Wayzata, MN Map & Demographics
Wayzata Map
Wayzata Overview
$114,230
PER CAPITA INCOME
$194,875
AVG FAMILY INCOME
$118,456
AVG HOUSEHOLD INCOME
37.5%
WAGE / INCOME GAP [ % ]
62.5¢/ $1
WAGE / INCOME GAP [ $ ]
0.60
INEQUALITY / GINI INDEX
4,365
TOTAL POPULATION
2,066
MALE POPULATION
2,299
FEMALE POPULATION
89.87
MALES / 100 FEMALES
111.28
FEMALES / 100 MALES
56.5
MEDIAN AGE
2.6
AVG FAMILY SIZE
2.0
AVG HOUSEHOLD SIZE
1,942
LABOR FORCE [ PEOPLE ]
50.0%
PERCENT IN LABOR FORCE
1.3%
UNEMPLOYMENT RATE
Wayzata Zip Codes
Income in Wayzata
Income Overview in Wayzata
Per Capita Income in Wayzata is $114,230, while median incomes of families and households are $194,875 and $118,456 respectively.
| Characteristic | Number | Measure |
| Per Capita Income | 4,365 | $114,230 |
| Median Family Income | 1,267 | $194,875 |
| Mean Family Income | 1,267 | $327,803 |
| Median Household Income | 2,169 | $118,456 |
| Mean Household Income | 2,169 | $229,318 |
| Income Deficit | 1,267 | $0 |
| Wage / Income Gap (%) | 4,365 | 37.49% |
| Wage / Income Gap ($) | 4,365 | 62.51¢ per $1 |
| Gini / Inequality Index | 4,365 | 0.60 |
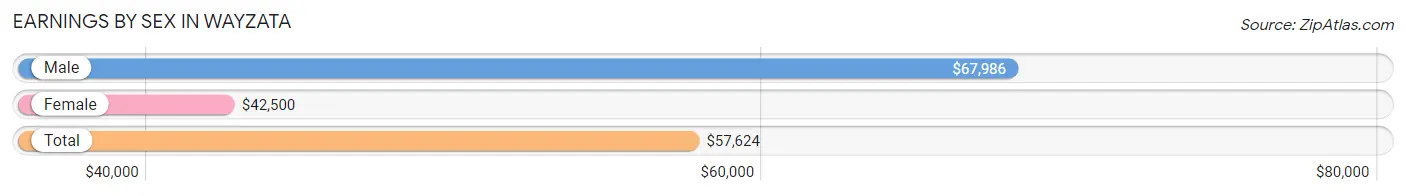
Earnings by Sex in Wayzata
Average Earnings in Wayzata are $57,624, $67,986 for men and $42,500 for women, a difference of 37.5%.
| Sex | Number | Average Earnings |
| Male | 1,277 (60.3%) | $67,986 |
| Female | 842 (39.7%) | $42,500 |
| Total | 2,119 (100.0%) | $57,624 |
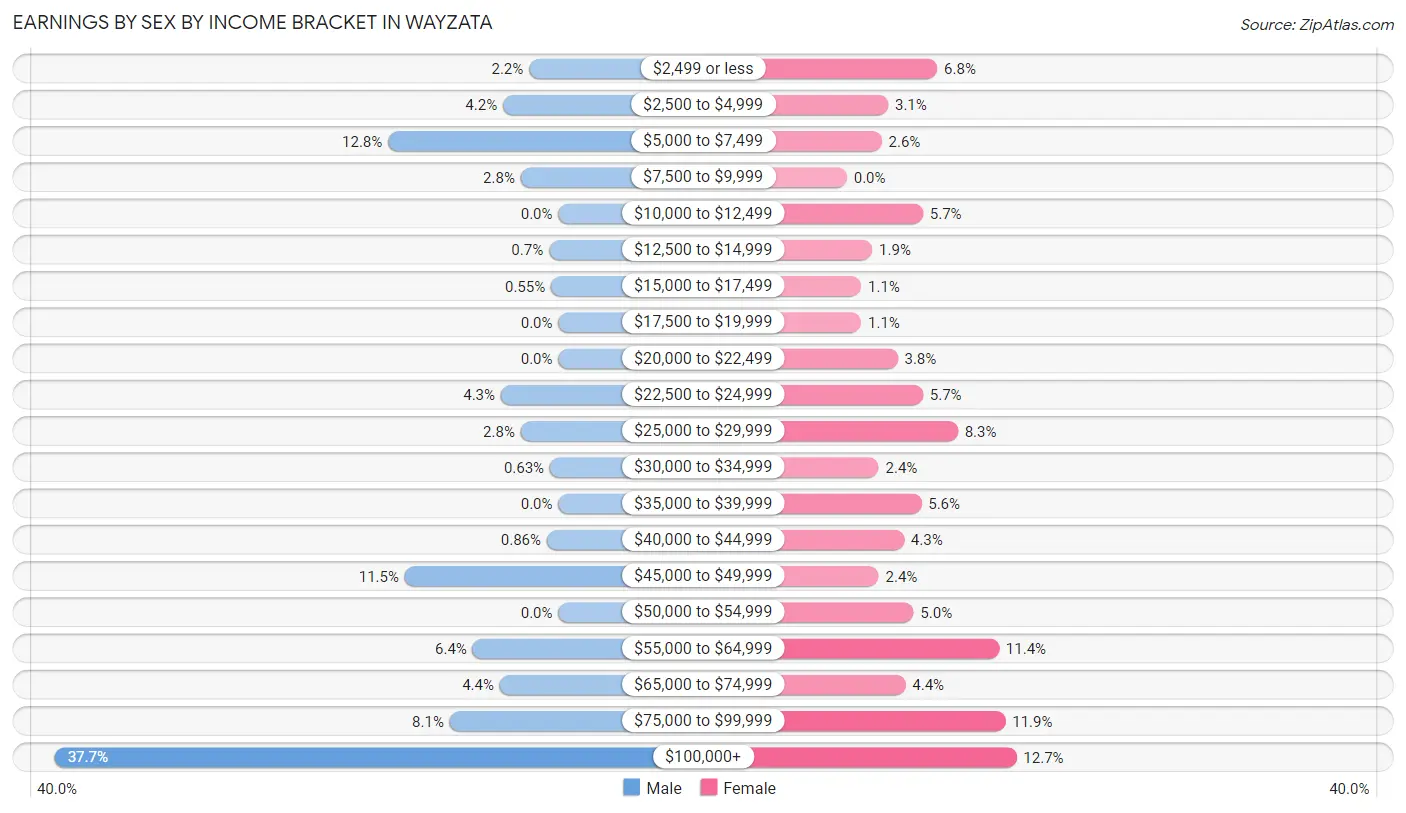
Earnings by Sex by Income Bracket in Wayzata
The most common earnings brackets in Wayzata are $100,000+ for men (482 | 37.7%) and $100,000+ for women (107 | 12.7%).
| Income | Male | Female |
| $2,499 or less | 28 (2.2%) | 57 (6.8%) |
| $2,500 to $4,999 | 53 (4.2%) | 26 (3.1%) |
| $5,000 to $7,499 | 163 (12.8%) | 22 (2.6%) |
| $7,500 to $9,999 | 36 (2.8%) | 0 (0.0%) |
| $10,000 to $12,499 | 0 (0.0%) | 48 (5.7%) |
| $12,500 to $14,999 | 9 (0.7%) | 16 (1.9%) |
| $15,000 to $17,499 | 7 (0.5%) | 9 (1.1%) |
| $17,500 to $19,999 | 0 (0.0%) | 9 (1.1%) |
| $20,000 to $22,499 | 0 (0.0%) | 32 (3.8%) |
| $22,500 to $24,999 | 55 (4.3%) | 48 (5.7%) |
| $25,000 to $29,999 | 36 (2.8%) | 70 (8.3%) |
| $30,000 to $34,999 | 8 (0.6%) | 20 (2.4%) |
| $35,000 to $39,999 | 0 (0.0%) | 47 (5.6%) |
| $40,000 to $44,999 | 11 (0.9%) | 36 (4.3%) |
| $45,000 to $49,999 | 147 (11.5%) | 20 (2.4%) |
| $50,000 to $54,999 | 0 (0.0%) | 42 (5.0%) |
| $55,000 to $64,999 | 82 (6.4%) | 96 (11.4%) |
| $65,000 to $74,999 | 56 (4.4%) | 37 (4.4%) |
| $75,000 to $99,999 | 104 (8.1%) | 100 (11.9%) |
| $100,000+ | 482 (37.7%) | 107 (12.7%) |
| Total | 1,277 (100.0%) | 842 (100.0%) |
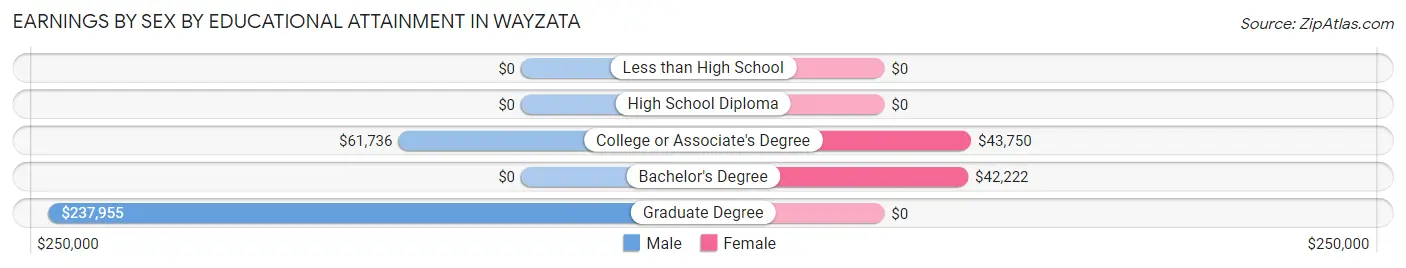
Earnings by Sex by Educational Attainment in Wayzata
Average earnings in Wayzata are $87,250 for men and $43,947 for women, a difference of 49.6%. Men with an educational attainment of graduate degree enjoy the highest average annual earnings of $237,955, while those with college or associate's degree education earn the least with $61,736. Women with an educational attainment of college or associate's degree earn the most with the average annual earnings of $43,750, while those with bachelor's degree education have the smallest earnings of $42,222.
| Educational Attainment | Male Income | Female Income |
| Less than High School | - | - |
| High School Diploma | - | - |
| College or Associate's Degree | $61,736 | $43,750 |
| Bachelor's Degree | - | - |
| Graduate Degree | $237,955 | $0 |
| Total | $87,250 | $43,947 |
Family Income in Wayzata
Family Income Brackets in Wayzata
According to the Wayzata family income data, there are 574 families falling into the $200,000+ income range, which is the most common income bracket and makes up 45.3% of all families.
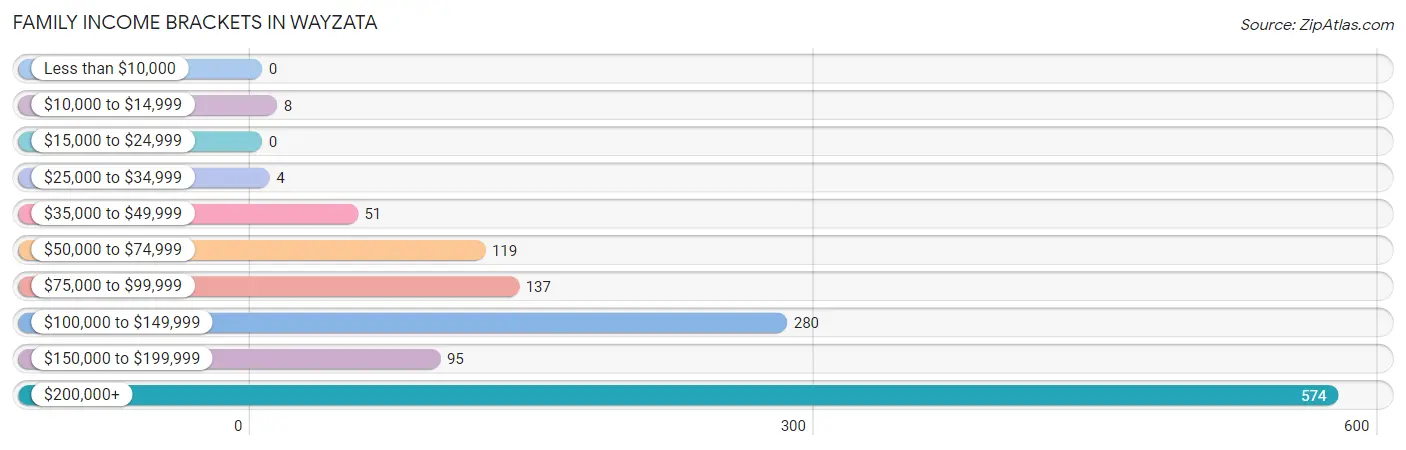
| Income Bracket | # Families | % Families |
| Less than $10,000 | 0 | 0.0% |
| $10,000 to $14,999 | 8 | 0.6% |
| $15,000 to $24,999 | 0 | 0.0% |
| $25,000 to $34,999 | 4 | 0.3% |
| $35,000 to $49,999 | 51 | 4.0% |
| $50,000 to $74,999 | 119 | 9.4% |
| $75,000 to $99,999 | 137 | 10.8% |
| $100,000 to $149,999 | 280 | 22.1% |
| $150,000 to $199,999 | 95 | 7.5% |
| $200,000+ | 574 | 45.3% |
Family Income by Famaliy Size in Wayzata
4-person families (145 | 11.4%) account for the highest median family income in Wayzata with $250,001 per family, while 2-person families (876 | 69.1%) have the highest median income of $66,806 per family member.
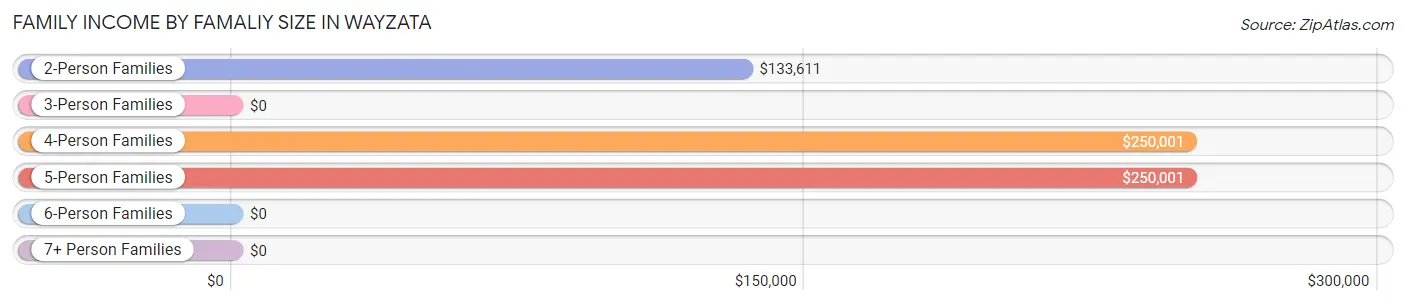
| Income Bracket | # Families | Median Income |
| 2-Person Families | 876 (69.1%) | $133,611 |
| 3-Person Families | 176 (13.9%) | $0 |
| 4-Person Families | 145 (11.4%) | $250,001 |
| 5-Person Families | 38 (3.0%) | $250,001 |
| 6-Person Families | 25 (2.0%) | $0 |
| 7+ Person Families | 7 (0.5%) | $0 |
| Total | 1,267 (100.0%) | $194,875 |
Family Income by Number of Earners in Wayzata
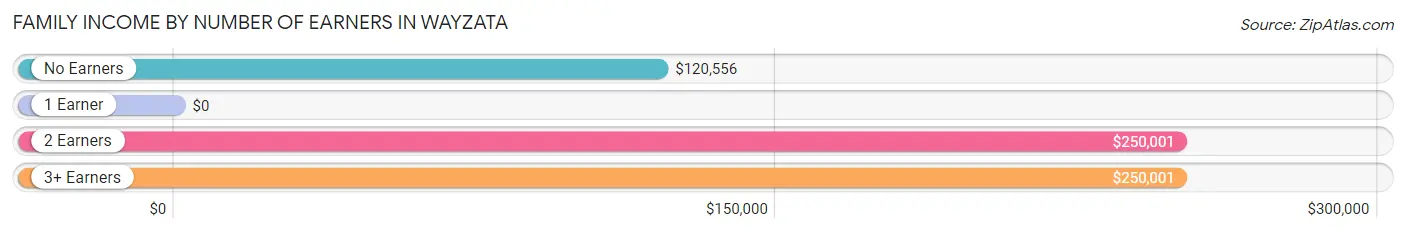
| Number of Earners | # Families | Median Income |
| No Earners | 412 (32.5%) | $120,556 |
| 1 Earner | 359 (28.3%) | $0 |
| 2 Earners | 362 (28.6%) | $250,001 |
| 3+ Earners | 134 (10.6%) | $250,001 |
| Total | 1,267 (100.0%) | $194,875 |
Household Income in Wayzata
Household Income Brackets in Wayzata
With 629 households falling in the category, the $200,000+ income range is the most frequent in Wayzata, accounting for 29.0% of all households. In contrast, only 61 households (2.8%) fall into the $10,000 to $14,999 income bracket, making it the least populous group.
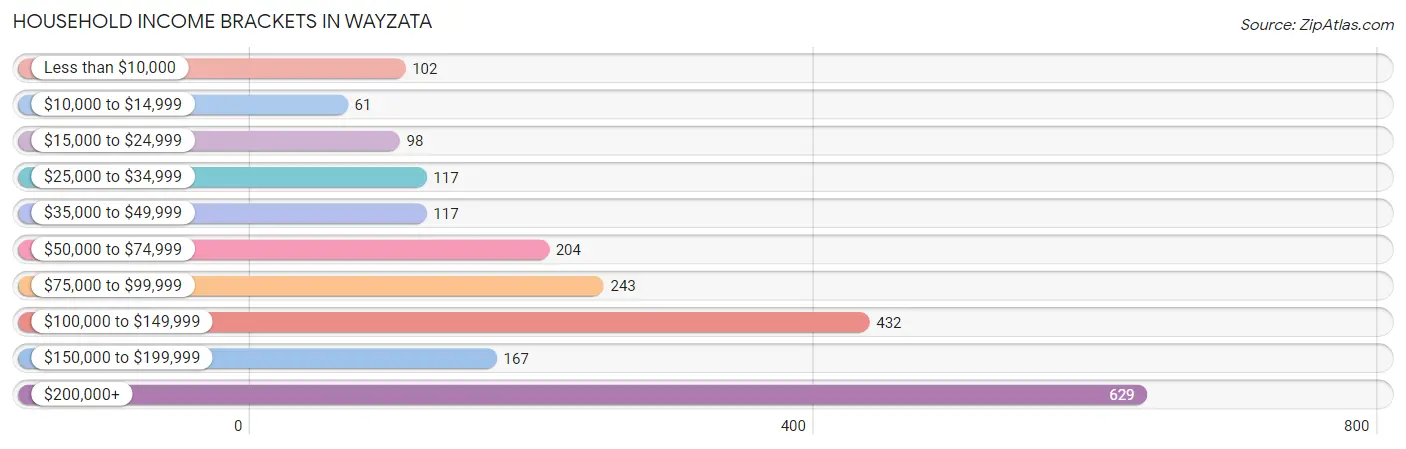
| Income Bracket | # Households | % Households |
| Less than $10,000 | 102 | 4.7% |
| $10,000 to $14,999 | 61 | 2.8% |
| $15,000 to $24,999 | 98 | 4.5% |
| $25,000 to $34,999 | 117 | 5.4% |
| $35,000 to $49,999 | 117 | 5.4% |
| $50,000 to $74,999 | 204 | 9.4% |
| $75,000 to $99,999 | 243 | 11.2% |
| $100,000 to $149,999 | 432 | 19.9% |
| $150,000 to $199,999 | 167 | 7.7% |
| $200,000+ | 629 | 29.0% |
Household Income by Householder Age in Wayzata
The median household income in Wayzata is $118,456, with the highest median household income of $250,001 found in the 45 to 64 years age bracket for the primary householder. A total of 642 households (29.6%) fall into this category. Meanwhile, the 15 to 24 years age bracket for the primary householder has the lowest median household income of $0, with 36 households (1.7%) in this group.
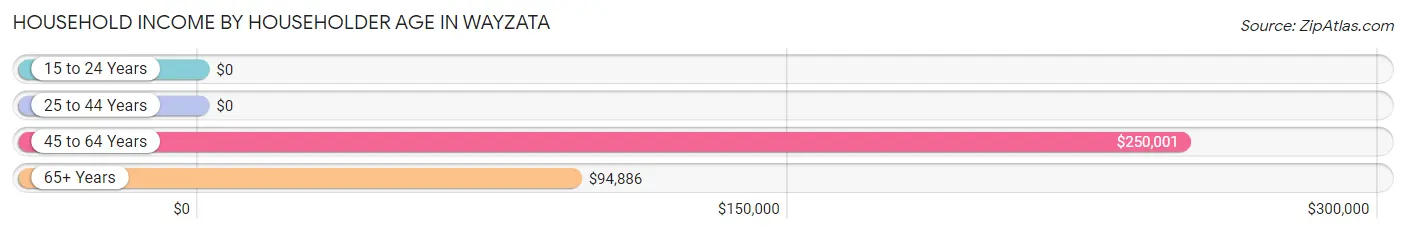
| Income Bracket | # Households | Median Income |
| 15 to 24 Years | 36 (1.7%) | $0 |
| 25 to 44 Years | 357 (16.5%) | $0 |
| 45 to 64 Years | 642 (29.6%) | $250,001 |
| 65+ Years | 1,134 (52.3%) | $94,886 |
| Total | 2,169 (100.0%) | $118,456 |
Poverty in Wayzata
Income Below Poverty by Sex and Age in Wayzata
With 3.5% poverty level for males and 5.3% for females among the residents of Wayzata, 6 to 11 year old males and 18 to 24 year old females are the most vulnerable to poverty, with 6 males (37.5%) and 14 females (48.3%) in their respective age groups living below the poverty level.
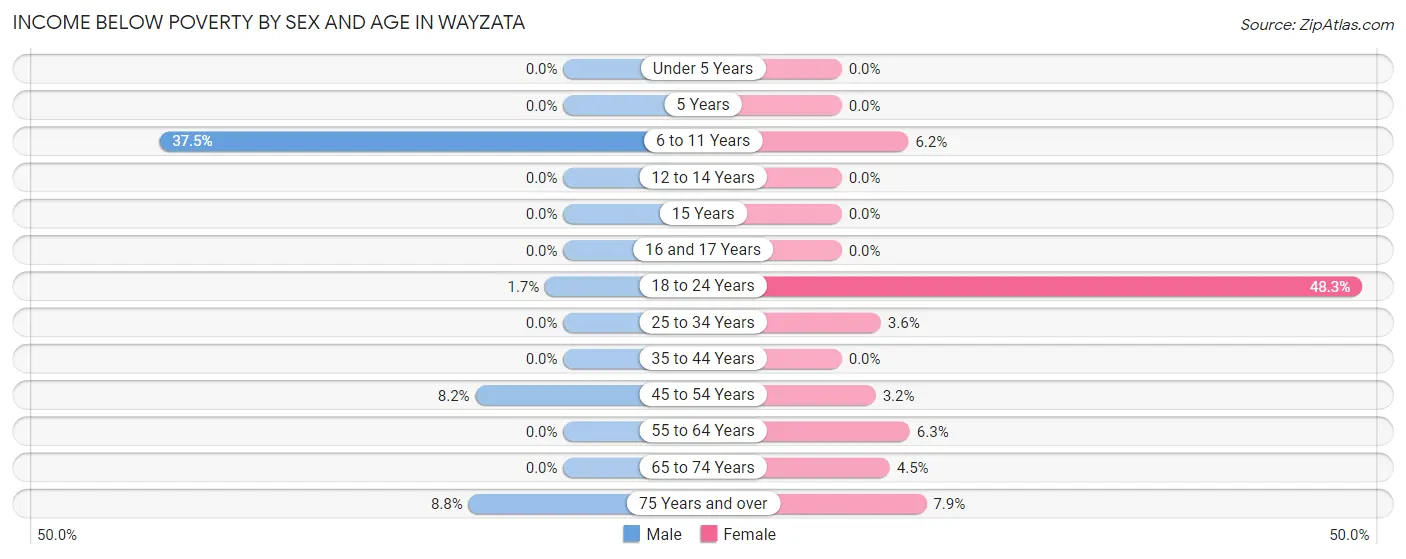
| Age Bracket | Male | Female |
| Under 5 Years | 0 (0.0%) | 0 (0.0%) |
| 5 Years | 0 (0.0%) | 0 (0.0%) |
| 6 to 11 Years | 6 (37.5%) | 7 (6.2%) |
| 12 to 14 Years | 0 (0.0%) | 0 (0.0%) |
| 15 Years | 0 (0.0%) | 0 (0.0%) |
| 16 and 17 Years | 0 (0.0%) | 0 (0.0%) |
| 18 to 24 Years | 3 (1.7%) | 14 (48.3%) |
| 25 to 34 Years | 0 (0.0%) | 7 (3.6%) |
| 35 to 44 Years | 0 (0.0%) | 0 (0.0%) |
| 45 to 54 Years | 20 (8.2%) | 11 (3.2%) |
| 55 to 64 Years | 0 (0.0%) | 17 (6.3%) |
| 65 to 74 Years | 0 (0.0%) | 18 (4.5%) |
| 75 Years and over | 43 (8.8%) | 47 (7.9%) |
| Total | 72 (3.5%) | 121 (5.3%) |
Income Above Poverty by Sex and Age in Wayzata
According to the poverty statistics in Wayzata, males aged under 5 years and females aged under 5 years are the age groups that are most secure financially, with 100.0% of males and 100.0% of females in these age groups living above the poverty line.
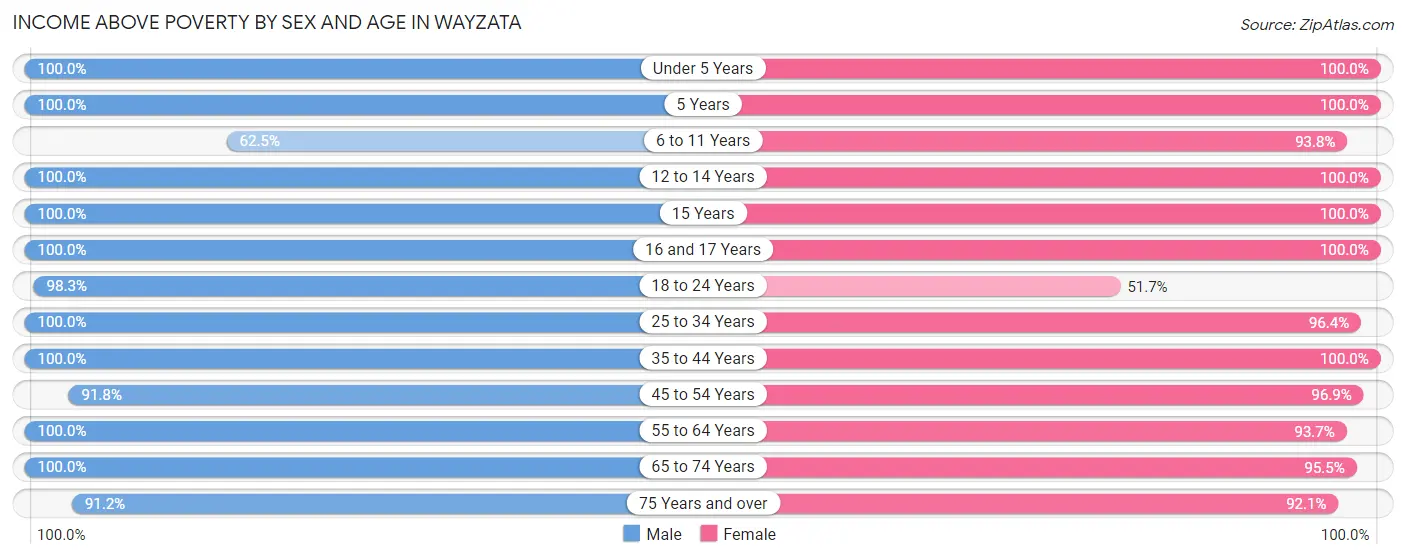
| Age Bracket | Male | Female |
| Under 5 Years | 71 (100.0%) | 110 (100.0%) |
| 5 Years | 14 (100.0%) | 9 (100.0%) |
| 6 to 11 Years | 10 (62.5%) | 106 (93.8%) |
| 12 to 14 Years | 55 (100.0%) | 68 (100.0%) |
| 15 Years | 18 (100.0%) | 7 (100.0%) |
| 16 and 17 Years | 91 (100.0%) | 15 (100.0%) |
| 18 to 24 Years | 174 (98.3%) | 15 (51.7%) |
| 25 to 34 Years | 187 (100.0%) | 186 (96.4%) |
| 35 to 44 Years | 153 (100.0%) | 135 (100.0%) |
| 45 to 54 Years | 225 (91.8%) | 338 (96.9%) |
| 55 to 64 Years | 327 (100.0%) | 252 (93.7%) |
| 65 to 74 Years | 223 (100.0%) | 386 (95.5%) |
| 75 Years and over | 446 (91.2%) | 551 (92.1%) |
| Total | 1,994 (96.5%) | 2,178 (94.7%) |
Income Below Poverty Among Married-Couple Families in Wayzata
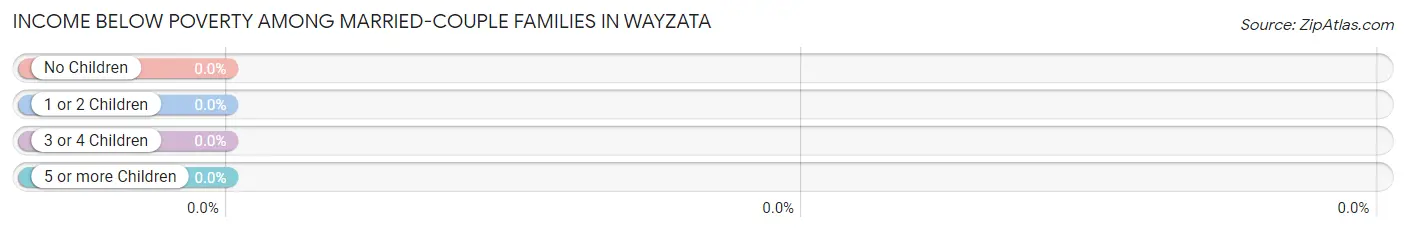
| Children | Above Poverty | Below Poverty |
| No Children | 916 (100.0%) | 0 (0.0%) |
| 1 or 2 Children | 239 (100.0%) | 0 (0.0%) |
| 3 or 4 Children | 63 (100.0%) | 0 (0.0%) |
| 5 or more Children | 0 (0.0%) | 0 (0.0%) |
| Total | 1,218 (100.0%) | 0 (0.0%) |
Income Below Poverty Among Single-Parent Households in Wayzata
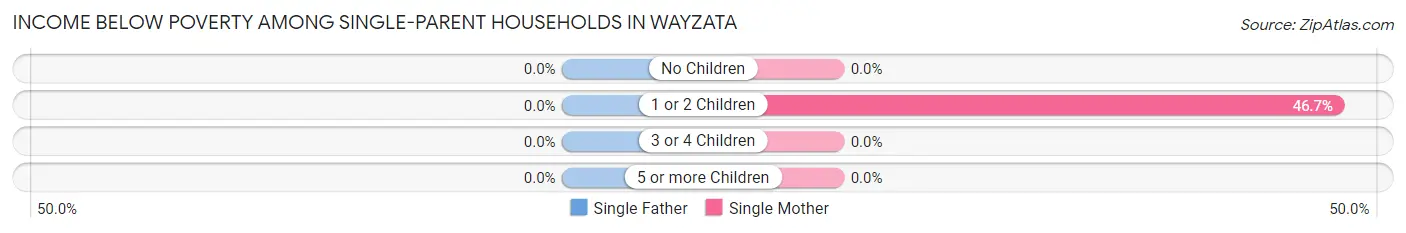
| Children | Single Father | Single Mother |
| No Children | 0 (0.0%) | 0 (0.0%) |
| 1 or 2 Children | 0 (0.0%) | 7 (46.7%) |
| 3 or 4 Children | 0 (0.0%) | 0 (0.0%) |
| 5 or more Children | 0 (0.0%) | 0 (0.0%) |
| Total | 0 (0.0%) | 7 (25.0%) |
Income Below Poverty Among Married-Couple vs Single-Parent Households in Wayzata
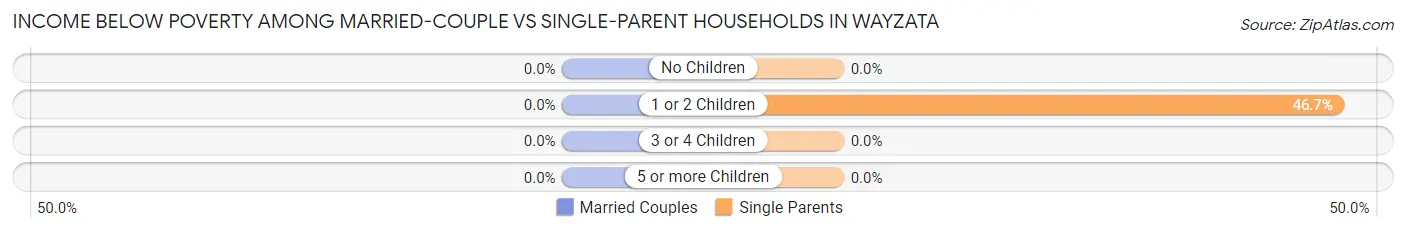
| Children | Married-Couple Families | Single-Parent Households |
| No Children | 0 (0.0%) | 0 (0.0%) |
| 1 or 2 Children | 0 (0.0%) | 7 (46.7%) |
| 3 or 4 Children | 0 (0.0%) | 0 (0.0%) |
| 5 or more Children | 0 (0.0%) | 0 (0.0%) |
| Total | 0 (0.0%) | 7 (14.3%) |
Race in Wayzata
The most populous races in Wayzata are White / Caucasian (3,928 | 90.0%), Asian (174 | 4.0%), and Two or more Races (145 | 3.3%).
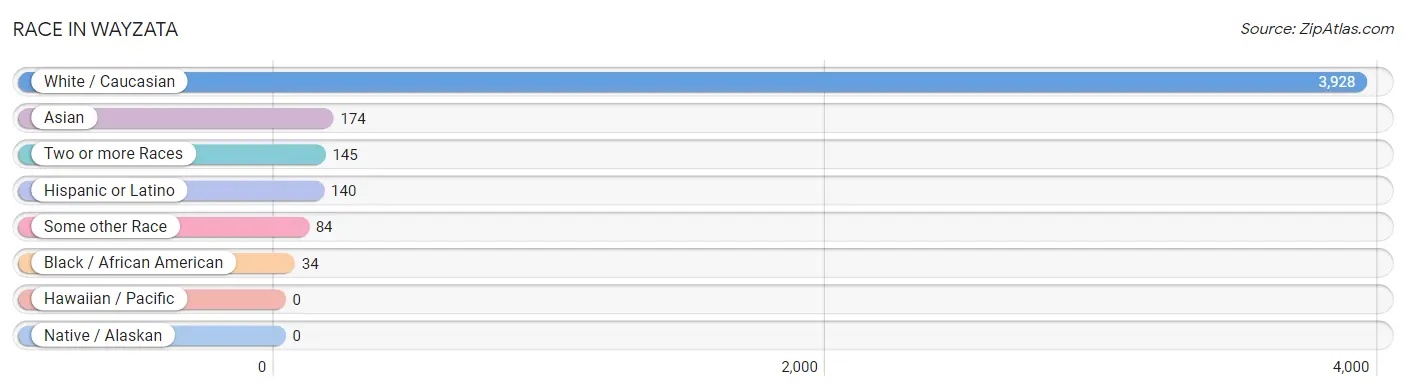
| Race | # Population | % Population |
| Asian | 174 | 4.0% |
| Black / African American | 34 | 0.8% |
| Hawaiian / Pacific | 0 | 0.0% |
| Hispanic or Latino | 140 | 3.2% |
| Native / Alaskan | 0 | 0.0% |
| White / Caucasian | 3,928 | 90.0% |
| Two or more Races | 145 | 3.3% |
| Some other Race | 84 | 1.9% |
| Total | 4,365 | 100.0% |
Ancestry in Wayzata
The most populous ancestries reported in Wayzata are German (1,077 | 24.7%), Irish (662 | 15.2%), Norwegian (565 | 12.9%), Swedish (492 | 11.3%), and English (488 | 11.2%), together accounting for 75.2% of all Wayzata residents.
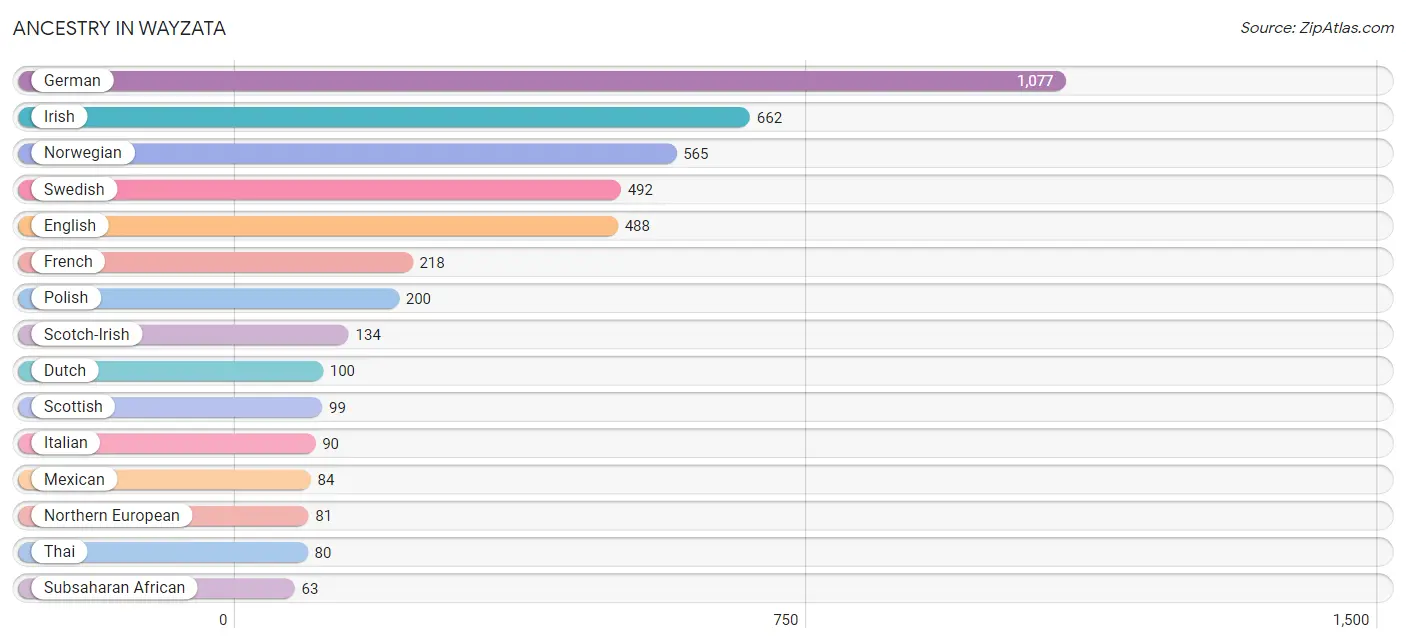
| Ancestry | # Population | % Population |
| Albanian | 25 | 0.6% |
| American | 51 | 1.2% |
| Arab | 17 | 0.4% |
| Australian | 9 | 0.2% |
| Austrian | 52 | 1.2% |
| British | 52 | 1.2% |
| Burmese | 11 | 0.3% |
| Canadian | 14 | 0.3% |
| Cherokee | 14 | 0.3% |
| Czech | 26 | 0.6% |
| Danish | 17 | 0.4% |
| Dominican | 25 | 0.6% |
| Dutch | 100 | 2.3% |
| Eastern European | 9 | 0.2% |
| English | 488 | 11.2% |
| European | 38 | 0.9% |
| Finnish | 44 | 1.0% |
| French | 218 | 5.0% |
| French Canadian | 9 | 0.2% |
| German | 1,077 | 24.7% |
| Hungarian | 28 | 0.6% |
| Indian (Asian) | 24 | 0.5% |
| Iranian | 30 | 0.7% |
| Irish | 662 | 15.2% |
| Italian | 90 | 2.1% |
| Korean | 59 | 1.3% |
| Mexican | 84 | 1.9% |
| Nigerian | 54 | 1.2% |
| Northern European | 81 | 1.9% |
| Norwegian | 565 | 12.9% |
| Polish | 200 | 4.6% |
| Puerto Rican | 7 | 0.2% |
| Russian | 25 | 0.6% |
| Scandinavian | 37 | 0.9% |
| Scotch-Irish | 134 | 3.1% |
| Scottish | 99 | 2.3% |
| Slovak | 41 | 0.9% |
| Slovene | 41 | 0.9% |
| Subsaharan African | 63 | 1.4% |
| Swedish | 492 | 11.3% |
| Swiss | 9 | 0.2% |
| Thai | 80 | 1.8% |
| Welsh | 45 | 1.0% |
| Yugoslavian | 21 | 0.5% | View All 44 Rows |
Immigrants in Wayzata
The most numerous immigrant groups reported in Wayzata came from Asia (128 | 2.9%), Latin America (108 | 2.5%), Europe (105 | 2.4%), Central America (84 | 1.9%), and Mexico (84 | 1.9%), together accounting for 11.6% of all Wayzata residents.
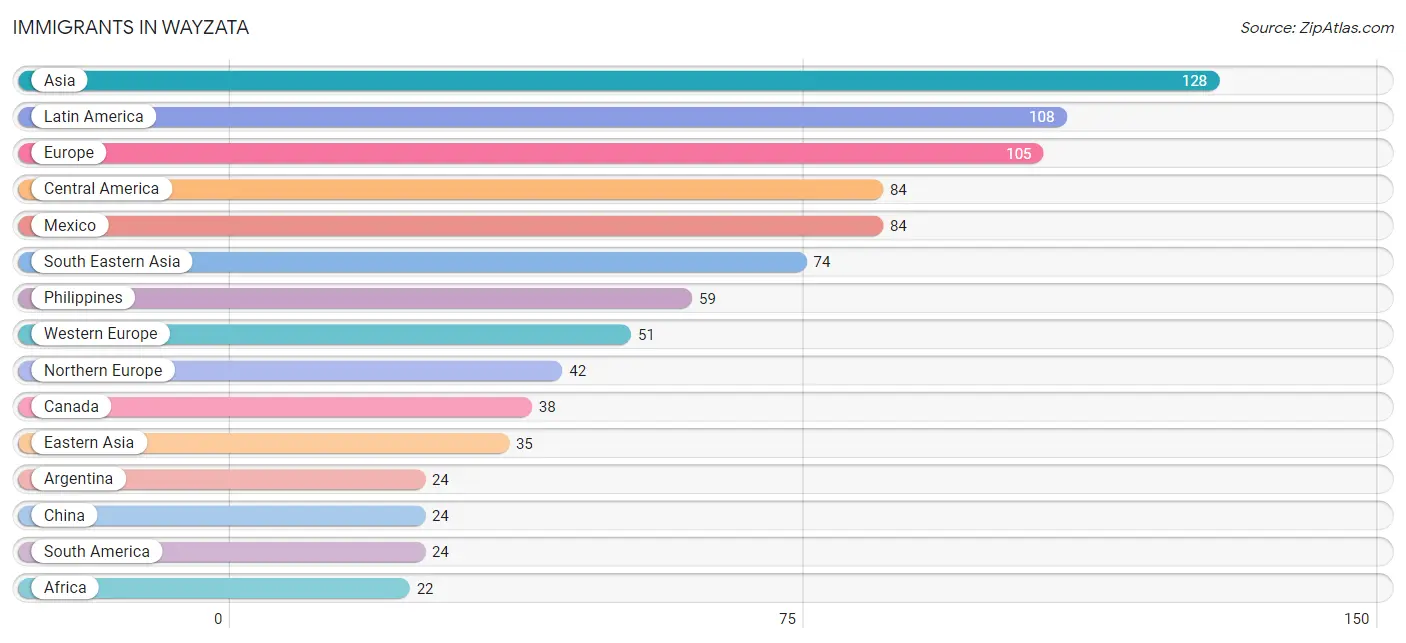
| Immigration Origin | # Population | % Population |
| Africa | 22 | 0.5% |
| Albania | 12 | 0.3% |
| Argentina | 24 | 0.5% |
| Asia | 128 | 2.9% |
| Canada | 38 | 0.9% |
| Central America | 84 | 1.9% |
| China | 24 | 0.5% |
| Eastern Asia | 35 | 0.8% |
| Eastern Europe | 12 | 0.3% |
| England | 13 | 0.3% |
| Europe | 105 | 2.4% |
| France | 16 | 0.4% |
| Germany | 16 | 0.4% |
| India | 19 | 0.4% |
| Korea | 11 | 0.3% |
| Latin America | 108 | 2.5% |
| Mexico | 84 | 1.9% |
| Netherlands | 19 | 0.4% |
| Nigeria | 22 | 0.5% |
| Northern Europe | 42 | 1.0% |
| Philippines | 59 | 1.3% |
| South America | 24 | 0.5% |
| South Central Asia | 19 | 0.4% |
| South Eastern Asia | 74 | 1.7% |
| Vietnam | 15 | 0.3% |
| Western Africa | 22 | 0.5% |
| Western Europe | 51 | 1.2% | View All 27 Rows |
Sex and Age in Wayzata
Sex and Age in Wayzata
The most populous age groups in Wayzata are 50 to 54 Years (198 | 9.6%) for men and 70 to 74 Years (259 | 11.3%) for women.
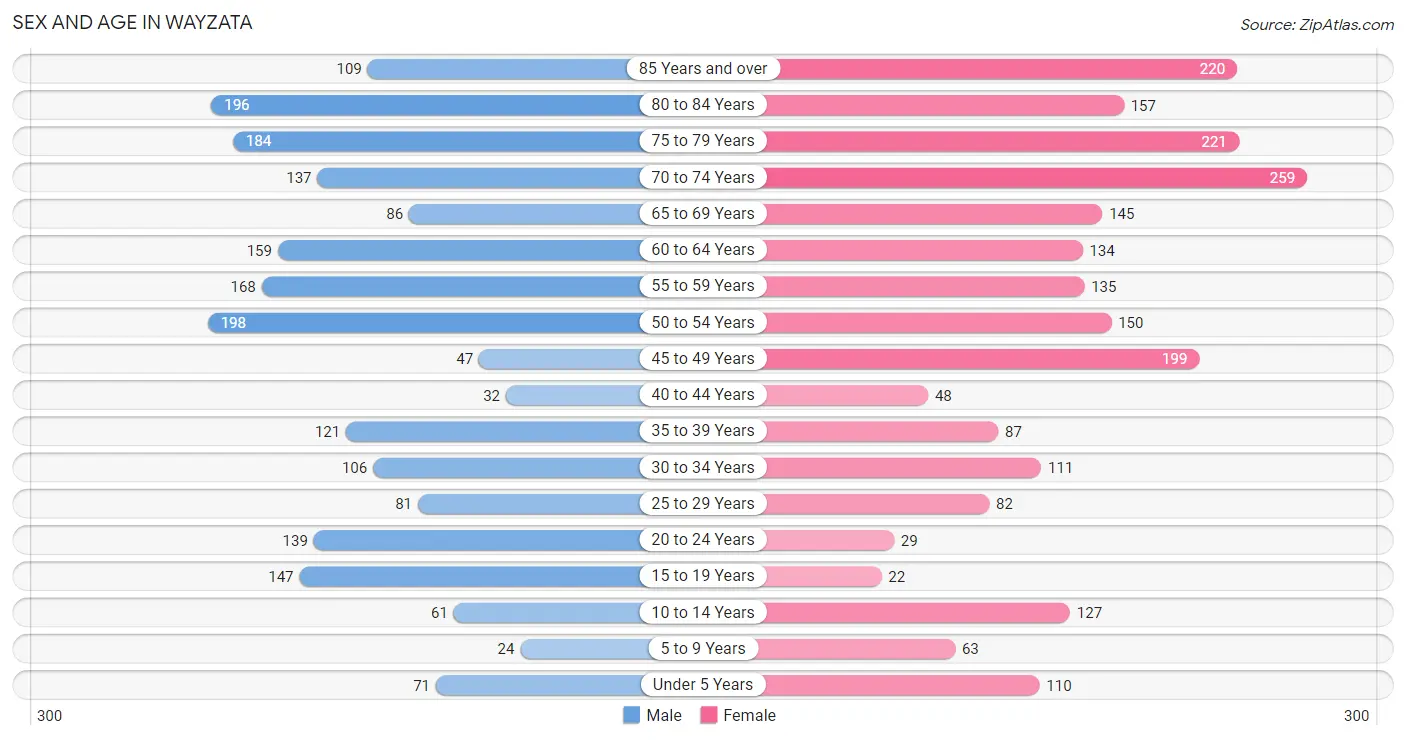
| Age Bracket | Male | Female |
| Under 5 Years | 71 (3.4%) | 110 (4.8%) |
| 5 to 9 Years | 24 (1.2%) | 63 (2.7%) |
| 10 to 14 Years | 61 (2.9%) | 127 (5.5%) |
| 15 to 19 Years | 147 (7.1%) | 22 (1.0%) |
| 20 to 24 Years | 139 (6.7%) | 29 (1.3%) |
| 25 to 29 Years | 81 (3.9%) | 82 (3.6%) |
| 30 to 34 Years | 106 (5.1%) | 111 (4.8%) |
| 35 to 39 Years | 121 (5.9%) | 87 (3.8%) |
| 40 to 44 Years | 32 (1.5%) | 48 (2.1%) |
| 45 to 49 Years | 47 (2.3%) | 199 (8.7%) |
| 50 to 54 Years | 198 (9.6%) | 150 (6.5%) |
| 55 to 59 Years | 168 (8.1%) | 135 (5.9%) |
| 60 to 64 Years | 159 (7.7%) | 134 (5.8%) |
| 65 to 69 Years | 86 (4.2%) | 145 (6.3%) |
| 70 to 74 Years | 137 (6.6%) | 259 (11.3%) |
| 75 to 79 Years | 184 (8.9%) | 221 (9.6%) |
| 80 to 84 Years | 196 (9.5%) | 157 (6.8%) |
| 85 Years and over | 109 (5.3%) | 220 (9.6%) |
| Total | 2,066 (100.0%) | 2,299 (100.0%) |
Families and Households in Wayzata
Median Family Size in Wayzata
The median family size in Wayzata is 2.59 persons per family, with single female/mother families (28 | 2.2%) accounting for the largest median family size of 2.79 persons per family. On the other hand, single male/father families (21 | 1.7%) represent the smallest median family size with 2.43 persons per family.
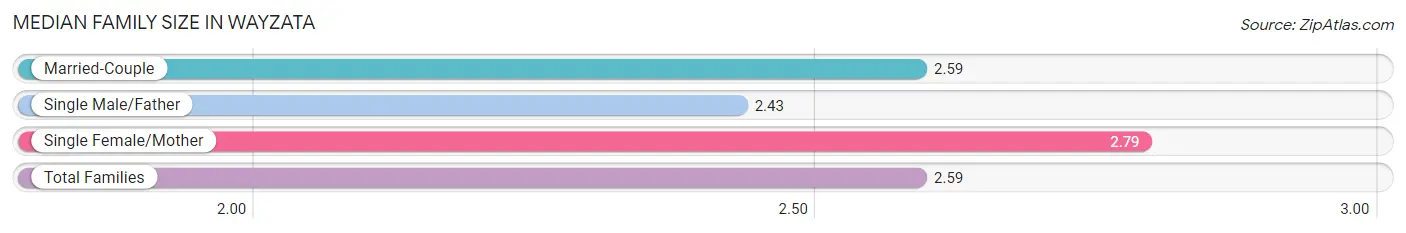
| Family Type | # Families | Family Size |
| Married-Couple | 1,218 (96.1%) | 2.59 |
| Single Male/Father | 21 (1.7%) | 2.43 |
| Single Female/Mother | 28 (2.2%) | 2.79 |
| Total Families | 1,267 (100.0%) | 2.59 |
Median Household Size in Wayzata
The median household size in Wayzata is 2.00 persons per household, with single female/mother households (28 | 1.3%) accounting for the largest median household size of 3.29 persons per household. non-family households (902 | 41.6%) represent the smallest median household size with 1.15 persons per household.
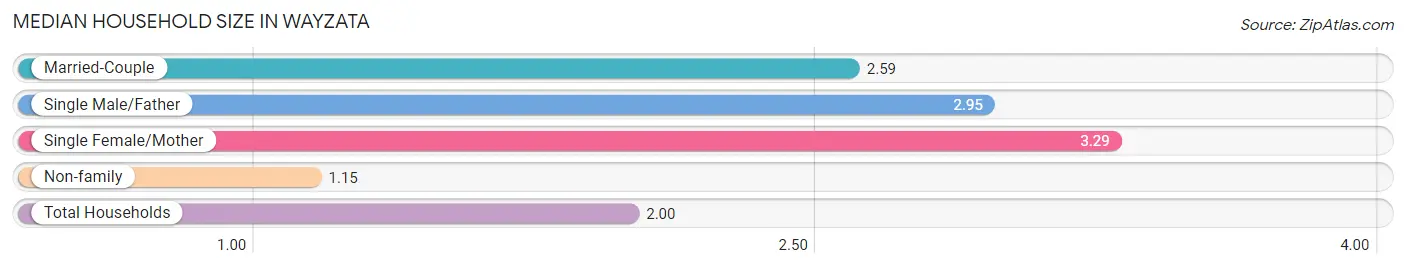
| Household Type | # Households | Household Size |
| Married-Couple | 1,218 (56.1%) | 2.59 |
| Single Male/Father | 21 (1.0%) | 2.95 |
| Single Female/Mother | 28 (1.3%) | 3.29 |
| Non-family | 902 (41.6%) | 1.15 |
| Total Households | 2,169 (100.0%) | 2.00 |
Household Size by Marriage Status in Wayzata
Out of a total of 2,169 households in Wayzata, 1,267 (58.4%) are family households, while 902 (41.6%) are nonfamily households. The most numerous type of family households are 2-person households, comprising 864, and the most common type of nonfamily households are 1-person households, comprising 775.
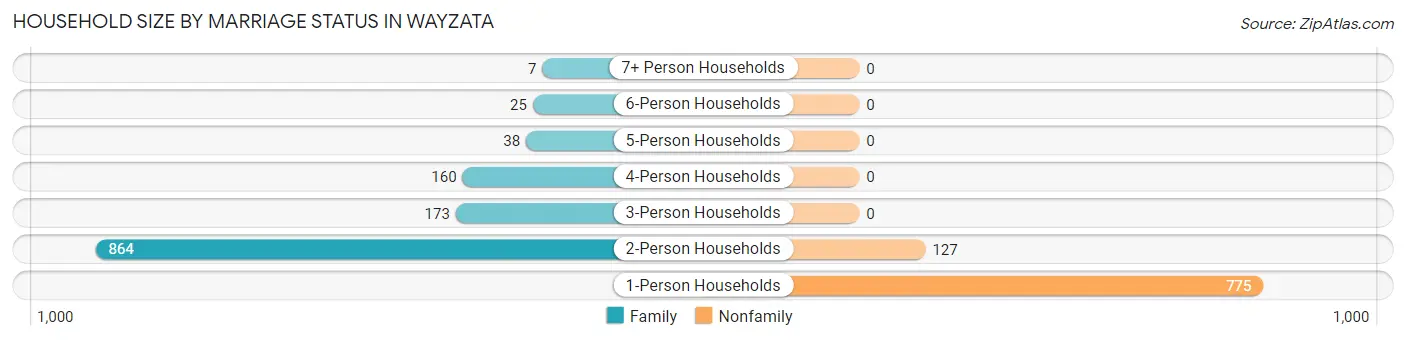
| Household Size | Family Households | Nonfamily Households |
| 1-Person Households | - | 775 (35.7%) |
| 2-Person Households | 864 (39.8%) | 127 (5.9%) |
| 3-Person Households | 173 (8.0%) | 0 (0.0%) |
| 4-Person Households | 160 (7.4%) | 0 (0.0%) |
| 5-Person Households | 38 (1.8%) | 0 (0.0%) |
| 6-Person Households | 25 (1.1%) | 0 (0.0%) |
| 7+ Person Households | 7 (0.3%) | 0 (0.0%) |
| Total | 1,267 (58.4%) | 902 (41.6%) |
Female Fertility in Wayzata
Fertility by Age in Wayzata
Average fertility rate in Wayzata is 28.0 births per 1,000 women. Women in the age bracket of 20 to 34 years have the highest fertility rate with 77.0 births per 1,000 women. Women in the age bracket of 20 to 34 years acount for 100.0% of all women with births.
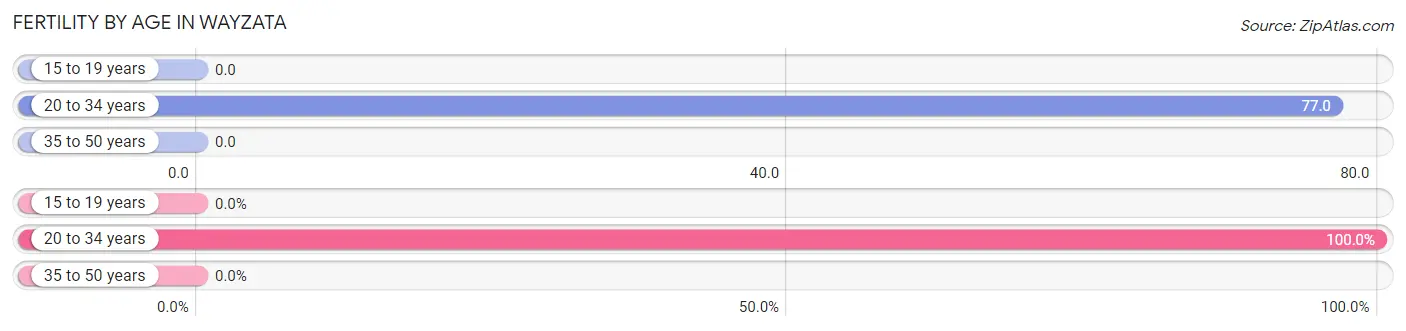
| Age Bracket | Women with Births | Births / 1,000 Women |
| 15 to 19 years | 0 (0.0%) | 0.0 |
| 20 to 34 years | 17 (100.0%) | 77.0 |
| 35 to 50 years | 0 (0.0%) | 0.0 |
| Total | 17 (100.0%) | 28.0 |
Fertility by Age by Marriage Status in Wayzata
52.9% of women with births (17) in Wayzata are married. The highest percentage of unmarried women with births falls into 20 to 34 years age bracket with 47.1% of them unmarried at the time of birth, while the lowest percentage of unmarried women with births belong to 20 to 34 years age bracket with 47.1% of them unmarried.
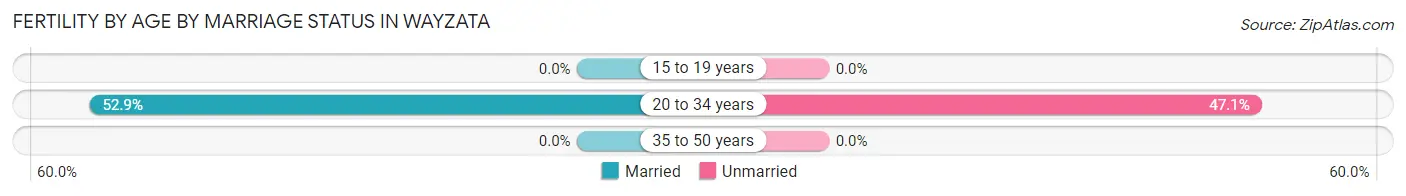
| Age Bracket | Married | Unmarried |
| 15 to 19 years | 0 (0.0%) | 0 (0.0%) |
| 20 to 34 years | 9 (52.9%) | 8 (47.1%) |
| 35 to 50 years | 0 (0.0%) | 0 (0.0%) |
| Total | 9 (52.9%) | 8 (47.1%) |
Fertility by Education in Wayzata
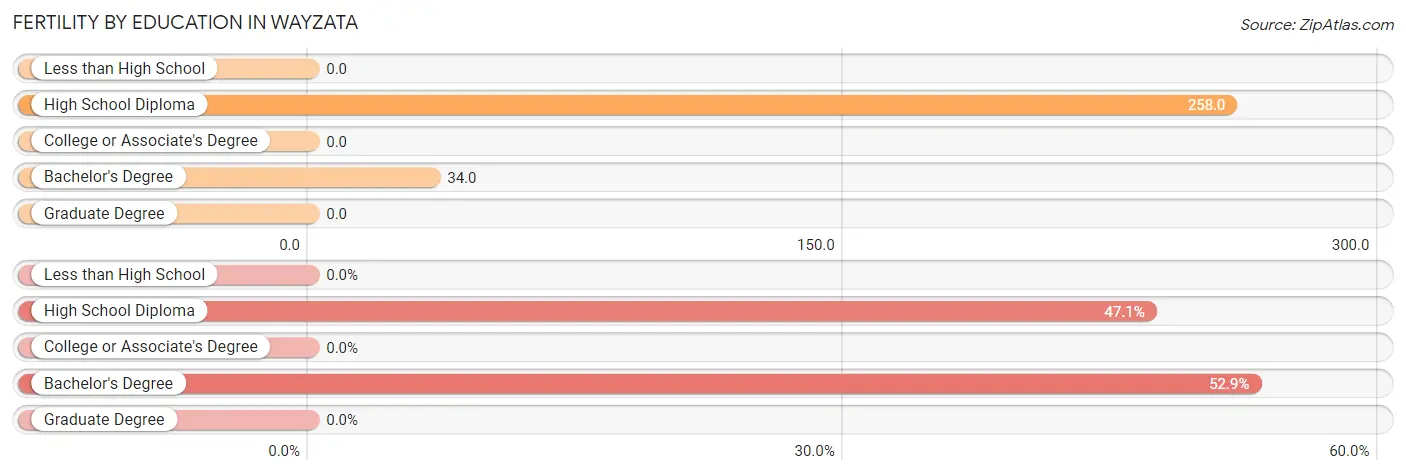
| Educational Attainment | Women with Births | Births / 1,000 Women |
| Less than High School | 0 (0.0%) | 0.0 |
| High School Diploma | 8 (47.1%) | 258.0 |
| College or Associate's Degree | 0 (0.0%) | 0.0 |
| Bachelor's Degree | 9 (52.9%) | 34.0 |
| Graduate Degree | 0 (0.0%) | 0.0 |
| Total | 17 (100.0%) | 28.0 |
Fertility by Education by Marriage Status in Wayzata
47.1% of women with births in Wayzata are unmarried. Women with the educational attainment of bachelor's degree are most likely to be married with 100.0% of them married at childbirth, while women with the educational attainment of high school diploma are least likely to be married with 100.0% of them unmarried at childbirth.
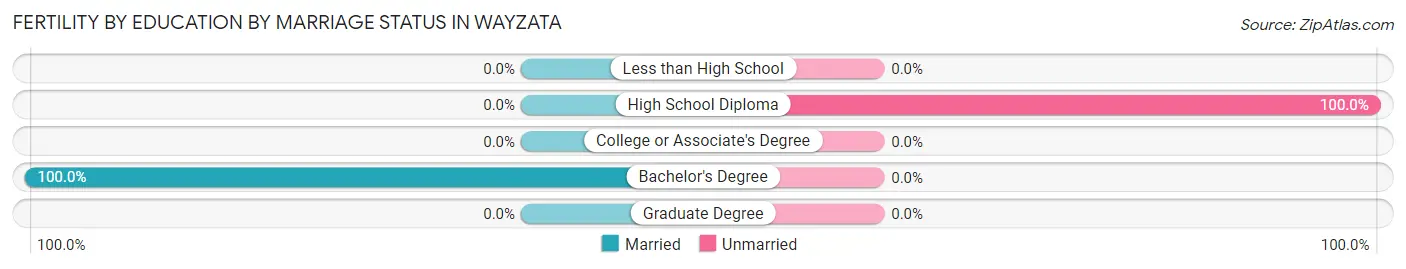
| Educational Attainment | Married | Unmarried |
| Less than High School | 0 (0.0%) | 0 (0.0%) |
| High School Diploma | 0 (0.0%) | 8 (100.0%) |
| College or Associate's Degree | 0 (0.0%) | 0 (0.0%) |
| Bachelor's Degree | 9 (100.0%) | 0 (0.0%) |
| Graduate Degree | 0 (0.0%) | 0 (0.0%) |
| Total | 9 (52.9%) | 8 (47.1%) |
Employment Characteristics in Wayzata
Employment by Class of Employer in Wayzata
Among the 1,754 employed individuals in Wayzata, private company employees (1,165 | 66.4%), self-employed (incorporated) (171 | 9.8%), and local government employees (152 | 8.7%) make up the most common classes of employment.
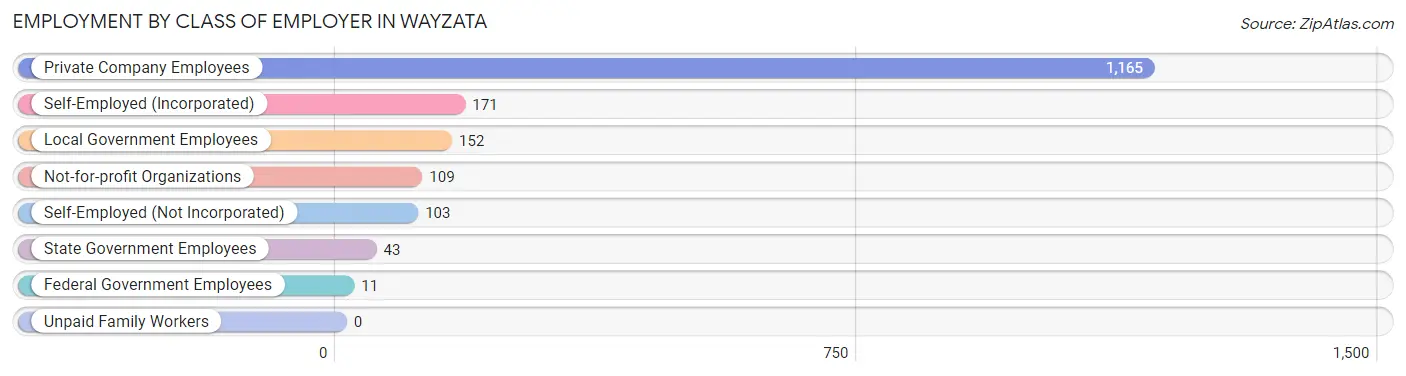
| Employer Class | # Employees | % Employees |
| Private Company Employees | 1,165 | 66.4% |
| Self-Employed (Incorporated) | 171 | 9.8% |
| Self-Employed (Not Incorporated) | 103 | 5.9% |
| Not-for-profit Organizations | 109 | 6.2% |
| Local Government Employees | 152 | 8.7% |
| State Government Employees | 43 | 2.5% |
| Federal Government Employees | 11 | 0.6% |
| Unpaid Family Workers | 0 | 0.0% |
| Total | 1,754 | 100.0% |
Employment Status by Age in Wayzata
According to the labor force statistics for Wayzata, out of the total population over 16 years of age (3,884), 50.0% or 1,942 individuals are in the labor force, with 1.3% or 25 of them unemployed. The age group with the highest labor force participation rate is 30 to 34 years, with 98.2% or 213 individuals in the labor force. Within the labor force, the 65 to 74 years age range has the highest percentage of unemployed individuals, with 6.3% or 8 of them being unemployed.
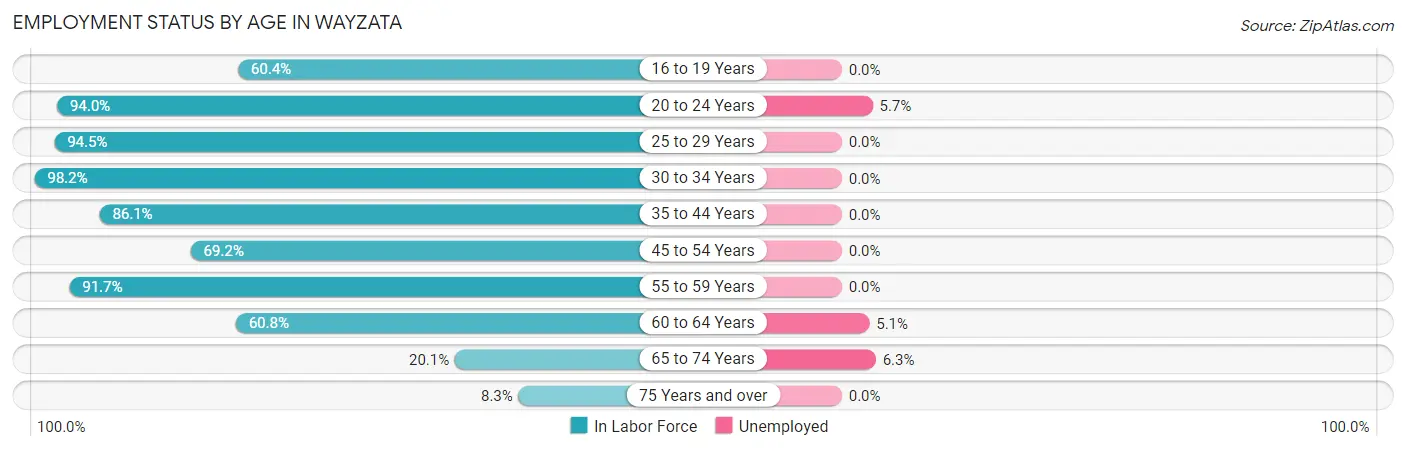
| Age Bracket | In Labor Force | Unemployed |
| 16 to 19 Years | 87 (60.4%) | 0 (0.0%) |
| 20 to 24 Years | 158 (94.0%) | 9 (5.7%) |
| 25 to 29 Years | 154 (94.5%) | 0 (0.0%) |
| 30 to 34 Years | 213 (98.2%) | 0 (0.0%) |
| 35 to 44 Years | 248 (86.1%) | 0 (0.0%) |
| 45 to 54 Years | 411 (69.2%) | 0 (0.0%) |
| 55 to 59 Years | 278 (91.7%) | 0 (0.0%) |
| 60 to 64 Years | 178 (60.8%) | 9 (5.1%) |
| 65 to 74 Years | 126 (20.1%) | 8 (6.3%) |
| 75 Years and over | 90 (8.3%) | 0 (0.0%) |
| Total | 1,942 (50.0%) | 25 (1.3%) |
Employment Status by Educational Attainment in Wayzata
According to labor force statistics for Wayzata, 79.8% of individuals (1,483) out of the total population between 25 and 64 years of age (1,858) are in the labor force, with 0.6% or 9 of them being unemployed. The group with the highest labor force participation rate are those with the educational attainment of college / associate degree, with 90.6% or 310 individuals in the labor force. Within the labor force, individuals with bachelor's degree or higher education have the highest percentage of unemployment, with 0.9% or 9 of them being unemployed.
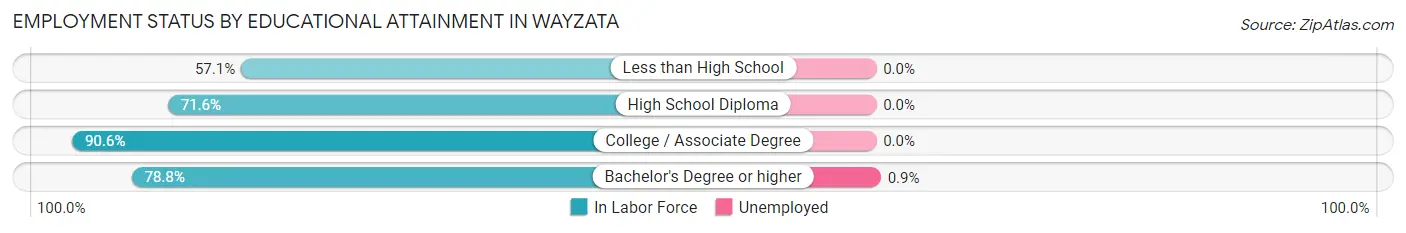
| Educational Attainment | In Labor Force | Unemployed |
| Less than High School | 36 (57.1%) | 0 (0.0%) |
| High School Diploma | 83 (71.6%) | 0 (0.0%) |
| College / Associate Degree | 310 (90.6%) | 0 (0.0%) |
| Bachelor's Degree or higher | 1,054 (78.8%) | 12 (0.9%) |
| Total | 1,483 (79.8%) | 11 (0.6%) |
Employment Occupations by Sex in Wayzata
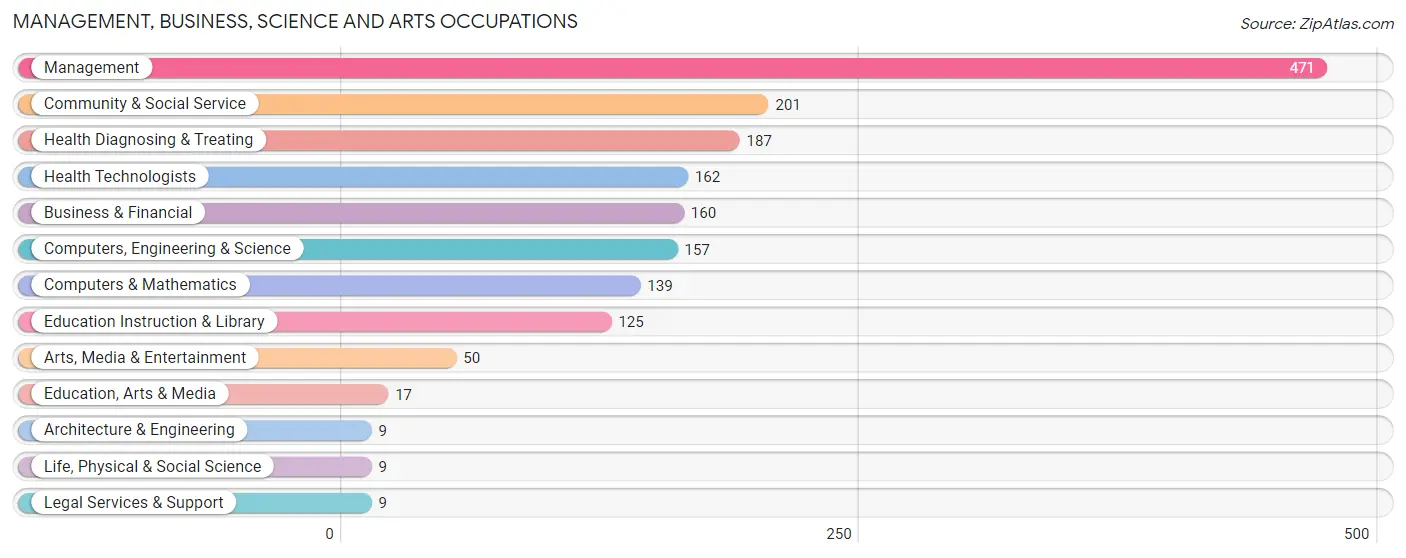
Management, Business, Science and Arts Occupations
The most common Management, Business, Science and Arts occupations in Wayzata are Management (471 | 24.6%), Community & Social Service (201 | 10.5%), Health Diagnosing & Treating (187 | 9.8%), Health Technologists (162 | 8.5%), and Business & Financial (160 | 8.4%).
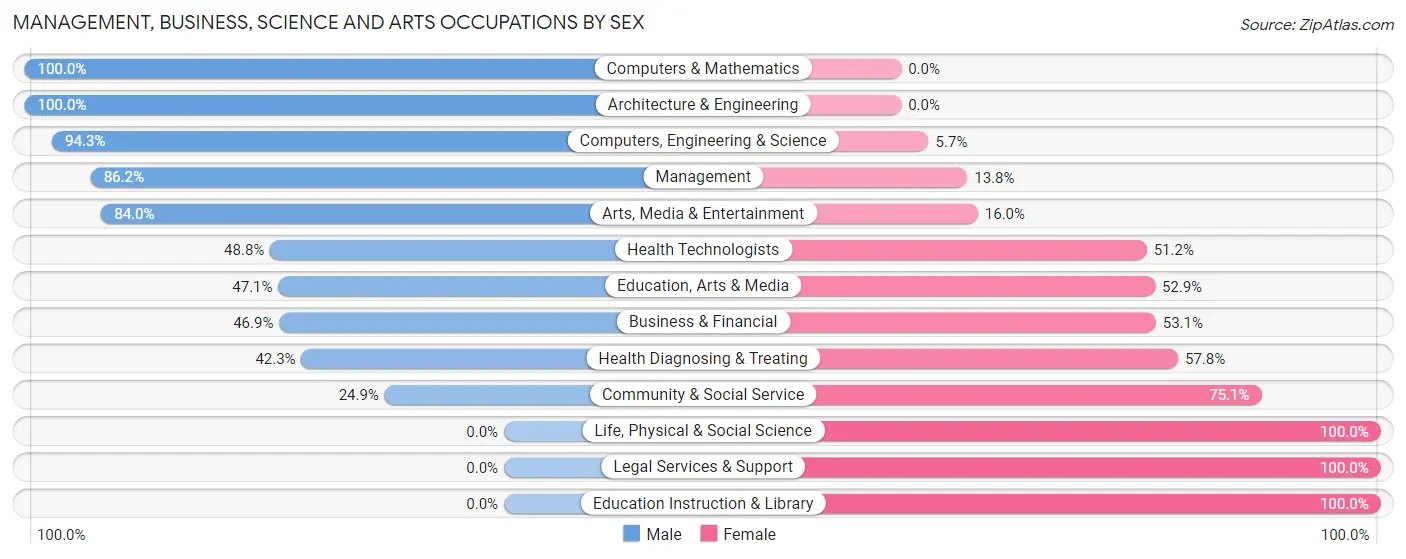
Management, Business, Science and Arts Occupations by Sex
Within the Management, Business, Science and Arts occupations in Wayzata, the most male-oriented occupations are Computers & Mathematics (100.0%), Architecture & Engineering (100.0%), and Computers, Engineering & Science (94.3%), while the most female-oriented occupations are Life, Physical & Social Science (100.0%), Legal Services & Support (100.0%), and Education Instruction & Library (100.0%).
| Occupation | Male | Female |
| Management | 406 (86.2%) | 65 (13.8%) |
| Business & Financial | 75 (46.9%) | 85 (53.1%) |
| Computers, Engineering & Science | 148 (94.3%) | 9 (5.7%) |
| Computers & Mathematics | 139 (100.0%) | 0 (0.0%) |
| Architecture & Engineering | 9 (100.0%) | 0 (0.0%) |
| Life, Physical & Social Science | 0 (0.0%) | 9 (100.0%) |
| Community & Social Service | 50 (24.9%) | 151 (75.1%) |
| Education, Arts & Media | 8 (47.1%) | 9 (52.9%) |
| Legal Services & Support | 0 (0.0%) | 9 (100.0%) |
| Education Instruction & Library | 0 (0.0%) | 125 (100.0%) |
| Arts, Media & Entertainment | 42 (84.0%) | 8 (16.0%) |
| Health Diagnosing & Treating | 79 (42.2%) | 108 (57.8%) |
| Health Technologists | 79 (48.8%) | 83 (51.2%) |
| Total (Category) | 758 (64.5%) | 418 (35.5%) |
| Total (Overall) | 1,176 (61.4%) | 741 (38.7%) |
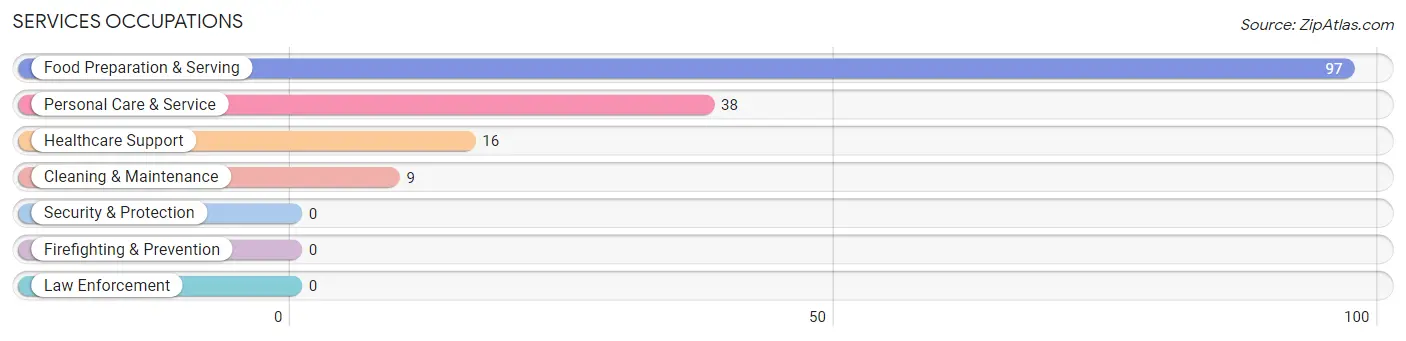
Services Occupations
The most common Services occupations in Wayzata are Food Preparation & Serving (97 | 5.1%), Personal Care & Service (38 | 2.0%), Healthcare Support (16 | 0.8%), and Cleaning & Maintenance (9 | 0.5%).
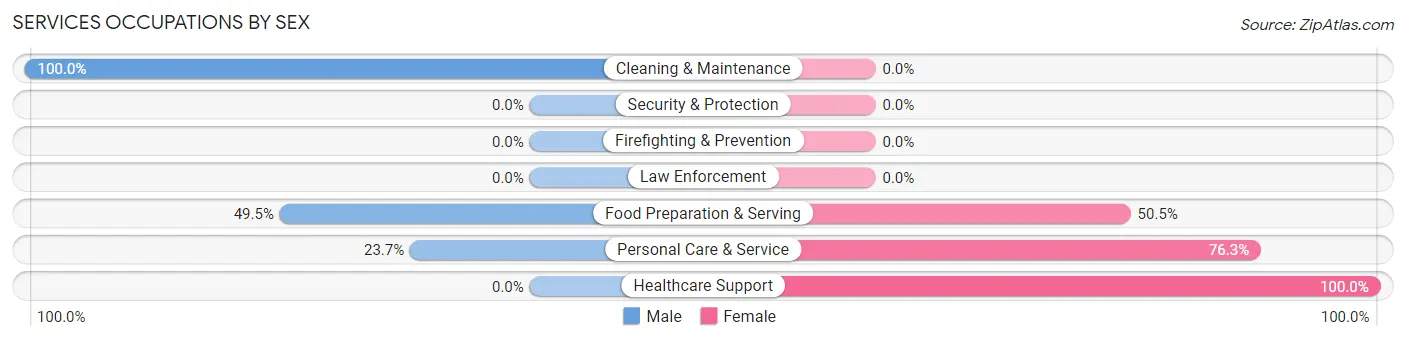
Services Occupations by Sex
Within the Services occupations in Wayzata, the most male-oriented occupations are Cleaning & Maintenance (100.0%), Food Preparation & Serving (49.5%), and Personal Care & Service (23.7%), while the most female-oriented occupations are Healthcare Support (100.0%), Personal Care & Service (76.3%), and Food Preparation & Serving (50.5%).
| Occupation | Male | Female |
| Healthcare Support | 0 (0.0%) | 16 (100.0%) |
| Security & Protection | 0 (0.0%) | 0 (0.0%) |
| Firefighting & Prevention | 0 (0.0%) | 0 (0.0%) |
| Law Enforcement | 0 (0.0%) | 0 (0.0%) |
| Food Preparation & Serving | 48 (49.5%) | 49 (50.5%) |
| Cleaning & Maintenance | 9 (100.0%) | 0 (0.0%) |
| Personal Care & Service | 9 (23.7%) | 29 (76.3%) |
| Total (Category) | 66 (41.2%) | 94 (58.8%) |
| Total (Overall) | 1,176 (61.4%) | 741 (38.7%) |
Sales and Office Occupations
The most common Sales and Office occupations in Wayzata are Sales & Related (248 | 12.9%), and Office & Administration (85 | 4.4%).

Sales and Office Occupations by Sex
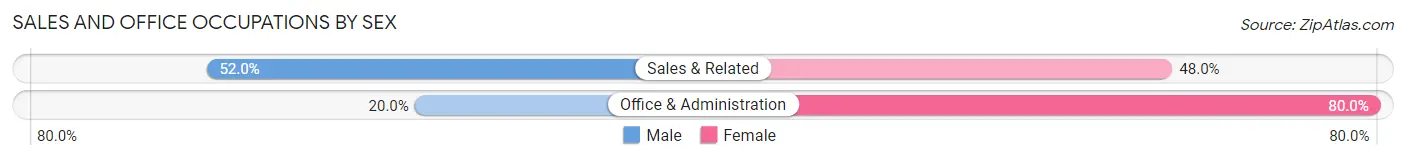
| Occupation | Male | Female |
| Sales & Related | 129 (52.0%) | 119 (48.0%) |
| Office & Administration | 17 (20.0%) | 68 (80.0%) |
| Total (Category) | 146 (43.8%) | 187 (56.2%) |
| Total (Overall) | 1,176 (61.4%) | 741 (38.7%) |
Natural Resources, Construction and Maintenance Occupations
The most common Natural Resources, Construction and Maintenance occupations in Wayzata are Construction & Extraction (33 | 1.7%), Installation, Maintenance & Repair (23 | 1.2%), and Farming, Fishing & Forestry (11 | 0.6%).

Natural Resources, Construction and Maintenance Occupations by Sex

| Occupation | Male | Female |
| Farming, Fishing & Forestry | 11 (100.0%) | 0 (0.0%) |
| Construction & Extraction | 24 (72.7%) | 9 (27.3%) |
| Installation, Maintenance & Repair | 23 (100.0%) | 0 (0.0%) |
| Total (Category) | 58 (86.6%) | 9 (13.4%) |
| Total (Overall) | 1,176 (61.4%) | 741 (38.7%) |
Production, Transportation and Moving Occupations
The most common Production, Transportation and Moving occupations in Wayzata are Material Moving (101 | 5.3%), Production (62 | 3.2%), and Transportation (18 | 0.9%).
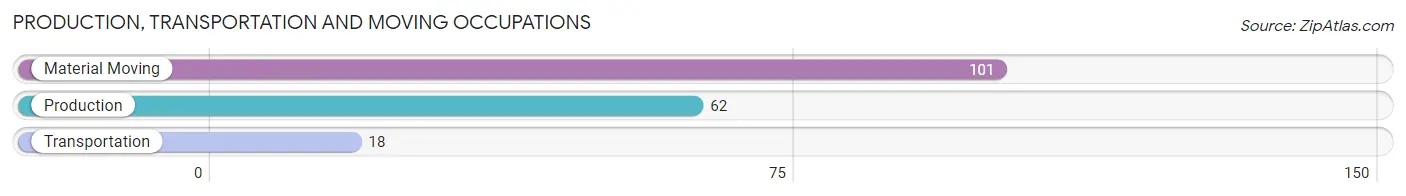
Production, Transportation and Moving Occupations by Sex
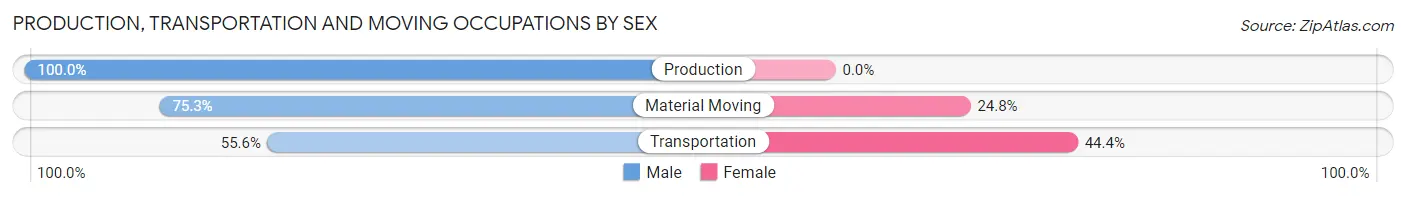
| Occupation | Male | Female |
| Production | 62 (100.0%) | 0 (0.0%) |
| Transportation | 10 (55.6%) | 8 (44.4%) |
| Material Moving | 76 (75.2%) | 25 (24.7%) |
| Total (Category) | 148 (81.8%) | 33 (18.2%) |
| Total (Overall) | 1,176 (61.4%) | 741 (38.7%) |
Employment Industries by Sex in Wayzata
Employment Industries in Wayzata
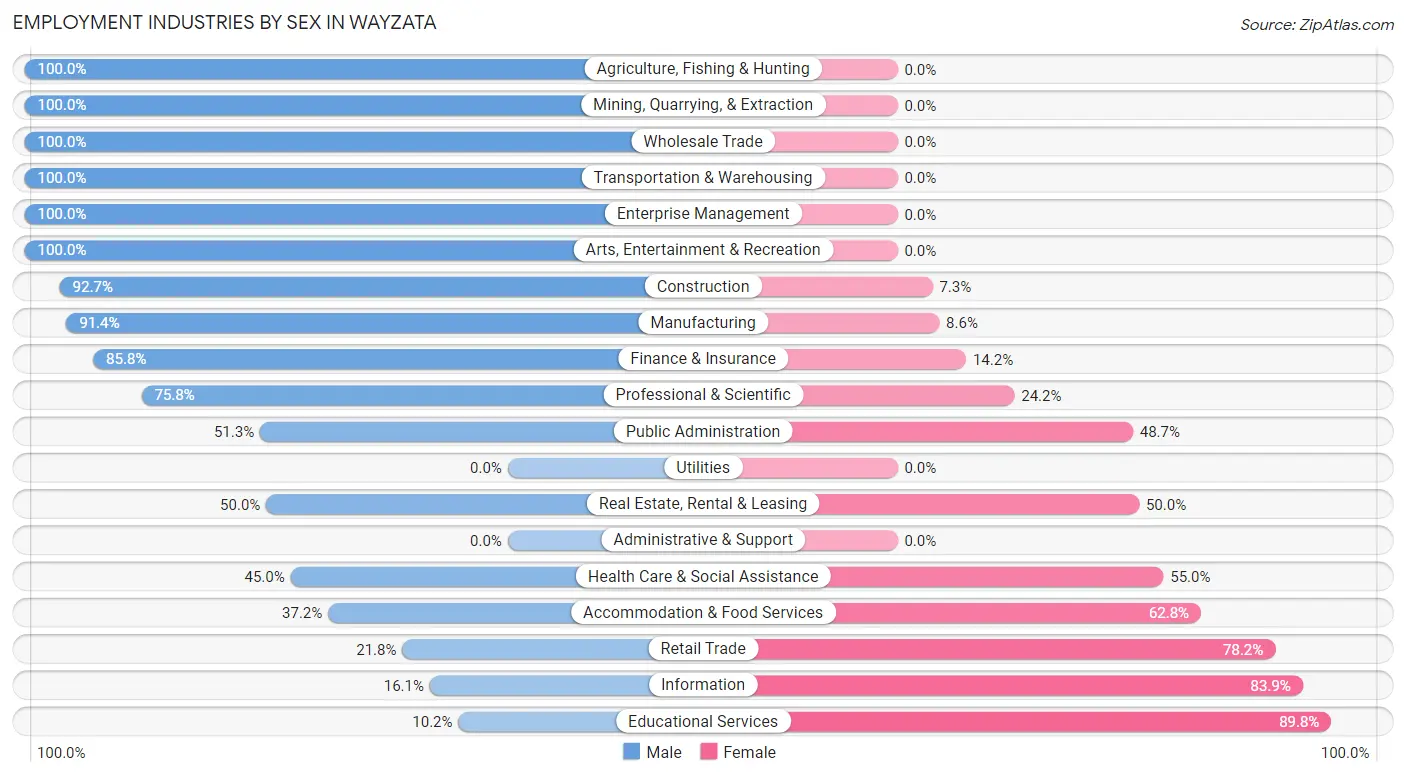
The major employment industries in Wayzata include Professional & Scientific (372 | 19.4%), Health Care & Social Assistance (238 | 12.4%), Manufacturing (220 | 11.5%), Retail Trade (197 | 10.3%), and Educational Services (186 | 9.7%).
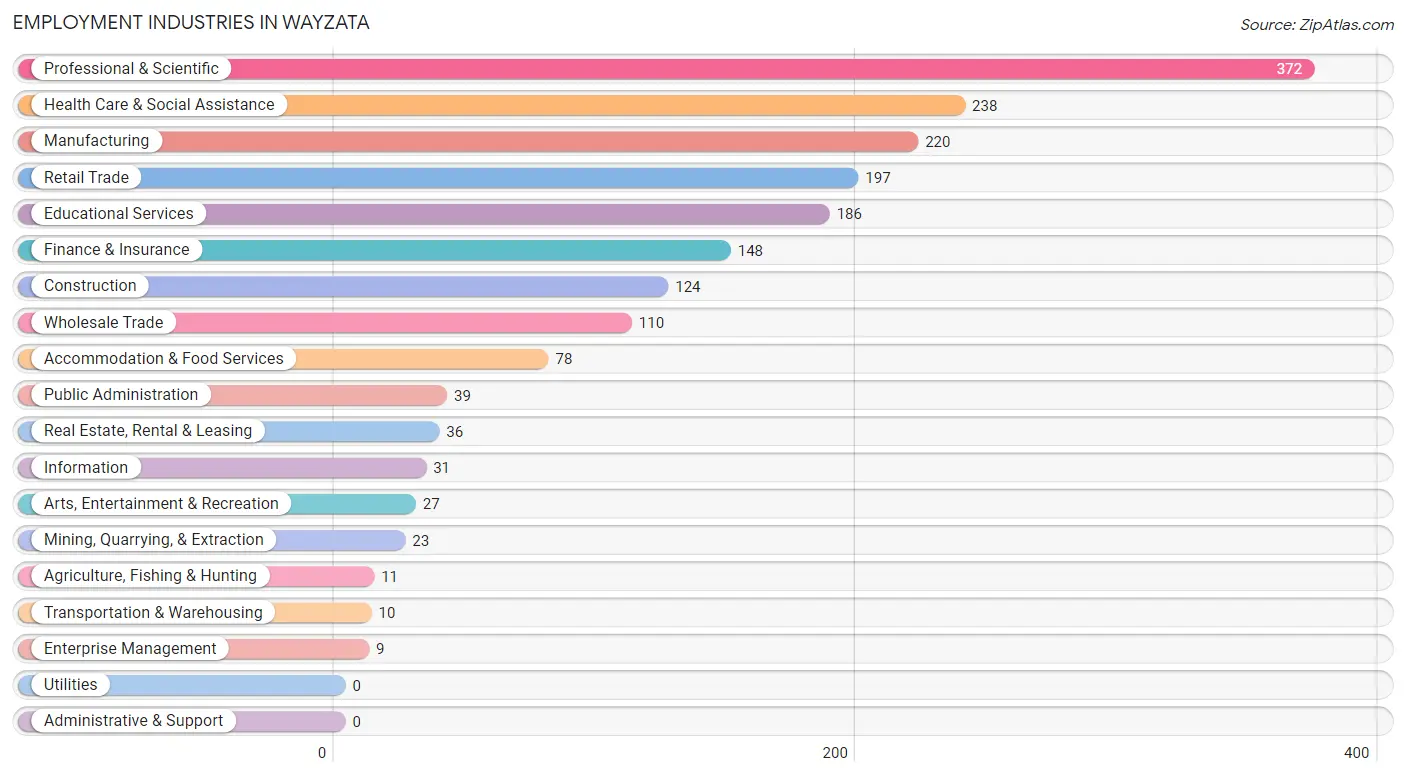
Employment Industries by Sex in Wayzata
The Wayzata industries that see more men than women are Agriculture, Fishing & Hunting (100.0%), Mining, Quarrying, & Extraction (100.0%), and Wholesale Trade (100.0%), whereas the industries that tend to have a higher number of women are Educational Services (89.8%), Information (83.9%), and Retail Trade (78.2%).
| Industry | Male | Female |
| Agriculture, Fishing & Hunting | 11 (100.0%) | 0 (0.0%) |
| Mining, Quarrying, & Extraction | 23 (100.0%) | 0 (0.0%) |
| Construction | 115 (92.7%) | 9 (7.3%) |
| Manufacturing | 201 (91.4%) | 19 (8.6%) |
| Wholesale Trade | 110 (100.0%) | 0 (0.0%) |
| Retail Trade | 43 (21.8%) | 154 (78.2%) |
| Transportation & Warehousing | 10 (100.0%) | 0 (0.0%) |
| Utilities | 0 (0.0%) | 0 (0.0%) |
| Information | 5 (16.1%) | 26 (83.9%) |
| Finance & Insurance | 127 (85.8%) | 21 (14.2%) |
| Real Estate, Rental & Leasing | 18 (50.0%) | 18 (50.0%) |
| Professional & Scientific | 282 (75.8%) | 90 (24.2%) |
| Enterprise Management | 9 (100.0%) | 0 (0.0%) |
| Administrative & Support | 0 (0.0%) | 0 (0.0%) |
| Educational Services | 19 (10.2%) | 167 (89.8%) |
| Health Care & Social Assistance | 107 (45.0%) | 131 (55.0%) |
| Arts, Entertainment & Recreation | 27 (100.0%) | 0 (0.0%) |
| Accommodation & Food Services | 29 (37.2%) | 49 (62.8%) |
| Public Administration | 20 (51.3%) | 19 (48.7%) |
| Total | 1,176 (61.4%) | 741 (38.7%) |
Education in Wayzata
School Enrollment in Wayzata
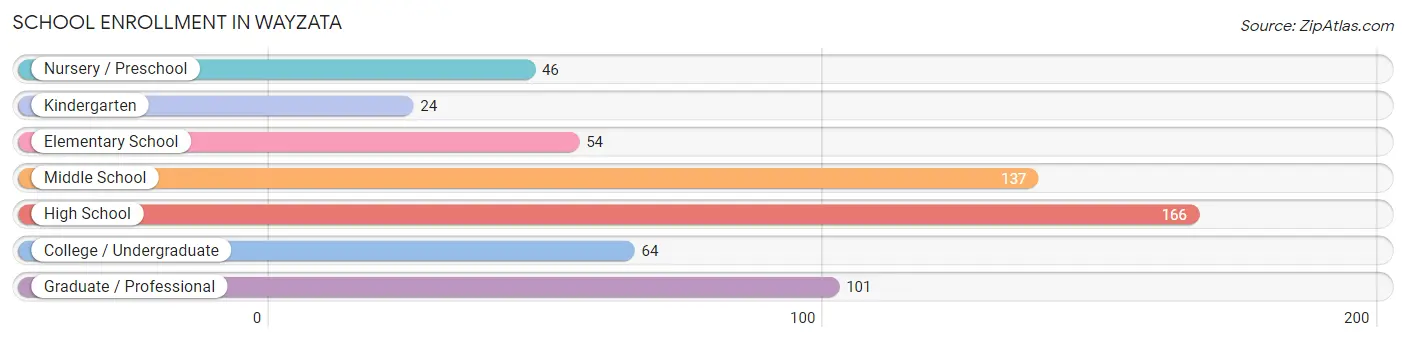
The most common levels of schooling among the 592 students in Wayzata are high school (166 | 28.0%), middle school (137 | 23.1%), and graduate / professional (101 | 17.1%).
| School Level | # Students | % Students |
| Nursery / Preschool | 46 | 7.8% |
| Kindergarten | 24 | 4.1% |
| Elementary School | 54 | 9.1% |
| Middle School | 137 | 23.1% |
| High School | 166 | 28.0% |
| College / Undergraduate | 64 | 10.8% |
| Graduate / Professional | 101 | 17.1% |
| Total | 592 | 100.0% |
School Enrollment by Age by Funding Source in Wayzata
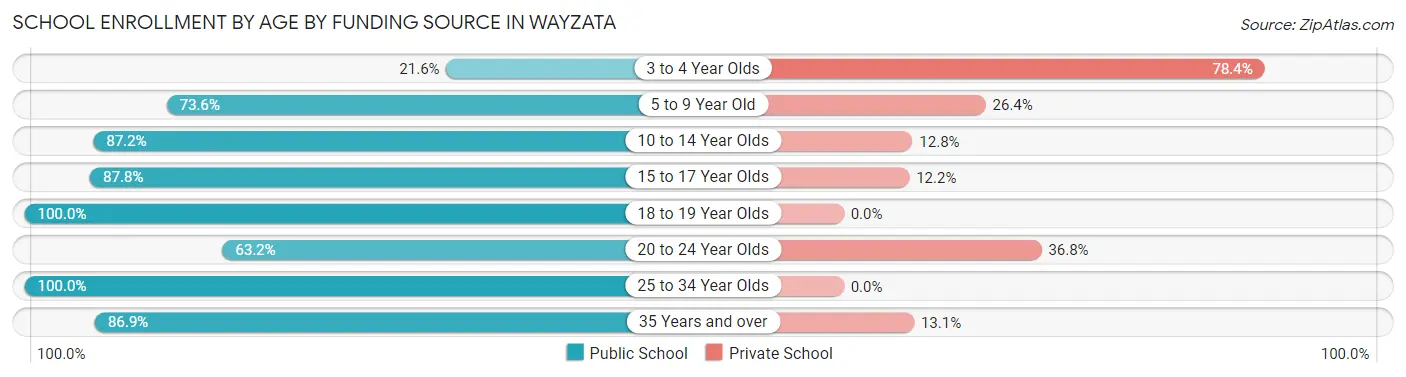
Out of a total of 592 students who are enrolled in schools in Wayzata, 114 (19.3%) attend a private institution, while the remaining 478 (80.7%) are enrolled in public schools. The age group of 3 to 4 year olds has the highest likelihood of being enrolled in private schools, with 29 (78.4% in the age bracket) enrolled. Conversely, the age group of 18 to 19 year olds has the lowest likelihood of being enrolled in a private school, with 27 (100.0% in the age bracket) attending a public institution.
| Age Bracket | Public School | Private School |
| 3 to 4 Year Olds | 8 (21.6%) | 29 (78.4%) |
| 5 to 9 Year Old | 64 (73.6%) | 23 (26.4%) |
| 10 to 14 Year Olds | 143 (87.2%) | 21 (12.8%) |
| 15 to 17 Year Olds | 115 (87.8%) | 16 (12.2%) |
| 18 to 19 Year Olds | 27 (100.0%) | 0 (0.0%) |
| 20 to 24 Year Olds | 24 (63.2%) | 14 (36.8%) |
| 25 to 34 Year Olds | 24 (100.0%) | 0 (0.0%) |
| 35 Years and over | 73 (86.9%) | 11 (13.1%) |
| Total | 478 (80.7%) | 114 (19.3%) |
Educational Attainment by Field of Study in Wayzata
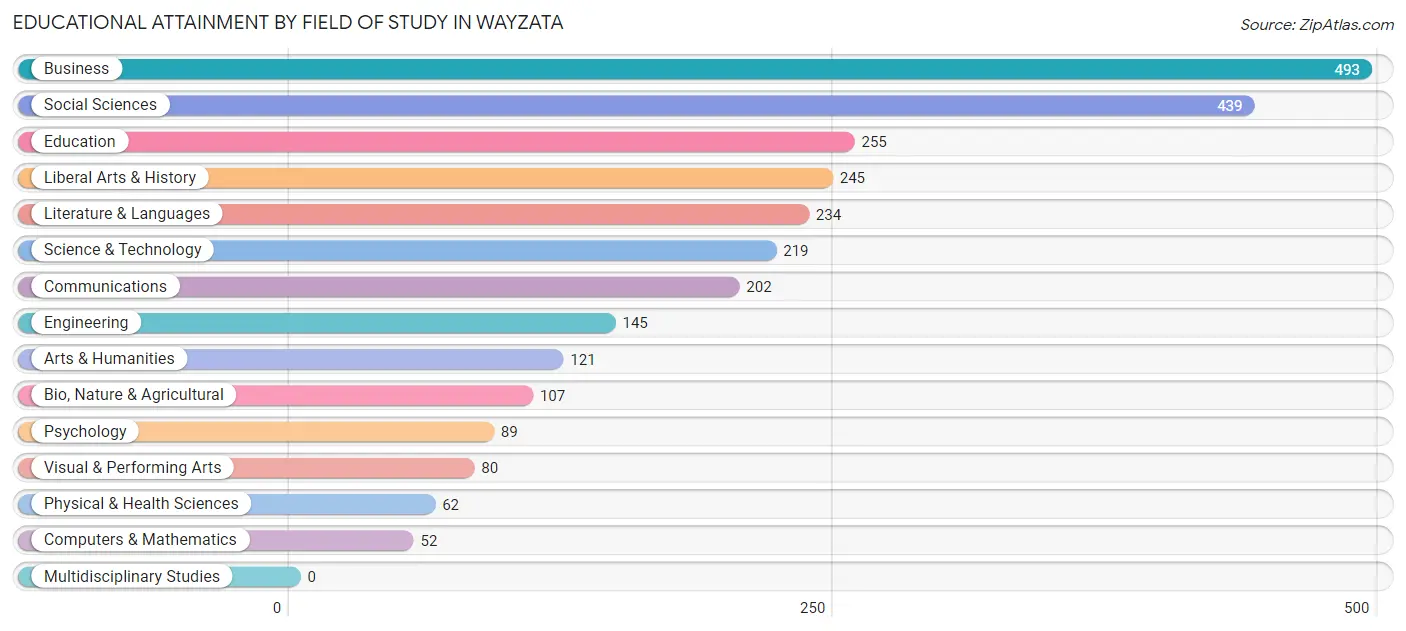
Business (493 | 18.0%), social sciences (439 | 16.0%), education (255 | 9.3%), liberal arts & history (245 | 8.9%), and literature & languages (234 | 8.5%) are the most common fields of study among 2,743 individuals in Wayzata who have obtained a bachelor's degree or higher.
| Field of Study | # Graduates | % Graduates |
| Computers & Mathematics | 52 | 1.9% |
| Bio, Nature & Agricultural | 107 | 3.9% |
| Physical & Health Sciences | 62 | 2.3% |
| Psychology | 89 | 3.2% |
| Social Sciences | 439 | 16.0% |
| Engineering | 145 | 5.3% |
| Multidisciplinary Studies | 0 | 0.0% |
| Science & Technology | 219 | 8.0% |
| Business | 493 | 18.0% |
| Education | 255 | 9.3% |
| Literature & Languages | 234 | 8.5% |
| Liberal Arts & History | 245 | 8.9% |
| Visual & Performing Arts | 80 | 2.9% |
| Communications | 202 | 7.4% |
| Arts & Humanities | 121 | 4.4% |
| Total | 2,743 | 100.0% |
Transportation & Commute in Wayzata
Vehicle Availability by Sex in Wayzata
The most prevalent vehicle ownership categories in Wayzata are males with 2 vehicles (472, accounting for 46.6%) and females with 2 vehicles (286, making up 63.7%).
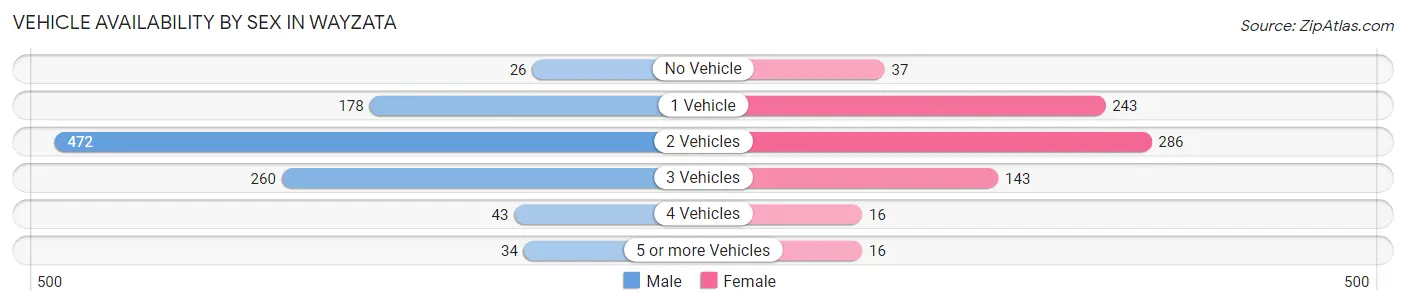
| Vehicles Available | Male | Female |
| No Vehicle | 26 (2.6%) | 37 (5.0%) |
| 1 Vehicle | 178 (17.6%) | 243 (32.8%) |
| 2 Vehicles | 472 (46.6%) | 286 (38.6%) |
| 3 Vehicles | 260 (25.7%) | 143 (19.3%) |
| 4 Vehicles | 43 (4.2%) | 16 (2.2%) |
| 5 or more Vehicles | 34 (3.4%) | 16 (2.2%) |
| Total | 1,013 (100.0%) | 741 (100.0%) |
Commute Time in Wayzata
The most frequently occuring commute durations in Wayzata are 15 to 19 minutes (324 commuters, 22.9%), 20 to 24 minutes (321 commuters, 22.6%), and 10 to 14 minutes (247 commuters, 17.4%).
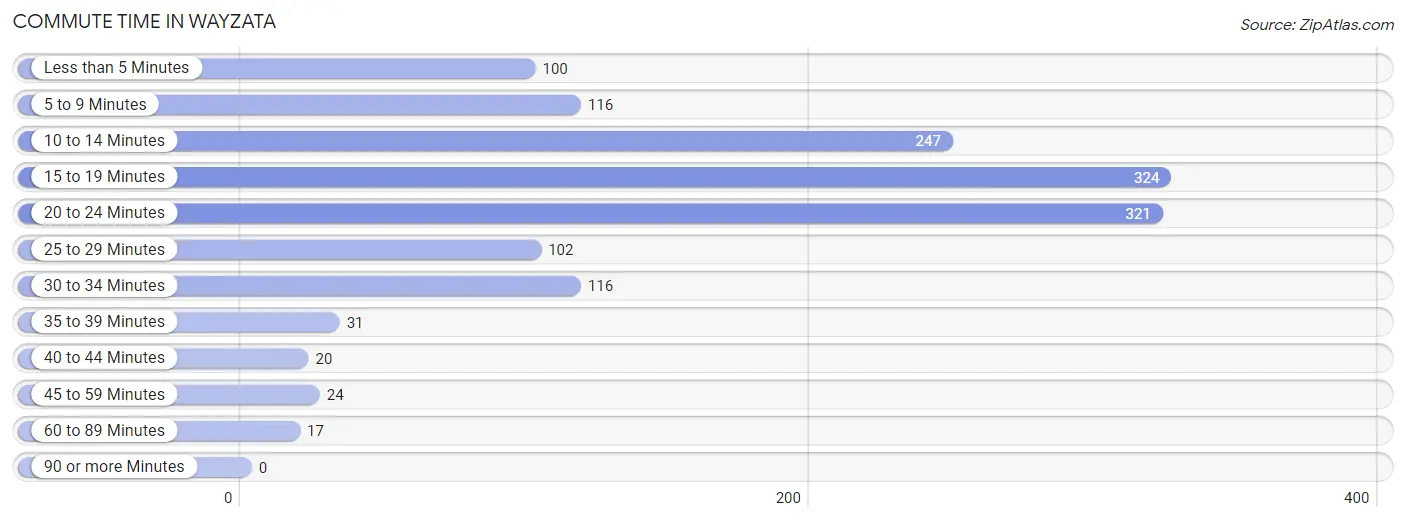
| Commute Time | # Commuters | % Commuters |
| Less than 5 Minutes | 100 | 7.0% |
| 5 to 9 Minutes | 116 | 8.2% |
| 10 to 14 Minutes | 247 | 17.4% |
| 15 to 19 Minutes | 324 | 22.9% |
| 20 to 24 Minutes | 321 | 22.6% |
| 25 to 29 Minutes | 102 | 7.2% |
| 30 to 34 Minutes | 116 | 8.2% |
| 35 to 39 Minutes | 31 | 2.2% |
| 40 to 44 Minutes | 20 | 1.4% |
| 45 to 59 Minutes | 24 | 1.7% |
| 60 to 89 Minutes | 17 | 1.2% |
| 90 or more Minutes | 0 | 0.0% |
Commute Time by Sex in Wayzata
The most common commute times in Wayzata are 15 to 19 minutes (252 commuters, 32.3%) for males and 20 to 24 minutes (175 commuters, 27.4%) for females.
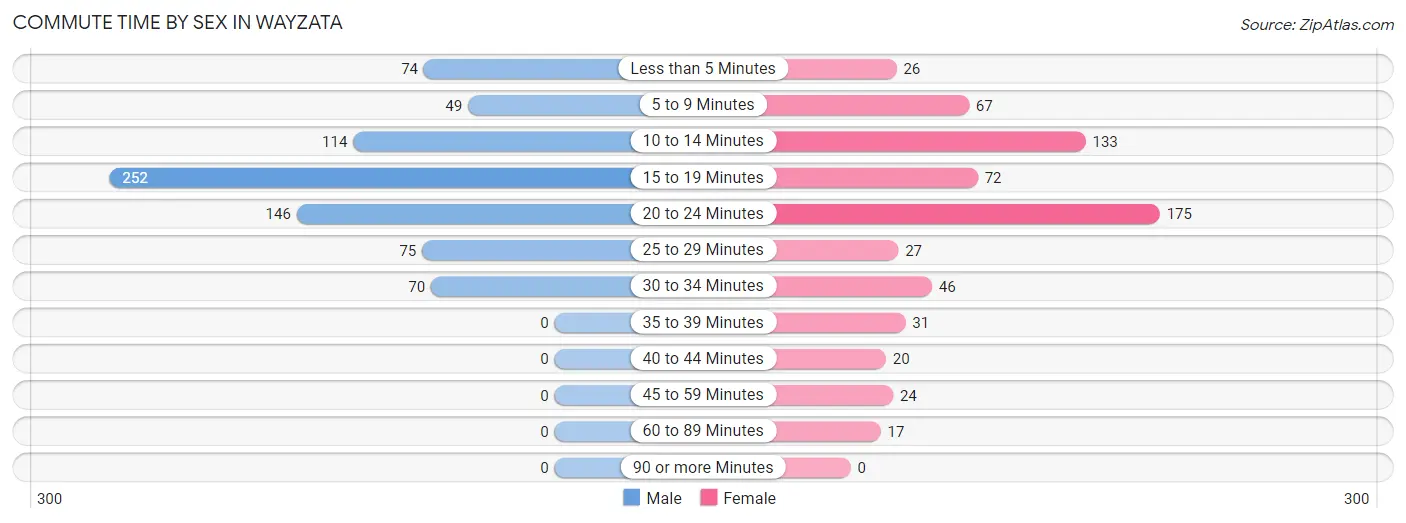
| Commute Time | Male | Female |
| Less than 5 Minutes | 74 (9.5%) | 26 (4.1%) |
| 5 to 9 Minutes | 49 (6.3%) | 67 (10.5%) |
| 10 to 14 Minutes | 114 (14.6%) | 133 (20.8%) |
| 15 to 19 Minutes | 252 (32.3%) | 72 (11.3%) |
| 20 to 24 Minutes | 146 (18.7%) | 175 (27.4%) |
| 25 to 29 Minutes | 75 (9.6%) | 27 (4.2%) |
| 30 to 34 Minutes | 70 (9.0%) | 46 (7.2%) |
| 35 to 39 Minutes | 0 (0.0%) | 31 (4.9%) |
| 40 to 44 Minutes | 0 (0.0%) | 20 (3.1%) |
| 45 to 59 Minutes | 0 (0.0%) | 24 (3.8%) |
| 60 to 89 Minutes | 0 (0.0%) | 17 (2.7%) |
| 90 or more Minutes | 0 (0.0%) | 0 (0.0%) |
Time of Departure to Work by Sex in Wayzata
The most frequent times of departure to work in Wayzata are 7:00 AM to 7:29 AM (277, 35.5%) for males and 7:00 AM to 7:29 AM (186, 29.1%) for females.
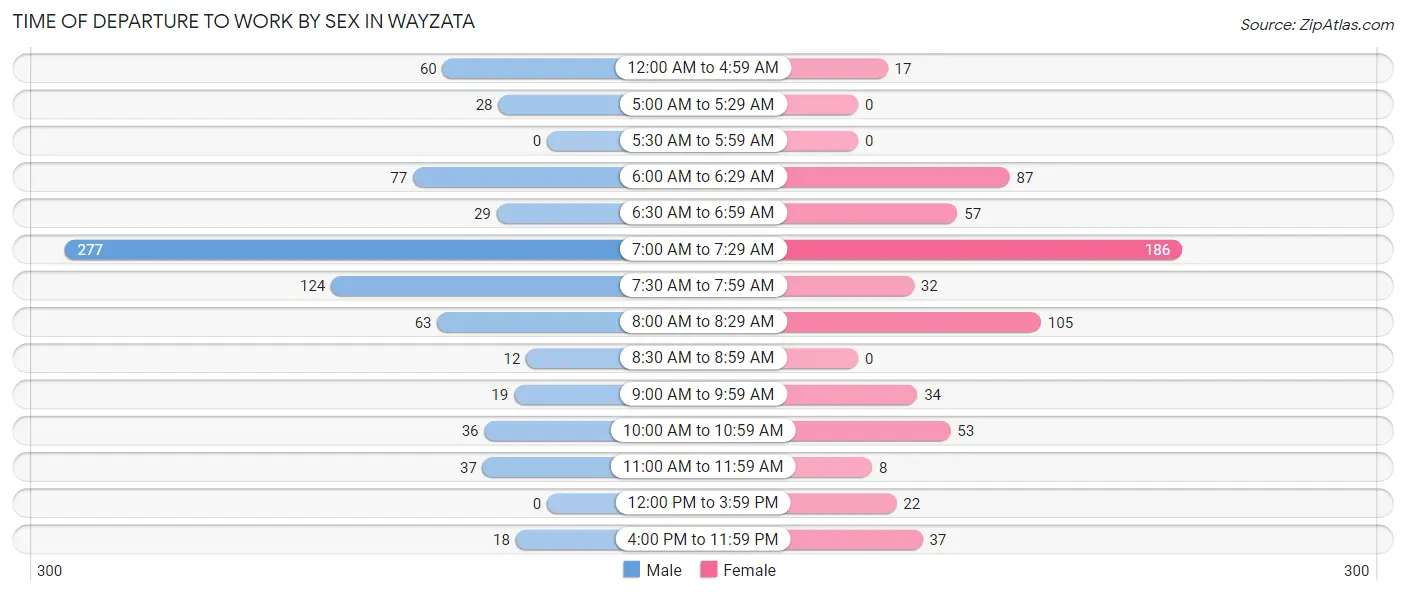
| Time of Departure | Male | Female |
| 12:00 AM to 4:59 AM | 60 (7.7%) | 17 (2.7%) |
| 5:00 AM to 5:29 AM | 28 (3.6%) | 0 (0.0%) |
| 5:30 AM to 5:59 AM | 0 (0.0%) | 0 (0.0%) |
| 6:00 AM to 6:29 AM | 77 (9.9%) | 87 (13.6%) |
| 6:30 AM to 6:59 AM | 29 (3.7%) | 57 (8.9%) |
| 7:00 AM to 7:29 AM | 277 (35.5%) | 186 (29.1%) |
| 7:30 AM to 7:59 AM | 124 (15.9%) | 32 (5.0%) |
| 8:00 AM to 8:29 AM | 63 (8.1%) | 105 (16.5%) |
| 8:30 AM to 8:59 AM | 12 (1.5%) | 0 (0.0%) |
| 9:00 AM to 9:59 AM | 19 (2.4%) | 34 (5.3%) |
| 10:00 AM to 10:59 AM | 36 (4.6%) | 53 (8.3%) |
| 11:00 AM to 11:59 AM | 37 (4.7%) | 8 (1.3%) |
| 12:00 PM to 3:59 PM | 0 (0.0%) | 22 (3.5%) |
| 4:00 PM to 11:59 PM | 18 (2.3%) | 37 (5.8%) |
| Total | 780 (100.0%) | 638 (100.0%) |
Housing Occupancy in Wayzata
Occupancy by Ownership in Wayzata
Of the total 2,169 dwellings in Wayzata, owner-occupied units account for 1,296 (59.8%), while renter-occupied units make up 873 (40.3%).
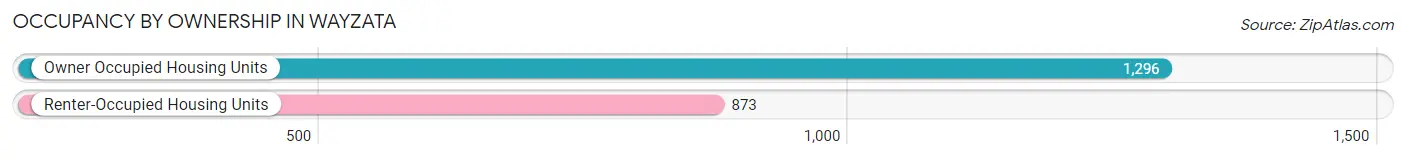
| Occupancy | # Housing Units | % Housing Units |
| Owner Occupied Housing Units | 1,296 | 59.8% |
| Renter-Occupied Housing Units | 873 | 40.3% |
| Total Occupied Housing Units | 2,169 | 100.0% |
Occupancy by Household Size in Wayzata
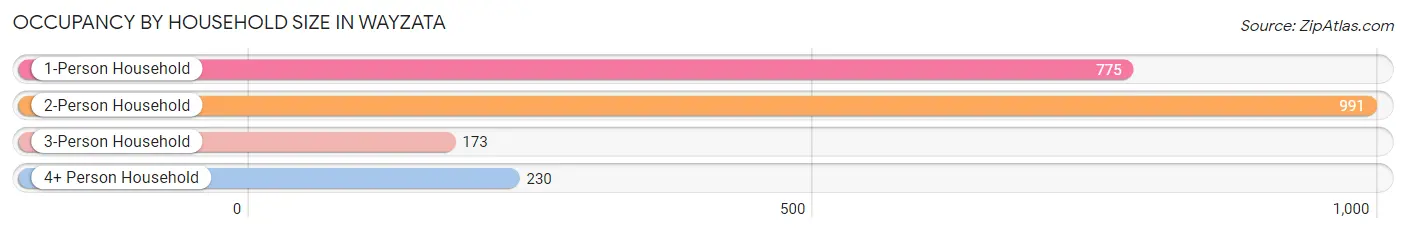
| Household Size | # Housing Units | % Housing Units |
| 1-Person Household | 775 | 35.7% |
| 2-Person Household | 991 | 45.7% |
| 3-Person Household | 173 | 8.0% |
| 4+ Person Household | 230 | 10.6% |
| Total Housing Units | 2,169 | 100.0% |
Occupancy by Ownership by Household Size in Wayzata
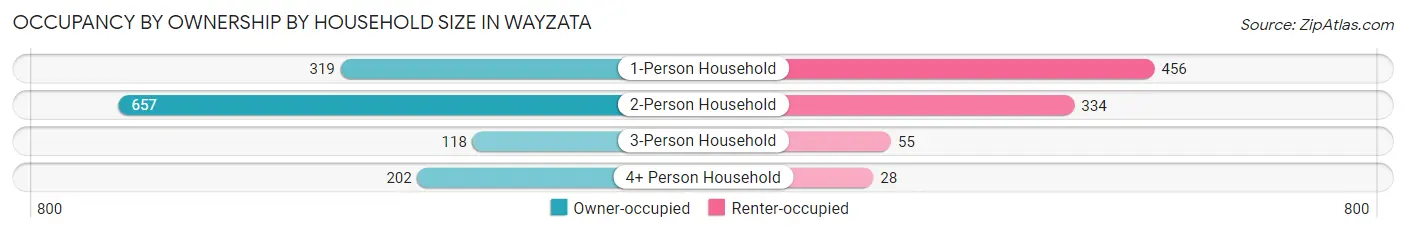
| Household Size | Owner-occupied | Renter-occupied |
| 1-Person Household | 319 (41.2%) | 456 (58.8%) |
| 2-Person Household | 657 (66.3%) | 334 (33.7%) |
| 3-Person Household | 118 (68.2%) | 55 (31.8%) |
| 4+ Person Household | 202 (87.8%) | 28 (12.2%) |
| Total Housing Units | 1,296 (59.8%) | 873 (40.3%) |
Occupancy by Educational Attainment in Wayzata
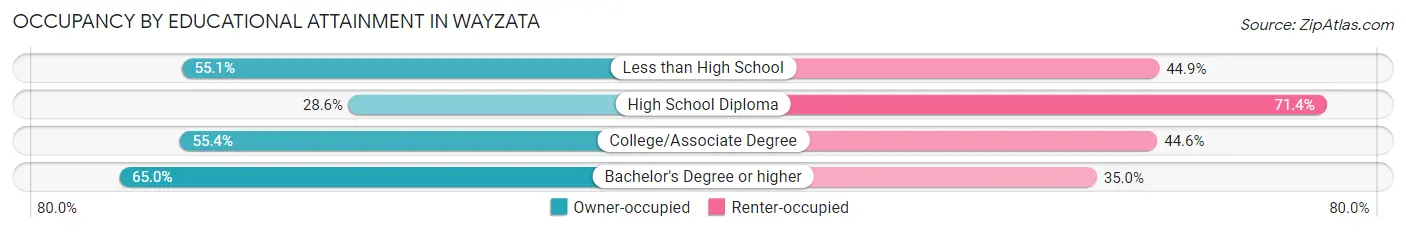
| Household Size | Owner-occupied | Renter-occupied |
| Less than High School | 27 (55.1%) | 22 (44.9%) |
| High School Diploma | 46 (28.6%) | 115 (71.4%) |
| College/Associate Degree | 292 (55.4%) | 235 (44.6%) |
| Bachelor's Degree or higher | 931 (65.0%) | 501 (35.0%) |
Occupancy by Age of Householder in Wayzata
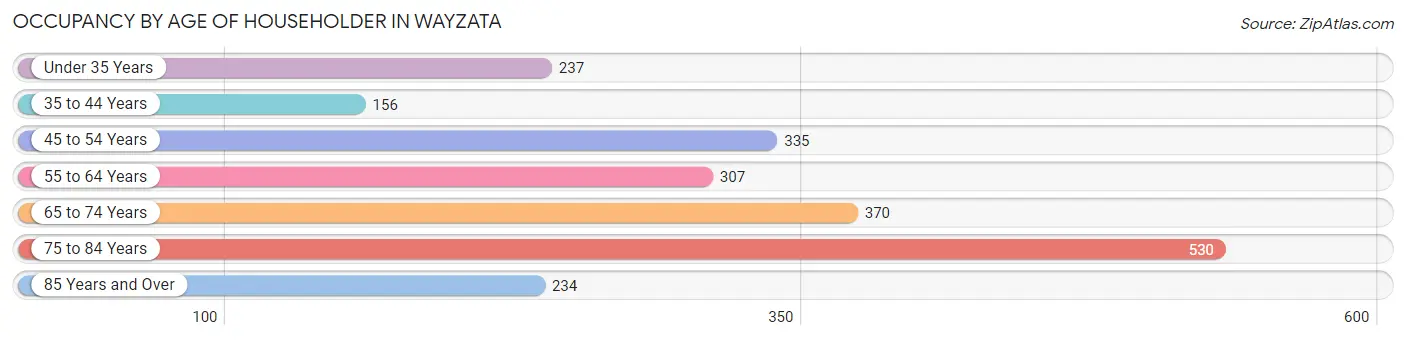
| Age Bracket | # Households | % Households |
| Under 35 Years | 237 | 10.9% |
| 35 to 44 Years | 156 | 7.2% |
| 45 to 54 Years | 335 | 15.4% |
| 55 to 64 Years | 307 | 14.1% |
| 65 to 74 Years | 370 | 17.1% |
| 75 to 84 Years | 530 | 24.4% |
| 85 Years and Over | 234 | 10.8% |
| Total | 2,169 | 100.0% |
Housing Finances in Wayzata
Median Income by Occupancy in Wayzata
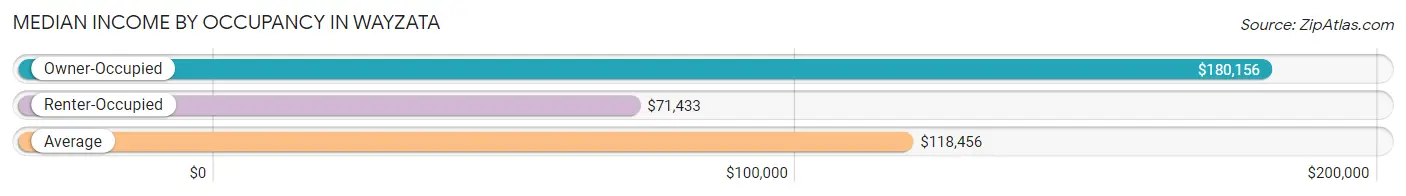
| Occupancy Type | # Households | Median Income |
| Owner-Occupied | 1,296 (59.8%) | $180,156 |
| Renter-Occupied | 873 (40.3%) | $71,433 |
| Average | 2,169 (100.0%) | $118,456 |
Occupancy by Householder Income Bracket in Wayzata
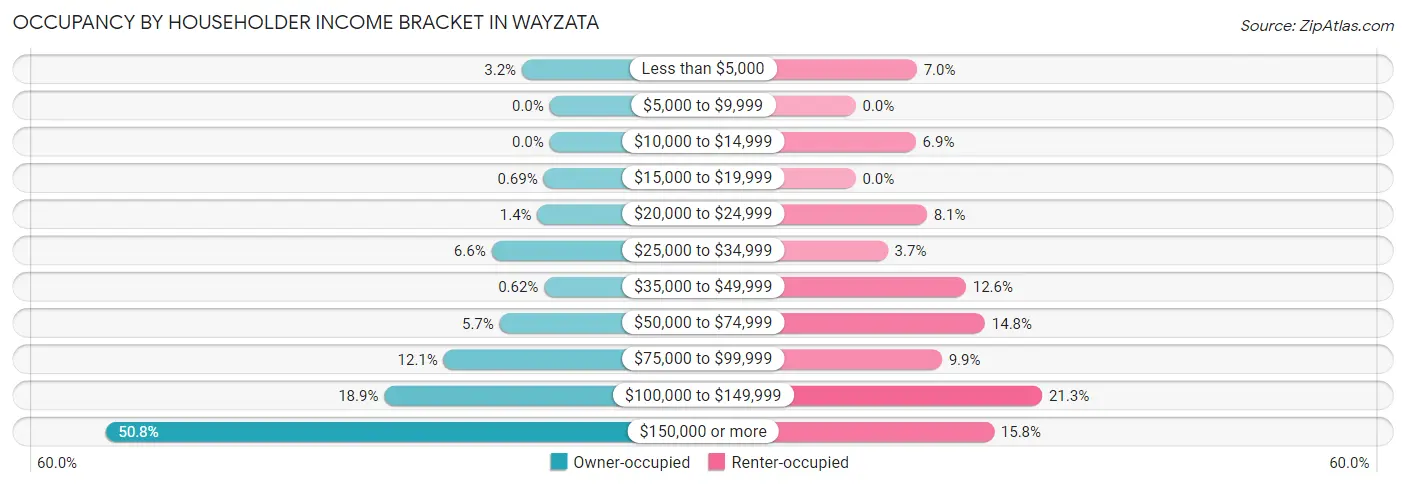
| Income Bracket | Owner-occupied | Renter-occupied |
| Less than $5,000 | 41 (3.2%) | 61 (7.0%) |
| $5,000 to $9,999 | 0 (0.0%) | 0 (0.0%) |
| $10,000 to $14,999 | 0 (0.0%) | 60 (6.9%) |
| $15,000 to $19,999 | 9 (0.7%) | 0 (0.0%) |
| $20,000 to $24,999 | 18 (1.4%) | 71 (8.1%) |
| $25,000 to $34,999 | 86 (6.6%) | 32 (3.7%) |
| $35,000 to $49,999 | 8 (0.6%) | 110 (12.6%) |
| $50,000 to $74,999 | 74 (5.7%) | 129 (14.8%) |
| $75,000 to $99,999 | 157 (12.1%) | 86 (9.9%) |
| $100,000 to $149,999 | 245 (18.9%) | 186 (21.3%) |
| $150,000 or more | 658 (50.8%) | 138 (15.8%) |
| Total | 1,296 (100.0%) | 873 (100.0%) |
Monthly Housing Cost Tiers in Wayzata
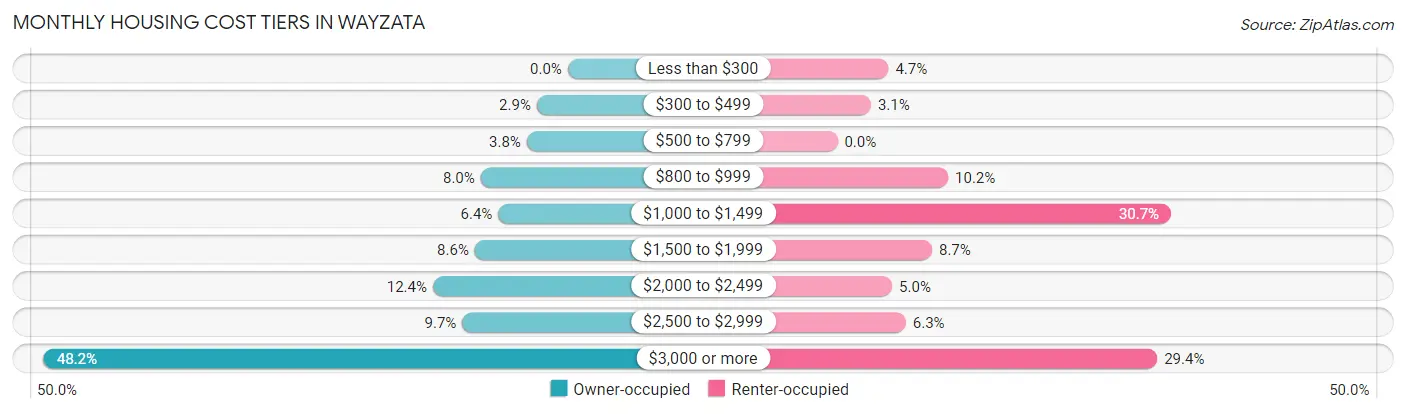
| Monthly Cost | Owner-occupied | Renter-occupied |
| Less than $300 | 0 (0.0%) | 41 (4.7%) |
| $300 to $499 | 37 (2.9%) | 27 (3.1%) |
| $500 to $799 | 49 (3.8%) | 0 (0.0%) |
| $800 to $999 | 104 (8.0%) | 89 (10.2%) |
| $1,000 to $1,499 | 83 (6.4%) | 268 (30.7%) |
| $1,500 to $1,999 | 111 (8.6%) | 76 (8.7%) |
| $2,000 to $2,499 | 161 (12.4%) | 44 (5.0%) |
| $2,500 to $2,999 | 126 (9.7%) | 55 (6.3%) |
| $3,000 or more | 625 (48.2%) | 257 (29.4%) |
| Total | 1,296 (100.0%) | 873 (100.0%) |
Physical Housing Characteristics in Wayzata
Housing Structures in Wayzata
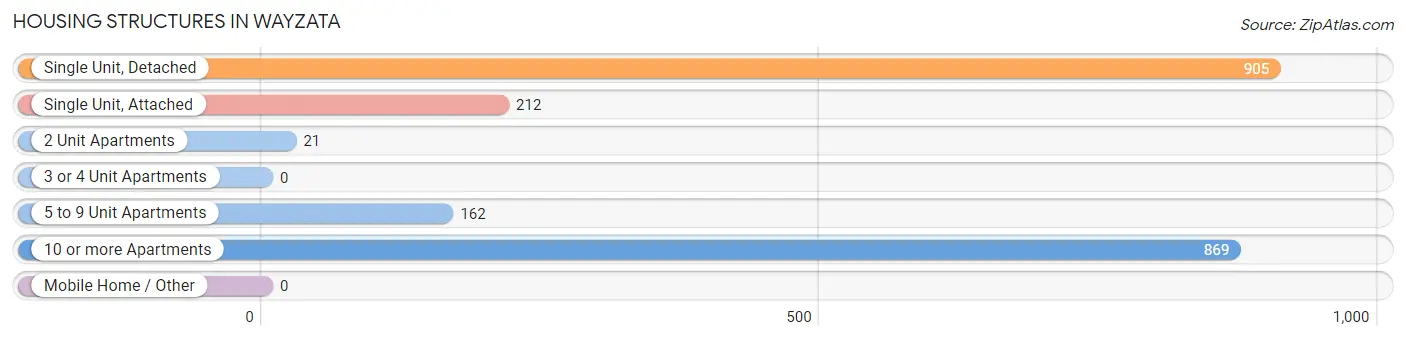
| Structure Type | # Housing Units | % Housing Units |
| Single Unit, Detached | 905 | 41.7% |
| Single Unit, Attached | 212 | 9.8% |
| 2 Unit Apartments | 21 | 1.0% |
| 3 or 4 Unit Apartments | 0 | 0.0% |
| 5 to 9 Unit Apartments | 162 | 7.5% |
| 10 or more Apartments | 869 | 40.1% |
| Mobile Home / Other | 0 | 0.0% |
| Total | 2,169 | 100.0% |
Housing Structures by Occupancy in Wayzata
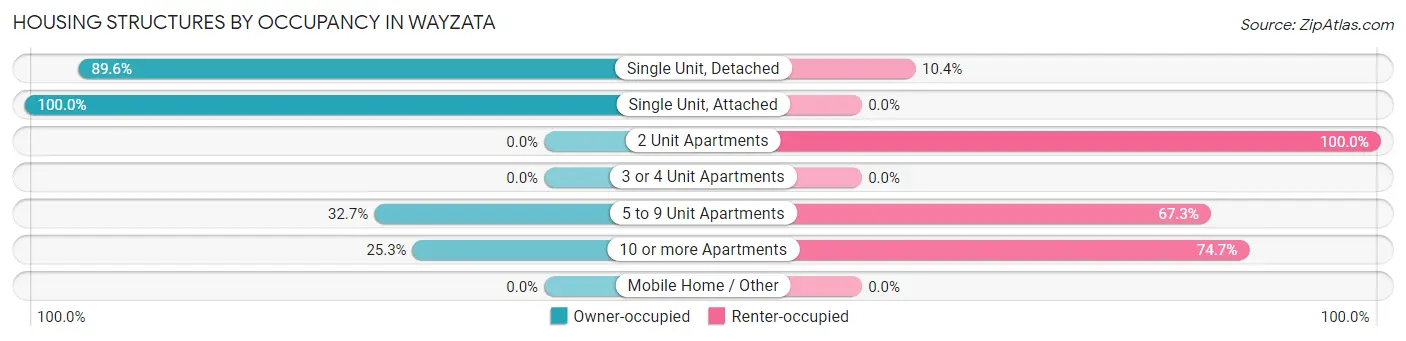
| Structure Type | Owner-occupied | Renter-occupied |
| Single Unit, Detached | 811 (89.6%) | 94 (10.4%) |
| Single Unit, Attached | 212 (100.0%) | 0 (0.0%) |
| 2 Unit Apartments | 0 (0.0%) | 21 (100.0%) |
| 3 or 4 Unit Apartments | 0 (0.0%) | 0 (0.0%) |
| 5 to 9 Unit Apartments | 53 (32.7%) | 109 (67.3%) |
| 10 or more Apartments | 220 (25.3%) | 649 (74.7%) |
| Mobile Home / Other | 0 (0.0%) | 0 (0.0%) |
| Total | 1,296 (59.8%) | 873 (40.3%) |
Housing Structures by Number of Rooms in Wayzata
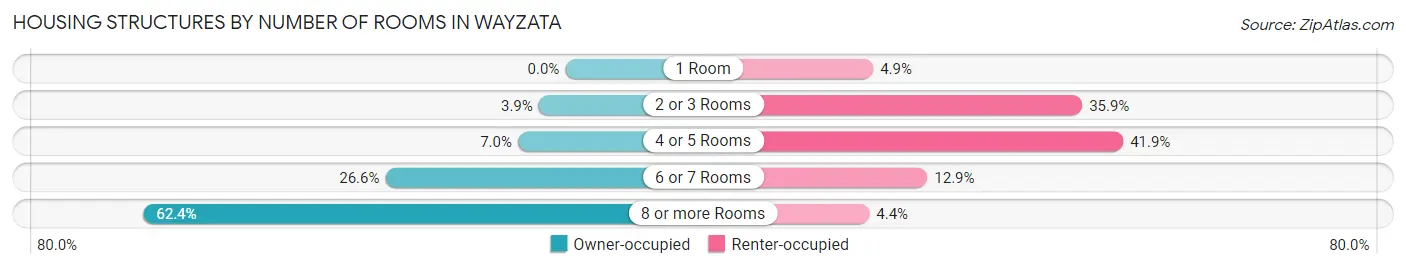
| Number of Rooms | Owner-occupied | Renter-occupied |
| 1 Room | 0 (0.0%) | 43 (4.9%) |
| 2 or 3 Rooms | 51 (3.9%) | 313 (35.8%) |
| 4 or 5 Rooms | 91 (7.0%) | 366 (41.9%) |
| 6 or 7 Rooms | 345 (26.6%) | 113 (12.9%) |
| 8 or more Rooms | 809 (62.4%) | 38 (4.3%) |
| Total | 1,296 (100.0%) | 873 (100.0%) |
Housing Structure by Heating Type in Wayzata
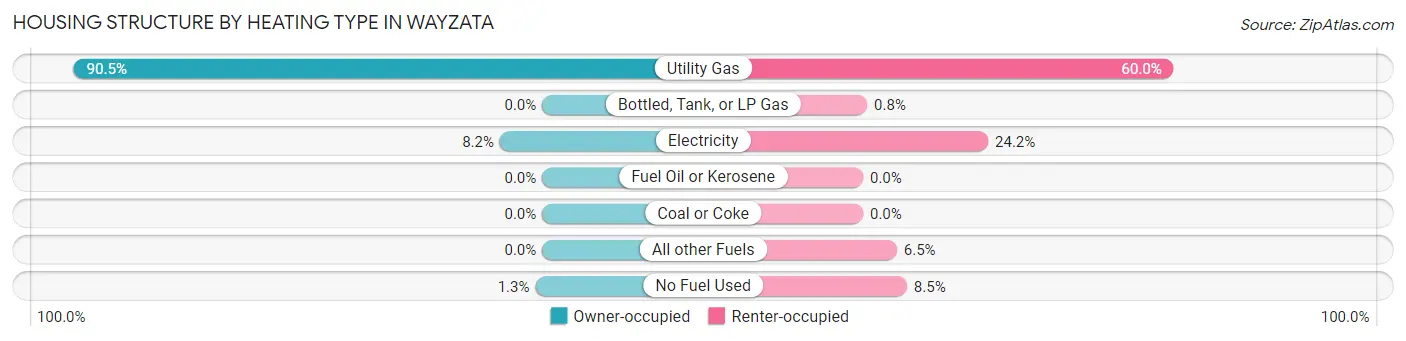
| Heating Type | Owner-occupied | Renter-occupied |
| Utility Gas | 1,173 (90.5%) | 524 (60.0%) |
| Bottled, Tank, or LP Gas | 0 (0.0%) | 7 (0.8%) |
| Electricity | 106 (8.2%) | 211 (24.2%) |
| Fuel Oil or Kerosene | 0 (0.0%) | 0 (0.0%) |
| Coal or Coke | 0 (0.0%) | 0 (0.0%) |
| All other Fuels | 0 (0.0%) | 57 (6.5%) |
| No Fuel Used | 17 (1.3%) | 74 (8.5%) |
| Total | 1,296 (100.0%) | 873 (100.0%) |
Household Vehicle Usage in Wayzata
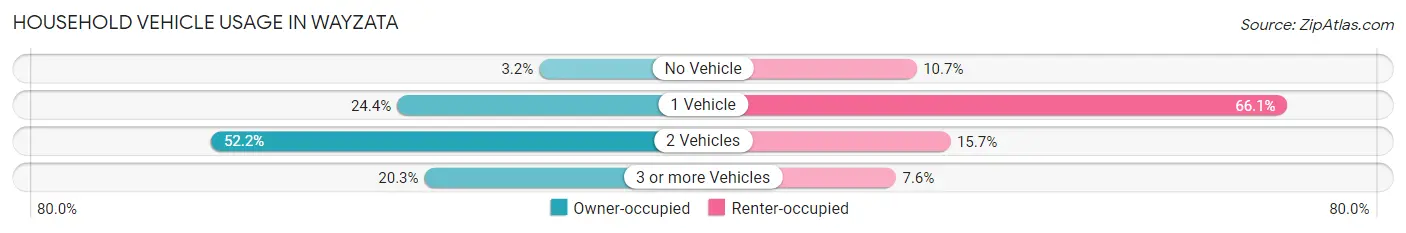
| Vehicles per Household | Owner-occupied | Renter-occupied |
| No Vehicle | 41 (3.2%) | 93 (10.6%) |
| 1 Vehicle | 316 (24.4%) | 577 (66.1%) |
| 2 Vehicles | 676 (52.2%) | 137 (15.7%) |
| 3 or more Vehicles | 263 (20.3%) | 66 (7.6%) |
| Total | 1,296 (100.0%) | 873 (100.0%) |
Real Estate & Mortgages in Wayzata
Real Estate and Mortgage Overview in Wayzata
| Characteristic | Without Mortgage | With Mortgage |
| Housing Units | 638 | 658 |
| Median Property Value | $737,600 | $1,055,600 |
| Median Household Income | $123,214 | $377 |
| Monthly Housing Costs | $1,501 | $439 |
| Real Estate Taxes | $10,001 | $14 |
Property Value by Mortgage Status in Wayzata
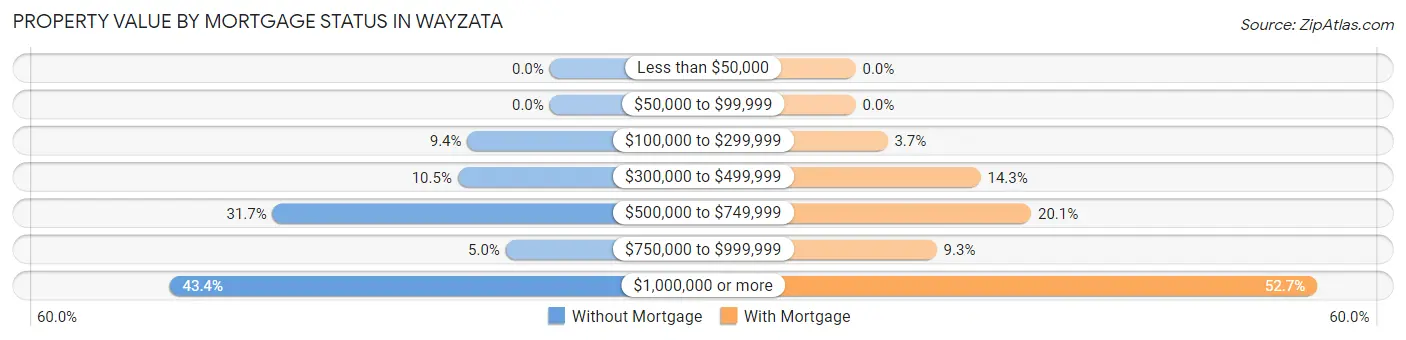
| Property Value | Without Mortgage | With Mortgage |
| Less than $50,000 | 0 (0.0%) | 0 (0.0%) |
| $50,000 to $99,999 | 0 (0.0%) | 0 (0.0%) |
| $100,000 to $299,999 | 60 (9.4%) | 24 (3.6%) |
| $300,000 to $499,999 | 67 (10.5%) | 94 (14.3%) |
| $500,000 to $749,999 | 202 (31.7%) | 132 (20.1%) |
| $750,000 to $999,999 | 32 (5.0%) | 61 (9.3%) |
| $1,000,000 or more | 277 (43.4%) | 347 (52.7%) |
| Total | 638 (100.0%) | 658 (100.0%) |
Household Income by Mortgage Status in Wayzata
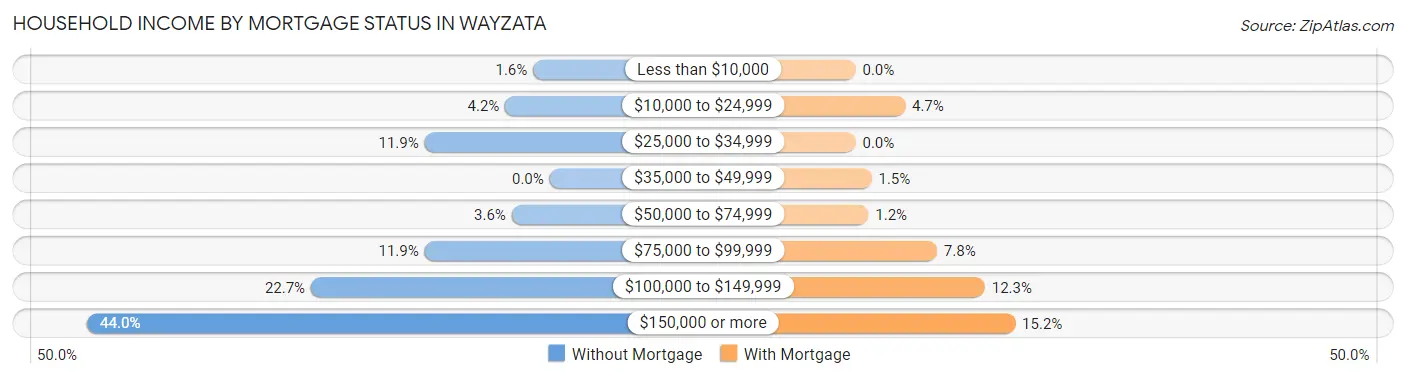
| Household Income | Without Mortgage | With Mortgage |
| Less than $10,000 | 10 (1.6%) | 0 (0.0%) |
| $10,000 to $24,999 | 27 (4.2%) | 31 (4.7%) |
| $25,000 to $34,999 | 76 (11.9%) | 0 (0.0%) |
| $35,000 to $49,999 | 0 (0.0%) | 10 (1.5%) |
| $50,000 to $74,999 | 23 (3.6%) | 8 (1.2%) |
| $75,000 to $99,999 | 76 (11.9%) | 51 (7.7%) |
| $100,000 to $149,999 | 145 (22.7%) | 81 (12.3%) |
| $150,000 or more | 281 (44.0%) | 100 (15.2%) |
| Total | 638 (100.0%) | 658 (100.0%) |
Property Value to Household Income Ratio in Wayzata
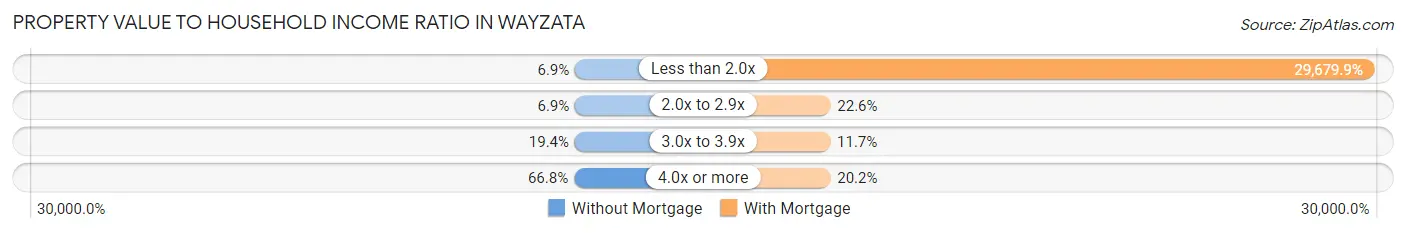
| Value-to-Income Ratio | Without Mortgage | With Mortgage |
| Less than 2.0x | 44 (6.9%) | 195,294 (29,679.9%) |
| 2.0x to 2.9x | 44 (6.9%) | 149 (22.6%) |
| 3.0x to 3.9x | 124 (19.4%) | 77 (11.7%) |
| 4.0x or more | 426 (66.8%) | 133 (20.2%) |
| Total | 638 (100.0%) | 658 (100.0%) |
Real Estate Taxes by Mortgage Status in Wayzata

| Property Taxes | Without Mortgage | With Mortgage |
| Less than $800 | 0 (0.0%) | 17 (2.6%) |
| $800 to $1,499 | 47 (7.4%) | 0 (0.0%) |
| $800 to $1,499 | 577 (90.4%) | 0 (0.0%) |
| Total | 638 (100.0%) | 658 (100.0%) |
Health & Disability in Wayzata
Health Insurance Coverage by Age in Wayzata
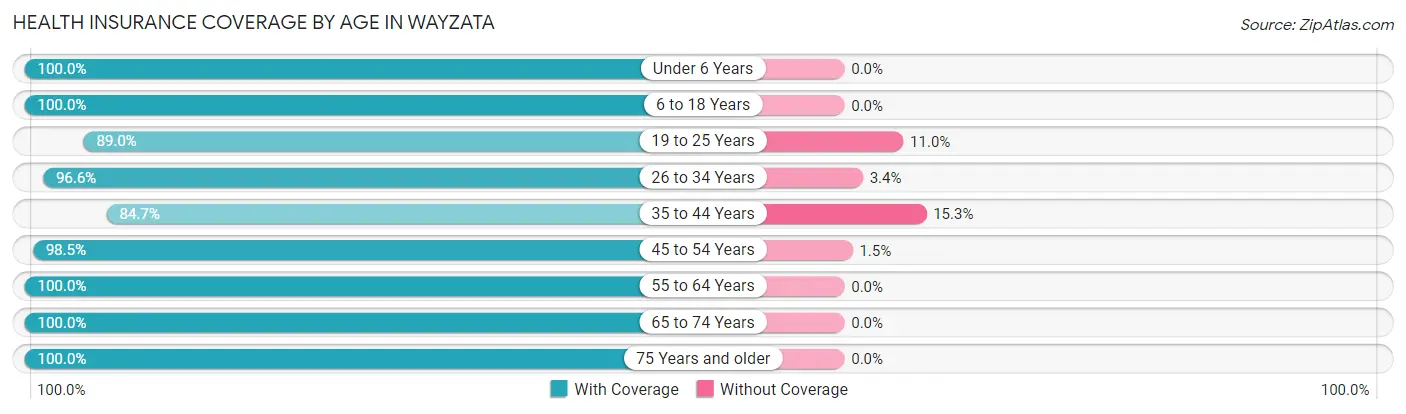
| Age Bracket | With Coverage | Without Coverage |
| Under 6 Years | 204 (100.0%) | 0 (0.0%) |
| 6 to 18 Years | 402 (100.0%) | 0 (0.0%) |
| 19 to 25 Years | 219 (89.0%) | 27 (11.0%) |
| 26 to 34 Years | 310 (96.6%) | 11 (3.4%) |
| 35 to 44 Years | 244 (84.7%) | 44 (15.3%) |
| 45 to 54 Years | 585 (98.5%) | 9 (1.5%) |
| 55 to 64 Years | 596 (100.0%) | 0 (0.0%) |
| 65 to 74 Years | 627 (100.0%) | 0 (0.0%) |
| 75 Years and older | 1,087 (100.0%) | 0 (0.0%) |
| Total | 4,274 (97.9%) | 91 (2.1%) |
Health Insurance Coverage by Citizenship Status in Wayzata

| Citizenship Status | With Coverage | Without Coverage |
| Native Born | 204 (100.0%) | 0 (0.0%) |
| Foreign Born, Citizen | 402 (100.0%) | 0 (0.0%) |
| Foreign Born, not a Citizen | 219 (89.0%) | 27 (11.0%) |
Health Insurance Coverage by Household Income in Wayzata
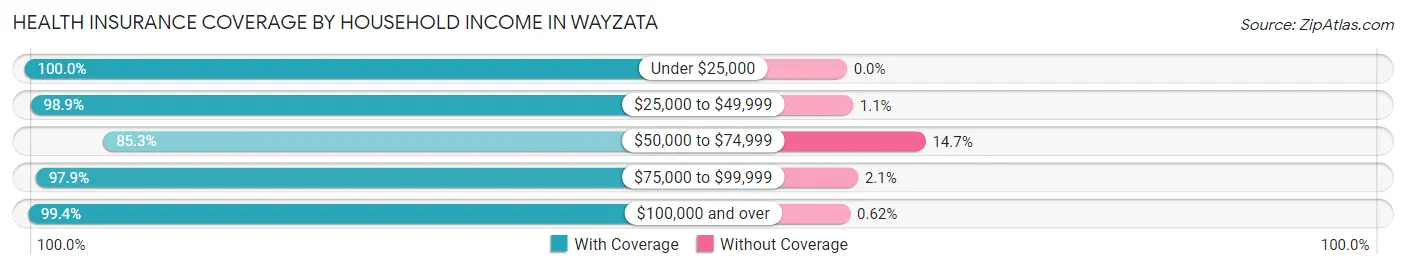
| Household Income | With Coverage | Without Coverage |
| Under $25,000 | 269 (100.0%) | 0 (0.0%) |
| $25,000 to $49,999 | 350 (98.9%) | 4 (1.1%) |
| $50,000 to $74,999 | 347 (85.3%) | 60 (14.7%) |
| $75,000 to $99,999 | 421 (97.9%) | 9 (2.1%) |
| $100,000 and over | 2,865 (99.4%) | 18 (0.6%) |
Public vs Private Health Insurance Coverage by Age in Wayzata
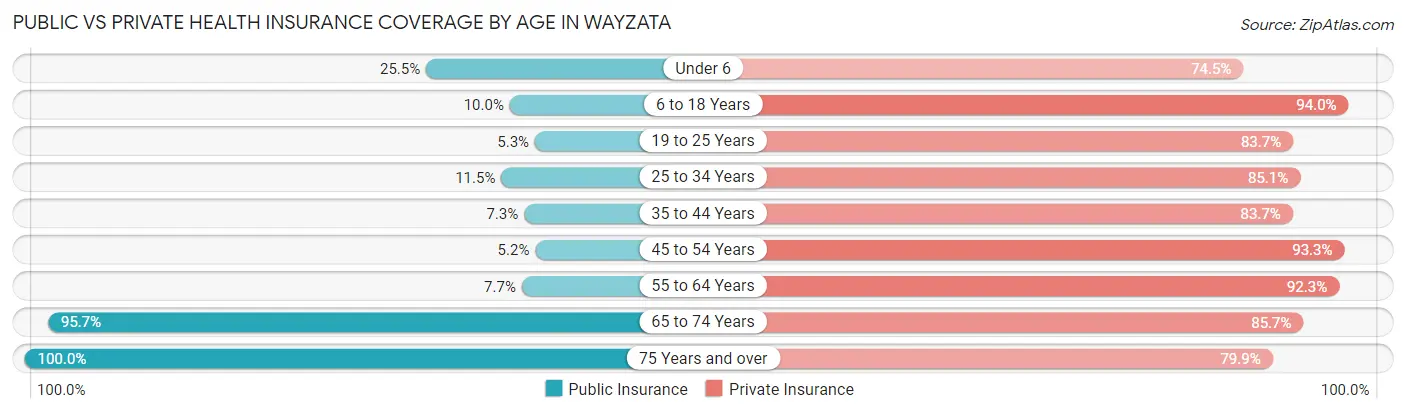
| Age Bracket | Public Insurance | Private Insurance |
| Under 6 | 52 (25.5%) | 152 (74.5%) |
| 6 to 18 Years | 40 (10.0%) | 378 (94.0%) |
| 19 to 25 Years | 13 (5.3%) | 206 (83.7%) |
| 25 to 34 Years | 37 (11.5%) | 273 (85.1%) |
| 35 to 44 Years | 21 (7.3%) | 241 (83.7%) |
| 45 to 54 Years | 31 (5.2%) | 554 (93.3%) |
| 55 to 64 Years | 46 (7.7%) | 550 (92.3%) |
| 65 to 74 Years | 600 (95.7%) | 537 (85.7%) |
| 75 Years and over | 1,087 (100.0%) | 869 (79.9%) |
| Total | 1,927 (44.2%) | 3,760 (86.1%) |
Disability Status by Sex by Age in Wayzata
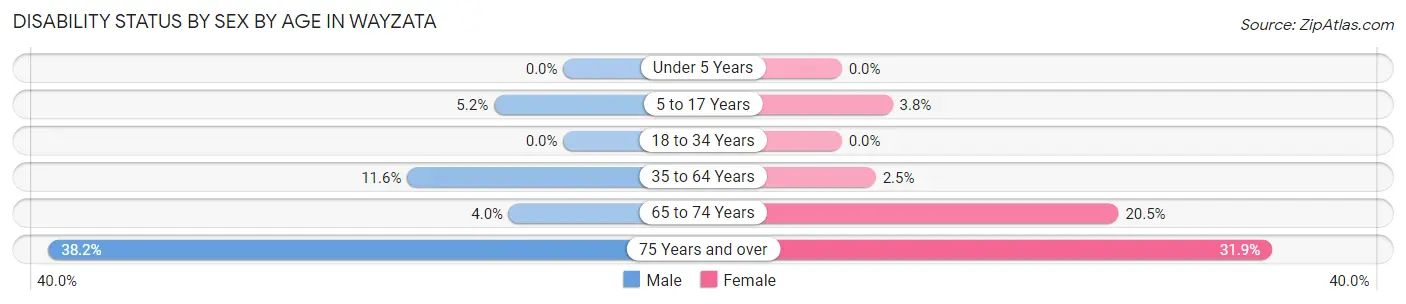
| Age Bracket | Male | Female |
| Under 5 Years | 0 (0.0%) | 0 (0.0%) |
| 5 to 17 Years | 10 (5.1%) | 8 (3.8%) |
| 18 to 34 Years | 0 (0.0%) | 0 (0.0%) |
| 35 to 64 Years | 84 (11.6%) | 19 (2.5%) |
| 65 to 74 Years | 9 (4.0%) | 83 (20.5%) |
| 75 Years and over | 187 (38.2%) | 191 (31.9%) |
Disability Class by Sex by Age in Wayzata
Disability Class: Hearing Difficulty
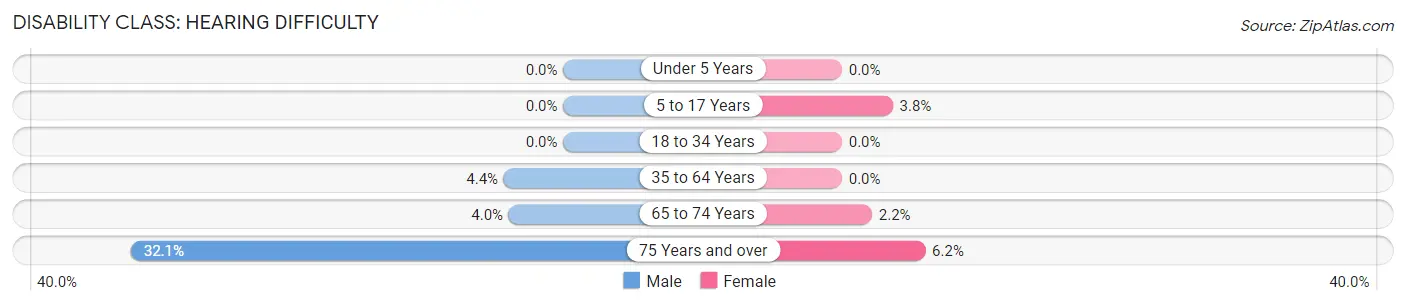
| Age Bracket | Male | Female |
| Under 5 Years | 0 (0.0%) | 0 (0.0%) |
| 5 to 17 Years | 0 (0.0%) | 8 (3.8%) |
| 18 to 34 Years | 0 (0.0%) | 0 (0.0%) |
| 35 to 64 Years | 32 (4.4%) | 0 (0.0%) |
| 65 to 74 Years | 9 (4.0%) | 9 (2.2%) |
| 75 Years and over | 157 (32.1%) | 37 (6.2%) |
Disability Class: Vision Difficulty
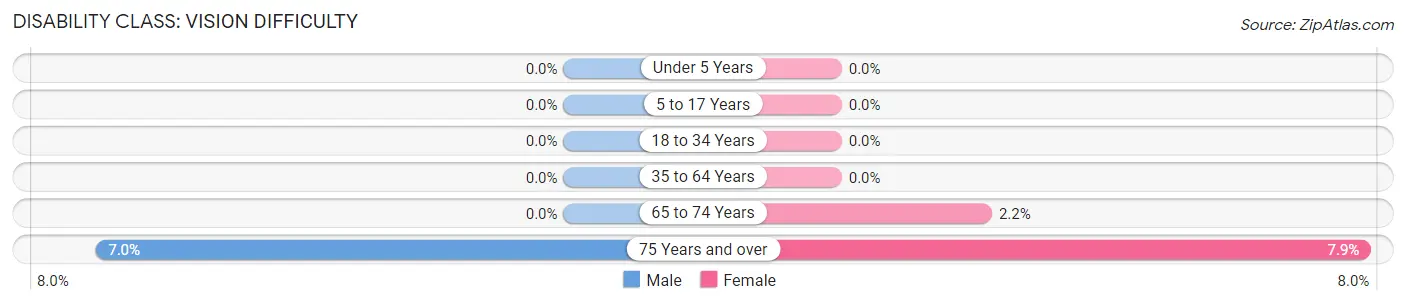
| Age Bracket | Male | Female |
| Under 5 Years | 0 (0.0%) | 0 (0.0%) |
| 5 to 17 Years | 0 (0.0%) | 0 (0.0%) |
| 18 to 34 Years | 0 (0.0%) | 0 (0.0%) |
| 35 to 64 Years | 0 (0.0%) | 0 (0.0%) |
| 65 to 74 Years | 0 (0.0%) | 9 (2.2%) |
| 75 Years and over | 34 (7.0%) | 47 (7.9%) |
Disability Class: Cognitive Difficulty
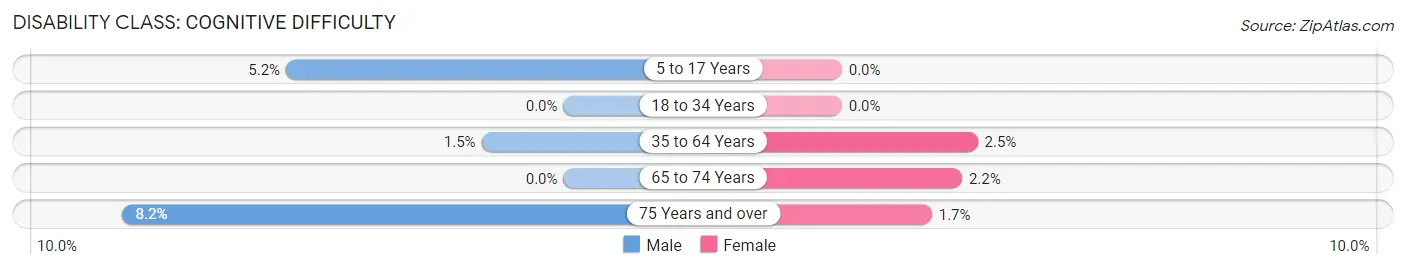
| Age Bracket | Male | Female |
| 5 to 17 Years | 10 (5.1%) | 0 (0.0%) |
| 18 to 34 Years | 0 (0.0%) | 0 (0.0%) |
| 35 to 64 Years | 11 (1.5%) | 19 (2.5%) |
| 65 to 74 Years | 0 (0.0%) | 9 (2.2%) |
| 75 Years and over | 40 (8.2%) | 10 (1.7%) |
Disability Class: Ambulatory Difficulty
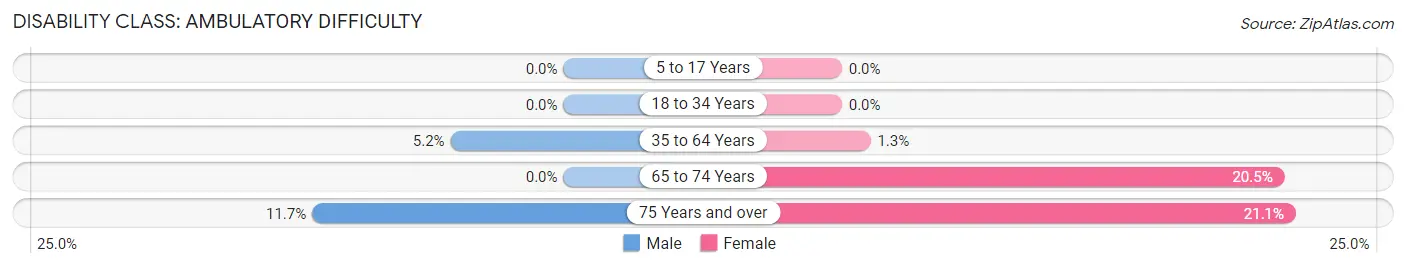
| Age Bracket | Male | Female |
| 5 to 17 Years | 0 (0.0%) | 0 (0.0%) |
| 18 to 34 Years | 0 (0.0%) | 0 (0.0%) |
| 35 to 64 Years | 38 (5.2%) | 10 (1.3%) |
| 65 to 74 Years | 0 (0.0%) | 83 (20.5%) |
| 75 Years and over | 57 (11.7%) | 126 (21.1%) |
Disability Class: Self-Care Difficulty
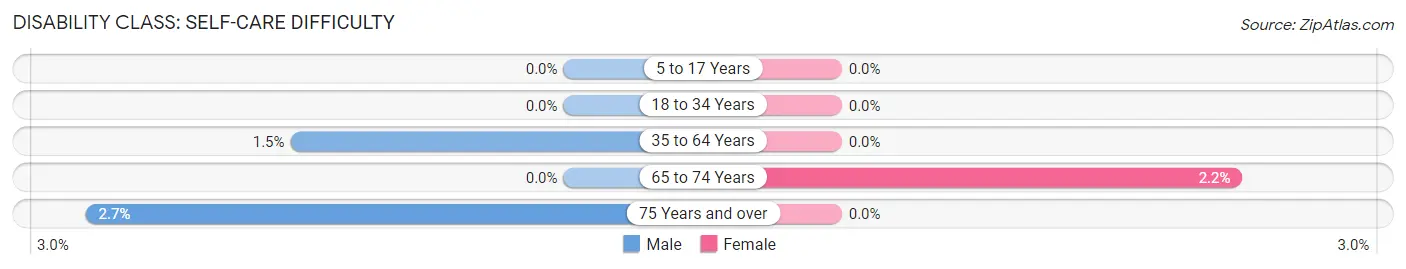
| Age Bracket | Male | Female |
| 5 to 17 Years | 0 (0.0%) | 0 (0.0%) |
| 18 to 34 Years | 0 (0.0%) | 0 (0.0%) |
| 35 to 64 Years | 11 (1.5%) | 0 (0.0%) |
| 65 to 74 Years | 0 (0.0%) | 9 (2.2%) |
| 75 Years and over | 13 (2.7%) | 0 (0.0%) |
Technology Access in Wayzata
Computing Device Access in Wayzata
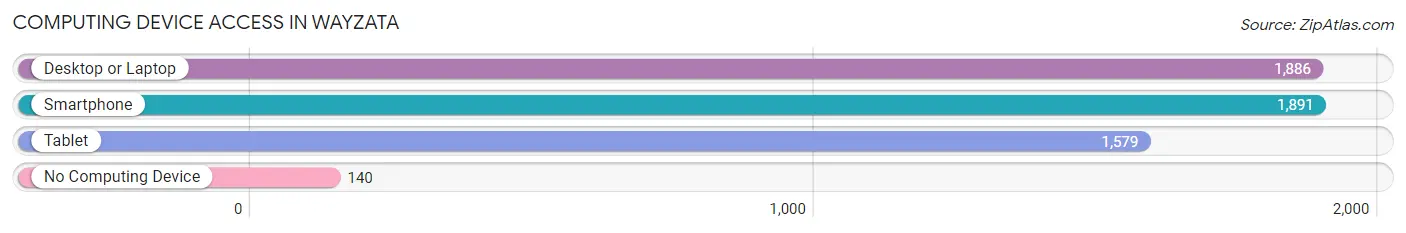
| Device Type | # Households | % Households |
| Desktop or Laptop | 1,886 | 87.0% |
| Smartphone | 1,891 | 87.2% |
| Tablet | 1,579 | 72.8% |
| No Computing Device | 140 | 6.5% |
| Total | 2,169 | 100.0% |
Internet Access in Wayzata
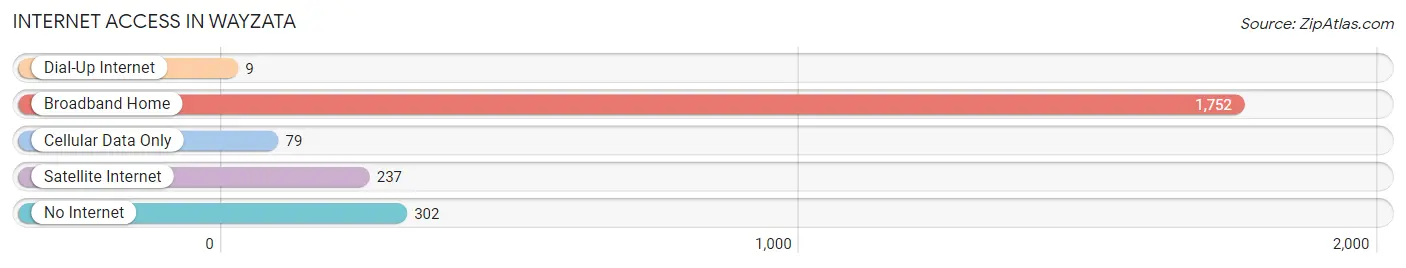
| Internet Type | # Households | % Households |
| Dial-Up Internet | 9 | 0.4% |
| Broadband Home | 1,752 | 80.8% |
| Cellular Data Only | 79 | 3.6% |
| Satellite Internet | 237 | 10.9% |
| No Internet | 302 | 13.9% |
| Total | 2,169 | 100.0% |
Wayzata Summary
Wayzata, Minnesota is a small city located on the western shore of Lake Minnetonka in Hennepin County. It is a suburb of Minneapolis and is part of the Twin Cities metropolitan area. The city has a population of 4,079 as of the 2010 census.
History
Wayzata was first settled in 1854 by a group of settlers from New England. The town was named after the Dakota word for “north shore”. The settlers built a sawmill and a gristmill, and the town quickly grew. By the late 1800s, Wayzata had become a popular summer resort destination for wealthy Minnesotans. The town was incorporated in 1886.
In the early 1900s, Wayzata was a popular destination for wealthy Minnesotans to build summer homes. The town was also home to several resorts, including the Wayzata Beach Hotel, which was built in 1906. The hotel was destroyed by fire in 1925.
In the 1950s, Wayzata began to experience rapid growth as Minneapolis and St. Paul expanded. The city was annexed by the city of Long Lake in 1972, and the two cities merged in 1974.
Geography
Wayzata is located on the western shore of Lake Minnetonka in Hennepin County. The city is bordered by the cities of Long Lake to the north, Minnetonka to the east, and Plymouth to the south. Wayzata is located approximately 15 miles west of Minneapolis and 25 miles northwest of St. Paul.
The city has a total area of 2.2 square miles, all of which is land. The terrain is mostly flat, with some rolling hills. The city is located on the north shore of Lake Minnetonka, which is the largest lake in the Twin Cities metropolitan area.
Economy
Wayzata’s economy is largely based on tourism and retail. The city is home to several upscale shopping centers, including the Wayzata Village Shopping Center and the Wayzata Bay Center. The city is also home to several restaurants, bars, and cafes.
The city is also home to several corporate headquarters, including Cargill, Inc., the largest privately held company in the United States. Other major employers in the city include the Carlson Companies, the Minnesota Vikings, and the Minnesota Twins.
Demographics
As of the 2010 census, the population of Wayzata was 4,079. The racial makeup of the city was 92.3% White, 2.3% African American, 0.2% Native American, 3.2% Asian, 0.1% Pacific Islander, 0.7% from other races, and 1.4% from two or more races. Hispanic or Latino of any race were 2.2% of the population.
The median household income in Wayzata was $107,917 in 2018. The median home value was $521,400 in 2018. The median age of the population was 44.7 years.
Conclusion
Wayzata, Minnesota is a small city located on the western shore of Lake Minnetonka in Hennepin County. It is a suburb of Minneapolis and is part of the Twin Cities metropolitan area. The city has a population of 4,079 as of the 2010 census. Wayzata was first settled in 1854 by a group of settlers from New England, and the town was incorporated in 1886. The city’s economy is largely based on tourism and retail, and it is home to several corporate headquarters. The racial makeup of the city is 92.3% White, 2.3% African American, 0.2% Native American, 3.2% Asian, 0.1% Pacific Islander, 0.7% from other races, and 1.4% from two or more races. The median household income in Wayzata was $107,917 in 2018, and the median home value was $521,400 in 2018.
Common Questions
What is Per Capita Income in Wayzata?
Per Capita income in Wayzata is $114,230.
What is the Median Family Income in Wayzata?
Median Family Income in Wayzata is $194,875.
What is the Median Household income in Wayzata?
Median Household Income in Wayzata is $118,456.
What is Income or Wage Gap in Wayzata?
Income or Wage Gap in Wayzata is 37.5%.
Women in Wayzata earn 62.5 cents for every dollar earned by a man.
What is Inequality or Gini Index in Wayzata?
Inequality or Gini Index in Wayzata is 0.60.
What is the Total Population of Wayzata?
Total Population of Wayzata is 4,365.
What is the Total Male Population of Wayzata?
Total Male Population of Wayzata is 2,066.
What is the Total Female Population of Wayzata?
Total Female Population of Wayzata is 2,299.
What is the Ratio of Males per 100 Females in Wayzata?
There are 89.87 Males per 100 Females in Wayzata.
What is the Ratio of Females per 100 Males in Wayzata?
There are 111.28 Females per 100 Males in Wayzata.
What is the Median Population Age in Wayzata?
Median Population Age in Wayzata is 56.5 Years.
What is the Average Family Size in Wayzata
Average Family Size in Wayzata is 2.6 People.
What is the Average Household Size in Wayzata
Average Household Size in Wayzata is 2.0 People.
How Large is the Labor Force in Wayzata?
There are 1,942 People in the Labor Forcein in Wayzata.
What is the Percentage of People in the Labor Force in Wayzata?
50.0% of People are in the Labor Force in Wayzata.
What is the Unemployment Rate in Wayzata?
Unemployment Rate in Wayzata is 1.3%.