Cities with the Most Immigrants from Kenya in Minnesota
RELATED REPORTS & OPTIONS
Kenya
Minnesota
Compare Cities
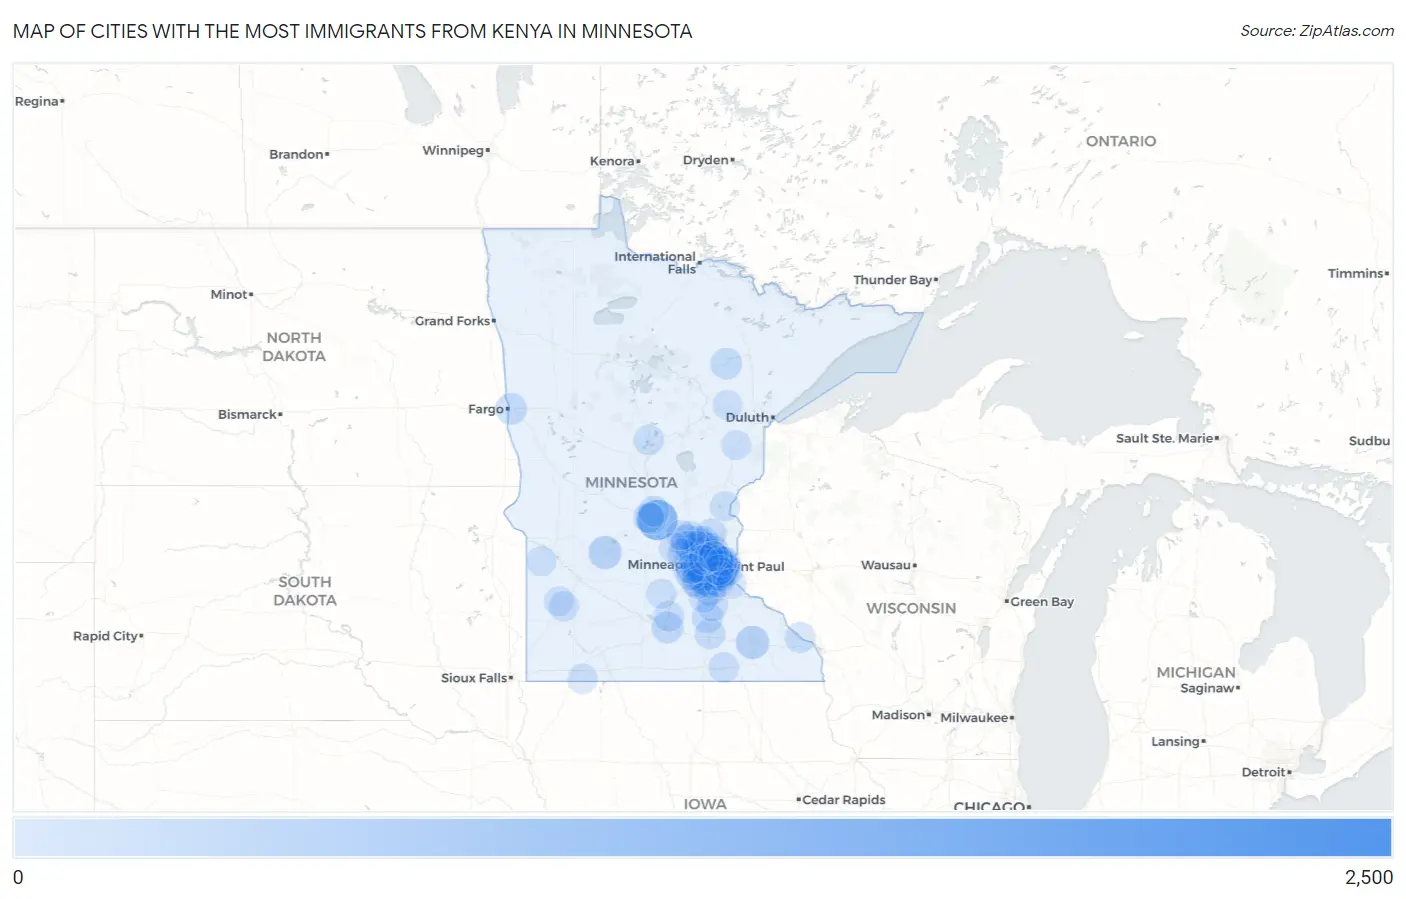
Map of Cities with the Most Immigrants from Kenya in Minnesota
0
2,500
Cities with the Most Immigrants from Kenya in Minnesota
| City | Kenya | vs State | vs National | |
| 1. | Minneapolis | 2,494 | 15,701(15.88%)#1 | 158,590(1.57%)#2 |
| 2. | St Paul | 1,416 | 15,701(9.02%)#2 | 158,590(0.89%)#9 |
| 3. | St Cloud | 1,267 | 15,701(8.07%)#3 | 158,590(0.80%)#14 |
| 4. | Bloomington | 974 | 15,701(6.20%)#4 | 158,590(0.61%)#21 |
| 5. | Plymouth | 470 | 15,701(2.99%)#5 | 158,590(0.30%)#48 |
| 6. | Burnsville | 446 | 15,701(2.84%)#6 | 158,590(0.28%)#53 |
| 7. | Brooklyn Park | 422 | 15,701(2.69%)#7 | 158,590(0.27%)#57 |
| 8. | Rochester | 385 | 15,701(2.45%)#8 | 158,590(0.24%)#66 |
| 9. | Willmar | 372 | 15,701(2.37%)#9 | 158,590(0.23%)#68 |
| 10. | Otsego | 356 | 15,701(2.27%)#10 | 158,590(0.22%)#72 |
| 11. | Lakeville | 327 | 15,701(2.08%)#11 | 158,590(0.21%)#77 |
| 12. | New Hope | 283 | 15,701(1.80%)#12 | 158,590(0.18%)#98 |
| 13. | Eden Prairie | 282 | 15,701(1.80%)#13 | 158,590(0.18%)#99 |
| 14. | Champlin | 262 | 15,701(1.67%)#14 | 158,590(0.17%)#108 |
| 15. | St Anthony City Hennepin And Ramsey Counties | 262 | 15,701(1.67%)#15 | 158,590(0.17%)#109 |
| 16. | Coon Rapids | 260 | 15,701(1.66%)#16 | 158,590(0.16%)#110 |
| 17. | Richfield | 225 | 15,701(1.43%)#17 | 158,590(0.14%)#125 |
| 18. | Maple Grove | 199 | 15,701(1.27%)#18 | 158,590(0.13%)#152 |
| 19. | Anoka | 198 | 15,701(1.26%)#19 | 158,590(0.12%)#154 |
| 20. | Mankato | 192 | 15,701(1.22%)#20 | 158,590(0.12%)#163 |
| 21. | Apple Valley | 186 | 15,701(1.18%)#21 | 158,590(0.12%)#166 |
| 22. | Hibbing | 185 | 15,701(1.18%)#22 | 158,590(0.12%)#167 |
| 23. | Fridley | 173 | 15,701(1.10%)#23 | 158,590(0.11%)#186 |
| 24. | St Louis Park | 166 | 15,701(1.06%)#24 | 158,590(0.10%)#191 |
| 25. | Hopkins | 164 | 15,701(1.04%)#25 | 158,590(0.10%)#194 |
| 26. | Moorhead | 162 | 15,701(1.03%)#26 | 158,590(0.10%)#195 |
| 27. | Oakdale | 160 | 15,701(1.02%)#27 | 158,590(0.10%)#199 |
| 28. | New Brighton | 152 | 15,701(0.97%)#28 | 158,590(0.10%)#212 |
| 29. | Crystal | 150 | 15,701(0.96%)#29 | 158,590(0.09%)#216 |
| 30. | Roseville | 149 | 15,701(0.95%)#30 | 158,590(0.09%)#218 |
| 31. | Blaine | 142 | 15,701(0.90%)#31 | 158,590(0.09%)#232 |
| 32. | Brooklyn Center | 126 | 15,701(0.80%)#32 | 158,590(0.08%)#253 |
| 33. | Faribault | 123 | 15,701(0.78%)#33 | 158,590(0.08%)#261 |
| 34. | Eagan | 119 | 15,701(0.76%)#34 | 158,590(0.08%)#271 |
| 35. | Ramsey | 118 | 15,701(0.75%)#35 | 158,590(0.07%)#274 |
| 36. | Waite Park | 114 | 15,701(0.73%)#36 | 158,590(0.07%)#284 |
| 37. | Spring Park | 109 | 15,701(0.69%)#37 | 158,590(0.07%)#291 |
| 38. | Woodbury | 106 | 15,701(0.68%)#38 | 158,590(0.07%)#297 |
| 39. | Sartell | 106 | 15,701(0.68%)#39 | 158,590(0.07%)#298 |
| 40. | Shakopee | 102 | 15,701(0.65%)#40 | 158,590(0.06%)#304 |
| 41. | St Peter | 89 | 15,701(0.57%)#41 | 158,590(0.06%)#343 |
| 42. | St Michael | 84 | 15,701(0.53%)#42 | 158,590(0.05%)#360 |
| 43. | Minnetonka | 82 | 15,701(0.52%)#43 | 158,590(0.05%)#363 |
| 44. | Owatonna | 82 | 15,701(0.52%)#44 | 158,590(0.05%)#365 |
| 45. | Columbia Heights | 77 | 15,701(0.49%)#45 | 158,590(0.05%)#378 |
| 46. | Winona | 76 | 15,701(0.48%)#46 | 158,590(0.05%)#382 |
| 47. | St Joseph | 76 | 15,701(0.48%)#47 | 158,590(0.05%)#384 |
| 48. | Edina | 69 | 15,701(0.44%)#48 | 158,590(0.04%)#409 |
| 49. | Lexington | 62 | 15,701(0.39%)#49 | 158,590(0.04%)#456 |
| 50. | Mounds View | 58 | 15,701(0.37%)#50 | 158,590(0.04%)#480 |
| 51. | Andover | 56 | 15,701(0.36%)#51 | 158,590(0.04%)#488 |
| 52. | Austin | 55 | 15,701(0.35%)#52 | 158,590(0.03%)#499 |
| 53. | Northfield | 55 | 15,701(0.35%)#53 | 158,590(0.03%)#500 |
| 54. | Rogers | 54 | 15,701(0.34%)#54 | 158,590(0.03%)#509 |
| 55. | East Bethel | 54 | 15,701(0.34%)#55 | 158,590(0.03%)#511 |
| 56. | Maplewood | 53 | 15,701(0.34%)#56 | 158,590(0.03%)#514 |
| 57. | Chanhassen | 53 | 15,701(0.34%)#57 | 158,590(0.03%)#515 |
| 58. | Newport | 48 | 15,701(0.31%)#58 | 158,590(0.03%)#556 |
| 59. | Inver Grove Heights | 42 | 15,701(0.27%)#59 | 158,590(0.03%)#607 |
| 60. | Dayton | 42 | 15,701(0.27%)#60 | 158,590(0.03%)#615 |
| 61. | Marshall | 40 | 15,701(0.25%)#61 | 158,590(0.03%)#640 |
| 62. | Elko New Market | 33 | 15,701(0.21%)#62 | 158,590(0.02%)#724 |
| 63. | Elk River | 32 | 15,701(0.20%)#63 | 158,590(0.02%)#732 |
| 64. | Greenfield | 30 | 15,701(0.19%)#64 | 158,590(0.02%)#758 |
| 65. | Nisswa | 30 | 15,701(0.19%)#65 | 158,590(0.02%)#760 |
| 66. | Little Canada | 29 | 15,701(0.18%)#66 | 158,590(0.02%)#777 |
| 67. | Rosemount | 26 | 15,701(0.17%)#67 | 158,590(0.02%)#834 |
| 68. | Prior Lake | 22 | 15,701(0.14%)#68 | 158,590(0.01%)#898 |
| 69. | North St Paul | 21 | 15,701(0.13%)#69 | 158,590(0.01%)#921 |
| 70. | West St Paul | 20 | 15,701(0.13%)#70 | 158,590(0.01%)#938 |
| 71. | Buffalo | 15 | 15,701(0.10%)#71 | 158,590(0.01%)#1,079 |
| 72. | Big Lake | 13 | 15,701(0.08%)#72 | 158,590(0.01%)#1,140 |
| 73. | Round Lake | 11 | 15,701(0.07%)#73 | 158,590(0.01%)#1,210 |
| 74. | Rush City | 9 | 15,701(0.06%)#74 | 158,590(0.01%)#1,266 |
| 75. | Hilltop | 7 | 15,701(0.04%)#75 | 158,590(0.00%)#1,355 |
| 76. | Hastings | 6 | 15,701(0.04%)#76 | 158,590(0.00%)#1,378 |
| 77. | Robbinsdale | 6 | 15,701(0.04%)#77 | 158,590(0.00%)#1,380 |
| 78. | Arden Hills | 4 | 15,701(0.03%)#78 | 158,590(0.00%)#1,437 |
| 79. | Arlington | 3 | 15,701(0.02%)#79 | 158,590(0.00%)#1,469 |
| 80. | Greenwood | 3 | 15,701(0.02%)#80 | 158,590(0.00%)#1,480 |
| 81. | Ghent | 3 | 15,701(0.02%)#81 | 158,590(0.00%)#1,483 |
| 82. | Floodwood | 2 | 15,701(0.01%)#82 | 158,590(0.00%)#1,507 |
| 83. | Moose Lake | 1 | 15,701(0.01%)#83 | 158,590(0.00%)#1,536 |
| 84. | Madison | 1 | 15,701(0.01%)#84 | 158,590(0.00%)#1,538 |
Common Questions
What are the Top 10 Cities with the Most Immigrants from Kenya in Minnesota?
Top 10 Cities with the Most Immigrants from Kenya in Minnesota are:
#1
2,494
#2
1,416
#3
1,267
#4
974
#5
470
#6
446
#7
422
#8
385
#9
372
#10
356
What city has the Most Immigrants from Kenya in Minnesota?
Minneapolis has the Most Immigrants from Kenya in Minnesota with 2,494.
What is the Total Immigrants from Kenya in the State of Minnesota?
Total Immigrants from Kenya in Minnesota is 15,701.
What is the Total Immigrants from Kenya in the United States?
Total Immigrants from Kenya in the United States is 158,590.