Mound, MN Map & Demographics
Mound Map
Mound Overview
$62,145
PER CAPITA INCOME
$129,146
AVG FAMILY INCOME
$89,855
AVG HOUSEHOLD INCOME
22.2%
WAGE / INCOME GAP [ % ]
77.8¢/ $1
WAGE / INCOME GAP [ $ ]
0.48
INEQUALITY / GINI INDEX
9,272
TOTAL POPULATION
5,022
MALE POPULATION
4,250
FEMALE POPULATION
118.16
MALES / 100 FEMALES
84.63
FEMALES / 100 MALES
44.6
MEDIAN AGE
2.8
AVG FAMILY SIZE
2.1
AVG HOUSEHOLD SIZE
5,334
LABOR FORCE [ PEOPLE ]
69.4%
PERCENT IN LABOR FORCE
3.6%
UNEMPLOYMENT RATE
Mound Zip Codes
Income in Mound
Income Overview in Mound
Per Capita Income in Mound is $62,145, while median incomes of families and households are $129,146 and $89,855 respectively.
| Characteristic | Number | Measure |
| Per Capita Income | 9,272 | $62,145 |
| Median Family Income | 2,436 | $129,146 |
| Mean Family Income | 2,436 | $169,867 |
| Median Household Income | 4,414 | $89,855 |
| Mean Household Income | 4,414 | $129,023 |
| Income Deficit | 2,436 | $0 |
| Wage / Income Gap (%) | 9,272 | 22.22% |
| Wage / Income Gap ($) | 9,272 | 77.78¢ per $1 |
| Gini / Inequality Index | 9,272 | 0.48 |
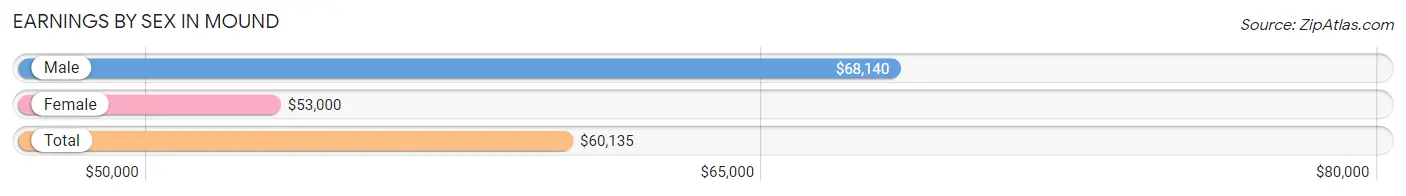
Earnings by Sex in Mound
Average Earnings in Mound are $60,135, $68,140 for men and $53,000 for women, a difference of 22.2%.
| Sex | Number | Average Earnings |
| Male | 3,317 (60.5%) | $68,140 |
| Female | 2,162 (39.5%) | $53,000 |
| Total | 5,479 (100.0%) | $60,135 |
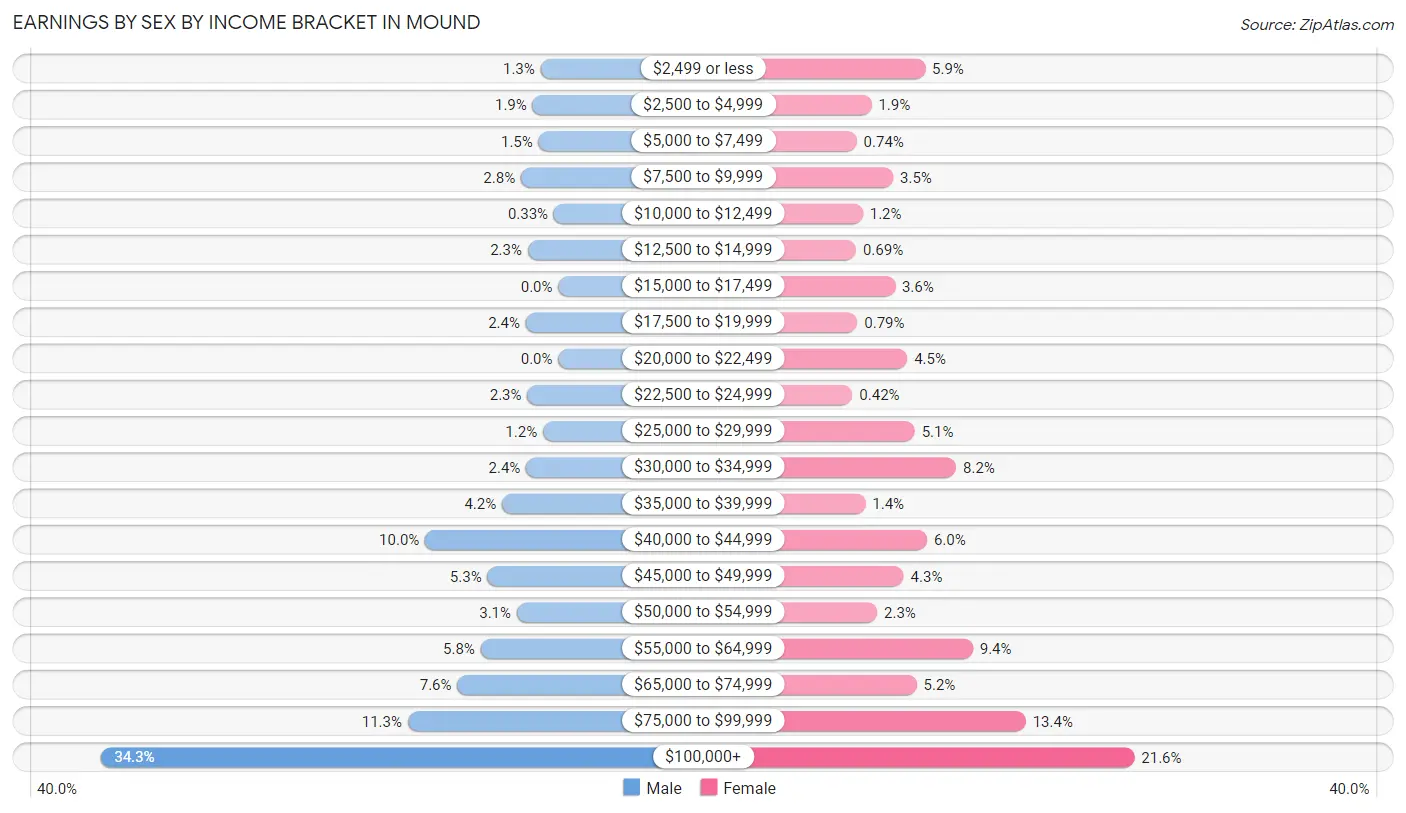
Earnings by Sex by Income Bracket in Mound
The most common earnings brackets in Mound are $100,000+ for men (1,136 | 34.3%) and $100,000+ for women (466 | 21.5%).
| Income | Male | Female |
| $2,499 or less | 44 (1.3%) | 127 (5.9%) |
| $2,500 to $4,999 | 64 (1.9%) | 40 (1.8%) |
| $5,000 to $7,499 | 49 (1.5%) | 16 (0.7%) |
| $7,500 to $9,999 | 93 (2.8%) | 75 (3.5%) |
| $10,000 to $12,499 | 11 (0.3%) | 26 (1.2%) |
| $12,500 to $14,999 | 76 (2.3%) | 15 (0.7%) |
| $15,000 to $17,499 | 0 (0.0%) | 78 (3.6%) |
| $17,500 to $19,999 | 81 (2.4%) | 17 (0.8%) |
| $20,000 to $22,499 | 0 (0.0%) | 98 (4.5%) |
| $22,500 to $24,999 | 77 (2.3%) | 9 (0.4%) |
| $25,000 to $29,999 | 38 (1.1%) | 110 (5.1%) |
| $30,000 to $34,999 | 80 (2.4%) | 177 (8.2%) |
| $35,000 to $39,999 | 140 (4.2%) | 30 (1.4%) |
| $40,000 to $44,999 | 331 (10.0%) | 130 (6.0%) |
| $45,000 to $49,999 | 176 (5.3%) | 92 (4.3%) |
| $50,000 to $54,999 | 103 (3.1%) | 49 (2.3%) |
| $55,000 to $64,999 | 193 (5.8%) | 204 (9.4%) |
| $65,000 to $74,999 | 251 (7.6%) | 113 (5.2%) |
| $75,000 to $99,999 | 374 (11.3%) | 290 (13.4%) |
| $100,000+ | 1,136 (34.3%) | 466 (21.5%) |
| Total | 3,317 (100.0%) | 2,162 (100.0%) |
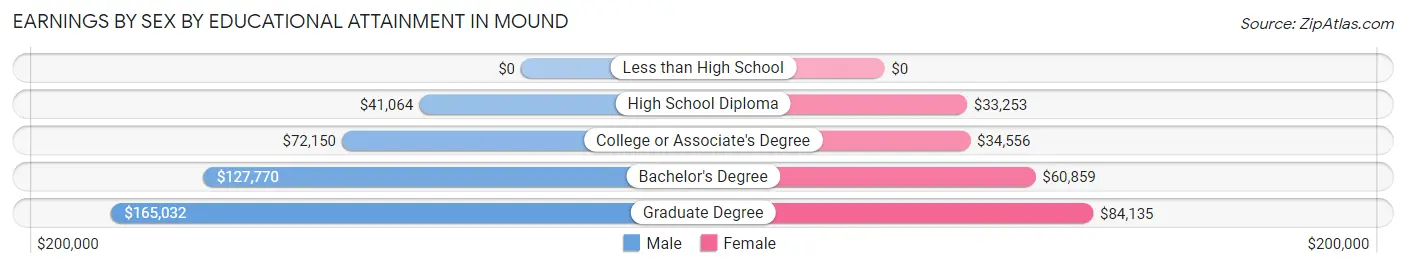
Earnings by Sex by Educational Attainment in Mound
Average earnings in Mound are $79,623 for men and $57,531 for women, a difference of 27.8%. Men with an educational attainment of graduate degree enjoy the highest average annual earnings of $165,032, while those with high school diploma education earn the least with $41,064. Women with an educational attainment of graduate degree earn the most with the average annual earnings of $84,135, while those with high school diploma education have the smallest earnings of $33,253.
| Educational Attainment | Male Income | Female Income |
| Less than High School | - | - |
| High School Diploma | $41,064 | $33,253 |
| College or Associate's Degree | $72,150 | $34,556 |
| Bachelor's Degree | $127,770 | $60,859 |
| Graduate Degree | $165,032 | $84,135 |
| Total | $79,623 | $57,531 |
Family Income in Mound
Family Income Brackets in Mound
According to the Mound family income data, there are 670 families falling into the $200,000+ income range, which is the most common income bracket and makes up 27.5% of all families. Conversely, the less than $10,000 income bracket is the least frequent group with only 12 families (0.5%) belonging to this category.
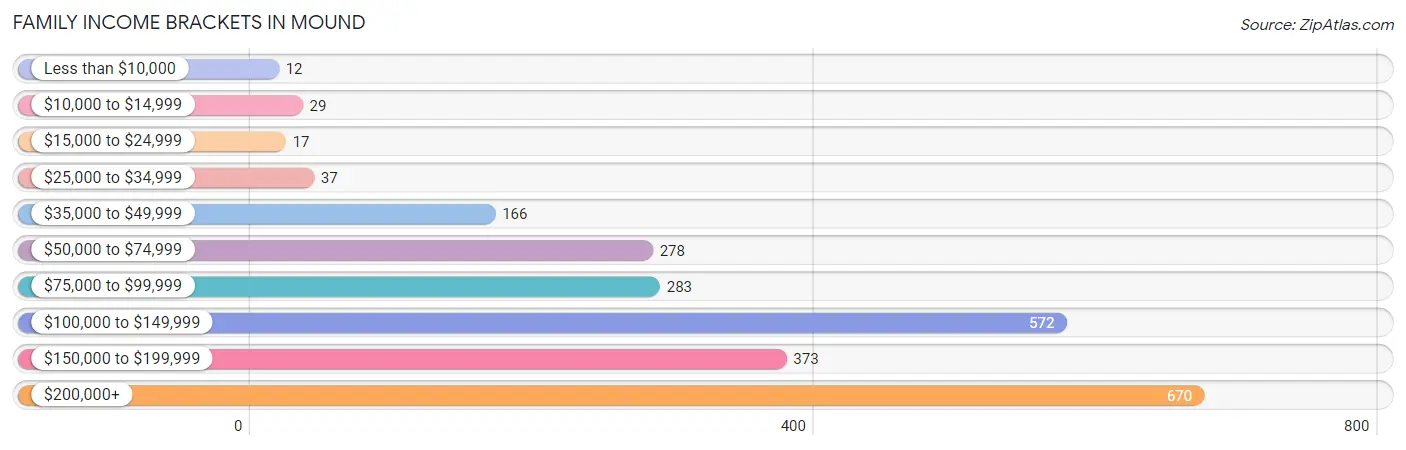
| Income Bracket | # Families | % Families |
| Less than $10,000 | 12 | 0.5% |
| $10,000 to $14,999 | 29 | 1.2% |
| $15,000 to $24,999 | 17 | 0.7% |
| $25,000 to $34,999 | 37 | 1.5% |
| $35,000 to $49,999 | 166 | 6.8% |
| $50,000 to $74,999 | 278 | 11.4% |
| $75,000 to $99,999 | 283 | 11.6% |
| $100,000 to $149,999 | 572 | 23.5% |
| $150,000 to $199,999 | 373 | 15.3% |
| $200,000+ | 670 | 27.5% |
Family Income by Famaliy Size in Mound
4-person families (373 | 15.3%) account for the highest median family income in Mound with $175,150 per family, while 2-person families (1,414 | 58.1%) have the highest median income of $60,375 per family member.
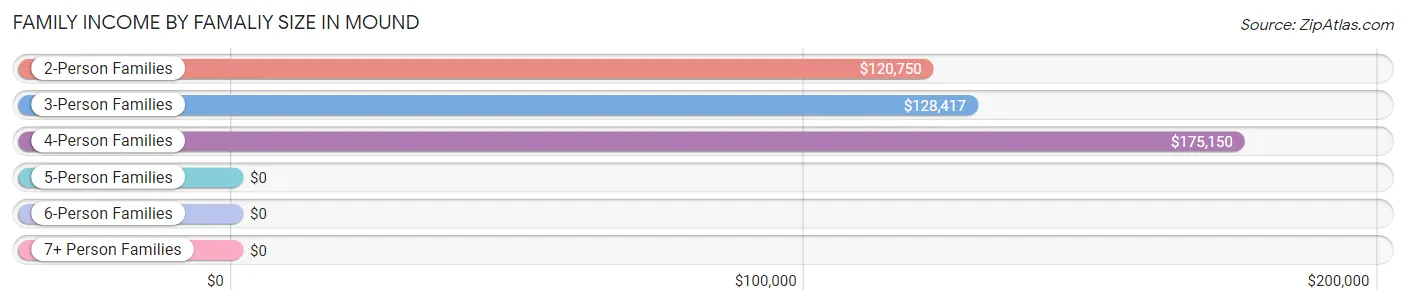
| Income Bracket | # Families | Median Income |
| 2-Person Families | 1,414 (58.1%) | $120,750 |
| 3-Person Families | 498 (20.4%) | $128,417 |
| 4-Person Families | 373 (15.3%) | $175,150 |
| 5-Person Families | 88 (3.6%) | $0 |
| 6-Person Families | 38 (1.6%) | $0 |
| 7+ Person Families | 25 (1.0%) | $0 |
| Total | 2,436 (100.0%) | $129,146 |
Family Income by Number of Earners in Mound
The median family income in Mound is $129,146, with families comprising 3+ earners (186) having the highest median family income of $220,093, while families with no earners (288) have the lowest median family income of $59,079, accounting for 7.6% and 11.8% of families, respectively.
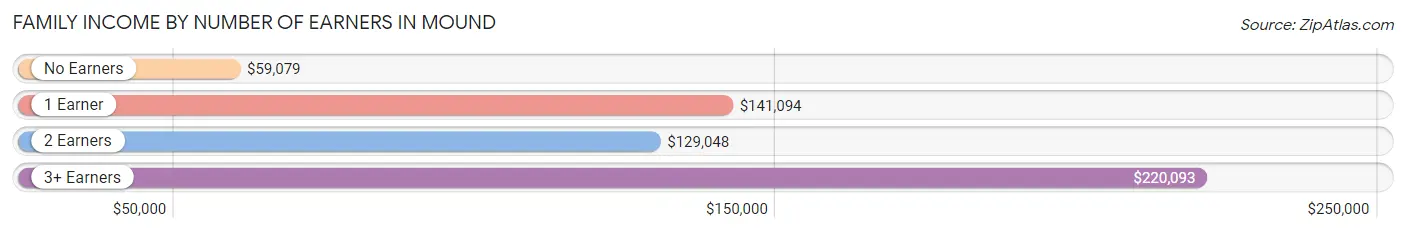
| Number of Earners | # Families | Median Income |
| No Earners | 288 (11.8%) | $59,079 |
| 1 Earner | 554 (22.7%) | $141,094 |
| 2 Earners | 1,408 (57.8%) | $129,048 |
| 3+ Earners | 186 (7.6%) | $220,093 |
| Total | 2,436 (100.0%) | $129,146 |
Household Income in Mound
Household Income Brackets in Mound
With 768 households falling in the category, the $100,000 to $149,999 income range is the most frequent in Mound, accounting for 17.4% of all households. In contrast, only 93 households (2.1%) fall into the less than $10,000 income bracket, making it the least populous group.
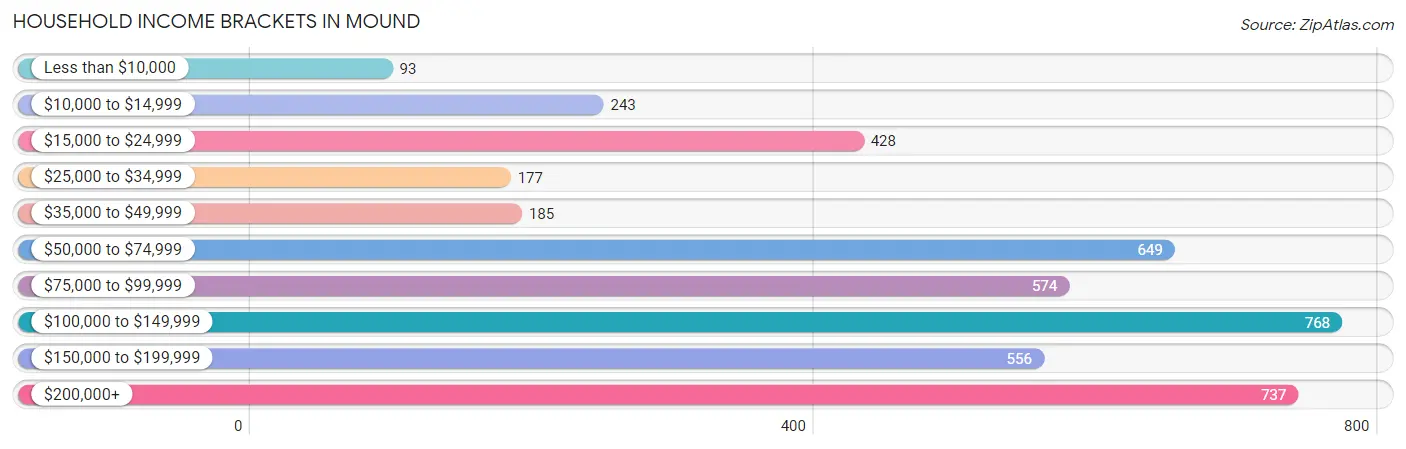
| Income Bracket | # Households | % Households |
| Less than $10,000 | 93 | 2.1% |
| $10,000 to $14,999 | 243 | 5.5% |
| $15,000 to $24,999 | 428 | 9.7% |
| $25,000 to $34,999 | 177 | 4.0% |
| $35,000 to $49,999 | 185 | 4.2% |
| $50,000 to $74,999 | 649 | 14.7% |
| $75,000 to $99,999 | 574 | 13.0% |
| $100,000 to $149,999 | 768 | 17.4% |
| $150,000 to $199,999 | 556 | 12.6% |
| $200,000+ | 737 | 16.7% |
Household Income by Householder Age in Mound
The median household income in Mound is $89,855, with the highest median household income of $136,371 found in the 45 to 64 years age bracket for the primary householder. A total of 1,788 households (40.5%) fall into this category. Meanwhile, the 15 to 24 years age bracket for the primary householder has the lowest median household income of $0, with 108 households (2.5%) in this group.
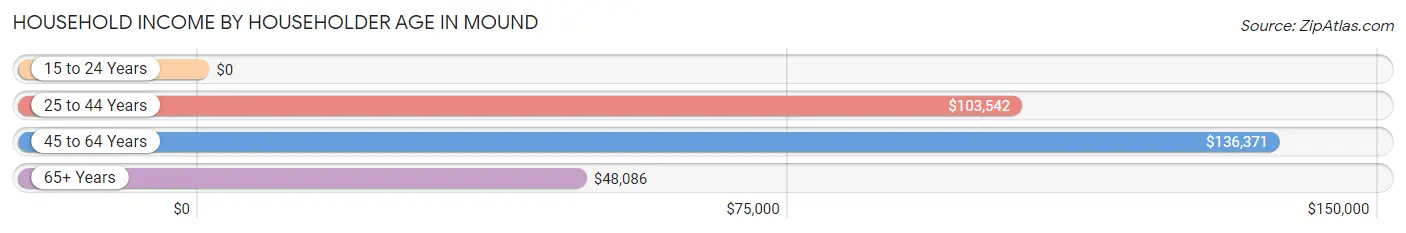
| Income Bracket | # Households | Median Income |
| 15 to 24 Years | 108 (2.5%) | $0 |
| 25 to 44 Years | 1,217 (27.6%) | $103,542 |
| 45 to 64 Years | 1,788 (40.5%) | $136,371 |
| 65+ Years | 1,301 (29.5%) | $48,086 |
| Total | 4,414 (100.0%) | $89,855 |
Poverty in Mound
Income Below Poverty by Sex and Age in Mound
With 6.7% poverty level for males and 8.8% for females among the residents of Mound, 12 to 14 year old males and 18 to 24 year old females are the most vulnerable to poverty, with 40 males (31.2%) and 67 females (59.3%) in their respective age groups living below the poverty level.
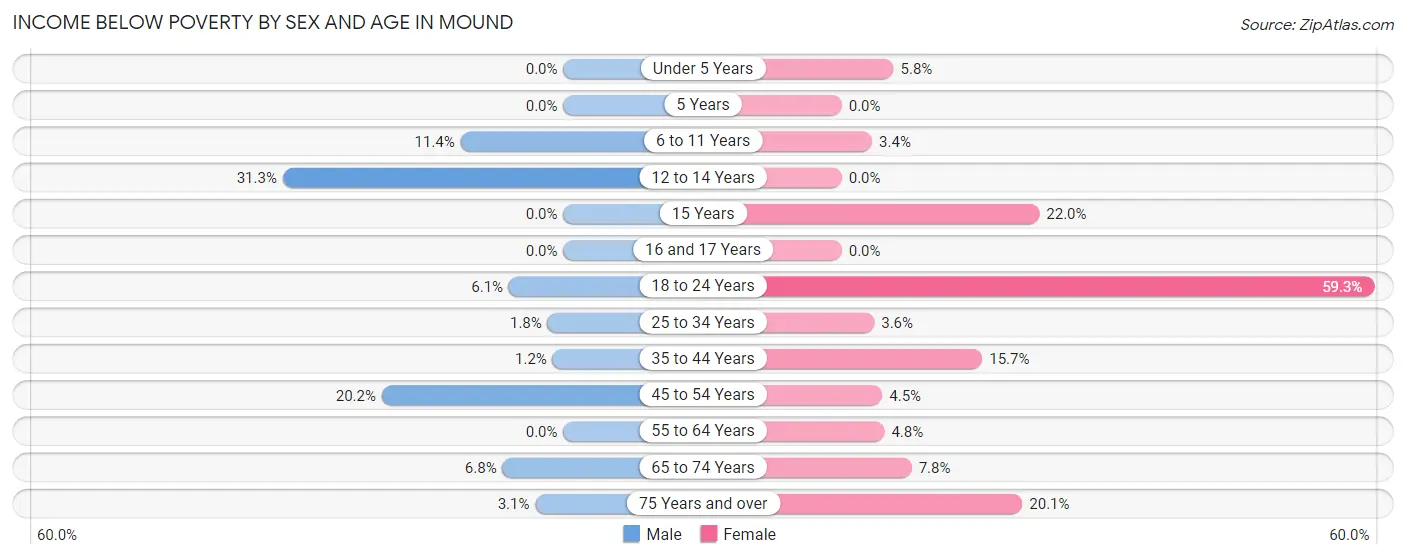
| Age Bracket | Male | Female |
| Under 5 Years | 0 (0.0%) | 12 (5.8%) |
| 5 Years | 0 (0.0%) | 0 (0.0%) |
| 6 to 11 Years | 39 (11.4%) | 11 (3.4%) |
| 12 to 14 Years | 40 (31.2%) | 0 (0.0%) |
| 15 Years | 0 (0.0%) | 11 (22.0%) |
| 16 and 17 Years | 0 (0.0%) | 0 (0.0%) |
| 18 to 24 Years | 30 (6.1%) | 67 (59.3%) |
| 25 to 34 Years | 7 (1.8%) | 16 (3.6%) |
| 35 to 44 Years | 10 (1.2%) | 98 (15.7%) |
| 45 to 54 Years | 167 (20.2%) | 25 (4.5%) |
| 55 to 64 Years | 0 (0.0%) | 32 (4.8%) |
| 65 to 74 Years | 36 (6.8%) | 63 (7.8%) |
| 75 Years and over | 7 (3.1%) | 36 (20.1%) |
| Total | 336 (6.7%) | 371 (8.8%) |
Income Above Poverty by Sex and Age in Mound
According to the poverty statistics in Mound, males aged under 5 years and females aged 5 years are the age groups that are most secure financially, with 100.0% of males and 100.0% of females in these age groups living above the poverty line.
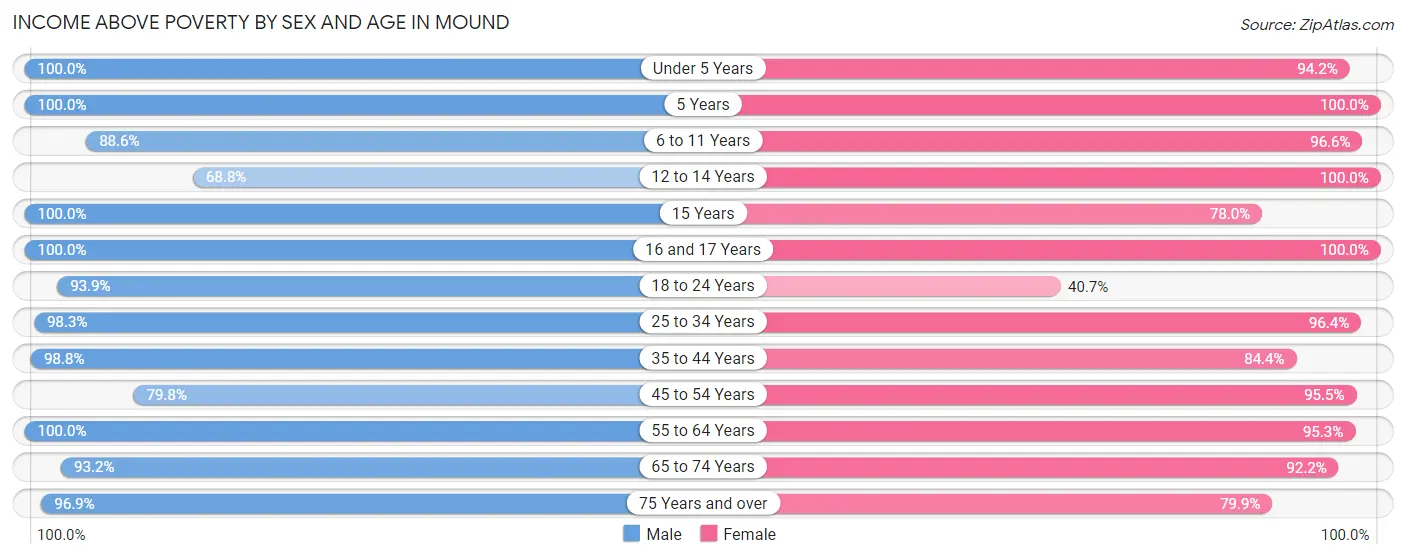
| Age Bracket | Male | Female |
| Under 5 Years | 245 (100.0%) | 196 (94.2%) |
| 5 Years | 43 (100.0%) | 12 (100.0%) |
| 6 to 11 Years | 302 (88.6%) | 314 (96.6%) |
| 12 to 14 Years | 88 (68.8%) | 133 (100.0%) |
| 15 Years | 88 (100.0%) | 39 (78.0%) |
| 16 and 17 Years | 74 (100.0%) | 114 (100.0%) |
| 18 to 24 Years | 465 (93.9%) | 46 (40.7%) |
| 25 to 34 Years | 392 (98.3%) | 426 (96.4%) |
| 35 to 44 Years | 830 (98.8%) | 528 (84.4%) |
| 45 to 54 Years | 659 (79.8%) | 528 (95.5%) |
| 55 to 64 Years | 788 (100.0%) | 641 (95.3%) |
| 65 to 74 Years | 495 (93.2%) | 746 (92.2%) |
| 75 Years and over | 217 (96.9%) | 143 (79.9%) |
| Total | 4,686 (93.3%) | 3,866 (91.2%) |
Income Below Poverty Among Married-Couple Families in Mound
The poverty statistics for married-couple families in Mound show that 1.1% or 23 of the total 2,017 families live below the poverty line. Families with 3 or 4 children have the highest poverty rate of 8.8%, comprising of 10 families. On the other hand, families with no children have the lowest poverty rate of 0.0%, which includes 0 families.
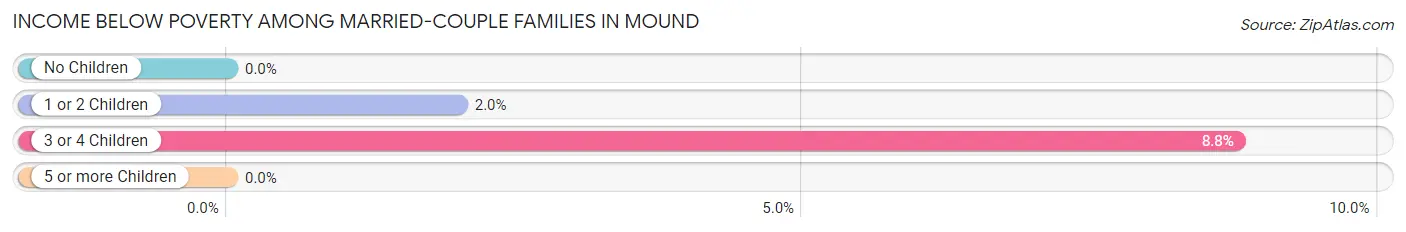
| Children | Above Poverty | Below Poverty |
| No Children | 1,242 (100.0%) | 0 (0.0%) |
| 1 or 2 Children | 637 (98.0%) | 13 (2.0%) |
| 3 or 4 Children | 104 (91.2%) | 10 (8.8%) |
| 5 or more Children | 11 (100.0%) | 0 (0.0%) |
| Total | 1,994 (98.9%) | 23 (1.1%) |
Income Below Poverty Among Single-Parent Households in Mound
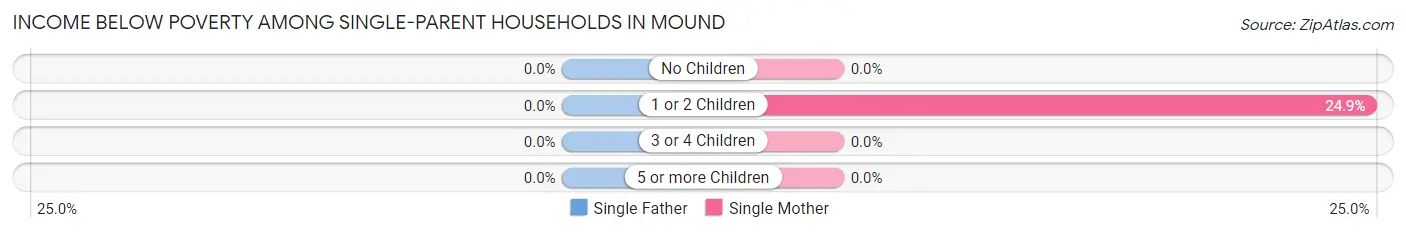
| Children | Single Father | Single Mother |
| No Children | 0 (0.0%) | 0 (0.0%) |
| 1 or 2 Children | 0 (0.0%) | 42 (24.8%) |
| 3 or 4 Children | 0 (0.0%) | 0 (0.0%) |
| 5 or more Children | 0 (0.0%) | 0 (0.0%) |
| Total | 0 (0.0%) | 42 (15.6%) |
Income Below Poverty Among Married-Couple vs Single-Parent Households in Mound
The poverty data for Mound shows that 23 of the married-couple family households (1.1%) and 42 of the single-parent households (10.0%) are living below the poverty level. Within the married-couple family households, those with 3 or 4 children have the highest poverty rate, with 10 households (8.8%) falling below the poverty line. Among the single-parent households, those with 1 or 2 children have the highest poverty rate, with 42 household (16.4%) living below poverty.
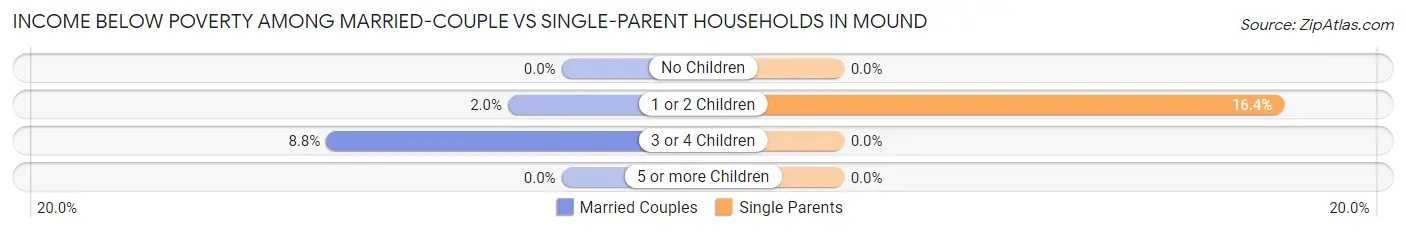
| Children | Married-Couple Families | Single-Parent Households |
| No Children | 0 (0.0%) | 0 (0.0%) |
| 1 or 2 Children | 13 (2.0%) | 42 (16.4%) |
| 3 or 4 Children | 10 (8.8%) | 0 (0.0%) |
| 5 or more Children | 0 (0.0%) | 0 (0.0%) |
| Total | 23 (1.1%) | 42 (10.0%) |
Race in Mound
The most populous races in Mound are White / Caucasian (8,334 | 89.9%), Two or more Races (410 | 4.4%), and Hispanic or Latino (294 | 3.2%).
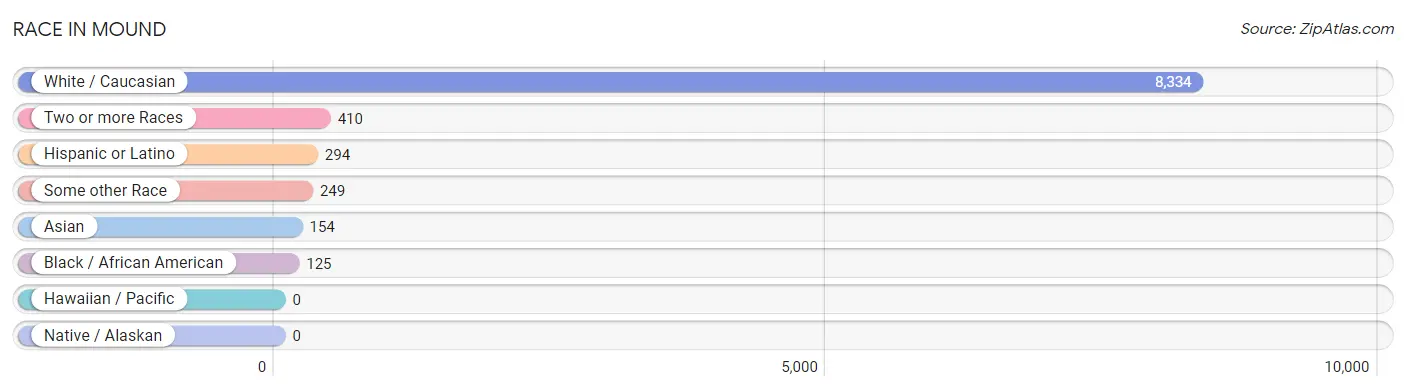
| Race | # Population | % Population |
| Asian | 154 | 1.7% |
| Black / African American | 125 | 1.3% |
| Hawaiian / Pacific | 0 | 0.0% |
| Hispanic or Latino | 294 | 3.2% |
| Native / Alaskan | 0 | 0.0% |
| White / Caucasian | 8,334 | 89.9% |
| Two or more Races | 410 | 4.4% |
| Some other Race | 249 | 2.7% |
| Total | 9,272 | 100.0% |
Ancestry in Mound
The most populous ancestries reported in Mound are German (2,814 | 30.3%), Norwegian (1,792 | 19.3%), Irish (1,099 | 11.8%), Swedish (893 | 9.6%), and English (667 | 7.2%), together accounting for 78.3% of all Mound residents.
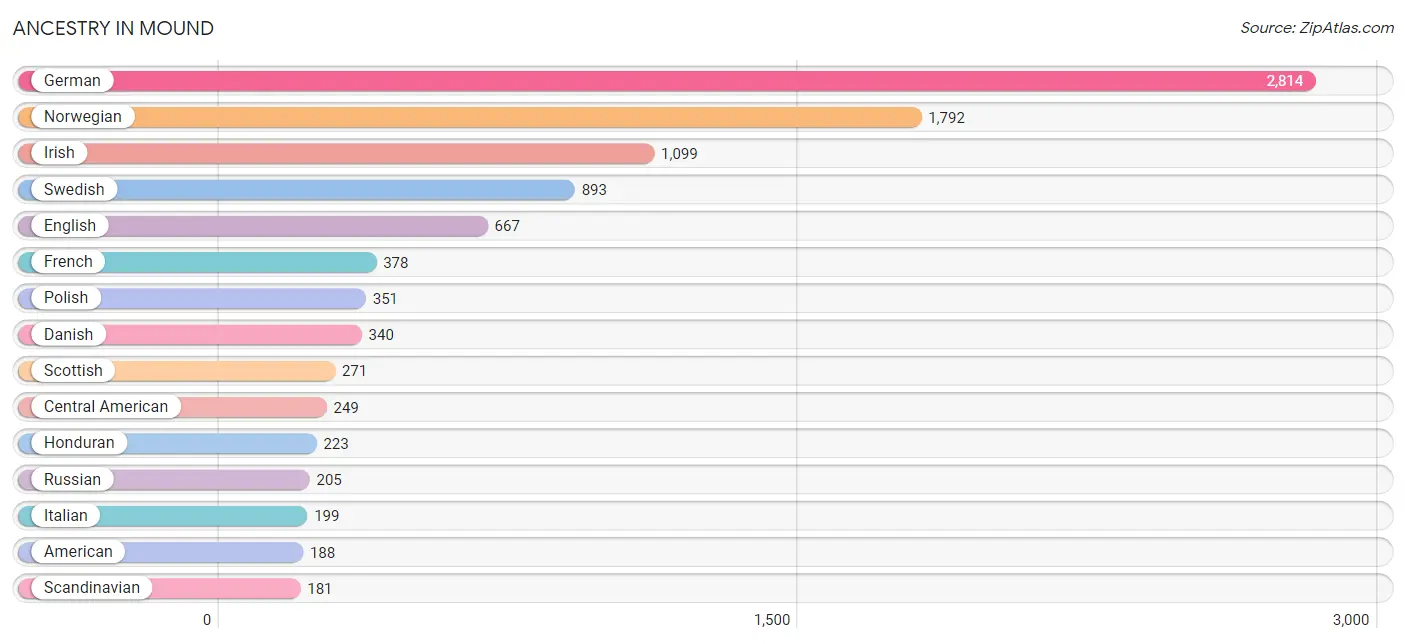
| Ancestry | # Population | % Population |
| American | 188 | 2.0% |
| Arab | 137 | 1.5% |
| Arapaho | 28 | 0.3% |
| Austrian | 23 | 0.3% |
| Belgian | 16 | 0.2% |
| British | 32 | 0.4% |
| Burmese | 63 | 0.7% |
| Canadian | 71 | 0.8% |
| Central American | 249 | 2.7% |
| Cherokee | 69 | 0.7% |
| Chippewa | 101 | 1.1% |
| Czech | 167 | 1.8% |
| Czechoslovakian | 10 | 0.1% |
| Danish | 340 | 3.7% |
| Dutch | 74 | 0.8% |
| English | 667 | 7.2% |
| European | 171 | 1.8% |
| Finnish | 69 | 0.7% |
| French | 378 | 4.1% |
| French Canadian | 104 | 1.1% |
| German | 2,814 | 30.3% |
| Honduran | 223 | 2.4% |
| Hungarian | 64 | 0.7% |
| Icelander | 19 | 0.2% |
| Indian (Asian) | 121 | 1.3% |
| Iranian | 16 | 0.2% |
| Irish | 1,099 | 11.8% |
| Italian | 199 | 2.1% |
| Korean | 16 | 0.2% |
| Lebanese | 137 | 1.5% |
| Lithuanian | 64 | 0.7% |
| Luxembourger | 30 | 0.3% |
| Nicaraguan | 26 | 0.3% |
| Norwegian | 1,792 | 19.3% |
| Polish | 351 | 3.8% |
| Portuguese | 20 | 0.2% |
| Romanian | 11 | 0.1% |
| Russian | 205 | 2.2% |
| Scandinavian | 181 | 1.9% |
| Scotch-Irish | 116 | 1.3% |
| Scottish | 271 | 2.9% |
| Serbian | 18 | 0.2% |
| Sri Lankan | 22 | 0.2% |
| Swedish | 893 | 9.6% |
| Swiss | 43 | 0.5% |
| Thai | 48 | 0.5% |
| Ukrainian | 139 | 1.5% |
| Welsh | 21 | 0.2% | View All 48 Rows |
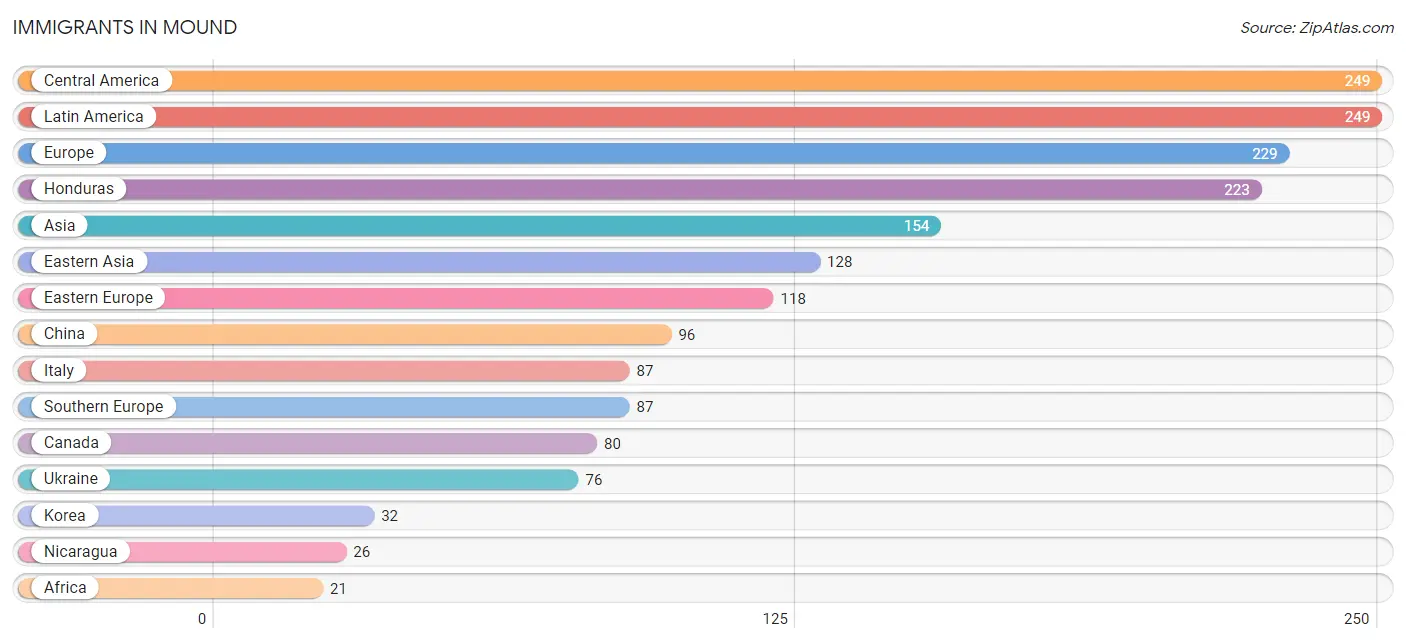
Immigrants in Mound
The most numerous immigrant groups reported in Mound came from Central America (249 | 2.7%), Latin America (249 | 2.7%), Europe (229 | 2.5%), Honduras (223 | 2.4%), and Asia (154 | 1.7%), together accounting for 11.9% of all Mound residents.
| Immigration Origin | # Population | % Population |
| Africa | 21 | 0.2% |
| Asia | 154 | 1.7% |
| Canada | 80 | 0.9% |
| Central America | 249 | 2.7% |
| China | 96 | 1.0% |
| Eastern Asia | 128 | 1.4% |
| Eastern Europe | 118 | 1.3% |
| England | 12 | 0.1% |
| Europe | 229 | 2.5% |
| France | 12 | 0.1% |
| Honduras | 223 | 2.4% |
| Hungary | 21 | 0.2% |
| India | 10 | 0.1% |
| Italy | 87 | 0.9% |
| Korea | 32 | 0.4% |
| Latin America | 249 | 2.7% |
| Nicaragua | 26 | 0.3% |
| Northern Africa | 21 | 0.2% |
| Northern Europe | 12 | 0.1% |
| Philippines | 16 | 0.2% |
| Russia | 21 | 0.2% |
| South Central Asia | 10 | 0.1% |
| South Eastern Asia | 16 | 0.2% |
| Southern Europe | 87 | 0.9% |
| Ukraine | 76 | 0.8% |
| Western Europe | 12 | 0.1% | View All 26 Rows |
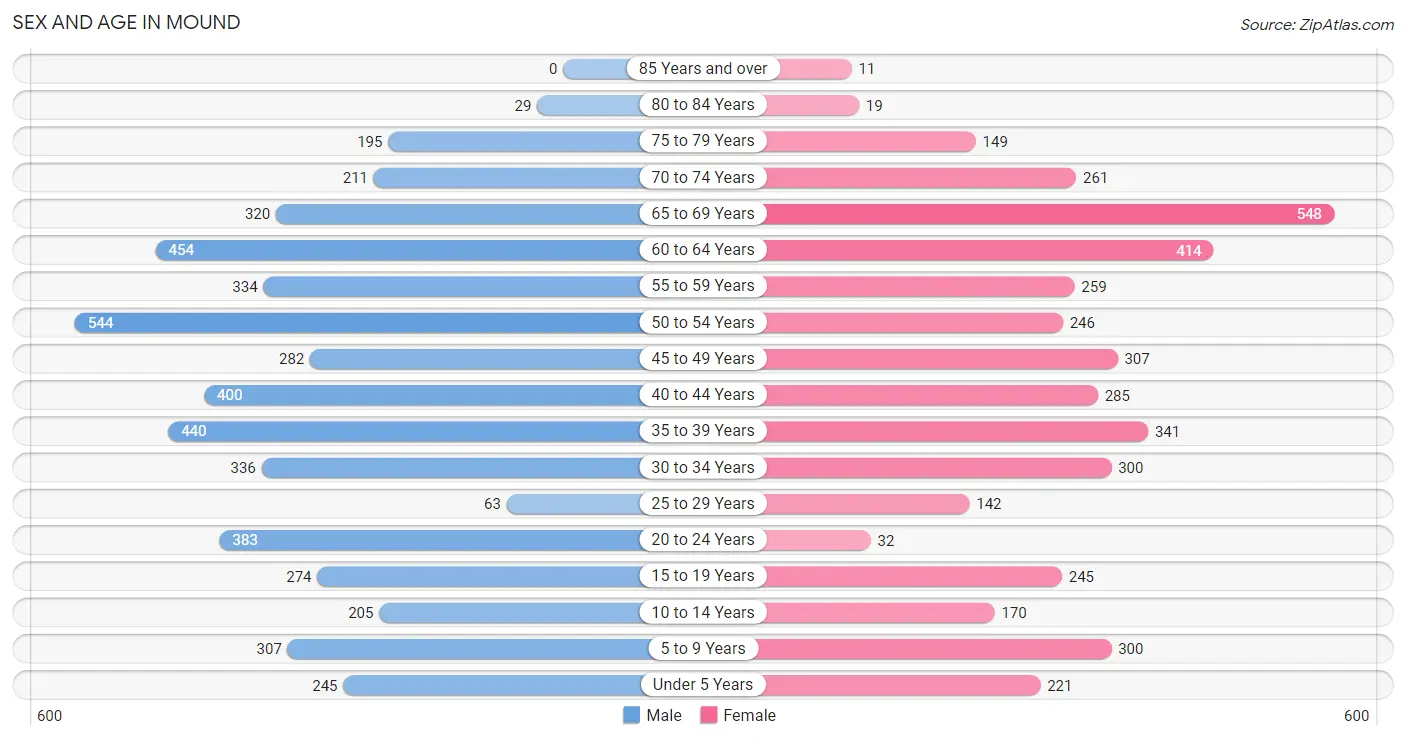
Sex and Age in Mound
Sex and Age in Mound
The most populous age groups in Mound are 50 to 54 Years (544 | 10.8%) for men and 65 to 69 Years (548 | 12.9%) for women.
| Age Bracket | Male | Female |
| Under 5 Years | 245 (4.9%) | 221 (5.2%) |
| 5 to 9 Years | 307 (6.1%) | 300 (7.1%) |
| 10 to 14 Years | 205 (4.1%) | 170 (4.0%) |
| 15 to 19 Years | 274 (5.5%) | 245 (5.8%) |
| 20 to 24 Years | 383 (7.6%) | 32 (0.7%) |
| 25 to 29 Years | 63 (1.3%) | 142 (3.3%) |
| 30 to 34 Years | 336 (6.7%) | 300 (7.1%) |
| 35 to 39 Years | 440 (8.8%) | 341 (8.0%) |
| 40 to 44 Years | 400 (8.0%) | 285 (6.7%) |
| 45 to 49 Years | 282 (5.6%) | 307 (7.2%) |
| 50 to 54 Years | 544 (10.8%) | 246 (5.8%) |
| 55 to 59 Years | 334 (6.7%) | 259 (6.1%) |
| 60 to 64 Years | 454 (9.0%) | 414 (9.7%) |
| 65 to 69 Years | 320 (6.4%) | 548 (12.9%) |
| 70 to 74 Years | 211 (4.2%) | 261 (6.1%) |
| 75 to 79 Years | 195 (3.9%) | 149 (3.5%) |
| 80 to 84 Years | 29 (0.6%) | 19 (0.4%) |
| 85 Years and over | 0 (0.0%) | 11 (0.3%) |
| Total | 5,022 (100.0%) | 4,250 (100.0%) |
Families and Households in Mound
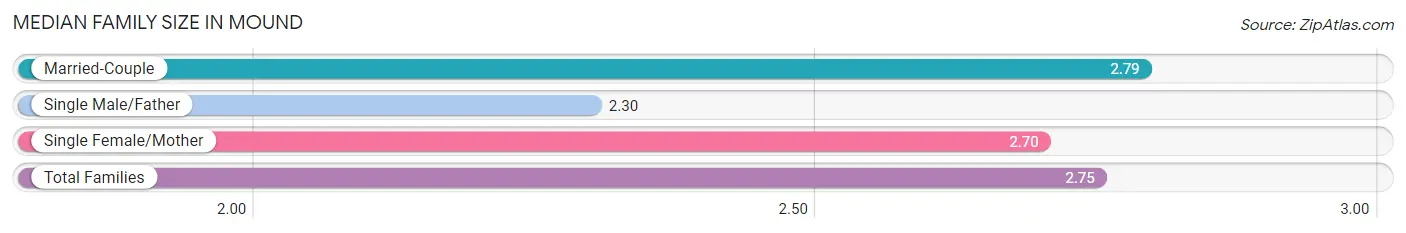
Median Family Size in Mound
The median family size in Mound is 2.75 persons per family, with married-couple families (2,017 | 82.8%) accounting for the largest median family size of 2.79 persons per family. On the other hand, single male/father families (149 | 6.1%) represent the smallest median family size with 2.30 persons per family.
| Family Type | # Families | Family Size |
| Married-Couple | 2,017 (82.8%) | 2.79 |
| Single Male/Father | 149 (6.1%) | 2.30 |
| Single Female/Mother | 270 (11.1%) | 2.70 |
| Total Families | 2,436 (100.0%) | 2.75 |
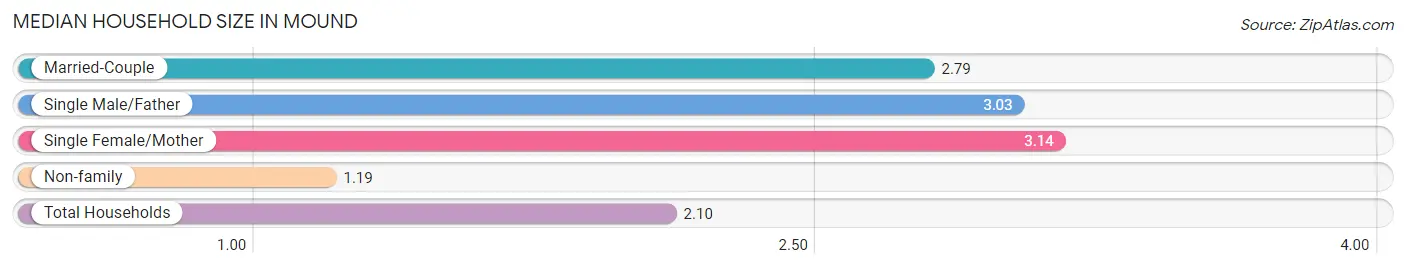
Median Household Size in Mound
The median household size in Mound is 2.10 persons per household, with single female/mother households (270 | 6.1%) accounting for the largest median household size of 3.14 persons per household. non-family households (1,978 | 44.8%) represent the smallest median household size with 1.19 persons per household.
| Household Type | # Households | Household Size |
| Married-Couple | 2,017 (45.7%) | 2.79 |
| Single Male/Father | 149 (3.4%) | 3.03 |
| Single Female/Mother | 270 (6.1%) | 3.14 |
| Non-family | 1,978 (44.8%) | 1.19 |
| Total Households | 4,414 (100.0%) | 2.10 |
Household Size by Marriage Status in Mound
Out of a total of 4,414 households in Mound, 2,436 (55.2%) are family households, while 1,978 (44.8%) are nonfamily households. The most numerous type of family households are 2-person households, comprising 1,314, and the most common type of nonfamily households are 1-person households, comprising 1,719.
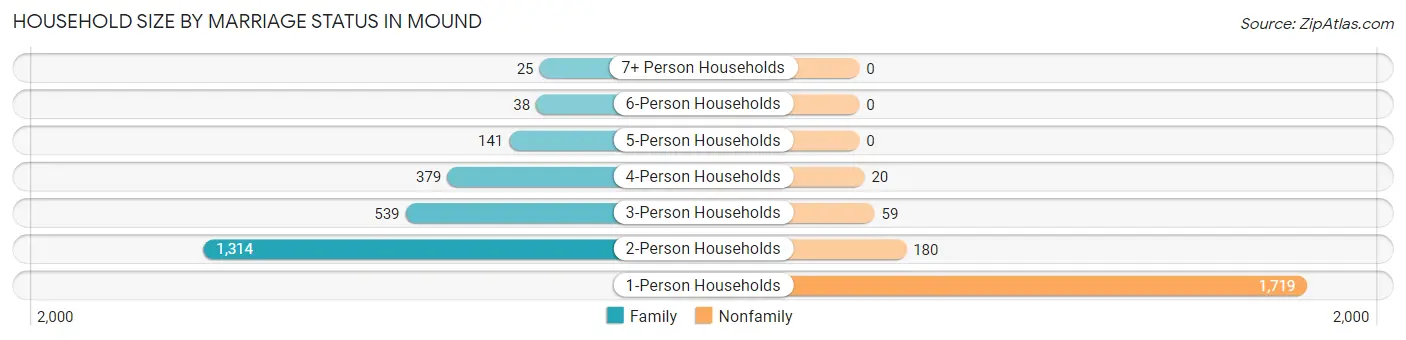
| Household Size | Family Households | Nonfamily Households |
| 1-Person Households | - | 1,719 (38.9%) |
| 2-Person Households | 1,314 (29.8%) | 180 (4.1%) |
| 3-Person Households | 539 (12.2%) | 59 (1.3%) |
| 4-Person Households | 379 (8.6%) | 20 (0.4%) |
| 5-Person Households | 141 (3.2%) | 0 (0.0%) |
| 6-Person Households | 38 (0.9%) | 0 (0.0%) |
| 7+ Person Households | 25 (0.6%) | 0 (0.0%) |
| Total | 2,436 (55.2%) | 1,978 (44.8%) |
Female Fertility in Mound
Fertility by Age in Mound
Average fertility rate in Mound is 79.0 births per 1,000 women. Women in the age bracket of 20 to 34 years have the highest fertility rate with 154.0 births per 1,000 women. Women in the age bracket of 20 to 34 years acount for 53.3% of all women with births.
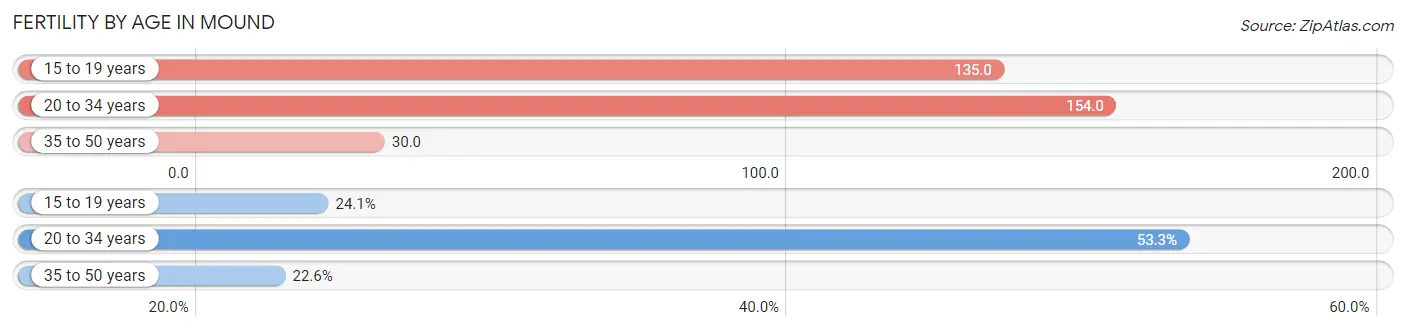
| Age Bracket | Women with Births | Births / 1,000 Women |
| 15 to 19 years | 33 (24.1%) | 135.0 |
| 20 to 34 years | 73 (53.3%) | 154.0 |
| 35 to 50 years | 31 (22.6%) | 30.0 |
| Total | 137 (100.0%) | 79.0 |
Fertility by Age by Marriage Status in Mound
75.9% of women with births (137) in Mound are married. The highest percentage of unmarried women with births falls into 15 to 19 years age bracket with 100.0% of them unmarried at the time of birth, while the lowest percentage of unmarried women with births belong to 20 to 34 years age bracket with 0.0% of them unmarried.
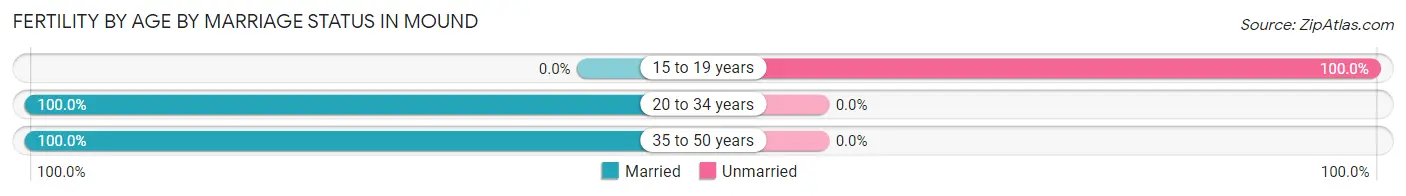
| Age Bracket | Married | Unmarried |
| 15 to 19 years | 0 (0.0%) | 33 (100.0%) |
| 20 to 34 years | 73 (100.0%) | 0 (0.0%) |
| 35 to 50 years | 31 (100.0%) | 0 (0.0%) |
| Total | 104 (75.9%) | 33 (24.1%) |
Fertility by Education in Mound
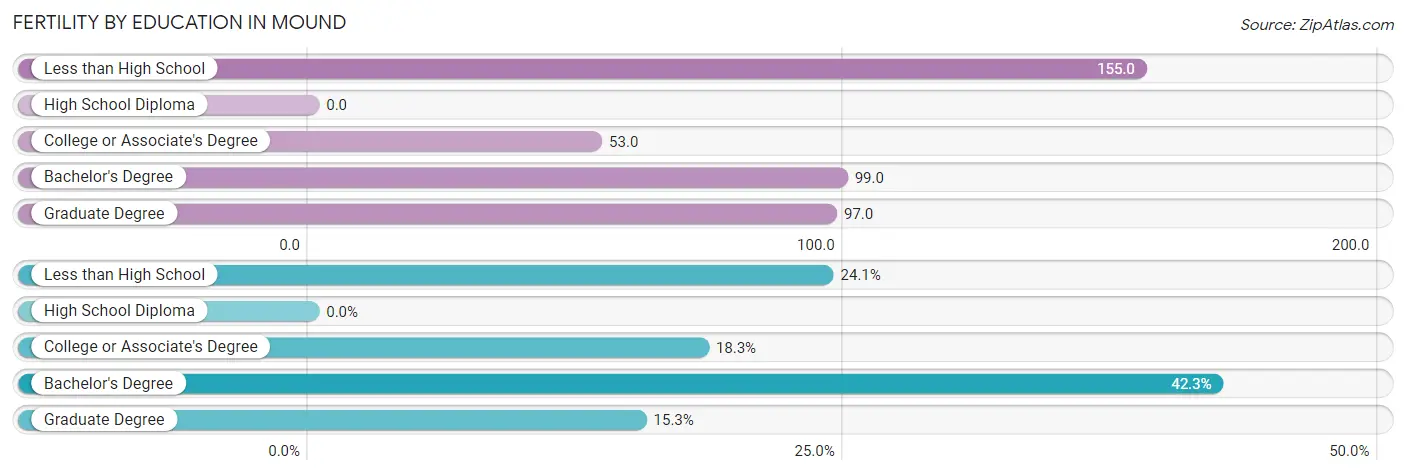
| Educational Attainment | Women with Births | Births / 1,000 Women |
| Less than High School | 33 (24.1%) | 155.0 |
| High School Diploma | 0 (0.0%) | 0.0 |
| College or Associate's Degree | 25 (18.2%) | 53.0 |
| Bachelor's Degree | 58 (42.3%) | 99.0 |
| Graduate Degree | 21 (15.3%) | 97.0 |
| Total | 137 (100.0%) | 79.0 |
Fertility by Education by Marriage Status in Mound
24.1% of women with births in Mound are unmarried. Women with the educational attainment of college or associate's degree are most likely to be married with 100.0% of them married at childbirth, while women with the educational attainment of less than high school are least likely to be married with 100.0% of them unmarried at childbirth.
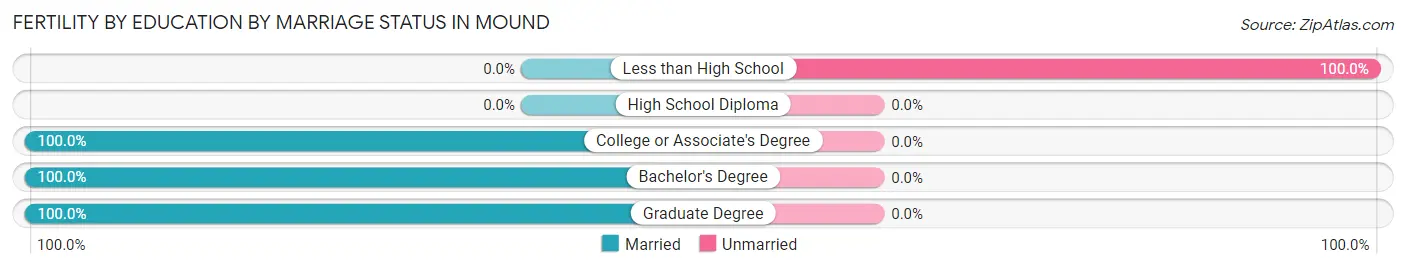
| Educational Attainment | Married | Unmarried |
| Less than High School | 0 (0.0%) | 33 (100.0%) |
| High School Diploma | 0 (0.0%) | 0 (0.0%) |
| College or Associate's Degree | 25 (100.0%) | 0 (0.0%) |
| Bachelor's Degree | 58 (100.0%) | 0 (0.0%) |
| Graduate Degree | 21 (100.0%) | 0 (0.0%) |
| Total | 104 (75.9%) | 33 (24.1%) |
Employment Characteristics in Mound
Employment by Class of Employer in Mound
Among the 5,113 employed individuals in Mound, private company employees (3,826 | 74.8%), self-employed (not incorporated) (336 | 6.6%), and local government employees (310 | 6.1%) make up the most common classes of employment.
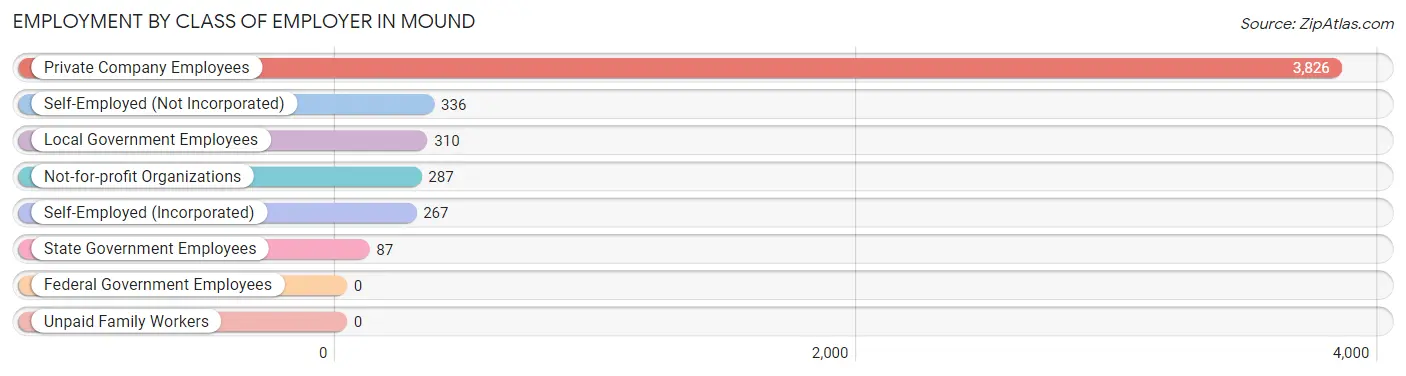
| Employer Class | # Employees | % Employees |
| Private Company Employees | 3,826 | 74.8% |
| Self-Employed (Incorporated) | 267 | 5.2% |
| Self-Employed (Not Incorporated) | 336 | 6.6% |
| Not-for-profit Organizations | 287 | 5.6% |
| Local Government Employees | 310 | 6.1% |
| State Government Employees | 87 | 1.7% |
| Federal Government Employees | 0 | 0.0% |
| Unpaid Family Workers | 0 | 0.0% |
| Total | 5,113 | 100.0% |
Employment Status by Age in Mound
According to the labor force statistics for Mound, out of the total population over 16 years of age (7,686), 69.4% or 5,334 individuals are in the labor force, with 3.6% or 192 of them unemployed. The age group with the highest labor force participation rate is 25 to 29 years, with 92.7% or 190 individuals in the labor force. Within the labor force, the 45 to 54 years age range has the highest percentage of unemployed individuals, with 14.6% or 172 of them being unemployed.
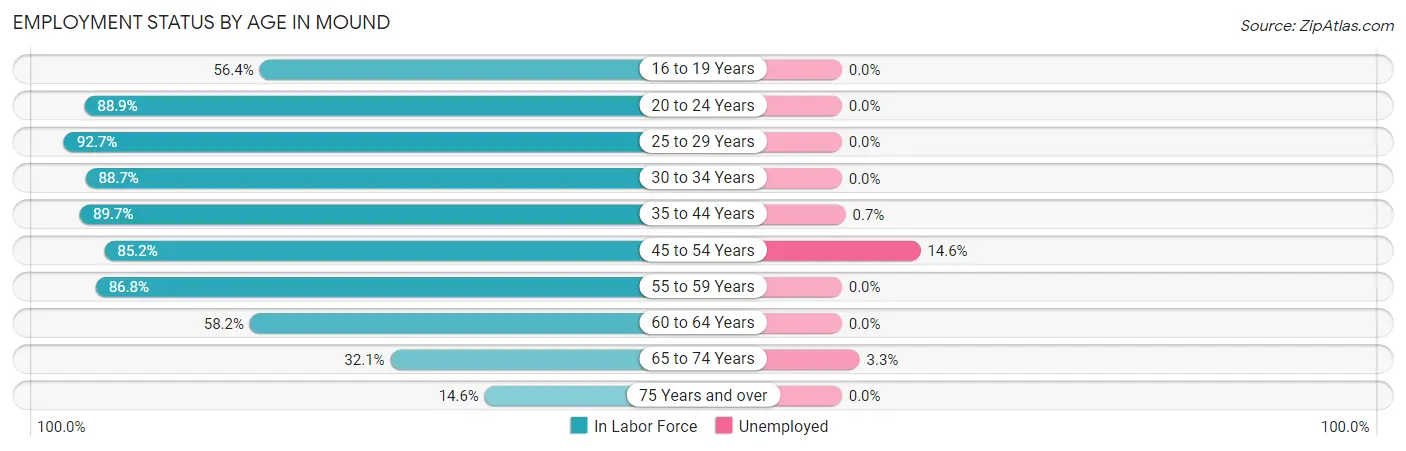
| Age Bracket | In Labor Force | Unemployed |
| 16 to 19 Years | 215 (56.4%) | 0 (0.0%) |
| 20 to 24 Years | 369 (88.9%) | 0 (0.0%) |
| 25 to 29 Years | 190 (92.7%) | 0 (0.0%) |
| 30 to 34 Years | 564 (88.7%) | 0 (0.0%) |
| 35 to 44 Years | 1,315 (89.7%) | 9 (0.7%) |
| 45 to 54 Years | 1,175 (85.2%) | 172 (14.6%) |
| 55 to 59 Years | 515 (86.8%) | 0 (0.0%) |
| 60 to 64 Years | 505 (58.2%) | 0 (0.0%) |
| 65 to 74 Years | 430 (32.1%) | 14 (3.3%) |
| 75 Years and over | 59 (14.6%) | 0 (0.0%) |
| Total | 5,334 (69.4%) | 192 (3.6%) |
Employment Status by Educational Attainment in Mound
According to labor force statistics for Mound, 82.8% of individuals (4,262) out of the total population between 25 and 64 years of age (5,147) are in the labor force, with 4.2% or 179 of them being unemployed. The group with the highest labor force participation rate are those with the educational attainment of bachelor's degree or higher, with 90.4% or 2,327 individuals in the labor force. Within the labor force, individuals with bachelor's degree or higher education have the highest percentage of unemployment, with 5.8% or 135 of them being unemployed.
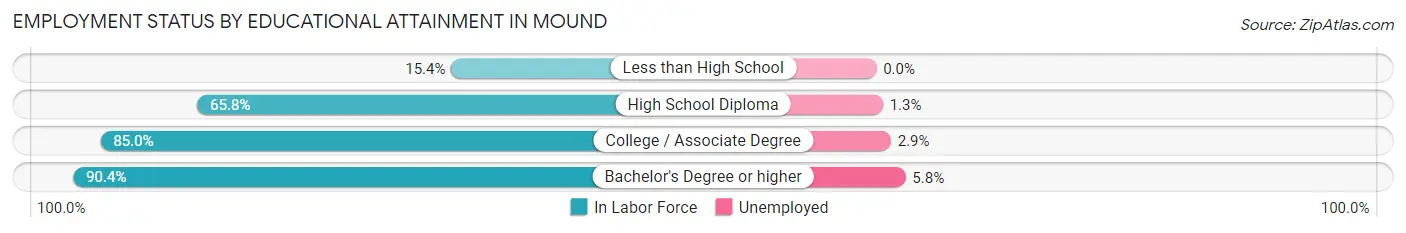
| Educational Attainment | In Labor Force | Unemployed |
| Less than High School | 10 (15.4%) | 0 (0.0%) |
| High School Diploma | 701 (65.8%) | 14 (1.3%) |
| College / Associate Degree | 1,226 (85.0%) | 42 (2.9%) |
| Bachelor's Degree or higher | 2,327 (90.4%) | 149 (5.8%) |
| Total | 4,262 (82.8%) | 216 (4.2%) |
Employment Occupations by Sex in Mound
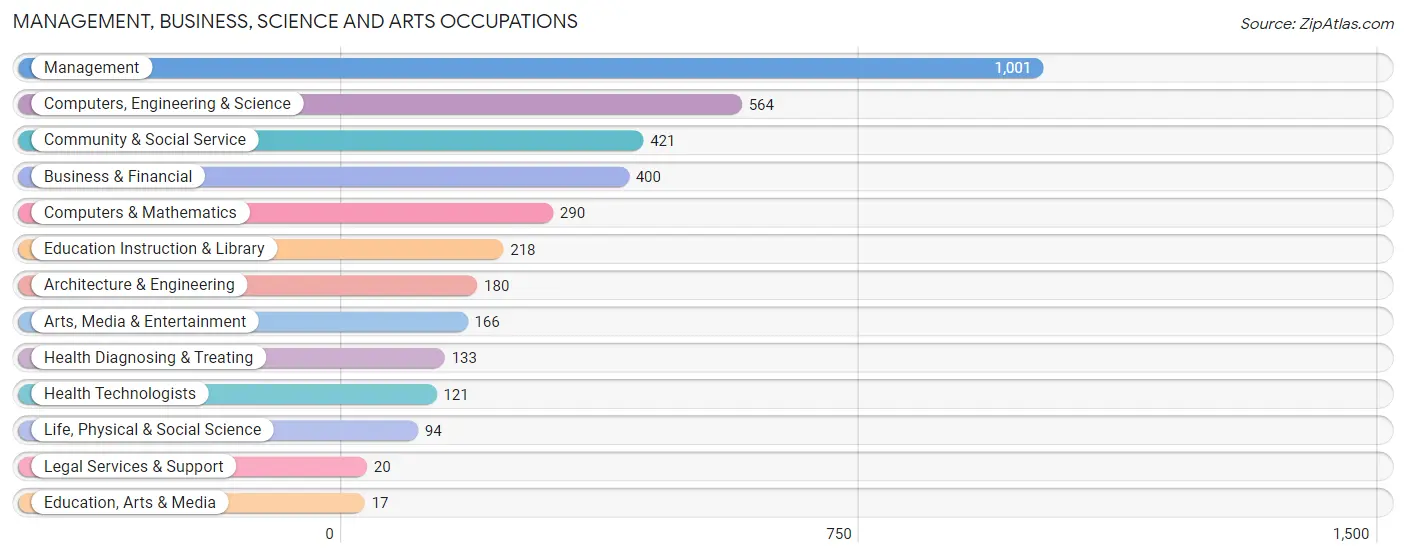
Management, Business, Science and Arts Occupations
The most common Management, Business, Science and Arts occupations in Mound are Management (1,001 | 19.5%), Computers, Engineering & Science (564 | 11.0%), Community & Social Service (421 | 8.2%), Business & Financial (400 | 7.8%), and Computers & Mathematics (290 | 5.6%).
Management, Business, Science and Arts Occupations by Sex
Within the Management, Business, Science and Arts occupations in Mound, the most male-oriented occupations are Architecture & Engineering (100.0%), Computers & Mathematics (79.3%), and Computers, Engineering & Science (77.8%), while the most female-oriented occupations are Education, Arts & Media (100.0%), Education Instruction & Library (91.7%), and Health Diagnosing & Treating (80.4%).
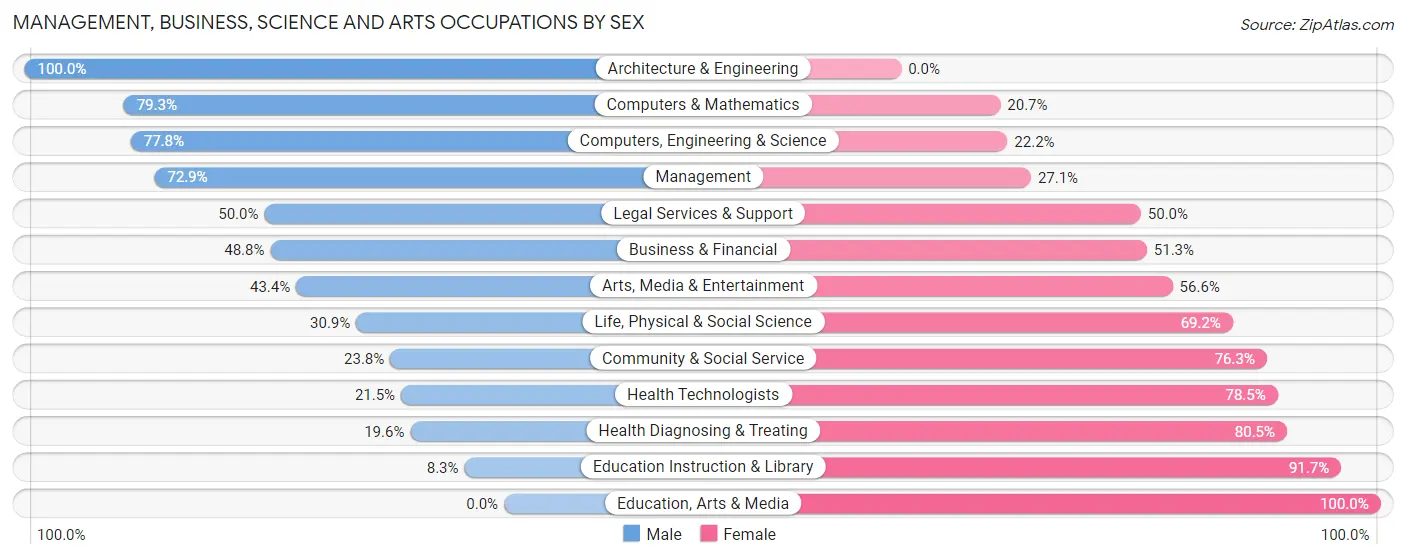
| Occupation | Male | Female |
| Management | 730 (72.9%) | 271 (27.1%) |
| Business & Financial | 195 (48.7%) | 205 (51.2%) |
| Computers, Engineering & Science | 439 (77.8%) | 125 (22.2%) |
| Computers & Mathematics | 230 (79.3%) | 60 (20.7%) |
| Architecture & Engineering | 180 (100.0%) | 0 (0.0%) |
| Life, Physical & Social Science | 29 (30.8%) | 65 (69.2%) |
| Community & Social Service | 100 (23.7%) | 321 (76.2%) |
| Education, Arts & Media | 0 (0.0%) | 17 (100.0%) |
| Legal Services & Support | 10 (50.0%) | 10 (50.0%) |
| Education Instruction & Library | 18 (8.3%) | 200 (91.7%) |
| Arts, Media & Entertainment | 72 (43.4%) | 94 (56.6%) |
| Health Diagnosing & Treating | 26 (19.6%) | 107 (80.4%) |
| Health Technologists | 26 (21.5%) | 95 (78.5%) |
| Total (Category) | 1,490 (59.2%) | 1,029 (40.8%) |
| Total (Overall) | 3,076 (59.8%) | 2,067 (40.2%) |
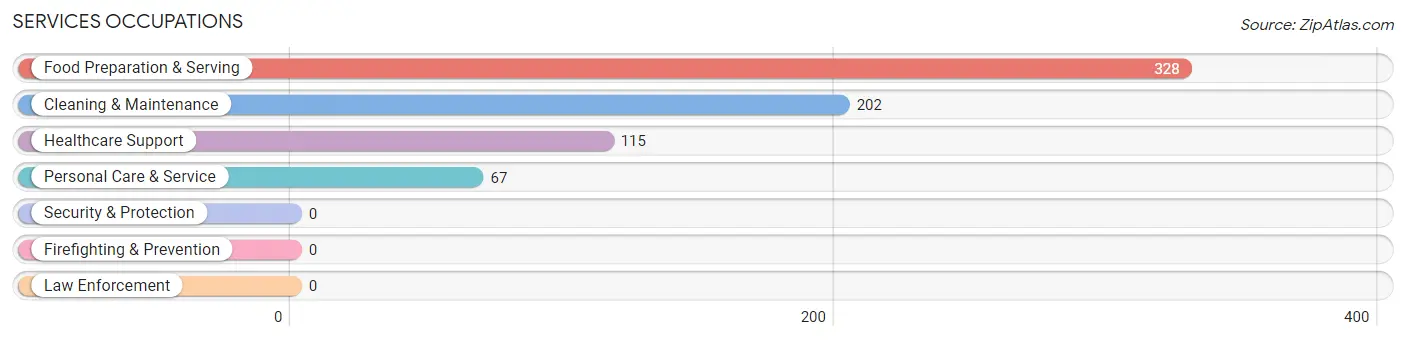
Services Occupations
The most common Services occupations in Mound are Food Preparation & Serving (328 | 6.4%), Cleaning & Maintenance (202 | 3.9%), Healthcare Support (115 | 2.2%), and Personal Care & Service (67 | 1.3%).
Services Occupations by Sex
Within the Services occupations in Mound, the most male-oriented occupations are Personal Care & Service (86.6%), Food Preparation & Serving (50.0%), and Cleaning & Maintenance (35.6%), while the most female-oriented occupations are Healthcare Support (93.0%), Cleaning & Maintenance (64.4%), and Food Preparation & Serving (50.0%).
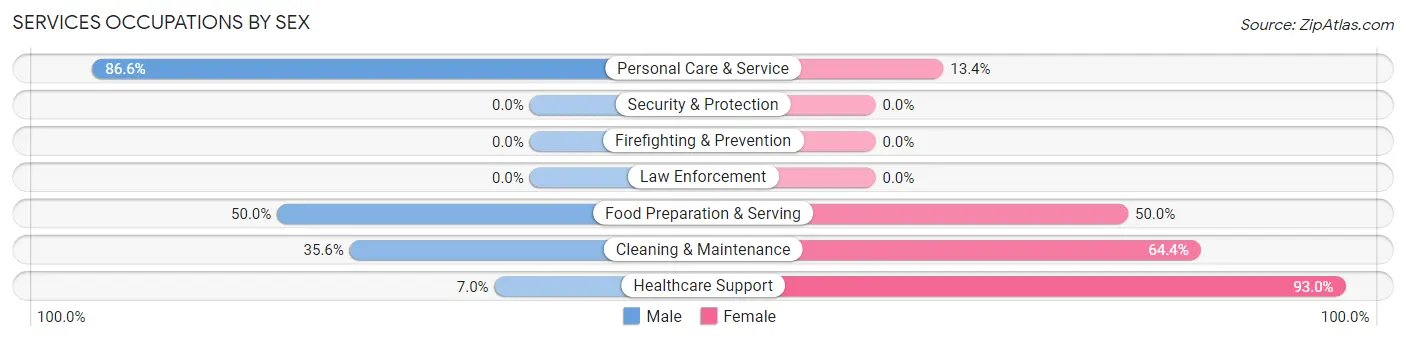
| Occupation | Male | Female |
| Healthcare Support | 8 (7.0%) | 107 (93.0%) |
| Security & Protection | 0 (0.0%) | 0 (0.0%) |
| Firefighting & Prevention | 0 (0.0%) | 0 (0.0%) |
| Law Enforcement | 0 (0.0%) | 0 (0.0%) |
| Food Preparation & Serving | 164 (50.0%) | 164 (50.0%) |
| Cleaning & Maintenance | 72 (35.6%) | 130 (64.4%) |
| Personal Care & Service | 58 (86.6%) | 9 (13.4%) |
| Total (Category) | 302 (42.4%) | 410 (57.6%) |
| Total (Overall) | 3,076 (59.8%) | 2,067 (40.2%) |
Sales and Office Occupations
The most common Sales and Office occupations in Mound are Sales & Related (609 | 11.8%), and Office & Administration (526 | 10.2%).
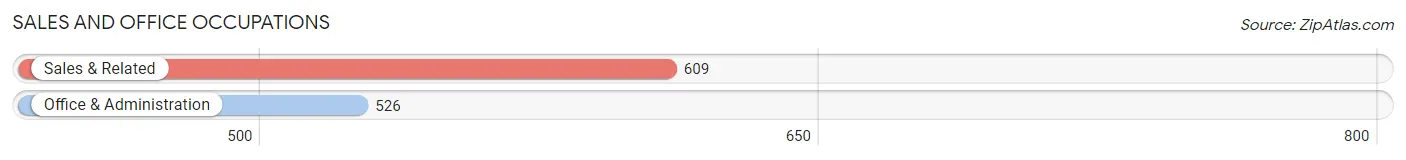
Sales and Office Occupations by Sex
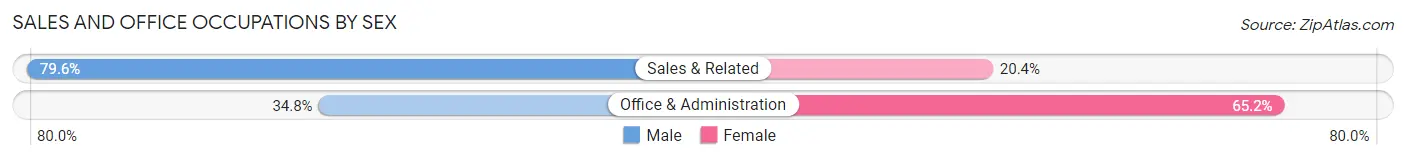
| Occupation | Male | Female |
| Sales & Related | 485 (79.6%) | 124 (20.4%) |
| Office & Administration | 183 (34.8%) | 343 (65.2%) |
| Total (Category) | 668 (58.9%) | 467 (41.1%) |
| Total (Overall) | 3,076 (59.8%) | 2,067 (40.2%) |
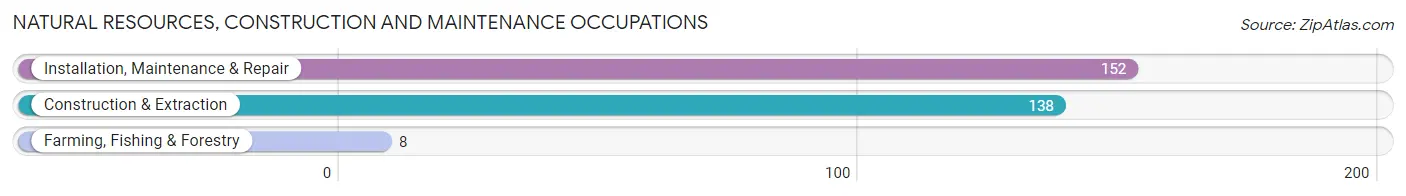
Natural Resources, Construction and Maintenance Occupations
The most common Natural Resources, Construction and Maintenance occupations in Mound are Installation, Maintenance & Repair (152 | 3.0%), Construction & Extraction (138 | 2.7%), and Farming, Fishing & Forestry (8 | 0.2%).
Natural Resources, Construction and Maintenance Occupations by Sex
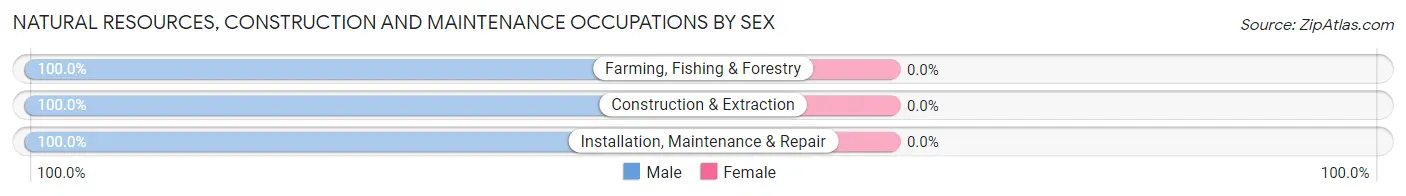
| Occupation | Male | Female |
| Farming, Fishing & Forestry | 8 (100.0%) | 0 (0.0%) |
| Construction & Extraction | 138 (100.0%) | 0 (0.0%) |
| Installation, Maintenance & Repair | 152 (100.0%) | 0 (0.0%) |
| Total (Category) | 298 (100.0%) | 0 (0.0%) |
| Total (Overall) | 3,076 (59.8%) | 2,067 (40.2%) |
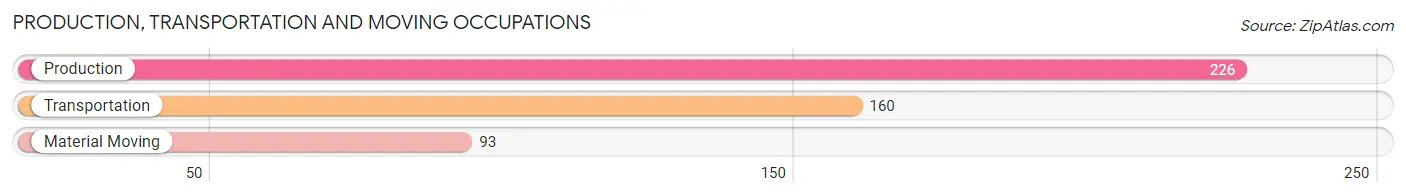
Production, Transportation and Moving Occupations
The most common Production, Transportation and Moving occupations in Mound are Production (226 | 4.4%), Transportation (160 | 3.1%), and Material Moving (93 | 1.8%).
Production, Transportation and Moving Occupations by Sex
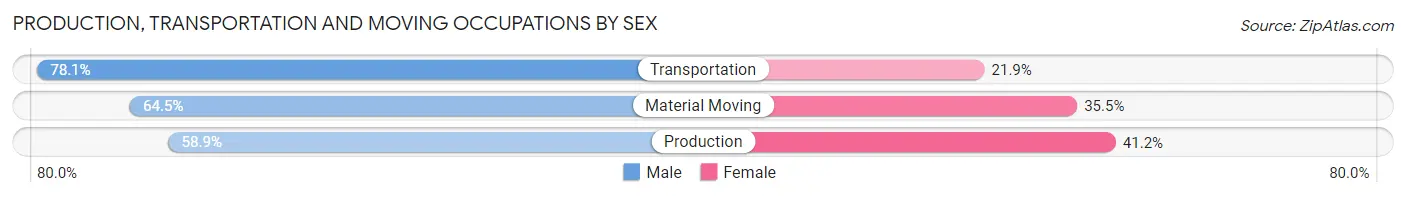
| Occupation | Male | Female |
| Production | 133 (58.9%) | 93 (41.1%) |
| Transportation | 125 (78.1%) | 35 (21.9%) |
| Material Moving | 60 (64.5%) | 33 (35.5%) |
| Total (Category) | 318 (66.4%) | 161 (33.6%) |
| Total (Overall) | 3,076 (59.8%) | 2,067 (40.2%) |
Employment Industries by Sex in Mound
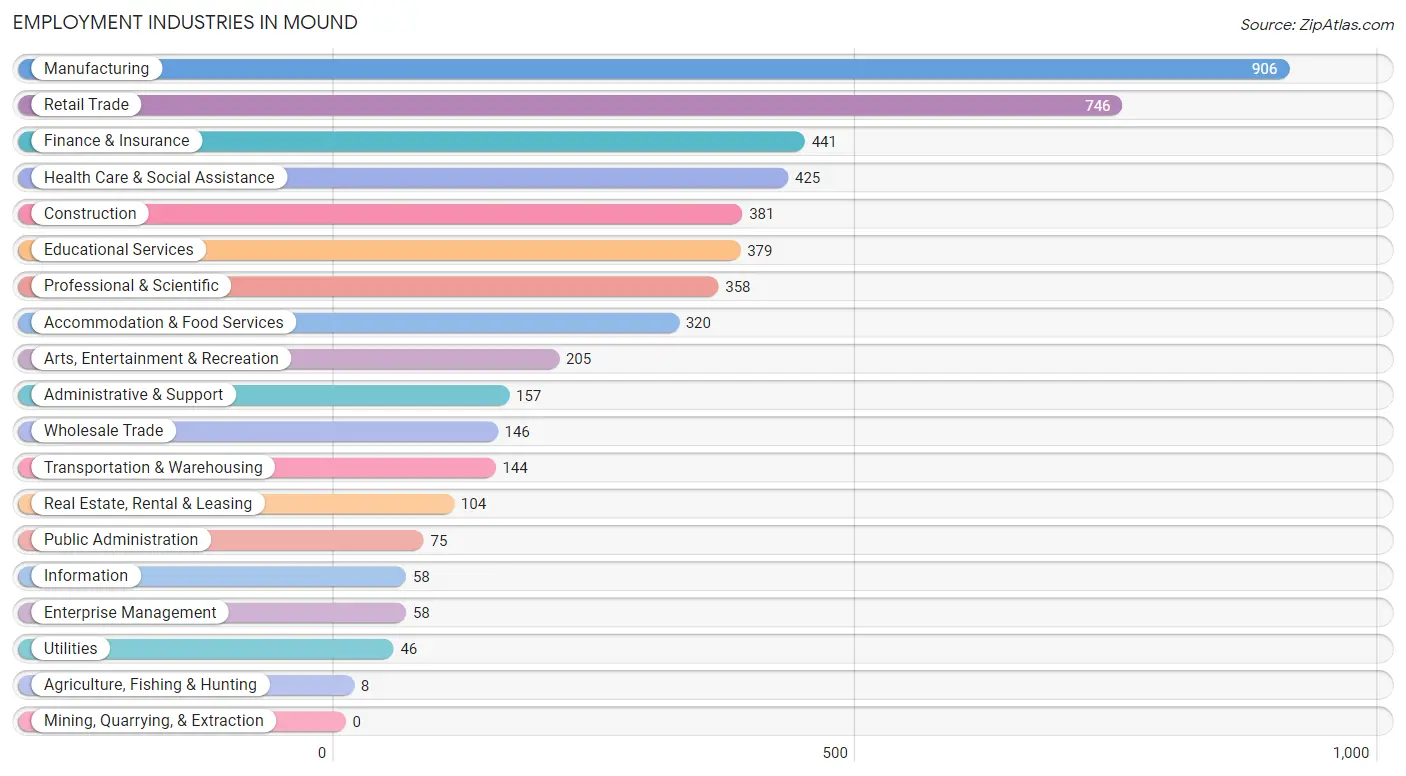
Employment Industries in Mound
The major employment industries in Mound include Manufacturing (906 | 17.6%), Retail Trade (746 | 14.5%), Finance & Insurance (441 | 8.6%), Health Care & Social Assistance (425 | 8.3%), and Construction (381 | 7.4%).
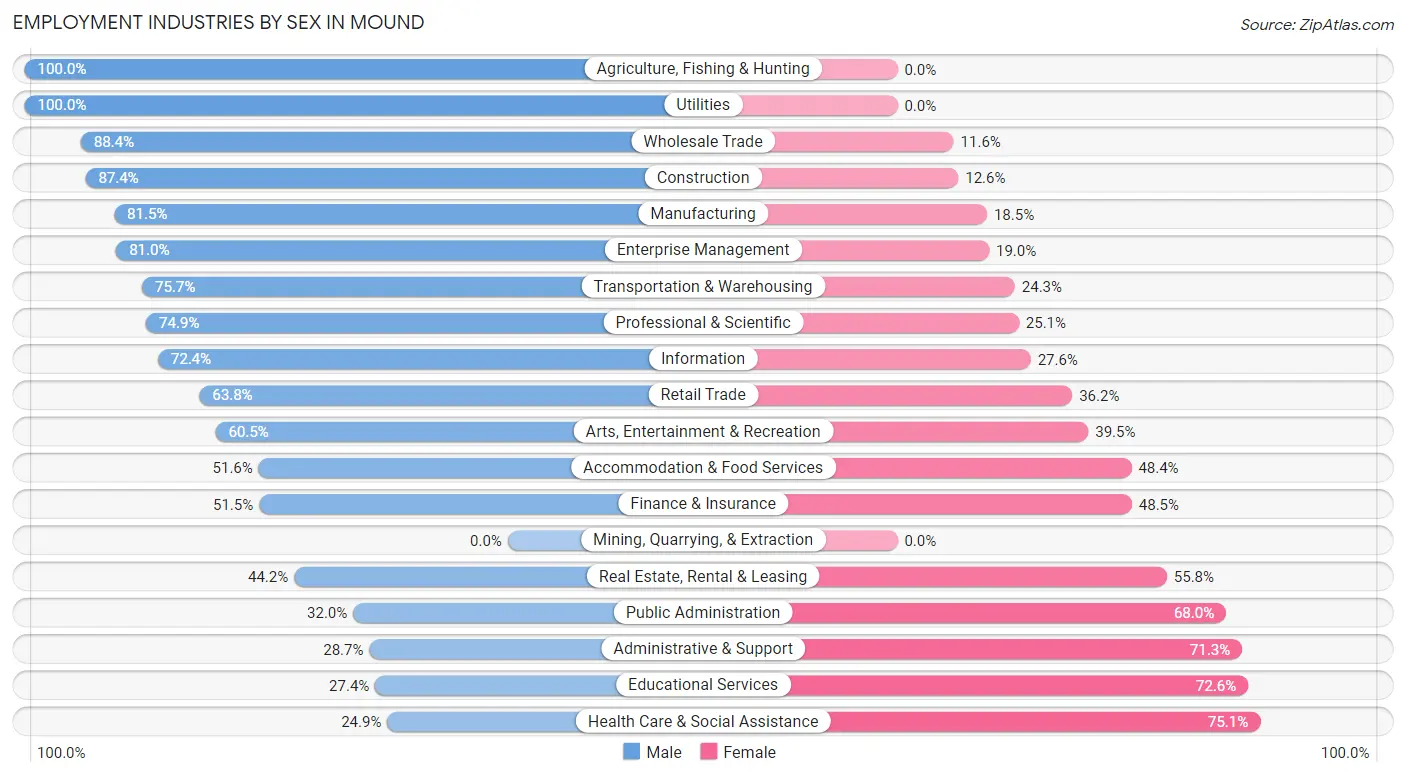
Employment Industries by Sex in Mound
The Mound industries that see more men than women are Agriculture, Fishing & Hunting (100.0%), Utilities (100.0%), and Wholesale Trade (88.4%), whereas the industries that tend to have a higher number of women are Health Care & Social Assistance (75.1%), Educational Services (72.6%), and Administrative & Support (71.3%).
| Industry | Male | Female |
| Agriculture, Fishing & Hunting | 8 (100.0%) | 0 (0.0%) |
| Mining, Quarrying, & Extraction | 0 (0.0%) | 0 (0.0%) |
| Construction | 333 (87.4%) | 48 (12.6%) |
| Manufacturing | 738 (81.5%) | 168 (18.5%) |
| Wholesale Trade | 129 (88.4%) | 17 (11.6%) |
| Retail Trade | 476 (63.8%) | 270 (36.2%) |
| Transportation & Warehousing | 109 (75.7%) | 35 (24.3%) |
| Utilities | 46 (100.0%) | 0 (0.0%) |
| Information | 42 (72.4%) | 16 (27.6%) |
| Finance & Insurance | 227 (51.5%) | 214 (48.5%) |
| Real Estate, Rental & Leasing | 46 (44.2%) | 58 (55.8%) |
| Professional & Scientific | 268 (74.9%) | 90 (25.1%) |
| Enterprise Management | 47 (81.0%) | 11 (19.0%) |
| Administrative & Support | 45 (28.7%) | 112 (71.3%) |
| Educational Services | 104 (27.4%) | 275 (72.6%) |
| Health Care & Social Assistance | 106 (24.9%) | 319 (75.1%) |
| Arts, Entertainment & Recreation | 124 (60.5%) | 81 (39.5%) |
| Accommodation & Food Services | 165 (51.6%) | 155 (48.4%) |
| Public Administration | 24 (32.0%) | 51 (68.0%) |
| Total | 3,076 (59.8%) | 2,067 (40.2%) |
Education in Mound
School Enrollment in Mound
The most common levels of schooling among the 1,657 students in Mound are elementary school (512 | 30.9%), high school (360 | 21.7%), and middle school (330 | 19.9%).
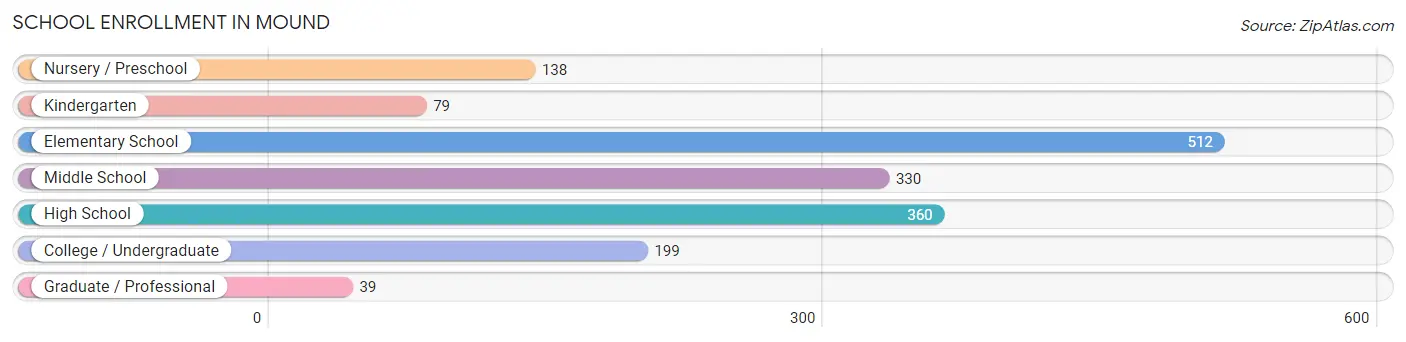
| School Level | # Students | % Students |
| Nursery / Preschool | 138 | 8.3% |
| Kindergarten | 79 | 4.8% |
| Elementary School | 512 | 30.9% |
| Middle School | 330 | 19.9% |
| High School | 360 | 21.7% |
| College / Undergraduate | 199 | 12.0% |
| Graduate / Professional | 39 | 2.4% |
| Total | 1,657 | 100.0% |
School Enrollment by Age by Funding Source in Mound
Out of a total of 1,657 students who are enrolled in schools in Mound, 326 (19.7%) attend a private institution, while the remaining 1,331 (80.3%) are enrolled in public schools. The age group of 35 years and over has the highest likelihood of being enrolled in private schools, with 39 (79.6% in the age bracket) enrolled. Conversely, the age group of 15 to 17 year olds has the lowest likelihood of being enrolled in a private school, with 326 (100.0% in the age bracket) attending a public institution.
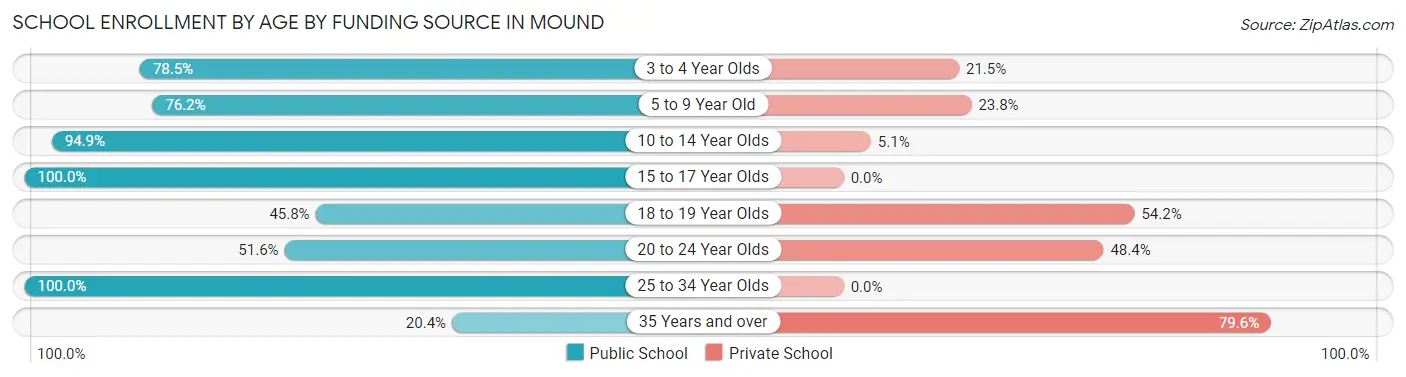
| Age Bracket | Public School | Private School |
| 3 to 4 Year Olds | 95 (78.5%) | 26 (21.5%) |
| 5 to 9 Year Old | 429 (76.2%) | 134 (23.8%) |
| 10 to 14 Year Olds | 356 (94.9%) | 19 (5.1%) |
| 15 to 17 Year Olds | 326 (100.0%) | 0 (0.0%) |
| 18 to 19 Year Olds | 66 (45.8%) | 78 (54.2%) |
| 20 to 24 Year Olds | 32 (51.6%) | 30 (48.4%) |
| 25 to 34 Year Olds | 17 (100.0%) | 0 (0.0%) |
| 35 Years and over | 10 (20.4%) | 39 (79.6%) |
| Total | 1,331 (80.3%) | 326 (19.7%) |
Educational Attainment by Field of Study in Mound
Business (930 | 27.4%), science & technology (390 | 11.5%), communications (295 | 8.7%), engineering (277 | 8.2%), and bio, nature & agricultural (256 | 7.5%) are the most common fields of study among 3,398 individuals in Mound who have obtained a bachelor's degree or higher.
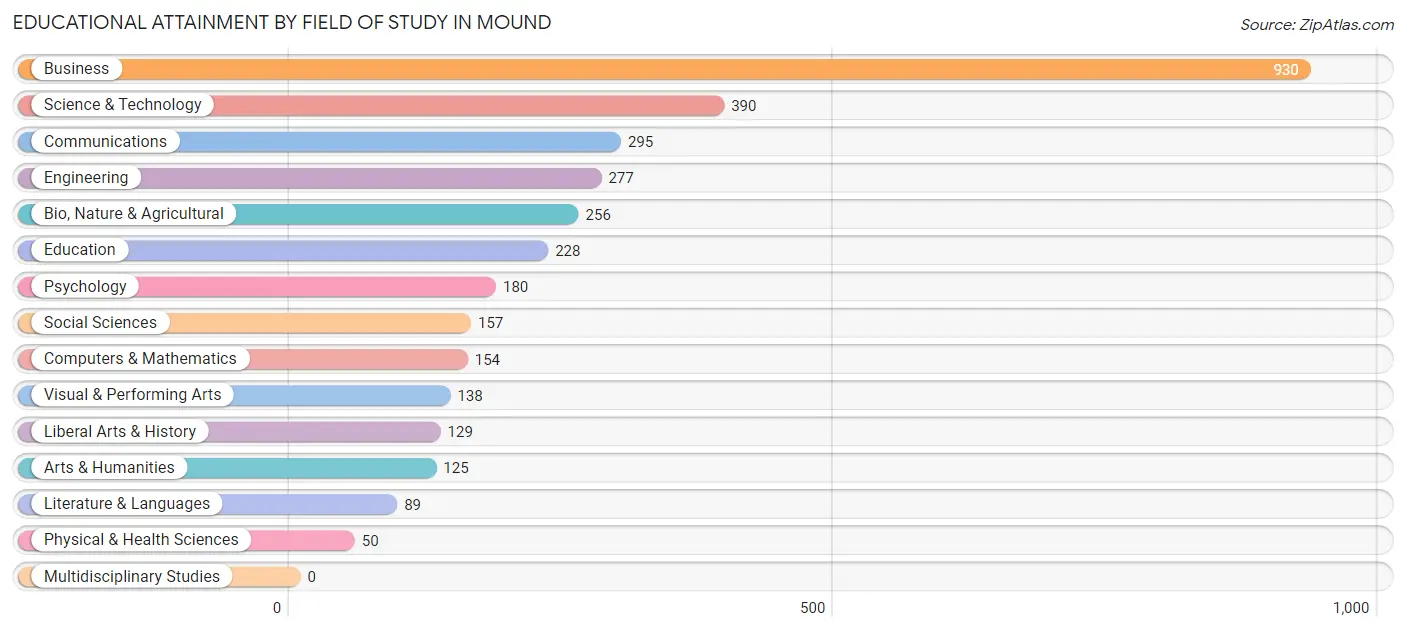
| Field of Study | # Graduates | % Graduates |
| Computers & Mathematics | 154 | 4.5% |
| Bio, Nature & Agricultural | 256 | 7.5% |
| Physical & Health Sciences | 50 | 1.5% |
| Psychology | 180 | 5.3% |
| Social Sciences | 157 | 4.6% |
| Engineering | 277 | 8.2% |
| Multidisciplinary Studies | 0 | 0.0% |
| Science & Technology | 390 | 11.5% |
| Business | 930 | 27.4% |
| Education | 228 | 6.7% |
| Literature & Languages | 89 | 2.6% |
| Liberal Arts & History | 129 | 3.8% |
| Visual & Performing Arts | 138 | 4.1% |
| Communications | 295 | 8.7% |
| Arts & Humanities | 125 | 3.7% |
| Total | 3,398 | 100.0% |
Transportation & Commute in Mound
Vehicle Availability by Sex in Mound
The most prevalent vehicle ownership categories in Mound are males with 2 vehicles (1,679, accounting for 54.8%) and females with 2 vehicles (1,250, making up 81.9%).
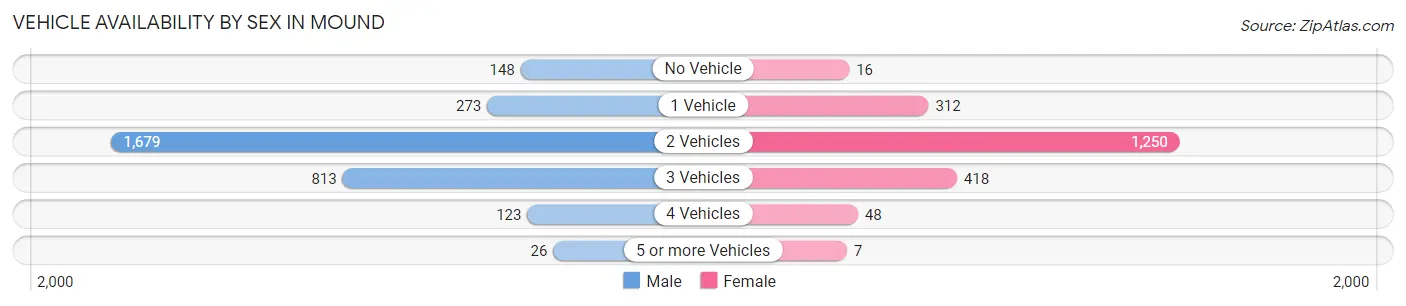
| Vehicles Available | Male | Female |
| No Vehicle | 148 (4.8%) | 16 (0.8%) |
| 1 Vehicle | 273 (8.9%) | 312 (15.2%) |
| 2 Vehicles | 1,679 (54.8%) | 1,250 (61.0%) |
| 3 Vehicles | 813 (26.6%) | 418 (20.4%) |
| 4 Vehicles | 123 (4.0%) | 48 (2.3%) |
| 5 or more Vehicles | 26 (0.9%) | 7 (0.3%) |
| Total | 3,062 (100.0%) | 2,051 (100.0%) |
Commute Time in Mound
The most frequently occuring commute durations in Mound are 30 to 34 minutes (1,119 commuters, 26.2%), 20 to 24 minutes (498 commuters, 11.7%), and 25 to 29 minutes (466 commuters, 10.9%).
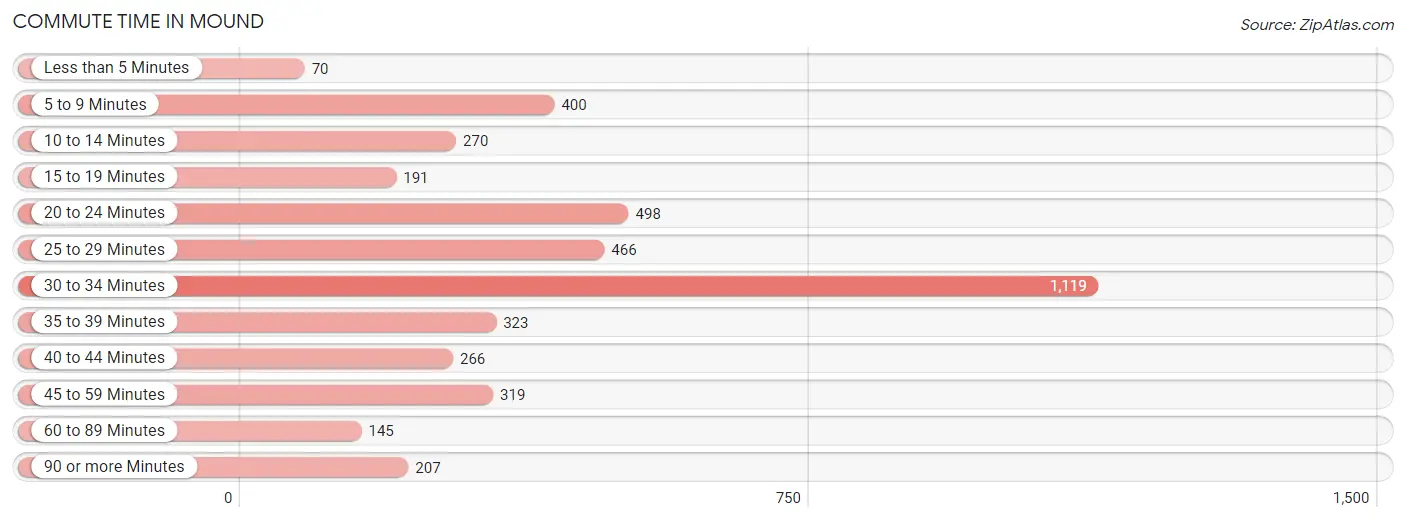
| Commute Time | # Commuters | % Commuters |
| Less than 5 Minutes | 70 | 1.6% |
| 5 to 9 Minutes | 400 | 9.4% |
| 10 to 14 Minutes | 270 | 6.3% |
| 15 to 19 Minutes | 191 | 4.5% |
| 20 to 24 Minutes | 498 | 11.7% |
| 25 to 29 Minutes | 466 | 10.9% |
| 30 to 34 Minutes | 1,119 | 26.2% |
| 35 to 39 Minutes | 323 | 7.6% |
| 40 to 44 Minutes | 266 | 6.2% |
| 45 to 59 Minutes | 319 | 7.5% |
| 60 to 89 Minutes | 145 | 3.4% |
| 90 or more Minutes | 207 | 4.8% |
Commute Time by Sex in Mound
The most common commute times in Mound are 30 to 34 minutes (772 commuters, 29.6%) for males and 30 to 34 minutes (347 commuters, 20.8%) for females.
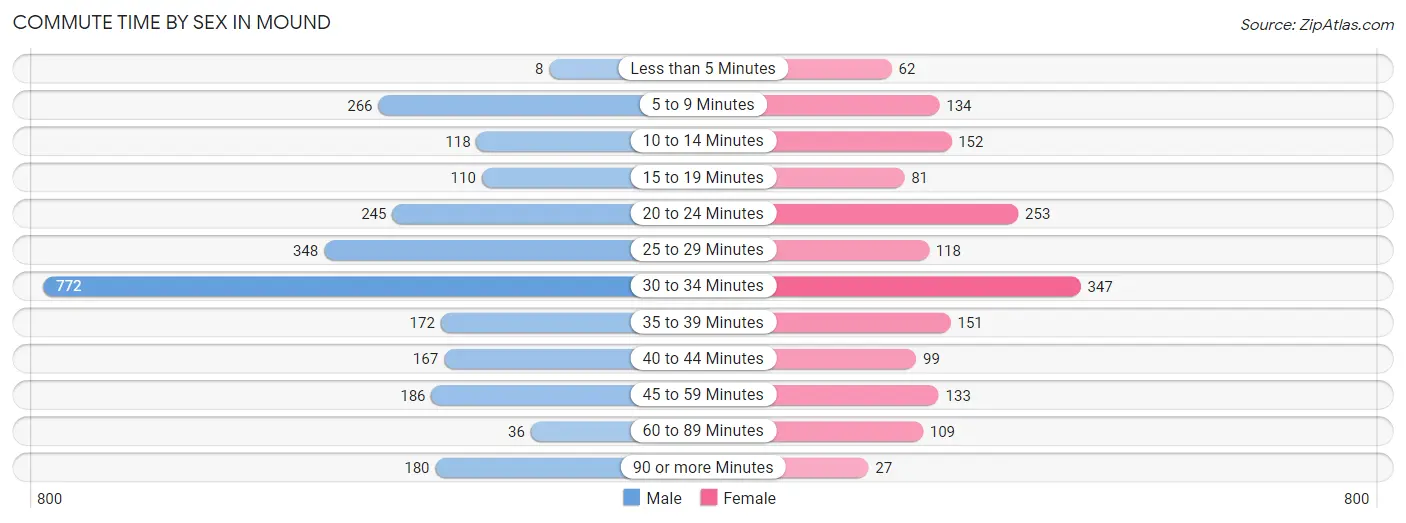
| Commute Time | Male | Female |
| Less than 5 Minutes | 8 (0.3%) | 62 (3.7%) |
| 5 to 9 Minutes | 266 (10.2%) | 134 (8.0%) |
| 10 to 14 Minutes | 118 (4.5%) | 152 (9.1%) |
| 15 to 19 Minutes | 110 (4.2%) | 81 (4.9%) |
| 20 to 24 Minutes | 245 (9.4%) | 253 (15.2%) |
| 25 to 29 Minutes | 348 (13.3%) | 118 (7.1%) |
| 30 to 34 Minutes | 772 (29.6%) | 347 (20.8%) |
| 35 to 39 Minutes | 172 (6.6%) | 151 (9.1%) |
| 40 to 44 Minutes | 167 (6.4%) | 99 (5.9%) |
| 45 to 59 Minutes | 186 (7.1%) | 133 (8.0%) |
| 60 to 89 Minutes | 36 (1.4%) | 109 (6.5%) |
| 90 or more Minutes | 180 (6.9%) | 27 (1.6%) |
Time of Departure to Work by Sex in Mound
The most frequent times of departure to work in Mound are 8:00 AM to 8:29 AM (404, 15.5%) for males and 7:00 AM to 7:29 AM (367, 22.0%) for females.
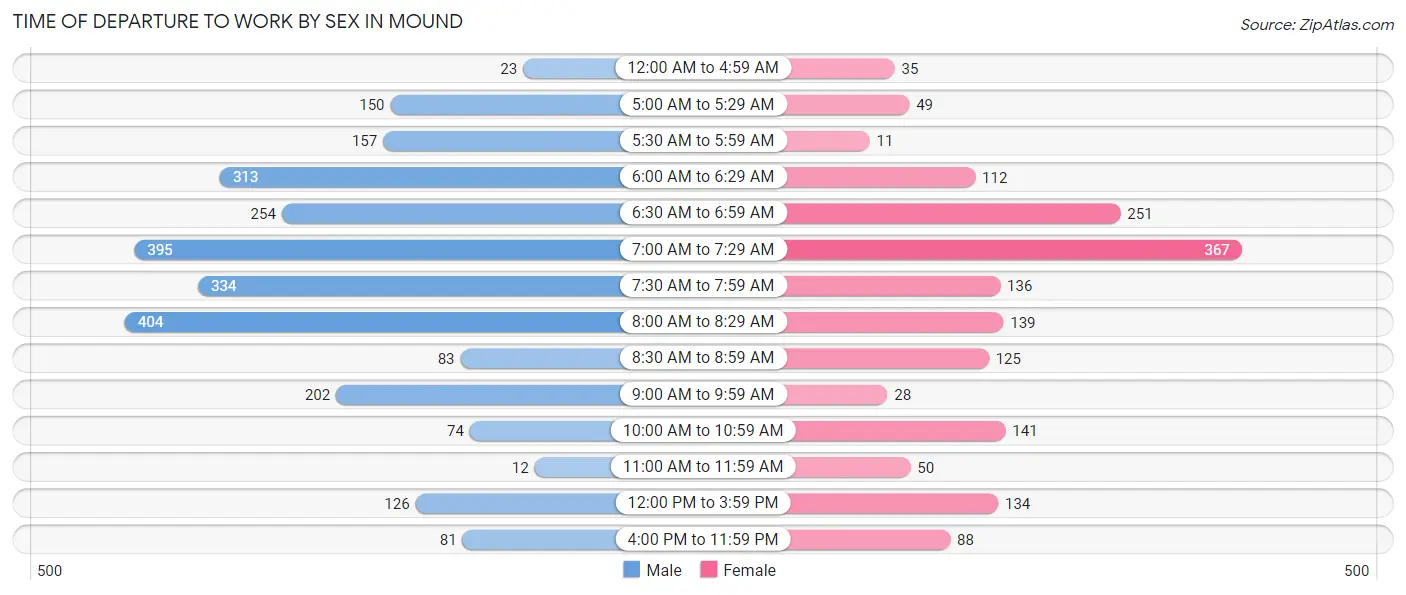
| Time of Departure | Male | Female |
| 12:00 AM to 4:59 AM | 23 (0.9%) | 35 (2.1%) |
| 5:00 AM to 5:29 AM | 150 (5.8%) | 49 (2.9%) |
| 5:30 AM to 5:59 AM | 157 (6.0%) | 11 (0.7%) |
| 6:00 AM to 6:29 AM | 313 (12.0%) | 112 (6.7%) |
| 6:30 AM to 6:59 AM | 254 (9.7%) | 251 (15.1%) |
| 7:00 AM to 7:29 AM | 395 (15.1%) | 367 (22.0%) |
| 7:30 AM to 7:59 AM | 334 (12.8%) | 136 (8.2%) |
| 8:00 AM to 8:29 AM | 404 (15.5%) | 139 (8.3%) |
| 8:30 AM to 8:59 AM | 83 (3.2%) | 125 (7.5%) |
| 9:00 AM to 9:59 AM | 202 (7.7%) | 28 (1.7%) |
| 10:00 AM to 10:59 AM | 74 (2.8%) | 141 (8.5%) |
| 11:00 AM to 11:59 AM | 12 (0.5%) | 50 (3.0%) |
| 12:00 PM to 3:59 PM | 126 (4.8%) | 134 (8.0%) |
| 4:00 PM to 11:59 PM | 81 (3.1%) | 88 (5.3%) |
| Total | 2,608 (100.0%) | 1,666 (100.0%) |
Housing Occupancy in Mound
Occupancy by Ownership in Mound
Of the total 4,414 dwellings in Mound, owner-occupied units account for 3,280 (74.3%), while renter-occupied units make up 1,134 (25.7%).
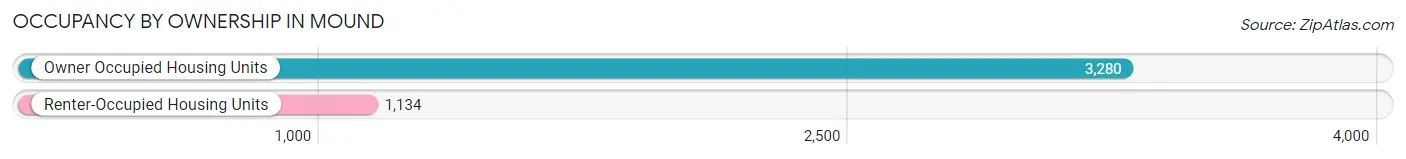
| Occupancy | # Housing Units | % Housing Units |
| Owner Occupied Housing Units | 3,280 | 74.3% |
| Renter-Occupied Housing Units | 1,134 | 25.7% |
| Total Occupied Housing Units | 4,414 | 100.0% |
Occupancy by Household Size in Mound
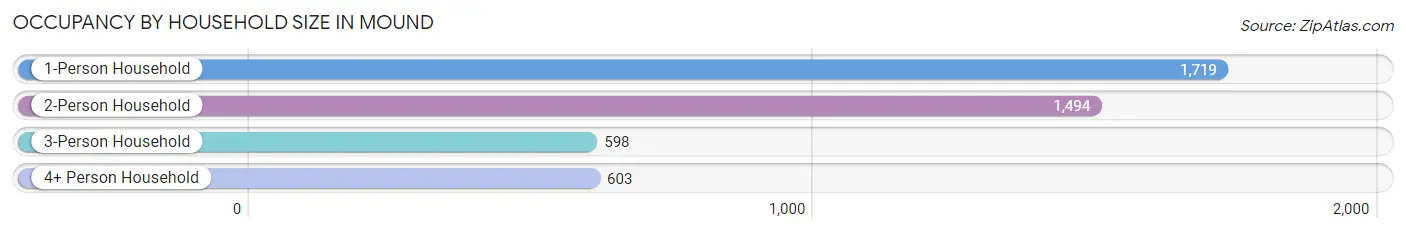
| Household Size | # Housing Units | % Housing Units |
| 1-Person Household | 1,719 | 38.9% |
| 2-Person Household | 1,494 | 33.9% |
| 3-Person Household | 598 | 13.6% |
| 4+ Person Household | 603 | 13.7% |
| Total Housing Units | 4,414 | 100.0% |
Occupancy by Ownership by Household Size in Mound
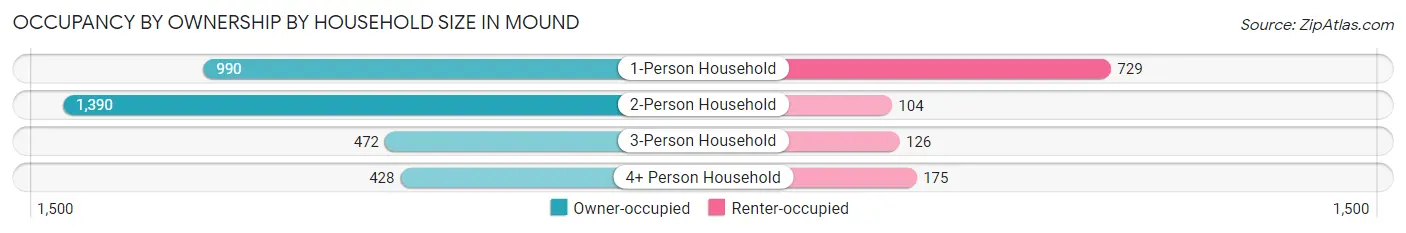
| Household Size | Owner-occupied | Renter-occupied |
| 1-Person Household | 990 (57.6%) | 729 (42.4%) |
| 2-Person Household | 1,390 (93.0%) | 104 (7.0%) |
| 3-Person Household | 472 (78.9%) | 126 (21.1%) |
| 4+ Person Household | 428 (71.0%) | 175 (29.0%) |
| Total Housing Units | 3,280 (74.3%) | 1,134 (25.7%) |
Occupancy by Educational Attainment in Mound
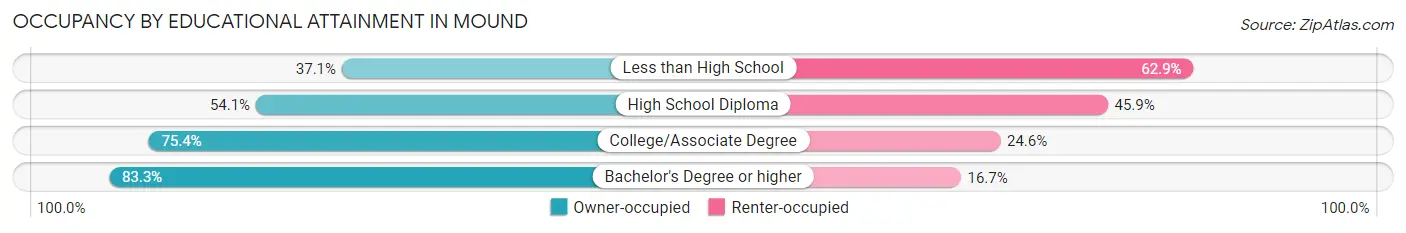
| Household Size | Owner-occupied | Renter-occupied |
| Less than High School | 23 (37.1%) | 39 (62.9%) |
| High School Diploma | 452 (54.1%) | 383 (45.9%) |
| College/Associate Degree | 1,192 (75.4%) | 388 (24.6%) |
| Bachelor's Degree or higher | 1,613 (83.3%) | 324 (16.7%) |
Occupancy by Age of Householder in Mound
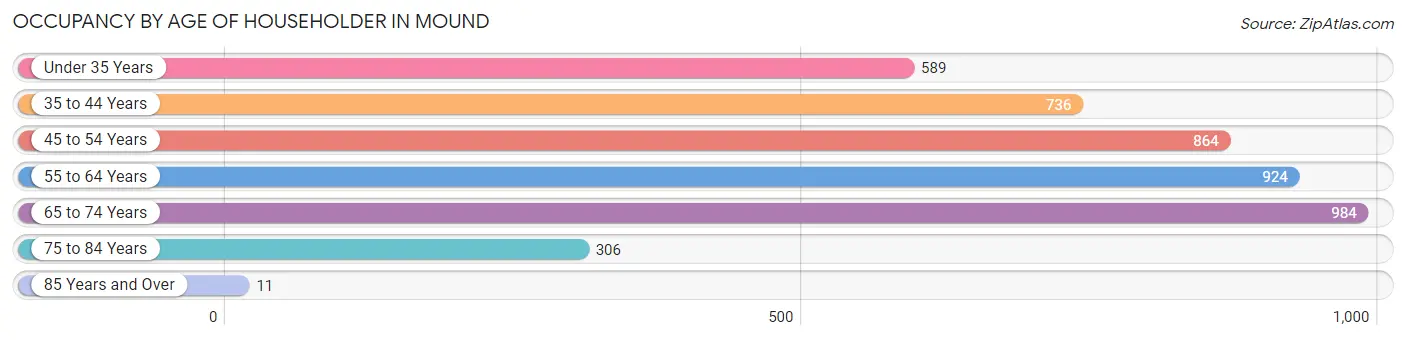
| Age Bracket | # Households | % Households |
| Under 35 Years | 589 | 13.3% |
| 35 to 44 Years | 736 | 16.7% |
| 45 to 54 Years | 864 | 19.6% |
| 55 to 64 Years | 924 | 20.9% |
| 65 to 74 Years | 984 | 22.3% |
| 75 to 84 Years | 306 | 6.9% |
| 85 Years and Over | 11 | 0.3% |
| Total | 4,414 | 100.0% |
Housing Finances in Mound
Median Income by Occupancy in Mound
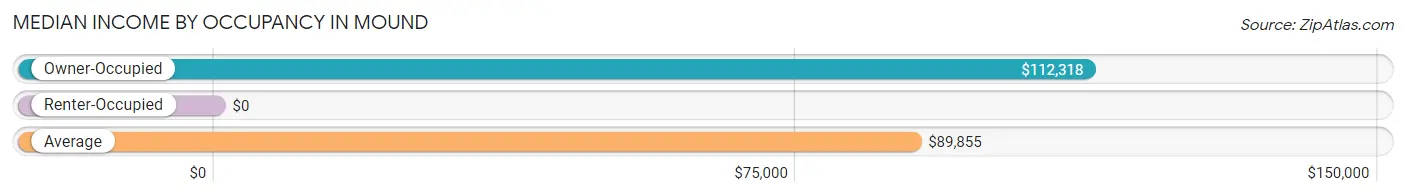
| Occupancy Type | # Households | Median Income |
| Owner-Occupied | 3,280 (74.3%) | $112,318 |
| Renter-Occupied | 1,134 (25.7%) | $0 |
| Average | 4,414 (100.0%) | $89,855 |
Occupancy by Householder Income Bracket in Mound
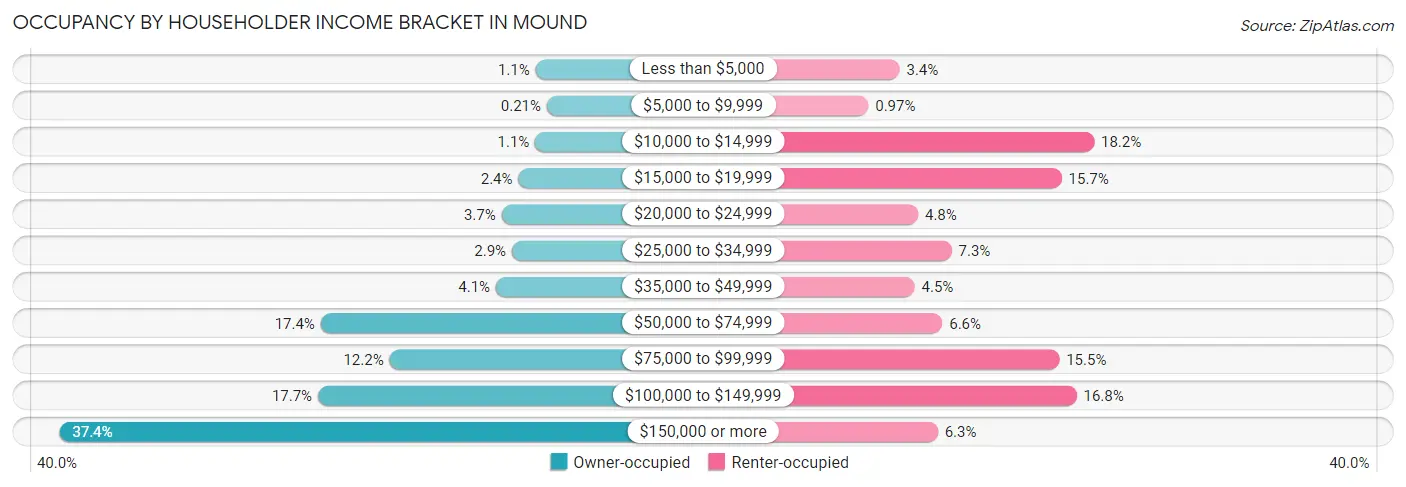
| Income Bracket | Owner-occupied | Renter-occupied |
| Less than $5,000 | 35 (1.1%) | 38 (3.4%) |
| $5,000 to $9,999 | 7 (0.2%) | 11 (1.0%) |
| $10,000 to $14,999 | 36 (1.1%) | 206 (18.2%) |
| $15,000 to $19,999 | 78 (2.4%) | 178 (15.7%) |
| $20,000 to $24,999 | 120 (3.7%) | 54 (4.8%) |
| $25,000 to $34,999 | 94 (2.9%) | 83 (7.3%) |
| $35,000 to $49,999 | 134 (4.1%) | 51 (4.5%) |
| $50,000 to $74,999 | 572 (17.4%) | 75 (6.6%) |
| $75,000 to $99,999 | 400 (12.2%) | 176 (15.5%) |
| $100,000 to $149,999 | 579 (17.6%) | 191 (16.8%) |
| $150,000 or more | 1,225 (37.3%) | 71 (6.3%) |
| Total | 3,280 (100.0%) | 1,134 (100.0%) |
Monthly Housing Cost Tiers in Mound
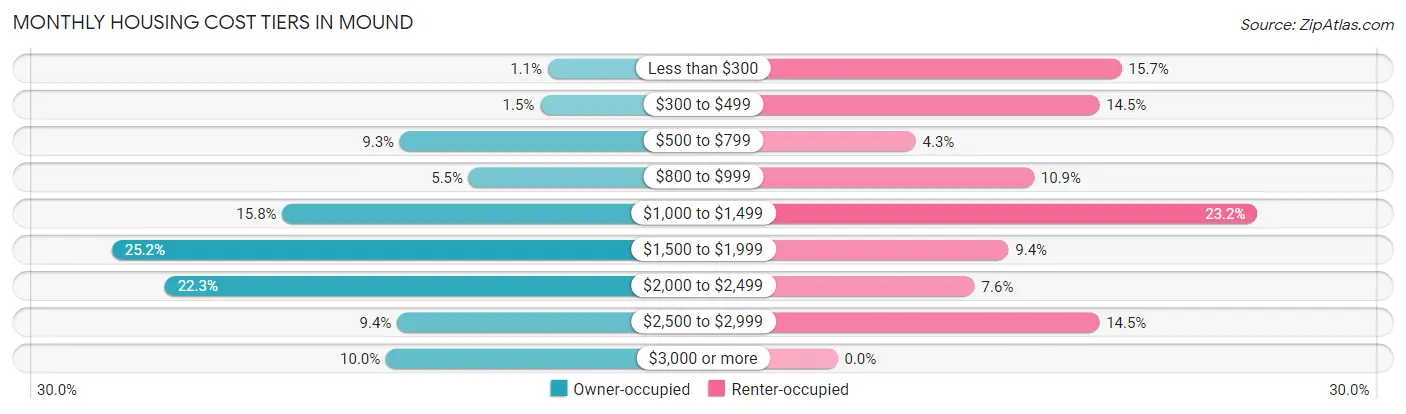
| Monthly Cost | Owner-occupied | Renter-occupied |
| Less than $300 | 36 (1.1%) | 178 (15.7%) |
| $300 to $499 | 50 (1.5%) | 164 (14.5%) |
| $500 to $799 | 304 (9.3%) | 49 (4.3%) |
| $800 to $999 | 179 (5.5%) | 123 (10.8%) |
| $1,000 to $1,499 | 517 (15.8%) | 263 (23.2%) |
| $1,500 to $1,999 | 826 (25.2%) | 107 (9.4%) |
| $2,000 to $2,499 | 730 (22.3%) | 86 (7.6%) |
| $2,500 to $2,999 | 309 (9.4%) | 164 (14.5%) |
| $3,000 or more | 329 (10.0%) | 0 (0.0%) |
| Total | 3,280 (100.0%) | 1,134 (100.0%) |
Physical Housing Characteristics in Mound
Housing Structures in Mound
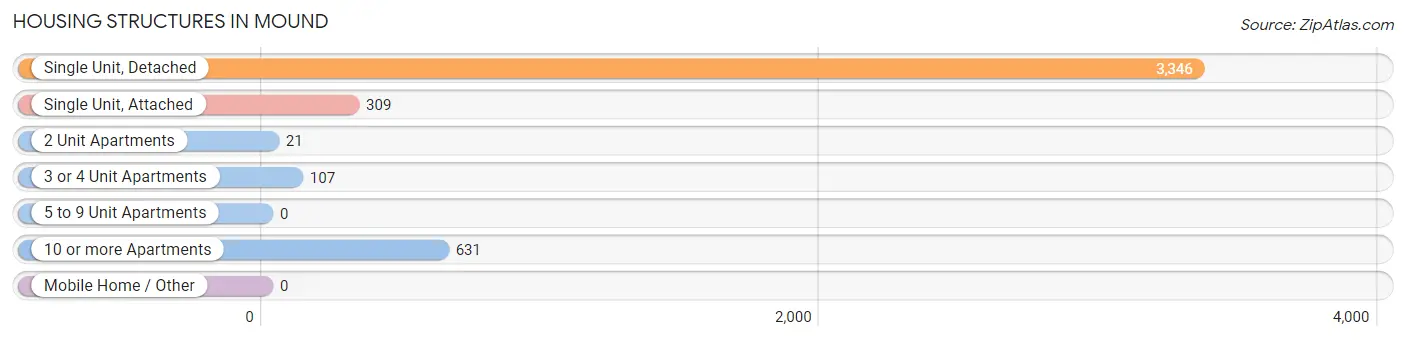
| Structure Type | # Housing Units | % Housing Units |
| Single Unit, Detached | 3,346 | 75.8% |
| Single Unit, Attached | 309 | 7.0% |
| 2 Unit Apartments | 21 | 0.5% |
| 3 or 4 Unit Apartments | 107 | 2.4% |
| 5 to 9 Unit Apartments | 0 | 0.0% |
| 10 or more Apartments | 631 | 14.3% |
| Mobile Home / Other | 0 | 0.0% |
| Total | 4,414 | 100.0% |
Housing Structures by Occupancy in Mound
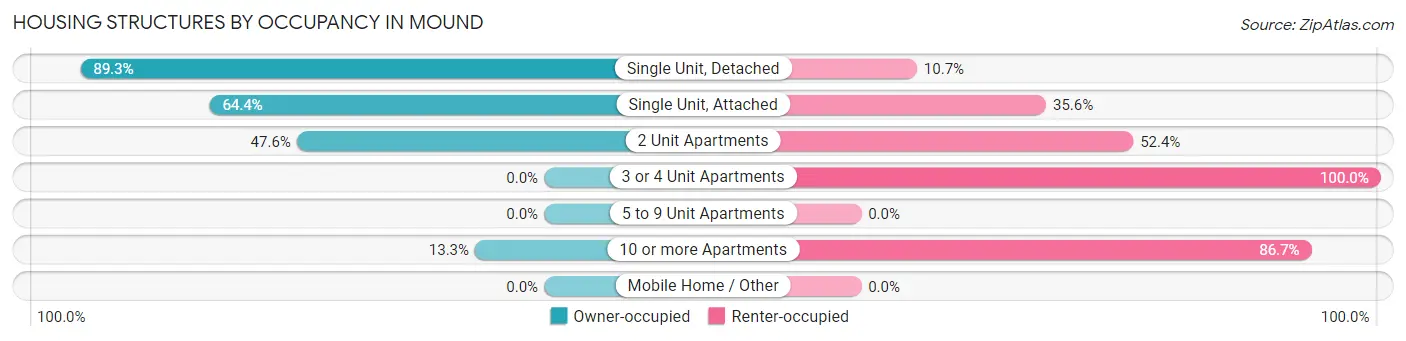
| Structure Type | Owner-occupied | Renter-occupied |
| Single Unit, Detached | 2,987 (89.3%) | 359 (10.7%) |
| Single Unit, Attached | 199 (64.4%) | 110 (35.6%) |
| 2 Unit Apartments | 10 (47.6%) | 11 (52.4%) |
| 3 or 4 Unit Apartments | 0 (0.0%) | 107 (100.0%) |
| 5 to 9 Unit Apartments | 0 (0.0%) | 0 (0.0%) |
| 10 or more Apartments | 84 (13.3%) | 547 (86.7%) |
| Mobile Home / Other | 0 (0.0%) | 0 (0.0%) |
| Total | 3,280 (74.3%) | 1,134 (25.7%) |
Housing Structures by Number of Rooms in Mound
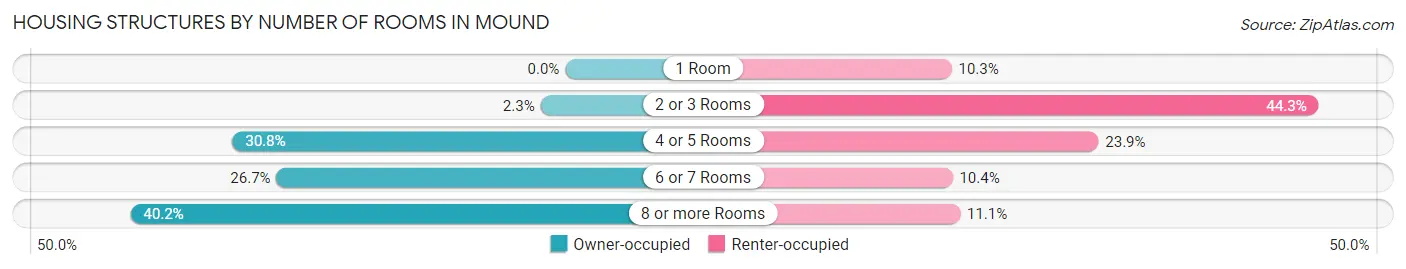
| Number of Rooms | Owner-occupied | Renter-occupied |
| 1 Room | 0 (0.0%) | 117 (10.3%) |
| 2 or 3 Rooms | 75 (2.3%) | 502 (44.3%) |
| 4 or 5 Rooms | 1,010 (30.8%) | 271 (23.9%) |
| 6 or 7 Rooms | 876 (26.7%) | 118 (10.4%) |
| 8 or more Rooms | 1,319 (40.2%) | 126 (11.1%) |
| Total | 3,280 (100.0%) | 1,134 (100.0%) |
Housing Structure by Heating Type in Mound
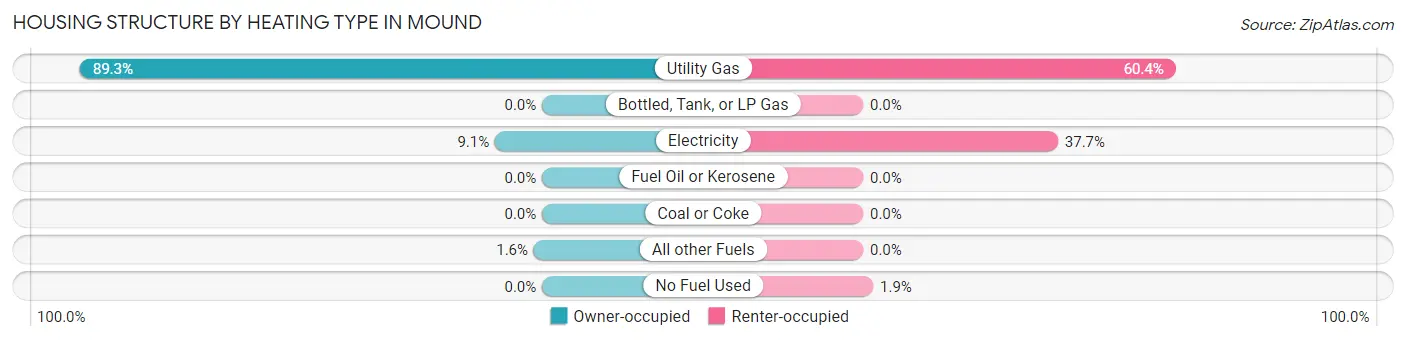
| Heating Type | Owner-occupied | Renter-occupied |
| Utility Gas | 2,930 (89.3%) | 685 (60.4%) |
| Bottled, Tank, or LP Gas | 0 (0.0%) | 0 (0.0%) |
| Electricity | 298 (9.1%) | 427 (37.7%) |
| Fuel Oil or Kerosene | 0 (0.0%) | 0 (0.0%) |
| Coal or Coke | 0 (0.0%) | 0 (0.0%) |
| All other Fuels | 52 (1.6%) | 0 (0.0%) |
| No Fuel Used | 0 (0.0%) | 22 (1.9%) |
| Total | 3,280 (100.0%) | 1,134 (100.0%) |
Household Vehicle Usage in Mound
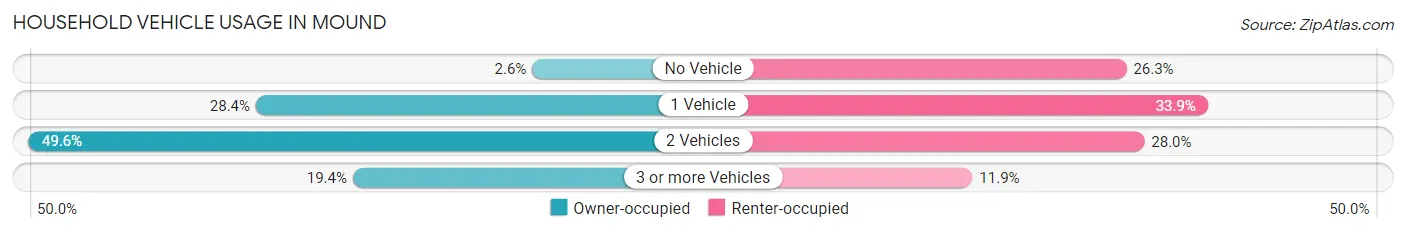
| Vehicles per Household | Owner-occupied | Renter-occupied |
| No Vehicle | 86 (2.6%) | 298 (26.3%) |
| 1 Vehicle | 932 (28.4%) | 384 (33.9%) |
| 2 Vehicles | 1,627 (49.6%) | 317 (28.0%) |
| 3 or more Vehicles | 635 (19.4%) | 135 (11.9%) |
| Total | 3,280 (100.0%) | 1,134 (100.0%) |
Real Estate & Mortgages in Mound
Real Estate and Mortgage Overview in Mound
| Characteristic | Without Mortgage | With Mortgage |
| Housing Units | 609 | 2,671 |
| Median Property Value | $327,500 | $327,500 |
| Median Household Income | $75,469 | $1,071 |
| Monthly Housing Costs | $813 | $319 |
| Real Estate Taxes | $3,505 | $0 |
Property Value by Mortgage Status in Mound
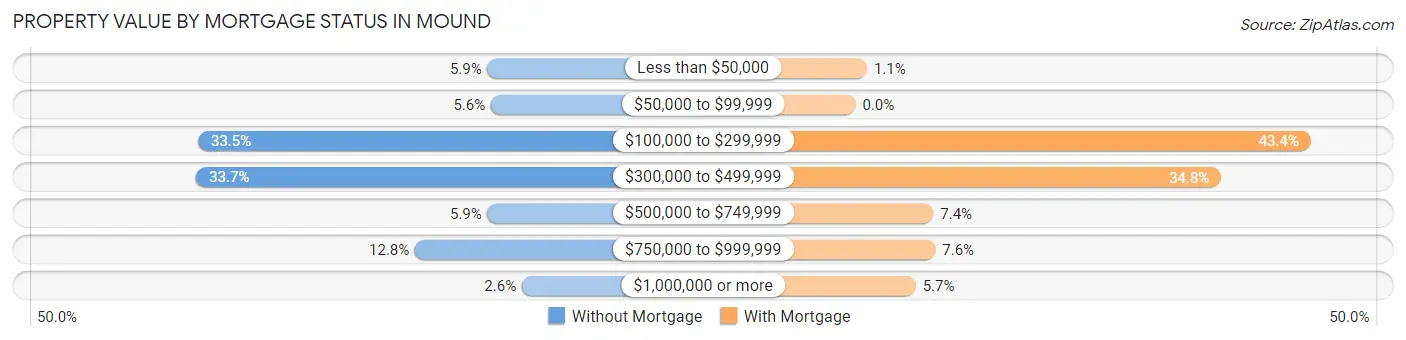
| Property Value | Without Mortgage | With Mortgage |
| Less than $50,000 | 36 (5.9%) | 29 (1.1%) |
| $50,000 to $99,999 | 34 (5.6%) | 0 (0.0%) |
| $100,000 to $299,999 | 204 (33.5%) | 1,158 (43.3%) |
| $300,000 to $499,999 | 205 (33.7%) | 930 (34.8%) |
| $500,000 to $749,999 | 36 (5.9%) | 198 (7.4%) |
| $750,000 to $999,999 | 78 (12.8%) | 203 (7.6%) |
| $1,000,000 or more | 16 (2.6%) | 153 (5.7%) |
| Total | 609 (100.0%) | 2,671 (100.0%) |
Household Income by Mortgage Status in Mound
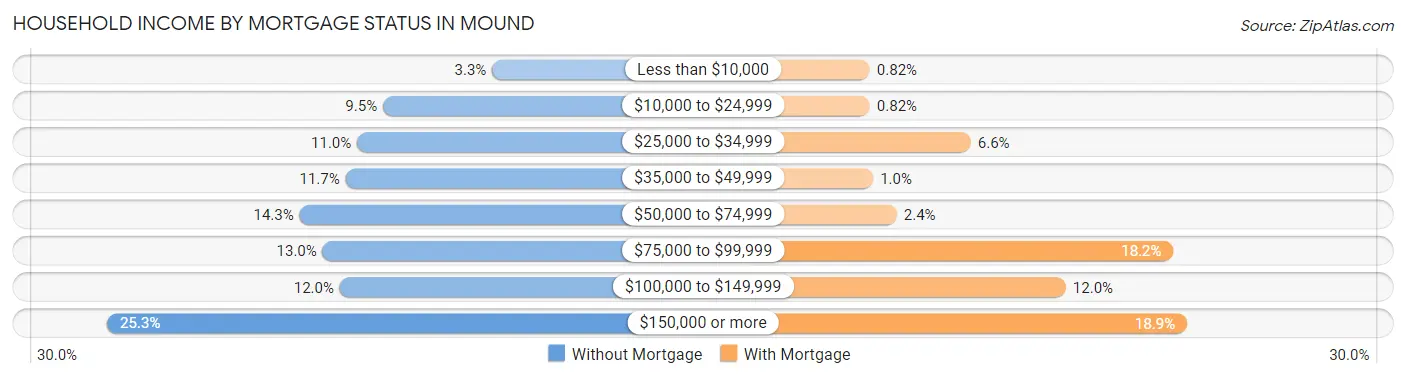
| Household Income | Without Mortgage | With Mortgage |
| Less than $10,000 | 20 (3.3%) | 22 (0.8%) |
| $10,000 to $24,999 | 58 (9.5%) | 22 (0.8%) |
| $25,000 to $34,999 | 67 (11.0%) | 176 (6.6%) |
| $35,000 to $49,999 | 71 (11.7%) | 27 (1.0%) |
| $50,000 to $74,999 | 87 (14.3%) | 63 (2.4%) |
| $75,000 to $99,999 | 79 (13.0%) | 485 (18.2%) |
| $100,000 to $149,999 | 73 (12.0%) | 321 (12.0%) |
| $150,000 or more | 154 (25.3%) | 506 (18.9%) |
| Total | 609 (100.0%) | 2,671 (100.0%) |
Property Value to Household Income Ratio in Mound
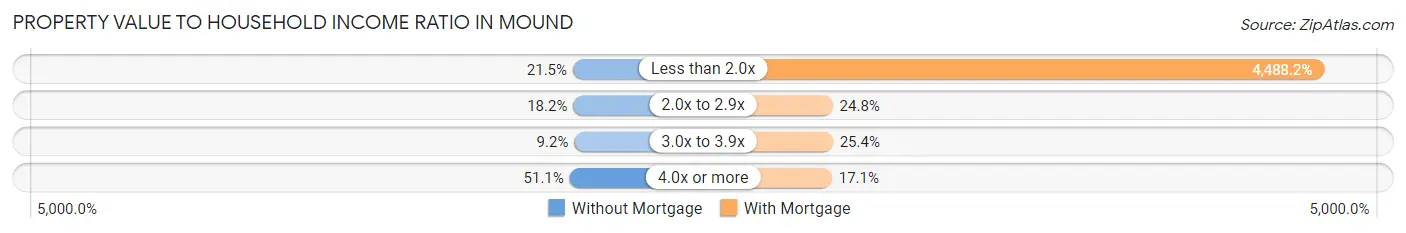
| Value-to-Income Ratio | Without Mortgage | With Mortgage |
| Less than 2.0x | 131 (21.5%) | 119,880 (4,488.2%) |
| 2.0x to 2.9x | 111 (18.2%) | 662 (24.8%) |
| 3.0x to 3.9x | 56 (9.2%) | 679 (25.4%) |
| 4.0x or more | 311 (51.1%) | 456 (17.1%) |
| Total | 609 (100.0%) | 2,671 (100.0%) |
Real Estate Taxes by Mortgage Status in Mound
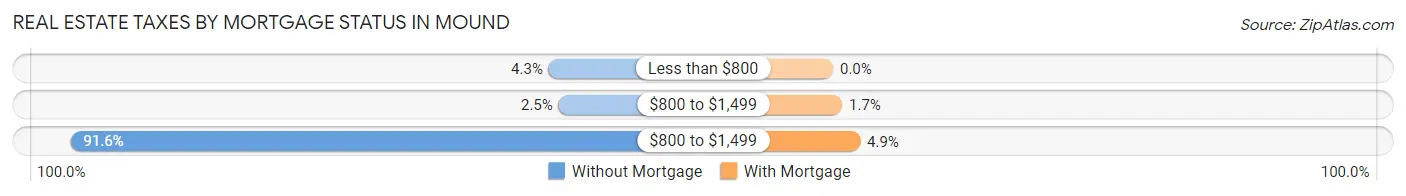
| Property Taxes | Without Mortgage | With Mortgage |
| Less than $800 | 26 (4.3%) | 0 (0.0%) |
| $800 to $1,499 | 15 (2.5%) | 44 (1.7%) |
| $800 to $1,499 | 558 (91.6%) | 132 (4.9%) |
| Total | 609 (100.0%) | 2,671 (100.0%) |
Health & Disability in Mound
Health Insurance Coverage by Age in Mound
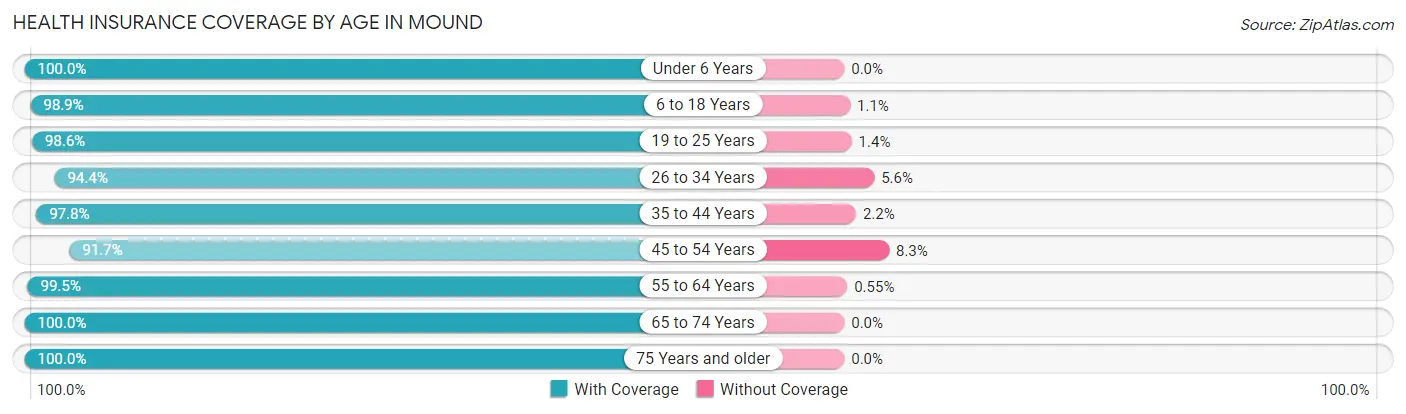
| Age Bracket | With Coverage | Without Coverage |
| Under 6 Years | 521 (100.0%) | 0 (0.0%) |
| 6 to 18 Years | 1,277 (98.9%) | 14 (1.1%) |
| 19 to 25 Years | 578 (98.6%) | 8 (1.4%) |
| 26 to 34 Years | 779 (94.4%) | 46 (5.6%) |
| 35 to 44 Years | 1,434 (97.8%) | 32 (2.2%) |
| 45 to 54 Years | 1,264 (91.7%) | 115 (8.3%) |
| 55 to 64 Years | 1,453 (99.5%) | 8 (0.5%) |
| 65 to 74 Years | 1,340 (100.0%) | 0 (0.0%) |
| 75 Years and older | 403 (100.0%) | 0 (0.0%) |
| Total | 9,049 (97.6%) | 223 (2.4%) |
Health Insurance Coverage by Citizenship Status in Mound
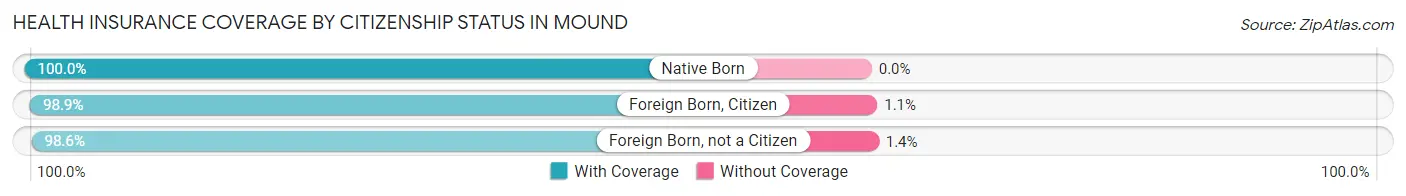
| Citizenship Status | With Coverage | Without Coverage |
| Native Born | 521 (100.0%) | 0 (0.0%) |
| Foreign Born, Citizen | 1,277 (98.9%) | 14 (1.1%) |
| Foreign Born, not a Citizen | 578 (98.6%) | 8 (1.4%) |
Health Insurance Coverage by Household Income in Mound
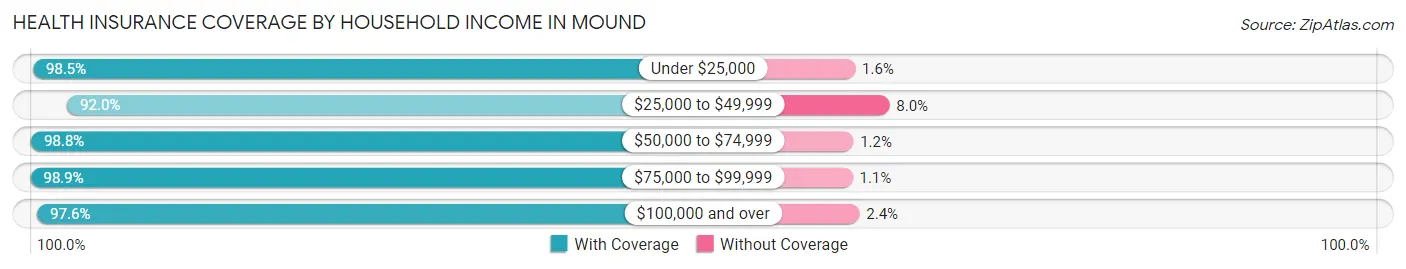
| Household Income | With Coverage | Without Coverage |
| Under $25,000 | 888 (98.5%) | 14 (1.5%) |
| $25,000 to $49,999 | 623 (92.0%) | 54 (8.0%) |
| $50,000 to $74,999 | 906 (98.8%) | 11 (1.2%) |
| $75,000 to $99,999 | 1,206 (98.9%) | 13 (1.1%) |
| $100,000 and over | 5,426 (97.6%) | 131 (2.4%) |
Public vs Private Health Insurance Coverage by Age in Mound
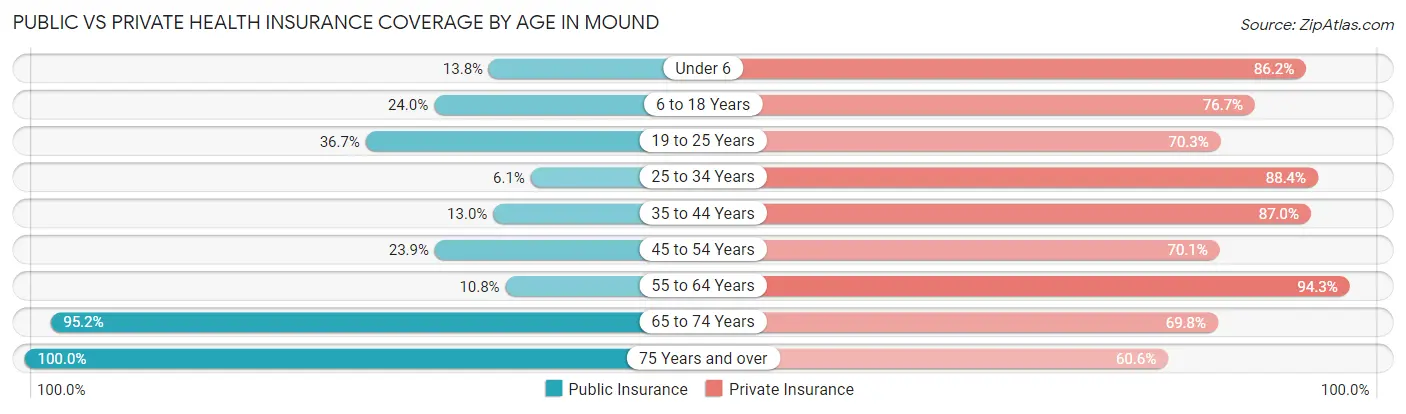
| Age Bracket | Public Insurance | Private Insurance |
| Under 6 | 72 (13.8%) | 449 (86.2%) |
| 6 to 18 Years | 310 (24.0%) | 990 (76.7%) |
| 19 to 25 Years | 215 (36.7%) | 412 (70.3%) |
| 25 to 34 Years | 50 (6.1%) | 729 (88.4%) |
| 35 to 44 Years | 191 (13.0%) | 1,276 (87.0%) |
| 45 to 54 Years | 329 (23.9%) | 967 (70.1%) |
| 55 to 64 Years | 157 (10.7%) | 1,377 (94.3%) |
| 65 to 74 Years | 1,276 (95.2%) | 935 (69.8%) |
| 75 Years and over | 403 (100.0%) | 244 (60.6%) |
| Total | 3,003 (32.4%) | 7,379 (79.6%) |
Disability Status by Sex by Age in Mound
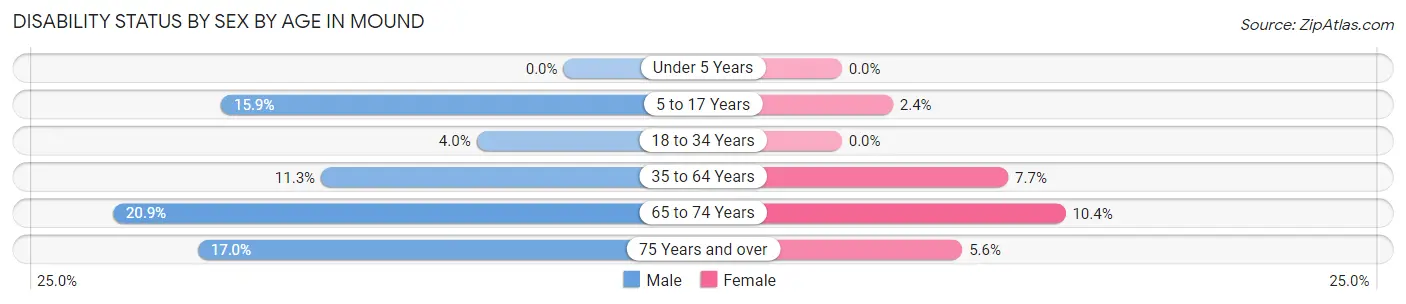
| Age Bracket | Male | Female |
| Under 5 Years | 0 (0.0%) | 0 (0.0%) |
| 5 to 17 Years | 107 (15.9%) | 15 (2.4%) |
| 18 to 34 Years | 36 (4.0%) | 0 (0.0%) |
| 35 to 64 Years | 276 (11.3%) | 143 (7.7%) |
| 65 to 74 Years | 111 (20.9%) | 84 (10.4%) |
| 75 Years and over | 38 (17.0%) | 10 (5.6%) |
Disability Class by Sex by Age in Mound
Disability Class: Hearing Difficulty
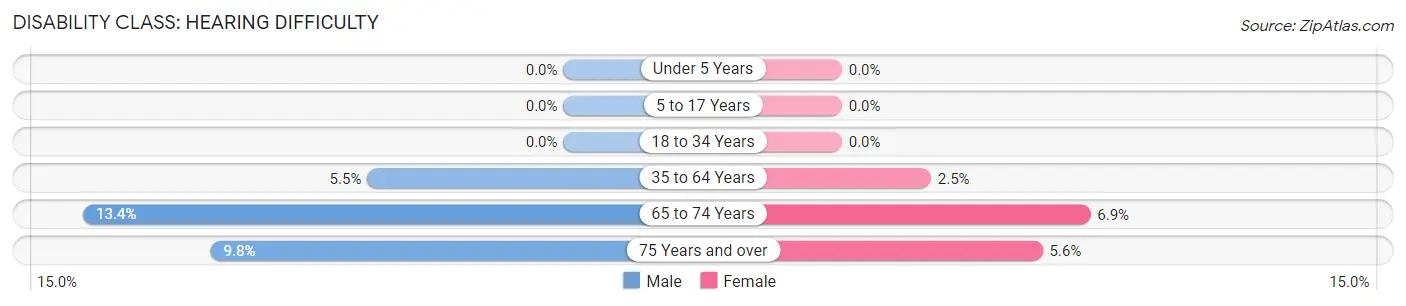
| Age Bracket | Male | Female |
| Under 5 Years | 0 (0.0%) | 0 (0.0%) |
| 5 to 17 Years | 0 (0.0%) | 0 (0.0%) |
| 18 to 34 Years | 0 (0.0%) | 0 (0.0%) |
| 35 to 64 Years | 134 (5.5%) | 46 (2.5%) |
| 65 to 74 Years | 71 (13.4%) | 56 (6.9%) |
| 75 Years and over | 22 (9.8%) | 10 (5.6%) |
Disability Class: Vision Difficulty
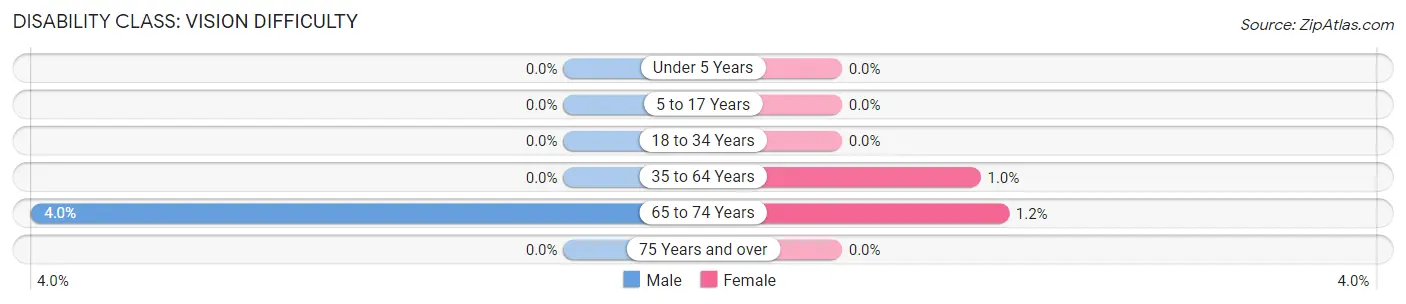
| Age Bracket | Male | Female |
| Under 5 Years | 0 (0.0%) | 0 (0.0%) |
| 5 to 17 Years | 0 (0.0%) | 0 (0.0%) |
| 18 to 34 Years | 0 (0.0%) | 0 (0.0%) |
| 35 to 64 Years | 0 (0.0%) | 19 (1.0%) |
| 65 to 74 Years | 21 (4.0%) | 10 (1.2%) |
| 75 Years and over | 0 (0.0%) | 0 (0.0%) |
Disability Class: Cognitive Difficulty
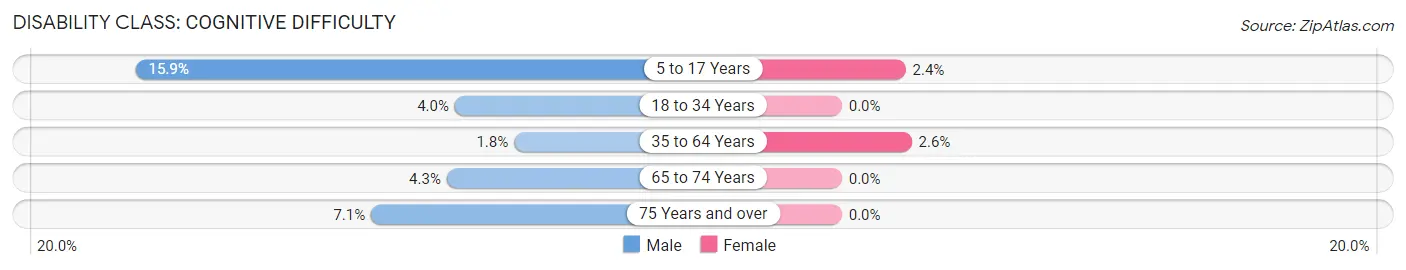
| Age Bracket | Male | Female |
| 5 to 17 Years | 107 (15.9%) | 15 (2.4%) |
| 18 to 34 Years | 36 (4.0%) | 0 (0.0%) |
| 35 to 64 Years | 45 (1.8%) | 48 (2.6%) |
| 65 to 74 Years | 23 (4.3%) | 0 (0.0%) |
| 75 Years and over | 16 (7.1%) | 0 (0.0%) |
Disability Class: Ambulatory Difficulty
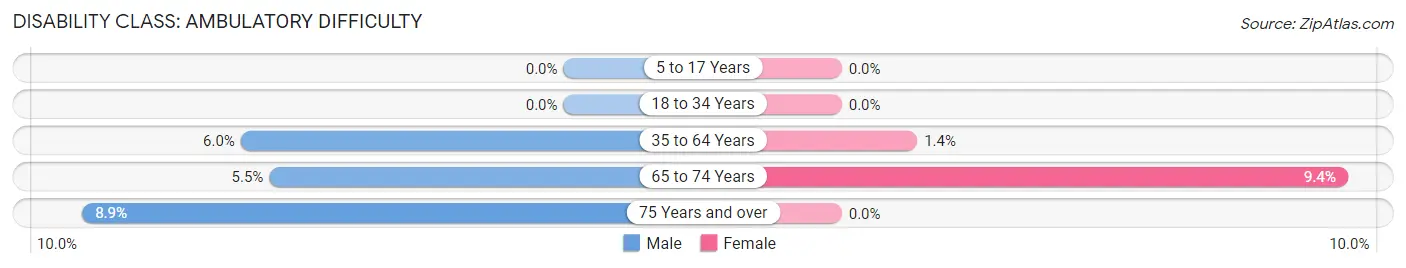
| Age Bracket | Male | Female |
| 5 to 17 Years | 0 (0.0%) | 0 (0.0%) |
| 18 to 34 Years | 0 (0.0%) | 0 (0.0%) |
| 35 to 64 Years | 147 (6.0%) | 26 (1.4%) |
| 65 to 74 Years | 29 (5.5%) | 76 (9.4%) |
| 75 Years and over | 20 (8.9%) | 0 (0.0%) |
Disability Class: Self-Care Difficulty
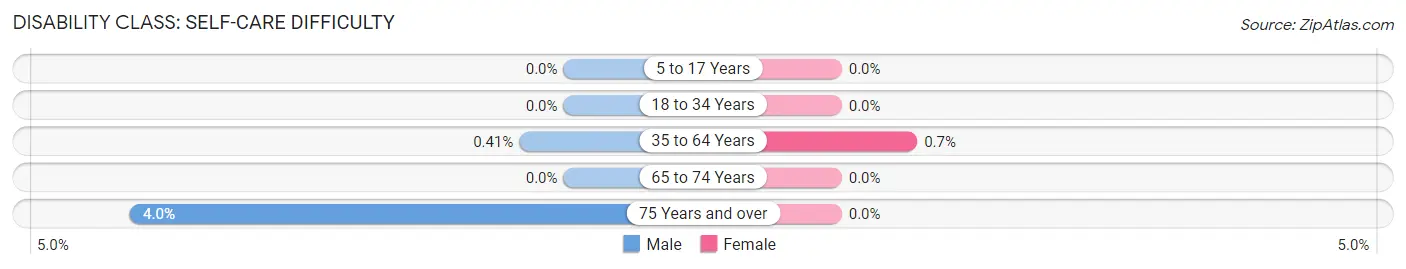
| Age Bracket | Male | Female |
| 5 to 17 Years | 0 (0.0%) | 0 (0.0%) |
| 18 to 34 Years | 0 (0.0%) | 0 (0.0%) |
| 35 to 64 Years | 10 (0.4%) | 13 (0.7%) |
| 65 to 74 Years | 0 (0.0%) | 0 (0.0%) |
| 75 Years and over | 9 (4.0%) | 0 (0.0%) |
Technology Access in Mound
Computing Device Access in Mound
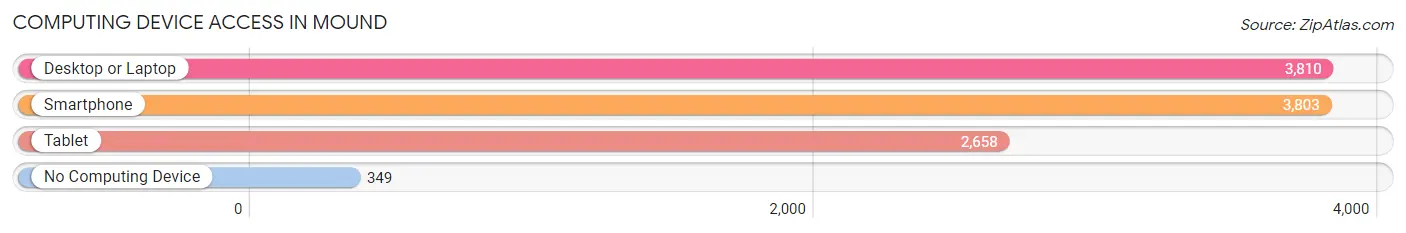
| Device Type | # Households | % Households |
| Desktop or Laptop | 3,810 | 86.3% |
| Smartphone | 3,803 | 86.2% |
| Tablet | 2,658 | 60.2% |
| No Computing Device | 349 | 7.9% |
| Total | 4,414 | 100.0% |
Internet Access in Mound
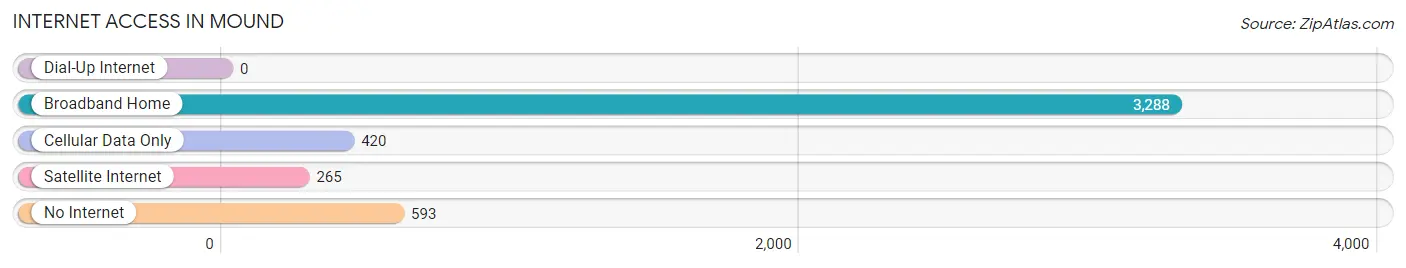
| Internet Type | # Households | % Households |
| Dial-Up Internet | 0 | 0.0% |
| Broadband Home | 3,288 | 74.5% |
| Cellular Data Only | 420 | 9.5% |
| Satellite Internet | 265 | 6.0% |
| No Internet | 593 | 13.4% |
| Total | 4,414 | 100.0% |
Mound Summary
Mound, Minnesota is a small city located in Hennepin County, Minnesota, United States. It is situated on the western shore of Lake Minnetonka, about 20 miles west of Minneapolis. The city was founded in 1853 and incorporated in 1858. As of the 2010 census, the population of Mound was 9,052.
History
Mound was first settled in 1853 by a group of settlers from New York. The settlers were attracted to the area by the abundance of natural resources, including timber, fish, and wild game. The settlers named the area Mound because of the large number of Native American burial mounds in the area.
In 1858, Mound was officially incorporated as a village. The village was named after the nearby Native American burial mounds. The first mayor of Mound was William H. Brown.
In the late 19th century, Mound became a popular summer resort destination for wealthy Minnesotans. The city was home to several large resorts, including the Mound House, the Mound Hotel, and the Mound Park Hotel.
In the early 20th century, Mound became a popular destination for boaters and fishermen. The city was home to several marinas, including the Mound Marina, the Mound Yacht Club, and the Mound Boat Club.
In the 1950s, Mound began to experience rapid growth as a suburb of Minneapolis. The city was home to several large businesses, including the Mound Manufacturing Company, the Mound Tool Company, and the Mound Plastics Company.
Geography
Mound is located in Hennepin County, Minnesota, United States. It is situated on the western shore of Lake Minnetonka, about 20 miles west of Minneapolis. The city has a total area of 4.2 square miles, all of which is land.
The city is located in the Minneapolis-St. Paul metropolitan area. The city is bordered by the cities of Minnetonka, Spring Park, and Orono.
Economy
Mound is home to several large businesses, including the Mound Manufacturing Company, the Mound Tool Company, and the Mound Plastics Company. The city is also home to several small businesses, including restaurants, retail stores, and professional services.
The city is home to several large employers, including the Mound Manufacturing Company, the Mound Tool Company, and the Mound Plastics Company. The city is also home to several small employers, including restaurants, retail stores, and professional services.
Demographics
As of the 2010 census, the population of Mound was 9,052. The racial makeup of the city was 94.2% White, 1.3% African American, 0.3% Native American, 1.7% Asian, 0.1% Pacific Islander, 0.9% from other races, and 1.7% from two or more races. Hispanic or Latino of any race were 2.7% of the population.
The median income for a household in Mound was $68,945, and the median income for a family was $77,945. The per capita income for the city was $32,945. About 3.2% of families and 4.3% of the population were below the poverty line, including 5.2% of those under age 18 and 4.2% of those age 65 or over.
Common Questions
What is Per Capita Income in Mound?
Per Capita income in Mound is $62,145.
What is the Median Family Income in Mound?
Median Family Income in Mound is $129,146.
What is the Median Household income in Mound?
Median Household Income in Mound is $89,855.
What is Income or Wage Gap in Mound?
Income or Wage Gap in Mound is 22.2%.
Women in Mound earn 77.8 cents for every dollar earned by a man.
What is Inequality or Gini Index in Mound?
Inequality or Gini Index in Mound is 0.48.
What is the Total Population of Mound?
Total Population of Mound is 9,272.
What is the Total Male Population of Mound?
Total Male Population of Mound is 5,022.
What is the Total Female Population of Mound?
Total Female Population of Mound is 4,250.
What is the Ratio of Males per 100 Females in Mound?
There are 118.16 Males per 100 Females in Mound.
What is the Ratio of Females per 100 Males in Mound?
There are 84.63 Females per 100 Males in Mound.
What is the Median Population Age in Mound?
Median Population Age in Mound is 44.6 Years.
What is the Average Family Size in Mound
Average Family Size in Mound is 2.8 People.
What is the Average Household Size in Mound
Average Household Size in Mound is 2.1 People.
How Large is the Labor Force in Mound?
There are 5,334 People in the Labor Forcein in Mound.
What is the Percentage of People in the Labor Force in Mound?
69.4% of People are in the Labor Force in Mound.
What is the Unemployment Rate in Mound?
Unemployment Rate in Mound is 3.6%.