Afton, MN Map & Demographics
Afton Map
Afton Overview
$70,978
PER CAPITA INCOME
$156,466
AVG FAMILY INCOME
$124,159
AVG HOUSEHOLD INCOME
72.2%
WAGE / INCOME GAP [ % ]
27.8¢/ $1
WAGE / INCOME GAP [ $ ]
0.43
INEQUALITY / GINI INDEX
2,951
TOTAL POPULATION
1,572
MALE POPULATION
1,379
FEMALE POPULATION
114.00
MALES / 100 FEMALES
87.72
FEMALES / 100 MALES
50.4
MEDIAN AGE
3.0
AVG FAMILY SIZE
2.5
AVG HOUSEHOLD SIZE
1,376
LABOR FORCE [ PEOPLE ]
56.4%
PERCENT IN LABOR FORCE
2.3%
UNEMPLOYMENT RATE
Afton Zip Codes
Afton Area Codes
Income in Afton
Income Overview in Afton
Per Capita Income in Afton is $70,978, while median incomes of families and households are $156,466 and $124,159 respectively.
| Characteristic | Number | Measure |
| Per Capita Income | 2,951 | $70,978 |
| Median Family Income | 850 | $156,466 |
| Mean Family Income | 850 | $201,721 |
| Median Household Income | 1,167 | $124,159 |
| Mean Household Income | 1,167 | $176,360 |
| Income Deficit | 850 | $0 |
| Wage / Income Gap (%) | 2,951 | 72.17% |
| Wage / Income Gap ($) | 2,951 | 27.83¢ per $1 |
| Gini / Inequality Index | 2,951 | 0.43 |
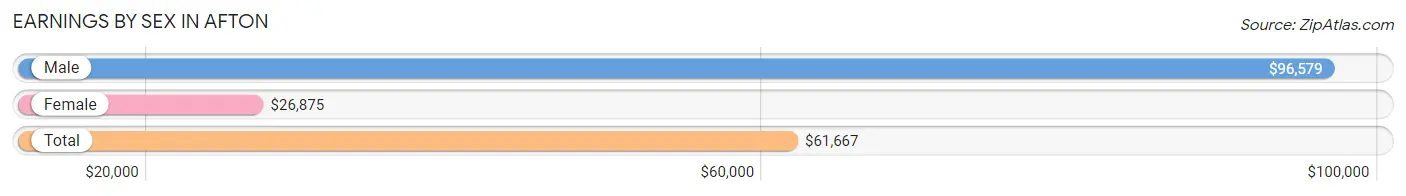
Earnings by Sex in Afton
Average Earnings in Afton are $61,667, $96,579 for men and $26,875 for women, a difference of 72.2%.
| Sex | Number | Average Earnings |
| Male | 822 (54.5%) | $96,579 |
| Female | 686 (45.5%) | $26,875 |
| Total | 1,508 (100.0%) | $61,667 |
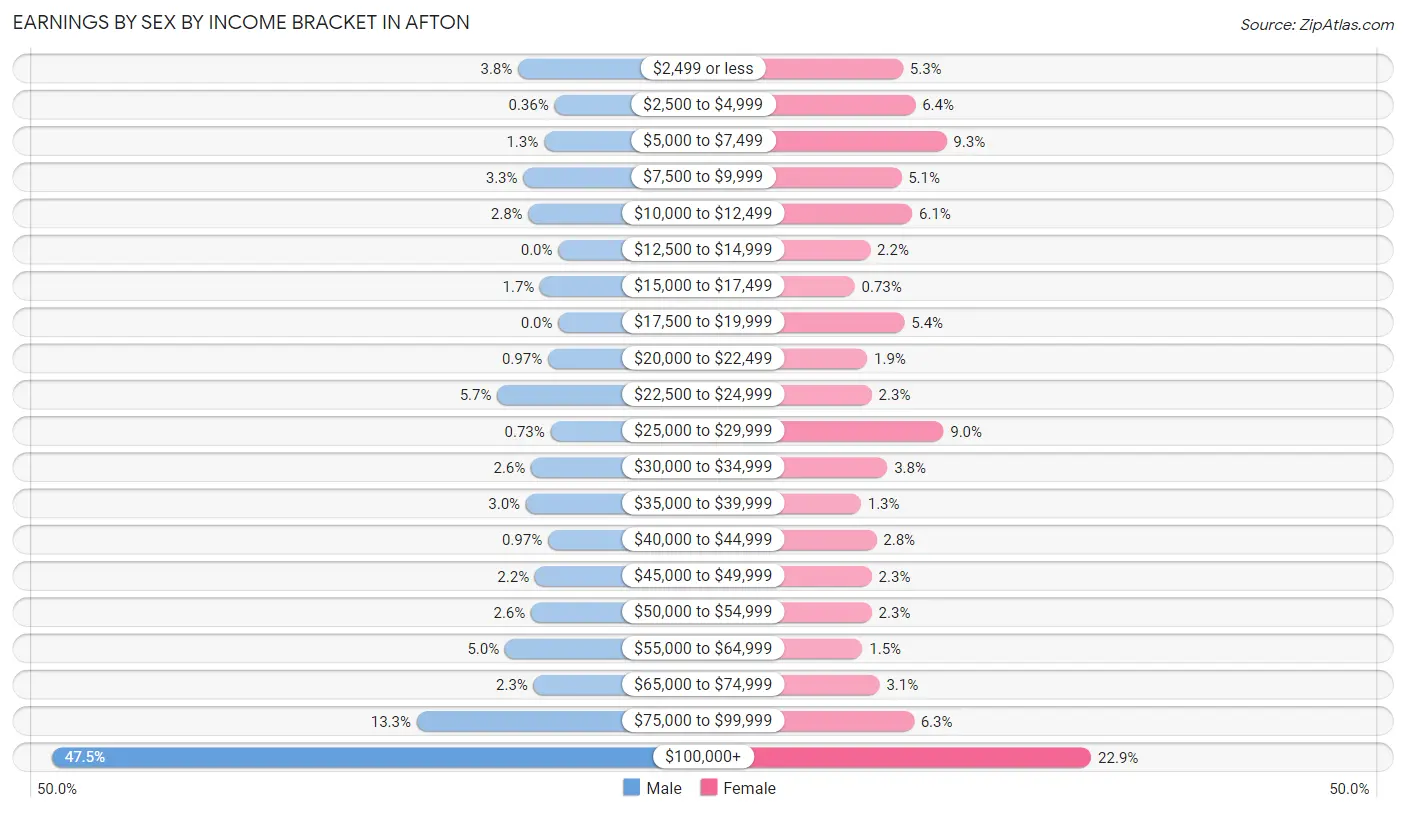
Earnings by Sex by Income Bracket in Afton
The most common earnings brackets in Afton are $100,000+ for men (390 | 47.4%) and $100,000+ for women (157 | 22.9%).
| Income | Male | Female |
| $2,499 or less | 31 (3.8%) | 36 (5.2%) |
| $2,500 to $4,999 | 3 (0.4%) | 44 (6.4%) |
| $5,000 to $7,499 | 11 (1.3%) | 64 (9.3%) |
| $7,500 to $9,999 | 27 (3.3%) | 35 (5.1%) |
| $10,000 to $12,499 | 23 (2.8%) | 42 (6.1%) |
| $12,500 to $14,999 | 0 (0.0%) | 15 (2.2%) |
| $15,000 to $17,499 | 14 (1.7%) | 5 (0.7%) |
| $17,500 to $19,999 | 0 (0.0%) | 37 (5.4%) |
| $20,000 to $22,499 | 8 (1.0%) | 13 (1.9%) |
| $22,500 to $24,999 | 47 (5.7%) | 16 (2.3%) |
| $25,000 to $29,999 | 6 (0.7%) | 62 (9.0%) |
| $30,000 to $34,999 | 21 (2.5%) | 26 (3.8%) |
| $35,000 to $39,999 | 25 (3.0%) | 9 (1.3%) |
| $40,000 to $44,999 | 8 (1.0%) | 19 (2.8%) |
| $45,000 to $49,999 | 18 (2.2%) | 16 (2.3%) |
| $50,000 to $54,999 | 21 (2.5%) | 16 (2.3%) |
| $55,000 to $64,999 | 41 (5.0%) | 10 (1.5%) |
| $65,000 to $74,999 | 19 (2.3%) | 21 (3.1%) |
| $75,000 to $99,999 | 109 (13.3%) | 43 (6.3%) |
| $100,000+ | 390 (47.4%) | 157 (22.9%) |
| Total | 822 (100.0%) | 686 (100.0%) |
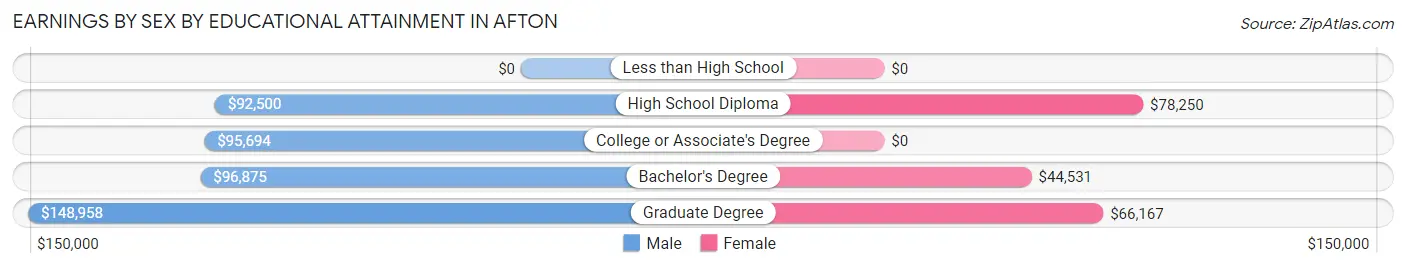
Earnings by Sex by Educational Attainment in Afton
Average earnings in Afton are $100,795 for men and $31,094 for women, a difference of 69.2%. Men with an educational attainment of graduate degree enjoy the highest average annual earnings of $148,958, while those with high school diploma education earn the least with $92,500. Women with an educational attainment of high school diploma earn the most with the average annual earnings of $78,250, while those with bachelor's degree education have the smallest earnings of $44,531.
| Educational Attainment | Male Income | Female Income |
| Less than High School | - | - |
| High School Diploma | $92,500 | $78,250 |
| College or Associate's Degree | $95,694 | $0 |
| Bachelor's Degree | $96,875 | $44,531 |
| Graduate Degree | $148,958 | $66,167 |
| Total | $100,795 | $31,094 |
Family Income in Afton
Family Income Brackets in Afton
According to the Afton family income data, there are 300 families falling into the $200,000+ income range, which is the most common income bracket and makes up 35.3% of all families.
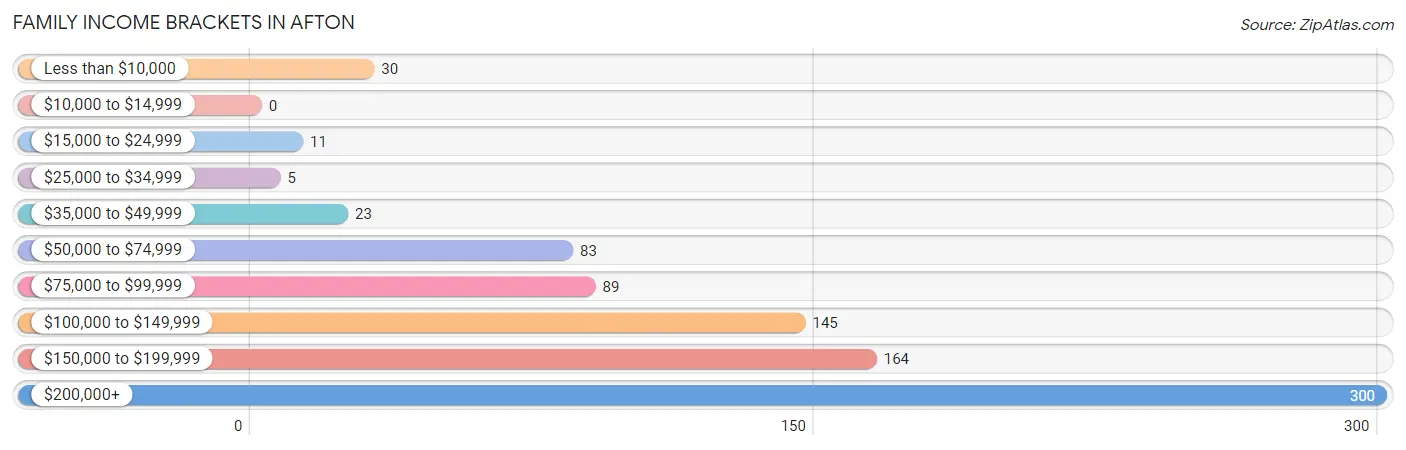
| Income Bracket | # Families | % Families |
| Less than $10,000 | 30 | 3.5% |
| $10,000 to $14,999 | 0 | 0.0% |
| $15,000 to $24,999 | 11 | 1.3% |
| $25,000 to $34,999 | 5 | 0.6% |
| $35,000 to $49,999 | 23 | 2.7% |
| $50,000 to $74,999 | 83 | 9.8% |
| $75,000 to $99,999 | 89 | 10.5% |
| $100,000 to $149,999 | 145 | 17.1% |
| $150,000 to $199,999 | 164 | 19.3% |
| $200,000+ | 300 | 35.3% |
Family Income by Famaliy Size in Afton
6-person families (33 | 3.9%) account for the highest median family income in Afton with $250,001 per family, while 2-person families (471 | 55.4%) have the highest median income of $57,458 per family member.
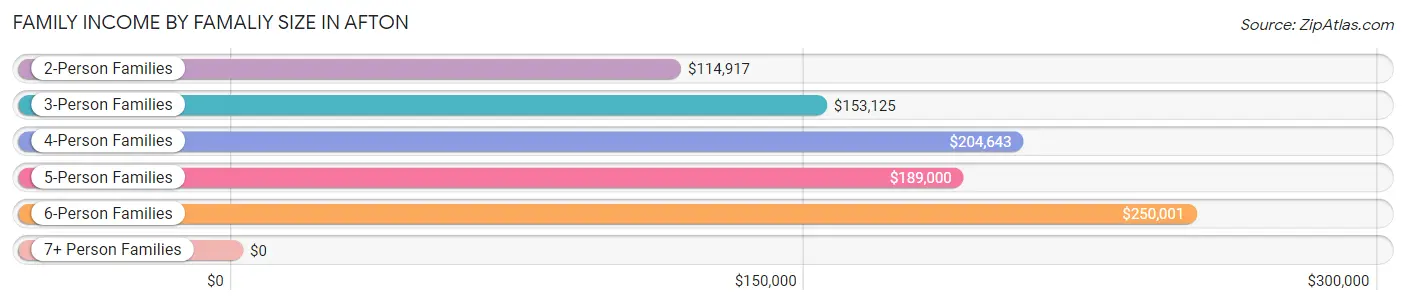
| Income Bracket | # Families | Median Income |
| 2-Person Families | 471 (55.4%) | $114,917 |
| 3-Person Families | 122 (14.3%) | $153,125 |
| 4-Person Families | 150 (17.6%) | $204,643 |
| 5-Person Families | 70 (8.2%) | $189,000 |
| 6-Person Families | 33 (3.9%) | $250,001 |
| 7+ Person Families | 4 (0.5%) | $0 |
| Total | 850 (100.0%) | $156,466 |
Family Income by Number of Earners in Afton
The median family income in Afton is $156,466, with families comprising 2 earners (363) having the highest median family income of $187,614, while families with no earners (210) have the lowest median family income of $79,833, accounting for 42.7% and 24.7% of families, respectively.
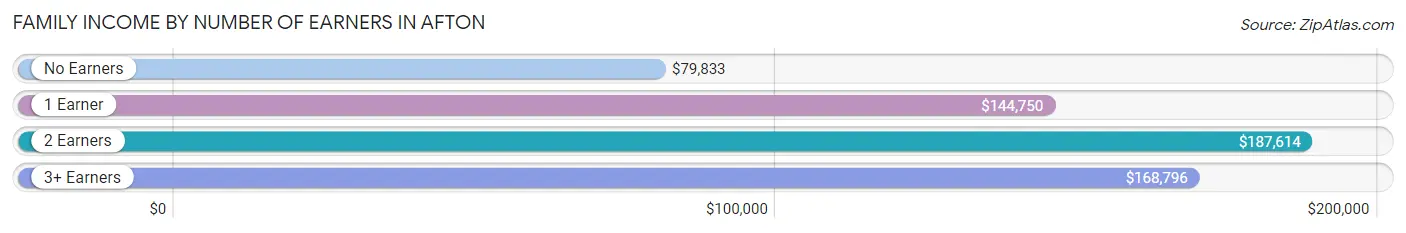
| Number of Earners | # Families | Median Income |
| No Earners | 210 (24.7%) | $79,833 |
| 1 Earner | 175 (20.6%) | $144,750 |
| 2 Earners | 363 (42.7%) | $187,614 |
| 3+ Earners | 102 (12.0%) | $168,796 |
| Total | 850 (100.0%) | $156,466 |
Household Income in Afton
Household Income Brackets in Afton
With 320 households falling in the category, the $200,000+ income range is the most frequent in Afton, accounting for 27.4% of all households. In contrast, only 7 households (0.6%) fall into the $10,000 to $14,999 income bracket, making it the least populous group.
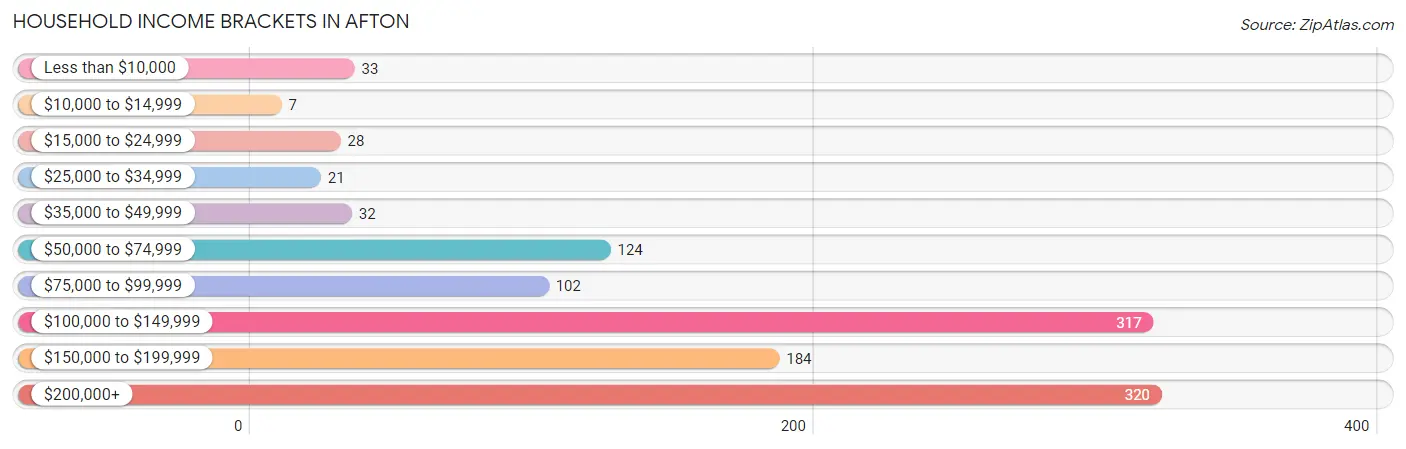
| Income Bracket | # Households | % Households |
| Less than $10,000 | 33 | 2.8% |
| $10,000 to $14,999 | 7 | 0.6% |
| $15,000 to $24,999 | 28 | 2.4% |
| $25,000 to $34,999 | 21 | 1.8% |
| $35,000 to $49,999 | 32 | 2.7% |
| $50,000 to $74,999 | 124 | 10.6% |
| $75,000 to $99,999 | 102 | 8.7% |
| $100,000 to $149,999 | 317 | 27.2% |
| $150,000 to $199,999 | 184 | 15.8% |
| $200,000+ | 320 | 27.4% |
Household Income by Householder Age in Afton
The median household income in Afton is $124,159, with the highest median household income of $166,500 found in the 25 to 44 years age bracket for the primary householder. A total of 226 households (19.4%) fall into this category. Meanwhile, the 15 to 24 years age bracket for the primary householder has the lowest median household income of $0, with 4 households (0.3%) in this group.
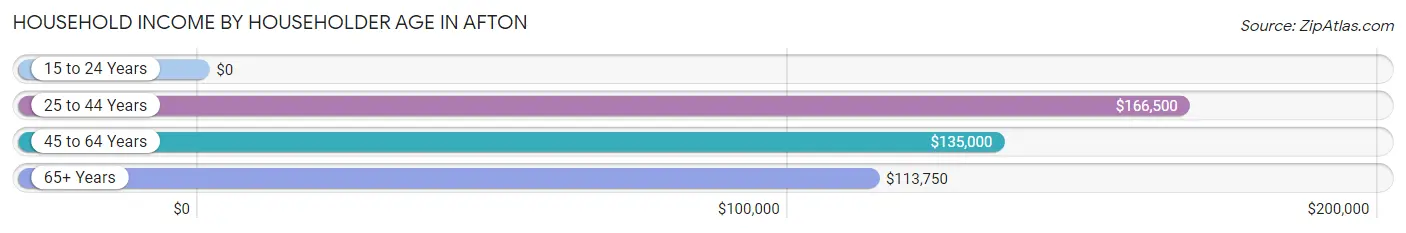
| Income Bracket | # Households | Median Income |
| 15 to 24 Years | 4 (0.3%) | $0 |
| 25 to 44 Years | 226 (19.4%) | $166,500 |
| 45 to 64 Years | 528 (45.2%) | $135,000 |
| 65+ Years | 409 (35.0%) | $113,750 |
| Total | 1,167 (100.0%) | $124,159 |
Poverty in Afton
Income Below Poverty by Sex and Age in Afton
With 8.1% poverty level for males and 1.0% for females among the residents of Afton, 18 to 24 year old males and 35 to 44 year old females are the most vulnerable to poverty, with 28 males (50.9%) and 5 females (4.2%) in their respective age groups living below the poverty level.
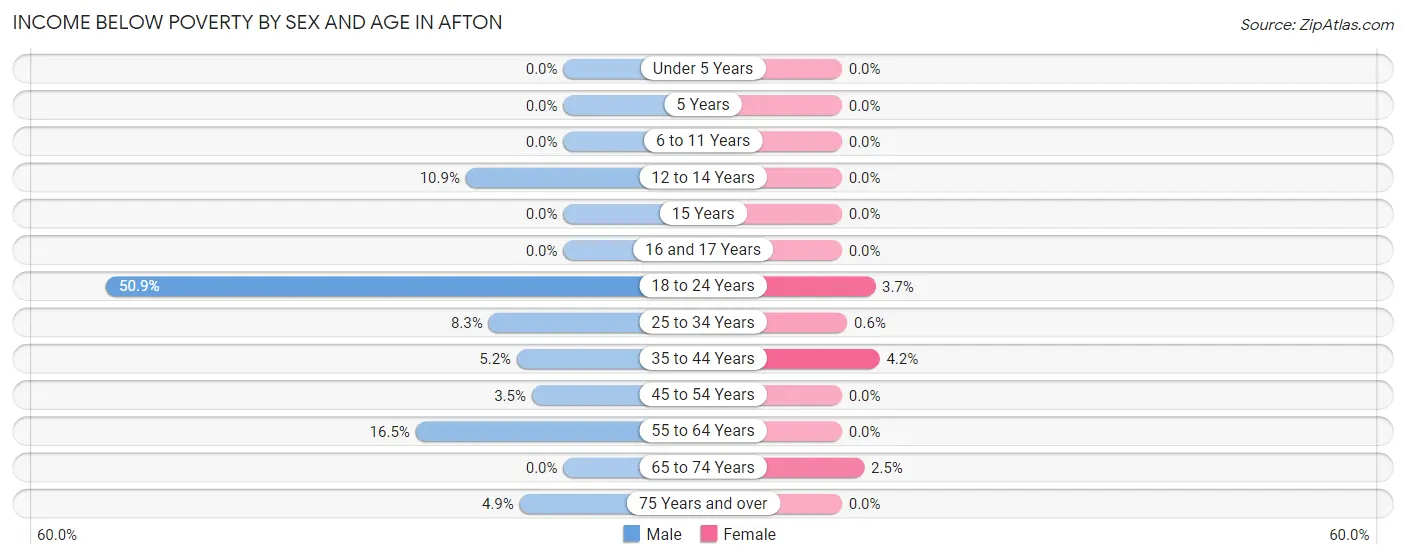
| Age Bracket | Male | Female |
| Under 5 Years | 0 (0.0%) | 0 (0.0%) |
| 5 Years | 0 (0.0%) | 0 (0.0%) |
| 6 to 11 Years | 0 (0.0%) | 0 (0.0%) |
| 12 to 14 Years | 5 (10.9%) | 0 (0.0%) |
| 15 Years | 0 (0.0%) | 0 (0.0%) |
| 16 and 17 Years | 0 (0.0%) | 0 (0.0%) |
| 18 to 24 Years | 28 (50.9%) | 3 (3.7%) |
| 25 to 34 Years | 12 (8.3%) | 1 (0.6%) |
| 35 to 44 Years | 9 (5.2%) | 5 (4.2%) |
| 45 to 54 Years | 6 (3.5%) | 0 (0.0%) |
| 55 to 64 Years | 62 (16.5%) | 0 (0.0%) |
| 65 to 74 Years | 0 (0.0%) | 5 (2.5%) |
| 75 Years and over | 6 (4.9%) | 0 (0.0%) |
| Total | 128 (8.1%) | 14 (1.0%) |
Income Above Poverty by Sex and Age in Afton
According to the poverty statistics in Afton, males aged under 5 years and females aged under 5 years are the age groups that are most secure financially, with 100.0% of males and 100.0% of females in these age groups living above the poverty line.
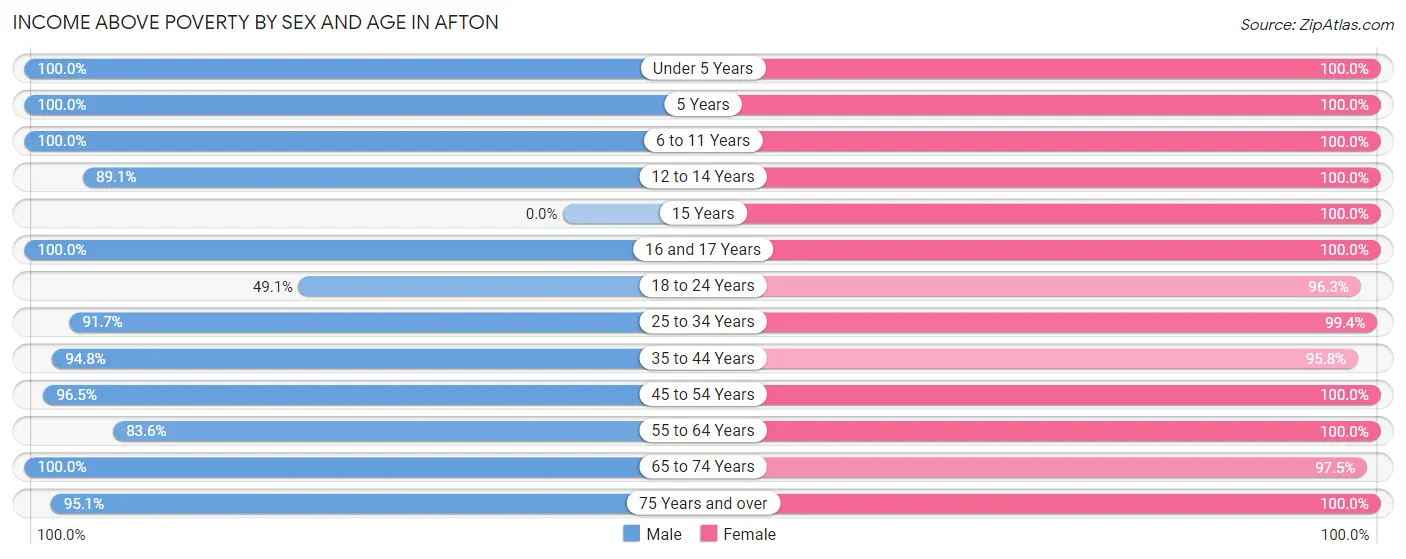
| Age Bracket | Male | Female |
| Under 5 Years | 77 (100.0%) | 62 (100.0%) |
| 5 Years | 13 (100.0%) | 4 (100.0%) |
| 6 to 11 Years | 96 (100.0%) | 156 (100.0%) |
| 12 to 14 Years | 41 (89.1%) | 46 (100.0%) |
| 15 Years | 0 (0.0%) | 9 (100.0%) |
| 16 and 17 Years | 28 (100.0%) | 24 (100.0%) |
| 18 to 24 Years | 27 (49.1%) | 78 (96.3%) |
| 25 to 34 Years | 132 (91.7%) | 167 (99.4%) |
| 35 to 44 Years | 165 (94.8%) | 114 (95.8%) |
| 45 to 54 Years | 165 (96.5%) | 131 (100.0%) |
| 55 to 64 Years | 315 (83.6%) | 269 (100.0%) |
| 65 to 74 Years | 268 (100.0%) | 197 (97.5%) |
| 75 Years and over | 117 (95.1%) | 99 (100.0%) |
| Total | 1,444 (91.9%) | 1,356 (99.0%) |
Income Below Poverty Among Married-Couple Families in Afton
The poverty statistics for married-couple families in Afton show that 1.4% or 11 of the total 777 families live below the poverty line. Families with 1 or 2 children have the highest poverty rate of 4.0%, comprising of 6 families. On the other hand, families with 3 or 4 children have the lowest poverty rate of 0.0%, which includes 0 families.
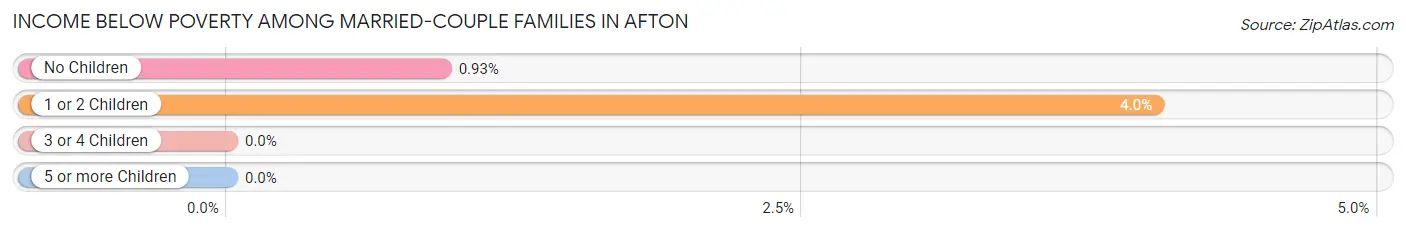
| Children | Above Poverty | Below Poverty |
| No Children | 531 (99.1%) | 5 (0.9%) |
| 1 or 2 Children | 143 (96.0%) | 6 (4.0%) |
| 3 or 4 Children | 88 (100.0%) | 0 (0.0%) |
| 5 or more Children | 4 (100.0%) | 0 (0.0%) |
| Total | 766 (98.6%) | 11 (1.4%) |
Income Below Poverty Among Single-Parent Households in Afton
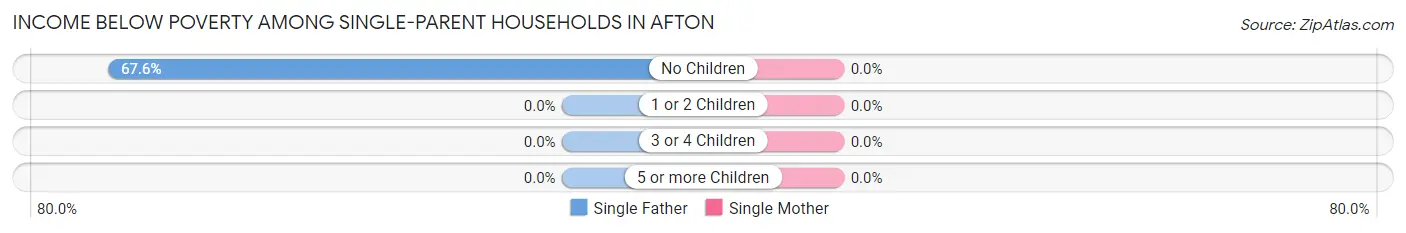
| Children | Single Father | Single Mother |
| No Children | 25 (67.6%) | 0 (0.0%) |
| 1 or 2 Children | 0 (0.0%) | 0 (0.0%) |
| 3 or 4 Children | 0 (0.0%) | 0 (0.0%) |
| 5 or more Children | 0 (0.0%) | 0 (0.0%) |
| Total | 25 (59.5%) | 0 (0.0%) |
Income Below Poverty Among Married-Couple vs Single-Parent Households in Afton
The poverty data for Afton shows that 11 of the married-couple family households (1.4%) and 25 of the single-parent households (34.3%) are living below the poverty level. Within the married-couple family households, those with 1 or 2 children have the highest poverty rate, with 6 households (4.0%) falling below the poverty line. Among the single-parent households, those with no children have the highest poverty rate, with 25 household (39.1%) living below poverty.
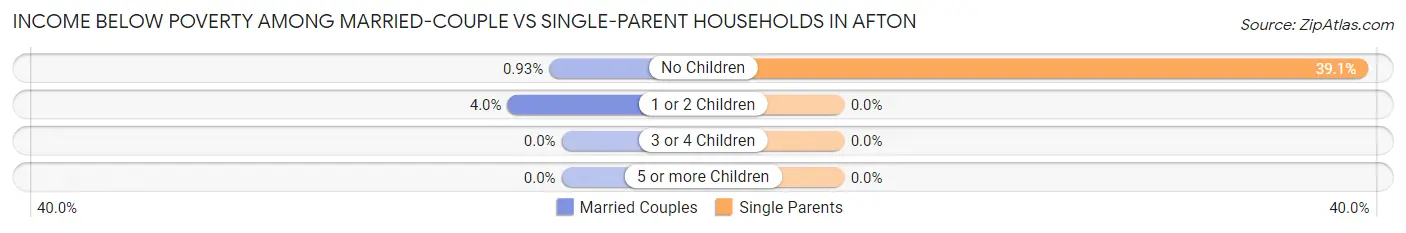
| Children | Married-Couple Families | Single-Parent Households |
| No Children | 5 (0.9%) | 25 (39.1%) |
| 1 or 2 Children | 6 (4.0%) | 0 (0.0%) |
| 3 or 4 Children | 0 (0.0%) | 0 (0.0%) |
| 5 or more Children | 0 (0.0%) | 0 (0.0%) |
| Total | 11 (1.4%) | 25 (34.3%) |
Race in Afton
The most populous races in Afton are White / Caucasian (2,686 | 91.0%), Two or more Races (139 | 4.7%), and Asian (109 | 3.7%).
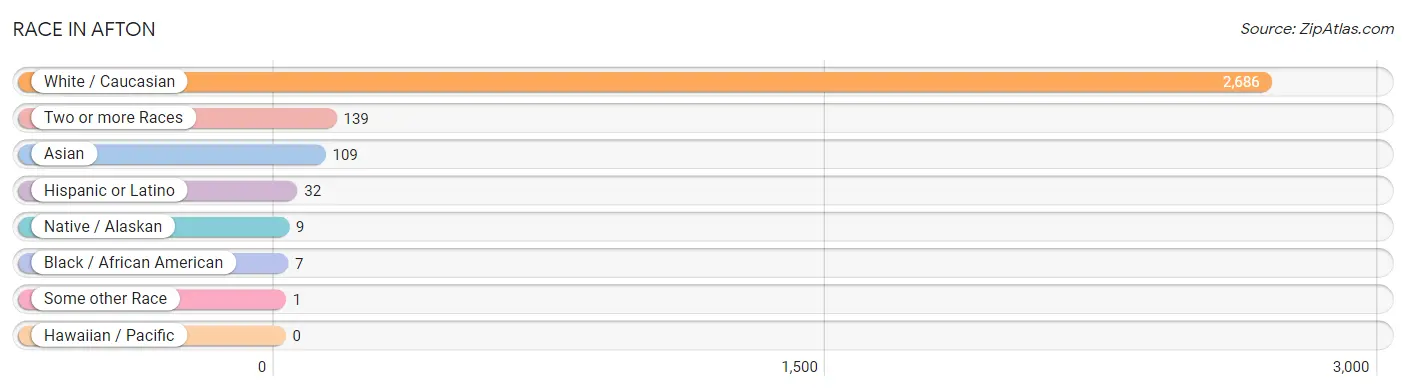
| Race | # Population | % Population |
| Asian | 109 | 3.7% |
| Black / African American | 7 | 0.2% |
| Hawaiian / Pacific | 0 | 0.0% |
| Hispanic or Latino | 32 | 1.1% |
| Native / Alaskan | 9 | 0.3% |
| White / Caucasian | 2,686 | 91.0% |
| Two or more Races | 139 | 4.7% |
| Some other Race | 1 | 0.0% |
| Total | 2,951 | 100.0% |
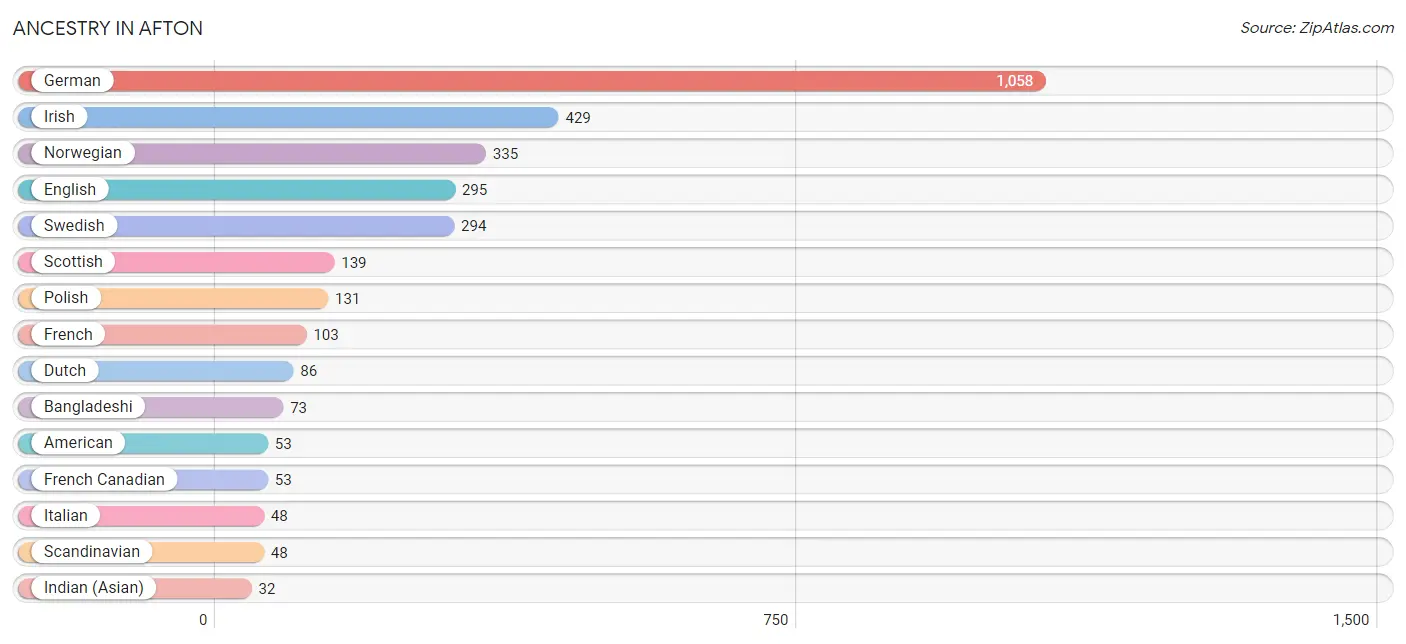
Ancestry in Afton
The most populous ancestries reported in Afton are German (1,058 | 35.8%), Irish (429 | 14.5%), Norwegian (335 | 11.4%), English (295 | 10.0%), and Swedish (294 | 10.0%), together accounting for 81.7% of all Afton residents.
| Ancestry | # Population | % Population |
| American | 53 | 1.8% |
| Austrian | 12 | 0.4% |
| Bangladeshi | 73 | 2.5% |
| British | 10 | 0.3% |
| Burmese | 13 | 0.4% |
| Canadian | 3 | 0.1% |
| Central American | 2 | 0.1% |
| Chippewa | 10 | 0.3% |
| Choctaw | 2 | 0.1% |
| Cuban | 21 | 0.7% |
| Czech | 28 | 0.9% |
| Danish | 18 | 0.6% |
| Dutch | 86 | 2.9% |
| Eastern European | 14 | 0.5% |
| English | 295 | 10.0% |
| Ethiopian | 3 | 0.1% |
| European | 26 | 0.9% |
| Finnish | 6 | 0.2% |
| French | 103 | 3.5% |
| French Canadian | 53 | 1.8% |
| German | 1,058 | 35.8% |
| Indian (Asian) | 32 | 1.1% |
| Iranian | 10 | 0.3% |
| Irish | 429 | 14.5% |
| Iroquois | 26 | 0.9% |
| Italian | 48 | 1.6% |
| Lithuanian | 4 | 0.1% |
| Luxembourger | 5 | 0.2% |
| Macedonian | 4 | 0.1% |
| Mexican | 9 | 0.3% |
| Northern European | 16 | 0.5% |
| Norwegian | 335 | 11.4% |
| Panamanian | 2 | 0.1% |
| Polish | 131 | 4.4% |
| Portuguese | 9 | 0.3% |
| Russian | 20 | 0.7% |
| Scandinavian | 48 | 1.6% |
| Scotch-Irish | 11 | 0.4% |
| Scottish | 139 | 4.7% |
| Sri Lankan | 9 | 0.3% |
| Subsaharan African | 3 | 0.1% |
| Swedish | 294 | 10.0% |
| Swiss | 19 | 0.6% |
| Ukrainian | 14 | 0.5% |
| Welsh | 22 | 0.7% | View All 45 Rows |
Immigrants in Afton
The most numerous immigrant groups reported in Afton came from Canada (91 | 3.1%), Asia (62 | 2.1%), South Eastern Asia (58 | 2.0%), Thailand (39 | 1.3%), and Europe (31 | 1.1%), together accounting for 9.5% of all Afton residents.
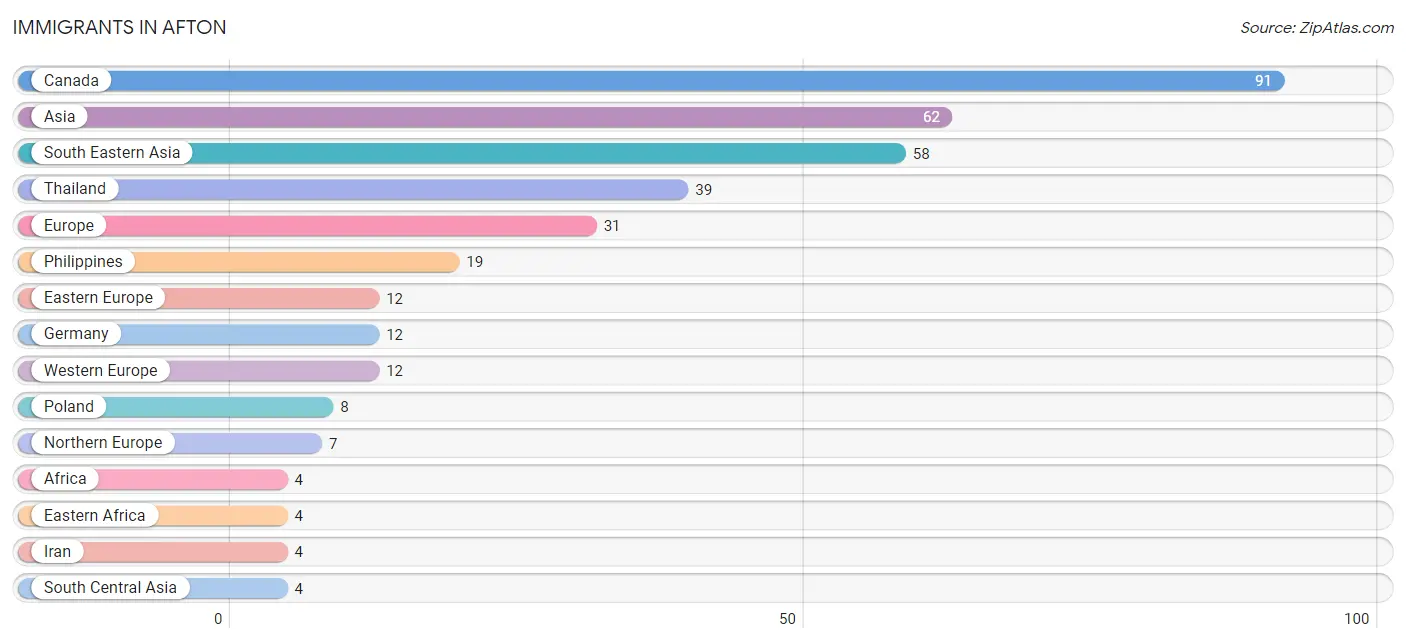
| Immigration Origin | # Population | % Population |
| Africa | 4 | 0.1% |
| Asia | 62 | 2.1% |
| Canada | 91 | 3.1% |
| Eastern Africa | 4 | 0.1% |
| Eastern Europe | 12 | 0.4% |
| Ethiopia | 3 | 0.1% |
| Europe | 31 | 1.1% |
| Germany | 12 | 0.4% |
| Iran | 4 | 0.1% |
| Northern Europe | 7 | 0.2% |
| Philippines | 19 | 0.6% |
| Poland | 8 | 0.3% |
| Somalia | 1 | 0.0% |
| South Central Asia | 4 | 0.1% |
| South Eastern Asia | 58 | 2.0% |
| Thailand | 39 | 1.3% |
| Western Europe | 12 | 0.4% | View All 17 Rows |
Sex and Age in Afton
Sex and Age in Afton
The most populous age groups in Afton are 60 to 64 Years (249 | 15.8%) for men and 60 to 64 Years (136 | 9.9%) for women.
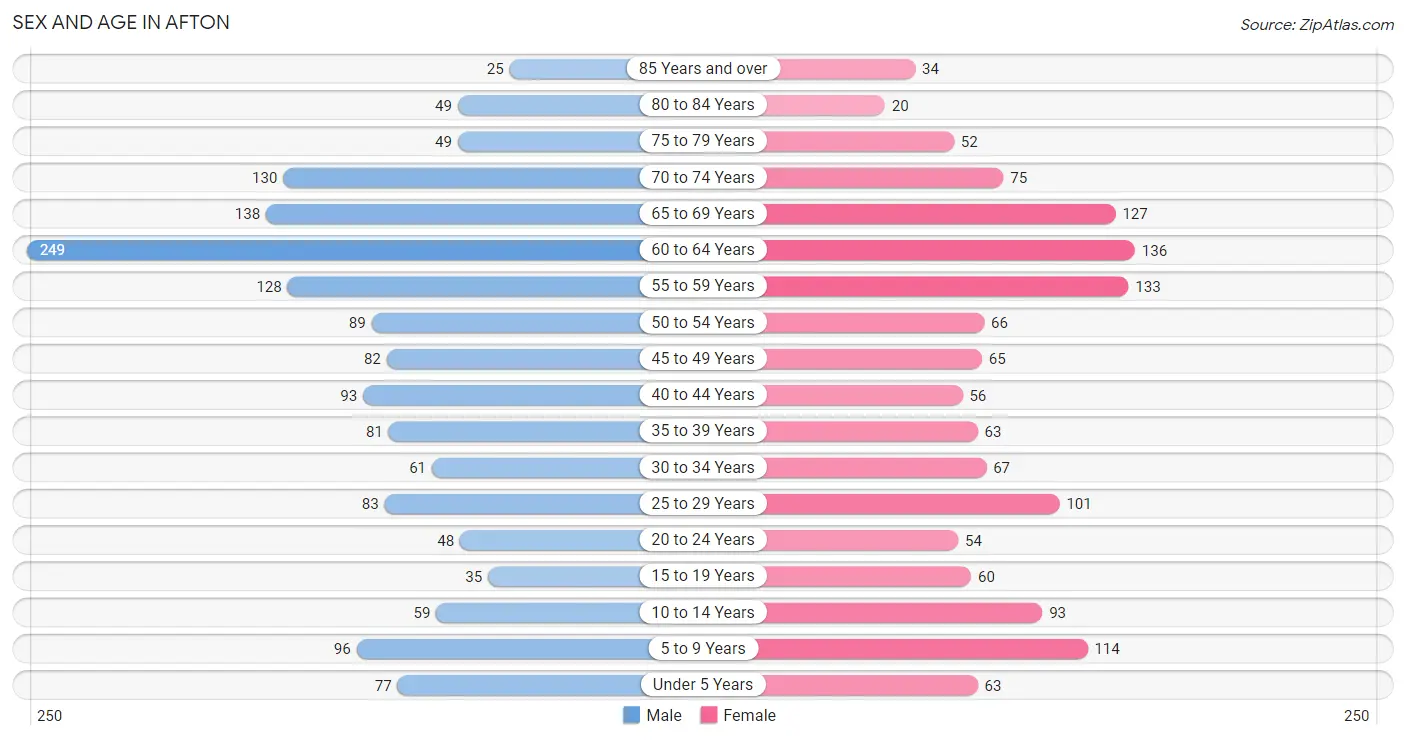
| Age Bracket | Male | Female |
| Under 5 Years | 77 (4.9%) | 63 (4.6%) |
| 5 to 9 Years | 96 (6.1%) | 114 (8.3%) |
| 10 to 14 Years | 59 (3.7%) | 93 (6.7%) |
| 15 to 19 Years | 35 (2.2%) | 60 (4.3%) |
| 20 to 24 Years | 48 (3.0%) | 54 (3.9%) |
| 25 to 29 Years | 83 (5.3%) | 101 (7.3%) |
| 30 to 34 Years | 61 (3.9%) | 67 (4.9%) |
| 35 to 39 Years | 81 (5.1%) | 63 (4.6%) |
| 40 to 44 Years | 93 (5.9%) | 56 (4.1%) |
| 45 to 49 Years | 82 (5.2%) | 65 (4.7%) |
| 50 to 54 Years | 89 (5.7%) | 66 (4.8%) |
| 55 to 59 Years | 128 (8.1%) | 133 (9.6%) |
| 60 to 64 Years | 249 (15.8%) | 136 (9.9%) |
| 65 to 69 Years | 138 (8.8%) | 127 (9.2%) |
| 70 to 74 Years | 130 (8.3%) | 75 (5.4%) |
| 75 to 79 Years | 49 (3.1%) | 52 (3.8%) |
| 80 to 84 Years | 49 (3.1%) | 20 (1.5%) |
| 85 Years and over | 25 (1.6%) | 34 (2.5%) |
| Total | 1,572 (100.0%) | 1,379 (100.0%) |
Families and Households in Afton
Median Family Size in Afton
The median family size in Afton is 2.98 persons per family, with married-couple families (777 | 91.4%) accounting for the largest median family size of 3.04 persons per family. On the other hand, single female/mother families (31 | 3.6%) represent the smallest median family size with 2.26 persons per family.
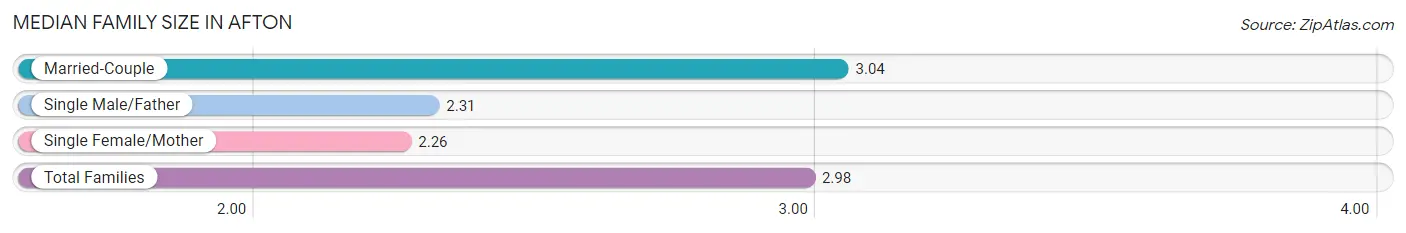
| Family Type | # Families | Family Size |
| Married-Couple | 777 (91.4%) | 3.04 |
| Single Male/Father | 42 (4.9%) | 2.31 |
| Single Female/Mother | 31 (3.6%) | 2.26 |
| Total Families | 850 (100.0%) | 2.98 |
Median Household Size in Afton
The median household size in Afton is 2.52 persons per household, with married-couple households (777 | 66.6%) accounting for the largest median household size of 3.09 persons per household. non-family households (317 | 27.2%) represent the smallest median household size with 1.16 persons per household.
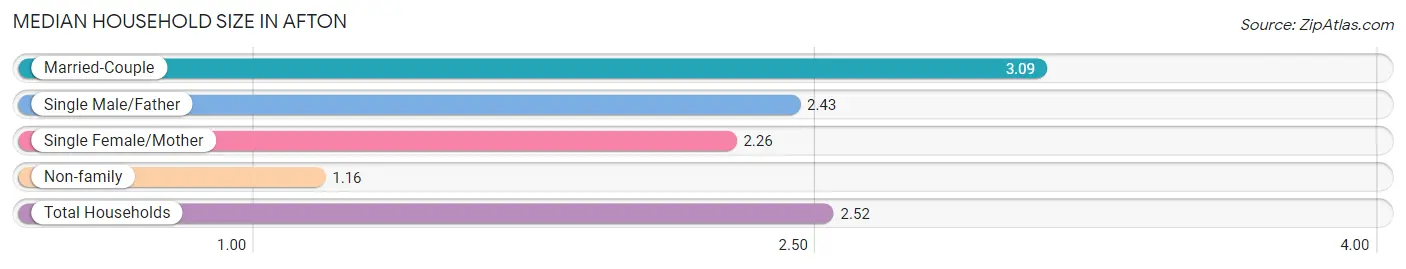
| Household Type | # Households | Household Size |
| Married-Couple | 777 (66.6%) | 3.09 |
| Single Male/Father | 42 (3.6%) | 2.43 |
| Single Female/Mother | 31 (2.7%) | 2.26 |
| Non-family | 317 (27.2%) | 1.16 |
| Total Households | 1,167 (100.0%) | 2.52 |
Household Size by Marriage Status in Afton
Out of a total of 1,167 households in Afton, 850 (72.8%) are family households, while 317 (27.2%) are nonfamily households. The most numerous type of family households are 2-person households, comprising 464, and the most common type of nonfamily households are 1-person households, comprising 259.
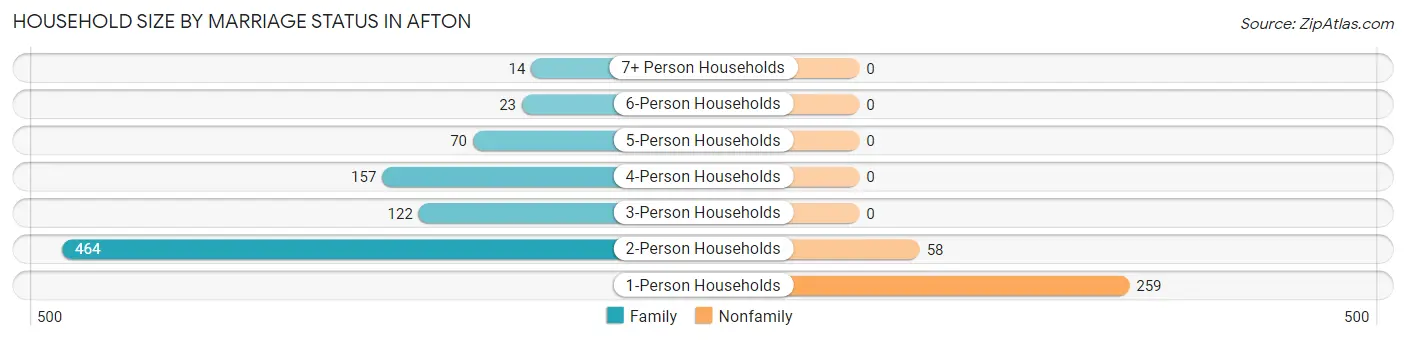
| Household Size | Family Households | Nonfamily Households |
| 1-Person Households | - | 259 (22.2%) |
| 2-Person Households | 464 (39.8%) | 58 (5.0%) |
| 3-Person Households | 122 (10.4%) | 0 (0.0%) |
| 4-Person Households | 157 (13.5%) | 0 (0.0%) |
| 5-Person Households | 70 (6.0%) | 0 (0.0%) |
| 6-Person Households | 23 (2.0%) | 0 (0.0%) |
| 7+ Person Households | 14 (1.2%) | 0 (0.0%) |
| Total | 850 (72.8%) | 317 (27.2%) |
Female Fertility in Afton
Fertility by Age in Afton
Average fertility rate in Afton is 46.0 births per 1,000 women. Women in the age bracket of 35 to 50 years have the highest fertility rate with 99.0 births per 1,000 women. Women in the age bracket of 35 to 50 years acount for 95.7% of all women with births.
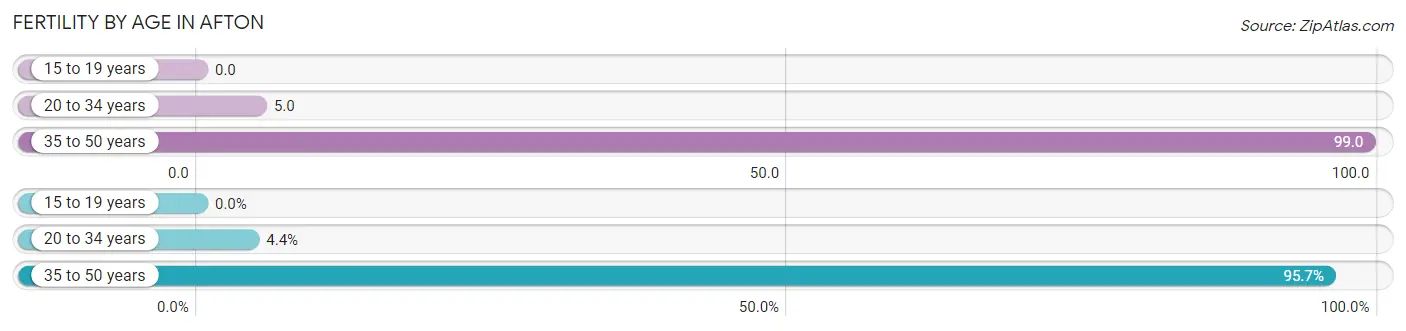
| Age Bracket | Women with Births | Births / 1,000 Women |
| 15 to 19 years | 0 (0.0%) | 0.0 |
| 20 to 34 years | 1 (4.3%) | 5.0 |
| 35 to 50 years | 22 (95.7%) | 99.0 |
| Total | 23 (100.0%) | 46.0 |
Fertility by Age by Marriage Status in Afton
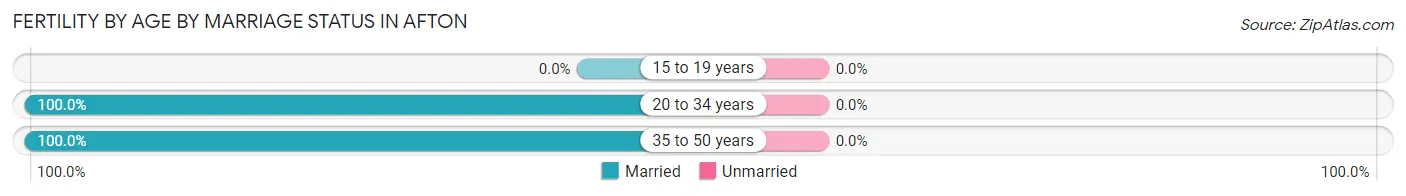
| Age Bracket | Married | Unmarried |
| 15 to 19 years | 0 (0.0%) | 0 (0.0%) |
| 20 to 34 years | 1 (100.0%) | 0 (0.0%) |
| 35 to 50 years | 22 (100.0%) | 0 (0.0%) |
| Total | 23 (100.0%) | 0 (0.0%) |
Fertility by Education in Afton
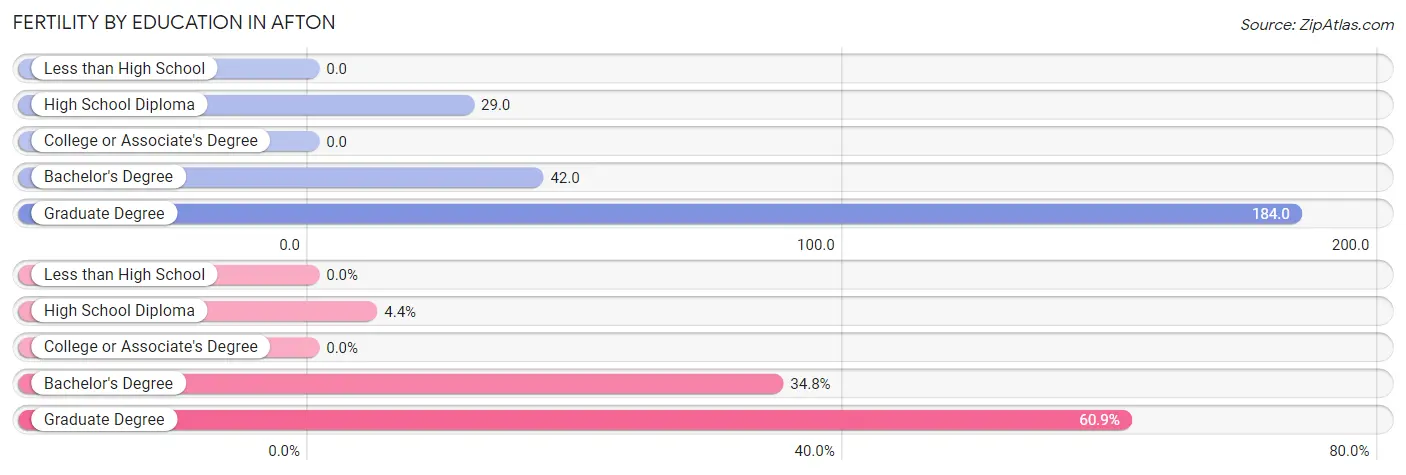
| Educational Attainment | Women with Births | Births / 1,000 Women |
| Less than High School | 0 (0.0%) | 0.0 |
| High School Diploma | 1 (4.3%) | 29.0 |
| College or Associate's Degree | 0 (0.0%) | 0.0 |
| Bachelor's Degree | 8 (34.8%) | 42.0 |
| Graduate Degree | 14 (60.9%) | 184.0 |
| Total | 23 (100.0%) | 46.0 |
Fertility by Education by Marriage Status in Afton
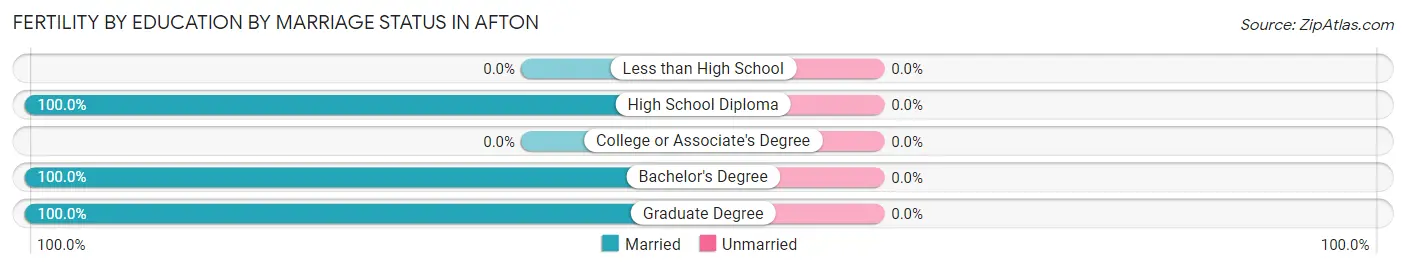
| Educational Attainment | Married | Unmarried |
| Less than High School | 0 (0.0%) | 0 (0.0%) |
| High School Diploma | 1 (100.0%) | 0 (0.0%) |
| College or Associate's Degree | 0 (0.0%) | 0 (0.0%) |
| Bachelor's Degree | 8 (100.0%) | 0 (0.0%) |
| Graduate Degree | 14 (100.0%) | 0 (0.0%) |
| Total | 23 (100.0%) | 0 (0.0%) |
Employment Characteristics in Afton
Employment by Class of Employer in Afton
Among the 1,339 employed individuals in Afton, private company employees (785 | 58.6%), self-employed (incorporated) (189 | 14.1%), and not-for-profit organizations (148 | 11.1%) make up the most common classes of employment.
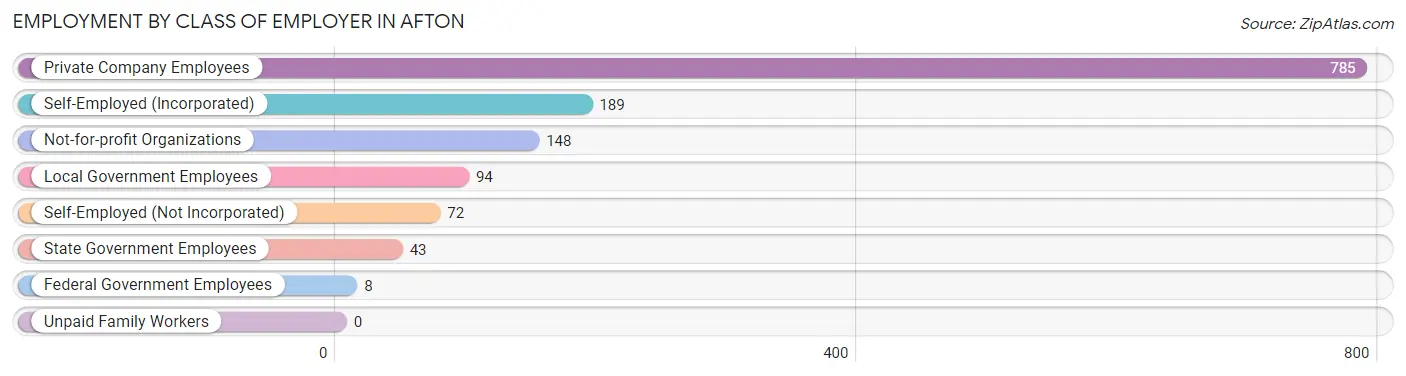
| Employer Class | # Employees | % Employees |
| Private Company Employees | 785 | 58.6% |
| Self-Employed (Incorporated) | 189 | 14.1% |
| Self-Employed (Not Incorporated) | 72 | 5.4% |
| Not-for-profit Organizations | 148 | 11.1% |
| Local Government Employees | 94 | 7.0% |
| State Government Employees | 43 | 3.2% |
| Federal Government Employees | 8 | 0.6% |
| Unpaid Family Workers | 0 | 0.0% |
| Total | 1,339 | 100.0% |
Employment Status by Age in Afton
According to the labor force statistics for Afton, out of the total population over 16 years of age (2,440), 56.4% or 1,376 individuals are in the labor force, with 2.3% or 32 of them unemployed. The age group with the highest labor force participation rate is 45 to 54 years, with 91.1% or 275 individuals in the labor force. Within the labor force, the 16 to 19 years age range has the highest percentage of unemployed individuals, with 25.5% or 14 of them being unemployed.
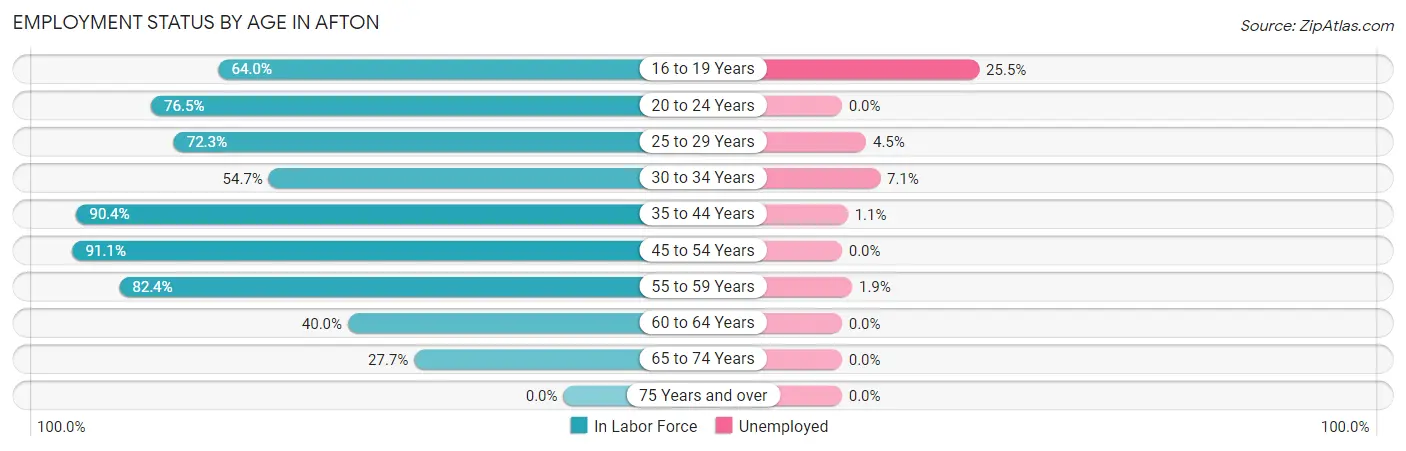
| Age Bracket | In Labor Force | Unemployed |
| 16 to 19 Years | 55 (64.0%) | 14 (25.5%) |
| 20 to 24 Years | 78 (76.5%) | 0 (0.0%) |
| 25 to 29 Years | 133 (72.3%) | 6 (4.5%) |
| 30 to 34 Years | 70 (54.7%) | 5 (7.1%) |
| 35 to 44 Years | 265 (90.4%) | 3 (1.1%) |
| 45 to 54 Years | 275 (91.1%) | 0 (0.0%) |
| 55 to 59 Years | 215 (82.4%) | 4 (1.9%) |
| 60 to 64 Years | 154 (40.0%) | 0 (0.0%) |
| 65 to 74 Years | 130 (27.7%) | 0 (0.0%) |
| 75 Years and over | 0 (0.0%) | 0 (0.0%) |
| Total | 1,376 (56.4%) | 32 (2.3%) |
Employment Status by Educational Attainment in Afton
According to labor force statistics for Afton, 71.6% of individuals (1,112) out of the total population between 25 and 64 years of age (1,553) are in the labor force, with 1.6% or 18 of them being unemployed. The group with the highest labor force participation rate are those with the educational attainment of bachelor's degree or higher, with 75.2% or 727 individuals in the labor force. Within the labor force, individuals with less than high school education have the highest percentage of unemployment, with 75.0% or 3 of them being unemployed.
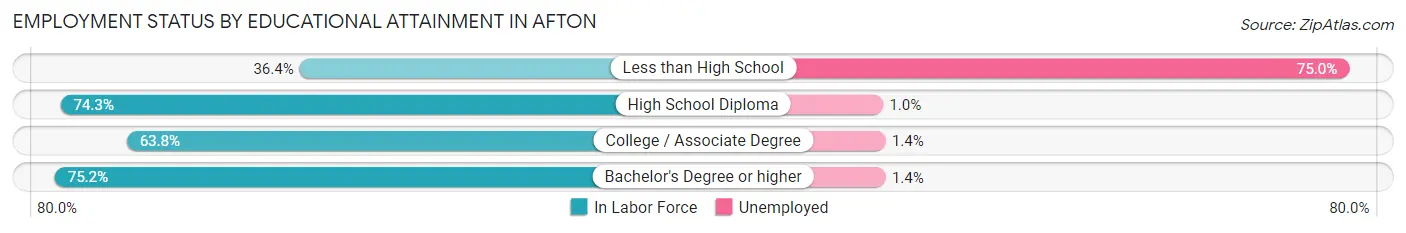
| Educational Attainment | In Labor Force | Unemployed |
| Less than High School | 4 (36.4%) | 8 (75.0%) |
| High School Diploma | 101 (74.3%) | 1 (1.0%) |
| College / Associate Degree | 280 (63.8%) | 6 (1.4%) |
| Bachelor's Degree or higher | 727 (75.2%) | 14 (1.4%) |
| Total | 1,112 (71.6%) | 25 (1.6%) |
Employment Occupations by Sex in Afton
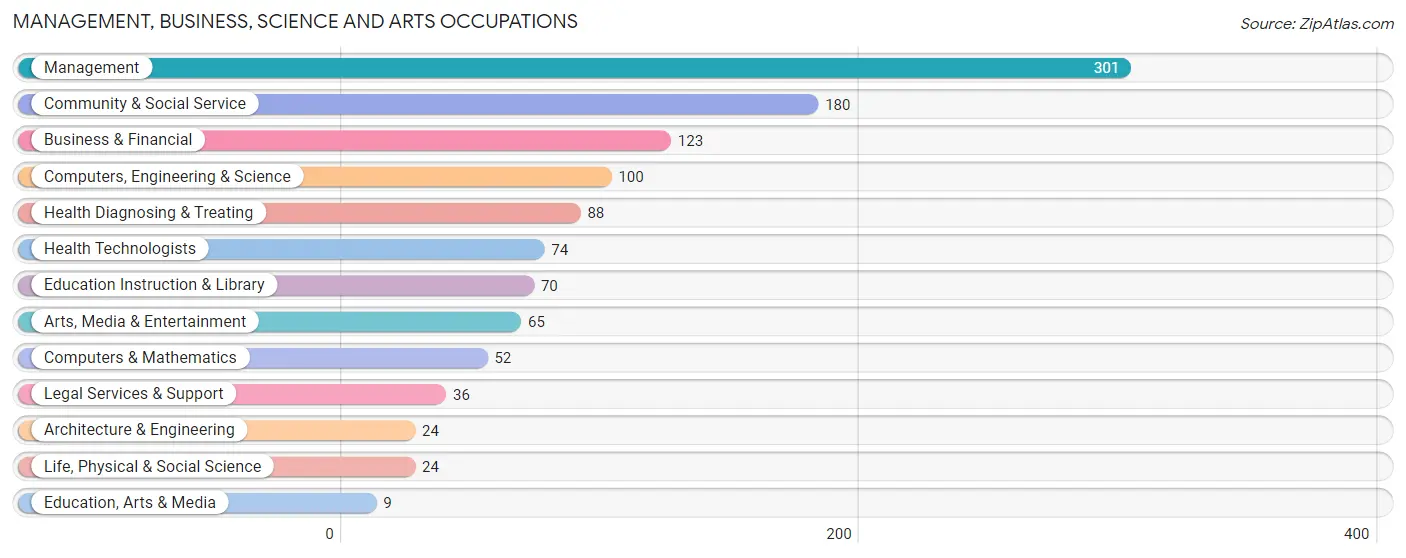
Management, Business, Science and Arts Occupations
The most common Management, Business, Science and Arts occupations in Afton are Management (301 | 22.4%), Community & Social Service (180 | 13.4%), Business & Financial (123 | 9.2%), Computers, Engineering & Science (100 | 7.4%), and Health Diagnosing & Treating (88 | 6.6%).
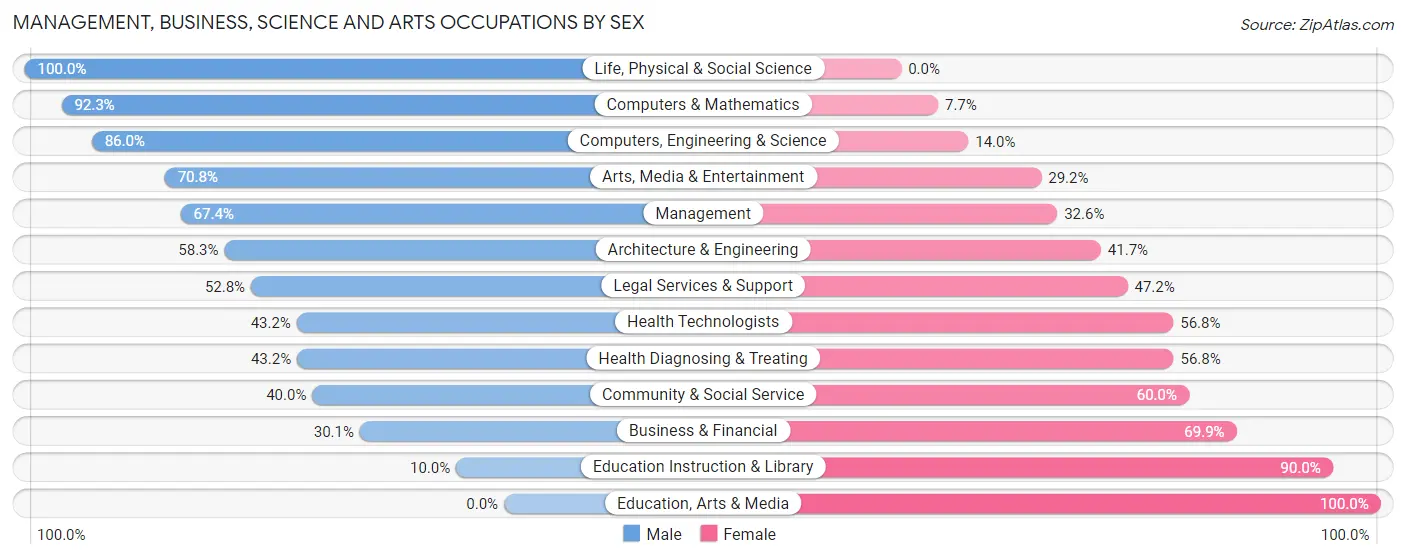
Management, Business, Science and Arts Occupations by Sex
Within the Management, Business, Science and Arts occupations in Afton, the most male-oriented occupations are Life, Physical & Social Science (100.0%), Computers & Mathematics (92.3%), and Computers, Engineering & Science (86.0%), while the most female-oriented occupations are Education, Arts & Media (100.0%), Education Instruction & Library (90.0%), and Business & Financial (69.9%).
| Occupation | Male | Female |
| Management | 203 (67.4%) | 98 (32.6%) |
| Business & Financial | 37 (30.1%) | 86 (69.9%) |
| Computers, Engineering & Science | 86 (86.0%) | 14 (14.0%) |
| Computers & Mathematics | 48 (92.3%) | 4 (7.7%) |
| Architecture & Engineering | 14 (58.3%) | 10 (41.7%) |
| Life, Physical & Social Science | 24 (100.0%) | 0 (0.0%) |
| Community & Social Service | 72 (40.0%) | 108 (60.0%) |
| Education, Arts & Media | 0 (0.0%) | 9 (100.0%) |
| Legal Services & Support | 19 (52.8%) | 17 (47.2%) |
| Education Instruction & Library | 7 (10.0%) | 63 (90.0%) |
| Arts, Media & Entertainment | 46 (70.8%) | 19 (29.2%) |
| Health Diagnosing & Treating | 38 (43.2%) | 50 (56.8%) |
| Health Technologists | 32 (43.2%) | 42 (56.8%) |
| Total (Category) | 436 (55.0%) | 356 (45.0%) |
| Total (Overall) | 760 (56.6%) | 583 (43.4%) |
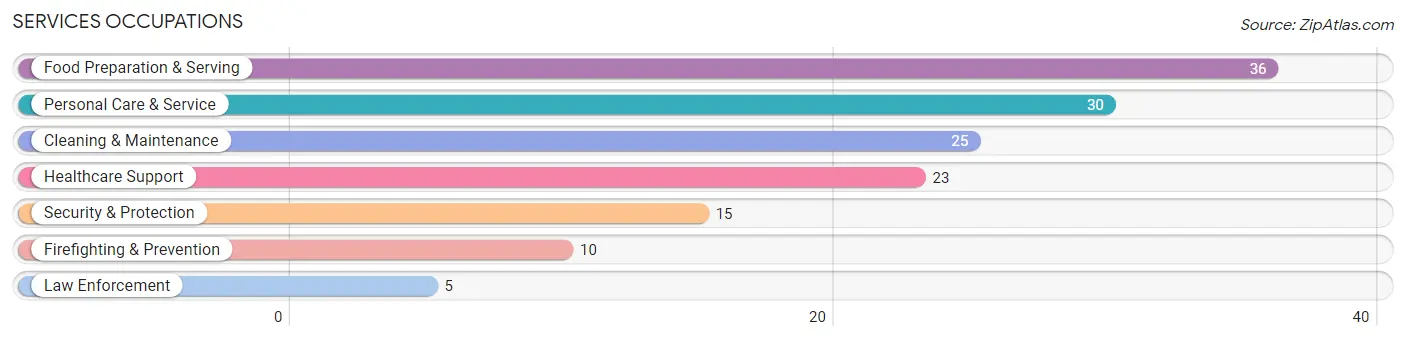
Services Occupations
The most common Services occupations in Afton are Food Preparation & Serving (36 | 2.7%), Personal Care & Service (30 | 2.2%), Cleaning & Maintenance (25 | 1.9%), Healthcare Support (23 | 1.7%), and Security & Protection (15 | 1.1%).
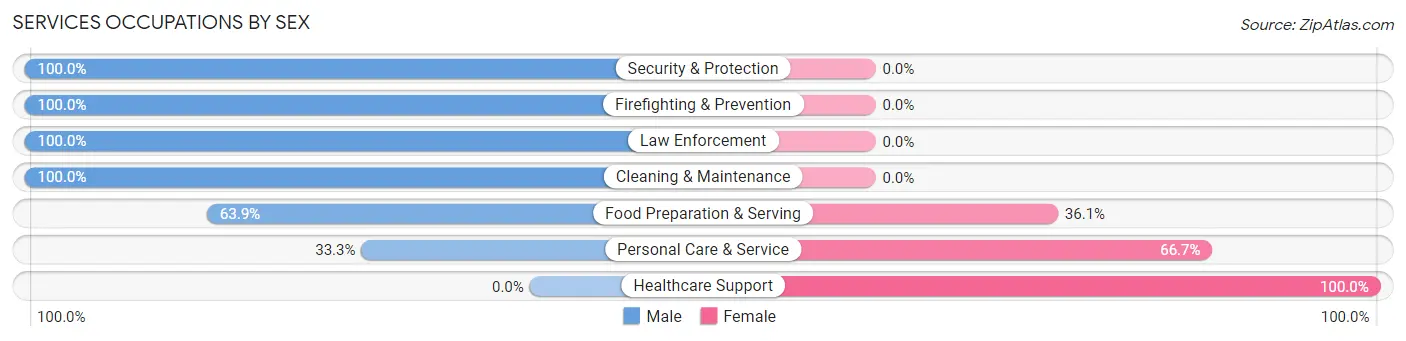
Services Occupations by Sex
Within the Services occupations in Afton, the most male-oriented occupations are Security & Protection (100.0%), Firefighting & Prevention (100.0%), and Law Enforcement (100.0%), while the most female-oriented occupations are Healthcare Support (100.0%), Personal Care & Service (66.7%), and Food Preparation & Serving (36.1%).
| Occupation | Male | Female |
| Healthcare Support | 0 (0.0%) | 23 (100.0%) |
| Security & Protection | 15 (100.0%) | 0 (0.0%) |
| Firefighting & Prevention | 10 (100.0%) | 0 (0.0%) |
| Law Enforcement | 5 (100.0%) | 0 (0.0%) |
| Food Preparation & Serving | 23 (63.9%) | 13 (36.1%) |
| Cleaning & Maintenance | 25 (100.0%) | 0 (0.0%) |
| Personal Care & Service | 10 (33.3%) | 20 (66.7%) |
| Total (Category) | 73 (56.6%) | 56 (43.4%) |
| Total (Overall) | 760 (56.6%) | 583 (43.4%) |
Sales and Office Occupations
The most common Sales and Office occupations in Afton are Sales & Related (110 | 8.2%), and Office & Administration (105 | 7.8%).
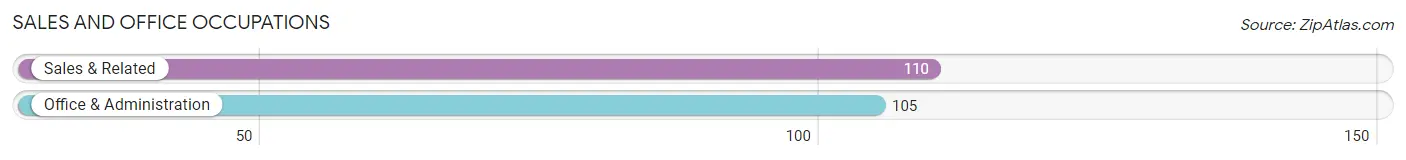
Sales and Office Occupations by Sex
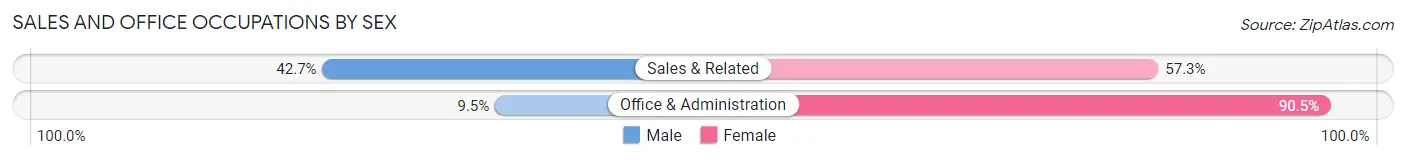
| Occupation | Male | Female |
| Sales & Related | 47 (42.7%) | 63 (57.3%) |
| Office & Administration | 10 (9.5%) | 95 (90.5%) |
| Total (Category) | 57 (26.5%) | 158 (73.5%) |
| Total (Overall) | 760 (56.6%) | 583 (43.4%) |
Natural Resources, Construction and Maintenance Occupations
The most common Natural Resources, Construction and Maintenance occupations in Afton are Installation, Maintenance & Repair (44 | 3.3%), Construction & Extraction (35 | 2.6%), and Farming, Fishing & Forestry (6 | 0.4%).
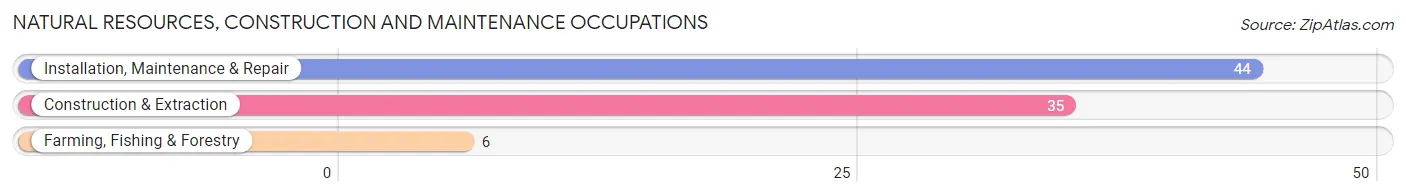
Natural Resources, Construction and Maintenance Occupations by Sex
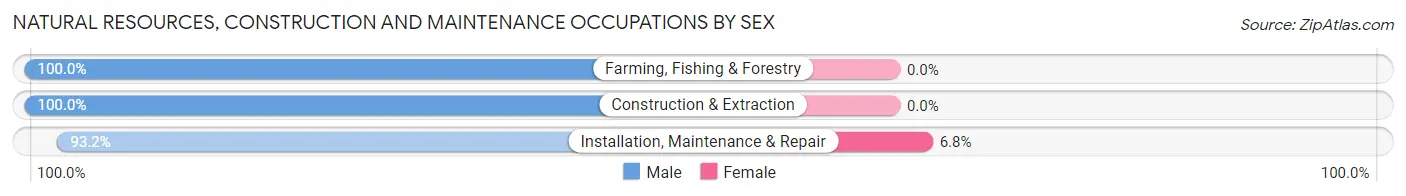
| Occupation | Male | Female |
| Farming, Fishing & Forestry | 6 (100.0%) | 0 (0.0%) |
| Construction & Extraction | 35 (100.0%) | 0 (0.0%) |
| Installation, Maintenance & Repair | 41 (93.2%) | 3 (6.8%) |
| Total (Category) | 82 (96.5%) | 3 (3.5%) |
| Total (Overall) | 760 (56.6%) | 583 (43.4%) |
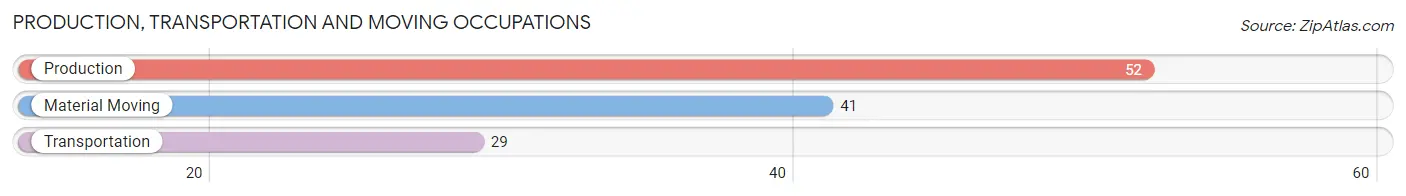
Production, Transportation and Moving Occupations
The most common Production, Transportation and Moving occupations in Afton are Production (52 | 3.9%), Material Moving (41 | 3.0%), and Transportation (29 | 2.2%).
Production, Transportation and Moving Occupations by Sex
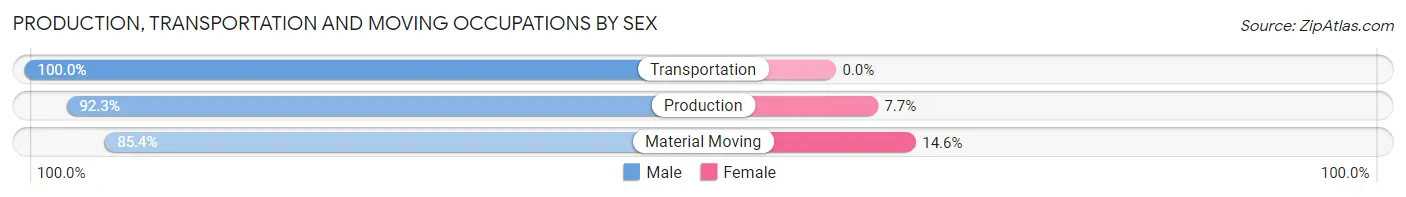
| Occupation | Male | Female |
| Production | 48 (92.3%) | 4 (7.7%) |
| Transportation | 29 (100.0%) | 0 (0.0%) |
| Material Moving | 35 (85.4%) | 6 (14.6%) |
| Total (Category) | 112 (91.8%) | 10 (8.2%) |
| Total (Overall) | 760 (56.6%) | 583 (43.4%) |
Employment Industries by Sex in Afton
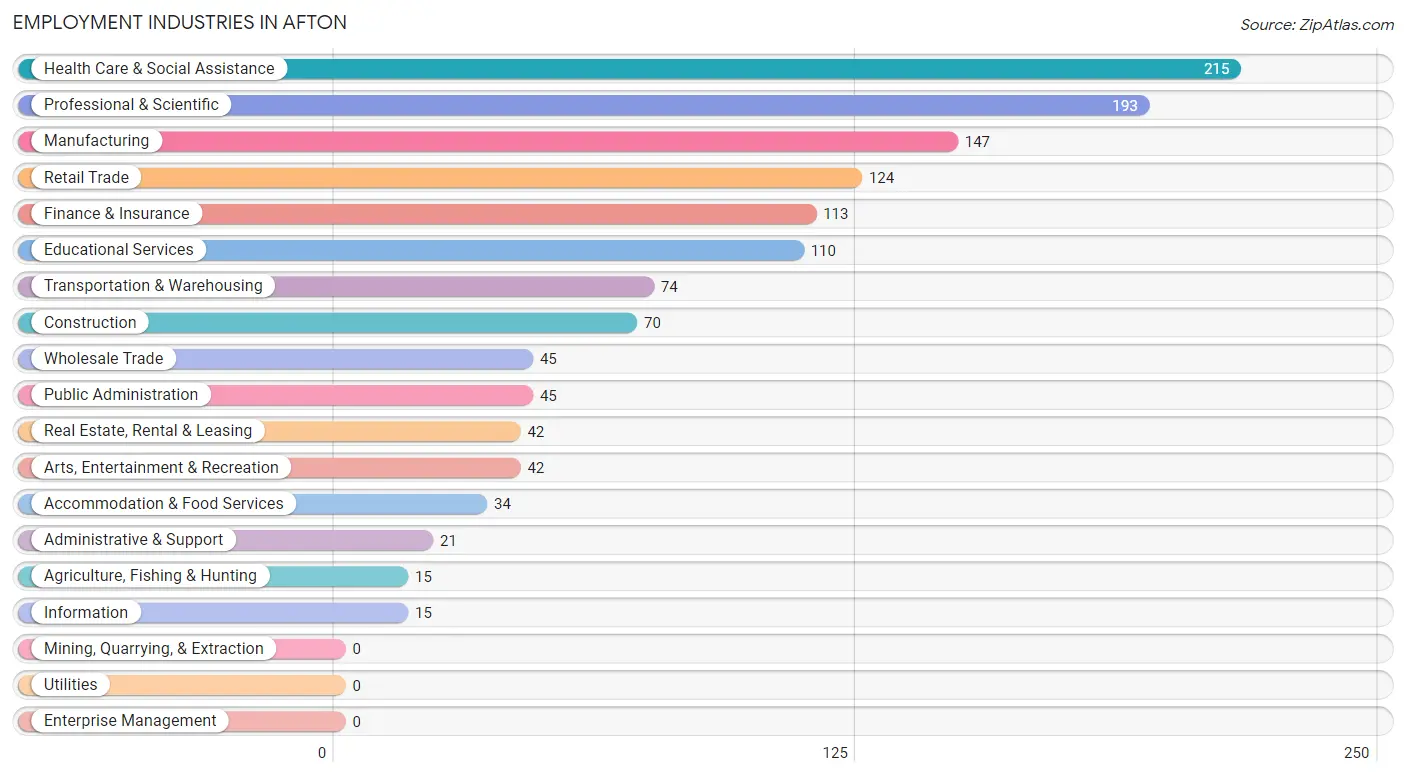
Employment Industries in Afton
The major employment industries in Afton include Health Care & Social Assistance (215 | 16.0%), Professional & Scientific (193 | 14.4%), Manufacturing (147 | 11.0%), Retail Trade (124 | 9.2%), and Finance & Insurance (113 | 8.4%).
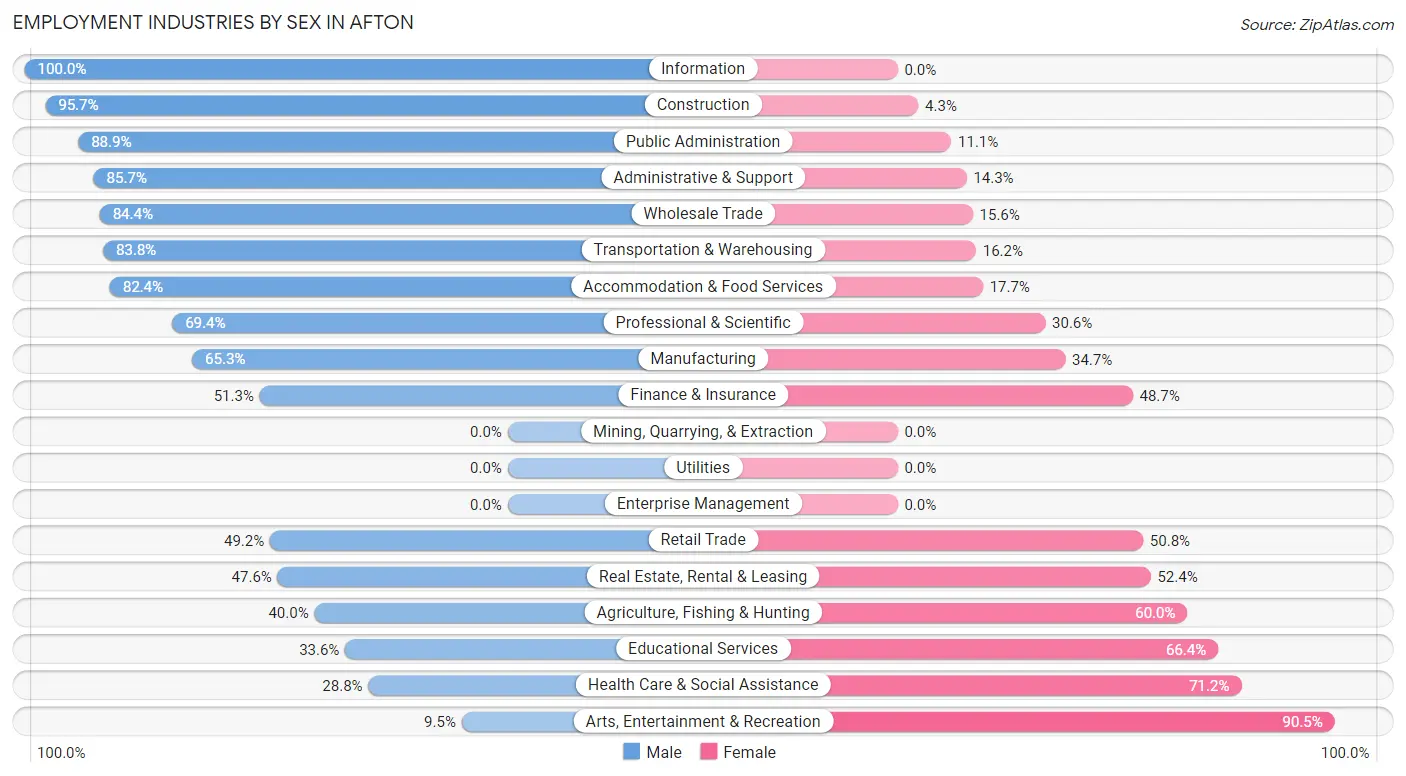
Employment Industries by Sex in Afton
The Afton industries that see more men than women are Information (100.0%), Construction (95.7%), and Public Administration (88.9%), whereas the industries that tend to have a higher number of women are Arts, Entertainment & Recreation (90.5%), Health Care & Social Assistance (71.2%), and Educational Services (66.4%).
| Industry | Male | Female |
| Agriculture, Fishing & Hunting | 6 (40.0%) | 9 (60.0%) |
| Mining, Quarrying, & Extraction | 0 (0.0%) | 0 (0.0%) |
| Construction | 67 (95.7%) | 3 (4.3%) |
| Manufacturing | 96 (65.3%) | 51 (34.7%) |
| Wholesale Trade | 38 (84.4%) | 7 (15.6%) |
| Retail Trade | 61 (49.2%) | 63 (50.8%) |
| Transportation & Warehousing | 62 (83.8%) | 12 (16.2%) |
| Utilities | 0 (0.0%) | 0 (0.0%) |
| Information | 15 (100.0%) | 0 (0.0%) |
| Finance & Insurance | 58 (51.3%) | 55 (48.7%) |
| Real Estate, Rental & Leasing | 20 (47.6%) | 22 (52.4%) |
| Professional & Scientific | 134 (69.4%) | 59 (30.6%) |
| Enterprise Management | 0 (0.0%) | 0 (0.0%) |
| Administrative & Support | 18 (85.7%) | 3 (14.3%) |
| Educational Services | 37 (33.6%) | 73 (66.4%) |
| Health Care & Social Assistance | 62 (28.8%) | 153 (71.2%) |
| Arts, Entertainment & Recreation | 4 (9.5%) | 38 (90.5%) |
| Accommodation & Food Services | 28 (82.4%) | 6 (17.6%) |
| Public Administration | 40 (88.9%) | 5 (11.1%) |
| Total | 760 (56.6%) | 583 (43.4%) |
Education in Afton
School Enrollment in Afton
The most common levels of schooling among the 568 students in Afton are elementary school (171 | 30.1%), middle school (120 | 21.1%), and college / undergraduate (93 | 16.4%).
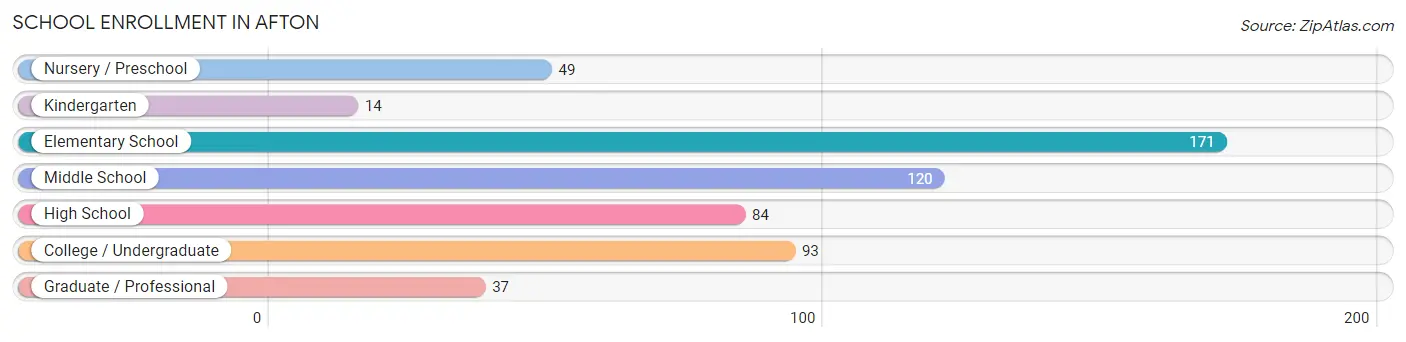
| School Level | # Students | % Students |
| Nursery / Preschool | 49 | 8.6% |
| Kindergarten | 14 | 2.5% |
| Elementary School | 171 | 30.1% |
| Middle School | 120 | 21.1% |
| High School | 84 | 14.8% |
| College / Undergraduate | 93 | 16.4% |
| Graduate / Professional | 37 | 6.5% |
| Total | 568 | 100.0% |
School Enrollment by Age by Funding Source in Afton
Out of a total of 568 students who are enrolled in schools in Afton, 132 (23.2%) attend a private institution, while the remaining 436 (76.8%) are enrolled in public schools. The age group of 18 to 19 year olds has the highest likelihood of being enrolled in private schools, with 20 (74.1% in the age bracket) enrolled. Conversely, the age group of 20 to 24 year olds has the lowest likelihood of being enrolled in a private school, with 43 (100.0% in the age bracket) attending a public institution.
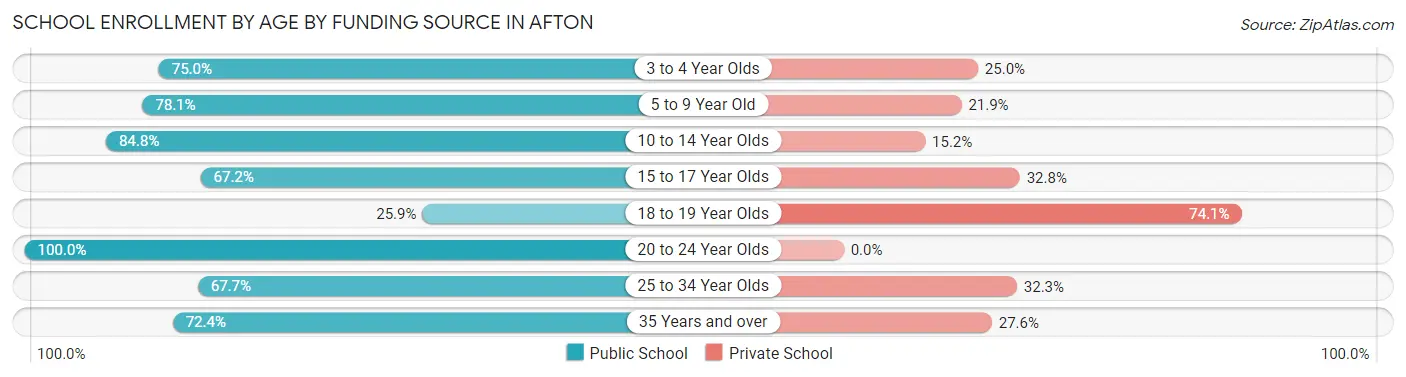
| Age Bracket | Public School | Private School |
| 3 to 4 Year Olds | 27 (75.0%) | 9 (25.0%) |
| 5 to 9 Year Old | 153 (78.1%) | 43 (21.9%) |
| 10 to 14 Year Olds | 123 (84.8%) | 22 (15.2%) |
| 15 to 17 Year Olds | 41 (67.2%) | 20 (32.8%) |
| 18 to 19 Year Olds | 7 (25.9%) | 20 (74.1%) |
| 20 to 24 Year Olds | 43 (100.0%) | 0 (0.0%) |
| 25 to 34 Year Olds | 21 (67.7%) | 10 (32.3%) |
| 35 Years and over | 21 (72.4%) | 8 (27.6%) |
| Total | 436 (76.8%) | 132 (23.2%) |
Educational Attainment by Field of Study in Afton
Business (255 | 17.8%), social sciences (172 | 12.0%), science & technology (164 | 11.4%), computers & mathematics (129 | 9.0%), and bio, nature & agricultural (99 | 6.9%) are the most common fields of study among 1,433 individuals in Afton who have obtained a bachelor's degree or higher.
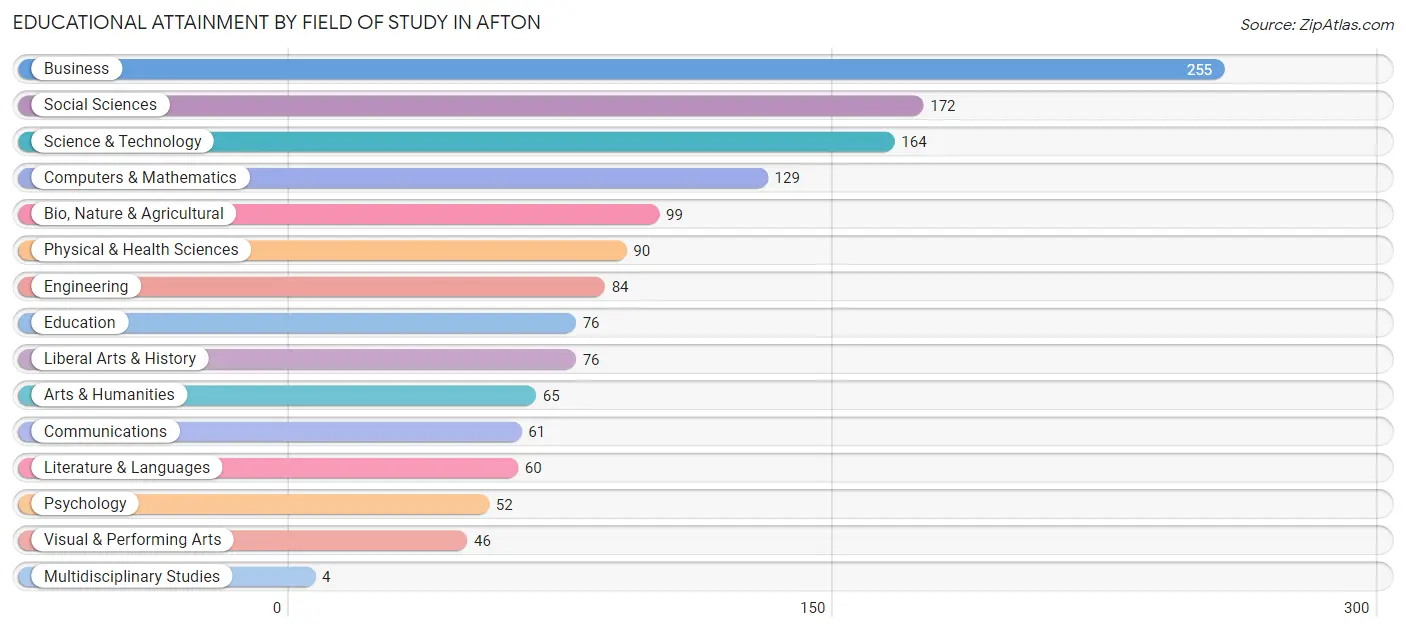
| Field of Study | # Graduates | % Graduates |
| Computers & Mathematics | 129 | 9.0% |
| Bio, Nature & Agricultural | 99 | 6.9% |
| Physical & Health Sciences | 90 | 6.3% |
| Psychology | 52 | 3.6% |
| Social Sciences | 172 | 12.0% |
| Engineering | 84 | 5.9% |
| Multidisciplinary Studies | 4 | 0.3% |
| Science & Technology | 164 | 11.4% |
| Business | 255 | 17.8% |
| Education | 76 | 5.3% |
| Literature & Languages | 60 | 4.2% |
| Liberal Arts & History | 76 | 5.3% |
| Visual & Performing Arts | 46 | 3.2% |
| Communications | 61 | 4.3% |
| Arts & Humanities | 65 | 4.5% |
| Total | 1,433 | 100.0% |
Transportation & Commute in Afton
Vehicle Availability by Sex in Afton
The most prevalent vehicle ownership categories in Afton are males with 2 vehicles (255, accounting for 33.7%) and females with 2 vehicles (225, making up 43.8%).
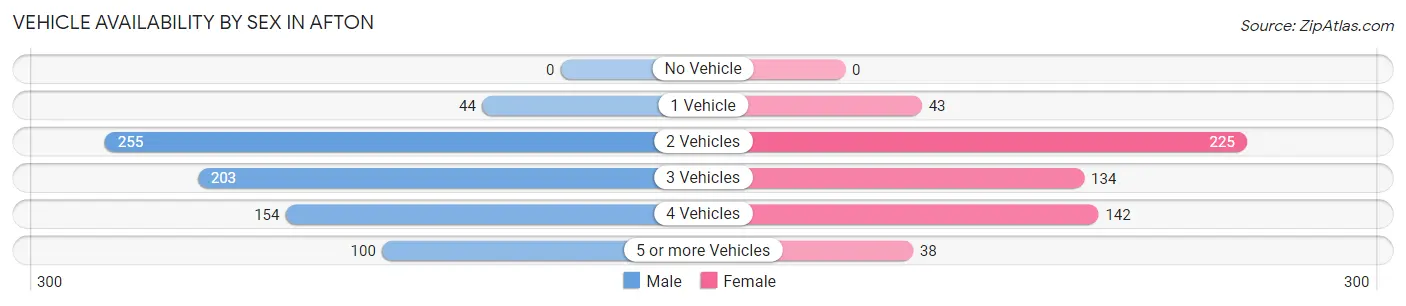
| Vehicles Available | Male | Female |
| No Vehicle | 0 (0.0%) | 0 (0.0%) |
| 1 Vehicle | 44 (5.8%) | 43 (7.4%) |
| 2 Vehicles | 255 (33.7%) | 225 (38.7%) |
| 3 Vehicles | 203 (26.9%) | 134 (23.0%) |
| 4 Vehicles | 154 (20.4%) | 142 (24.4%) |
| 5 or more Vehicles | 100 (13.2%) | 38 (6.5%) |
| Total | 756 (100.0%) | 582 (100.0%) |
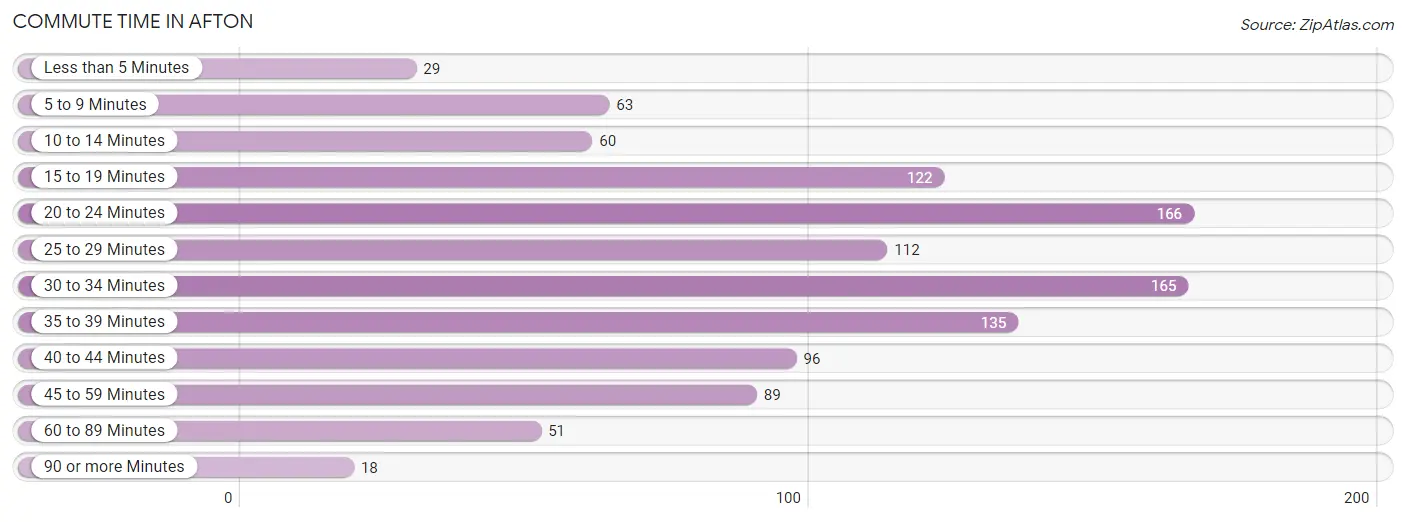
Commute Time in Afton
The most frequently occuring commute durations in Afton are 20 to 24 minutes (166 commuters, 15.0%), 30 to 34 minutes (165 commuters, 14.9%), and 35 to 39 minutes (135 commuters, 12.2%).
| Commute Time | # Commuters | % Commuters |
| Less than 5 Minutes | 29 | 2.6% |
| 5 to 9 Minutes | 63 | 5.7% |
| 10 to 14 Minutes | 60 | 5.4% |
| 15 to 19 Minutes | 122 | 11.0% |
| 20 to 24 Minutes | 166 | 15.0% |
| 25 to 29 Minutes | 112 | 10.1% |
| 30 to 34 Minutes | 165 | 14.9% |
| 35 to 39 Minutes | 135 | 12.2% |
| 40 to 44 Minutes | 96 | 8.7% |
| 45 to 59 Minutes | 89 | 8.1% |
| 60 to 89 Minutes | 51 | 4.6% |
| 90 or more Minutes | 18 | 1.6% |
Commute Time by Sex in Afton
The most common commute times in Afton are 30 to 34 minutes (111 commuters, 17.1%) for males and 15 to 19 minutes (82 commuters, 17.9%) for females.
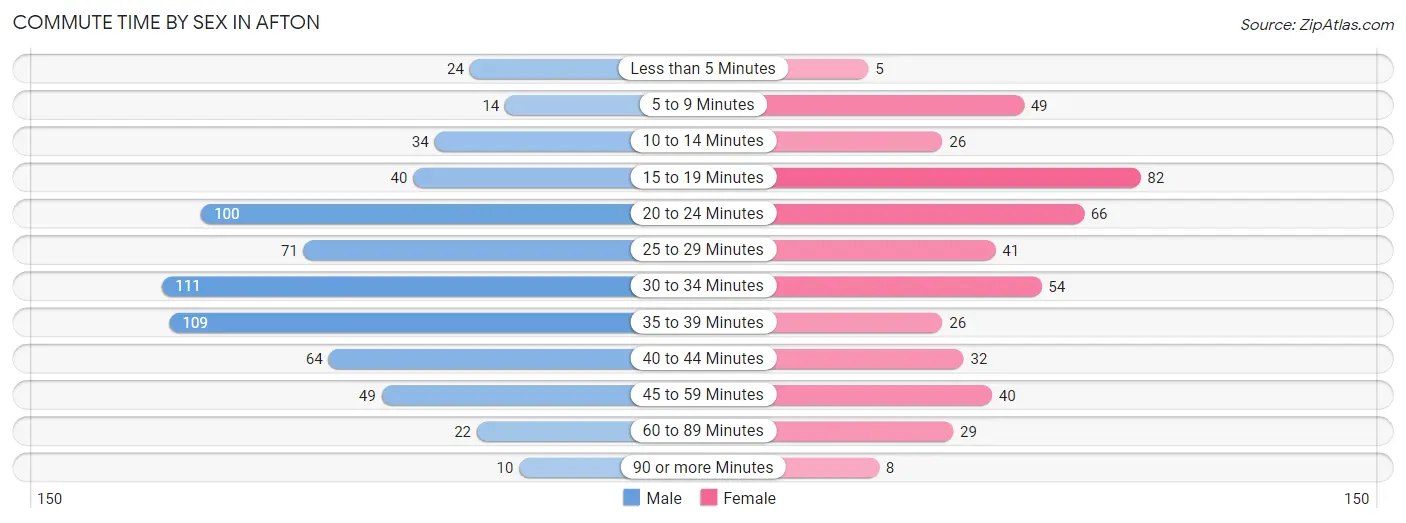
| Commute Time | Male | Female |
| Less than 5 Minutes | 24 (3.7%) | 5 (1.1%) |
| 5 to 9 Minutes | 14 (2.2%) | 49 (10.7%) |
| 10 to 14 Minutes | 34 (5.2%) | 26 (5.7%) |
| 15 to 19 Minutes | 40 (6.2%) | 82 (17.9%) |
| 20 to 24 Minutes | 100 (15.4%) | 66 (14.4%) |
| 25 to 29 Minutes | 71 (11.0%) | 41 (8.9%) |
| 30 to 34 Minutes | 111 (17.1%) | 54 (11.8%) |
| 35 to 39 Minutes | 109 (16.8%) | 26 (5.7%) |
| 40 to 44 Minutes | 64 (9.9%) | 32 (7.0%) |
| 45 to 59 Minutes | 49 (7.6%) | 40 (8.7%) |
| 60 to 89 Minutes | 22 (3.4%) | 29 (6.3%) |
| 90 or more Minutes | 10 (1.5%) | 8 (1.8%) |
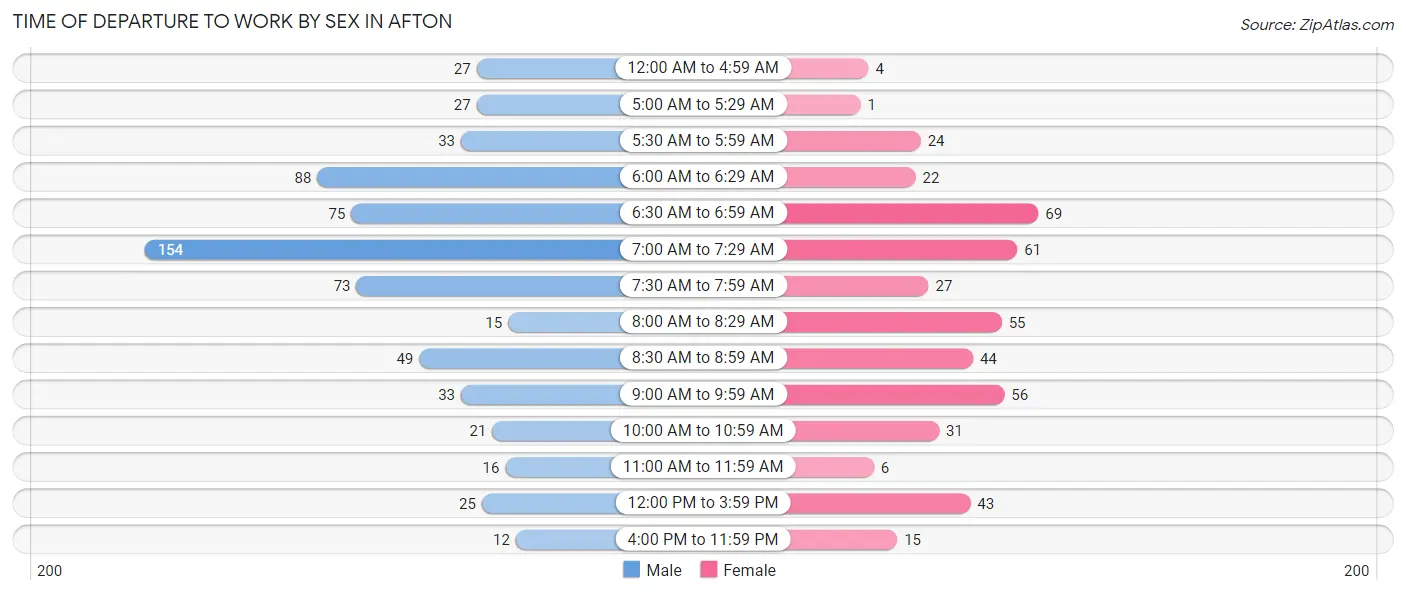
Time of Departure to Work by Sex in Afton
The most frequent times of departure to work in Afton are 7:00 AM to 7:29 AM (154, 23.8%) for males and 6:30 AM to 6:59 AM (69, 15.1%) for females.
| Time of Departure | Male | Female |
| 12:00 AM to 4:59 AM | 27 (4.2%) | 4 (0.9%) |
| 5:00 AM to 5:29 AM | 27 (4.2%) | 1 (0.2%) |
| 5:30 AM to 5:59 AM | 33 (5.1%) | 24 (5.2%) |
| 6:00 AM to 6:29 AM | 88 (13.6%) | 22 (4.8%) |
| 6:30 AM to 6:59 AM | 75 (11.6%) | 69 (15.1%) |
| 7:00 AM to 7:29 AM | 154 (23.8%) | 61 (13.3%) |
| 7:30 AM to 7:59 AM | 73 (11.3%) | 27 (5.9%) |
| 8:00 AM to 8:29 AM | 15 (2.3%) | 55 (12.0%) |
| 8:30 AM to 8:59 AM | 49 (7.6%) | 44 (9.6%) |
| 9:00 AM to 9:59 AM | 33 (5.1%) | 56 (12.2%) |
| 10:00 AM to 10:59 AM | 21 (3.2%) | 31 (6.8%) |
| 11:00 AM to 11:59 AM | 16 (2.5%) | 6 (1.3%) |
| 12:00 PM to 3:59 PM | 25 (3.9%) | 43 (9.4%) |
| 4:00 PM to 11:59 PM | 12 (1.8%) | 15 (3.3%) |
| Total | 648 (100.0%) | 458 (100.0%) |
Housing Occupancy in Afton
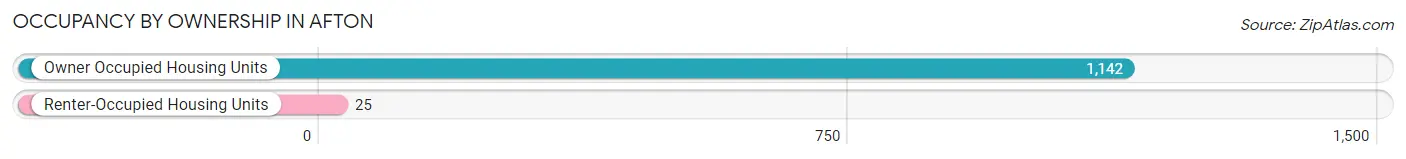
Occupancy by Ownership in Afton
Of the total 1,167 dwellings in Afton, owner-occupied units account for 1,142 (97.9%), while renter-occupied units make up 25 (2.1%).
| Occupancy | # Housing Units | % Housing Units |
| Owner Occupied Housing Units | 1,142 | 97.9% |
| Renter-Occupied Housing Units | 25 | 2.1% |
| Total Occupied Housing Units | 1,167 | 100.0% |
Occupancy by Household Size in Afton
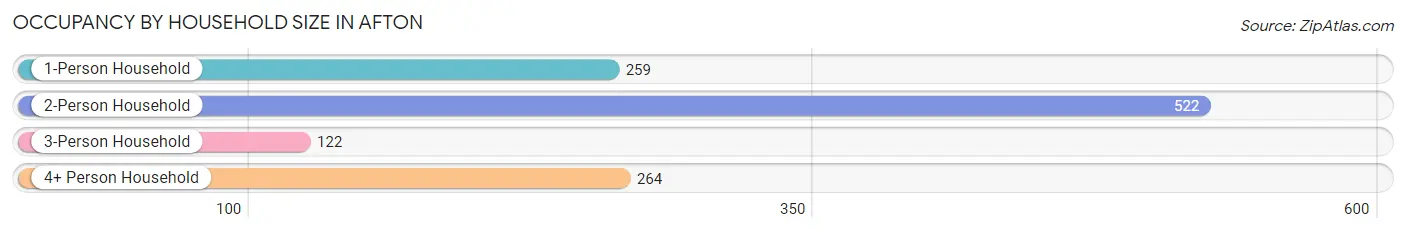
| Household Size | # Housing Units | % Housing Units |
| 1-Person Household | 259 | 22.2% |
| 2-Person Household | 522 | 44.7% |
| 3-Person Household | 122 | 10.4% |
| 4+ Person Household | 264 | 22.6% |
| Total Housing Units | 1,167 | 100.0% |
Occupancy by Ownership by Household Size in Afton
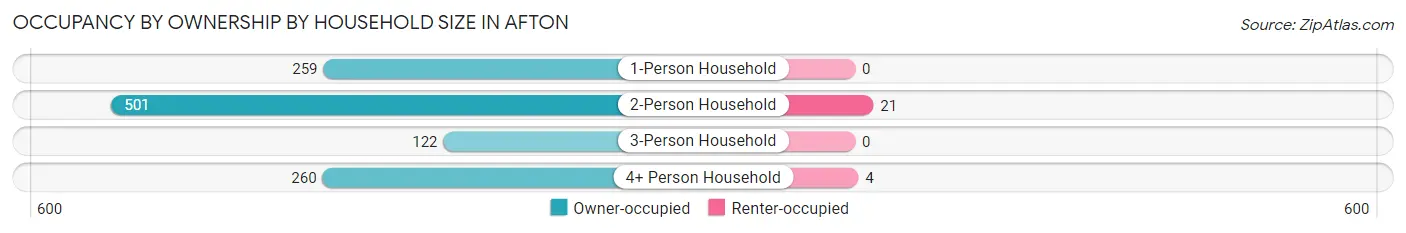
| Household Size | Owner-occupied | Renter-occupied |
| 1-Person Household | 259 (100.0%) | 0 (0.0%) |
| 2-Person Household | 501 (96.0%) | 21 (4.0%) |
| 3-Person Household | 122 (100.0%) | 0 (0.0%) |
| 4+ Person Household | 260 (98.5%) | 4 (1.5%) |
| Total Housing Units | 1,142 (97.9%) | 25 (2.1%) |
Occupancy by Educational Attainment in Afton
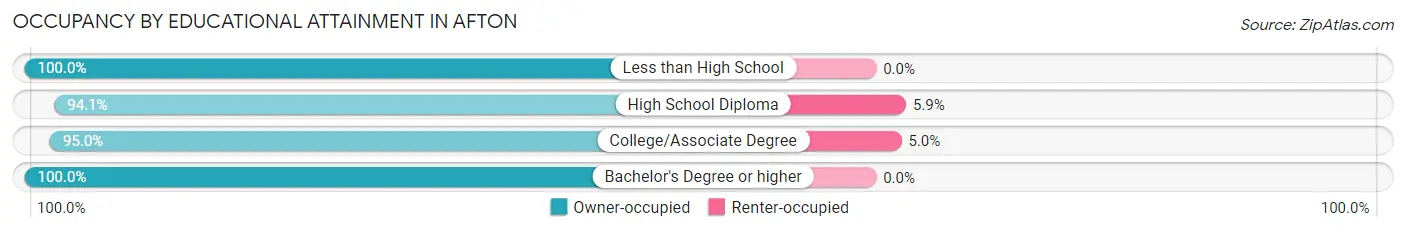
| Household Size | Owner-occupied | Renter-occupied |
| Less than High School | 6 (100.0%) | 0 (0.0%) |
| High School Diploma | 143 (94.1%) | 9 (5.9%) |
| College/Associate Degree | 303 (95.0%) | 16 (5.0%) |
| Bachelor's Degree or higher | 690 (100.0%) | 0 (0.0%) |
Occupancy by Age of Householder in Afton
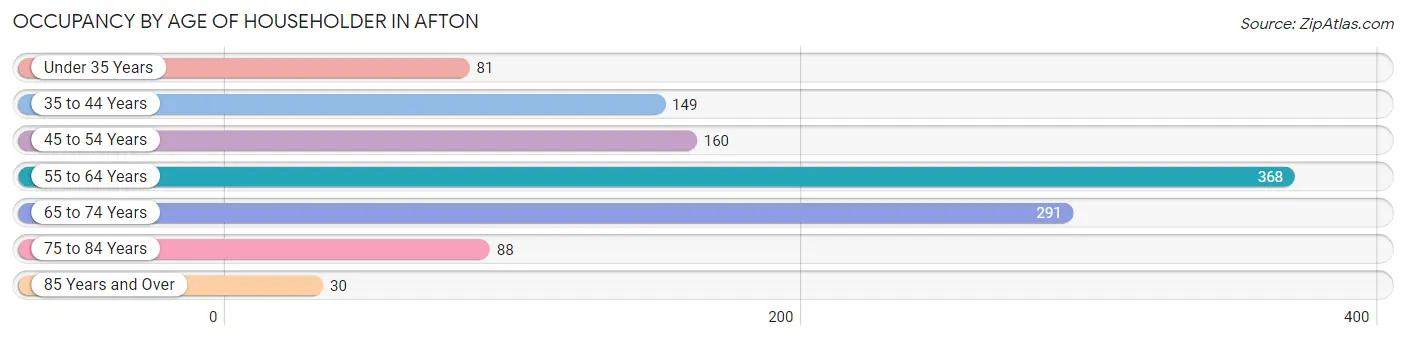
| Age Bracket | # Households | % Households |
| Under 35 Years | 81 | 6.9% |
| 35 to 44 Years | 149 | 12.8% |
| 45 to 54 Years | 160 | 13.7% |
| 55 to 64 Years | 368 | 31.5% |
| 65 to 74 Years | 291 | 24.9% |
| 75 to 84 Years | 88 | 7.5% |
| 85 Years and Over | 30 | 2.6% |
| Total | 1,167 | 100.0% |
Housing Finances in Afton
Median Income by Occupancy in Afton
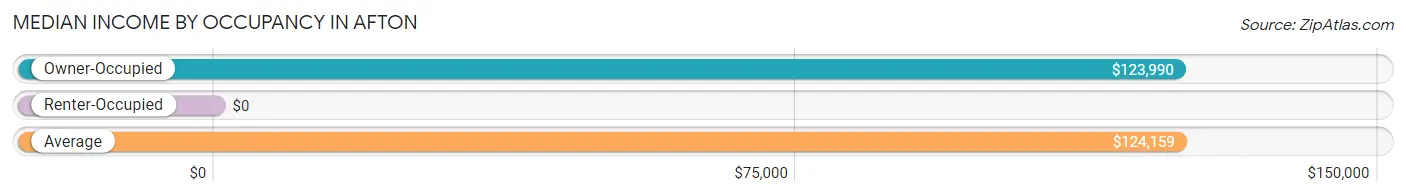
| Occupancy Type | # Households | Median Income |
| Owner-Occupied | 1,142 (97.9%) | $123,990 |
| Renter-Occupied | 25 (2.1%) | $0 |
| Average | 1,167 (100.0%) | $124,159 |
Occupancy by Householder Income Bracket in Afton
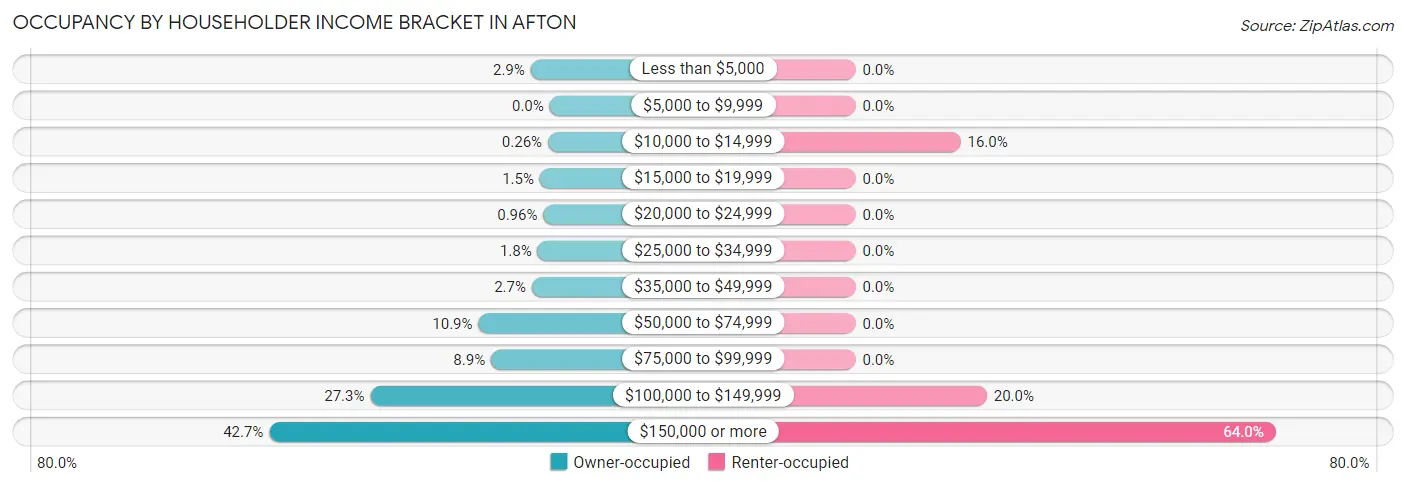
| Income Bracket | Owner-occupied | Renter-occupied |
| Less than $5,000 | 33 (2.9%) | 0 (0.0%) |
| $5,000 to $9,999 | 0 (0.0%) | 0 (0.0%) |
| $10,000 to $14,999 | 3 (0.3%) | 4 (16.0%) |
| $15,000 to $19,999 | 17 (1.5%) | 0 (0.0%) |
| $20,000 to $24,999 | 11 (1.0%) | 0 (0.0%) |
| $25,000 to $34,999 | 21 (1.8%) | 0 (0.0%) |
| $35,000 to $49,999 | 31 (2.7%) | 0 (0.0%) |
| $50,000 to $74,999 | 124 (10.9%) | 0 (0.0%) |
| $75,000 to $99,999 | 102 (8.9%) | 0 (0.0%) |
| $100,000 to $149,999 | 312 (27.3%) | 5 (20.0%) |
| $150,000 or more | 488 (42.7%) | 16 (64.0%) |
| Total | 1,142 (100.0%) | 25 (100.0%) |
Monthly Housing Cost Tiers in Afton
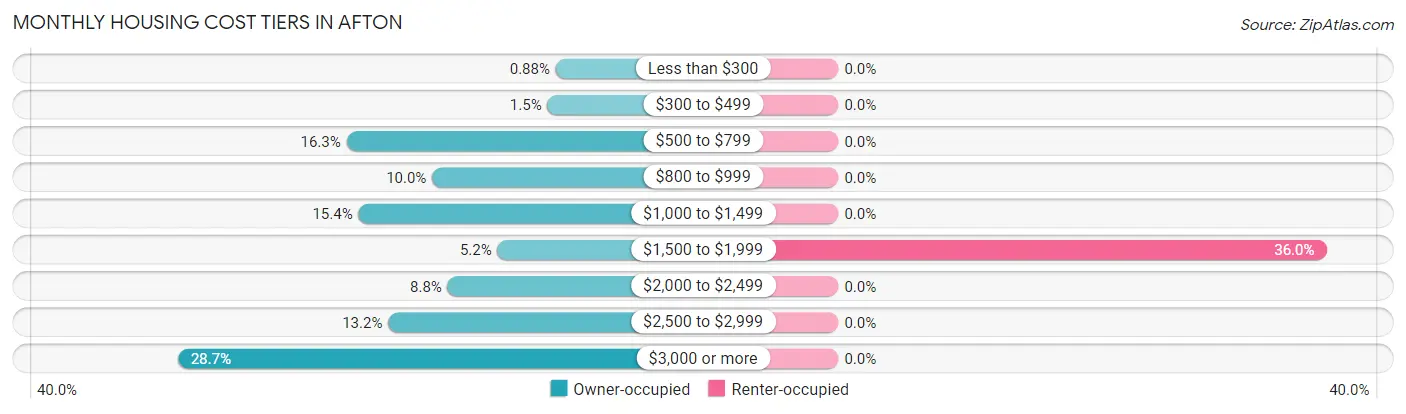
| Monthly Cost | Owner-occupied | Renter-occupied |
| Less than $300 | 10 (0.9%) | 0 (0.0%) |
| $300 to $499 | 17 (1.5%) | 0 (0.0%) |
| $500 to $799 | 186 (16.3%) | 0 (0.0%) |
| $800 to $999 | 114 (10.0%) | 0 (0.0%) |
| $1,000 to $1,499 | 176 (15.4%) | 0 (0.0%) |
| $1,500 to $1,999 | 59 (5.2%) | 9 (36.0%) |
| $2,000 to $2,499 | 101 (8.8%) | 0 (0.0%) |
| $2,500 to $2,999 | 151 (13.2%) | 0 (0.0%) |
| $3,000 or more | 328 (28.7%) | 0 (0.0%) |
| Total | 1,142 (100.0%) | 25 (100.0%) |
Physical Housing Characteristics in Afton
Housing Structures in Afton
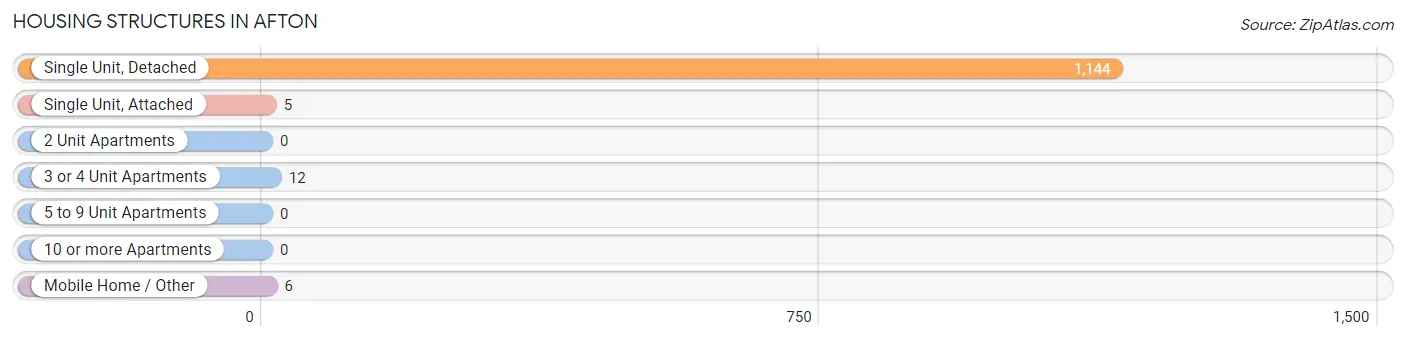
| Structure Type | # Housing Units | % Housing Units |
| Single Unit, Detached | 1,144 | 98.0% |
| Single Unit, Attached | 5 | 0.4% |
| 2 Unit Apartments | 0 | 0.0% |
| 3 or 4 Unit Apartments | 12 | 1.0% |
| 5 to 9 Unit Apartments | 0 | 0.0% |
| 10 or more Apartments | 0 | 0.0% |
| Mobile Home / Other | 6 | 0.5% |
| Total | 1,167 | 100.0% |
Housing Structures by Occupancy in Afton
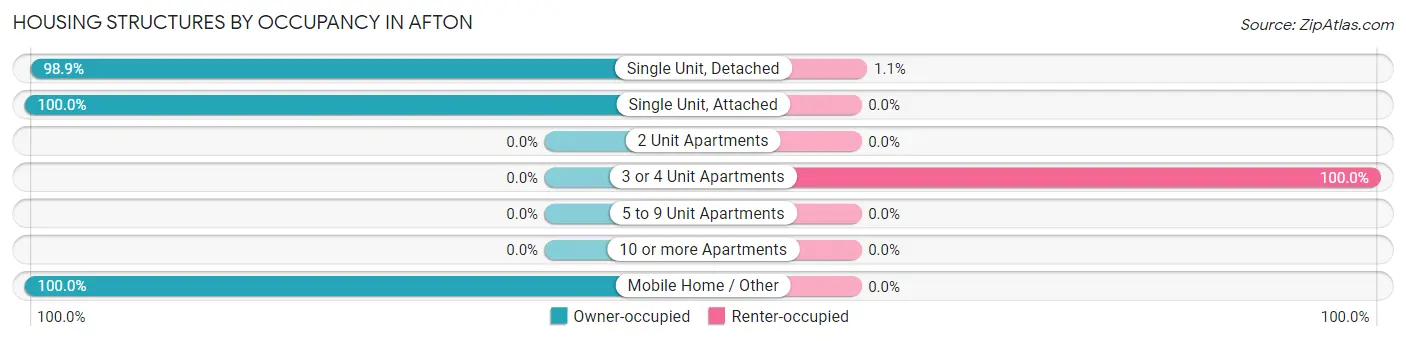
| Structure Type | Owner-occupied | Renter-occupied |
| Single Unit, Detached | 1,131 (98.9%) | 13 (1.1%) |
| Single Unit, Attached | 5 (100.0%) | 0 (0.0%) |
| 2 Unit Apartments | 0 (0.0%) | 0 (0.0%) |
| 3 or 4 Unit Apartments | 0 (0.0%) | 12 (100.0%) |
| 5 to 9 Unit Apartments | 0 (0.0%) | 0 (0.0%) |
| 10 or more Apartments | 0 (0.0%) | 0 (0.0%) |
| Mobile Home / Other | 6 (100.0%) | 0 (0.0%) |
| Total | 1,142 (97.9%) | 25 (2.1%) |
Housing Structures by Number of Rooms in Afton
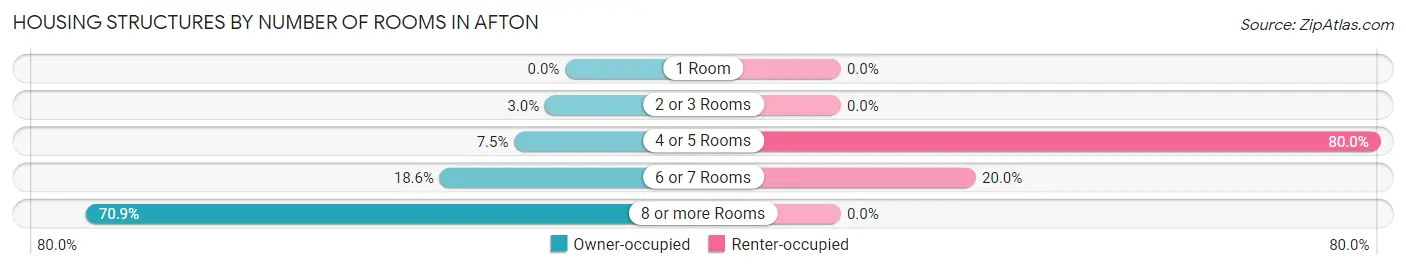
| Number of Rooms | Owner-occupied | Renter-occupied |
| 1 Room | 0 (0.0%) | 0 (0.0%) |
| 2 or 3 Rooms | 34 (3.0%) | 0 (0.0%) |
| 4 or 5 Rooms | 86 (7.5%) | 20 (80.0%) |
| 6 or 7 Rooms | 212 (18.6%) | 5 (20.0%) |
| 8 or more Rooms | 810 (70.9%) | 0 (0.0%) |
| Total | 1,142 (100.0%) | 25 (100.0%) |
Housing Structure by Heating Type in Afton
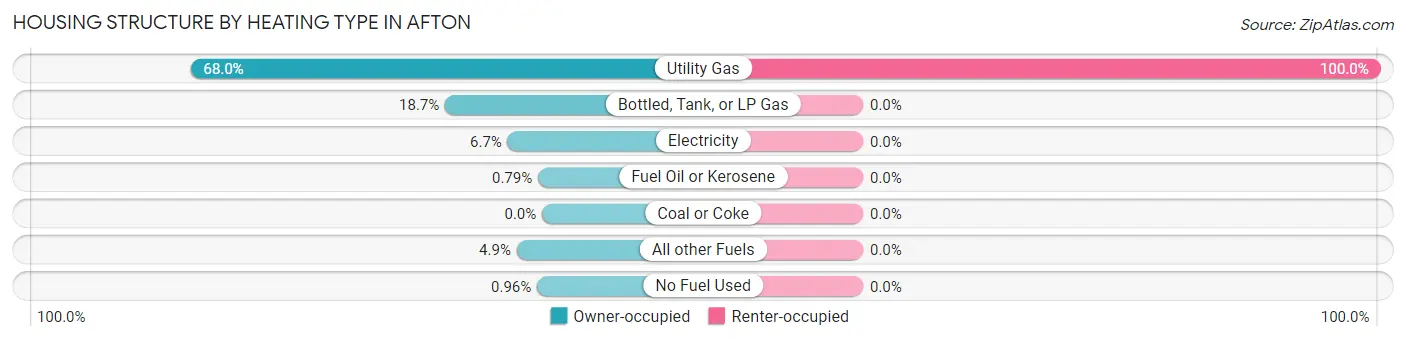
| Heating Type | Owner-occupied | Renter-occupied |
| Utility Gas | 776 (67.9%) | 25 (100.0%) |
| Bottled, Tank, or LP Gas | 214 (18.7%) | 0 (0.0%) |
| Electricity | 76 (6.7%) | 0 (0.0%) |
| Fuel Oil or Kerosene | 9 (0.8%) | 0 (0.0%) |
| Coal or Coke | 0 (0.0%) | 0 (0.0%) |
| All other Fuels | 56 (4.9%) | 0 (0.0%) |
| No Fuel Used | 11 (1.0%) | 0 (0.0%) |
| Total | 1,142 (100.0%) | 25 (100.0%) |
Household Vehicle Usage in Afton
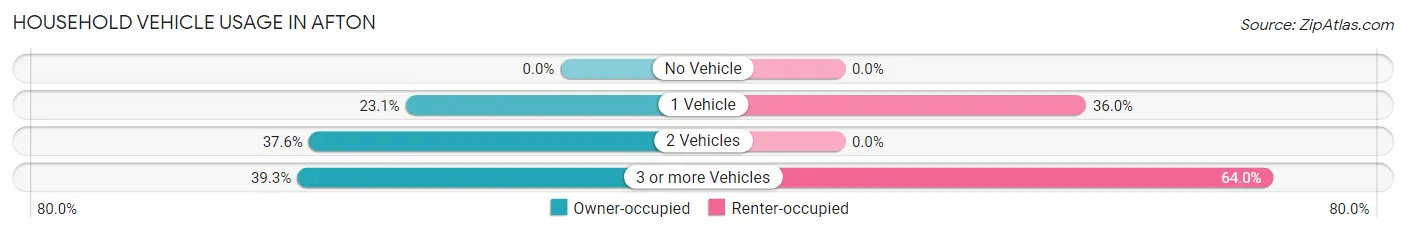
| Vehicles per Household | Owner-occupied | Renter-occupied |
| No Vehicle | 0 (0.0%) | 0 (0.0%) |
| 1 Vehicle | 264 (23.1%) | 9 (36.0%) |
| 2 Vehicles | 429 (37.6%) | 0 (0.0%) |
| 3 or more Vehicles | 449 (39.3%) | 16 (64.0%) |
| Total | 1,142 (100.0%) | 25 (100.0%) |
Real Estate & Mortgages in Afton
Real Estate and Mortgage Overview in Afton
| Characteristic | Without Mortgage | With Mortgage |
| Housing Units | 475 | 667 |
| Median Property Value | $570,100 | $693,200 |
| Median Household Income | $111,250 | $346 |
| Monthly Housing Costs | $932 | $328 |
| Real Estate Taxes | $5,751 | $0 |
Property Value by Mortgage Status in Afton
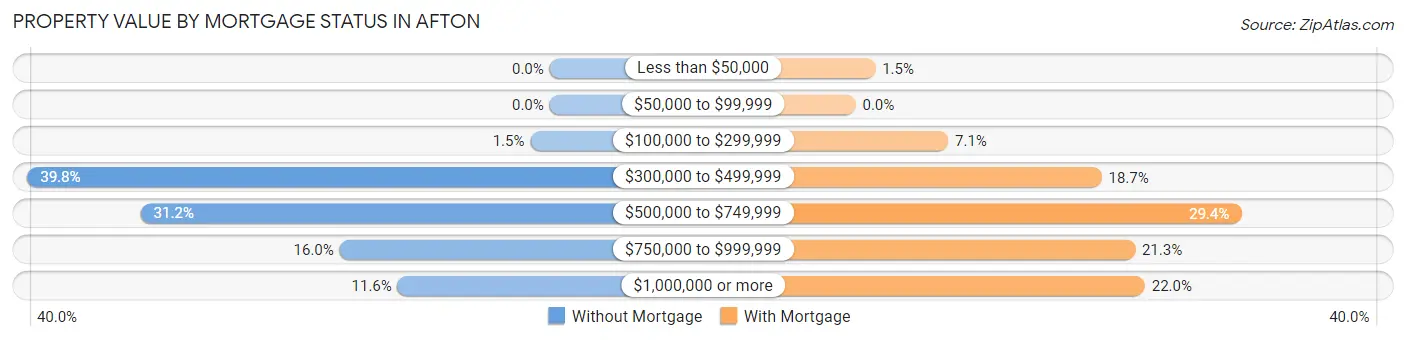
| Property Value | Without Mortgage | With Mortgage |
| Less than $50,000 | 0 (0.0%) | 10 (1.5%) |
| $50,000 to $99,999 | 0 (0.0%) | 0 (0.0%) |
| $100,000 to $299,999 | 7 (1.5%) | 47 (7.0%) |
| $300,000 to $499,999 | 189 (39.8%) | 125 (18.7%) |
| $500,000 to $749,999 | 148 (31.2%) | 196 (29.4%) |
| $750,000 to $999,999 | 76 (16.0%) | 142 (21.3%) |
| $1,000,000 or more | 55 (11.6%) | 147 (22.0%) |
| Total | 475 (100.0%) | 667 (100.0%) |
Household Income by Mortgage Status in Afton
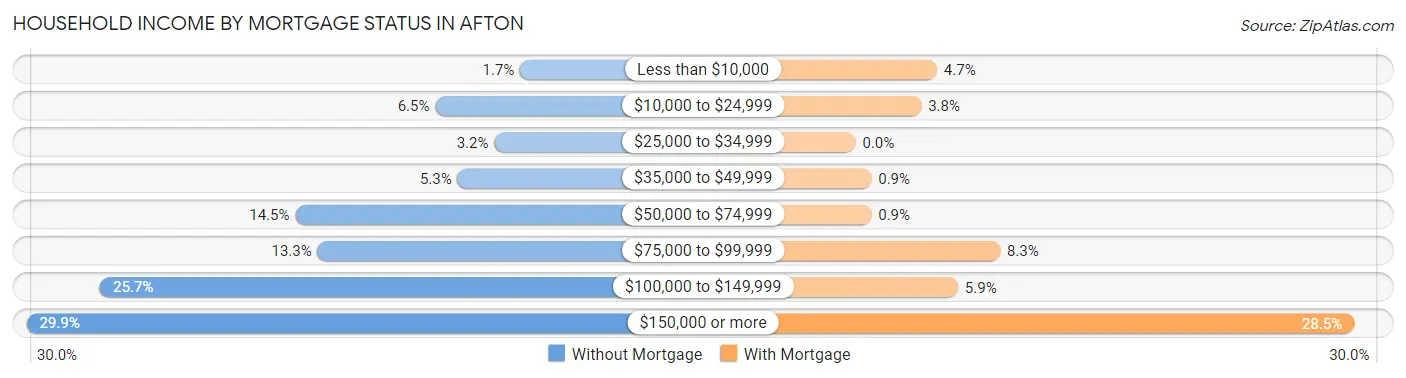
| Household Income | Without Mortgage | With Mortgage |
| Less than $10,000 | 8 (1.7%) | 31 (4.6%) |
| $10,000 to $24,999 | 31 (6.5%) | 25 (3.7%) |
| $25,000 to $34,999 | 15 (3.2%) | 0 (0.0%) |
| $35,000 to $49,999 | 25 (5.3%) | 6 (0.9%) |
| $50,000 to $74,999 | 69 (14.5%) | 6 (0.9%) |
| $75,000 to $99,999 | 63 (13.3%) | 55 (8.3%) |
| $100,000 to $149,999 | 122 (25.7%) | 39 (5.9%) |
| $150,000 or more | 142 (29.9%) | 190 (28.5%) |
| Total | 475 (100.0%) | 667 (100.0%) |
Property Value to Household Income Ratio in Afton
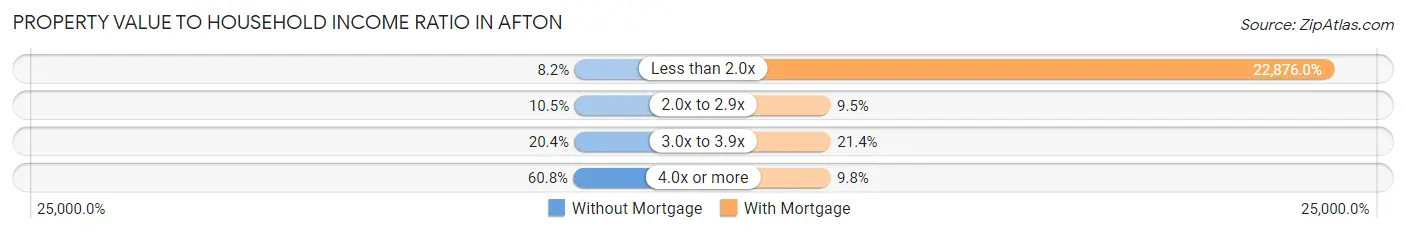
| Value-to-Income Ratio | Without Mortgage | With Mortgage |
| Less than 2.0x | 39 (8.2%) | 152,583 (22,876.0%) |
| 2.0x to 2.9x | 50 (10.5%) | 63 (9.5%) |
| 3.0x to 3.9x | 97 (20.4%) | 143 (21.4%) |
| 4.0x or more | 289 (60.8%) | 65 (9.8%) |
| Total | 475 (100.0%) | 667 (100.0%) |
Real Estate Taxes by Mortgage Status in Afton
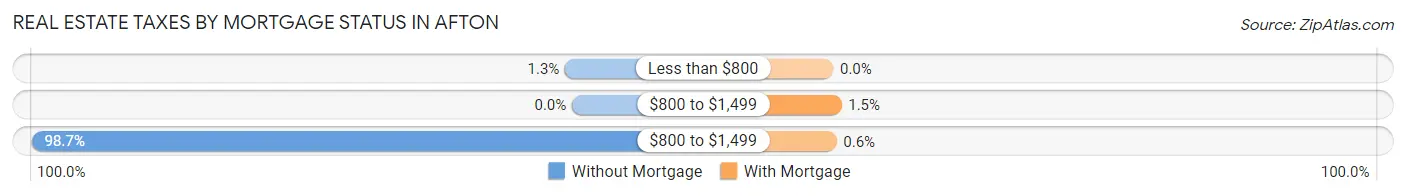
| Property Taxes | Without Mortgage | With Mortgage |
| Less than $800 | 6 (1.3%) | 0 (0.0%) |
| $800 to $1,499 | 0 (0.0%) | 10 (1.5%) |
| $800 to $1,499 | 469 (98.7%) | 4 (0.6%) |
| Total | 475 (100.0%) | 667 (100.0%) |
Health & Disability in Afton
Health Insurance Coverage by Age in Afton
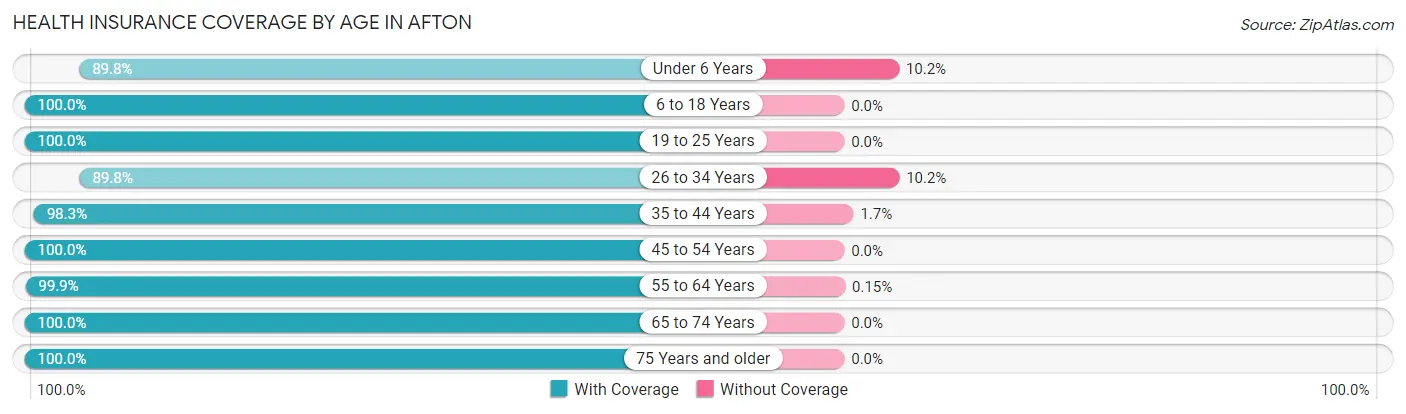
| Age Bracket | With Coverage | Without Coverage |
| Under 6 Years | 141 (89.8%) | 16 (10.2%) |
| 6 to 18 Years | 426 (100.0%) | 0 (0.0%) |
| 19 to 25 Years | 135 (100.0%) | 0 (0.0%) |
| 26 to 34 Years | 263 (89.8%) | 30 (10.2%) |
| 35 to 44 Years | 288 (98.3%) | 5 (1.7%) |
| 45 to 54 Years | 302 (100.0%) | 0 (0.0%) |
| 55 to 64 Years | 645 (99.9%) | 1 (0.2%) |
| 65 to 74 Years | 470 (100.0%) | 0 (0.0%) |
| 75 Years and older | 222 (100.0%) | 0 (0.0%) |
| Total | 2,892 (98.2%) | 52 (1.8%) |
Health Insurance Coverage by Citizenship Status in Afton
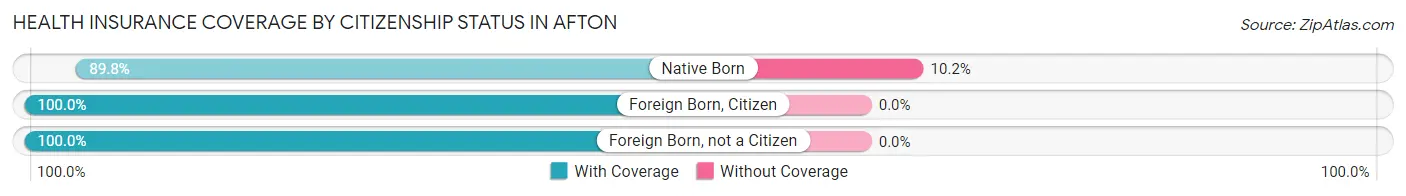
| Citizenship Status | With Coverage | Without Coverage |
| Native Born | 141 (89.8%) | 16 (10.2%) |
| Foreign Born, Citizen | 426 (100.0%) | 0 (0.0%) |
| Foreign Born, not a Citizen | 135 (100.0%) | 0 (0.0%) |
Health Insurance Coverage by Household Income in Afton
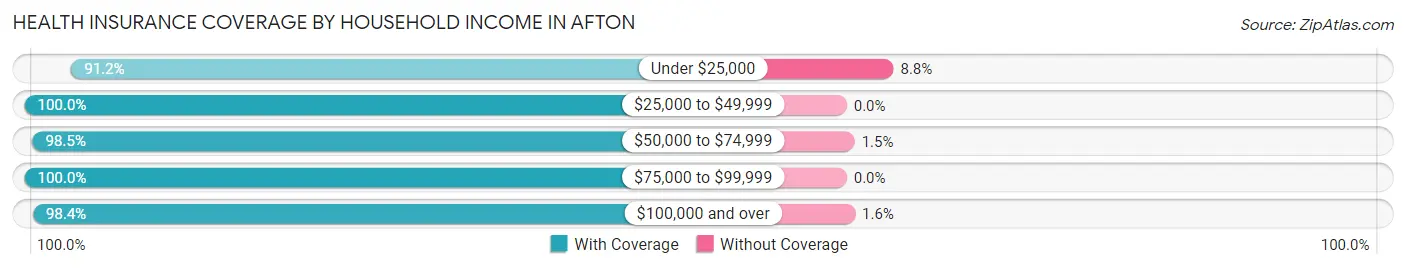
| Household Income | With Coverage | Without Coverage |
| Under $25,000 | 125 (91.2%) | 12 (8.8%) |
| $25,000 to $49,999 | 85 (100.0%) | 0 (0.0%) |
| $50,000 to $74,999 | 267 (98.5%) | 4 (1.5%) |
| $75,000 to $99,999 | 205 (100.0%) | 0 (0.0%) |
| $100,000 and over | 2,206 (98.4%) | 35 (1.6%) |
Public vs Private Health Insurance Coverage by Age in Afton
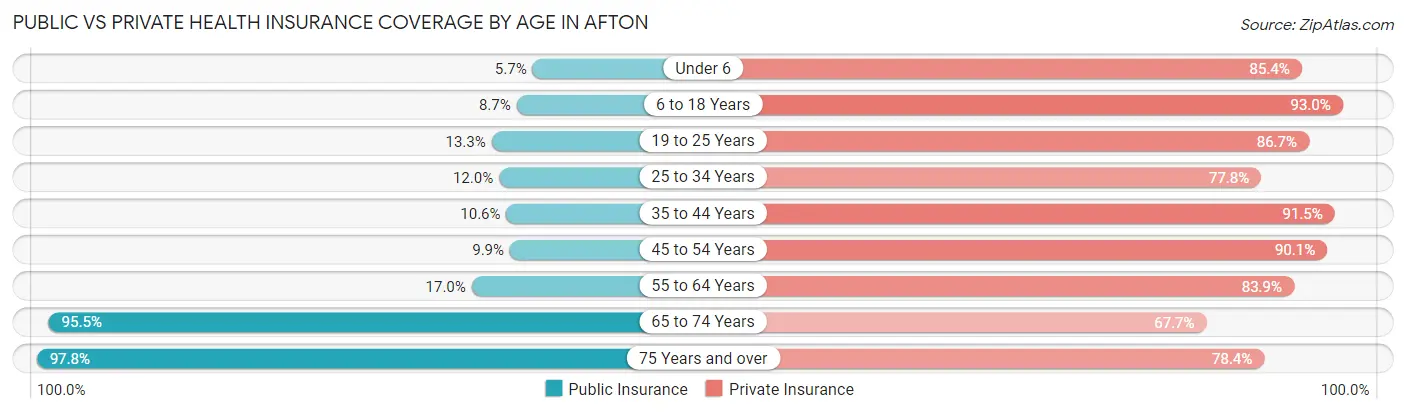
| Age Bracket | Public Insurance | Private Insurance |
| Under 6 | 9 (5.7%) | 134 (85.4%) |
| 6 to 18 Years | 37 (8.7%) | 396 (93.0%) |
| 19 to 25 Years | 18 (13.3%) | 117 (86.7%) |
| 25 to 34 Years | 35 (11.9%) | 228 (77.8%) |
| 35 to 44 Years | 31 (10.6%) | 268 (91.5%) |
| 45 to 54 Years | 30 (9.9%) | 272 (90.1%) |
| 55 to 64 Years | 110 (17.0%) | 542 (83.9%) |
| 65 to 74 Years | 449 (95.5%) | 318 (67.7%) |
| 75 Years and over | 217 (97.8%) | 174 (78.4%) |
| Total | 936 (31.8%) | 2,449 (83.2%) |
Disability Status by Sex by Age in Afton
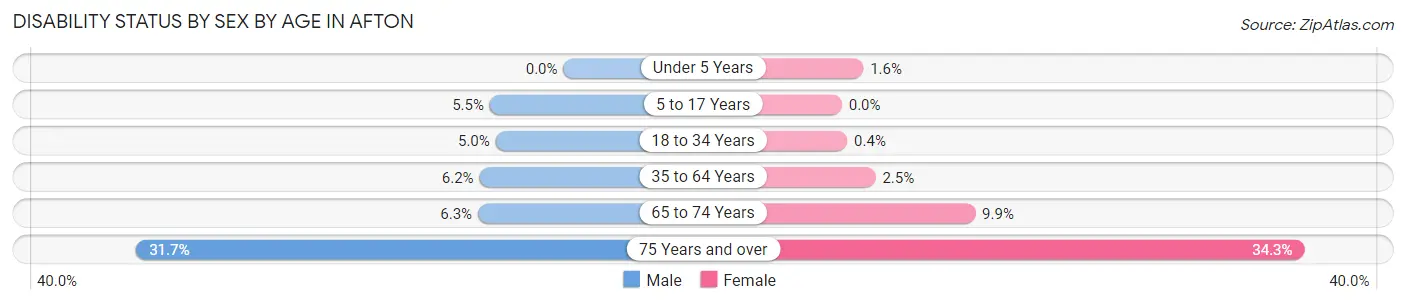
| Age Bracket | Male | Female |
| Under 5 Years | 0 (0.0%) | 1 (1.6%) |
| 5 to 17 Years | 10 (5.5%) | 0 (0.0%) |
| 18 to 34 Years | 10 (5.0%) | 1 (0.4%) |
| 35 to 64 Years | 45 (6.2%) | 13 (2.5%) |
| 65 to 74 Years | 17 (6.3%) | 20 (9.9%) |
| 75 Years and over | 39 (31.7%) | 34 (34.3%) |
Disability Class by Sex by Age in Afton
Disability Class: Hearing Difficulty
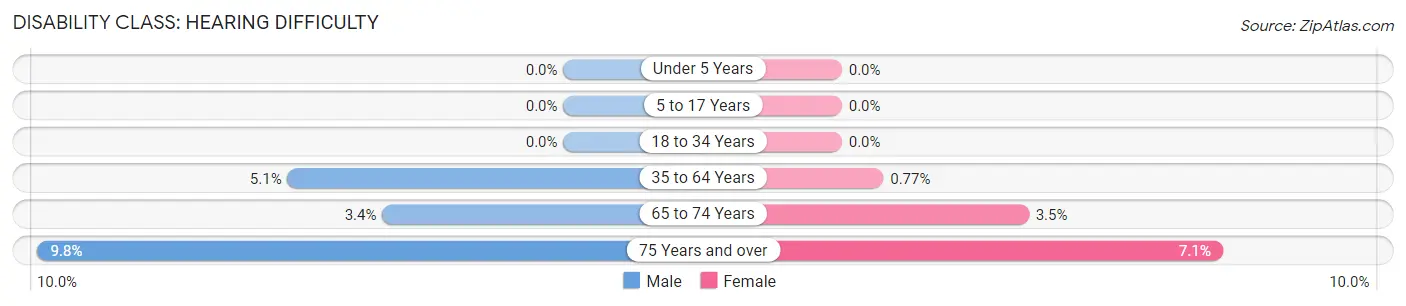
| Age Bracket | Male | Female |
| Under 5 Years | 0 (0.0%) | 0 (0.0%) |
| 5 to 17 Years | 0 (0.0%) | 0 (0.0%) |
| 18 to 34 Years | 0 (0.0%) | 0 (0.0%) |
| 35 to 64 Years | 37 (5.1%) | 4 (0.8%) |
| 65 to 74 Years | 9 (3.4%) | 7 (3.5%) |
| 75 Years and over | 12 (9.8%) | 7 (7.1%) |
Disability Class: Vision Difficulty
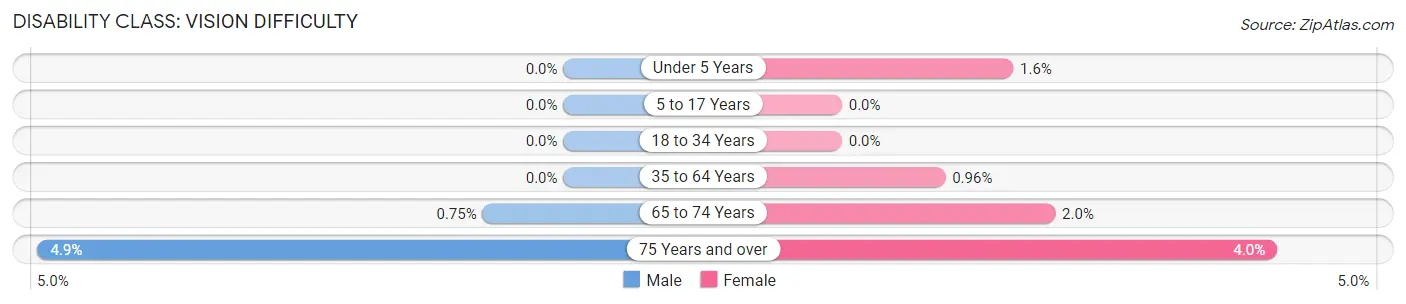
| Age Bracket | Male | Female |
| Under 5 Years | 0 (0.0%) | 1 (1.6%) |
| 5 to 17 Years | 0 (0.0%) | 0 (0.0%) |
| 18 to 34 Years | 0 (0.0%) | 0 (0.0%) |
| 35 to 64 Years | 0 (0.0%) | 5 (1.0%) |
| 65 to 74 Years | 2 (0.7%) | 4 (2.0%) |
| 75 Years and over | 6 (4.9%) | 4 (4.0%) |
Disability Class: Cognitive Difficulty
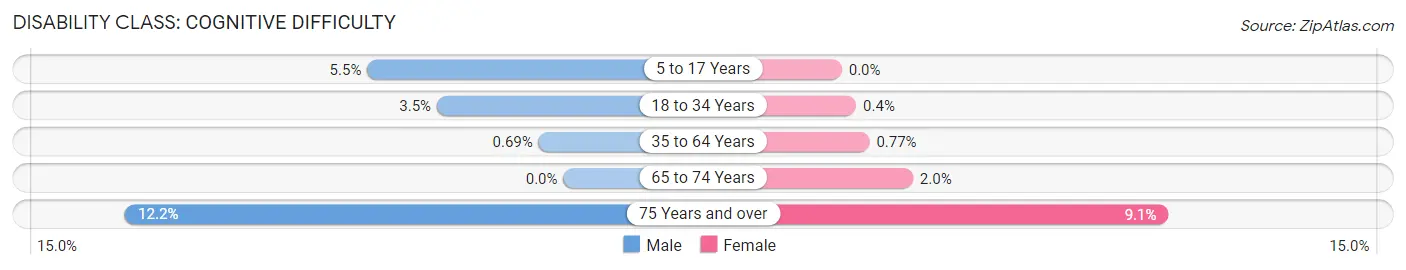
| Age Bracket | Male | Female |
| 5 to 17 Years | 10 (5.5%) | 0 (0.0%) |
| 18 to 34 Years | 7 (3.5%) | 1 (0.4%) |
| 35 to 64 Years | 5 (0.7%) | 4 (0.8%) |
| 65 to 74 Years | 0 (0.0%) | 4 (2.0%) |
| 75 Years and over | 15 (12.2%) | 9 (9.1%) |
Disability Class: Ambulatory Difficulty
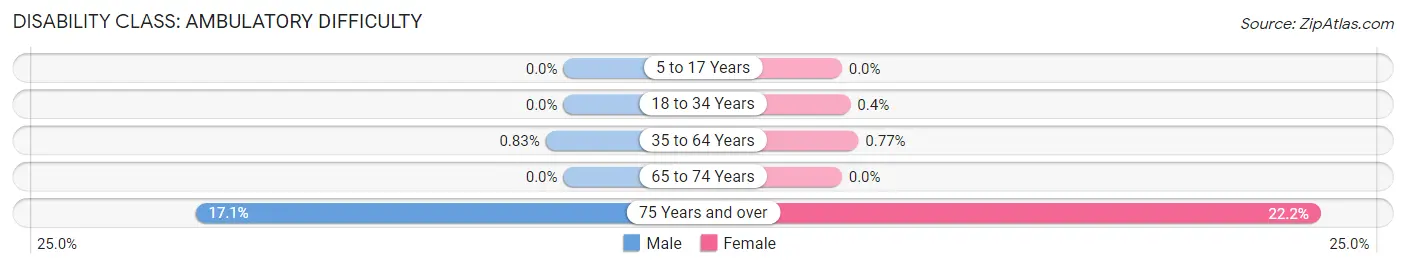
| Age Bracket | Male | Female |
| 5 to 17 Years | 0 (0.0%) | 0 (0.0%) |
| 18 to 34 Years | 0 (0.0%) | 1 (0.4%) |
| 35 to 64 Years | 6 (0.8%) | 4 (0.8%) |
| 65 to 74 Years | 0 (0.0%) | 0 (0.0%) |
| 75 Years and over | 21 (17.1%) | 22 (22.2%) |
Disability Class: Self-Care Difficulty
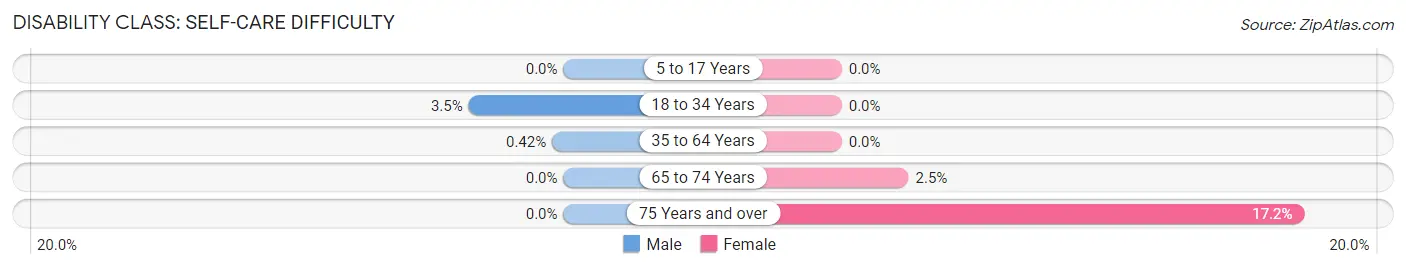
| Age Bracket | Male | Female |
| 5 to 17 Years | 0 (0.0%) | 0 (0.0%) |
| 18 to 34 Years | 7 (3.5%) | 0 (0.0%) |
| 35 to 64 Years | 3 (0.4%) | 0 (0.0%) |
| 65 to 74 Years | 0 (0.0%) | 5 (2.5%) |
| 75 Years and over | 0 (0.0%) | 17 (17.2%) |
Technology Access in Afton
Computing Device Access in Afton
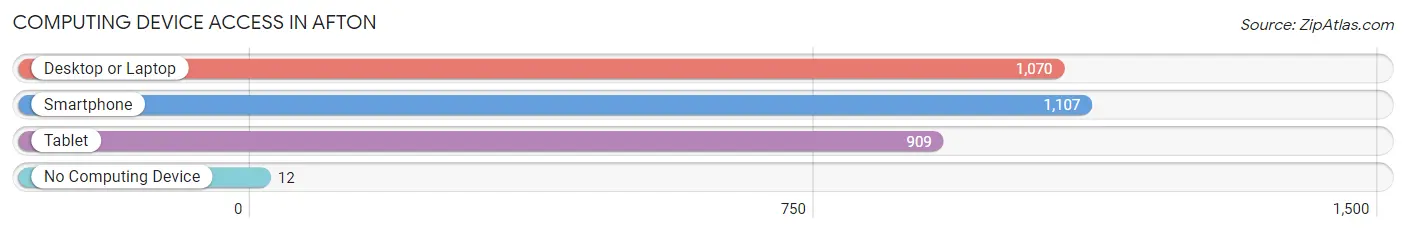
| Device Type | # Households | % Households |
| Desktop or Laptop | 1,070 | 91.7% |
| Smartphone | 1,107 | 94.9% |
| Tablet | 909 | 77.9% |
| No Computing Device | 12 | 1.0% |
| Total | 1,167 | 100.0% |
Internet Access in Afton
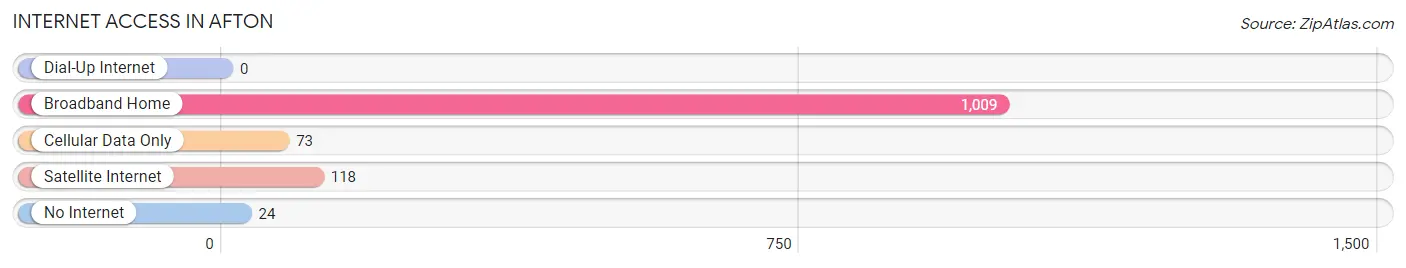
| Internet Type | # Households | % Households |
| Dial-Up Internet | 0 | 0.0% |
| Broadband Home | 1,009 | 86.5% |
| Cellular Data Only | 73 | 6.3% |
| Satellite Internet | 118 | 10.1% |
| No Internet | 24 | 2.1% |
| Total | 1,167 | 100.0% |
Afton Summary
Afton, Minnesota is a small city located in Washington County, Minnesota. It is situated on the St. Croix River, just south of the Twin Cities metropolitan area. The city has a population of approximately 2,500 people and is part of the Stillwater-Woodbury-Afton metropolitan area.
History
Afton was first settled in 1844 by a group of settlers from New York. The settlers named the area after the Afton River in Scotland. The first post office was established in 1854 and the city was officially incorporated in 1858.
The city was originally a farming community, but in the late 19th century, it became a popular tourist destination. The city was home to several resorts, including the Afton House Inn, which was built in 1885. The inn was a popular destination for wealthy families from the Twin Cities area.
In the early 20th century, the city began to experience a period of growth. The St. Croix Valley Railroad was built in 1906, connecting Afton to the Twin Cities. This allowed for increased trade and commerce in the area.
Geography
Afton is located in Washington County, Minnesota. It is situated on the St. Croix River, just south of the Twin Cities metropolitan area. The city has a total area of 4.2 square miles, all of which is land.
The city is located in a hilly area, with the highest point being the Afton Bluff, which is located at an elevation of 890 feet. The city is also home to several lakes, including Lake Afton, Lake St. Croix, and Lake Elmo.
Economy
The economy of Afton is largely based on tourism and agriculture. The city is home to several resorts, including the Afton House Inn, which is a popular destination for tourists from the Twin Cities area. The city is also home to several wineries, including the Afton House Winery and the St. Croix Vineyards.
Agriculture is also an important part of the local economy. The city is home to several farms, which produce a variety of crops, including corn, soybeans, and hay.
Demographics
As of the 2010 census, the population of Afton was 2,521. The racial makeup of the city was 97.2% White, 0.7% African American, 0.2% Native American, 0.7% Asian, 0.1% Pacific Islander, 0.3% from other races, and 0.9% from two or more races. Hispanic or Latino of any race were 1.3% of the population.
The median household income in Afton was $68,750, and the median family income was $76,250. The per capita income for the city was $30,945. About 4.2% of families and 5.3% of the population were below the poverty line, including 6.2% of those under age 18 and 4.2% of those age 65 or over.
Common Questions
What is Per Capita Income in Afton?
Per Capita income in Afton is $70,978.
What is the Median Family Income in Afton?
Median Family Income in Afton is $156,466.
What is the Median Household income in Afton?
Median Household Income in Afton is $124,159.
What is Income or Wage Gap in Afton?
Income or Wage Gap in Afton is 72.2%.
Women in Afton earn 27.8 cents for every dollar earned by a man.
What is Inequality or Gini Index in Afton?
Inequality or Gini Index in Afton is 0.43.
What is the Total Population of Afton?
Total Population of Afton is 2,951.
What is the Total Male Population of Afton?
Total Male Population of Afton is 1,572.
What is the Total Female Population of Afton?
Total Female Population of Afton is 1,379.
What is the Ratio of Males per 100 Females in Afton?
There are 114.00 Males per 100 Females in Afton.
What is the Ratio of Females per 100 Males in Afton?
There are 87.72 Females per 100 Males in Afton.
What is the Median Population Age in Afton?
Median Population Age in Afton is 50.4 Years.
What is the Average Family Size in Afton
Average Family Size in Afton is 3.0 People.
What is the Average Household Size in Afton
Average Household Size in Afton is 2.5 People.
How Large is the Labor Force in Afton?
There are 1,376 People in the Labor Forcein in Afton.
What is the Percentage of People in the Labor Force in Afton?
56.4% of People are in the Labor Force in Afton.
What is the Unemployment Rate in Afton?
Unemployment Rate in Afton is 2.3%.