Farmington, MN Map & Demographics
Farmington Map
Farmington Overview
$44,105
PER CAPITA INCOME
$133,464
AVG FAMILY INCOME
$114,737
AVG HOUSEHOLD INCOME
29.3%
WAGE / INCOME GAP [ % ]
70.7¢/ $1
WAGE / INCOME GAP [ $ ]
0.34
INEQUALITY / GINI INDEX
23,487
TOTAL POPULATION
11,933
MALE POPULATION
11,554
FEMALE POPULATION
103.28
MALES / 100 FEMALES
96.82
FEMALES / 100 MALES
35.1
MEDIAN AGE
3.3
AVG FAMILY SIZE
2.9
AVG HOUSEHOLD SIZE
13,407
LABOR FORCE [ PEOPLE ]
79.3%
PERCENT IN LABOR FORCE
3.4%
UNEMPLOYMENT RATE
Farmington Zip Codes
Income in Farmington
Income Overview in Farmington
Per Capita Income in Farmington is $44,105, while median incomes of families and households are $133,464 and $114,737 respectively.
| Characteristic | Number | Measure |
| Per Capita Income | 23,487 | $44,105 |
| Median Family Income | 6,145 | $133,464 |
| Mean Family Income | 6,145 | $138,861 |
| Median Household Income | 8,122 | $114,737 |
| Mean Household Income | 8,122 | $124,213 |
| Income Deficit | 6,145 | $0 |
| Wage / Income Gap (%) | 23,487 | 29.30% |
| Wage / Income Gap ($) | 23,487 | 70.70¢ per $1 |
| Gini / Inequality Index | 23,487 | 0.34 |
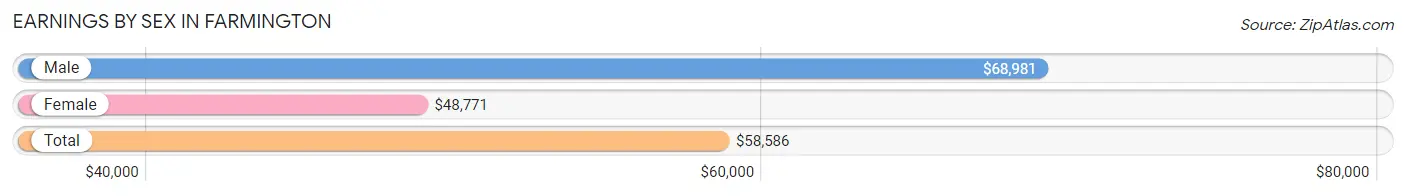
Earnings by Sex in Farmington
Average Earnings in Farmington are $58,586, $68,981 for men and $48,771 for women, a difference of 29.3%.
| Sex | Number | Average Earnings |
| Male | 7,354 (52.6%) | $68,981 |
| Female | 6,633 (47.4%) | $48,771 |
| Total | 13,987 (100.0%) | $58,586 |
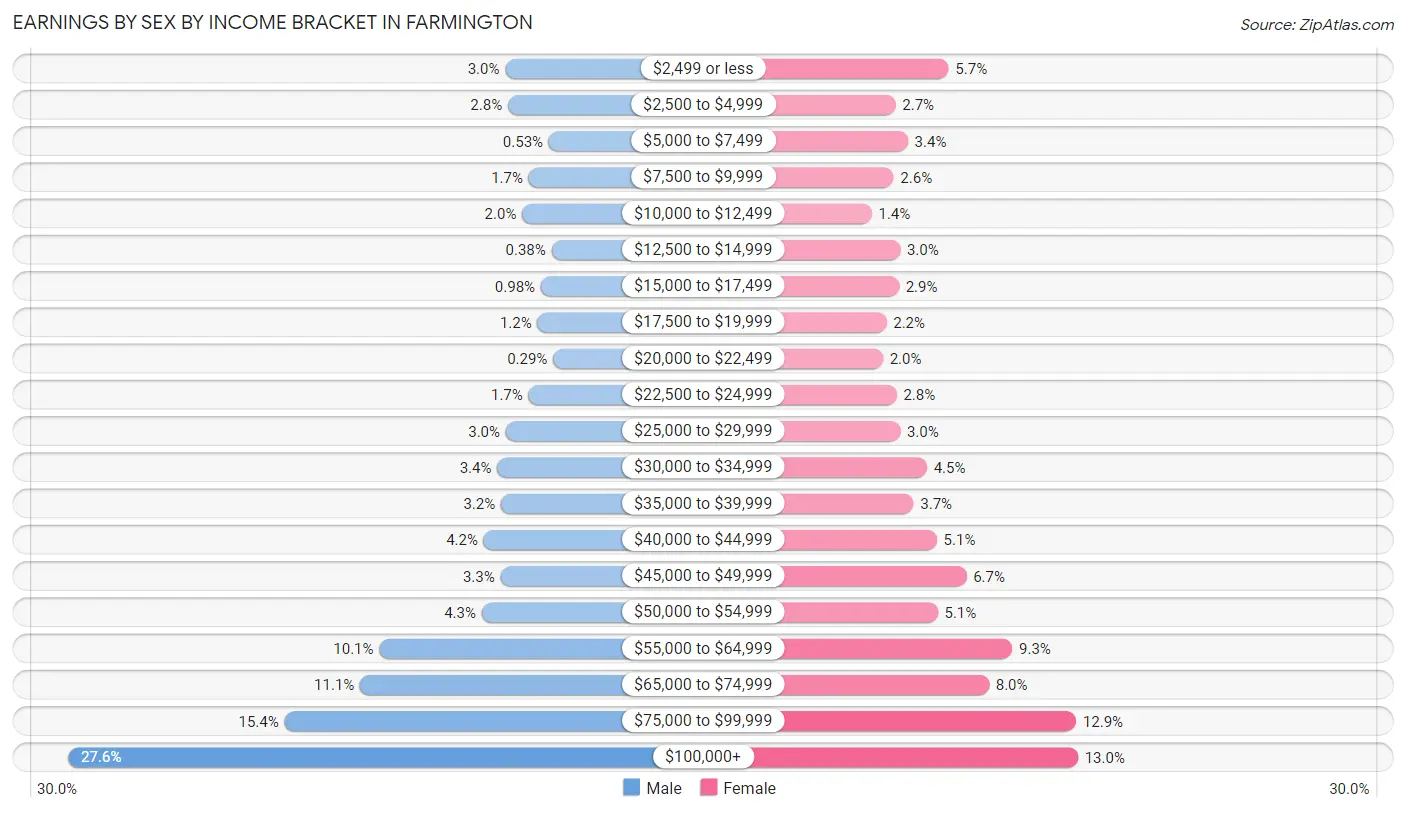
Earnings by Sex by Income Bracket in Farmington
The most common earnings brackets in Farmington are $100,000+ for men (2,027 | 27.6%) and $100,000+ for women (861 | 13.0%).
| Income | Male | Female |
| $2,499 or less | 219 (3.0%) | 379 (5.7%) |
| $2,500 to $4,999 | 208 (2.8%) | 181 (2.7%) |
| $5,000 to $7,499 | 39 (0.5%) | 227 (3.4%) |
| $7,500 to $9,999 | 122 (1.7%) | 174 (2.6%) |
| $10,000 to $12,499 | 149 (2.0%) | 92 (1.4%) |
| $12,500 to $14,999 | 28 (0.4%) | 198 (3.0%) |
| $15,000 to $17,499 | 72 (1.0%) | 194 (2.9%) |
| $17,500 to $19,999 | 86 (1.2%) | 147 (2.2%) |
| $20,000 to $22,499 | 21 (0.3%) | 134 (2.0%) |
| $22,500 to $24,999 | 123 (1.7%) | 185 (2.8%) |
| $25,000 to $29,999 | 217 (2.9%) | 198 (3.0%) |
| $30,000 to $34,999 | 252 (3.4%) | 298 (4.5%) |
| $35,000 to $39,999 | 237 (3.2%) | 248 (3.7%) |
| $40,000 to $44,999 | 308 (4.2%) | 335 (5.1%) |
| $45,000 to $49,999 | 239 (3.3%) | 445 (6.7%) |
| $50,000 to $54,999 | 316 (4.3%) | 338 (5.1%) |
| $55,000 to $64,999 | 740 (10.1%) | 616 (9.3%) |
| $65,000 to $74,999 | 819 (11.1%) | 529 (8.0%) |
| $75,000 to $99,999 | 1,132 (15.4%) | 854 (12.9%) |
| $100,000+ | 2,027 (27.6%) | 861 (13.0%) |
| Total | 7,354 (100.0%) | 6,633 (100.0%) |
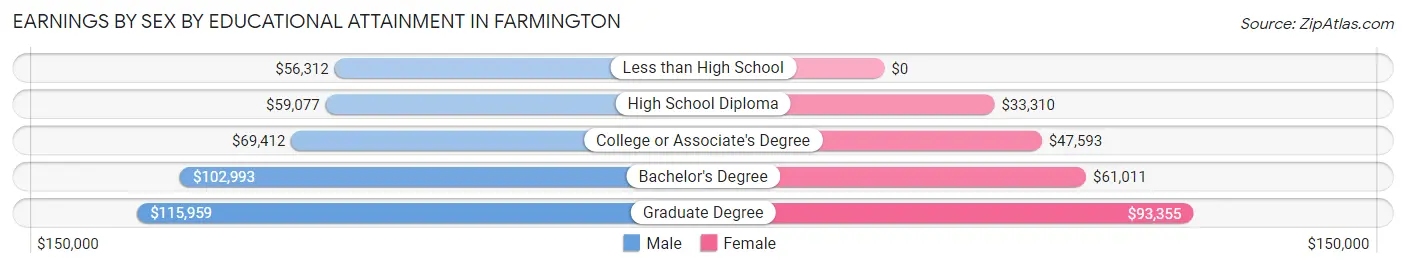
Earnings by Sex by Educational Attainment in Farmington
Average earnings in Farmington are $74,519 for men and $53,996 for women, a difference of 27.5%. Men with an educational attainment of graduate degree enjoy the highest average annual earnings of $115,959, while those with less than high school education earn the least with $56,312. Women with an educational attainment of graduate degree earn the most with the average annual earnings of $93,355, while those with high school diploma education have the smallest earnings of $33,310.
| Educational Attainment | Male Income | Female Income |
| Less than High School | $56,312 | $0 |
| High School Diploma | $59,077 | $33,310 |
| College or Associate's Degree | $69,412 | $47,593 |
| Bachelor's Degree | $102,993 | $61,011 |
| Graduate Degree | $115,959 | $93,355 |
| Total | $74,519 | $53,996 |
Family Income in Farmington
Family Income Brackets in Farmington
According to the Farmington family income data, there are 1,837 families falling into the $100,000 to $149,999 income range, which is the most common income bracket and makes up 29.9% of all families. Conversely, the less than $10,000 income bracket is the least frequent group with only 25 families (0.4%) belonging to this category.
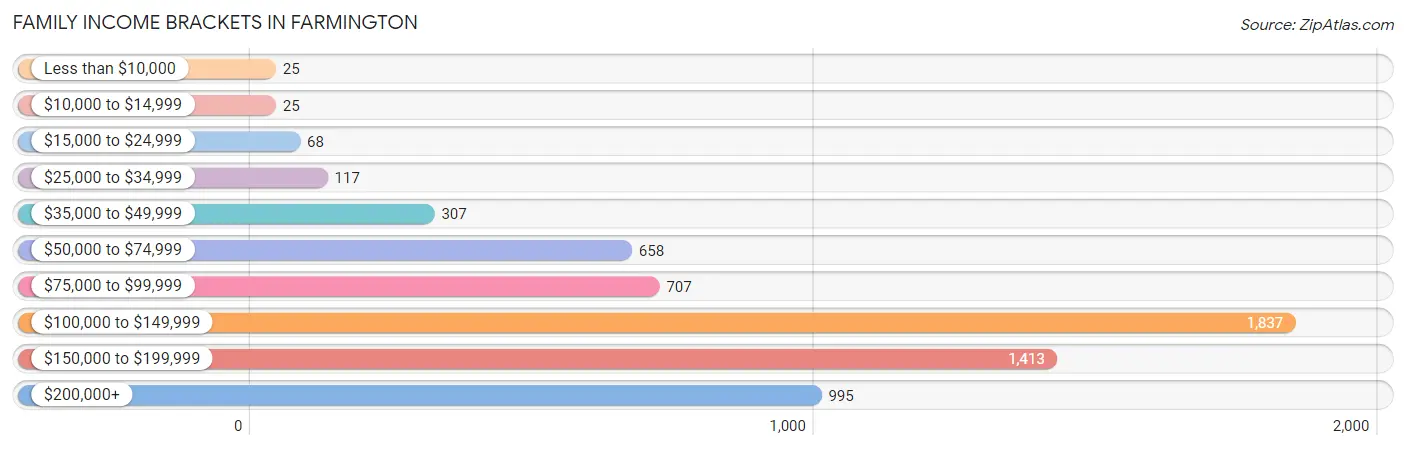
| Income Bracket | # Families | % Families |
| Less than $10,000 | 25 | 0.4% |
| $10,000 to $14,999 | 25 | 0.4% |
| $15,000 to $24,999 | 68 | 1.1% |
| $25,000 to $34,999 | 117 | 1.9% |
| $35,000 to $49,999 | 307 | 5.0% |
| $50,000 to $74,999 | 658 | 10.7% |
| $75,000 to $99,999 | 707 | 11.5% |
| $100,000 to $149,999 | 1,837 | 29.9% |
| $150,000 to $199,999 | 1,413 | 23.0% |
| $200,000+ | 995 | 16.2% |
Family Income by Famaliy Size in Farmington
4-person families (1,483 | 24.1%) account for the highest median family income in Farmington with $160,220 per family, while 2-person families (2,203 | 35.8%) have the highest median income of $55,514 per family member.
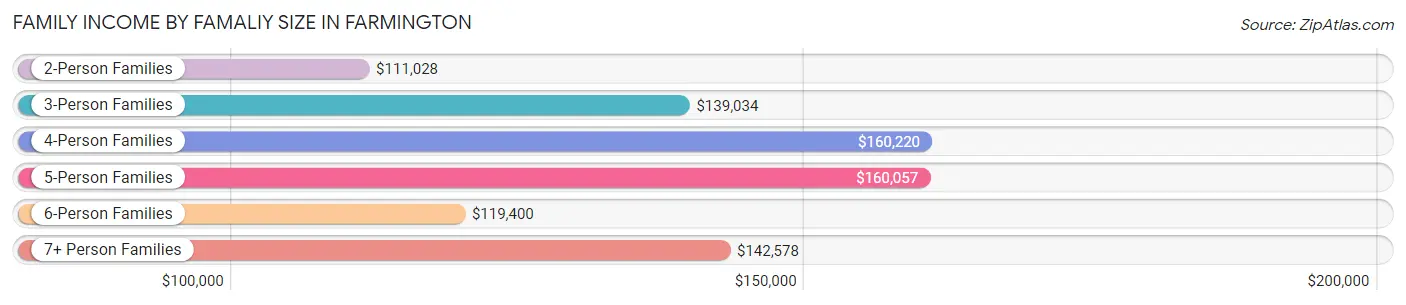
| Income Bracket | # Families | Median Income |
| 2-Person Families | 2,203 (35.8%) | $111,028 |
| 3-Person Families | 1,523 (24.8%) | $139,034 |
| 4-Person Families | 1,483 (24.1%) | $160,220 |
| 5-Person Families | 729 (11.9%) | $160,057 |
| 6-Person Families | 104 (1.7%) | $119,400 |
| 7+ Person Families | 103 (1.7%) | $142,578 |
| Total | 6,145 (100.0%) | $133,464 |
Family Income by Number of Earners in Farmington
The median family income in Farmington is $133,464, with families comprising 3+ earners (1,011) having the highest median family income of $165,284, while families with no earners (419) have the lowest median family income of $64,911, accounting for 16.5% and 6.8% of families, respectively.
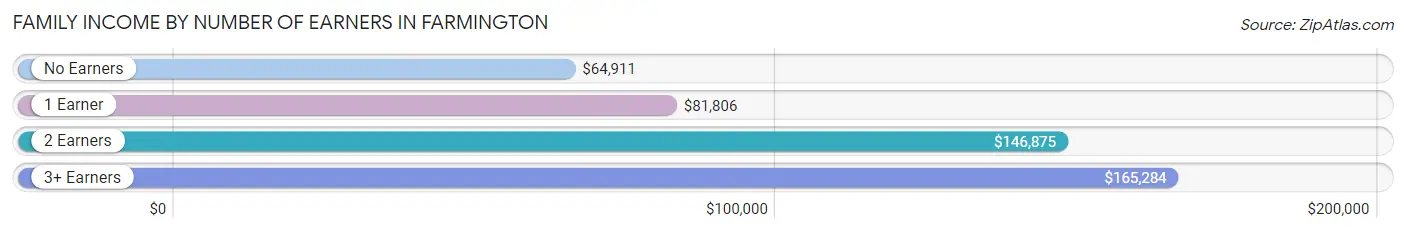
| Number of Earners | # Families | Median Income |
| No Earners | 419 (6.8%) | $64,911 |
| 1 Earner | 1,437 (23.4%) | $81,806 |
| 2 Earners | 3,278 (53.3%) | $146,875 |
| 3+ Earners | 1,011 (16.5%) | $165,284 |
| Total | 6,145 (100.0%) | $133,464 |
Household Income in Farmington
Household Income Brackets in Farmington
With 2,209 households falling in the category, the $100,000 to $149,999 income range is the most frequent in Farmington, accounting for 27.2% of all households. In contrast, only 97 households (1.2%) fall into the $10,000 to $14,999 income bracket, making it the least populous group.
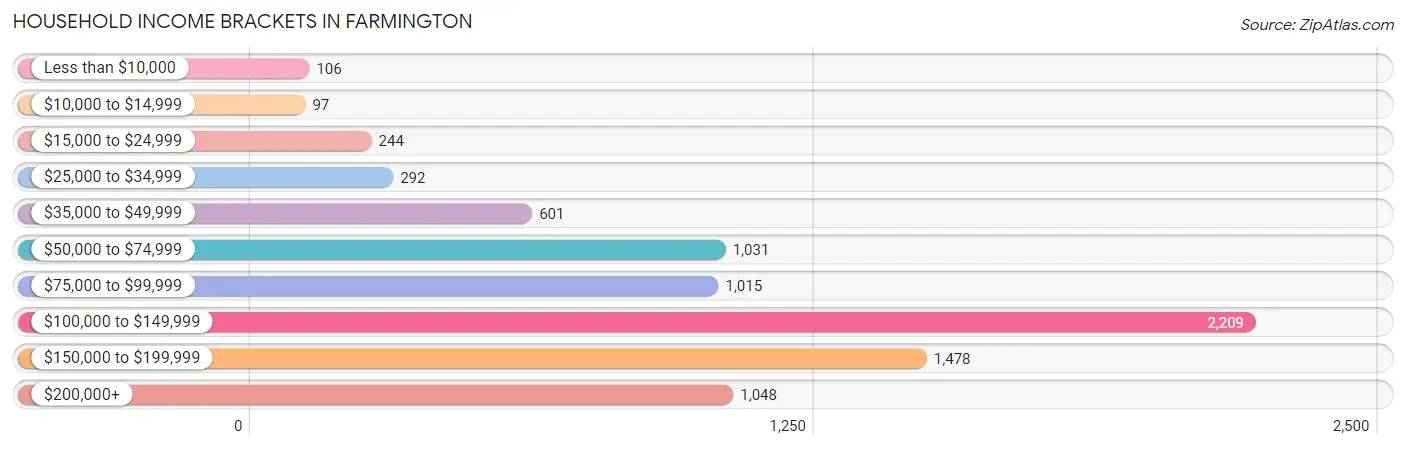
| Income Bracket | # Households | % Households |
| Less than $10,000 | 106 | 1.3% |
| $10,000 to $14,999 | 97 | 1.2% |
| $15,000 to $24,999 | 244 | 3.0% |
| $25,000 to $34,999 | 292 | 3.6% |
| $35,000 to $49,999 | 601 | 7.4% |
| $50,000 to $74,999 | 1,031 | 12.7% |
| $75,000 to $99,999 | 1,015 | 12.5% |
| $100,000 to $149,999 | 2,209 | 27.2% |
| $150,000 to $199,999 | 1,478 | 18.2% |
| $200,000+ | 1,048 | 12.9% |
Household Income by Householder Age in Farmington
The median household income in Farmington is $114,737, with the highest median household income of $130,482 found in the 45 to 64 years age bracket for the primary householder. A total of 3,608 households (44.4%) fall into this category. Meanwhile, the 65+ years age bracket for the primary householder has the lowest median household income of $54,734, with 1,186 households (14.6%) in this group.
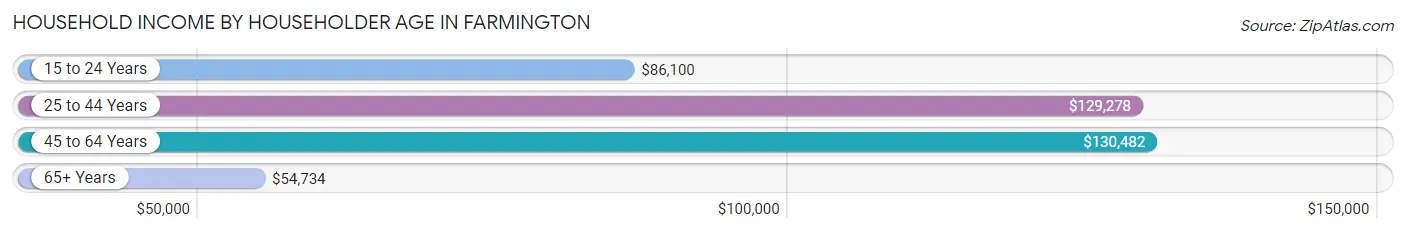
| Income Bracket | # Households | Median Income |
| 15 to 24 Years | 104 (1.3%) | $86,100 |
| 25 to 44 Years | 3,224 (39.7%) | $129,278 |
| 45 to 64 Years | 3,608 (44.4%) | $130,482 |
| 65+ Years | 1,186 (14.6%) | $54,734 |
| Total | 8,122 (100.0%) | $114,737 |
Poverty in Farmington
Income Below Poverty by Sex and Age in Farmington
With 2.3% poverty level for males and 4.3% for females among the residents of Farmington, 12 to 14 year old males and 15 year old females are the most vulnerable to poverty, with 40 males (9.9%) and 74 females (30.2%) in their respective age groups living below the poverty level.
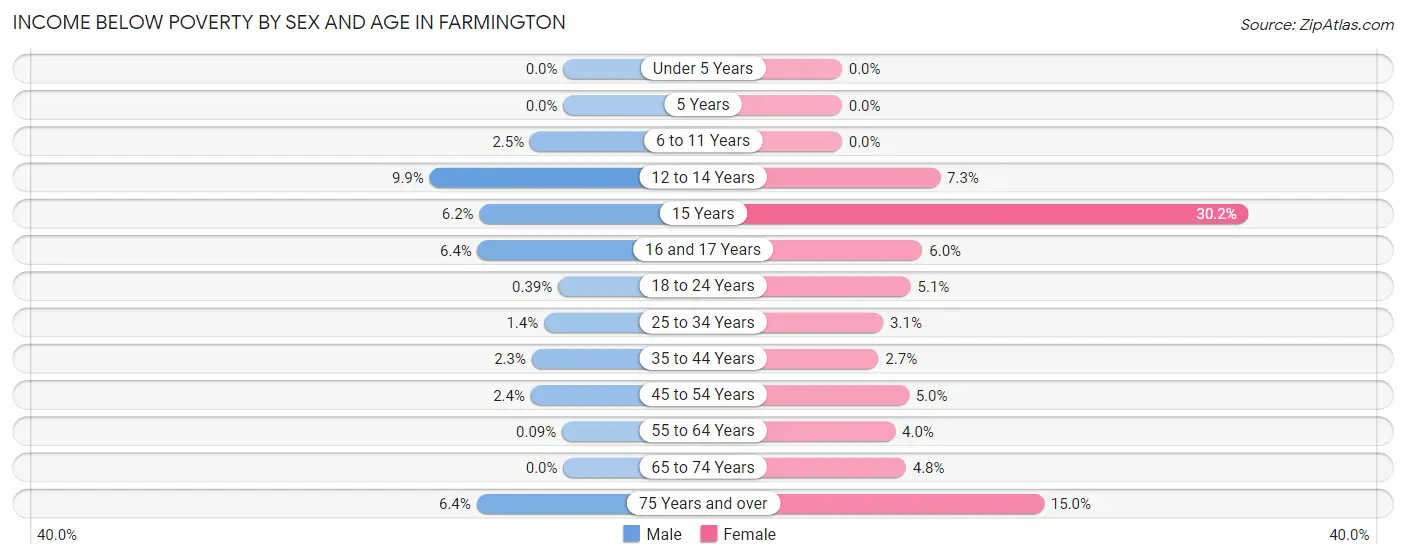
| Age Bracket | Male | Female |
| Under 5 Years | 0 (0.0%) | 0 (0.0%) |
| 5 Years | 0 (0.0%) | 0 (0.0%) |
| 6 to 11 Years | 34 (2.5%) | 0 (0.0%) |
| 12 to 14 Years | 40 (9.9%) | 44 (7.3%) |
| 15 Years | 24 (6.2%) | 74 (30.2%) |
| 16 and 17 Years | 30 (6.4%) | 25 (6.0%) |
| 18 to 24 Years | 3 (0.4%) | 29 (5.1%) |
| 25 to 34 Years | 22 (1.4%) | 41 (3.1%) |
| 35 to 44 Years | 43 (2.3%) | 54 (2.7%) |
| 45 to 54 Years | 47 (2.4%) | 78 (5.0%) |
| 55 to 64 Years | 1 (0.1%) | 60 (4.0%) |
| 65 to 74 Years | 0 (0.0%) | 26 (4.8%) |
| 75 Years and over | 23 (6.4%) | 60 (15.0%) |
| Total | 267 (2.3%) | 491 (4.3%) |
Income Above Poverty by Sex and Age in Farmington
According to the poverty statistics in Farmington, males aged under 5 years and females aged under 5 years are the age groups that are most secure financially, with 100.0% of males and 100.0% of females in these age groups living above the poverty line.
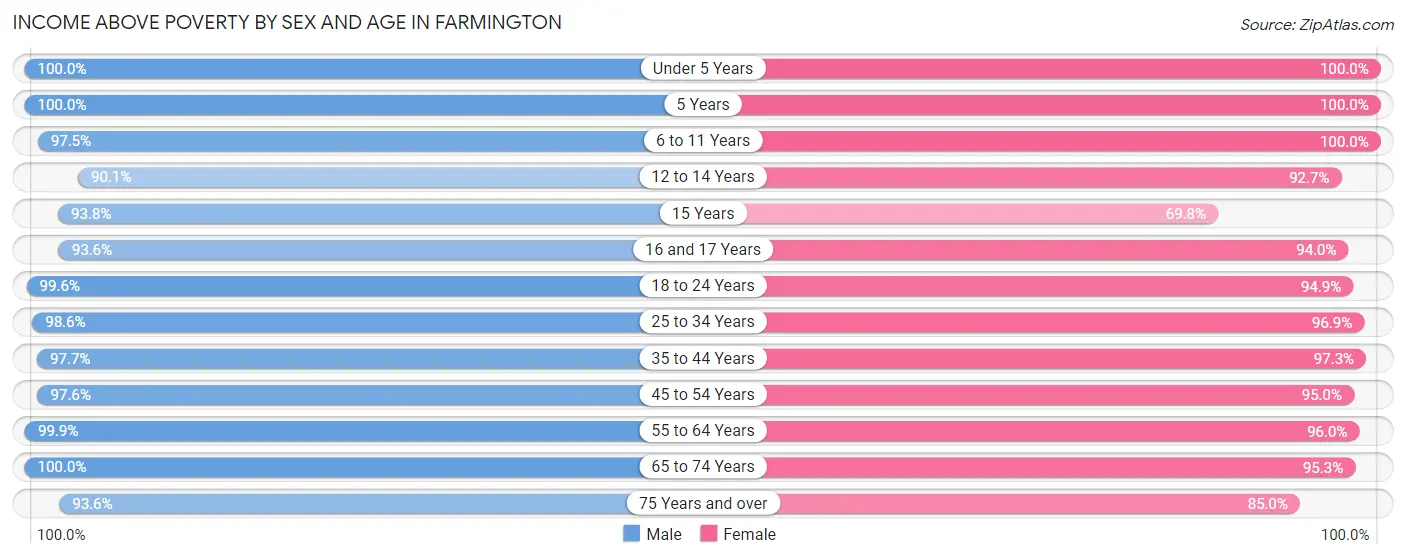
| Age Bracket | Male | Female |
| Under 5 Years | 858 (100.0%) | 832 (100.0%) |
| 5 Years | 222 (100.0%) | 167 (100.0%) |
| 6 to 11 Years | 1,340 (97.5%) | 1,300 (100.0%) |
| 12 to 14 Years | 363 (90.1%) | 559 (92.7%) |
| 15 Years | 361 (93.8%) | 171 (69.8%) |
| 16 and 17 Years | 442 (93.6%) | 393 (94.0%) |
| 18 to 24 Years | 767 (99.6%) | 538 (94.9%) |
| 25 to 34 Years | 1,512 (98.6%) | 1,294 (96.9%) |
| 35 to 44 Years | 1,792 (97.7%) | 1,929 (97.3%) |
| 45 to 54 Years | 1,894 (97.6%) | 1,492 (95.0%) |
| 55 to 64 Years | 1,132 (99.9%) | 1,455 (96.0%) |
| 65 to 74 Years | 459 (100.0%) | 521 (95.3%) |
| 75 Years and over | 334 (93.6%) | 340 (85.0%) |
| Total | 11,476 (97.7%) | 10,991 (95.7%) |
Income Below Poverty Among Married-Couple Families in Farmington
The poverty statistics for married-couple families in Farmington show that 0.5% or 22 of the total 4,625 families live below the poverty line. Families with no children have the highest poverty rate of 1.0%, comprising of 22 families. On the other hand, families with 1 or 2 children have the lowest poverty rate of 0.0%, which includes 0 families.
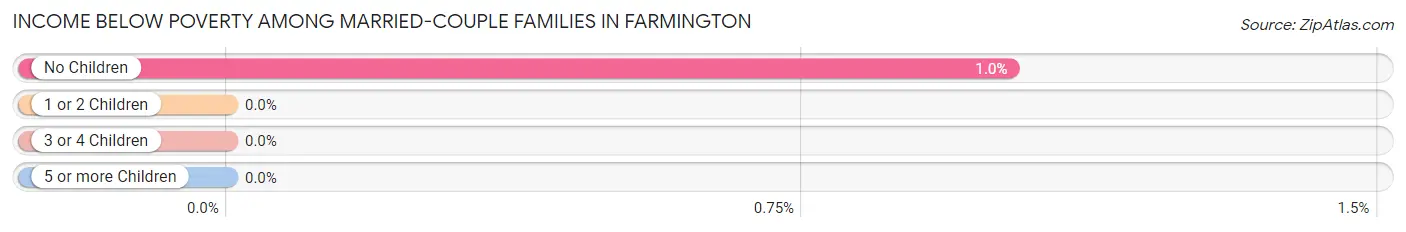
| Children | Above Poverty | Below Poverty |
| No Children | 2,132 (99.0%) | 22 (1.0%) |
| 1 or 2 Children | 1,825 (100.0%) | 0 (0.0%) |
| 3 or 4 Children | 603 (100.0%) | 0 (0.0%) |
| 5 or more Children | 43 (100.0%) | 0 (0.0%) |
| Total | 4,603 (99.5%) | 22 (0.5%) |
Income Below Poverty Among Single-Parent Households in Farmington
According to the poverty data in Farmington, 3.6% or 18 single-father households and 7.1% or 73 single-mother households are living below the poverty line. Among single-father households, those with 1 or 2 children have the highest poverty rate, with 18 households (6.0%) experiencing poverty. Likewise, among single-mother households, those with 3 or 4 children have the highest poverty rate, with 47 households (29.2%) falling below the poverty line.
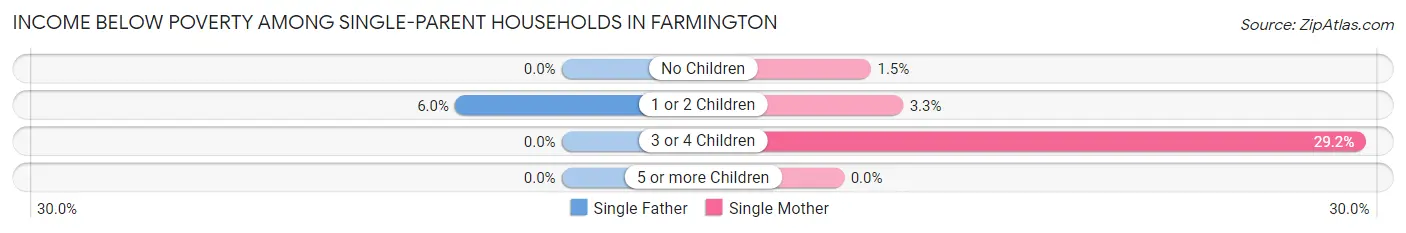
| Children | Single Father | Single Mother |
| No Children | 0 (0.0%) | 2 (1.5%) |
| 1 or 2 Children | 18 (6.0%) | 24 (3.3%) |
| 3 or 4 Children | 0 (0.0%) | 47 (29.2%) |
| 5 or more Children | 0 (0.0%) | 0 (0.0%) |
| Total | 18 (3.6%) | 73 (7.1%) |
Income Below Poverty Among Married-Couple vs Single-Parent Households in Farmington
The poverty data for Farmington shows that 22 of the married-couple family households (0.5%) and 91 of the single-parent households (6.0%) are living below the poverty level. Within the married-couple family households, those with no children have the highest poverty rate, with 22 households (1.0%) falling below the poverty line. Among the single-parent households, those with 3 or 4 children have the highest poverty rate, with 47 household (17.3%) living below poverty.
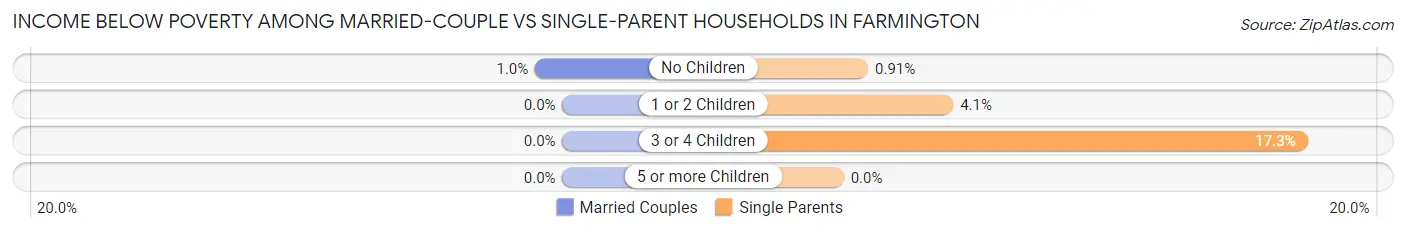
| Children | Married-Couple Families | Single-Parent Households |
| No Children | 22 (1.0%) | 2 (0.9%) |
| 1 or 2 Children | 0 (0.0%) | 42 (4.1%) |
| 3 or 4 Children | 0 (0.0%) | 47 (17.3%) |
| 5 or more Children | 0 (0.0%) | 0 (0.0%) |
| Total | 22 (0.5%) | 91 (6.0%) |
Race in Farmington
The most populous races in Farmington are White / Caucasian (20,473 | 87.2%), Hispanic or Latino (1,239 | 5.3%), and Two or more Races (1,017 | 4.3%).
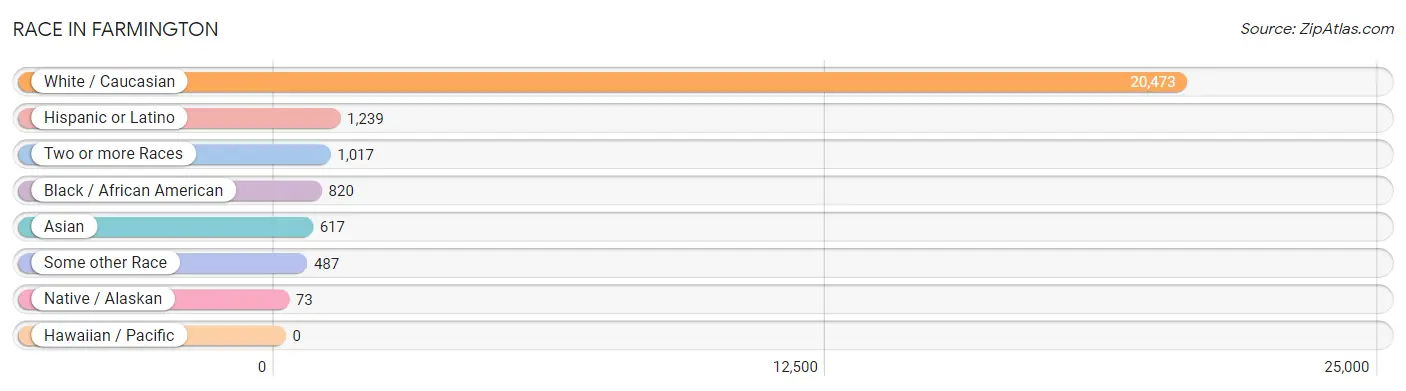
| Race | # Population | % Population |
| Asian | 617 | 2.6% |
| Black / African American | 820 | 3.5% |
| Hawaiian / Pacific | 0 | 0.0% |
| Hispanic or Latino | 1,239 | 5.3% |
| Native / Alaskan | 73 | 0.3% |
| White / Caucasian | 20,473 | 87.2% |
| Two or more Races | 1,017 | 4.3% |
| Some other Race | 487 | 2.1% |
| Total | 23,487 | 100.0% |
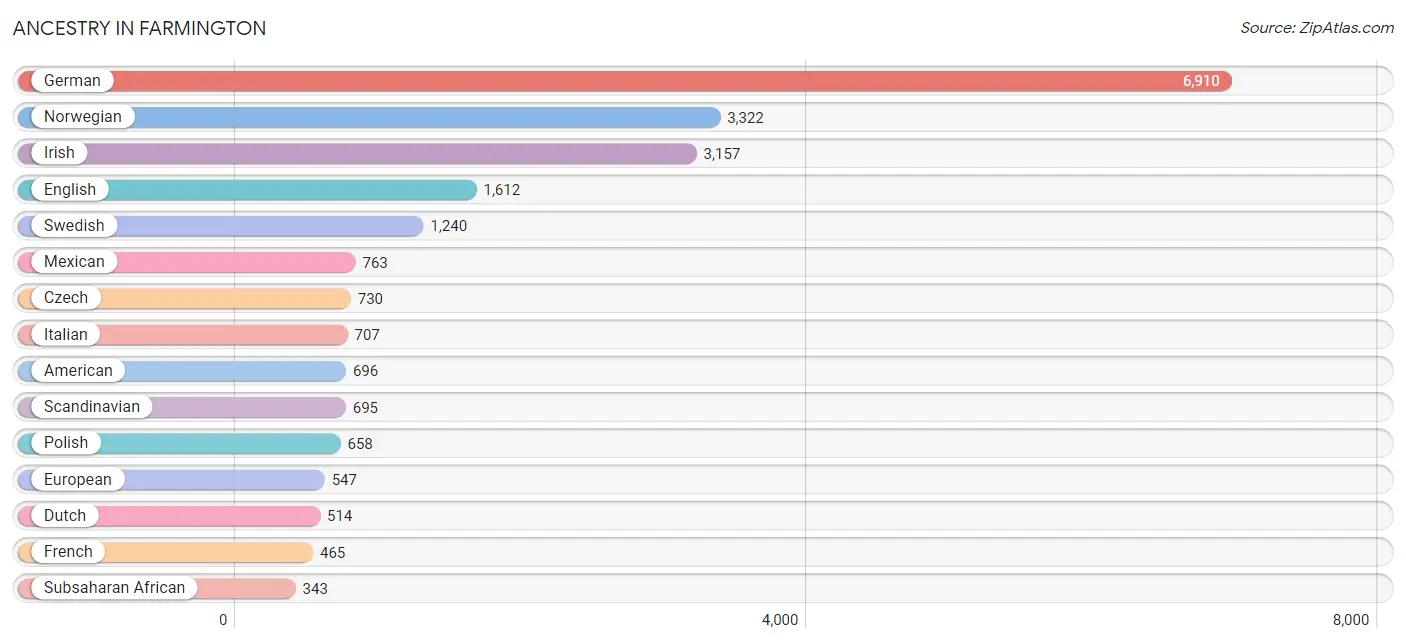
Ancestry in Farmington
The most populous ancestries reported in Farmington are German (6,910 | 29.4%), Norwegian (3,322 | 14.1%), Irish (3,157 | 13.4%), English (1,612 | 6.9%), and Swedish (1,240 | 5.3%), together accounting for 69.1% of all Farmington residents.
| Ancestry | # Population | % Population |
| African | 86 | 0.4% |
| Aleut | 26 | 0.1% |
| American | 696 | 3.0% |
| Arab | 39 | 0.2% |
| Austrian | 100 | 0.4% |
| Belgian | 155 | 0.7% |
| Bhutanese | 53 | 0.2% |
| British | 44 | 0.2% |
| Burmese | 82 | 0.4% |
| Central American | 269 | 1.1% |
| Chippewa | 135 | 0.6% |
| Colombian | 30 | 0.1% |
| Costa Rican | 3 | 0.0% |
| Croatian | 99 | 0.4% |
| Cuban | 45 | 0.2% |
| Czech | 730 | 3.1% |
| Czechoslovakian | 87 | 0.4% |
| Danish | 336 | 1.4% |
| Dutch | 514 | 2.2% |
| Egyptian | 39 | 0.2% |
| English | 1,612 | 6.9% |
| Estonian | 12 | 0.1% |
| Ethiopian | 92 | 0.4% |
| European | 547 | 2.3% |
| Finnish | 274 | 1.2% |
| French | 465 | 2.0% |
| French Canadian | 315 | 1.3% |
| German | 6,910 | 29.4% |
| Greek | 10 | 0.0% |
| Guyanese | 14 | 0.1% |
| Hungarian | 120 | 0.5% |
| Icelander | 8 | 0.0% |
| Indian (Asian) | 17 | 0.1% |
| Irish | 3,157 | 13.4% |
| Italian | 707 | 3.0% |
| Japanese | 62 | 0.3% |
| Korean | 316 | 1.3% |
| Liberian | 5 | 0.0% |
| Lithuanian | 57 | 0.2% |
| Mexican | 763 | 3.3% |
| Nigerian | 141 | 0.6% |
| Northern European | 121 | 0.5% |
| Norwegian | 3,322 | 14.1% |
| Pennsylvania German | 6 | 0.0% |
| Polish | 658 | 2.8% |
| Puerto Rican | 82 | 0.4% |
| Romanian | 19 | 0.1% |
| Russian | 189 | 0.8% |
| Salvadoran | 266 | 1.1% |
| Scandinavian | 695 | 3.0% |
| Scotch-Irish | 44 | 0.2% |
| Scottish | 182 | 0.8% |
| Sioux | 5 | 0.0% |
| Slovak | 8 | 0.0% |
| Slovene | 16 | 0.1% |
| South African | 19 | 0.1% |
| South American | 80 | 0.3% |
| Sri Lankan | 140 | 0.6% |
| Subsaharan African | 343 | 1.5% |
| Swedish | 1,240 | 5.3% |
| Swiss | 74 | 0.3% |
| Thai | 149 | 0.6% |
| Trinidadian and Tobagonian | 33 | 0.1% |
| Ukrainian | 50 | 0.2% |
| Venezuelan | 50 | 0.2% |
| Welsh | 135 | 0.6% |
| West Indian | 14 | 0.1% | View All 67 Rows |
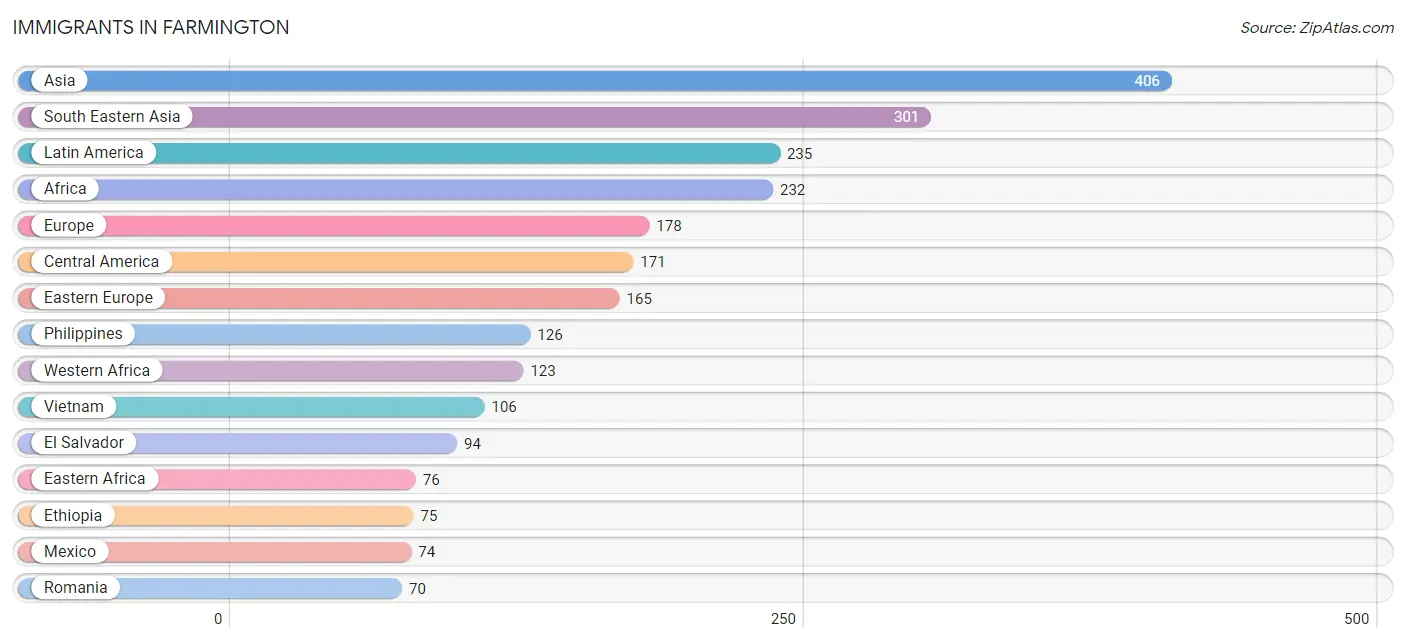
Immigrants in Farmington
The most numerous immigrant groups reported in Farmington came from Asia (406 | 1.7%), South Eastern Asia (301 | 1.3%), Latin America (235 | 1.0%), Africa (232 | 1.0%), and Europe (178 | 0.8%), together accounting for 5.8% of all Farmington residents.
| Immigration Origin | # Population | % Population |
| Africa | 232 | 1.0% |
| Asia | 406 | 1.7% |
| Bangladesh | 9 | 0.0% |
| Cambodia | 28 | 0.1% |
| Canada | 18 | 0.1% |
| Caribbean | 8 | 0.0% |
| Central America | 171 | 0.7% |
| China | 32 | 0.1% |
| Colombia | 9 | 0.0% |
| Costa Rica | 3 | 0.0% |
| Cuba | 8 | 0.0% |
| Eastern Africa | 76 | 0.3% |
| Eastern Asia | 64 | 0.3% |
| Eastern Europe | 165 | 0.7% |
| Ecuador | 8 | 0.0% |
| Egypt | 24 | 0.1% |
| El Salvador | 94 | 0.4% |
| Ethiopia | 75 | 0.3% |
| Europe | 178 | 0.8% |
| Germany | 2 | 0.0% |
| Guyana | 39 | 0.2% |
| India | 19 | 0.1% |
| Korea | 32 | 0.1% |
| Laos | 23 | 0.1% |
| Latin America | 235 | 1.0% |
| Liberia | 48 | 0.2% |
| Mexico | 74 | 0.3% |
| Moldova | 19 | 0.1% |
| Netherlands | 11 | 0.1% |
| Nigeria | 11 | 0.1% |
| Northern Africa | 24 | 0.1% |
| Philippines | 126 | 0.5% |
| Poland | 14 | 0.1% |
| Romania | 70 | 0.3% |
| Russia | 51 | 0.2% |
| Sierra Leone | 64 | 0.3% |
| Somalia | 1 | 0.0% |
| South Africa | 9 | 0.0% |
| South America | 56 | 0.2% |
| South Central Asia | 41 | 0.2% |
| South Eastern Asia | 301 | 1.3% |
| Thailand | 18 | 0.1% |
| Ukraine | 11 | 0.1% |
| Vietnam | 106 | 0.4% |
| Western Africa | 123 | 0.5% |
| Western Europe | 13 | 0.1% | View All 46 Rows |
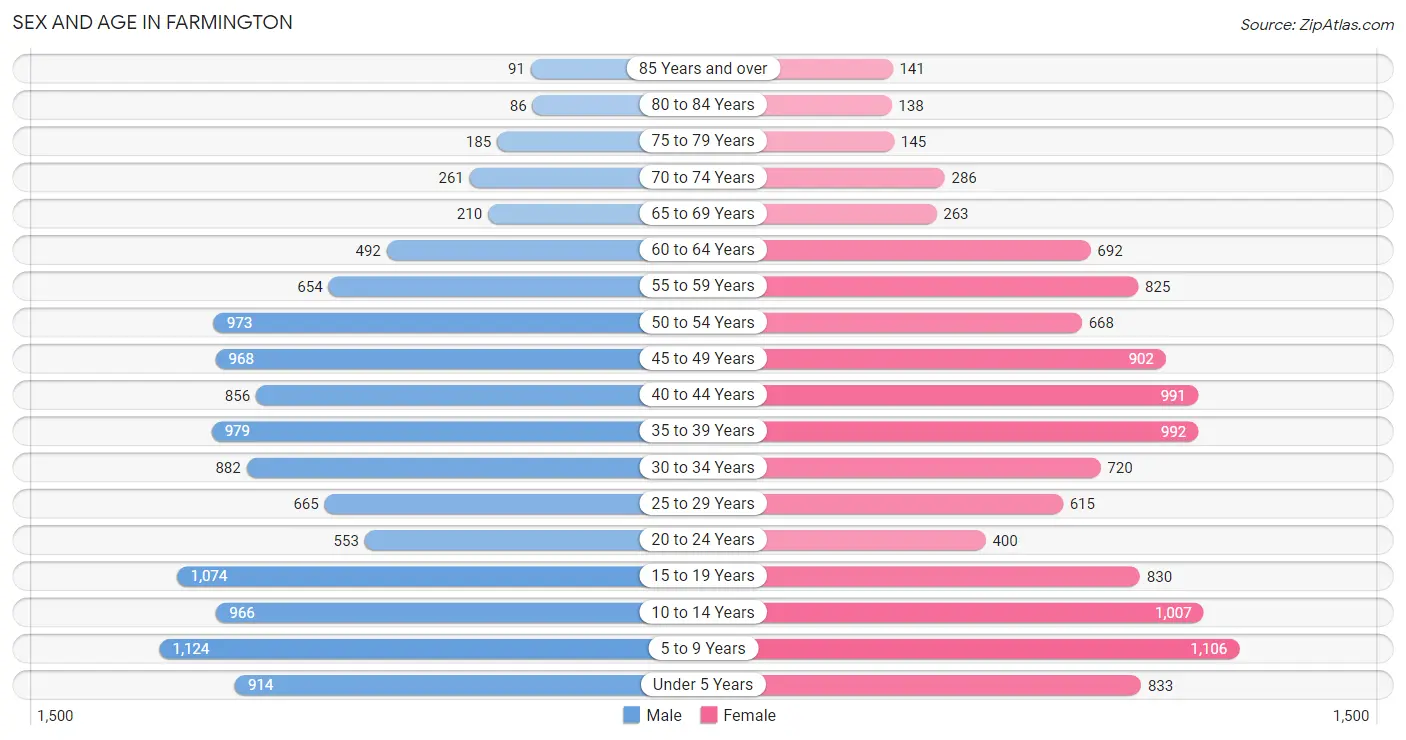
Sex and Age in Farmington
Sex and Age in Farmington
The most populous age groups in Farmington are 5 to 9 Years (1,124 | 9.4%) for men and 5 to 9 Years (1,106 | 9.6%) for women.
| Age Bracket | Male | Female |
| Under 5 Years | 914 (7.7%) | 833 (7.2%) |
| 5 to 9 Years | 1,124 (9.4%) | 1,106 (9.6%) |
| 10 to 14 Years | 966 (8.1%) | 1,007 (8.7%) |
| 15 to 19 Years | 1,074 (9.0%) | 830 (7.2%) |
| 20 to 24 Years | 553 (4.6%) | 400 (3.5%) |
| 25 to 29 Years | 665 (5.6%) | 615 (5.3%) |
| 30 to 34 Years | 882 (7.4%) | 720 (6.2%) |
| 35 to 39 Years | 979 (8.2%) | 992 (8.6%) |
| 40 to 44 Years | 856 (7.2%) | 991 (8.6%) |
| 45 to 49 Years | 968 (8.1%) | 902 (7.8%) |
| 50 to 54 Years | 973 (8.2%) | 668 (5.8%) |
| 55 to 59 Years | 654 (5.5%) | 825 (7.1%) |
| 60 to 64 Years | 492 (4.1%) | 692 (6.0%) |
| 65 to 69 Years | 210 (1.8%) | 263 (2.3%) |
| 70 to 74 Years | 261 (2.2%) | 286 (2.5%) |
| 75 to 79 Years | 185 (1.5%) | 145 (1.3%) |
| 80 to 84 Years | 86 (0.7%) | 138 (1.2%) |
| 85 Years and over | 91 (0.8%) | 141 (1.2%) |
| Total | 11,933 (100.0%) | 11,554 (100.0%) |
Families and Households in Farmington
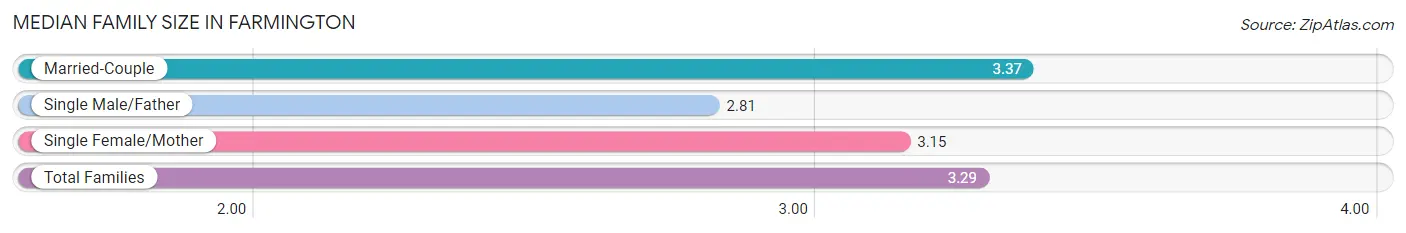
Median Family Size in Farmington
The median family size in Farmington is 3.29 persons per family, with married-couple families (4,625 | 75.3%) accounting for the largest median family size of 3.37 persons per family. On the other hand, single male/father families (499 | 8.1%) represent the smallest median family size with 2.81 persons per family.
| Family Type | # Families | Family Size |
| Married-Couple | 4,625 (75.3%) | 3.37 |
| Single Male/Father | 499 (8.1%) | 2.81 |
| Single Female/Mother | 1,021 (16.6%) | 3.15 |
| Total Families | 6,145 (100.0%) | 3.29 |
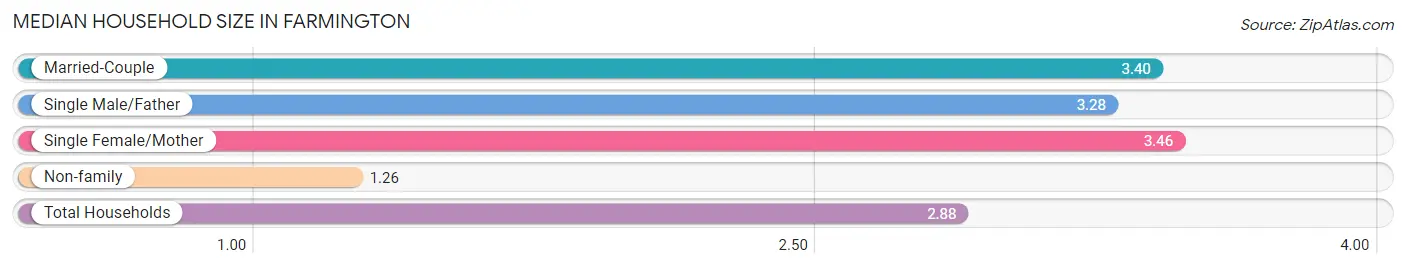
Median Household Size in Farmington
The median household size in Farmington is 2.88 persons per household, with single female/mother households (1,021 | 12.6%) accounting for the largest median household size of 3.46 persons per household. non-family households (1,977 | 24.3%) represent the smallest median household size with 1.26 persons per household.
| Household Type | # Households | Household Size |
| Married-Couple | 4,625 (56.9%) | 3.40 |
| Single Male/Father | 499 (6.1%) | 3.28 |
| Single Female/Mother | 1,021 (12.6%) | 3.46 |
| Non-family | 1,977 (24.3%) | 1.26 |
| Total Households | 8,122 (100.0%) | 2.88 |
Household Size by Marriage Status in Farmington
Out of a total of 8,122 households in Farmington, 6,145 (75.7%) are family households, while 1,977 (24.3%) are nonfamily households. The most numerous type of family households are 2-person households, comprising 1,968, and the most common type of nonfamily households are 1-person households, comprising 1,598.
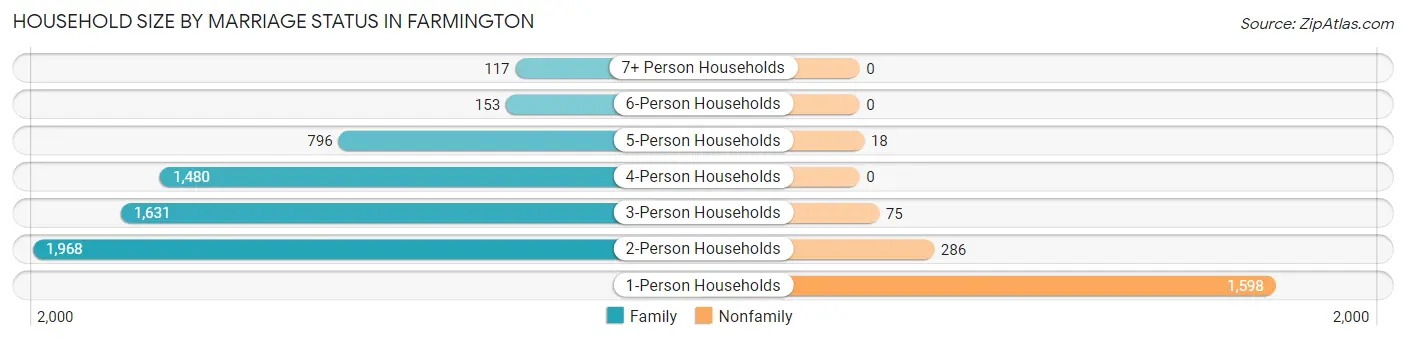
| Household Size | Family Households | Nonfamily Households |
| 1-Person Households | - | 1,598 (19.7%) |
| 2-Person Households | 1,968 (24.2%) | 286 (3.5%) |
| 3-Person Households | 1,631 (20.1%) | 75 (0.9%) |
| 4-Person Households | 1,480 (18.2%) | 0 (0.0%) |
| 5-Person Households | 796 (9.8%) | 18 (0.2%) |
| 6-Person Households | 153 (1.9%) | 0 (0.0%) |
| 7+ Person Households | 117 (1.4%) | 0 (0.0%) |
| Total | 6,145 (75.7%) | 1,977 (24.3%) |
Female Fertility in Farmington
Fertility by Age in Farmington
Average fertility rate in Farmington is 56.0 births per 1,000 women. Women in the age bracket of 20 to 34 years have the highest fertility rate with 136.0 births per 1,000 women. Women in the age bracket of 20 to 34 years acount for 76.1% of all women with births.
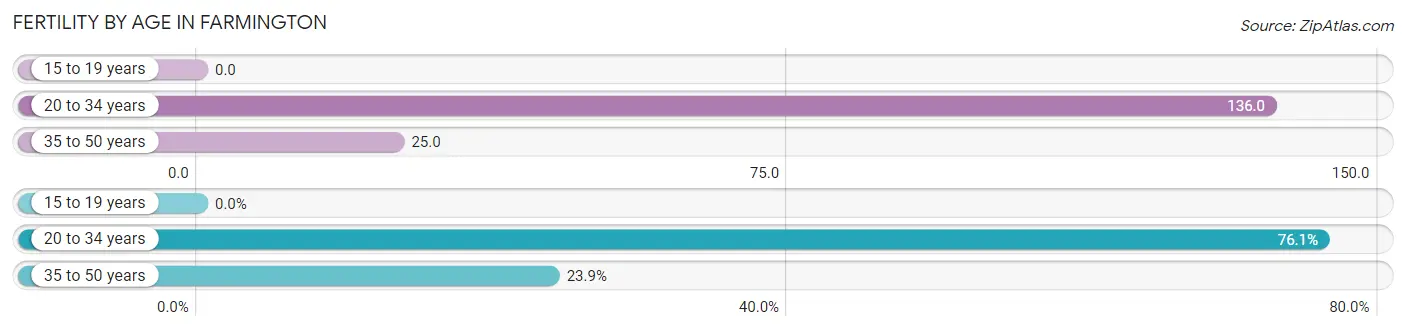
| Age Bracket | Women with Births | Births / 1,000 Women |
| 15 to 19 years | 0 (0.0%) | 0.0 |
| 20 to 34 years | 236 (76.1%) | 136.0 |
| 35 to 50 years | 74 (23.9%) | 25.0 |
| Total | 310 (100.0%) | 56.0 |
Fertility by Age by Marriage Status in Farmington
86.1% of women with births (310) in Farmington are married. The highest percentage of unmarried women with births falls into 35 to 50 years age bracket with 27.0% of them unmarried at the time of birth, while the lowest percentage of unmarried women with births belong to 20 to 34 years age bracket with 9.8% of them unmarried.
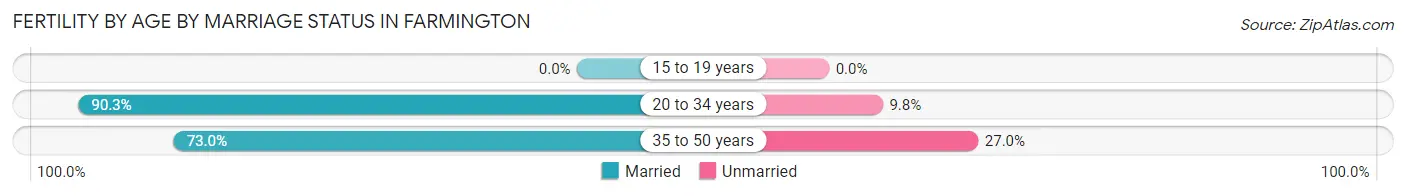
| Age Bracket | Married | Unmarried |
| 15 to 19 years | 0 (0.0%) | 0 (0.0%) |
| 20 to 34 years | 213 (90.2%) | 23 (9.8%) |
| 35 to 50 years | 54 (73.0%) | 20 (27.0%) |
| Total | 267 (86.1%) | 43 (13.9%) |
Fertility by Education in Farmington
Average fertility rate in Farmington is 56.0 births per 1,000 women. Women with the education attainment of bachelor's degree have the highest fertility rate of 78.0 births per 1,000 women, while women with the education attainment of less than high school have the lowest fertility at 17.0 births per 1,000 women. Women with the education attainment of bachelor's degree represent 46.5% of all women with births.
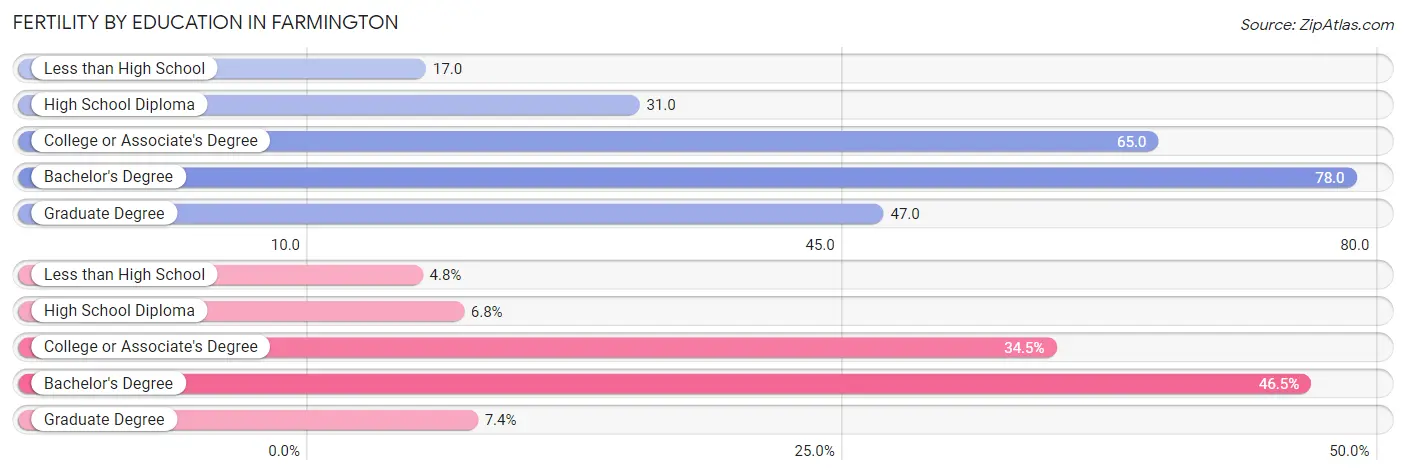
| Educational Attainment | Women with Births | Births / 1,000 Women |
| Less than High School | 15 (4.8%) | 17.0 |
| High School Diploma | 21 (6.8%) | 31.0 |
| College or Associate's Degree | 107 (34.5%) | 65.0 |
| Bachelor's Degree | 144 (46.5%) | 78.0 |
| Graduate Degree | 23 (7.4%) | 47.0 |
| Total | 310 (100.0%) | 56.0 |
Fertility by Education by Marriage Status in Farmington
13.9% of women with births in Farmington are unmarried. Women with the educational attainment of less than high school are most likely to be married with 100.0% of them married at childbirth, while women with the educational attainment of high school diploma are least likely to be married with 52.4% of them unmarried at childbirth.
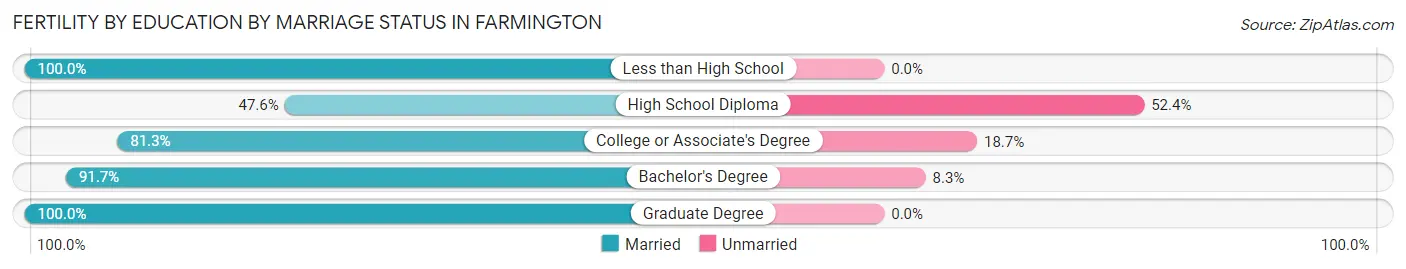
| Educational Attainment | Married | Unmarried |
| Less than High School | 15 (100.0%) | 0 (0.0%) |
| High School Diploma | 10 (47.6%) | 11 (52.4%) |
| College or Associate's Degree | 87 (81.3%) | 20 (18.7%) |
| Bachelor's Degree | 132 (91.7%) | 12 (8.3%) |
| Graduate Degree | 23 (100.0%) | 0 (0.0%) |
| Total | 267 (86.1%) | 43 (13.9%) |
Employment Characteristics in Farmington
Employment by Class of Employer in Farmington
Among the 12,771 employed individuals in Farmington, private company employees (9,367 | 73.4%), local government employees (1,084 | 8.5%), and not-for-profit organizations (1,028 | 8.1%) make up the most common classes of employment.

| Employer Class | # Employees | % Employees |
| Private Company Employees | 9,367 | 73.4% |
| Self-Employed (Incorporated) | 267 | 2.1% |
| Self-Employed (Not Incorporated) | 457 | 3.6% |
| Not-for-profit Organizations | 1,028 | 8.1% |
| Local Government Employees | 1,084 | 8.5% |
| State Government Employees | 228 | 1.8% |
| Federal Government Employees | 294 | 2.3% |
| Unpaid Family Workers | 46 | 0.4% |
| Total | 12,771 | 100.0% |
Employment Status by Age in Farmington
According to the labor force statistics for Farmington, out of the total population over 16 years of age (16,907), 79.3% or 13,407 individuals are in the labor force, with 3.4% or 456 of them unemployed. The age group with the highest labor force participation rate is 30 to 34 years, with 98.0% or 1,570 individuals in the labor force. Within the labor force, the 20 to 24 years age range has the highest percentage of unemployed individuals, with 8.8% or 79 of them being unemployed.
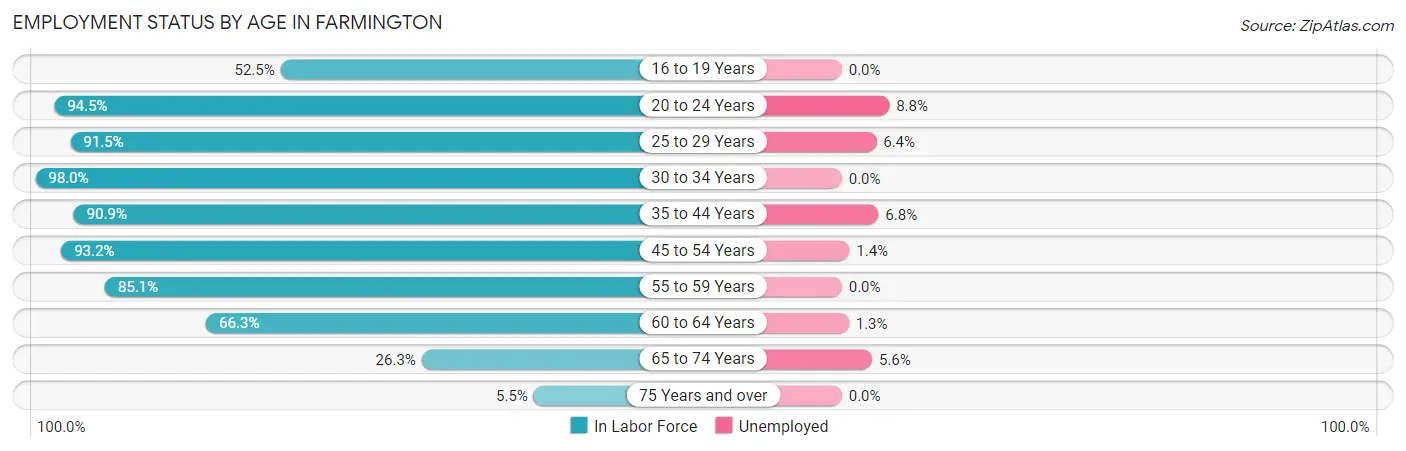
| Age Bracket | In Labor Force | Unemployed |
| 16 to 19 Years | 669 (52.5%) | 0 (0.0%) |
| 20 to 24 Years | 901 (94.5%) | 79 (8.8%) |
| 25 to 29 Years | 1,171 (91.5%) | 75 (6.4%) |
| 30 to 34 Years | 1,570 (98.0%) | 0 (0.0%) |
| 35 to 44 Years | 3,471 (90.9%) | 236 (6.8%) |
| 45 to 54 Years | 3,272 (93.2%) | 46 (1.4%) |
| 55 to 59 Years | 1,259 (85.1%) | 0 (0.0%) |
| 60 to 64 Years | 785 (66.3%) | 10 (1.3%) |
| 65 to 74 Years | 268 (26.3%) | 15 (5.6%) |
| 75 Years and over | 43 (5.5%) | 0 (0.0%) |
| Total | 13,407 (79.3%) | 456 (3.4%) |
Employment Status by Educational Attainment in Farmington
According to labor force statistics for Farmington, 89.5% of individuals (11,522) out of the total population between 25 and 64 years of age (12,874) are in the labor force, with 3.2% or 369 of them being unemployed. The group with the highest labor force participation rate are those with the educational attainment of bachelor's degree or higher, with 93.1% or 4,725 individuals in the labor force. Within the labor force, individuals with less than high school education have the highest percentage of unemployment, with 14.2% or 96 of them being unemployed.
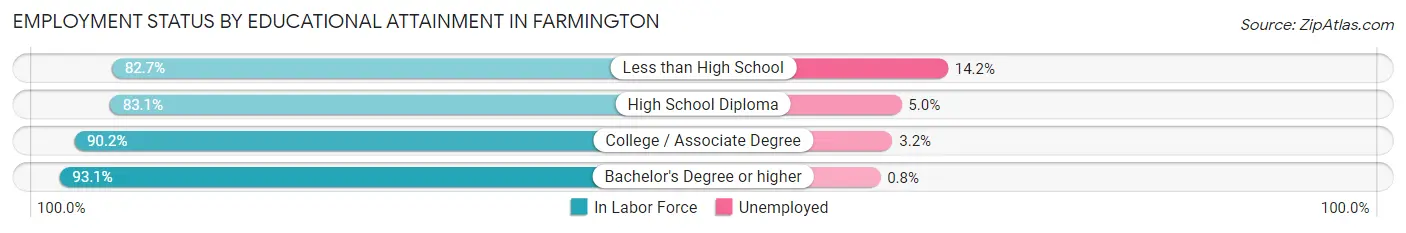
| Educational Attainment | In Labor Force | Unemployed |
| Less than High School | 677 (82.7%) | 116 (14.2%) |
| High School Diploma | 2,012 (83.1%) | 121 (5.0%) |
| College / Associate Degree | 4,112 (90.2%) | 146 (3.2%) |
| Bachelor's Degree or higher | 4,725 (93.1%) | 41 (0.8%) |
| Total | 11,522 (89.5%) | 412 (3.2%) |
Employment Occupations by Sex in Farmington
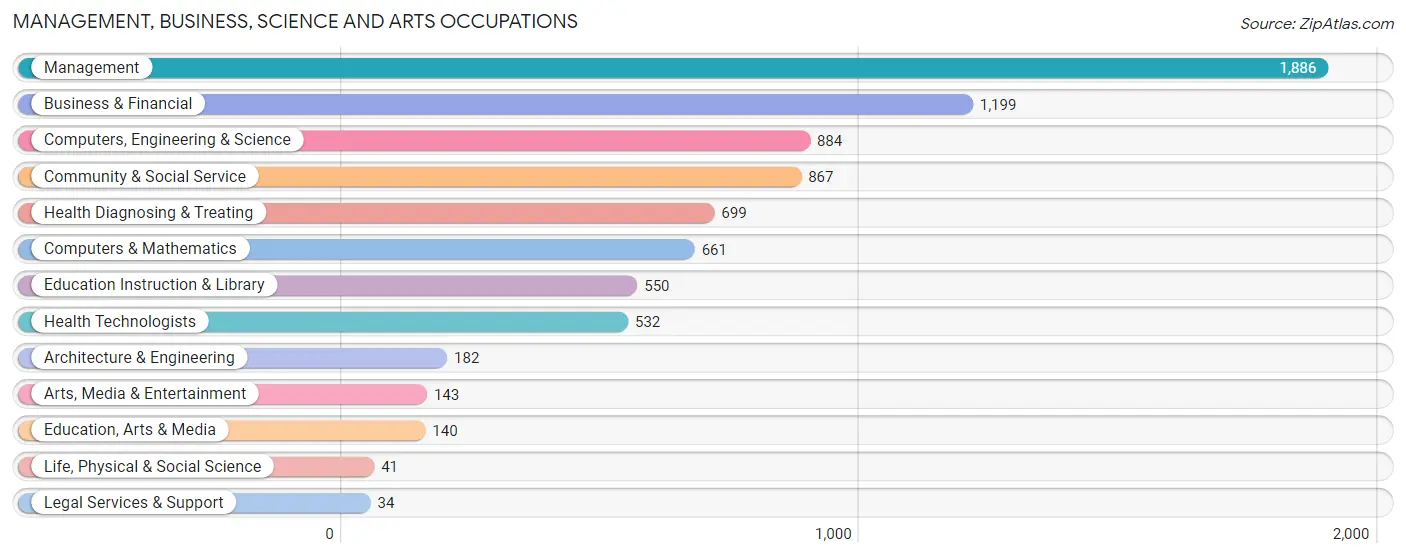
Management, Business, Science and Arts Occupations
The most common Management, Business, Science and Arts occupations in Farmington are Management (1,886 | 14.6%), Business & Financial (1,199 | 9.3%), Computers, Engineering & Science (884 | 6.8%), Community & Social Service (867 | 6.7%), and Health Diagnosing & Treating (699 | 5.4%).
Management, Business, Science and Arts Occupations by Sex
Within the Management, Business, Science and Arts occupations in Farmington, the most male-oriented occupations are Architecture & Engineering (89.6%), Computers, Engineering & Science (65.0%), and Computers & Mathematics (59.5%), while the most female-oriented occupations are Legal Services & Support (100.0%), Health Technologists (90.0%), and Health Diagnosing & Treating (86.8%).
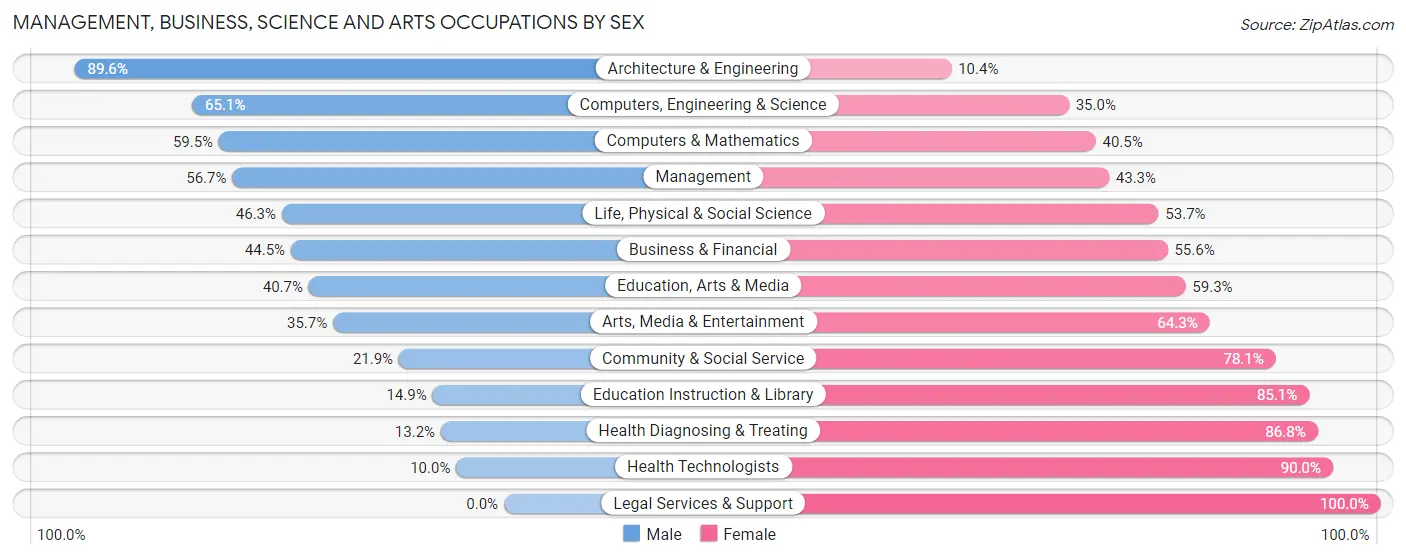
| Occupation | Male | Female |
| Management | 1,069 (56.7%) | 817 (43.3%) |
| Business & Financial | 533 (44.5%) | 666 (55.5%) |
| Computers, Engineering & Science | 575 (65.0%) | 309 (34.9%) |
| Computers & Mathematics | 393 (59.5%) | 268 (40.5%) |
| Architecture & Engineering | 163 (89.6%) | 19 (10.4%) |
| Life, Physical & Social Science | 19 (46.3%) | 22 (53.7%) |
| Community & Social Service | 190 (21.9%) | 677 (78.1%) |
| Education, Arts & Media | 57 (40.7%) | 83 (59.3%) |
| Legal Services & Support | 0 (0.0%) | 34 (100.0%) |
| Education Instruction & Library | 82 (14.9%) | 468 (85.1%) |
| Arts, Media & Entertainment | 51 (35.7%) | 92 (64.3%) |
| Health Diagnosing & Treating | 92 (13.2%) | 607 (86.8%) |
| Health Technologists | 53 (10.0%) | 479 (90.0%) |
| Total (Category) | 2,459 (44.4%) | 3,076 (55.6%) |
| Total (Overall) | 6,848 (52.9%) | 6,089 (47.1%) |
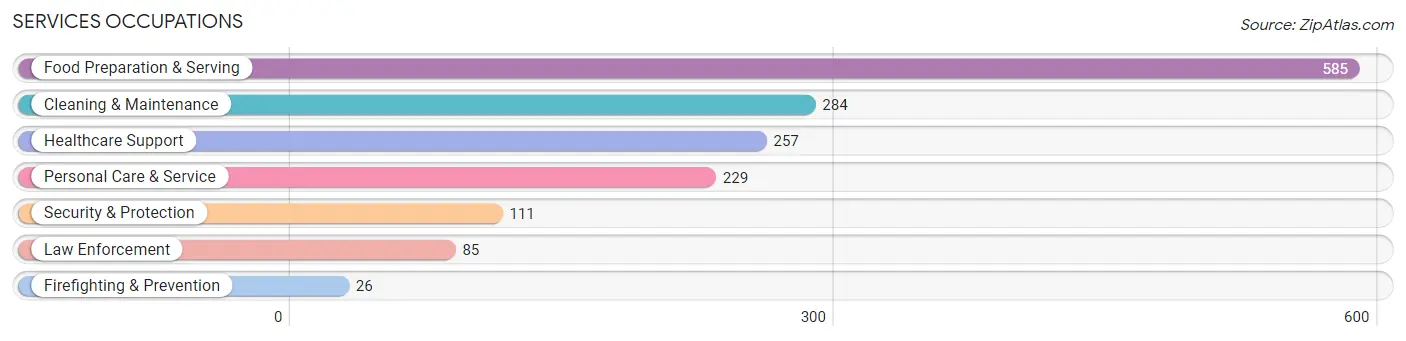
Services Occupations
The most common Services occupations in Farmington are Food Preparation & Serving (585 | 4.5%), Cleaning & Maintenance (284 | 2.2%), Healthcare Support (257 | 2.0%), Personal Care & Service (229 | 1.8%), and Security & Protection (111 | 0.9%).
Services Occupations by Sex
Within the Services occupations in Farmington, the most male-oriented occupations are Law Enforcement (100.0%), Security & Protection (92.8%), and Cleaning & Maintenance (78.9%), while the most female-oriented occupations are Personal Care & Service (91.3%), Healthcare Support (80.5%), and Food Preparation & Serving (70.6%).
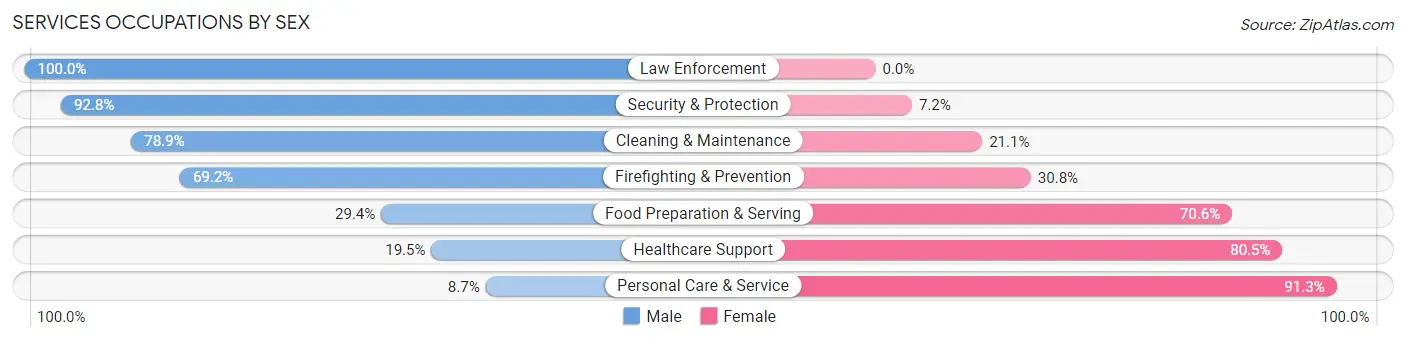
| Occupation | Male | Female |
| Healthcare Support | 50 (19.5%) | 207 (80.5%) |
| Security & Protection | 103 (92.8%) | 8 (7.2%) |
| Firefighting & Prevention | 18 (69.2%) | 8 (30.8%) |
| Law Enforcement | 85 (100.0%) | 0 (0.0%) |
| Food Preparation & Serving | 172 (29.4%) | 413 (70.6%) |
| Cleaning & Maintenance | 224 (78.9%) | 60 (21.1%) |
| Personal Care & Service | 20 (8.7%) | 209 (91.3%) |
| Total (Category) | 569 (38.8%) | 897 (61.2%) |
| Total (Overall) | 6,848 (52.9%) | 6,089 (47.1%) |
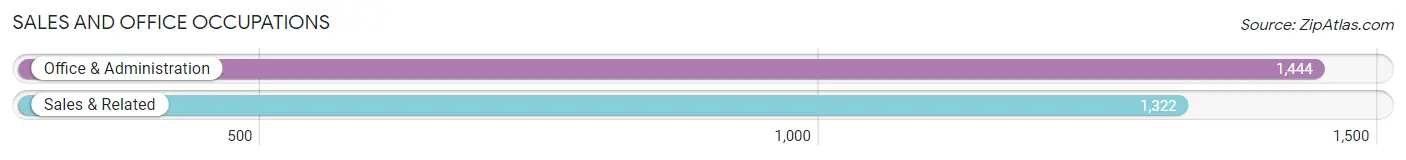
Sales and Office Occupations
The most common Sales and Office occupations in Farmington are Office & Administration (1,444 | 11.2%), and Sales & Related (1,322 | 10.2%).
Sales and Office Occupations by Sex
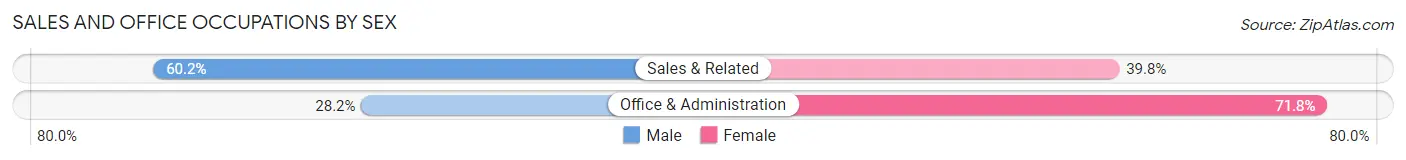
| Occupation | Male | Female |
| Sales & Related | 796 (60.2%) | 526 (39.8%) |
| Office & Administration | 407 (28.2%) | 1,037 (71.8%) |
| Total (Category) | 1,203 (43.5%) | 1,563 (56.5%) |
| Total (Overall) | 6,848 (52.9%) | 6,089 (47.1%) |
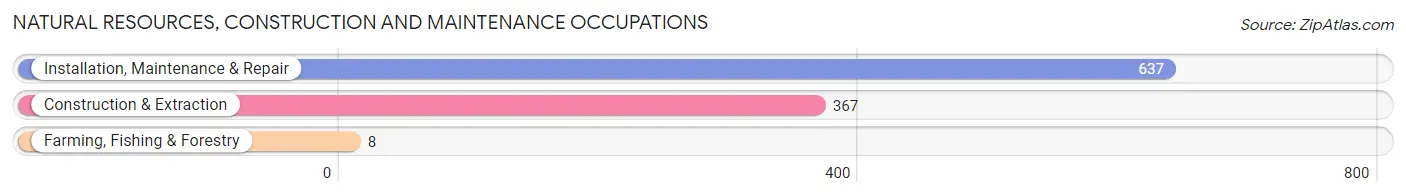
Natural Resources, Construction and Maintenance Occupations
The most common Natural Resources, Construction and Maintenance occupations in Farmington are Installation, Maintenance & Repair (637 | 4.9%), Construction & Extraction (367 | 2.8%), and Farming, Fishing & Forestry (8 | 0.1%).
Natural Resources, Construction and Maintenance Occupations by Sex
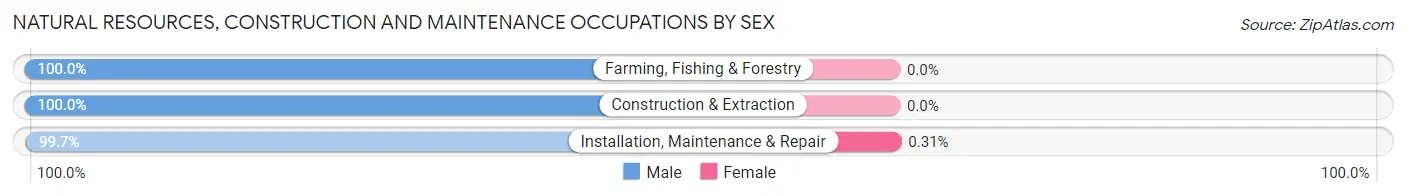
| Occupation | Male | Female |
| Farming, Fishing & Forestry | 8 (100.0%) | 0 (0.0%) |
| Construction & Extraction | 367 (100.0%) | 0 (0.0%) |
| Installation, Maintenance & Repair | 635 (99.7%) | 2 (0.3%) |
| Total (Category) | 1,010 (99.8%) | 2 (0.2%) |
| Total (Overall) | 6,848 (52.9%) | 6,089 (47.1%) |
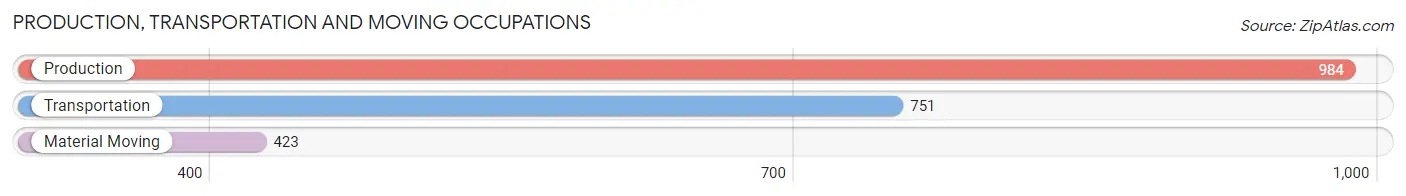
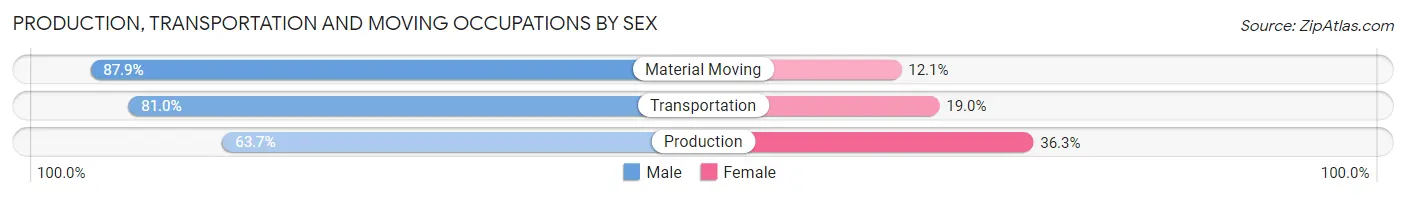
Production, Transportation and Moving Occupations
The most common Production, Transportation and Moving occupations in Farmington are Production (984 | 7.6%), Transportation (751 | 5.8%), and Material Moving (423 | 3.3%).
Production, Transportation and Moving Occupations by Sex
| Occupation | Male | Female |
| Production | 627 (63.7%) | 357 (36.3%) |
| Transportation | 608 (81.0%) | 143 (19.0%) |
| Material Moving | 372 (87.9%) | 51 (12.1%) |
| Total (Category) | 1,607 (74.5%) | 551 (25.5%) |
| Total (Overall) | 6,848 (52.9%) | 6,089 (47.1%) |
Employment Industries by Sex in Farmington
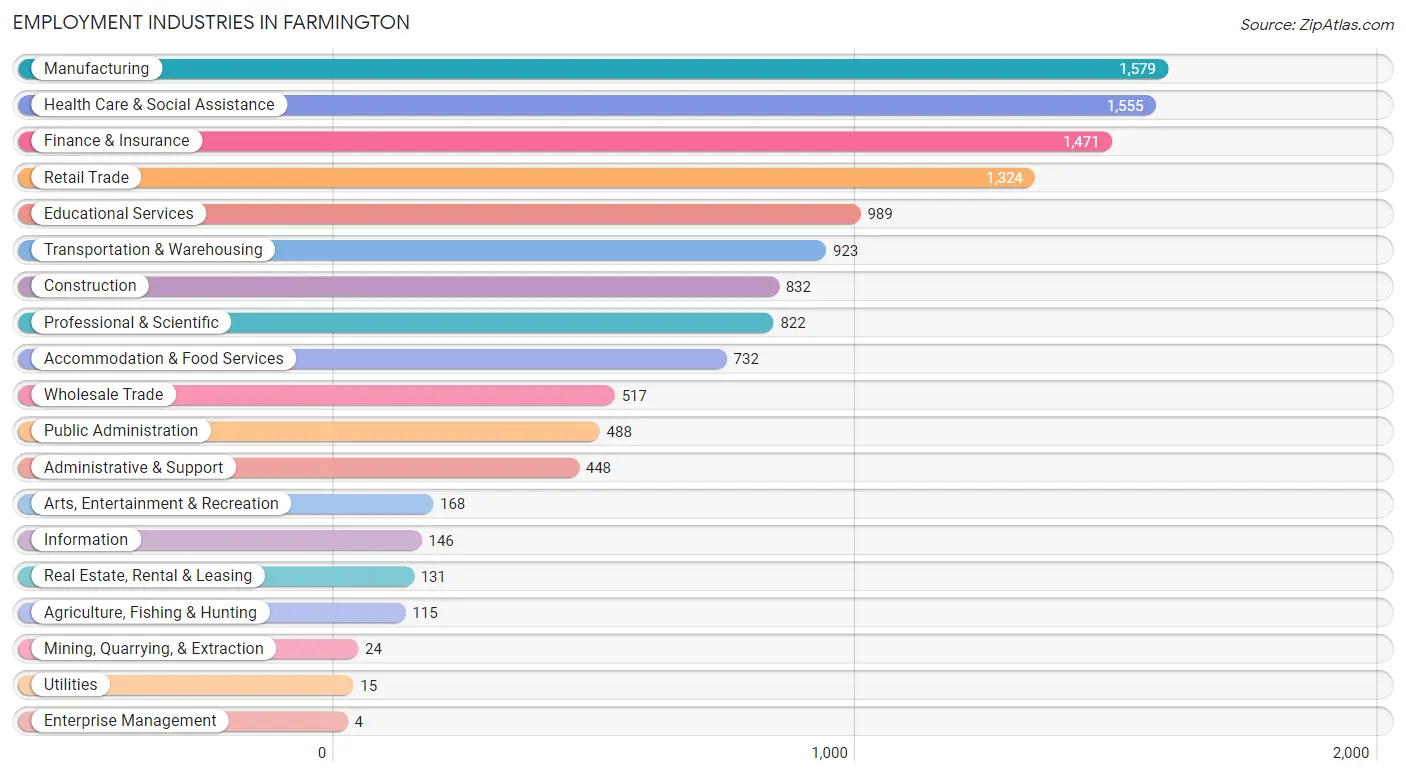
Employment Industries in Farmington
The major employment industries in Farmington include Manufacturing (1,579 | 12.2%), Health Care & Social Assistance (1,555 | 12.0%), Finance & Insurance (1,471 | 11.4%), Retail Trade (1,324 | 10.2%), and Educational Services (989 | 7.6%).
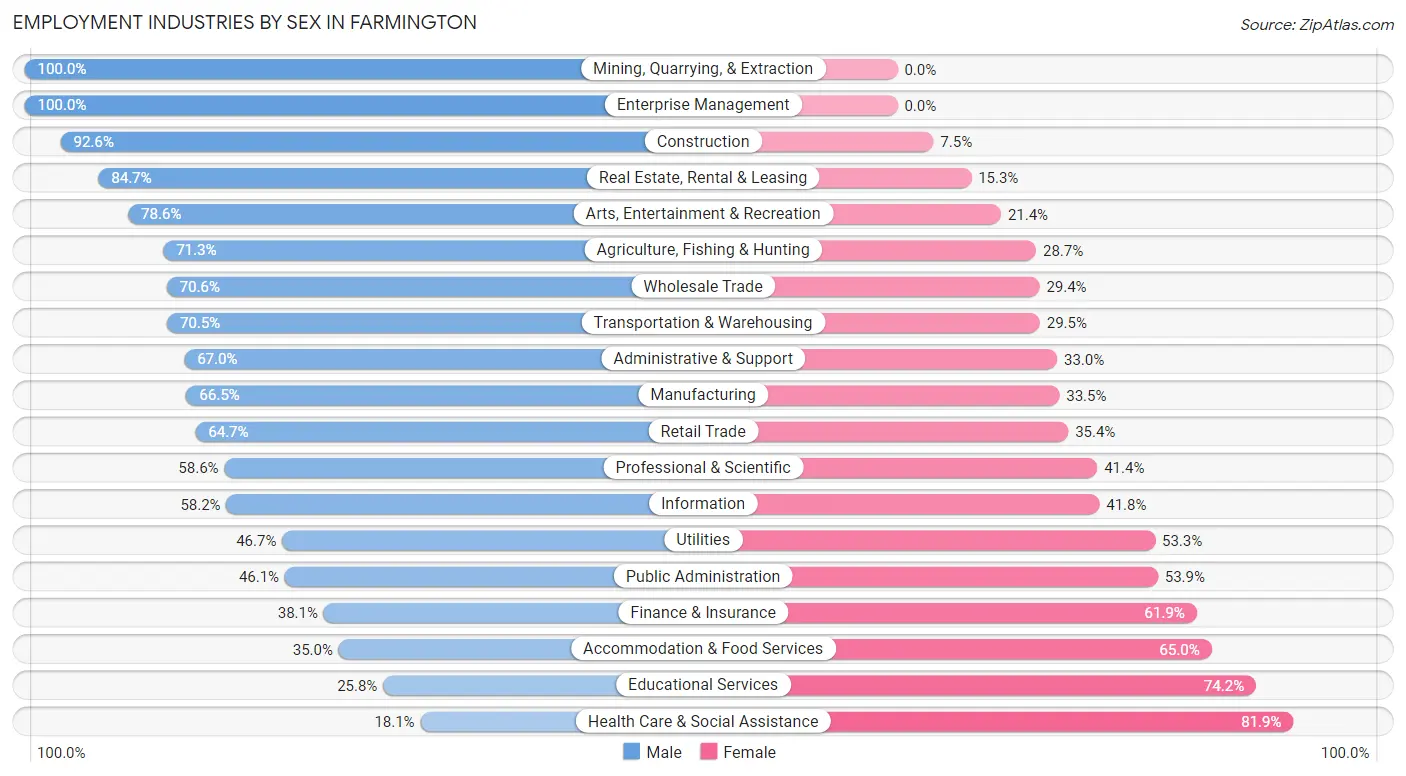
Employment Industries by Sex in Farmington
The Farmington industries that see more men than women are Mining, Quarrying, & Extraction (100.0%), Enterprise Management (100.0%), and Construction (92.5%), whereas the industries that tend to have a higher number of women are Health Care & Social Assistance (81.9%), Educational Services (74.2%), and Accommodation & Food Services (65.0%).
| Industry | Male | Female |
| Agriculture, Fishing & Hunting | 82 (71.3%) | 33 (28.7%) |
| Mining, Quarrying, & Extraction | 24 (100.0%) | 0 (0.0%) |
| Construction | 770 (92.5%) | 62 (7.4%) |
| Manufacturing | 1,050 (66.5%) | 529 (33.5%) |
| Wholesale Trade | 365 (70.6%) | 152 (29.4%) |
| Retail Trade | 856 (64.6%) | 468 (35.3%) |
| Transportation & Warehousing | 651 (70.5%) | 272 (29.5%) |
| Utilities | 7 (46.7%) | 8 (53.3%) |
| Information | 85 (58.2%) | 61 (41.8%) |
| Finance & Insurance | 560 (38.1%) | 911 (61.9%) |
| Real Estate, Rental & Leasing | 111 (84.7%) | 20 (15.3%) |
| Professional & Scientific | 482 (58.6%) | 340 (41.4%) |
| Enterprise Management | 4 (100.0%) | 0 (0.0%) |
| Administrative & Support | 300 (67.0%) | 148 (33.0%) |
| Educational Services | 255 (25.8%) | 734 (74.2%) |
| Health Care & Social Assistance | 281 (18.1%) | 1,274 (81.9%) |
| Arts, Entertainment & Recreation | 132 (78.6%) | 36 (21.4%) |
| Accommodation & Food Services | 256 (35.0%) | 476 (65.0%) |
| Public Administration | 225 (46.1%) | 263 (53.9%) |
| Total | 6,848 (52.9%) | 6,089 (47.1%) |
Education in Farmington
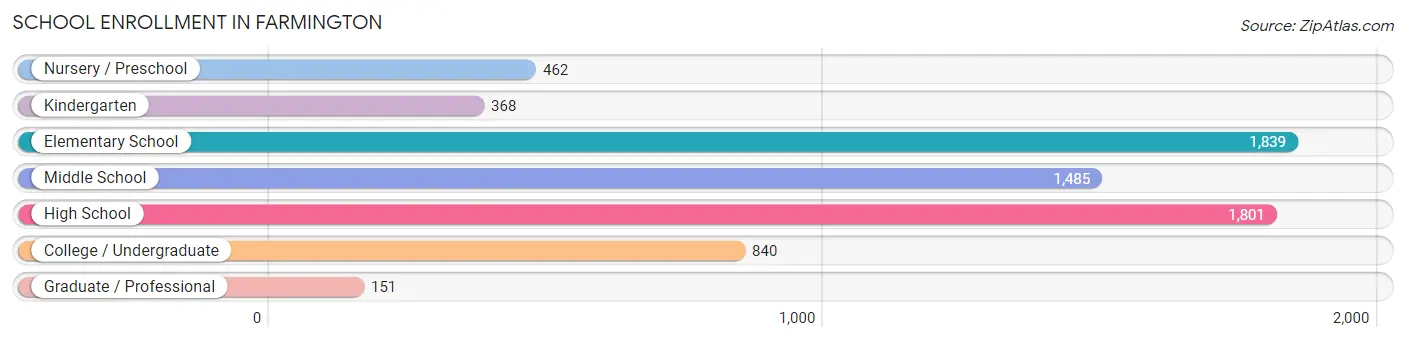
School Enrollment in Farmington
The most common levels of schooling among the 6,946 students in Farmington are elementary school (1,839 | 26.5%), high school (1,801 | 25.9%), and middle school (1,485 | 21.4%).
| School Level | # Students | % Students |
| Nursery / Preschool | 462 | 6.7% |
| Kindergarten | 368 | 5.3% |
| Elementary School | 1,839 | 26.5% |
| Middle School | 1,485 | 21.4% |
| High School | 1,801 | 25.9% |
| College / Undergraduate | 840 | 12.1% |
| Graduate / Professional | 151 | 2.2% |
| Total | 6,946 | 100.0% |
School Enrollment by Age by Funding Source in Farmington
Out of a total of 6,946 students who are enrolled in schools in Farmington, 570 (8.2%) attend a private institution, while the remaining 6,376 (91.8%) are enrolled in public schools. The age group of 25 to 34 year olds has the highest likelihood of being enrolled in private schools, with 77 (37.2% in the age bracket) enrolled. Conversely, the age group of 10 to 14 year olds has the lowest likelihood of being enrolled in a private school, with 1,868 (96.7% in the age bracket) attending a public institution.
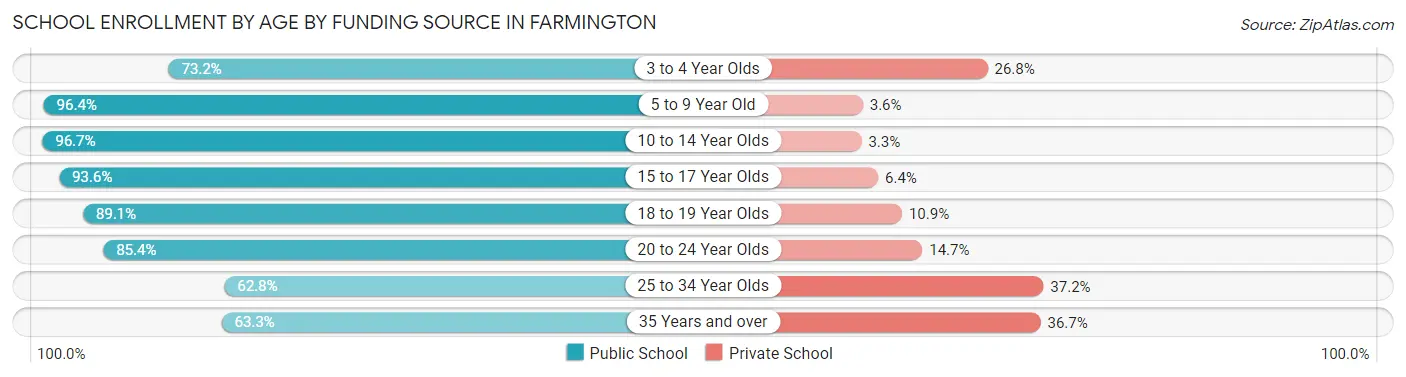
| Age Bracket | Public School | Private School |
| 3 to 4 Year Olds | 224 (73.2%) | 82 (26.8%) |
| 5 to 9 Year Old | 2,029 (96.4%) | 75 (3.6%) |
| 10 to 14 Year Olds | 1,868 (96.7%) | 64 (3.3%) |
| 15 to 17 Year Olds | 1,402 (93.6%) | 96 (6.4%) |
| 18 to 19 Year Olds | 271 (89.1%) | 33 (10.9%) |
| 20 to 24 Year Olds | 303 (85.4%) | 52 (14.6%) |
| 25 to 34 Year Olds | 130 (62.8%) | 77 (37.2%) |
| 35 Years and over | 152 (63.3%) | 88 (36.7%) |
| Total | 6,376 (91.8%) | 570 (8.2%) |
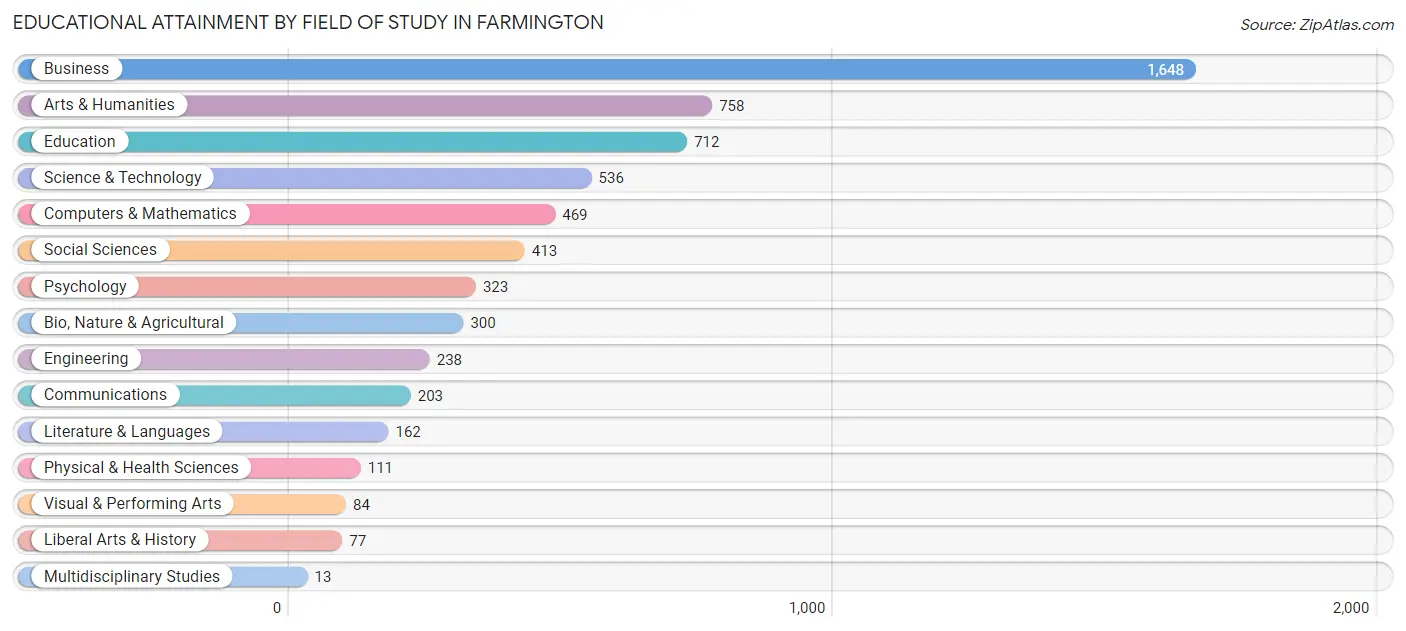
Educational Attainment by Field of Study in Farmington
Business (1,648 | 27.3%), arts & humanities (758 | 12.5%), education (712 | 11.8%), science & technology (536 | 8.9%), and computers & mathematics (469 | 7.8%) are the most common fields of study among 6,047 individuals in Farmington who have obtained a bachelor's degree or higher.
| Field of Study | # Graduates | % Graduates |
| Computers & Mathematics | 469 | 7.8% |
| Bio, Nature & Agricultural | 300 | 5.0% |
| Physical & Health Sciences | 111 | 1.8% |
| Psychology | 323 | 5.3% |
| Social Sciences | 413 | 6.8% |
| Engineering | 238 | 3.9% |
| Multidisciplinary Studies | 13 | 0.2% |
| Science & Technology | 536 | 8.9% |
| Business | 1,648 | 27.3% |
| Education | 712 | 11.8% |
| Literature & Languages | 162 | 2.7% |
| Liberal Arts & History | 77 | 1.3% |
| Visual & Performing Arts | 84 | 1.4% |
| Communications | 203 | 3.4% |
| Arts & Humanities | 758 | 12.5% |
| Total | 6,047 | 100.0% |
Transportation & Commute in Farmington
Vehicle Availability by Sex in Farmington
The most prevalent vehicle ownership categories in Farmington are males with 2 vehicles (3,225, accounting for 47.4%) and females with 2 vehicles (2,695, making up 54.1%).
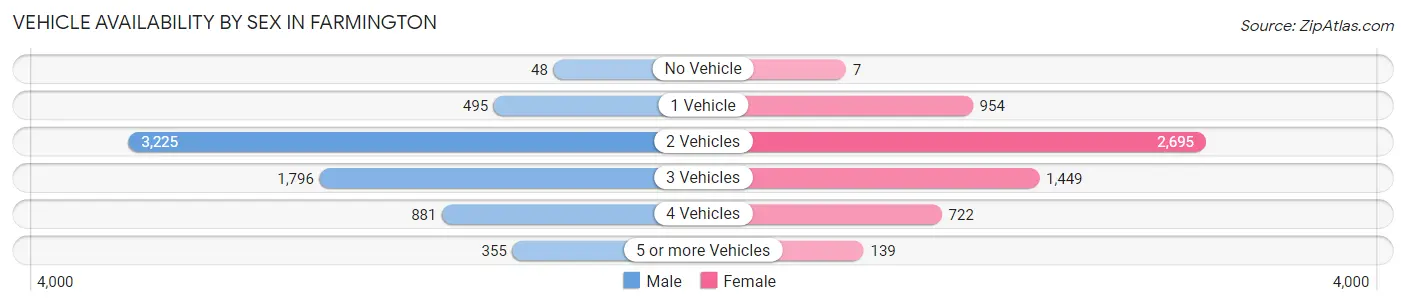
| Vehicles Available | Male | Female |
| No Vehicle | 48 (0.7%) | 7 (0.1%) |
| 1 Vehicle | 495 (7.3%) | 954 (16.0%) |
| 2 Vehicles | 3,225 (47.4%) | 2,695 (45.2%) |
| 3 Vehicles | 1,796 (26.4%) | 1,449 (24.3%) |
| 4 Vehicles | 881 (13.0%) | 722 (12.1%) |
| 5 or more Vehicles | 355 (5.2%) | 139 (2.3%) |
| Total | 6,800 (100.0%) | 5,966 (100.0%) |
Commute Time in Farmington
The most frequently occuring commute durations in Farmington are 30 to 34 minutes (1,745 commuters, 15.9%), 10 to 14 minutes (1,391 commuters, 12.7%), and 25 to 29 minutes (1,371 commuters, 12.5%).
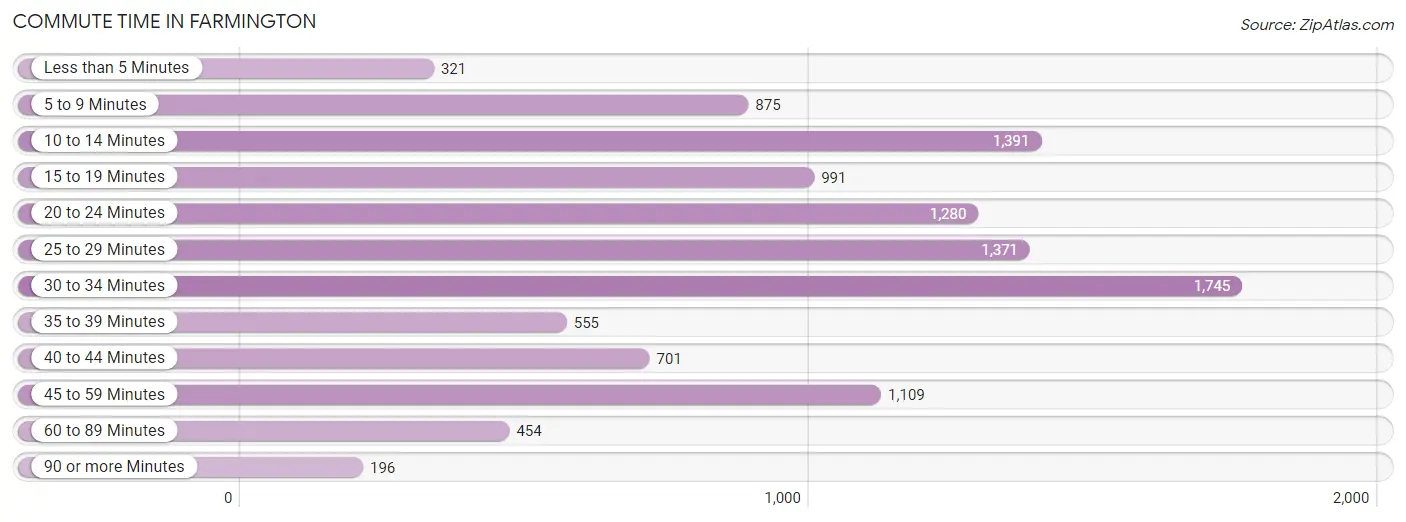
| Commute Time | # Commuters | % Commuters |
| Less than 5 Minutes | 321 | 2.9% |
| 5 to 9 Minutes | 875 | 8.0% |
| 10 to 14 Minutes | 1,391 | 12.7% |
| 15 to 19 Minutes | 991 | 9.0% |
| 20 to 24 Minutes | 1,280 | 11.7% |
| 25 to 29 Minutes | 1,371 | 12.5% |
| 30 to 34 Minutes | 1,745 | 15.9% |
| 35 to 39 Minutes | 555 | 5.1% |
| 40 to 44 Minutes | 701 | 6.4% |
| 45 to 59 Minutes | 1,109 | 10.1% |
| 60 to 89 Minutes | 454 | 4.1% |
| 90 or more Minutes | 196 | 1.8% |
Commute Time by Sex in Farmington
The most common commute times in Farmington are 30 to 34 minutes (1,045 commuters, 17.7%) for males and 10 to 14 minutes (730 commuters, 14.3%) for females.
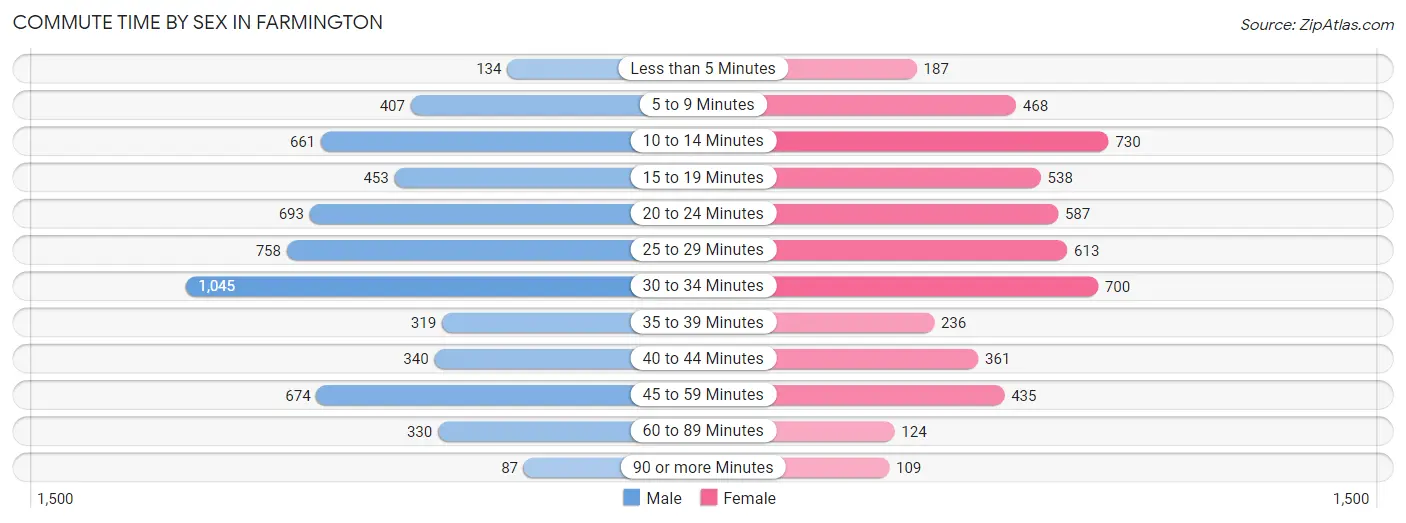
| Commute Time | Male | Female |
| Less than 5 Minutes | 134 (2.3%) | 187 (3.7%) |
| 5 to 9 Minutes | 407 (6.9%) | 468 (9.2%) |
| 10 to 14 Minutes | 661 (11.2%) | 730 (14.3%) |
| 15 to 19 Minutes | 453 (7.7%) | 538 (10.6%) |
| 20 to 24 Minutes | 693 (11.7%) | 587 (11.5%) |
| 25 to 29 Minutes | 758 (12.9%) | 613 (12.0%) |
| 30 to 34 Minutes | 1,045 (17.7%) | 700 (13.8%) |
| 35 to 39 Minutes | 319 (5.4%) | 236 (4.6%) |
| 40 to 44 Minutes | 340 (5.8%) | 361 (7.1%) |
| 45 to 59 Minutes | 674 (11.4%) | 435 (8.6%) |
| 60 to 89 Minutes | 330 (5.6%) | 124 (2.4%) |
| 90 or more Minutes | 87 (1.5%) | 109 (2.1%) |
Time of Departure to Work by Sex in Farmington
The most frequent times of departure to work in Farmington are 6:30 AM to 6:59 AM (751, 12.7%) for males and 7:00 AM to 7:29 AM (978, 19.2%) for females.
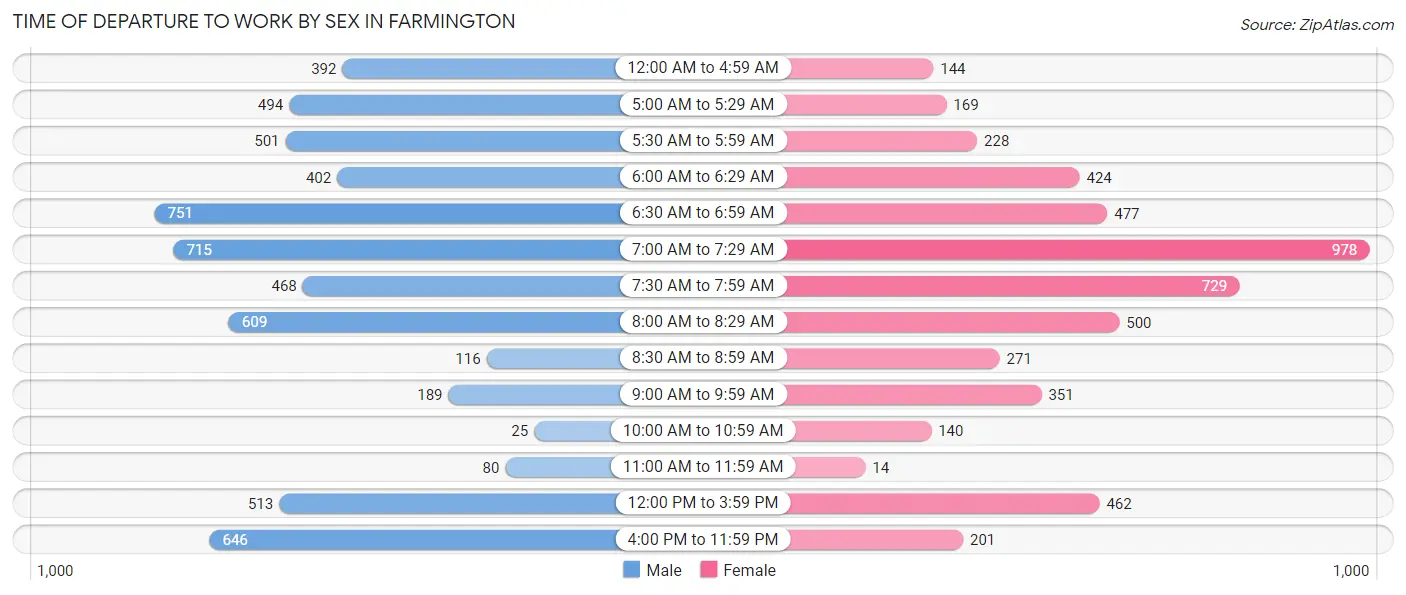
| Time of Departure | Male | Female |
| 12:00 AM to 4:59 AM | 392 (6.6%) | 144 (2.8%) |
| 5:00 AM to 5:29 AM | 494 (8.4%) | 169 (3.3%) |
| 5:30 AM to 5:59 AM | 501 (8.5%) | 228 (4.5%) |
| 6:00 AM to 6:29 AM | 402 (6.8%) | 424 (8.3%) |
| 6:30 AM to 6:59 AM | 751 (12.7%) | 477 (9.4%) |
| 7:00 AM to 7:29 AM | 715 (12.1%) | 978 (19.2%) |
| 7:30 AM to 7:59 AM | 468 (7.9%) | 729 (14.3%) |
| 8:00 AM to 8:29 AM | 609 (10.3%) | 500 (9.8%) |
| 8:30 AM to 8:59 AM | 116 (2.0%) | 271 (5.3%) |
| 9:00 AM to 9:59 AM | 189 (3.2%) | 351 (6.9%) |
| 10:00 AM to 10:59 AM | 25 (0.4%) | 140 (2.8%) |
| 11:00 AM to 11:59 AM | 80 (1.4%) | 14 (0.3%) |
| 12:00 PM to 3:59 PM | 513 (8.7%) | 462 (9.1%) |
| 4:00 PM to 11:59 PM | 646 (11.0%) | 201 (4.0%) |
| Total | 5,901 (100.0%) | 5,088 (100.0%) |
Housing Occupancy in Farmington
Occupancy by Ownership in Farmington
Of the total 8,122 dwellings in Farmington, owner-occupied units account for 7,003 (86.2%), while renter-occupied units make up 1,119 (13.8%).
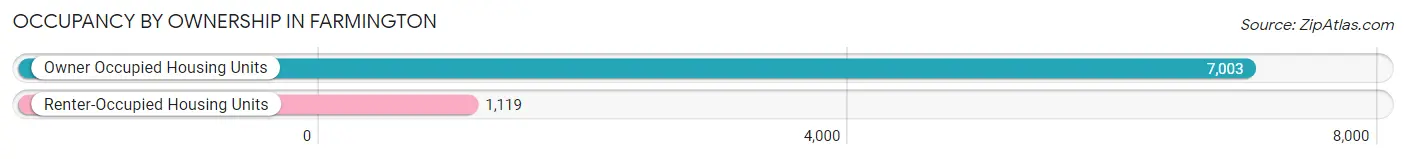
| Occupancy | # Housing Units | % Housing Units |
| Owner Occupied Housing Units | 7,003 | 86.2% |
| Renter-Occupied Housing Units | 1,119 | 13.8% |
| Total Occupied Housing Units | 8,122 | 100.0% |
Occupancy by Household Size in Farmington
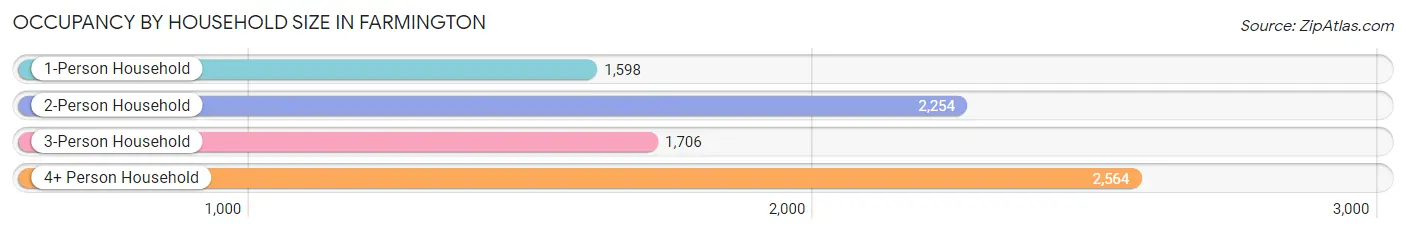
| Household Size | # Housing Units | % Housing Units |
| 1-Person Household | 1,598 | 19.7% |
| 2-Person Household | 2,254 | 27.8% |
| 3-Person Household | 1,706 | 21.0% |
| 4+ Person Household | 2,564 | 31.6% |
| Total Housing Units | 8,122 | 100.0% |
Occupancy by Ownership by Household Size in Farmington
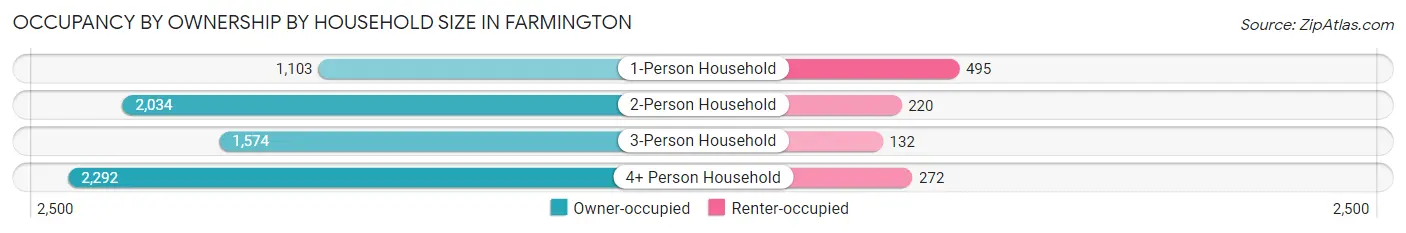
| Household Size | Owner-occupied | Renter-occupied |
| 1-Person Household | 1,103 (69.0%) | 495 (31.0%) |
| 2-Person Household | 2,034 (90.2%) | 220 (9.8%) |
| 3-Person Household | 1,574 (92.3%) | 132 (7.7%) |
| 4+ Person Household | 2,292 (89.4%) | 272 (10.6%) |
| Total Housing Units | 7,003 (86.2%) | 1,119 (13.8%) |
Occupancy by Educational Attainment in Farmington
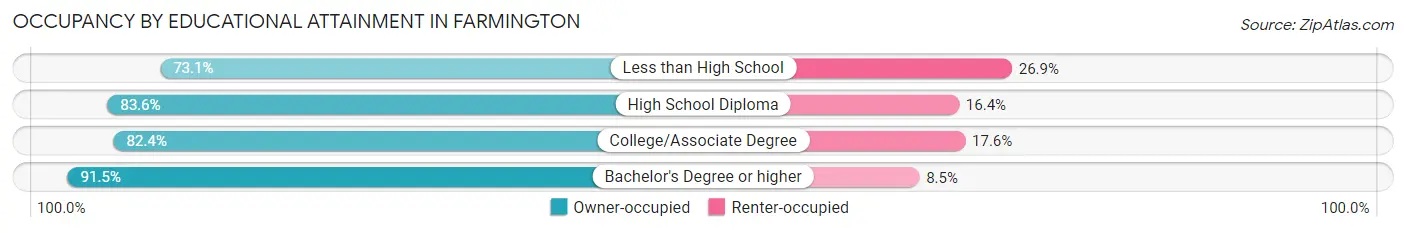
| Household Size | Owner-occupied | Renter-occupied |
| Less than High School | 193 (73.1%) | 71 (26.9%) |
| High School Diploma | 1,244 (83.6%) | 244 (16.4%) |
| College/Associate Degree | 2,359 (82.4%) | 505 (17.6%) |
| Bachelor's Degree or higher | 3,207 (91.5%) | 299 (8.5%) |
Occupancy by Age of Householder in Farmington
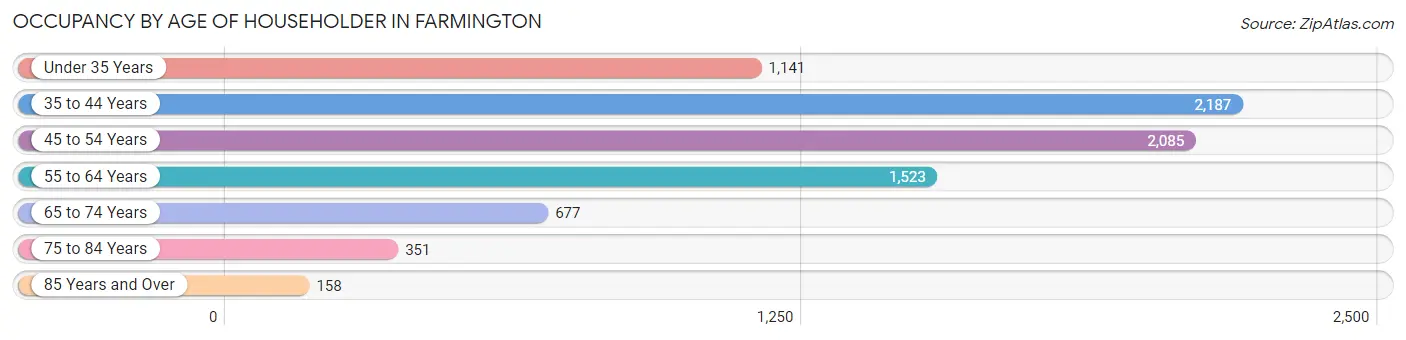
| Age Bracket | # Households | % Households |
| Under 35 Years | 1,141 | 14.1% |
| 35 to 44 Years | 2,187 | 26.9% |
| 45 to 54 Years | 2,085 | 25.7% |
| 55 to 64 Years | 1,523 | 18.8% |
| 65 to 74 Years | 677 | 8.3% |
| 75 to 84 Years | 351 | 4.3% |
| 85 Years and Over | 158 | 1.9% |
| Total | 8,122 | 100.0% |
Housing Finances in Farmington
Median Income by Occupancy in Farmington
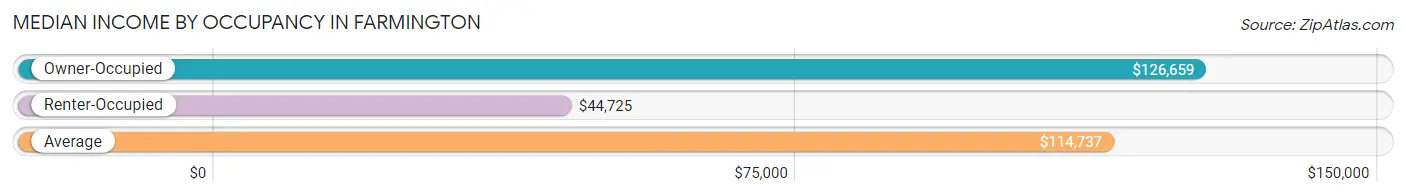
| Occupancy Type | # Households | Median Income |
| Owner-Occupied | 7,003 (86.2%) | $126,659 |
| Renter-Occupied | 1,119 (13.8%) | $44,725 |
| Average | 8,122 (100.0%) | $114,737 |
Occupancy by Householder Income Bracket in Farmington
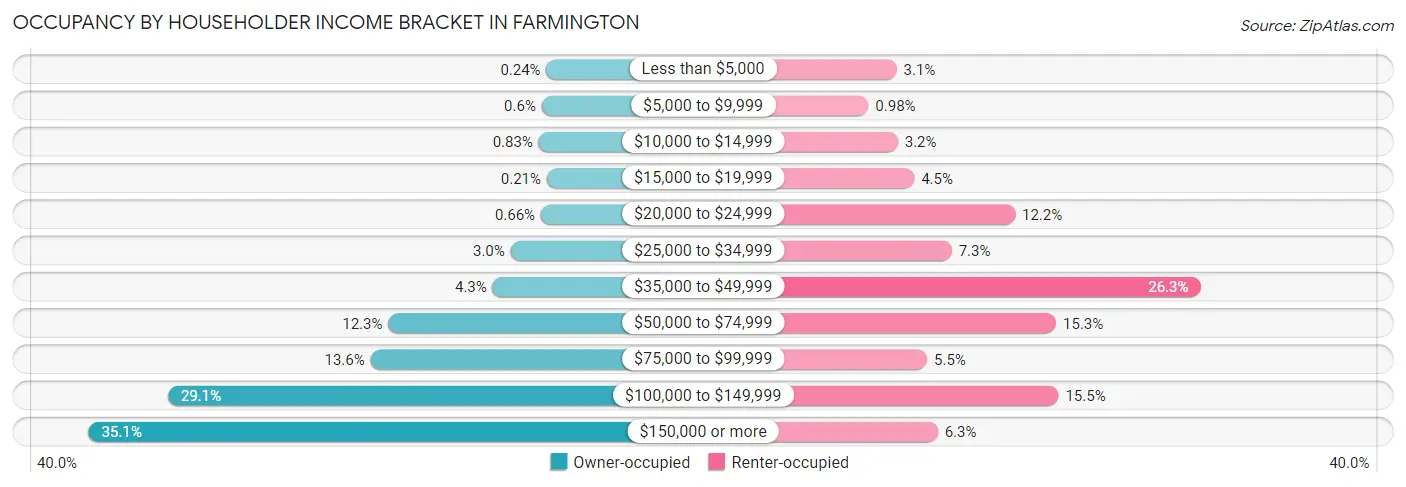
| Income Bracket | Owner-occupied | Renter-occupied |
| Less than $5,000 | 17 (0.2%) | 35 (3.1%) |
| $5,000 to $9,999 | 42 (0.6%) | 11 (1.0%) |
| $10,000 to $14,999 | 58 (0.8%) | 36 (3.2%) |
| $15,000 to $19,999 | 15 (0.2%) | 50 (4.5%) |
| $20,000 to $24,999 | 46 (0.7%) | 136 (12.1%) |
| $25,000 to $34,999 | 208 (3.0%) | 82 (7.3%) |
| $35,000 to $49,999 | 304 (4.3%) | 294 (26.3%) |
| $50,000 to $74,999 | 861 (12.3%) | 171 (15.3%) |
| $75,000 to $99,999 | 955 (13.6%) | 61 (5.4%) |
| $100,000 to $149,999 | 2,037 (29.1%) | 173 (15.5%) |
| $150,000 or more | 2,460 (35.1%) | 70 (6.3%) |
| Total | 7,003 (100.0%) | 1,119 (100.0%) |
Monthly Housing Cost Tiers in Farmington
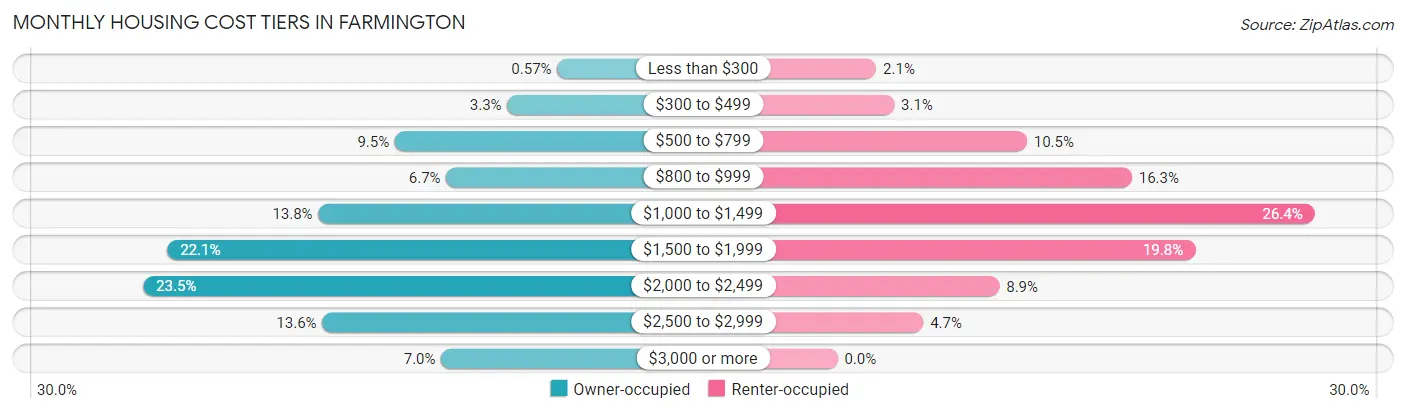
| Monthly Cost | Owner-occupied | Renter-occupied |
| Less than $300 | 40 (0.6%) | 24 (2.1%) |
| $300 to $499 | 233 (3.3%) | 35 (3.1%) |
| $500 to $799 | 668 (9.5%) | 117 (10.5%) |
| $800 to $999 | 469 (6.7%) | 182 (16.3%) |
| $1,000 to $1,499 | 964 (13.8%) | 295 (26.4%) |
| $1,500 to $1,999 | 1,549 (22.1%) | 221 (19.8%) |
| $2,000 to $2,499 | 1,642 (23.4%) | 100 (8.9%) |
| $2,500 to $2,999 | 949 (13.6%) | 53 (4.7%) |
| $3,000 or more | 489 (7.0%) | 0 (0.0%) |
| Total | 7,003 (100.0%) | 1,119 (100.0%) |
Physical Housing Characteristics in Farmington
Housing Structures in Farmington
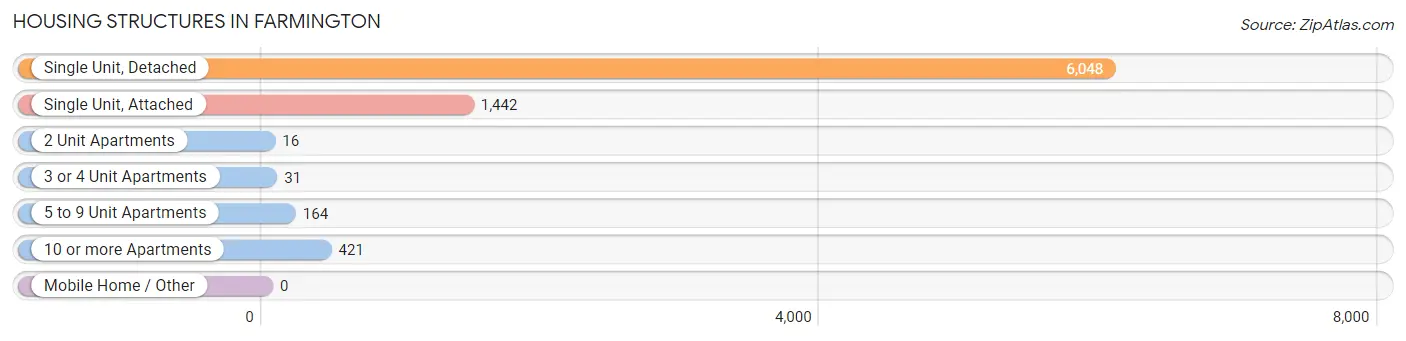
| Structure Type | # Housing Units | % Housing Units |
| Single Unit, Detached | 6,048 | 74.5% |
| Single Unit, Attached | 1,442 | 17.7% |
| 2 Unit Apartments | 16 | 0.2% |
| 3 or 4 Unit Apartments | 31 | 0.4% |
| 5 to 9 Unit Apartments | 164 | 2.0% |
| 10 or more Apartments | 421 | 5.2% |
| Mobile Home / Other | 0 | 0.0% |
| Total | 8,122 | 100.0% |
Housing Structures by Occupancy in Farmington
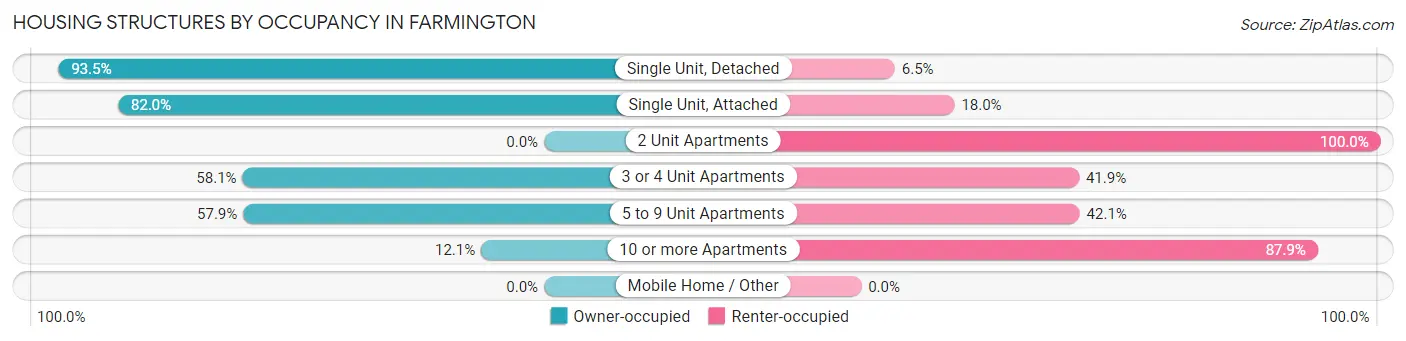
| Structure Type | Owner-occupied | Renter-occupied |
| Single Unit, Detached | 5,656 (93.5%) | 392 (6.5%) |
| Single Unit, Attached | 1,183 (82.0%) | 259 (18.0%) |
| 2 Unit Apartments | 0 (0.0%) | 16 (100.0%) |
| 3 or 4 Unit Apartments | 18 (58.1%) | 13 (41.9%) |
| 5 to 9 Unit Apartments | 95 (57.9%) | 69 (42.1%) |
| 10 or more Apartments | 51 (12.1%) | 370 (87.9%) |
| Mobile Home / Other | 0 (0.0%) | 0 (0.0%) |
| Total | 7,003 (86.2%) | 1,119 (13.8%) |
Housing Structures by Number of Rooms in Farmington
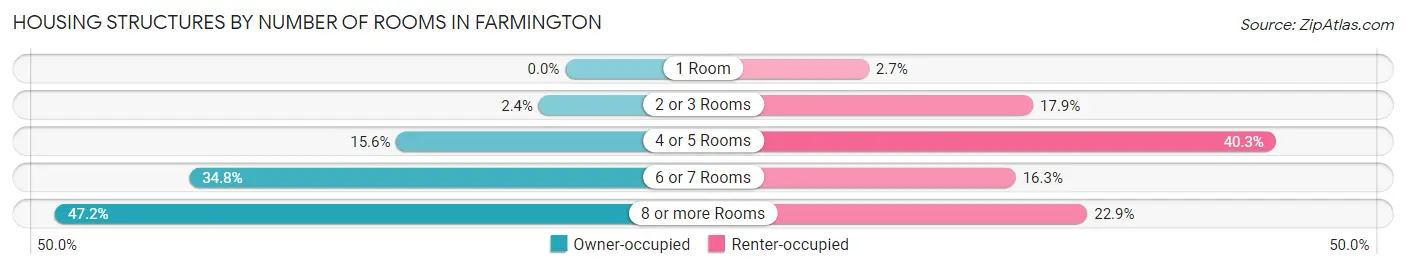
| Number of Rooms | Owner-occupied | Renter-occupied |
| 1 Room | 0 (0.0%) | 30 (2.7%) |
| 2 or 3 Rooms | 171 (2.4%) | 200 (17.9%) |
| 4 or 5 Rooms | 1,094 (15.6%) | 451 (40.3%) |
| 6 or 7 Rooms | 2,435 (34.8%) | 182 (16.3%) |
| 8 or more Rooms | 3,303 (47.2%) | 256 (22.9%) |
| Total | 7,003 (100.0%) | 1,119 (100.0%) |
Housing Structure by Heating Type in Farmington
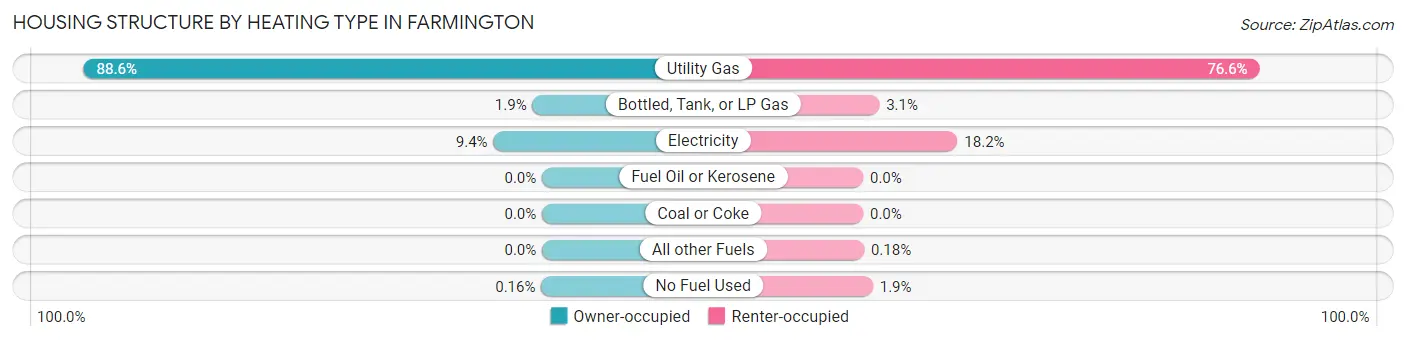
| Heating Type | Owner-occupied | Renter-occupied |
| Utility Gas | 6,203 (88.6%) | 857 (76.6%) |
| Bottled, Tank, or LP Gas | 130 (1.9%) | 35 (3.1%) |
| Electricity | 659 (9.4%) | 204 (18.2%) |
| Fuel Oil or Kerosene | 0 (0.0%) | 0 (0.0%) |
| Coal or Coke | 0 (0.0%) | 0 (0.0%) |
| All other Fuels | 0 (0.0%) | 2 (0.2%) |
| No Fuel Used | 11 (0.2%) | 21 (1.9%) |
| Total | 7,003 (100.0%) | 1,119 (100.0%) |
Household Vehicle Usage in Farmington
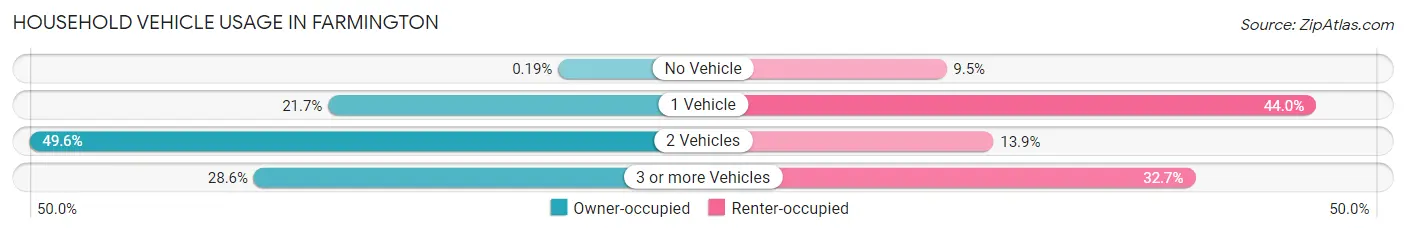
| Vehicles per Household | Owner-occupied | Renter-occupied |
| No Vehicle | 13 (0.2%) | 106 (9.5%) |
| 1 Vehicle | 1,517 (21.7%) | 492 (44.0%) |
| 2 Vehicles | 3,470 (49.5%) | 155 (13.9%) |
| 3 or more Vehicles | 2,003 (28.6%) | 366 (32.7%) |
| Total | 7,003 (100.0%) | 1,119 (100.0%) |
Real Estate & Mortgages in Farmington
Real Estate and Mortgage Overview in Farmington
| Characteristic | Without Mortgage | With Mortgage |
| Housing Units | 1,432 | 5,571 |
| Median Property Value | $285,500 | $334,600 |
| Median Household Income | $94,934 | $2,073 |
| Monthly Housing Costs | $708 | $489 |
| Real Estate Taxes | $3,828 | $74 |
Property Value by Mortgage Status in Farmington
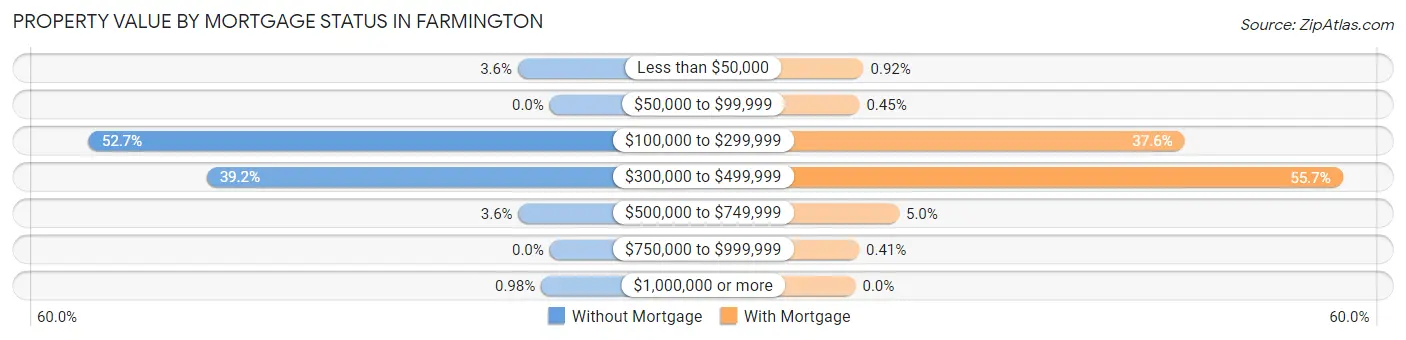
| Property Value | Without Mortgage | With Mortgage |
| Less than $50,000 | 52 (3.6%) | 51 (0.9%) |
| $50,000 to $99,999 | 0 (0.0%) | 25 (0.4%) |
| $100,000 to $299,999 | 754 (52.6%) | 2,095 (37.6%) |
| $300,000 to $499,999 | 561 (39.2%) | 3,100 (55.6%) |
| $500,000 to $749,999 | 51 (3.6%) | 277 (5.0%) |
| $750,000 to $999,999 | 0 (0.0%) | 23 (0.4%) |
| $1,000,000 or more | 14 (1.0%) | 0 (0.0%) |
| Total | 1,432 (100.0%) | 5,571 (100.0%) |
Household Income by Mortgage Status in Farmington
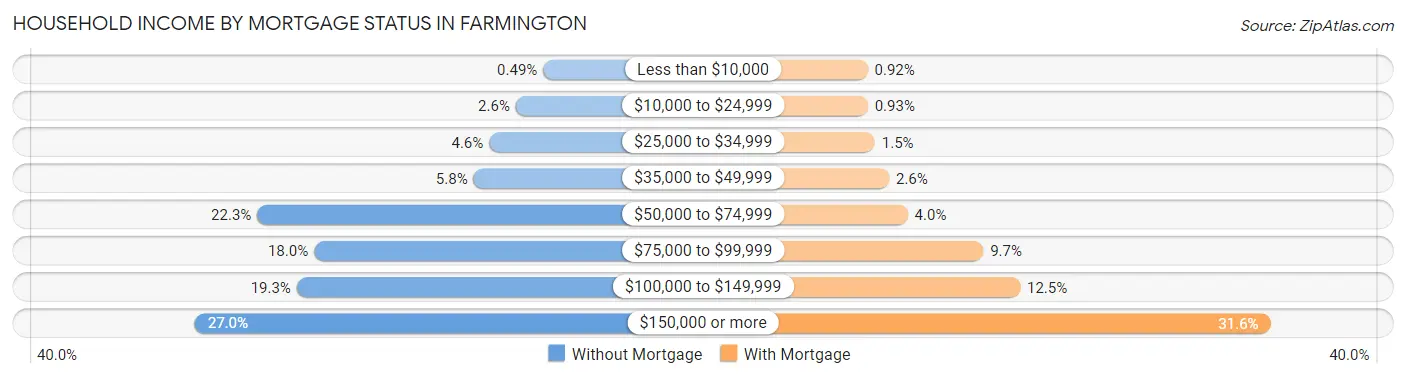
| Household Income | Without Mortgage | With Mortgage |
| Less than $10,000 | 7 (0.5%) | 51 (0.9%) |
| $10,000 to $24,999 | 37 (2.6%) | 52 (0.9%) |
| $25,000 to $34,999 | 66 (4.6%) | 82 (1.5%) |
| $35,000 to $49,999 | 83 (5.8%) | 142 (2.5%) |
| $50,000 to $74,999 | 319 (22.3%) | 221 (4.0%) |
| $75,000 to $99,999 | 257 (17.9%) | 542 (9.7%) |
| $100,000 to $149,999 | 276 (19.3%) | 698 (12.5%) |
| $150,000 or more | 387 (27.0%) | 1,761 (31.6%) |
| Total | 1,432 (100.0%) | 5,571 (100.0%) |
Property Value to Household Income Ratio in Farmington
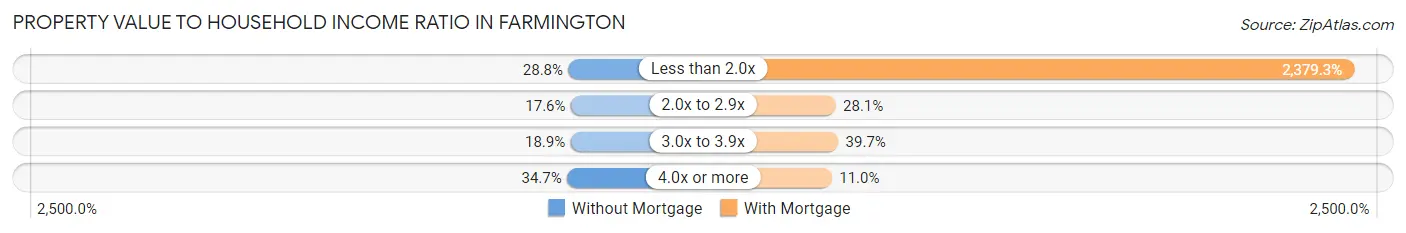
| Value-to-Income Ratio | Without Mortgage | With Mortgage |
| Less than 2.0x | 413 (28.8%) | 132,551 (2,379.3%) |
| 2.0x to 2.9x | 252 (17.6%) | 1,565 (28.1%) |
| 3.0x to 3.9x | 270 (18.9%) | 2,211 (39.7%) |
| 4.0x or more | 497 (34.7%) | 612 (11.0%) |
| Total | 1,432 (100.0%) | 5,571 (100.0%) |
Real Estate Taxes by Mortgage Status in Farmington
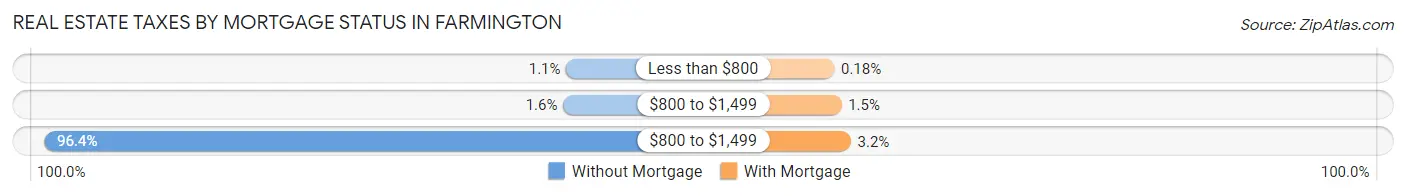
| Property Taxes | Without Mortgage | With Mortgage |
| Less than $800 | 15 (1.1%) | 10 (0.2%) |
| $800 to $1,499 | 23 (1.6%) | 83 (1.5%) |
| $800 to $1,499 | 1,381 (96.4%) | 179 (3.2%) |
| Total | 1,432 (100.0%) | 5,571 (100.0%) |
Health & Disability in Farmington
Health Insurance Coverage by Age in Farmington
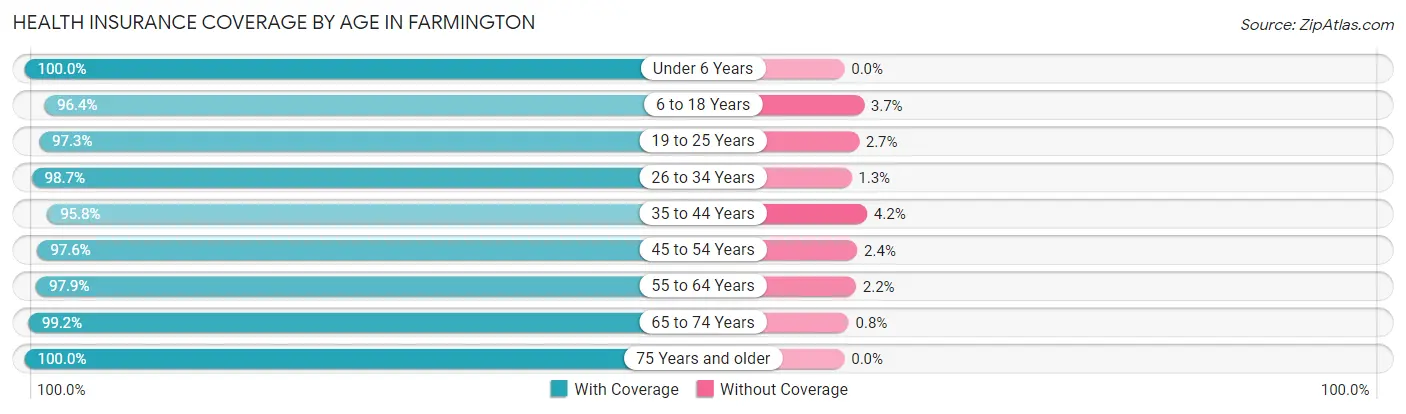
| Age Bracket | With Coverage | Without Coverage |
| Under 6 Years | 2,183 (100.0%) | 0 (0.0%) |
| 6 to 18 Years | 5,308 (96.4%) | 201 (3.6%) |
| 19 to 25 Years | 1,295 (97.3%) | 36 (2.7%) |
| 26 to 34 Years | 2,618 (98.7%) | 35 (1.3%) |
| 35 to 44 Years | 3,657 (95.8%) | 161 (4.2%) |
| 45 to 54 Years | 3,416 (97.6%) | 84 (2.4%) |
| 55 to 64 Years | 2,591 (97.9%) | 57 (2.1%) |
| 65 to 74 Years | 998 (99.2%) | 8 (0.8%) |
| 75 Years and older | 757 (100.0%) | 0 (0.0%) |
| Total | 22,823 (97.5%) | 582 (2.5%) |
Health Insurance Coverage by Citizenship Status in Farmington
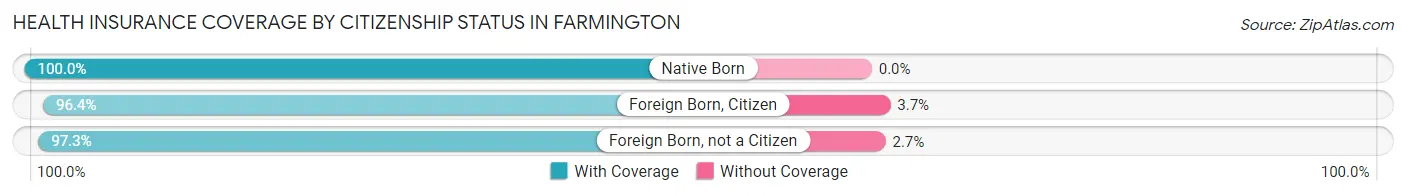
| Citizenship Status | With Coverage | Without Coverage |
| Native Born | 2,183 (100.0%) | 0 (0.0%) |
| Foreign Born, Citizen | 5,308 (96.4%) | 201 (3.6%) |
| Foreign Born, not a Citizen | 1,295 (97.3%) | 36 (2.7%) |
Health Insurance Coverage by Household Income in Farmington
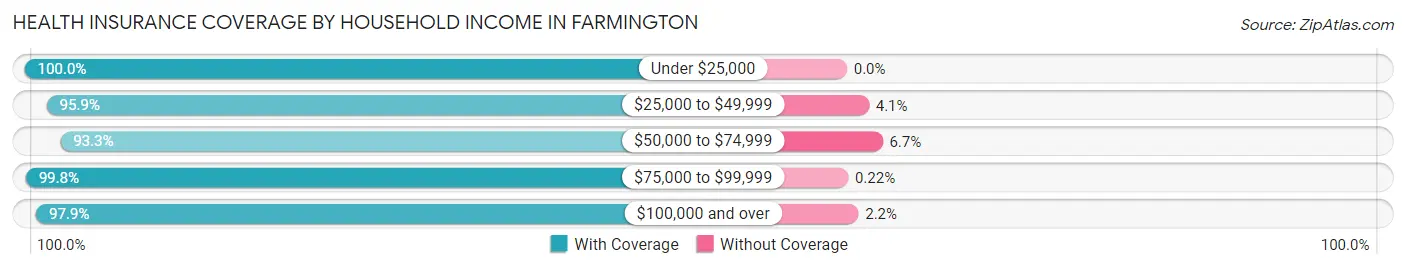
| Household Income | With Coverage | Without Coverage |
| Under $25,000 | 513 (100.0%) | 0 (0.0%) |
| $25,000 to $49,999 | 1,512 (95.9%) | 65 (4.1%) |
| $50,000 to $74,999 | 2,334 (93.3%) | 167 (6.7%) |
| $75,000 to $99,999 | 2,732 (99.8%) | 6 (0.2%) |
| $100,000 and over | 15,683 (97.9%) | 344 (2.1%) |
Public vs Private Health Insurance Coverage by Age in Farmington
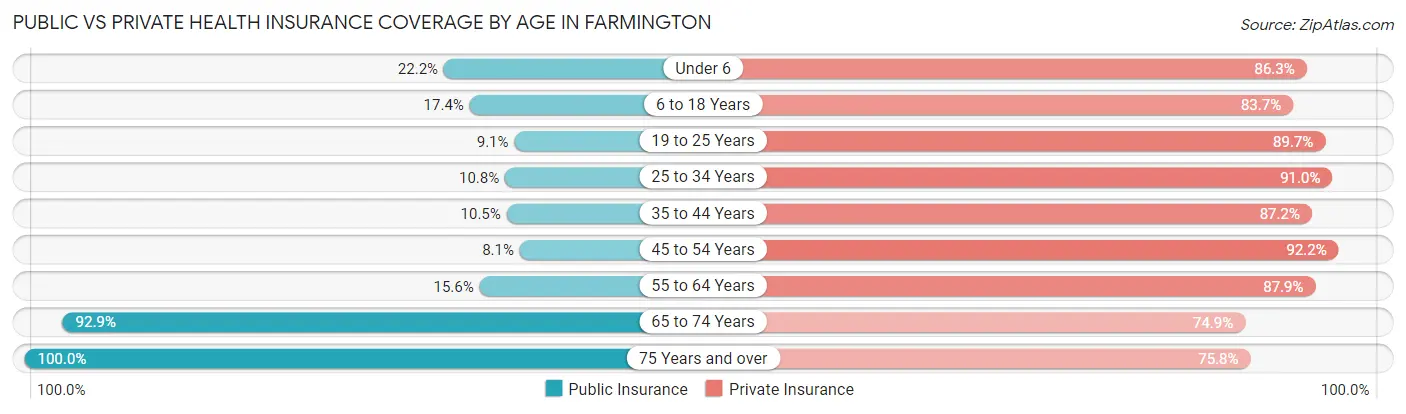
| Age Bracket | Public Insurance | Private Insurance |
| Under 6 | 484 (22.2%) | 1,883 (86.3%) |
| 6 to 18 Years | 958 (17.4%) | 4,613 (83.7%) |
| 19 to 25 Years | 121 (9.1%) | 1,194 (89.7%) |
| 25 to 34 Years | 287 (10.8%) | 2,415 (91.0%) |
| 35 to 44 Years | 402 (10.5%) | 3,330 (87.2%) |
| 45 to 54 Years | 283 (8.1%) | 3,227 (92.2%) |
| 55 to 64 Years | 412 (15.6%) | 2,327 (87.9%) |
| 65 to 74 Years | 935 (92.9%) | 753 (74.9%) |
| 75 Years and over | 757 (100.0%) | 574 (75.8%) |
| Total | 4,639 (19.8%) | 20,316 (86.8%) |
Disability Status by Sex by Age in Farmington
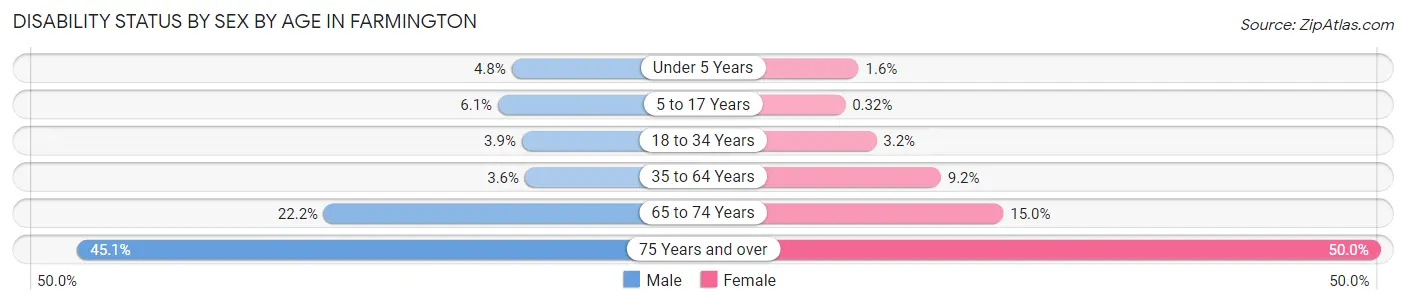
| Age Bracket | Male | Female |
| Under 5 Years | 44 (4.8%) | 13 (1.6%) |
| 5 to 17 Years | 179 (6.1%) | 9 (0.3%) |
| 18 to 34 Years | 89 (3.9%) | 61 (3.2%) |
| 35 to 64 Years | 175 (3.6%) | 466 (9.2%) |
| 65 to 74 Years | 102 (22.2%) | 82 (15.0%) |
| 75 Years and over | 161 (45.1%) | 200 (50.0%) |
Disability Class by Sex by Age in Farmington
Disability Class: Hearing Difficulty
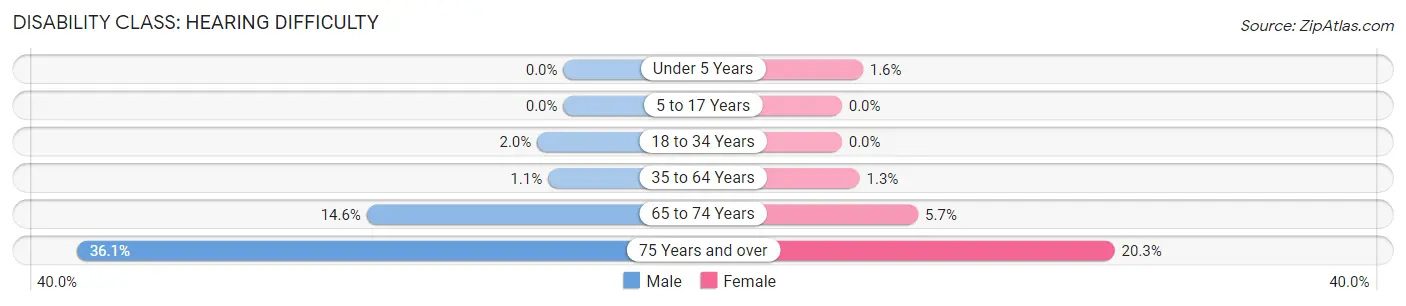
| Age Bracket | Male | Female |
| Under 5 Years | 0 (0.0%) | 13 (1.6%) |
| 5 to 17 Years | 0 (0.0%) | 0 (0.0%) |
| 18 to 34 Years | 45 (1.9%) | 0 (0.0%) |
| 35 to 64 Years | 56 (1.1%) | 67 (1.3%) |
| 65 to 74 Years | 67 (14.6%) | 31 (5.7%) |
| 75 Years and over | 129 (36.1%) | 81 (20.3%) |
Disability Class: Vision Difficulty
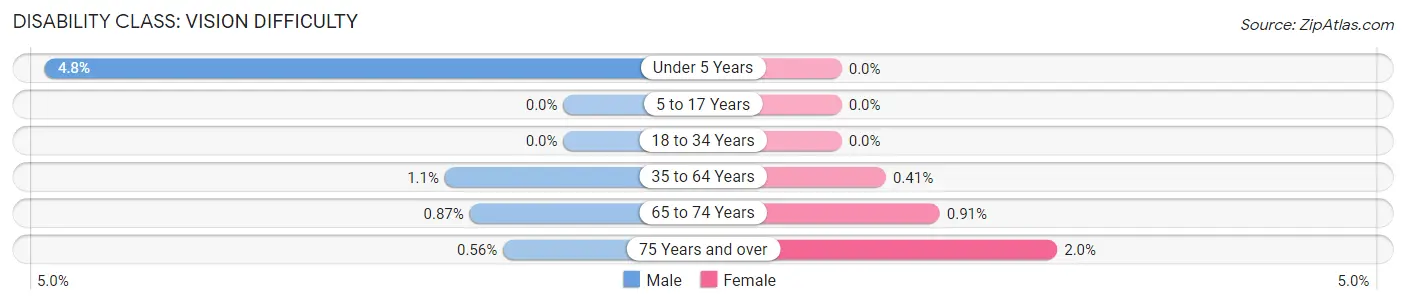
| Age Bracket | Male | Female |
| Under 5 Years | 44 (4.8%) | 0 (0.0%) |
| 5 to 17 Years | 0 (0.0%) | 0 (0.0%) |
| 18 to 34 Years | 0 (0.0%) | 0 (0.0%) |
| 35 to 64 Years | 54 (1.1%) | 21 (0.4%) |
| 65 to 74 Years | 4 (0.9%) | 5 (0.9%) |
| 75 Years and over | 2 (0.6%) | 8 (2.0%) |
Disability Class: Cognitive Difficulty
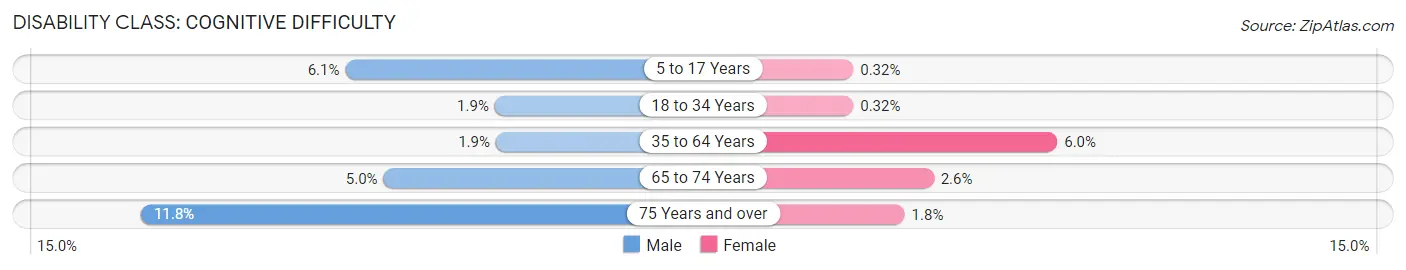
| Age Bracket | Male | Female |
| 5 to 17 Years | 179 (6.1%) | 9 (0.3%) |
| 18 to 34 Years | 44 (1.9%) | 6 (0.3%) |
| 35 to 64 Years | 92 (1.9%) | 304 (6.0%) |
| 65 to 74 Years | 23 (5.0%) | 14 (2.6%) |
| 75 Years and over | 42 (11.8%) | 7 (1.8%) |
Disability Class: Ambulatory Difficulty
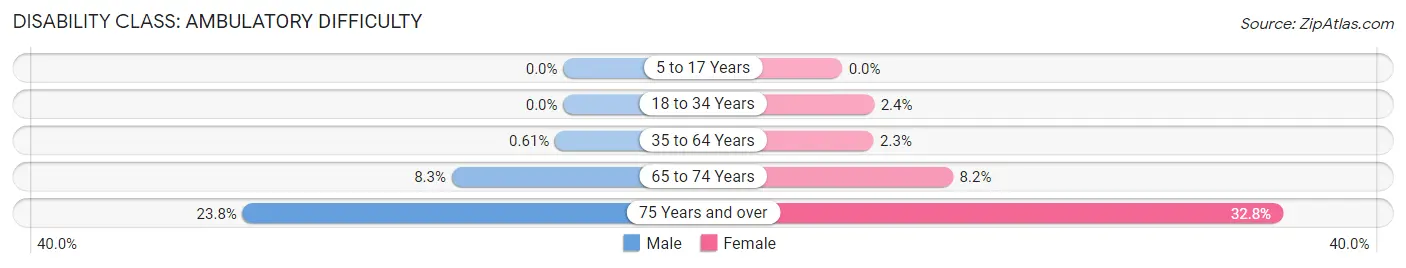
| Age Bracket | Male | Female |
| 5 to 17 Years | 0 (0.0%) | 0 (0.0%) |
| 18 to 34 Years | 0 (0.0%) | 45 (2.4%) |
| 35 to 64 Years | 30 (0.6%) | 118 (2.3%) |
| 65 to 74 Years | 38 (8.3%) | 45 (8.2%) |
| 75 Years and over | 85 (23.8%) | 131 (32.8%) |
Disability Class: Self-Care Difficulty
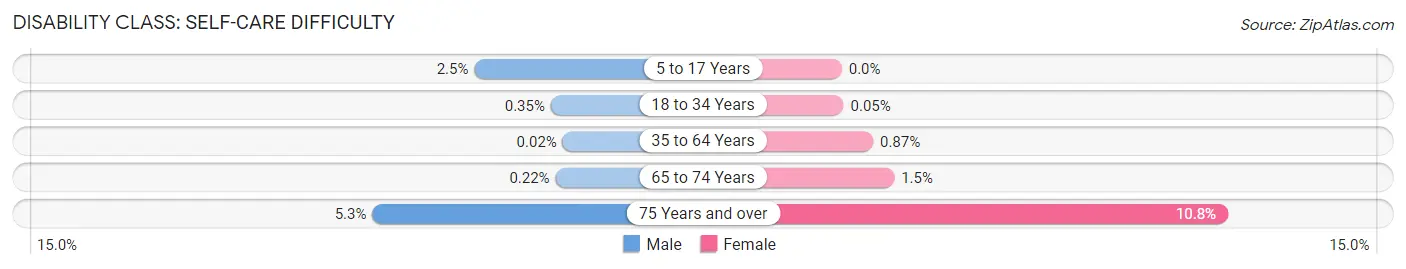
| Age Bracket | Male | Female |
| 5 to 17 Years | 73 (2.5%) | 0 (0.0%) |
| 18 to 34 Years | 8 (0.4%) | 1 (0.1%) |
| 35 to 64 Years | 1 (0.0%) | 44 (0.9%) |
| 65 to 74 Years | 1 (0.2%) | 8 (1.5%) |
| 75 Years and over | 19 (5.3%) | 43 (10.7%) |
Technology Access in Farmington
Computing Device Access in Farmington
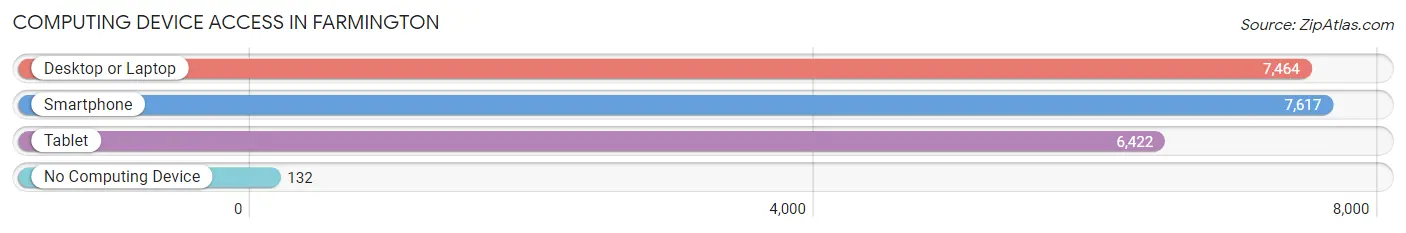
| Device Type | # Households | % Households |
| Desktop or Laptop | 7,464 | 91.9% |
| Smartphone | 7,617 | 93.8% |
| Tablet | 6,422 | 79.1% |
| No Computing Device | 132 | 1.6% |
| Total | 8,122 | 100.0% |
Internet Access in Farmington
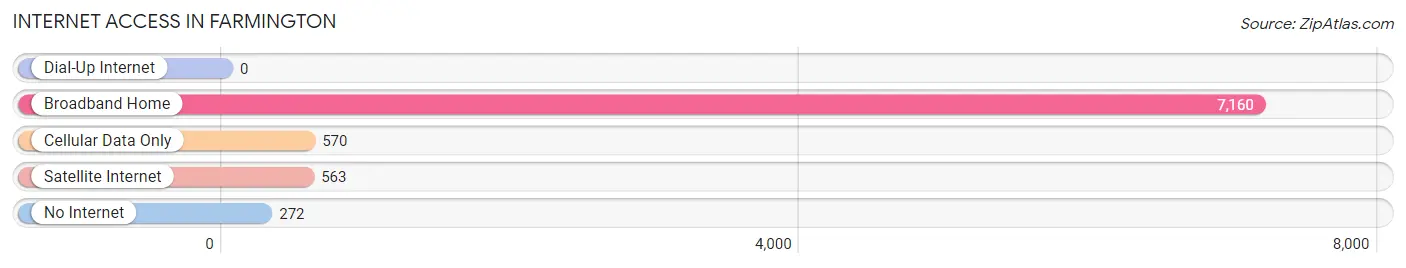
| Internet Type | # Households | % Households |
| Dial-Up Internet | 0 | 0.0% |
| Broadband Home | 7,160 | 88.2% |
| Cellular Data Only | 570 | 7.0% |
| Satellite Internet | 563 | 6.9% |
| No Internet | 272 | 3.4% |
| Total | 8,122 | 100.0% |
Farmington Summary
History
The city of Farmington, Minnesota is located in Dakota County, approximately 25 miles south of Minneapolis. The city was founded in 1852 by a group of settlers from New York, led by William Meighen. The settlers chose the area due to its proximity to the Vermillion River, which provided a source of water for the settlers. The city was originally named “Farmington Township” and was later changed to “Farmington” in 1858.
The city of Farmington was officially incorporated in 1858 and was the first city in Dakota County. The city was initially a farming community, with the majority of the population being farmers. The city was also home to a number of businesses, including a sawmill, a grist mill, a blacksmith shop, and a general store.
In the late 19th century, the city began to grow and develop. The railroad arrived in 1872, which allowed for the transportation of goods and people to and from the city. The city also began to attract new businesses, such as a brickyard, a creamery, and a brewery.
In the early 20th century, the city continued to grow and develop. The city was home to a number of factories, including a flour mill, a canning factory, and a furniture factory. The city also had a number of churches, schools, and other civic organizations.
In the late 20th century, the city began to experience a period of growth and development. The city was home to a number of new businesses, including a shopping mall, a movie theater, and a number of restaurants. The city also had a number of parks and recreational facilities, including a golf course, a swimming pool, and a skate park.
Geography
Farmington is located in Dakota County, Minnesota, approximately 25 miles south of Minneapolis. The city is situated on the banks of the Vermillion River, which provides a source of water for the city. The city is surrounded by a number of small towns and villages, including Lakeville, Apple Valley, and Rosemount.
The city of Farmington covers an area of approximately 8.5 square miles and has a population of approximately 21,000 people. The city is located at an elevation of 945 feet above sea level. The city has a humid continental climate, with cold winters and warm summers.
Economy
The economy of Farmington is largely based on the service industry. The city is home to a number of businesses, including restaurants, retail stores, and professional services. The city is also home to a number of manufacturing companies, including a furniture factory, a canning factory, and a flour mill.
The city is also home to a number of educational institutions, including a community college, a technical college, and a number of public and private schools. The city is also home to a number of healthcare facilities, including a hospital and a number of clinics.
Demographics
As of the 2010 census, the population of Farmington was 21,086. The population is largely white, with approximately 87% of the population being white. The city also has a large Hispanic population, with approximately 10% of the population being Hispanic. The city also has a small African American population, with approximately 2% of the population being African American.
The median household income in Farmington is approximately $63,000, which is slightly higher than the national average. The median home value in the city is approximately $250,000, which is slightly higher than the national average. The city also has a low unemployment rate, with approximately 3.5% of the population being unemployed.
Common Questions
What is Per Capita Income in Farmington?
Per Capita income in Farmington is $44,105.
What is the Median Family Income in Farmington?
Median Family Income in Farmington is $133,464.
What is the Median Household income in Farmington?
Median Household Income in Farmington is $114,737.
What is Income or Wage Gap in Farmington?
Income or Wage Gap in Farmington is 29.3%.
Women in Farmington earn 70.7 cents for every dollar earned by a man.
What is Inequality or Gini Index in Farmington?
Inequality or Gini Index in Farmington is 0.34.
What is the Total Population of Farmington?
Total Population of Farmington is 23,487.
What is the Total Male Population of Farmington?
Total Male Population of Farmington is 11,933.
What is the Total Female Population of Farmington?
Total Female Population of Farmington is 11,554.
What is the Ratio of Males per 100 Females in Farmington?
There are 103.28 Males per 100 Females in Farmington.
What is the Ratio of Females per 100 Males in Farmington?
There are 96.82 Females per 100 Males in Farmington.
What is the Median Population Age in Farmington?
Median Population Age in Farmington is 35.1 Years.
What is the Average Family Size in Farmington
Average Family Size in Farmington is 3.3 People.
What is the Average Household Size in Farmington
Average Household Size in Farmington is 2.9 People.
How Large is the Labor Force in Farmington?
There are 13,407 People in the Labor Forcein in Farmington.
What is the Percentage of People in the Labor Force in Farmington?
79.3% of People are in the Labor Force in Farmington.
What is the Unemployment Rate in Farmington?
Unemployment Rate in Farmington is 3.4%.