Starbuck, MN Map & Demographics
Starbuck Map
Starbuck Overview
$32,271
PER CAPITA INCOME
$78,281
AVG FAMILY INCOME
$57,167
AVG HOUSEHOLD INCOME
20.2%
WAGE / INCOME GAP [ % ]
79.8¢/ $1
WAGE / INCOME GAP [ $ ]
0.42
INEQUALITY / GINI INDEX
1,269
TOTAL POPULATION
590
MALE POPULATION
679
FEMALE POPULATION
86.89
MALES / 100 FEMALES
115.08
FEMALES / 100 MALES
48.1
MEDIAN AGE
2.7
AVG FAMILY SIZE
2.1
AVG HOUSEHOLD SIZE
673
LABOR FORCE [ PEOPLE ]
64.0%
PERCENT IN LABOR FORCE
0.6%
UNEMPLOYMENT RATE
Starbuck Zip Codes
Starbuck Area Codes
Income in Starbuck
Income Overview in Starbuck
Per Capita Income in Starbuck is $32,271, while median incomes of families and households are $78,281 and $57,167 respectively.
| Characteristic | Number | Measure |
| Per Capita Income | 1,269 | $32,271 |
| Median Family Income | 329 | $78,281 |
| Mean Family Income | 329 | $91,018 |
| Median Household Income | 556 | $57,167 |
| Mean Household Income | 556 | $71,804 |
| Income Deficit | 329 | $0 |
| Wage / Income Gap (%) | 1,269 | 20.22% |
| Wage / Income Gap ($) | 1,269 | 79.78¢ per $1 |
| Gini / Inequality Index | 1,269 | 0.42 |
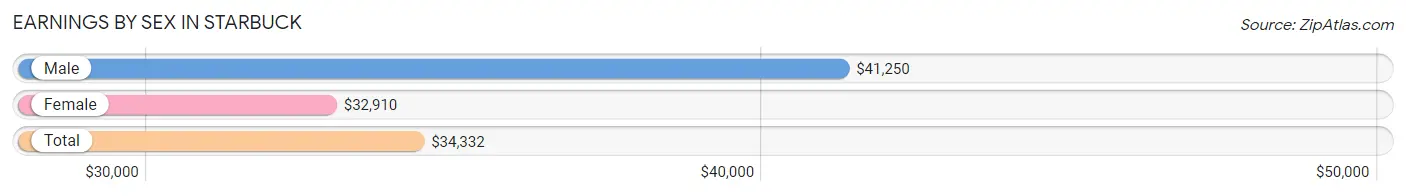
Earnings by Sex in Starbuck
Average Earnings in Starbuck are $34,332, $41,250 for men and $32,910 for women, a difference of 20.2%.
| Sex | Number | Average Earnings |
| Male | 331 (45.7%) | $41,250 |
| Female | 394 (54.3%) | $32,910 |
| Total | 725 (100.0%) | $34,332 |
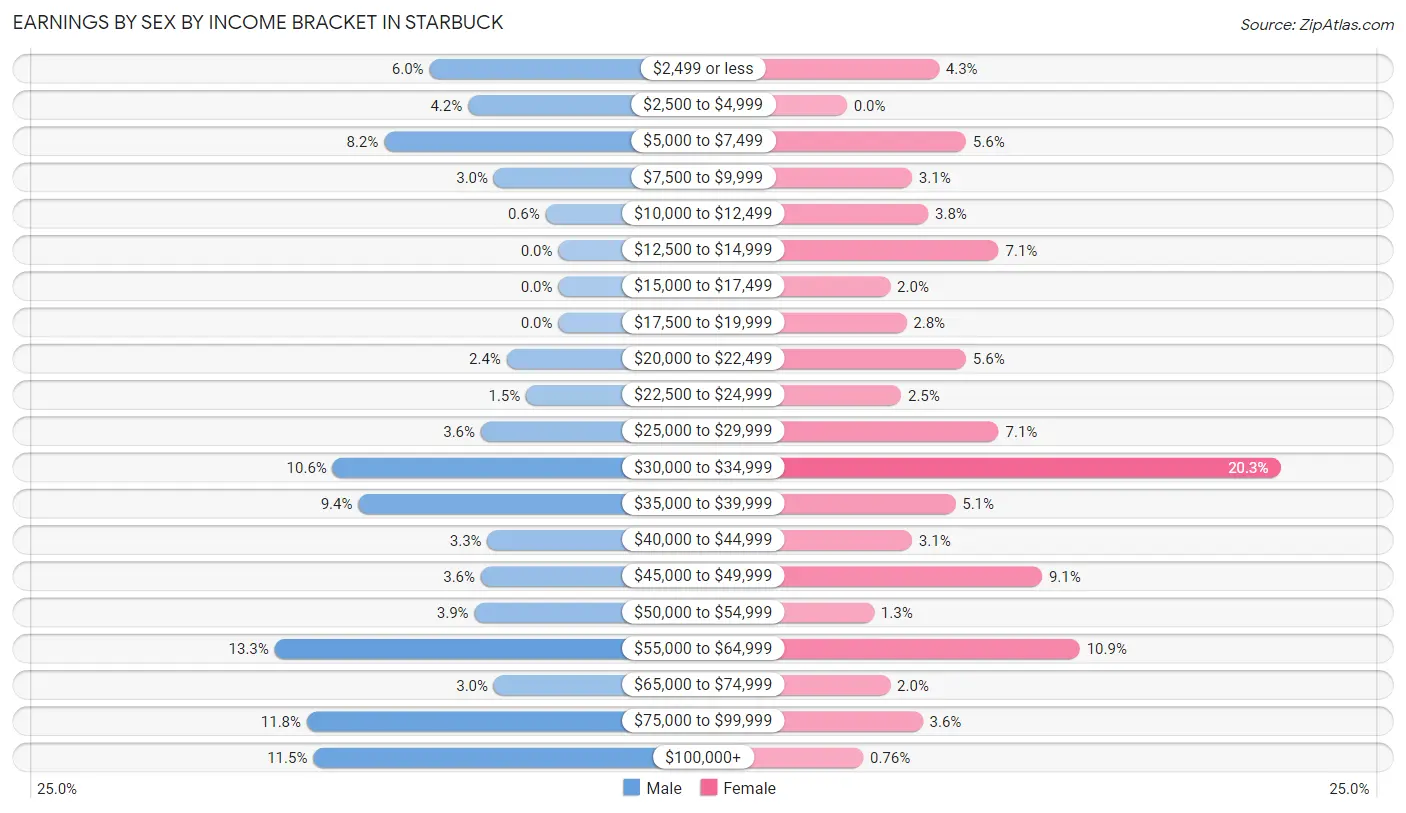
Earnings by Sex by Income Bracket in Starbuck
The most common earnings brackets in Starbuck are $55,000 to $64,999 for men (44 | 13.3%) and $30,000 to $34,999 for women (80 | 20.3%).
| Income | Male | Female |
| $2,499 or less | 20 (6.0%) | 17 (4.3%) |
| $2,500 to $4,999 | 14 (4.2%) | 0 (0.0%) |
| $5,000 to $7,499 | 27 (8.2%) | 22 (5.6%) |
| $7,500 to $9,999 | 10 (3.0%) | 12 (3.0%) |
| $10,000 to $12,499 | 2 (0.6%) | 15 (3.8%) |
| $12,500 to $14,999 | 0 (0.0%) | 28 (7.1%) |
| $15,000 to $17,499 | 0 (0.0%) | 8 (2.0%) |
| $17,500 to $19,999 | 0 (0.0%) | 11 (2.8%) |
| $20,000 to $22,499 | 8 (2.4%) | 22 (5.6%) |
| $22,500 to $24,999 | 5 (1.5%) | 10 (2.5%) |
| $25,000 to $29,999 | 12 (3.6%) | 28 (7.1%) |
| $30,000 to $34,999 | 35 (10.6%) | 80 (20.3%) |
| $35,000 to $39,999 | 31 (9.4%) | 20 (5.1%) |
| $40,000 to $44,999 | 11 (3.3%) | 12 (3.0%) |
| $45,000 to $49,999 | 12 (3.6%) | 36 (9.1%) |
| $50,000 to $54,999 | 13 (3.9%) | 5 (1.3%) |
| $55,000 to $64,999 | 44 (13.3%) | 43 (10.9%) |
| $65,000 to $74,999 | 10 (3.0%) | 8 (2.0%) |
| $75,000 to $99,999 | 39 (11.8%) | 14 (3.5%) |
| $100,000+ | 38 (11.5%) | 3 (0.8%) |
| Total | 331 (100.0%) | 394 (100.0%) |
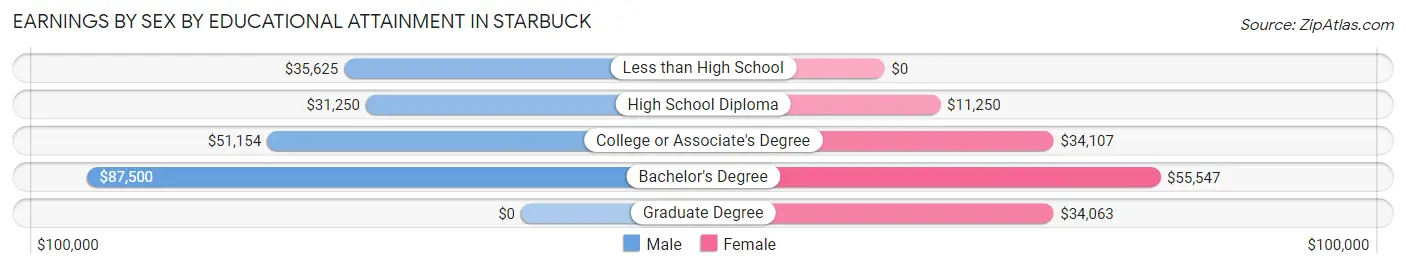
Earnings by Sex by Educational Attainment in Starbuck
Average earnings in Starbuck are $43,125 for men and $33,563 for women, a difference of 22.2%. Men with an educational attainment of bachelor's degree enjoy the highest average annual earnings of $87,500, while those with high school diploma education earn the least with $31,250. Women with an educational attainment of bachelor's degree earn the most with the average annual earnings of $55,547, while those with high school diploma education have the smallest earnings of $11,250.
| Educational Attainment | Male Income | Female Income |
| Less than High School | $35,625 | $0 |
| High School Diploma | $31,250 | $11,250 |
| College or Associate's Degree | $51,154 | $34,107 |
| Bachelor's Degree | $87,500 | $55,547 |
| Graduate Degree | - | - |
| Total | $43,125 | $33,563 |
Family Income in Starbuck
Family Income Brackets in Starbuck
According to the Starbuck family income data, there are 66 families falling into the $50,000 to $74,999 income range, which is the most common income bracket and makes up 20.1% of all families. Conversely, the less than $10,000 income bracket is the least frequent group with only 9 families (2.7%) belonging to this category.
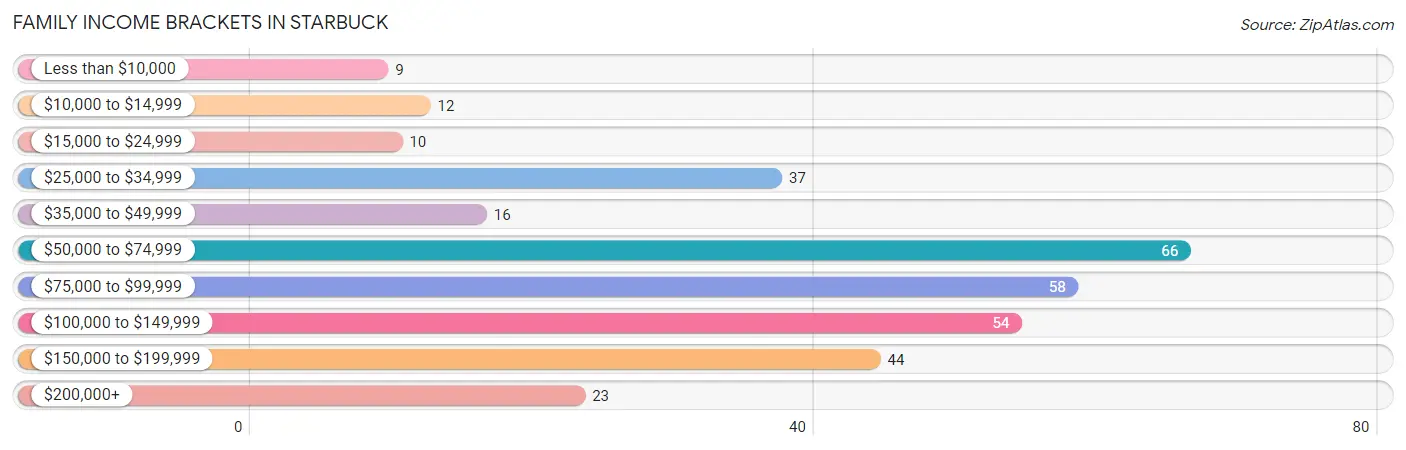
| Income Bracket | # Families | % Families |
| Less than $10,000 | 9 | 2.7% |
| $10,000 to $14,999 | 12 | 3.6% |
| $15,000 to $24,999 | 10 | 3.0% |
| $25,000 to $34,999 | 37 | 11.2% |
| $35,000 to $49,999 | 16 | 4.9% |
| $50,000 to $74,999 | 66 | 20.1% |
| $75,000 to $99,999 | 58 | 17.6% |
| $100,000 to $149,999 | 54 | 16.4% |
| $150,000 to $199,999 | 44 | 13.4% |
| $200,000+ | 23 | 7.0% |
Family Income by Famaliy Size in Starbuck
3-person families (72 | 21.9%) account for the highest median family income in Starbuck with $123,333 per family, while 3-person families (72 | 21.9%) have the highest median income of $41,111 per family member.
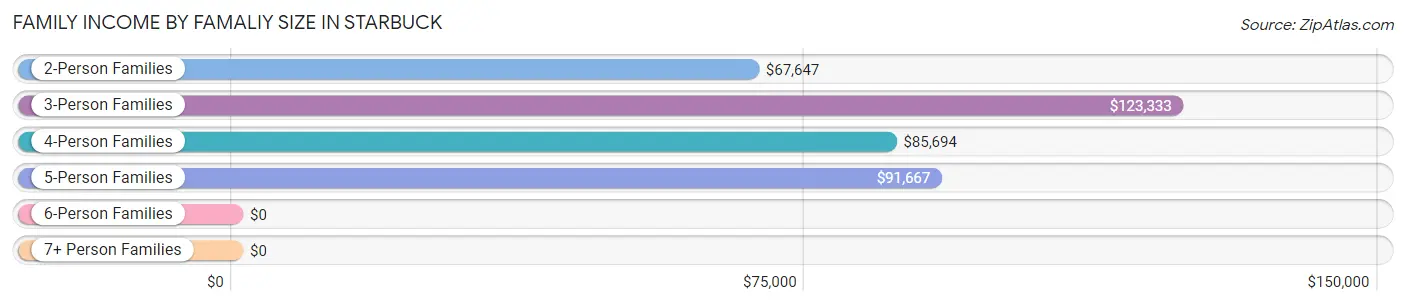
| Income Bracket | # Families | Median Income |
| 2-Person Families | 178 (54.1%) | $67,647 |
| 3-Person Families | 72 (21.9%) | $123,333 |
| 4-Person Families | 65 (19.8%) | $85,694 |
| 5-Person Families | 10 (3.0%) | $91,667 |
| 6-Person Families | 4 (1.2%) | $0 |
| 7+ Person Families | 0 (0.0%) | $0 |
| Total | 329 (100.0%) | $78,281 |
Family Income by Number of Earners in Starbuck
The median family income in Starbuck is $78,281, with families comprising 3+ earners (41) having the highest median family income of $194,125, while families with no earners (52) have the lowest median family income of $37,500, accounting for 12.5% and 15.8% of families, respectively.
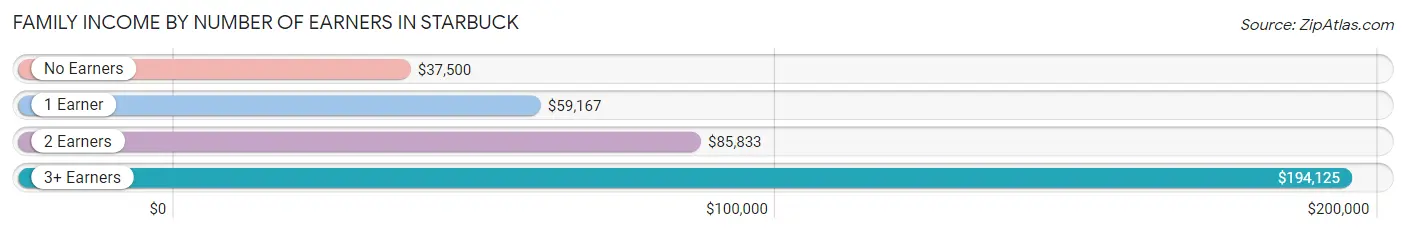
| Number of Earners | # Families | Median Income |
| No Earners | 52 (15.8%) | $37,500 |
| 1 Earner | 68 (20.7%) | $59,167 |
| 2 Earners | 168 (51.1%) | $85,833 |
| 3+ Earners | 41 (12.5%) | $194,125 |
| Total | 329 (100.0%) | $78,281 |
Household Income in Starbuck
Household Income Brackets in Starbuck
With 102 households falling in the category, the $50,000 to $74,999 income range is the most frequent in Starbuck, accounting for 18.3% of all households. In contrast, only 22 households (4.0%) fall into the less than $10,000 income bracket, making it the least populous group.
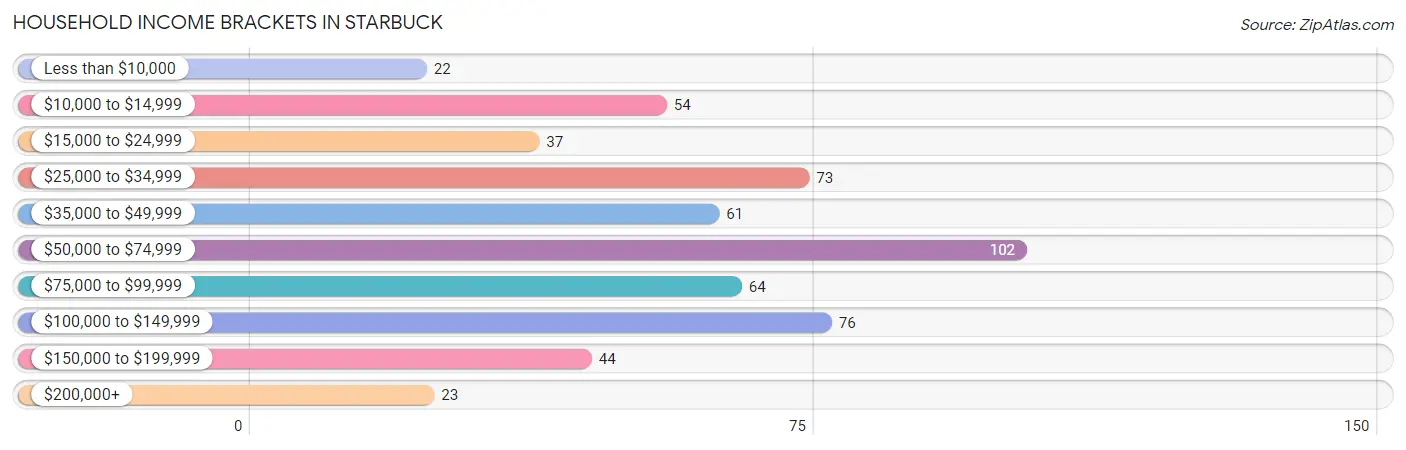
| Income Bracket | # Households | % Households |
| Less than $10,000 | 22 | 4.0% |
| $10,000 to $14,999 | 54 | 9.7% |
| $15,000 to $24,999 | 37 | 6.7% |
| $25,000 to $34,999 | 73 | 13.1% |
| $35,000 to $49,999 | 61 | 11.0% |
| $50,000 to $74,999 | 102 | 18.3% |
| $75,000 to $99,999 | 64 | 11.5% |
| $100,000 to $149,999 | 76 | 13.7% |
| $150,000 to $199,999 | 44 | 7.9% |
| $200,000+ | 23 | 4.1% |
Household Income by Householder Age in Starbuck
The median household income in Starbuck is $57,167, with the highest median household income of $76,042 found in the 45 to 64 years age bracket for the primary householder. A total of 176 households (31.7%) fall into this category. Meanwhile, the 15 to 24 years age bracket for the primary householder has the lowest median household income of $0, with 15 households (2.7%) in this group.
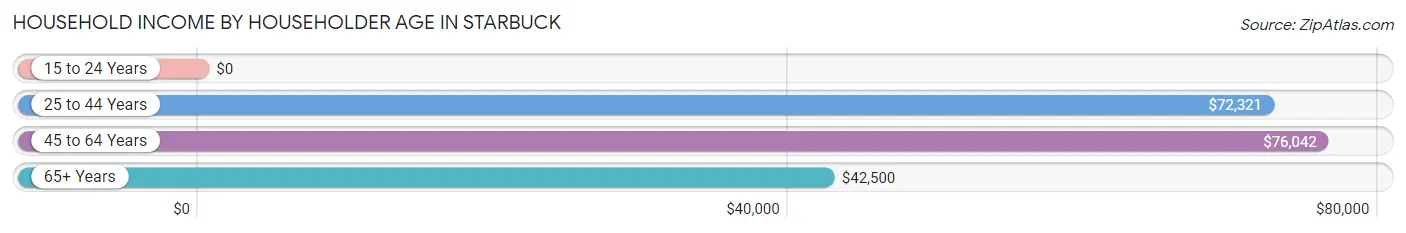
| Income Bracket | # Households | Median Income |
| 15 to 24 Years | 15 (2.7%) | $0 |
| 25 to 44 Years | 159 (28.6%) | $72,321 |
| 45 to 64 Years | 176 (31.7%) | $76,042 |
| 65+ Years | 206 (37.0%) | $42,500 |
| Total | 556 (100.0%) | $57,167 |
Poverty in Starbuck
Income Below Poverty by Sex and Age in Starbuck
With 17.2% poverty level for males and 14.1% for females among the residents of Starbuck, 12 to 14 year old males and 16 and 17 year old females are the most vulnerable to poverty, with 22 males (59.5%) and 7 females (58.3%) in their respective age groups living below the poverty level.
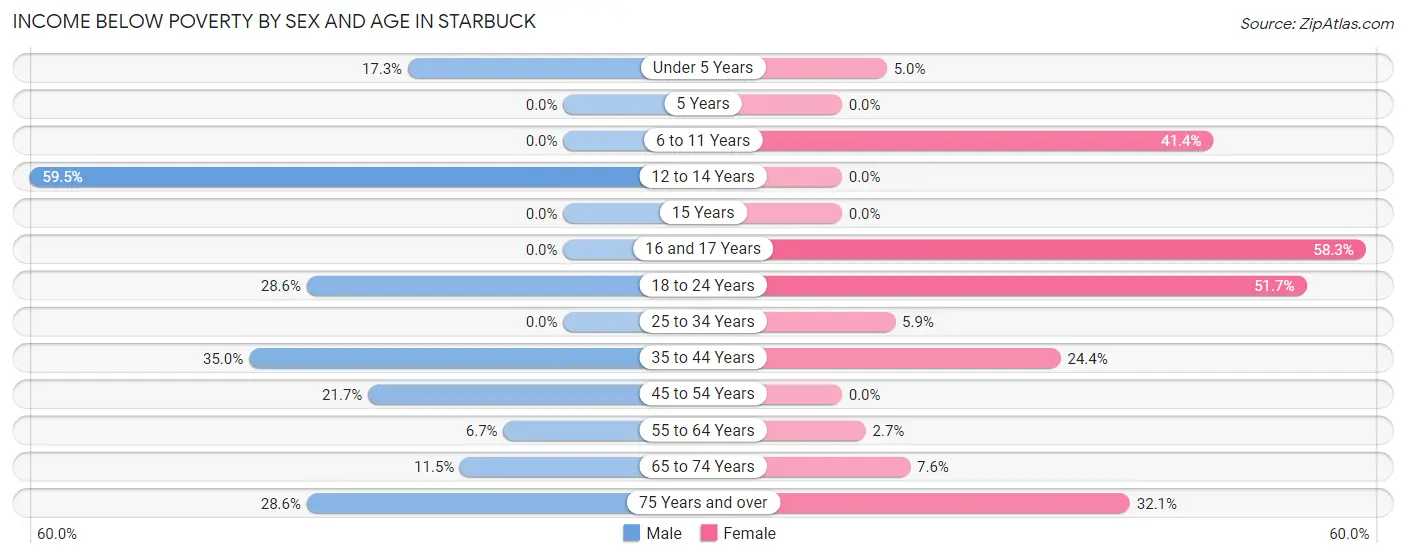
| Age Bracket | Male | Female |
| Under 5 Years | 9 (17.3%) | 2 (5.0%) |
| 5 Years | 0 (0.0%) | 0 (0.0%) |
| 6 to 11 Years | 0 (0.0%) | 12 (41.4%) |
| 12 to 14 Years | 22 (59.5%) | 0 (0.0%) |
| 15 Years | 0 (0.0%) | 0 (0.0%) |
| 16 and 17 Years | 0 (0.0%) | 7 (58.3%) |
| 18 to 24 Years | 4 (28.6%) | 15 (51.7%) |
| 25 to 34 Years | 0 (0.0%) | 6 (5.9%) |
| 35 to 44 Years | 21 (35.0%) | 19 (24.4%) |
| 45 to 54 Years | 10 (21.7%) | 0 (0.0%) |
| 55 to 64 Years | 6 (6.7%) | 3 (2.6%) |
| 65 to 74 Years | 10 (11.5%) | 7 (7.6%) |
| 75 Years and over | 18 (28.6%) | 17 (32.1%) |
| Total | 100 (17.2%) | 88 (14.1%) |
Income Above Poverty by Sex and Age in Starbuck
According to the poverty statistics in Starbuck, males aged 5 years and females aged 5 years are the age groups that are most secure financially, with 100.0% of males and 100.0% of females in these age groups living above the poverty line.
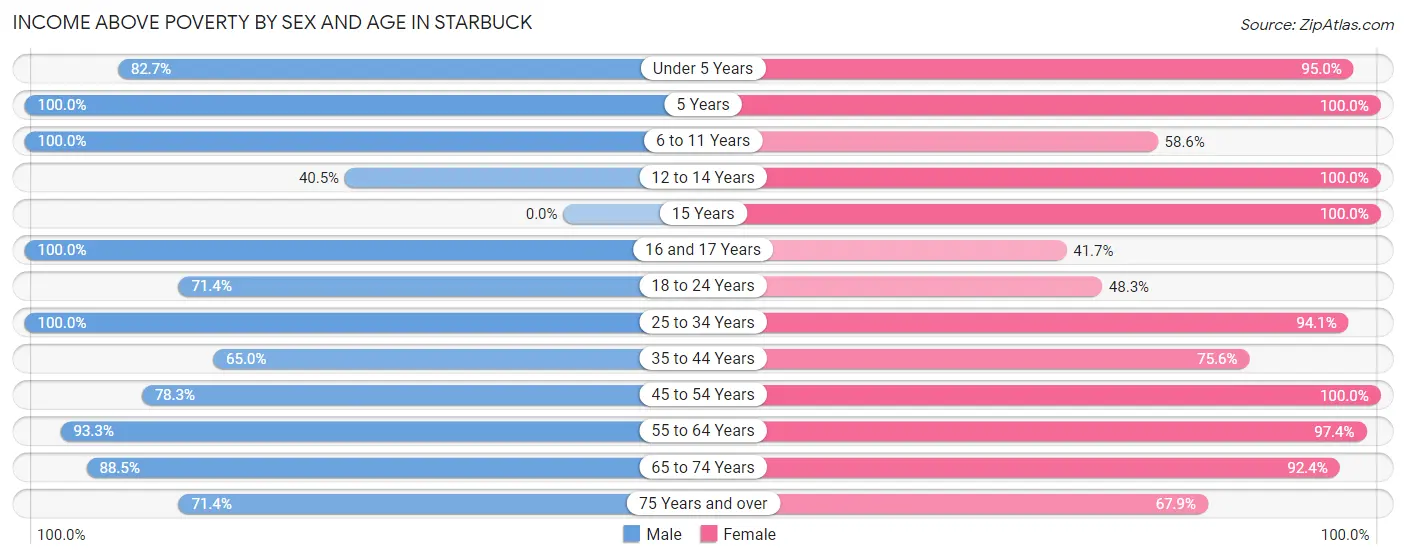
| Age Bracket | Male | Female |
| Under 5 Years | 43 (82.7%) | 38 (95.0%) |
| 5 Years | 4 (100.0%) | 5 (100.0%) |
| 6 to 11 Years | 23 (100.0%) | 17 (58.6%) |
| 12 to 14 Years | 15 (40.5%) | 11 (100.0%) |
| 15 Years | 0 (0.0%) | 17 (100.0%) |
| 16 and 17 Years | 20 (100.0%) | 5 (41.7%) |
| 18 to 24 Years | 10 (71.4%) | 14 (48.3%) |
| 25 to 34 Years | 87 (100.0%) | 95 (94.1%) |
| 35 to 44 Years | 39 (65.0%) | 59 (75.6%) |
| 45 to 54 Years | 36 (78.3%) | 46 (100.0%) |
| 55 to 64 Years | 84 (93.3%) | 110 (97.4%) |
| 65 to 74 Years | 77 (88.5%) | 85 (92.4%) |
| 75 Years and over | 45 (71.4%) | 36 (67.9%) |
| Total | 483 (82.9%) | 538 (85.9%) |
Income Below Poverty Among Married-Couple Families in Starbuck
The poverty statistics for married-couple families in Starbuck show that 1.2% or 3 of the total 247 families live below the poverty line. Families with no children have the highest poverty rate of 1.8%, comprising of 3 families. On the other hand, families with 1 or 2 children have the lowest poverty rate of 0.0%, which includes 0 families.
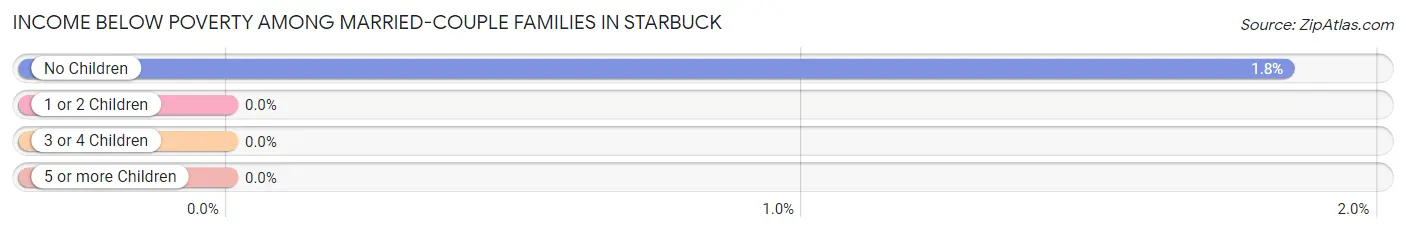
| Children | Above Poverty | Below Poverty |
| No Children | 160 (98.2%) | 3 (1.8%) |
| 1 or 2 Children | 70 (100.0%) | 0 (0.0%) |
| 3 or 4 Children | 14 (100.0%) | 0 (0.0%) |
| 5 or more Children | 0 (0.0%) | 0 (0.0%) |
| Total | 244 (98.8%) | 3 (1.2%) |
Income Below Poverty Among Single-Parent Households in Starbuck
According to the poverty data in Starbuck, 26.5% or 13 single-father households and 48.5% or 16 single-mother households are living below the poverty line. Among single-father households, those with 1 or 2 children have the highest poverty rate, with 13 households (34.2%) experiencing poverty. Likewise, among single-mother households, those with 1 or 2 children have the highest poverty rate, with 16 households (76.2%) falling below the poverty line.
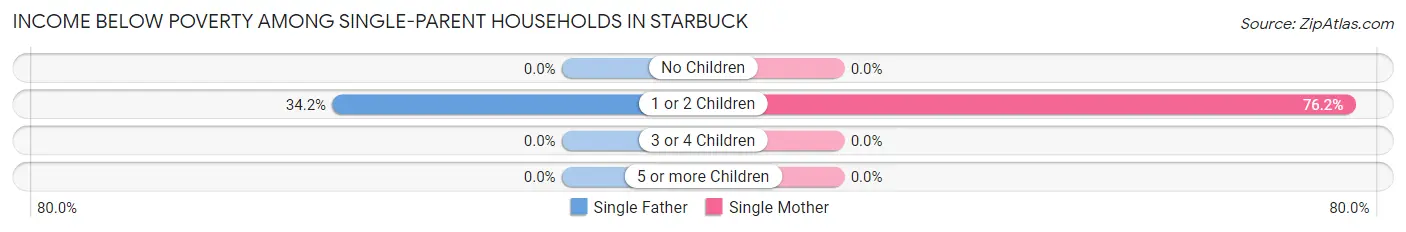
| Children | Single Father | Single Mother |
| No Children | 0 (0.0%) | 0 (0.0%) |
| 1 or 2 Children | 13 (34.2%) | 16 (76.2%) |
| 3 or 4 Children | 0 (0.0%) | 0 (0.0%) |
| 5 or more Children | 0 (0.0%) | 0 (0.0%) |
| Total | 13 (26.5%) | 16 (48.5%) |
Income Below Poverty Among Married-Couple vs Single-Parent Households in Starbuck
The poverty data for Starbuck shows that 3 of the married-couple family households (1.2%) and 29 of the single-parent households (35.4%) are living below the poverty level. Within the married-couple family households, those with no children have the highest poverty rate, with 3 households (1.8%) falling below the poverty line. Among the single-parent households, those with 1 or 2 children have the highest poverty rate, with 29 household (49.1%) living below poverty.
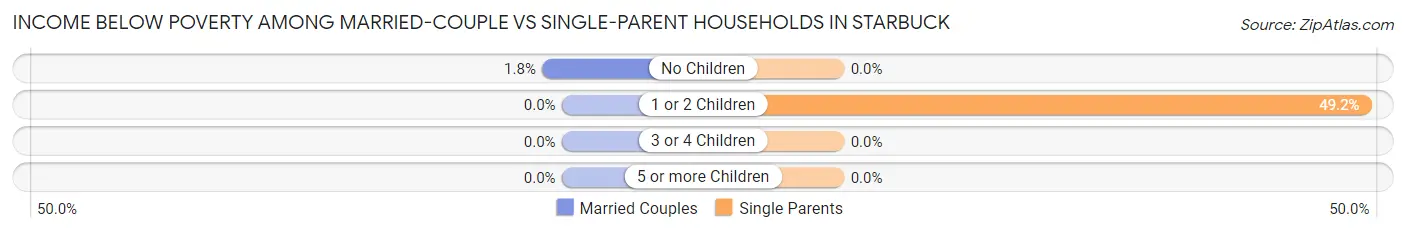
| Children | Married-Couple Families | Single-Parent Households |
| No Children | 3 (1.8%) | 0 (0.0%) |
| 1 or 2 Children | 0 (0.0%) | 29 (49.1%) |
| 3 or 4 Children | 0 (0.0%) | 0 (0.0%) |
| 5 or more Children | 0 (0.0%) | 0 (0.0%) |
| Total | 3 (1.2%) | 29 (35.4%) |
Race in Starbuck
The most populous races in Starbuck are White / Caucasian (1,158 | 91.2%), Hispanic or Latino (73 | 5.8%), and Two or more Races (64 | 5.0%).
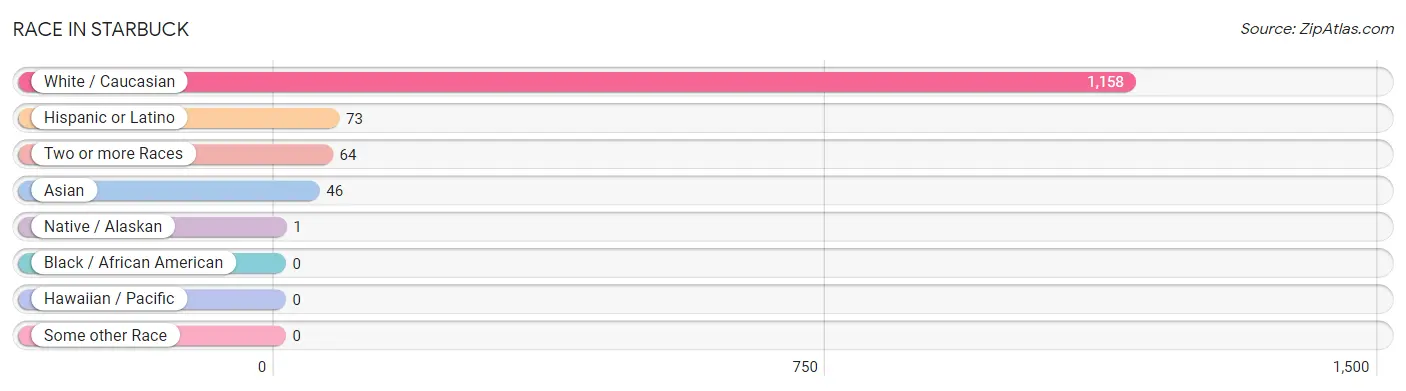
| Race | # Population | % Population |
| Asian | 46 | 3.6% |
| Black / African American | 0 | 0.0% |
| Hawaiian / Pacific | 0 | 0.0% |
| Hispanic or Latino | 73 | 5.8% |
| Native / Alaskan | 1 | 0.1% |
| White / Caucasian | 1,158 | 91.2% |
| Two or more Races | 64 | 5.0% |
| Some other Race | 0 | 0.0% |
| Total | 1,269 | 100.0% |
Ancestry in Starbuck
The most populous ancestries reported in Starbuck are Norwegian (425 | 33.5%), German (418 | 32.9%), Irish (86 | 6.8%), English (59 | 4.6%), and Puerto Rican (56 | 4.4%), together accounting for 82.3% of all Starbuck residents.
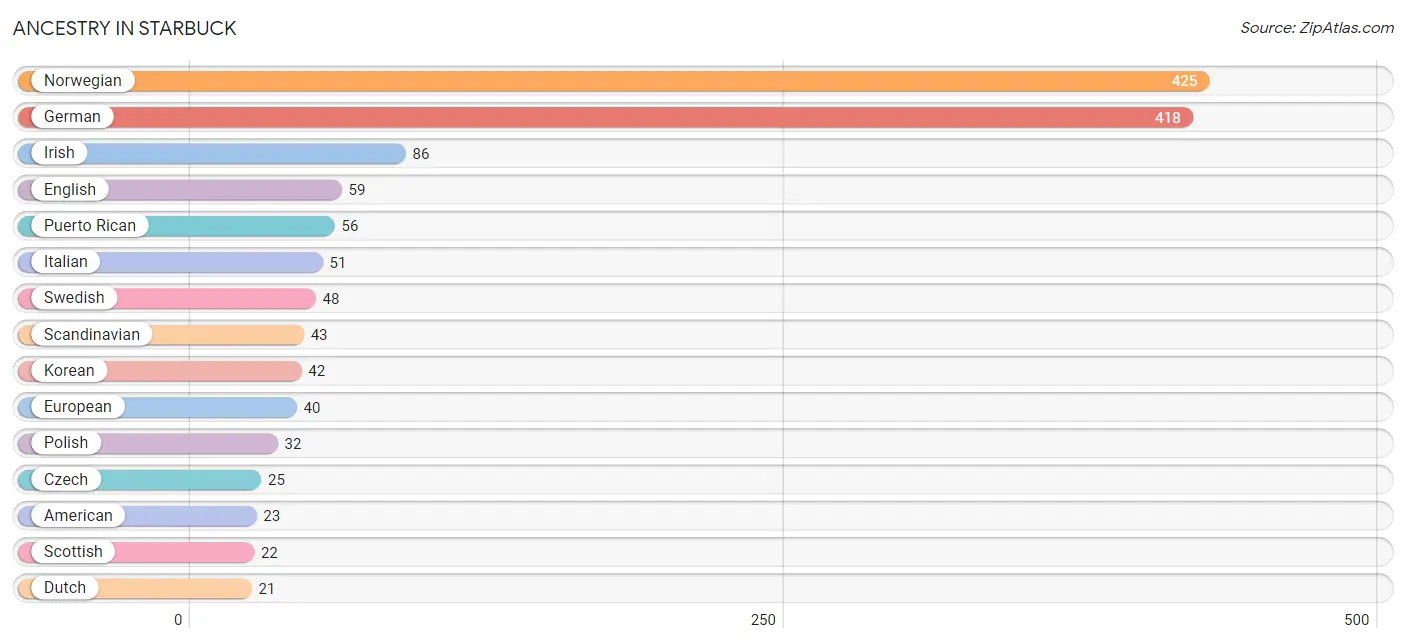
| Ancestry | # Population | % Population |
| American | 23 | 1.8% |
| Burmese | 4 | 0.3% |
| Chippewa | 7 | 0.5% |
| Czech | 25 | 2.0% |
| Danish | 13 | 1.0% |
| Dutch | 21 | 1.7% |
| English | 59 | 4.6% |
| European | 40 | 3.2% |
| Finnish | 17 | 1.3% |
| French | 15 | 1.2% |
| German | 418 | 32.9% |
| Irish | 86 | 6.8% |
| Italian | 51 | 4.0% |
| Korean | 42 | 3.3% |
| Latvian | 5 | 0.4% |
| Mexican | 17 | 1.3% |
| Norwegian | 425 | 33.5% |
| Polish | 32 | 2.5% |
| Puerto Rican | 56 | 4.4% |
| Russian | 3 | 0.2% |
| Scandinavian | 43 | 3.4% |
| Scotch-Irish | 11 | 0.9% |
| Scottish | 22 | 1.7% |
| Swedish | 48 | 3.8% |
| Swiss | 4 | 0.3% |
| Welsh | 16 | 1.3% | View All 26 Rows |
Immigrants in Starbuck
The most numerous immigrant groups reported in Starbuck came from Asia (46 | 3.6%), Philippines (42 | 3.3%), South Eastern Asia (42 | 3.3%), Eastern Asia (4 | 0.3%), and Korea (4 | 0.3%), together accounting for 10.9% of all Starbuck residents.
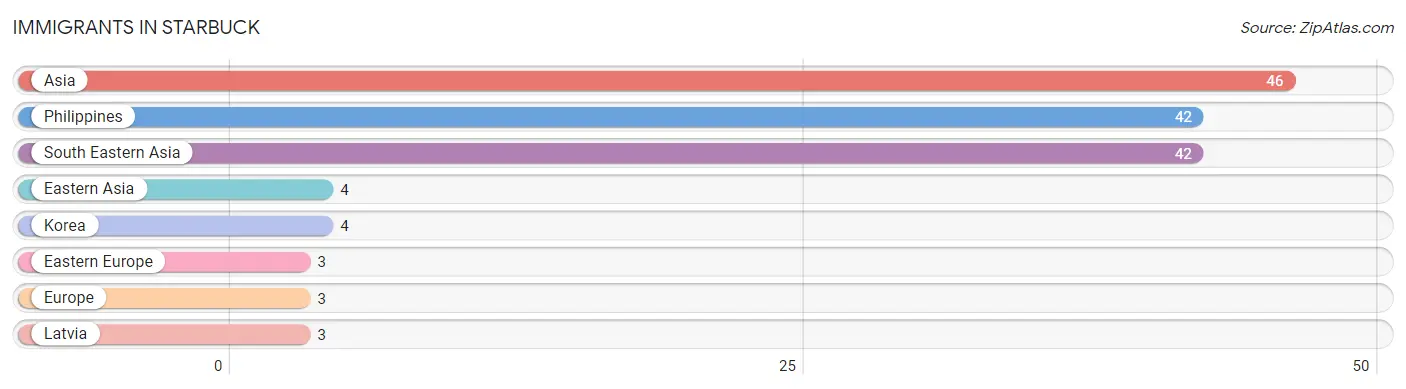
| Immigration Origin | # Population | % Population |
| Asia | 46 | 3.6% |
| Eastern Asia | 4 | 0.3% |
| Eastern Europe | 3 | 0.2% |
| Europe | 3 | 0.2% |
| Korea | 4 | 0.3% |
| Latvia | 3 | 0.2% |
| Philippines | 42 | 3.3% |
| South Eastern Asia | 42 | 3.3% | View All 8 Rows |
Sex and Age in Starbuck
Sex and Age in Starbuck
The most populous age groups in Starbuck are 55 to 59 Years (67 | 11.4%) for men and 85 Years and over (67 | 9.9%) for women.
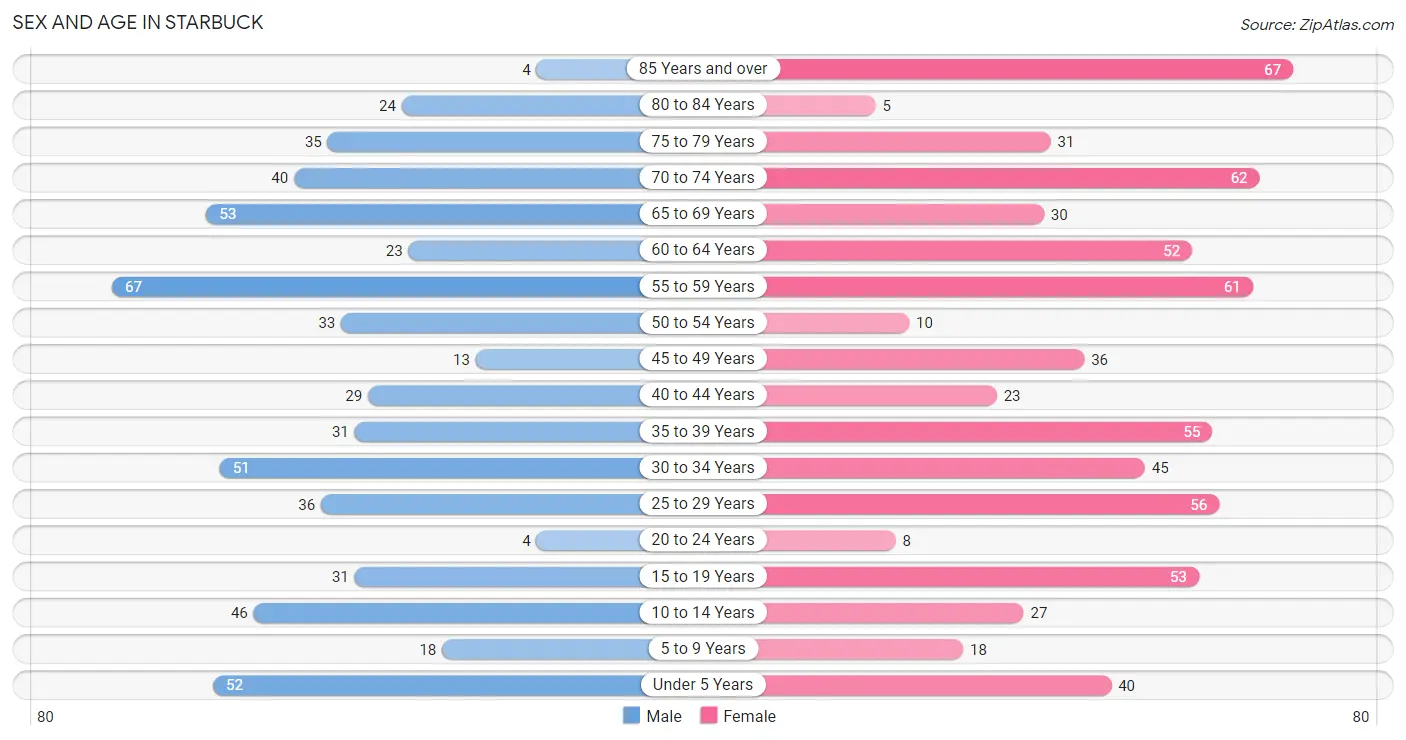
| Age Bracket | Male | Female |
| Under 5 Years | 52 (8.8%) | 40 (5.9%) |
| 5 to 9 Years | 18 (3.0%) | 18 (2.6%) |
| 10 to 14 Years | 46 (7.8%) | 27 (4.0%) |
| 15 to 19 Years | 31 (5.2%) | 53 (7.8%) |
| 20 to 24 Years | 4 (0.7%) | 8 (1.2%) |
| 25 to 29 Years | 36 (6.1%) | 56 (8.3%) |
| 30 to 34 Years | 51 (8.6%) | 45 (6.6%) |
| 35 to 39 Years | 31 (5.2%) | 55 (8.1%) |
| 40 to 44 Years | 29 (4.9%) | 23 (3.4%) |
| 45 to 49 Years | 13 (2.2%) | 36 (5.3%) |
| 50 to 54 Years | 33 (5.6%) | 10 (1.5%) |
| 55 to 59 Years | 67 (11.4%) | 61 (9.0%) |
| 60 to 64 Years | 23 (3.9%) | 52 (7.7%) |
| 65 to 69 Years | 53 (9.0%) | 30 (4.4%) |
| 70 to 74 Years | 40 (6.8%) | 62 (9.1%) |
| 75 to 79 Years | 35 (5.9%) | 31 (4.6%) |
| 80 to 84 Years | 24 (4.1%) | 5 (0.7%) |
| 85 Years and over | 4 (0.7%) | 67 (9.9%) |
| Total | 590 (100.0%) | 679 (100.0%) |
Families and Households in Starbuck
Median Family Size in Starbuck
The median family size in Starbuck is 2.68 persons per family, with married-couple families (247 | 75.1%) accounting for the largest median family size of 2.71 persons per family. On the other hand, single male/father families (49 | 14.9%) represent the smallest median family size with 2.57 persons per family.
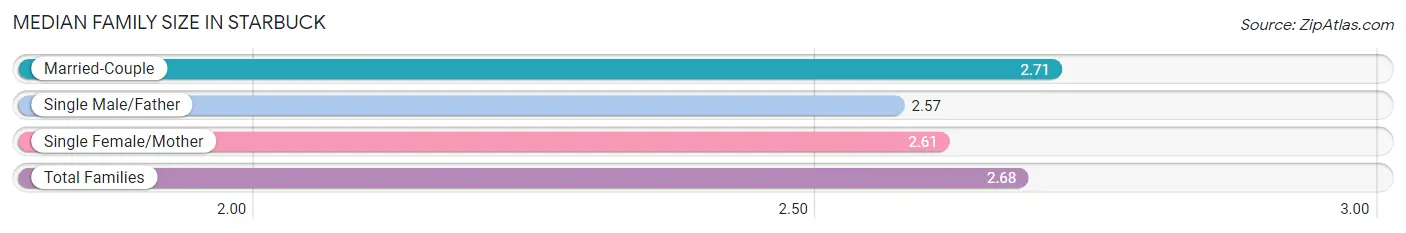
| Family Type | # Families | Family Size |
| Married-Couple | 247 (75.1%) | 2.71 |
| Single Male/Father | 49 (14.9%) | 2.57 |
| Single Female/Mother | 33 (10.0%) | 2.61 |
| Total Families | 329 (100.0%) | 2.68 |
Median Household Size in Starbuck
The median household size in Starbuck is 2.15 persons per household, with single male/father households (49 | 8.8%) accounting for the largest median household size of 3.22 persons per household. non-family households (227 | 40.8%) represent the smallest median household size with 1.22 persons per household.
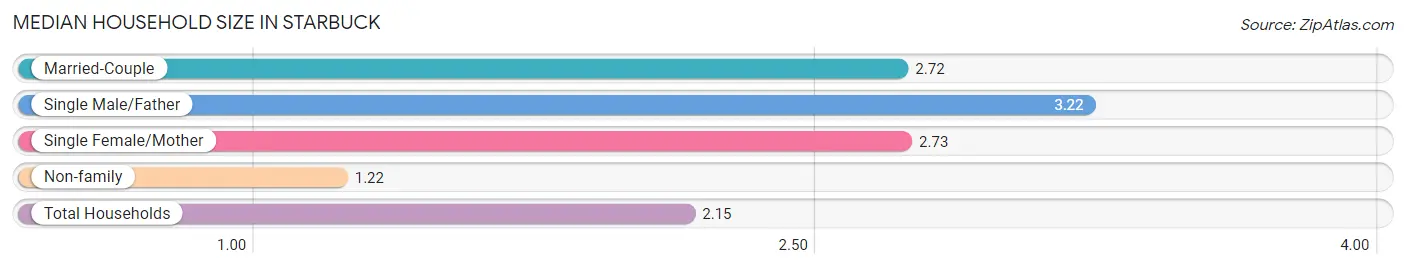
| Household Type | # Households | Household Size |
| Married-Couple | 247 (44.4%) | 2.72 |
| Single Male/Father | 49 (8.8%) | 3.22 |
| Single Female/Mother | 33 (5.9%) | 2.73 |
| Non-family | 227 (40.8%) | 1.22 |
| Total Households | 556 (100.0%) | 2.15 |
Household Size by Marriage Status in Starbuck
Out of a total of 556 households in Starbuck, 329 (59.2%) are family households, while 227 (40.8%) are nonfamily households. The most numerous type of family households are 2-person households, comprising 164, and the most common type of nonfamily households are 1-person households, comprising 183.
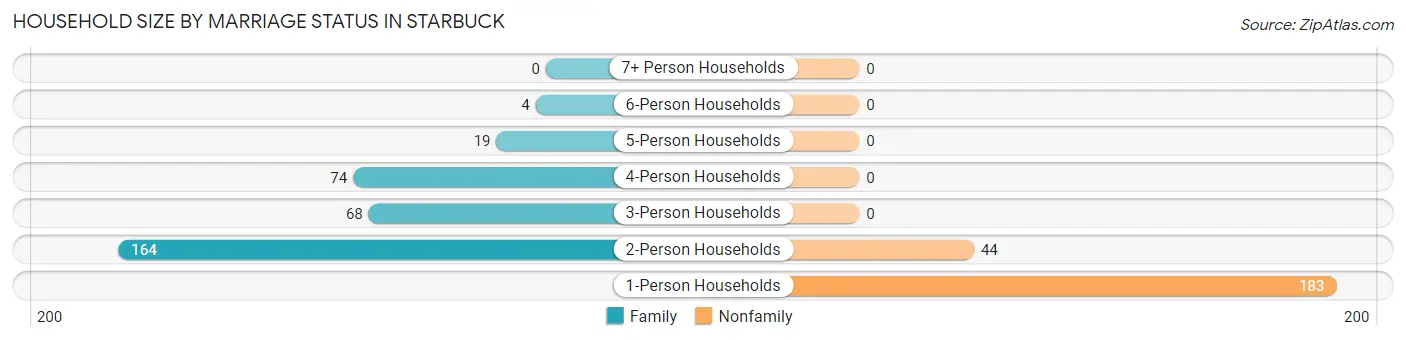
| Household Size | Family Households | Nonfamily Households |
| 1-Person Households | - | 183 (32.9%) |
| 2-Person Households | 164 (29.5%) | 44 (7.9%) |
| 3-Person Households | 68 (12.2%) | 0 (0.0%) |
| 4-Person Households | 74 (13.3%) | 0 (0.0%) |
| 5-Person Households | 19 (3.4%) | 0 (0.0%) |
| 6-Person Households | 4 (0.7%) | 0 (0.0%) |
| 7+ Person Households | 0 (0.0%) | 0 (0.0%) |
| Total | 329 (59.2%) | 227 (40.8%) |
Female Fertility in Starbuck
Fertility by Age in Starbuck
Average fertility rate in Starbuck is 120.0 births per 1,000 women. Women in the age bracket of 20 to 34 years have the highest fertility rate with 303.0 births per 1,000 women. Women in the age bracket of 20 to 34 years acount for 100.0% of all women with births.
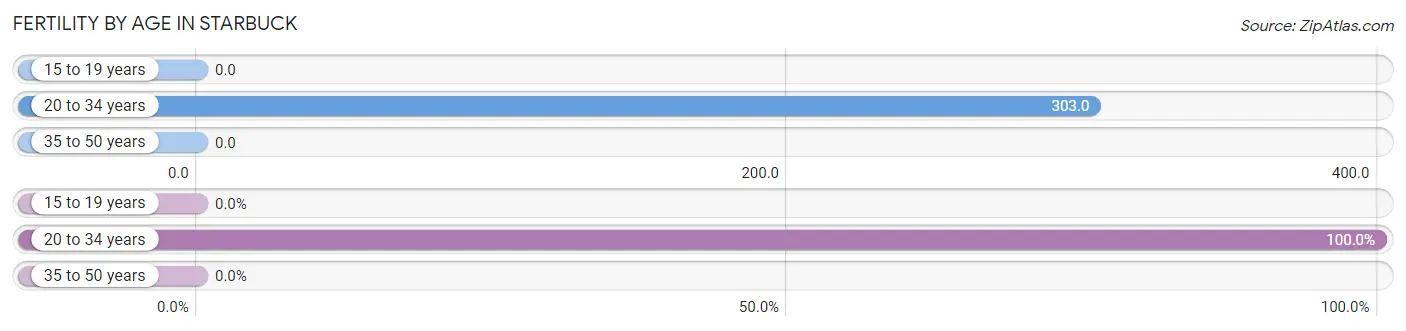
| Age Bracket | Women with Births | Births / 1,000 Women |
| 15 to 19 years | 0 (0.0%) | 0.0 |
| 20 to 34 years | 33 (100.0%) | 303.0 |
| 35 to 50 years | 0 (0.0%) | 0.0 |
| Total | 33 (100.0%) | 120.0 |
Fertility by Age by Marriage Status in Starbuck
54.5% of women with births (33) in Starbuck are married. The highest percentage of unmarried women with births falls into 20 to 34 years age bracket with 45.5% of them unmarried at the time of birth, while the lowest percentage of unmarried women with births belong to 20 to 34 years age bracket with 45.5% of them unmarried.
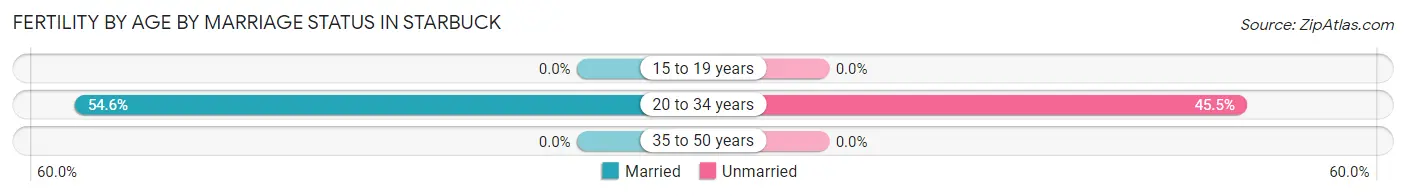
| Age Bracket | Married | Unmarried |
| 15 to 19 years | 0 (0.0%) | 0 (0.0%) |
| 20 to 34 years | 18 (54.5%) | 15 (45.5%) |
| 35 to 50 years | 0 (0.0%) | 0 (0.0%) |
| Total | 18 (54.5%) | 15 (45.5%) |
Fertility by Education in Starbuck
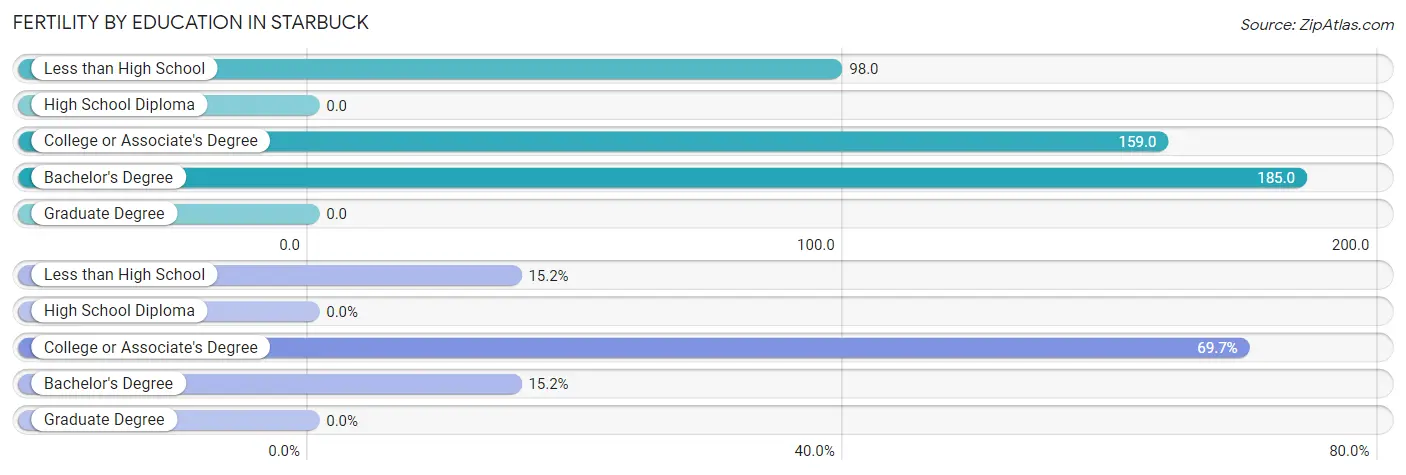
| Educational Attainment | Women with Births | Births / 1,000 Women |
| Less than High School | 5 (15.1%) | 98.0 |
| High School Diploma | 0 (0.0%) | 0.0 |
| College or Associate's Degree | 23 (69.7%) | 159.0 |
| Bachelor's Degree | 5 (15.1%) | 185.0 |
| Graduate Degree | 0 (0.0%) | 0.0 |
| Total | 33 (100.0%) | 120.0 |
Fertility by Education by Marriage Status in Starbuck
45.5% of women with births in Starbuck are unmarried. Women with the educational attainment of bachelor's degree are most likely to be married with 100.0% of them married at childbirth, while women with the educational attainment of less than high school are least likely to be married with 100.0% of them unmarried at childbirth.
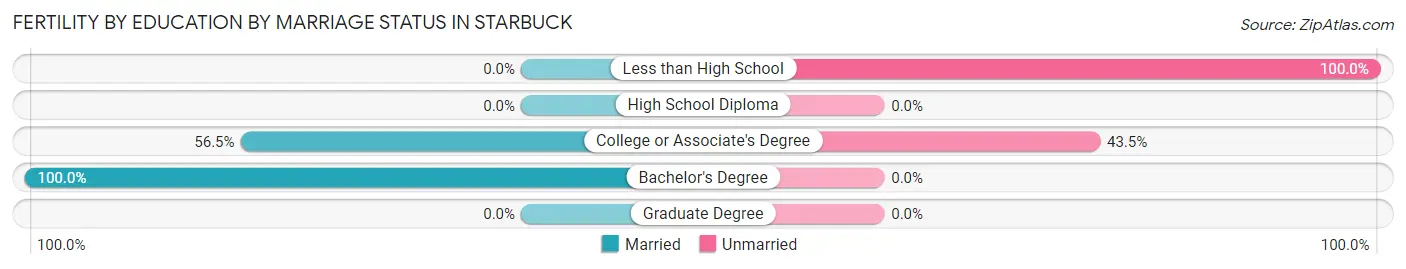
| Educational Attainment | Married | Unmarried |
| Less than High School | 0 (0.0%) | 5 (100.0%) |
| High School Diploma | 0 (0.0%) | 0 (0.0%) |
| College or Associate's Degree | 13 (56.5%) | 10 (43.5%) |
| Bachelor's Degree | 5 (100.0%) | 0 (0.0%) |
| Graduate Degree | 0 (0.0%) | 0 (0.0%) |
| Total | 18 (54.5%) | 15 (45.5%) |
Employment Characteristics in Starbuck
Employment by Class of Employer in Starbuck
Among the 662 employed individuals in Starbuck, private company employees (424 | 64.0%), not-for-profit organizations (99 | 14.9%), and local government employees (96 | 14.5%) make up the most common classes of employment.
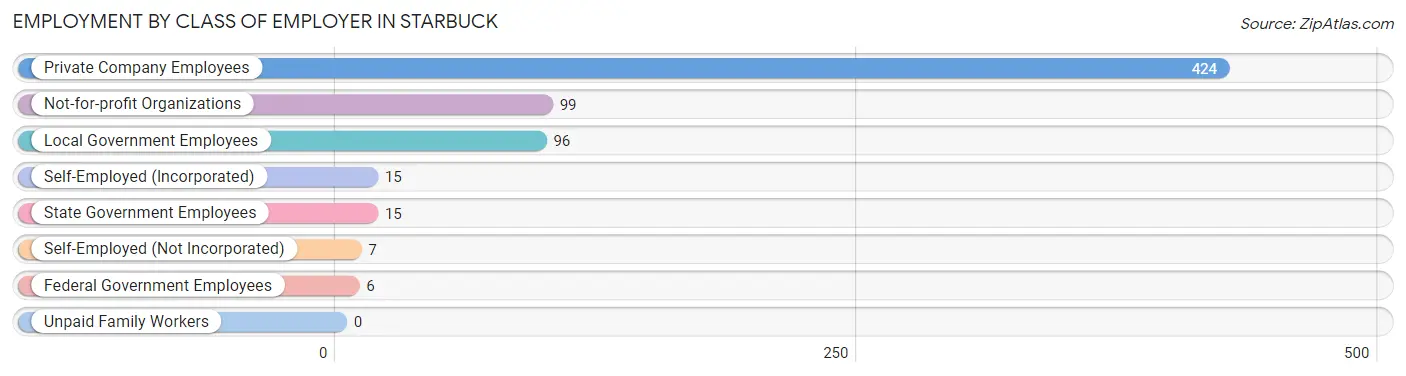
| Employer Class | # Employees | % Employees |
| Private Company Employees | 424 | 64.0% |
| Self-Employed (Incorporated) | 15 | 2.3% |
| Self-Employed (Not Incorporated) | 7 | 1.1% |
| Not-for-profit Organizations | 99 | 14.9% |
| Local Government Employees | 96 | 14.5% |
| State Government Employees | 15 | 2.3% |
| Federal Government Employees | 6 | 0.9% |
| Unpaid Family Workers | 0 | 0.0% |
| Total | 662 | 100.0% |
Employment Status by Age in Starbuck
According to the labor force statistics for Starbuck, out of the total population over 16 years of age (1,051), 64.0% or 673 individuals are in the labor force, with 0.6% or 4 of them unemployed. The age group with the highest labor force participation rate is 25 to 29 years, with 94.6% or 87 individuals in the labor force. Within the labor force, the 45 to 54 years age range has the highest percentage of unemployed individuals, with 3.8% or 3 of them being unemployed.
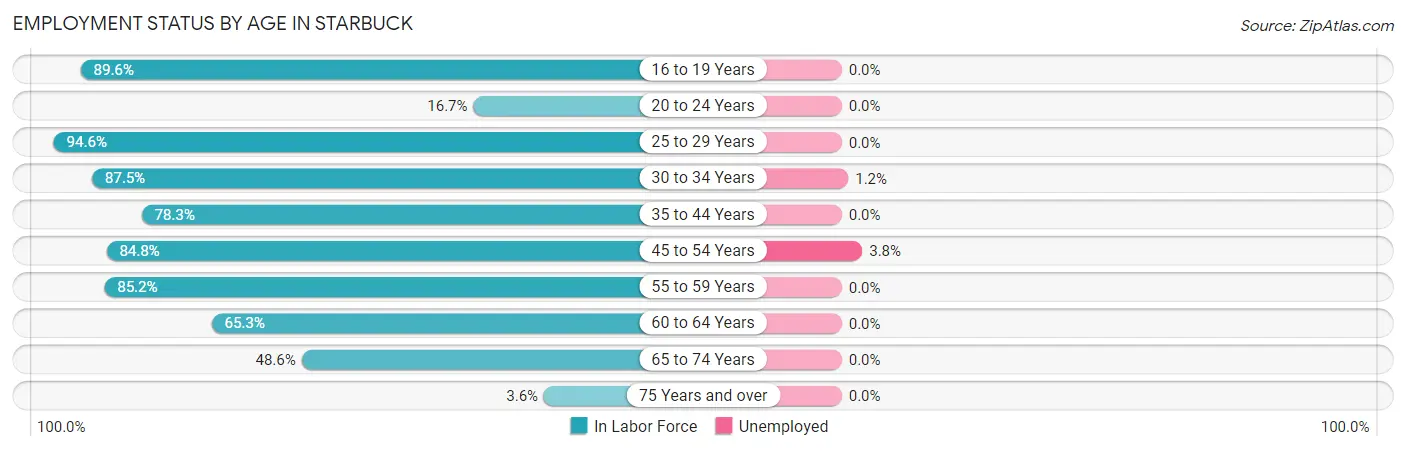
| Age Bracket | In Labor Force | Unemployed |
| 16 to 19 Years | 60 (89.6%) | 0 (0.0%) |
| 20 to 24 Years | 2 (16.7%) | 0 (0.0%) |
| 25 to 29 Years | 87 (94.6%) | 0 (0.0%) |
| 30 to 34 Years | 84 (87.5%) | 1 (1.2%) |
| 35 to 44 Years | 108 (78.3%) | 0 (0.0%) |
| 45 to 54 Years | 78 (84.8%) | 3 (3.8%) |
| 55 to 59 Years | 109 (85.2%) | 0 (0.0%) |
| 60 to 64 Years | 49 (65.3%) | 0 (0.0%) |
| 65 to 74 Years | 90 (48.6%) | 0 (0.0%) |
| 75 Years and over | 6 (3.6%) | 0 (0.0%) |
| Total | 673 (64.0%) | 4 (0.6%) |
Employment Status by Educational Attainment in Starbuck
According to labor force statistics for Starbuck, 82.9% of individuals (515) out of the total population between 25 and 64 years of age (621) are in the labor force, with 0.8% or 4 of them being unemployed. The group with the highest labor force participation rate are those with the educational attainment of bachelor's degree or higher, with 93.9% or 107 individuals in the labor force. Within the labor force, individuals with college / associate degree education have the highest percentage of unemployment, with 1.4% or 4 of them being unemployed.
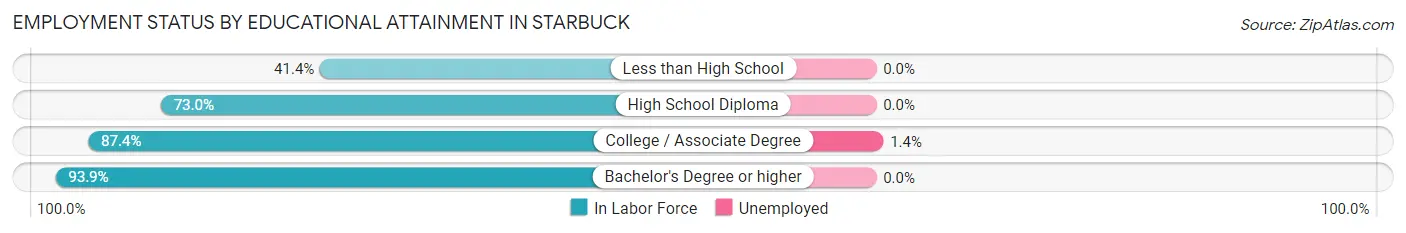
| Educational Attainment | In Labor Force | Unemployed |
| Less than High School | 12 (41.4%) | 0 (0.0%) |
| High School Diploma | 111 (73.0%) | 0 (0.0%) |
| College / Associate Degree | 285 (87.4%) | 5 (1.4%) |
| Bachelor's Degree or higher | 107 (93.9%) | 0 (0.0%) |
| Total | 515 (82.9%) | 5 (0.8%) |
Employment Occupations by Sex in Starbuck
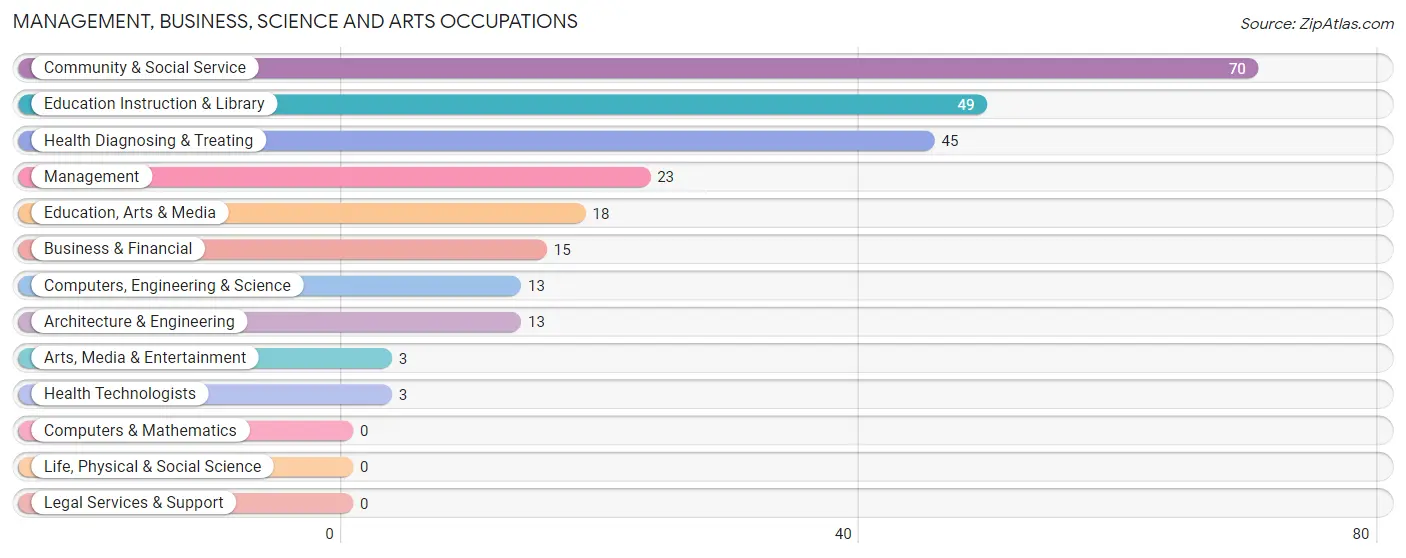
Management, Business, Science and Arts Occupations
The most common Management, Business, Science and Arts occupations in Starbuck are Community & Social Service (70 | 10.6%), Education Instruction & Library (49 | 7.4%), Health Diagnosing & Treating (45 | 6.8%), Management (23 | 3.5%), and Education, Arts & Media (18 | 2.7%).
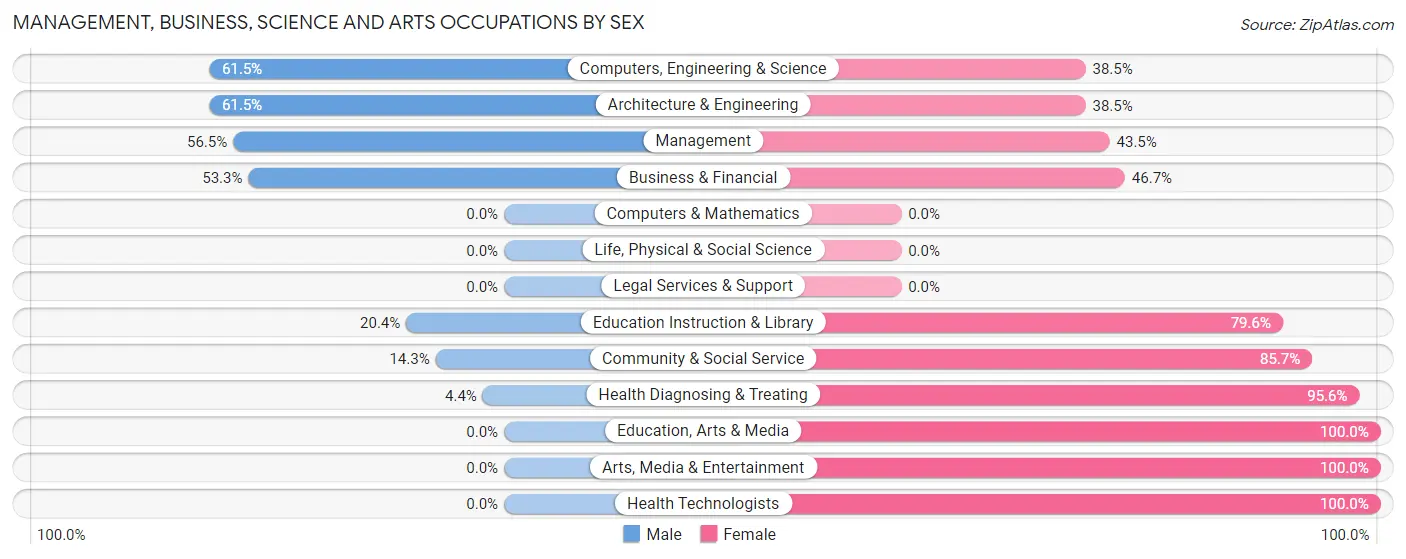
Management, Business, Science and Arts Occupations by Sex
Within the Management, Business, Science and Arts occupations in Starbuck, the most male-oriented occupations are Computers, Engineering & Science (61.5%), Architecture & Engineering (61.5%), and Management (56.5%), while the most female-oriented occupations are Education, Arts & Media (100.0%), Arts, Media & Entertainment (100.0%), and Health Technologists (100.0%).
| Occupation | Male | Female |
| Management | 13 (56.5%) | 10 (43.5%) |
| Business & Financial | 8 (53.3%) | 7 (46.7%) |
| Computers, Engineering & Science | 8 (61.5%) | 5 (38.5%) |
| Computers & Mathematics | 0 (0.0%) | 0 (0.0%) |
| Architecture & Engineering | 8 (61.5%) | 5 (38.5%) |
| Life, Physical & Social Science | 0 (0.0%) | 0 (0.0%) |
| Community & Social Service | 10 (14.3%) | 60 (85.7%) |
| Education, Arts & Media | 0 (0.0%) | 18 (100.0%) |
| Legal Services & Support | 0 (0.0%) | 0 (0.0%) |
| Education Instruction & Library | 10 (20.4%) | 39 (79.6%) |
| Arts, Media & Entertainment | 0 (0.0%) | 3 (100.0%) |
| Health Diagnosing & Treating | 2 (4.4%) | 43 (95.6%) |
| Health Technologists | 0 (0.0%) | 3 (100.0%) |
| Total (Category) | 41 (24.7%) | 125 (75.3%) |
| Total (Overall) | 296 (44.7%) | 367 (55.3%) |
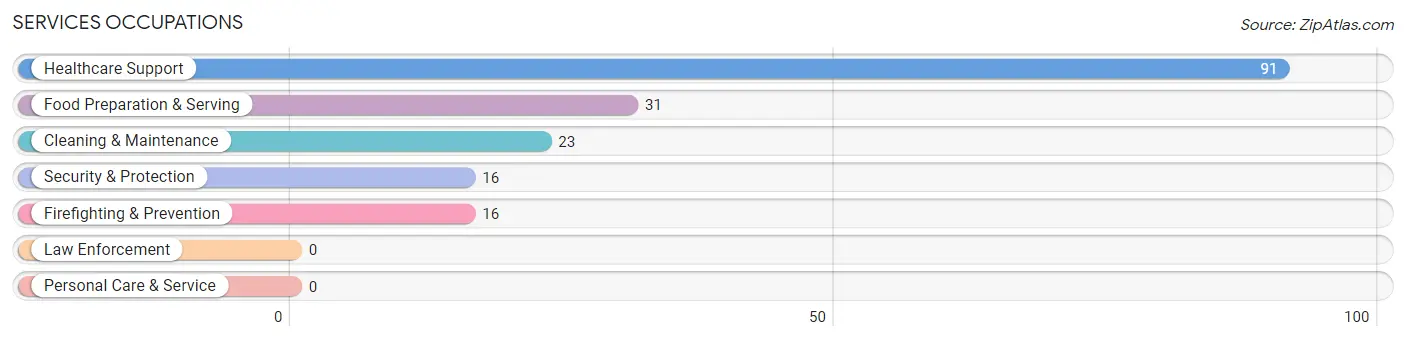
Services Occupations
The most common Services occupations in Starbuck are Healthcare Support (91 | 13.7%), Food Preparation & Serving (31 | 4.7%), Cleaning & Maintenance (23 | 3.5%), Security & Protection (16 | 2.4%), and Firefighting & Prevention (16 | 2.4%).
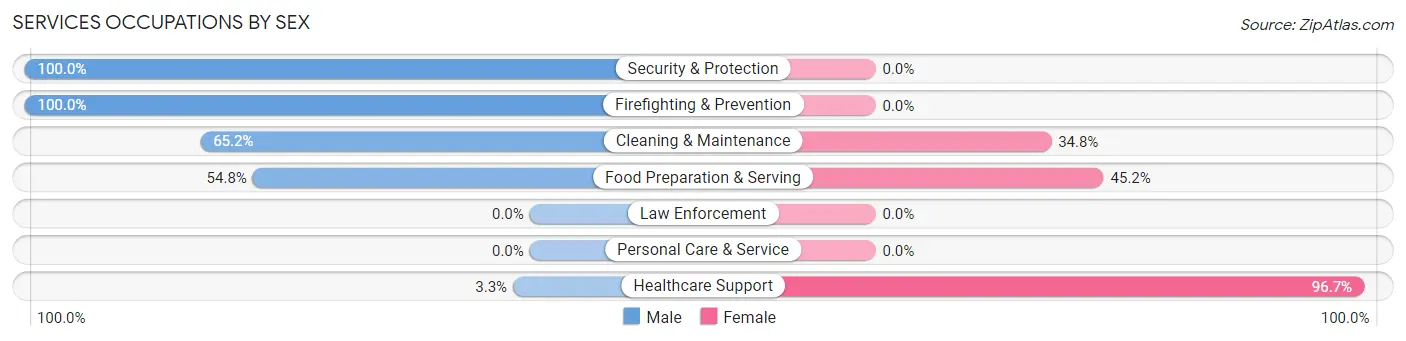
Services Occupations by Sex
Within the Services occupations in Starbuck, the most male-oriented occupations are Security & Protection (100.0%), Firefighting & Prevention (100.0%), and Cleaning & Maintenance (65.2%), while the most female-oriented occupations are Healthcare Support (96.7%), Food Preparation & Serving (45.2%), and Cleaning & Maintenance (34.8%).
| Occupation | Male | Female |
| Healthcare Support | 3 (3.3%) | 88 (96.7%) |
| Security & Protection | 16 (100.0%) | 0 (0.0%) |
| Firefighting & Prevention | 16 (100.0%) | 0 (0.0%) |
| Law Enforcement | 0 (0.0%) | 0 (0.0%) |
| Food Preparation & Serving | 17 (54.8%) | 14 (45.2%) |
| Cleaning & Maintenance | 15 (65.2%) | 8 (34.8%) |
| Personal Care & Service | 0 (0.0%) | 0 (0.0%) |
| Total (Category) | 51 (31.7%) | 110 (68.3%) |
| Total (Overall) | 296 (44.7%) | 367 (55.3%) |
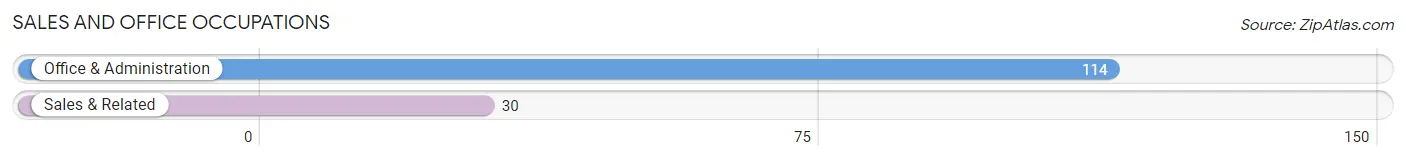
Sales and Office Occupations
The most common Sales and Office occupations in Starbuck are Office & Administration (114 | 17.2%), and Sales & Related (30 | 4.5%).
Sales and Office Occupations by Sex
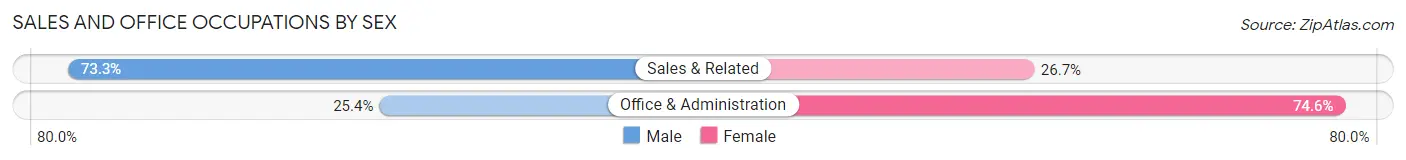
| Occupation | Male | Female |
| Sales & Related | 22 (73.3%) | 8 (26.7%) |
| Office & Administration | 29 (25.4%) | 85 (74.6%) |
| Total (Category) | 51 (35.4%) | 93 (64.6%) |
| Total (Overall) | 296 (44.7%) | 367 (55.3%) |
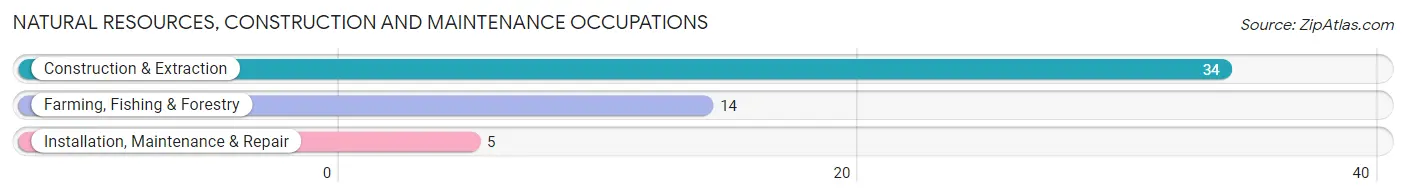
Natural Resources, Construction and Maintenance Occupations
The most common Natural Resources, Construction and Maintenance occupations in Starbuck are Construction & Extraction (34 | 5.1%), Farming, Fishing & Forestry (14 | 2.1%), and Installation, Maintenance & Repair (5 | 0.7%).
Natural Resources, Construction and Maintenance Occupations by Sex
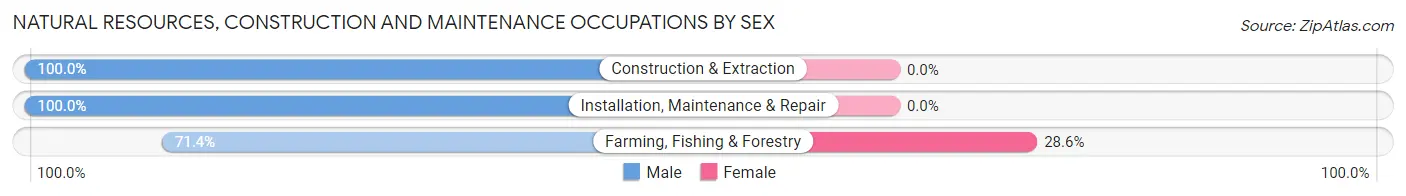
| Occupation | Male | Female |
| Farming, Fishing & Forestry | 10 (71.4%) | 4 (28.6%) |
| Construction & Extraction | 34 (100.0%) | 0 (0.0%) |
| Installation, Maintenance & Repair | 5 (100.0%) | 0 (0.0%) |
| Total (Category) | 49 (92.4%) | 4 (7.5%) |
| Total (Overall) | 296 (44.7%) | 367 (55.3%) |
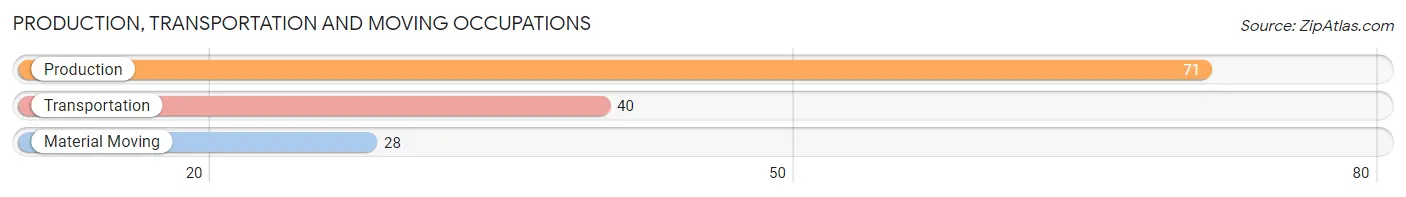
Production, Transportation and Moving Occupations
The most common Production, Transportation and Moving occupations in Starbuck are Production (71 | 10.7%), Transportation (40 | 6.0%), and Material Moving (28 | 4.2%).
Production, Transportation and Moving Occupations by Sex
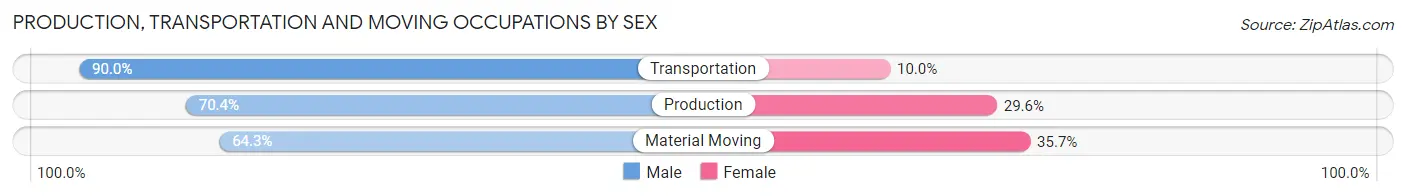
| Occupation | Male | Female |
| Production | 50 (70.4%) | 21 (29.6%) |
| Transportation | 36 (90.0%) | 4 (10.0%) |
| Material Moving | 18 (64.3%) | 10 (35.7%) |
| Total (Category) | 104 (74.8%) | 35 (25.2%) |
| Total (Overall) | 296 (44.7%) | 367 (55.3%) |
Employment Industries by Sex in Starbuck
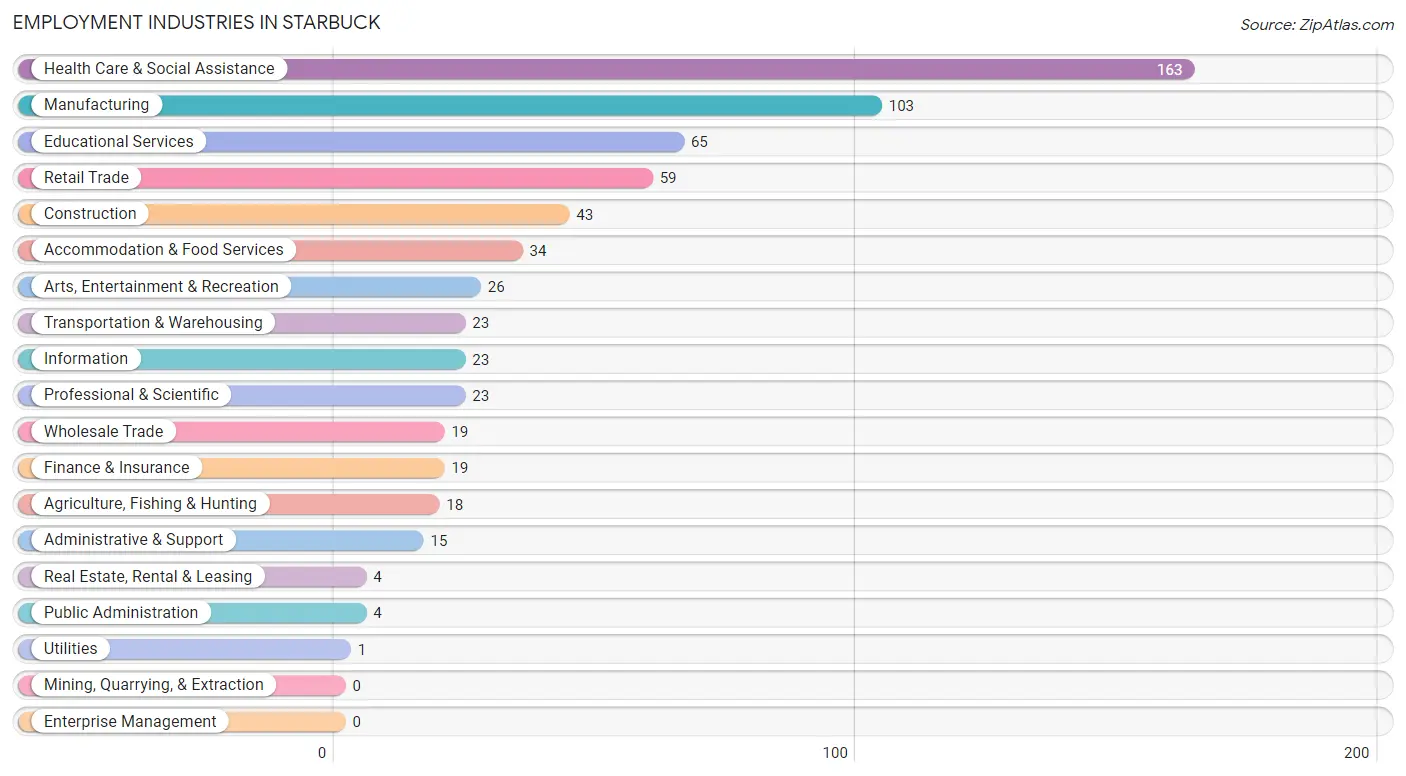
Employment Industries in Starbuck
The major employment industries in Starbuck include Health Care & Social Assistance (163 | 24.6%), Manufacturing (103 | 15.5%), Educational Services (65 | 9.8%), Retail Trade (59 | 8.9%), and Construction (43 | 6.5%).
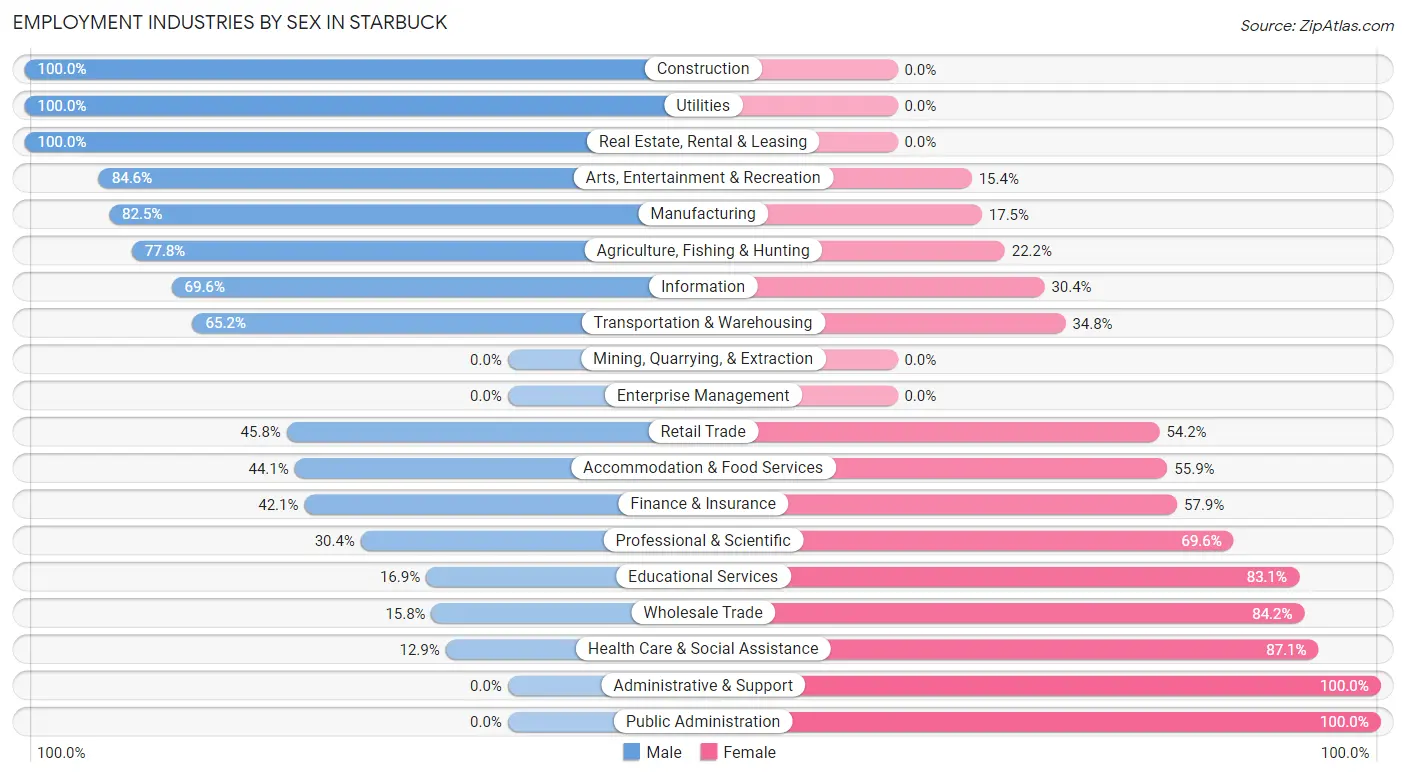
Employment Industries by Sex in Starbuck
The Starbuck industries that see more men than women are Construction (100.0%), Utilities (100.0%), and Real Estate, Rental & Leasing (100.0%), whereas the industries that tend to have a higher number of women are Administrative & Support (100.0%), Public Administration (100.0%), and Health Care & Social Assistance (87.1%).
| Industry | Male | Female |
| Agriculture, Fishing & Hunting | 14 (77.8%) | 4 (22.2%) |
| Mining, Quarrying, & Extraction | 0 (0.0%) | 0 (0.0%) |
| Construction | 43 (100.0%) | 0 (0.0%) |
| Manufacturing | 85 (82.5%) | 18 (17.5%) |
| Wholesale Trade | 3 (15.8%) | 16 (84.2%) |
| Retail Trade | 27 (45.8%) | 32 (54.2%) |
| Transportation & Warehousing | 15 (65.2%) | 8 (34.8%) |
| Utilities | 1 (100.0%) | 0 (0.0%) |
| Information | 16 (69.6%) | 7 (30.4%) |
| Finance & Insurance | 8 (42.1%) | 11 (57.9%) |
| Real Estate, Rental & Leasing | 4 (100.0%) | 0 (0.0%) |
| Professional & Scientific | 7 (30.4%) | 16 (69.6%) |
| Enterprise Management | 0 (0.0%) | 0 (0.0%) |
| Administrative & Support | 0 (0.0%) | 15 (100.0%) |
| Educational Services | 11 (16.9%) | 54 (83.1%) |
| Health Care & Social Assistance | 21 (12.9%) | 142 (87.1%) |
| Arts, Entertainment & Recreation | 22 (84.6%) | 4 (15.4%) |
| Accommodation & Food Services | 15 (44.1%) | 19 (55.9%) |
| Public Administration | 0 (0.0%) | 4 (100.0%) |
| Total | 296 (44.7%) | 367 (55.3%) |
Education in Starbuck
School Enrollment in Starbuck
The most common levels of schooling among the 197 students in Starbuck are middle school (69 | 35.0%), high school (64 | 32.5%), and elementary school (31 | 15.7%).
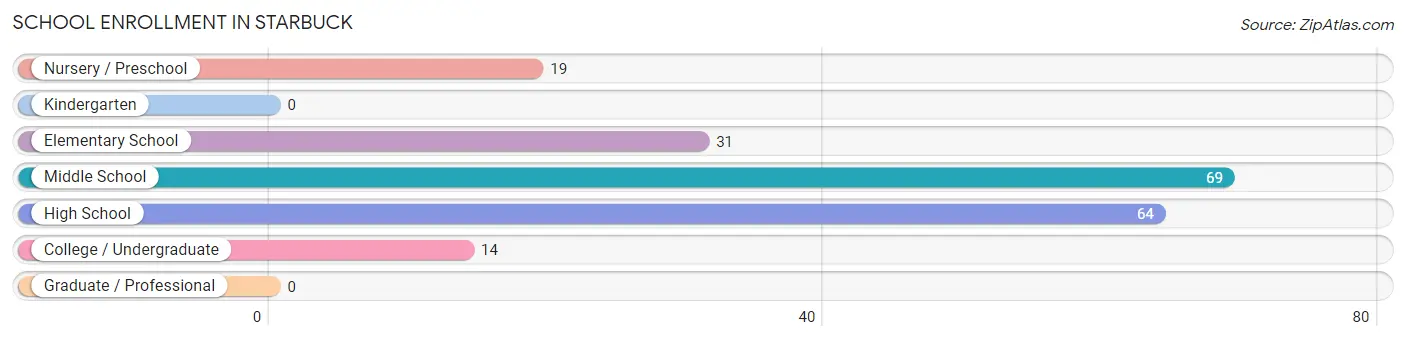
| School Level | # Students | % Students |
| Nursery / Preschool | 19 | 9.6% |
| Kindergarten | 0 | 0.0% |
| Elementary School | 31 | 15.7% |
| Middle School | 69 | 35.0% |
| High School | 64 | 32.5% |
| College / Undergraduate | 14 | 7.1% |
| Graduate / Professional | 0 | 0.0% |
| Total | 197 | 100.0% |
School Enrollment by Age by Funding Source in Starbuck
Out of a total of 197 students who are enrolled in schools in Starbuck, 27 (13.7%) attend a private institution, while the remaining 170 (86.3%) are enrolled in public schools. The age group of 25 to 34 year olds has the highest likelihood of being enrolled in private schools, with 3 (50.0% in the age bracket) enrolled. Conversely, the age group of 3 to 4 year olds has the lowest likelihood of being enrolled in a private school, with 10 (100.0% in the age bracket) attending a public institution.
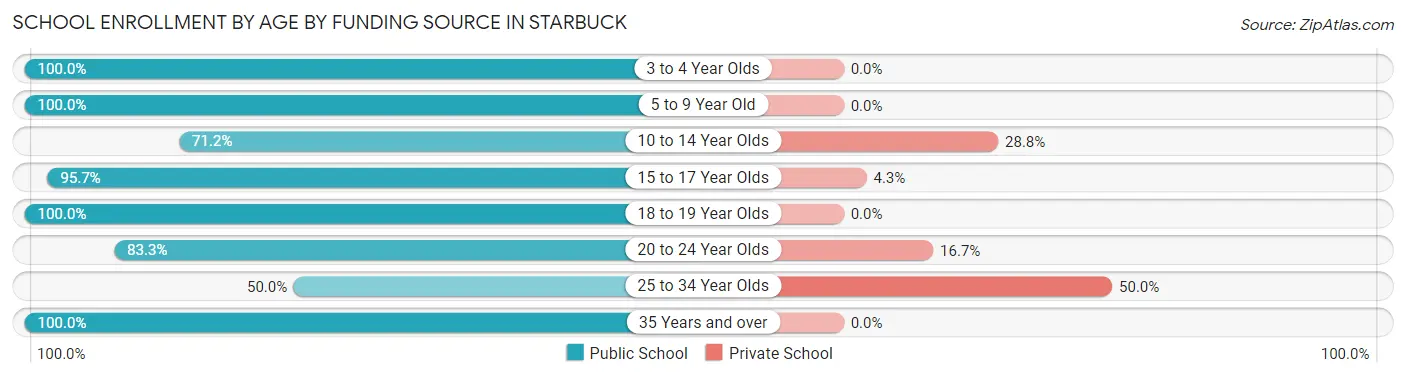
| Age Bracket | Public School | Private School |
| 3 to 4 Year Olds | 10 (100.0%) | 0 (0.0%) |
| 5 to 9 Year Old | 36 (100.0%) | 0 (0.0%) |
| 10 to 14 Year Olds | 52 (71.2%) | 21 (28.8%) |
| 15 to 17 Year Olds | 45 (95.7%) | 2 (4.3%) |
| 18 to 19 Year Olds | 12 (100.0%) | 0 (0.0%) |
| 20 to 24 Year Olds | 5 (83.3%) | 1 (16.7%) |
| 25 to 34 Year Olds | 3 (50.0%) | 3 (50.0%) |
| 35 Years and over | 7 (100.0%) | 0 (0.0%) |
| Total | 170 (86.3%) | 27 (13.7%) |
Educational Attainment by Field of Study in Starbuck
Education (70 | 42.2%), business (58 | 34.9%), computers & mathematics (16 | 9.6%), engineering (13 | 7.8%), and social sciences (3 | 1.8%) are the most common fields of study among 166 individuals in Starbuck who have obtained a bachelor's degree or higher.
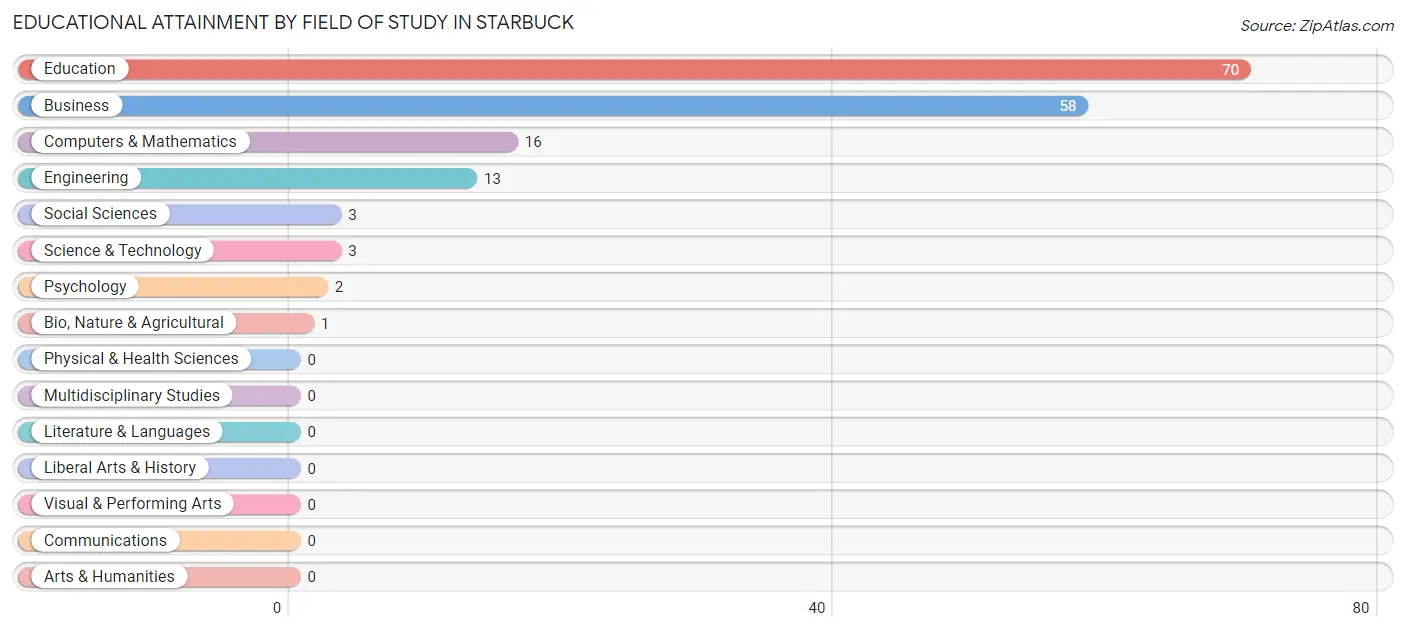
| Field of Study | # Graduates | % Graduates |
| Computers & Mathematics | 16 | 9.6% |
| Bio, Nature & Agricultural | 1 | 0.6% |
| Physical & Health Sciences | 0 | 0.0% |
| Psychology | 2 | 1.2% |
| Social Sciences | 3 | 1.8% |
| Engineering | 13 | 7.8% |
| Multidisciplinary Studies | 0 | 0.0% |
| Science & Technology | 3 | 1.8% |
| Business | 58 | 34.9% |
| Education | 70 | 42.2% |
| Literature & Languages | 0 | 0.0% |
| Liberal Arts & History | 0 | 0.0% |
| Visual & Performing Arts | 0 | 0.0% |
| Communications | 0 | 0.0% |
| Arts & Humanities | 0 | 0.0% |
| Total | 166 | 100.0% |
Transportation & Commute in Starbuck
Vehicle Availability by Sex in Starbuck
The most prevalent vehicle ownership categories in Starbuck are males with 2 vehicles (123, accounting for 41.8%) and females with 2 vehicles (172, making up 34.2%).
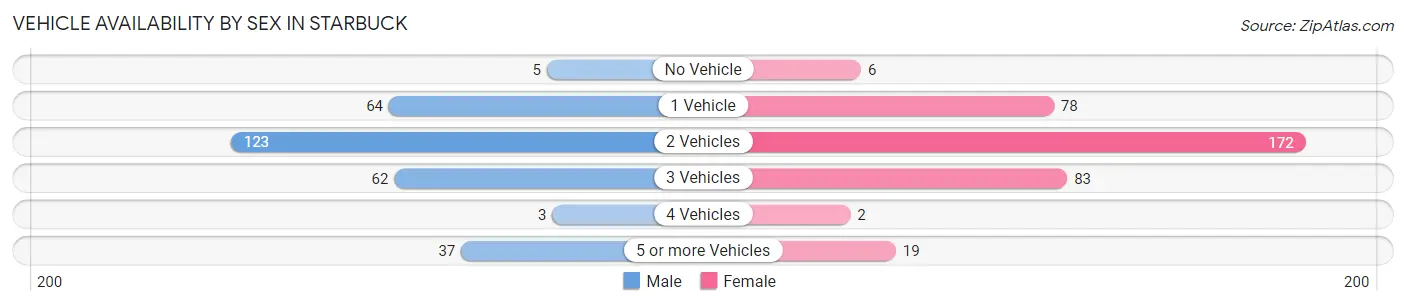
| Vehicles Available | Male | Female |
| No Vehicle | 5 (1.7%) | 6 (1.7%) |
| 1 Vehicle | 64 (21.8%) | 78 (21.7%) |
| 2 Vehicles | 123 (41.8%) | 172 (47.8%) |
| 3 Vehicles | 62 (21.1%) | 83 (23.1%) |
| 4 Vehicles | 3 (1.0%) | 2 (0.6%) |
| 5 or more Vehicles | 37 (12.6%) | 19 (5.3%) |
| Total | 294 (100.0%) | 360 (100.0%) |
Commute Time in Starbuck
The most frequently occuring commute durations in Starbuck are 30 to 34 minutes (129 commuters, 20.8%), 5 to 9 minutes (91 commuters, 14.7%), and 20 to 24 minutes (78 commuters, 12.6%).
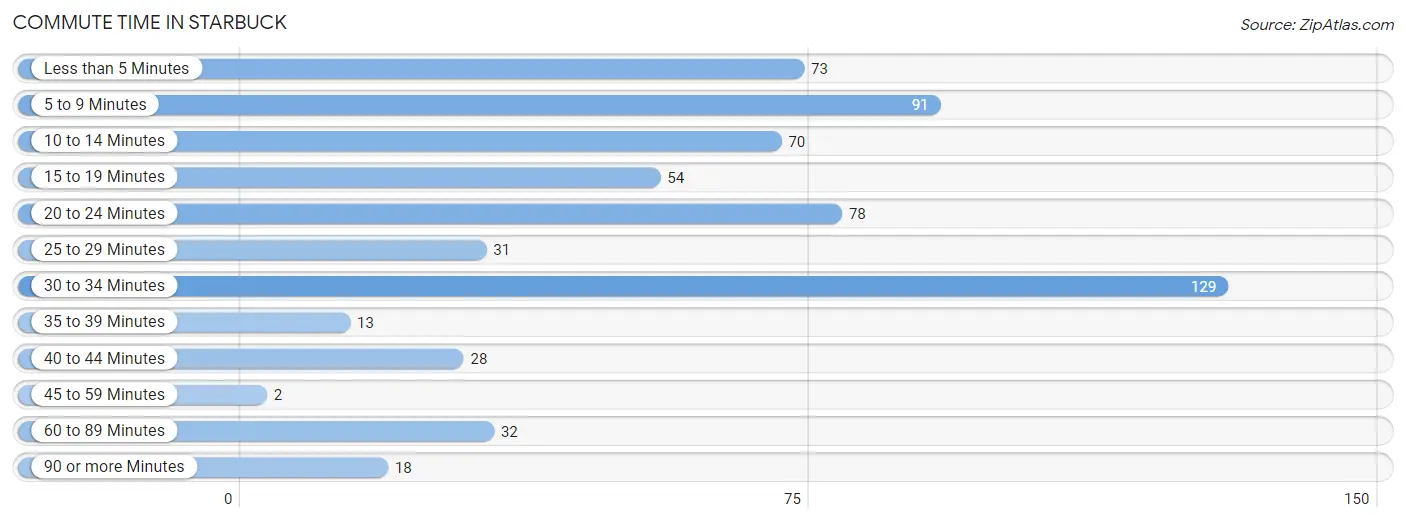
| Commute Time | # Commuters | % Commuters |
| Less than 5 Minutes | 73 | 11.8% |
| 5 to 9 Minutes | 91 | 14.7% |
| 10 to 14 Minutes | 70 | 11.3% |
| 15 to 19 Minutes | 54 | 8.7% |
| 20 to 24 Minutes | 78 | 12.6% |
| 25 to 29 Minutes | 31 | 5.0% |
| 30 to 34 Minutes | 129 | 20.8% |
| 35 to 39 Minutes | 13 | 2.1% |
| 40 to 44 Minutes | 28 | 4.5% |
| 45 to 59 Minutes | 2 | 0.3% |
| 60 to 89 Minutes | 32 | 5.2% |
| 90 or more Minutes | 18 | 2.9% |
Commute Time by Sex in Starbuck
The most common commute times in Starbuck are 5 to 9 minutes (54 commuters, 18.3%) for males and 30 to 34 minutes (79 commuters, 24.4%) for females.
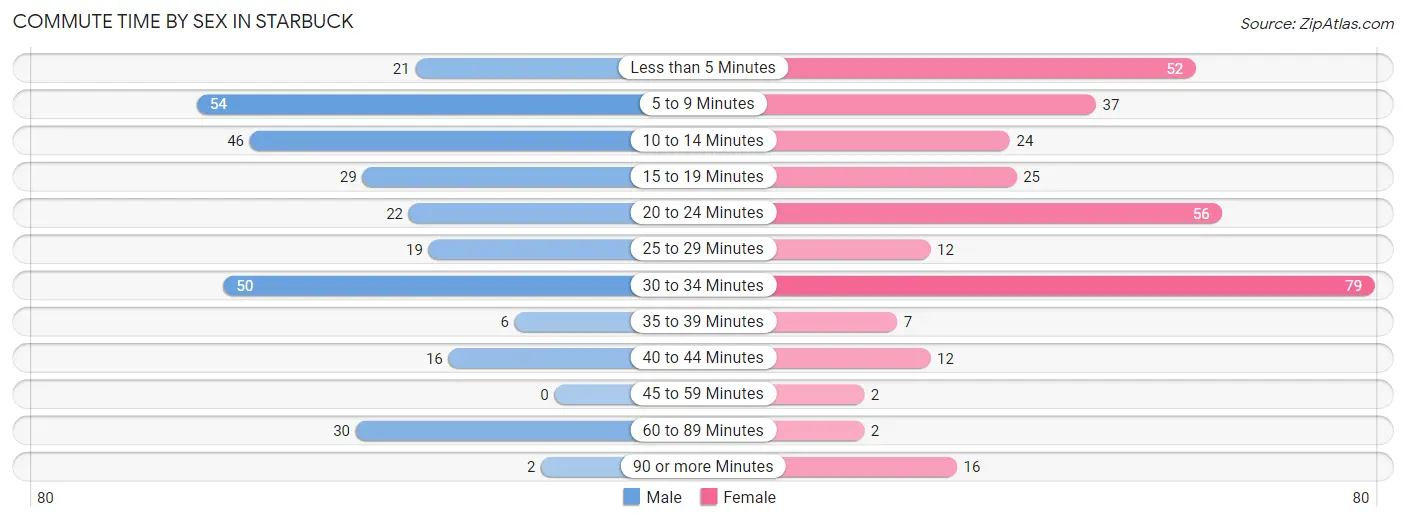
| Commute Time | Male | Female |
| Less than 5 Minutes | 21 (7.1%) | 52 (16.1%) |
| 5 to 9 Minutes | 54 (18.3%) | 37 (11.4%) |
| 10 to 14 Minutes | 46 (15.6%) | 24 (7.4%) |
| 15 to 19 Minutes | 29 (9.8%) | 25 (7.7%) |
| 20 to 24 Minutes | 22 (7.5%) | 56 (17.3%) |
| 25 to 29 Minutes | 19 (6.4%) | 12 (3.7%) |
| 30 to 34 Minutes | 50 (17.0%) | 79 (24.4%) |
| 35 to 39 Minutes | 6 (2.0%) | 7 (2.2%) |
| 40 to 44 Minutes | 16 (5.4%) | 12 (3.7%) |
| 45 to 59 Minutes | 0 (0.0%) | 2 (0.6%) |
| 60 to 89 Minutes | 30 (10.2%) | 2 (0.6%) |
| 90 or more Minutes | 2 (0.7%) | 16 (4.9%) |
Time of Departure to Work by Sex in Starbuck
The most frequent times of departure to work in Starbuck are 7:00 AM to 7:29 AM (54, 18.3%) for males and 4:00 PM to 11:59 PM (52, 16.1%) for females.
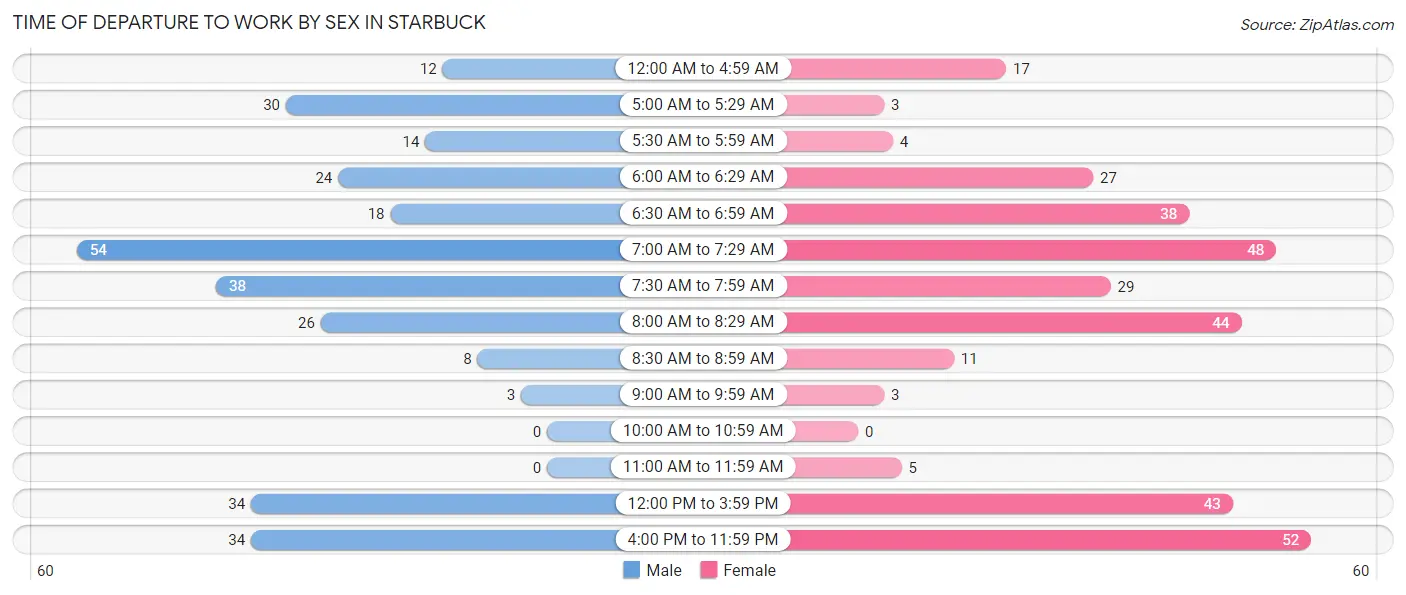
| Time of Departure | Male | Female |
| 12:00 AM to 4:59 AM | 12 (4.1%) | 17 (5.2%) |
| 5:00 AM to 5:29 AM | 30 (10.2%) | 3 (0.9%) |
| 5:30 AM to 5:59 AM | 14 (4.8%) | 4 (1.2%) |
| 6:00 AM to 6:29 AM | 24 (8.1%) | 27 (8.3%) |
| 6:30 AM to 6:59 AM | 18 (6.1%) | 38 (11.7%) |
| 7:00 AM to 7:29 AM | 54 (18.3%) | 48 (14.8%) |
| 7:30 AM to 7:59 AM | 38 (12.9%) | 29 (8.9%) |
| 8:00 AM to 8:29 AM | 26 (8.8%) | 44 (13.6%) |
| 8:30 AM to 8:59 AM | 8 (2.7%) | 11 (3.4%) |
| 9:00 AM to 9:59 AM | 3 (1.0%) | 3 (0.9%) |
| 10:00 AM to 10:59 AM | 0 (0.0%) | 0 (0.0%) |
| 11:00 AM to 11:59 AM | 0 (0.0%) | 5 (1.5%) |
| 12:00 PM to 3:59 PM | 34 (11.5%) | 43 (13.3%) |
| 4:00 PM to 11:59 PM | 34 (11.5%) | 52 (16.1%) |
| Total | 295 (100.0%) | 324 (100.0%) |
Housing Occupancy in Starbuck
Occupancy by Ownership in Starbuck
Of the total 556 dwellings in Starbuck, owner-occupied units account for 410 (73.7%), while renter-occupied units make up 146 (26.3%).
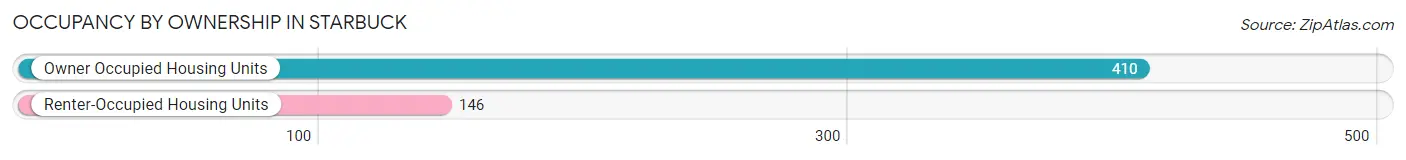
| Occupancy | # Housing Units | % Housing Units |
| Owner Occupied Housing Units | 410 | 73.7% |
| Renter-Occupied Housing Units | 146 | 26.3% |
| Total Occupied Housing Units | 556 | 100.0% |
Occupancy by Household Size in Starbuck
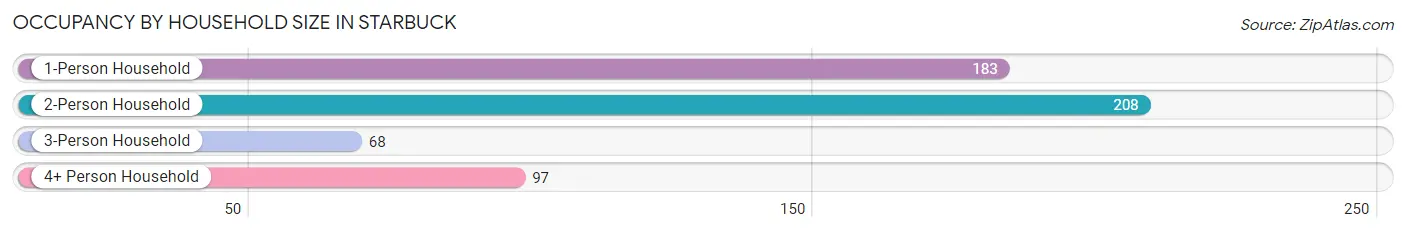
| Household Size | # Housing Units | % Housing Units |
| 1-Person Household | 183 | 32.9% |
| 2-Person Household | 208 | 37.4% |
| 3-Person Household | 68 | 12.2% |
| 4+ Person Household | 97 | 17.4% |
| Total Housing Units | 556 | 100.0% |
Occupancy by Ownership by Household Size in Starbuck
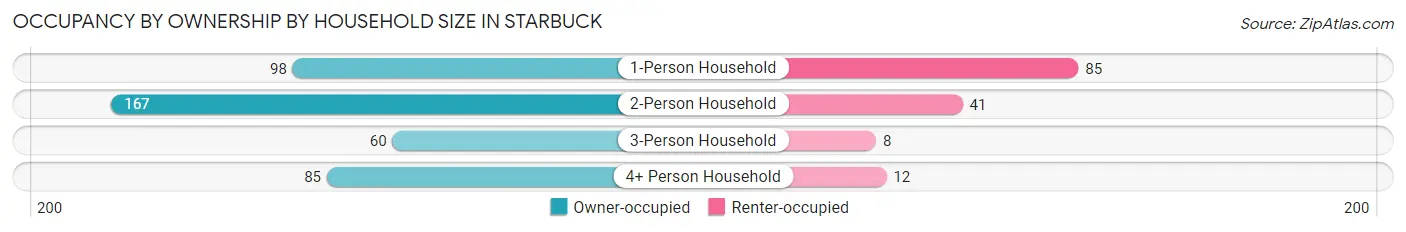
| Household Size | Owner-occupied | Renter-occupied |
| 1-Person Household | 98 (53.5%) | 85 (46.5%) |
| 2-Person Household | 167 (80.3%) | 41 (19.7%) |
| 3-Person Household | 60 (88.2%) | 8 (11.8%) |
| 4+ Person Household | 85 (87.6%) | 12 (12.4%) |
| Total Housing Units | 410 (73.7%) | 146 (26.3%) |
Occupancy by Educational Attainment in Starbuck
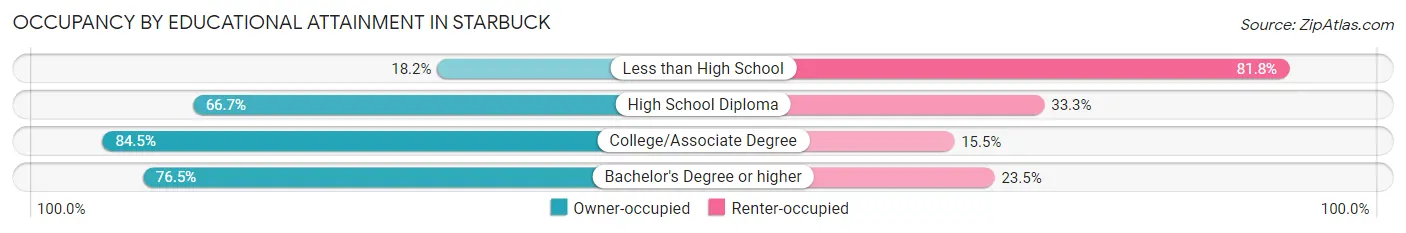
| Household Size | Owner-occupied | Renter-occupied |
| Less than High School | 6 (18.2%) | 27 (81.8%) |
| High School Diploma | 118 (66.7%) | 59 (33.3%) |
| College/Associate Degree | 224 (84.5%) | 41 (15.5%) |
| Bachelor's Degree or higher | 62 (76.5%) | 19 (23.5%) |
Occupancy by Age of Householder in Starbuck
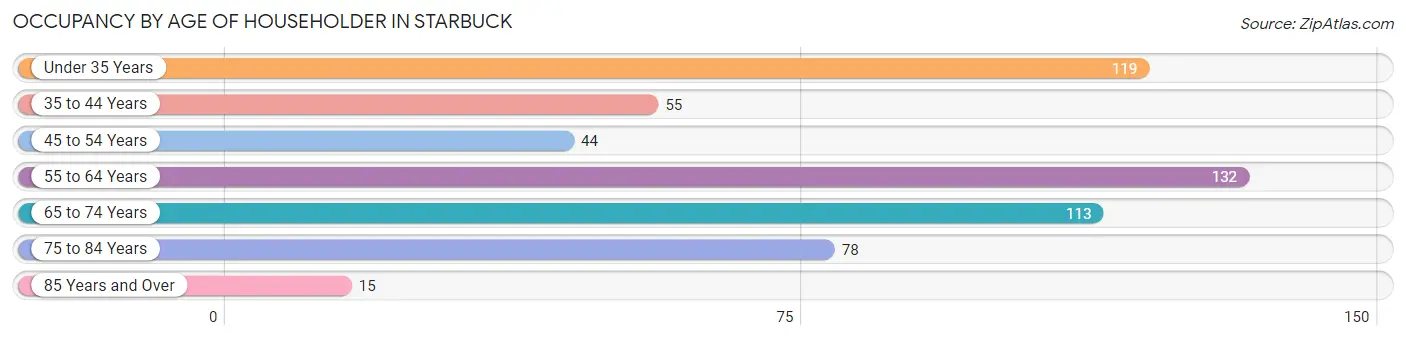
| Age Bracket | # Households | % Households |
| Under 35 Years | 119 | 21.4% |
| 35 to 44 Years | 55 | 9.9% |
| 45 to 54 Years | 44 | 7.9% |
| 55 to 64 Years | 132 | 23.7% |
| 65 to 74 Years | 113 | 20.3% |
| 75 to 84 Years | 78 | 14.0% |
| 85 Years and Over | 15 | 2.7% |
| Total | 556 | 100.0% |
Housing Finances in Starbuck
Median Income by Occupancy in Starbuck
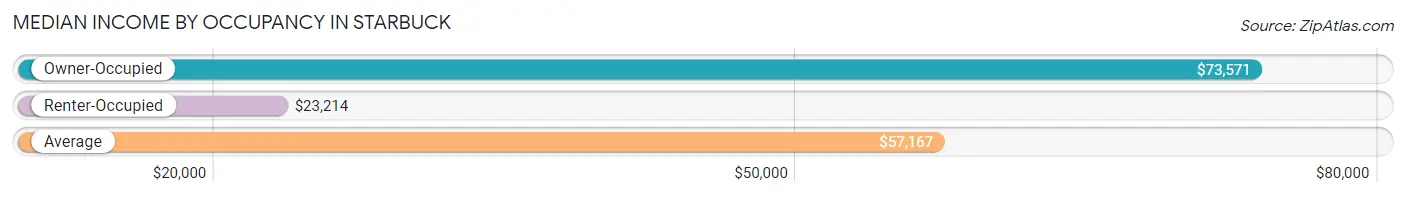
| Occupancy Type | # Households | Median Income |
| Owner-Occupied | 410 (73.7%) | $73,571 |
| Renter-Occupied | 146 (26.3%) | $23,214 |
| Average | 556 (100.0%) | $57,167 |
Occupancy by Householder Income Bracket in Starbuck
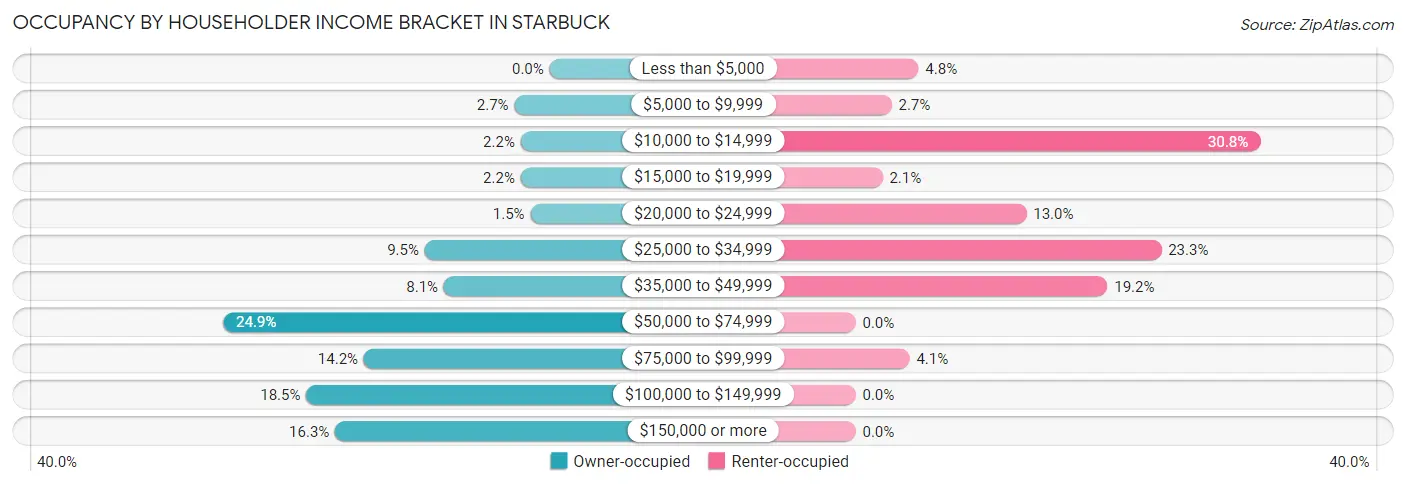
| Income Bracket | Owner-occupied | Renter-occupied |
| Less than $5,000 | 0 (0.0%) | 7 (4.8%) |
| $5,000 to $9,999 | 11 (2.7%) | 4 (2.7%) |
| $10,000 to $14,999 | 9 (2.2%) | 45 (30.8%) |
| $15,000 to $19,999 | 9 (2.2%) | 3 (2.1%) |
| $20,000 to $24,999 | 6 (1.5%) | 19 (13.0%) |
| $25,000 to $34,999 | 39 (9.5%) | 34 (23.3%) |
| $35,000 to $49,999 | 33 (8.1%) | 28 (19.2%) |
| $50,000 to $74,999 | 102 (24.9%) | 0 (0.0%) |
| $75,000 to $99,999 | 58 (14.1%) | 6 (4.1%) |
| $100,000 to $149,999 | 76 (18.5%) | 0 (0.0%) |
| $150,000 or more | 67 (16.3%) | 0 (0.0%) |
| Total | 410 (100.0%) | 146 (100.0%) |
Monthly Housing Cost Tiers in Starbuck
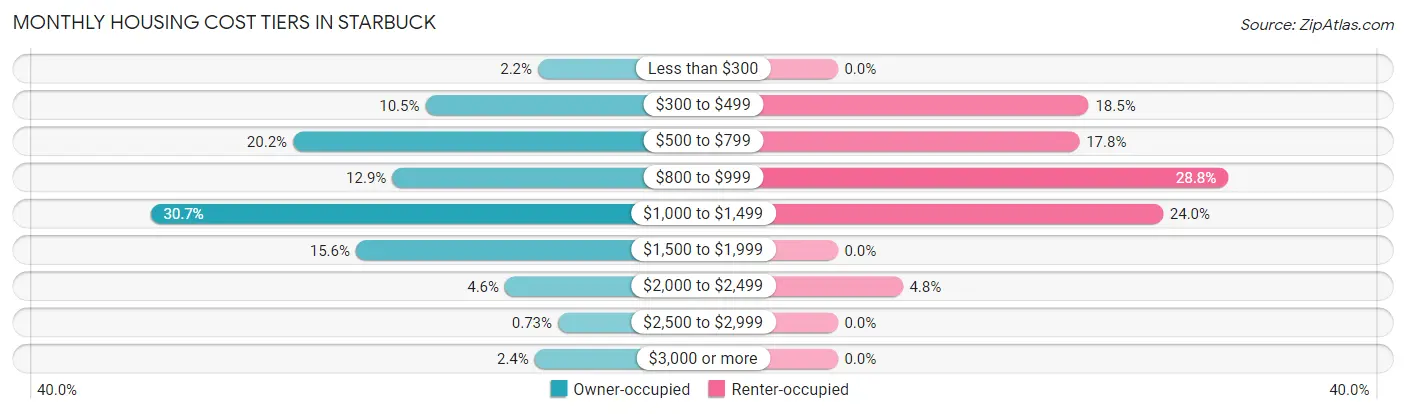
| Monthly Cost | Owner-occupied | Renter-occupied |
| Less than $300 | 9 (2.2%) | 0 (0.0%) |
| $300 to $499 | 43 (10.5%) | 27 (18.5%) |
| $500 to $799 | 83 (20.2%) | 26 (17.8%) |
| $800 to $999 | 53 (12.9%) | 42 (28.8%) |
| $1,000 to $1,499 | 126 (30.7%) | 35 (24.0%) |
| $1,500 to $1,999 | 64 (15.6%) | 0 (0.0%) |
| $2,000 to $2,499 | 19 (4.6%) | 7 (4.8%) |
| $2,500 to $2,999 | 3 (0.7%) | 0 (0.0%) |
| $3,000 or more | 10 (2.4%) | 0 (0.0%) |
| Total | 410 (100.0%) | 146 (100.0%) |
Physical Housing Characteristics in Starbuck
Housing Structures in Starbuck
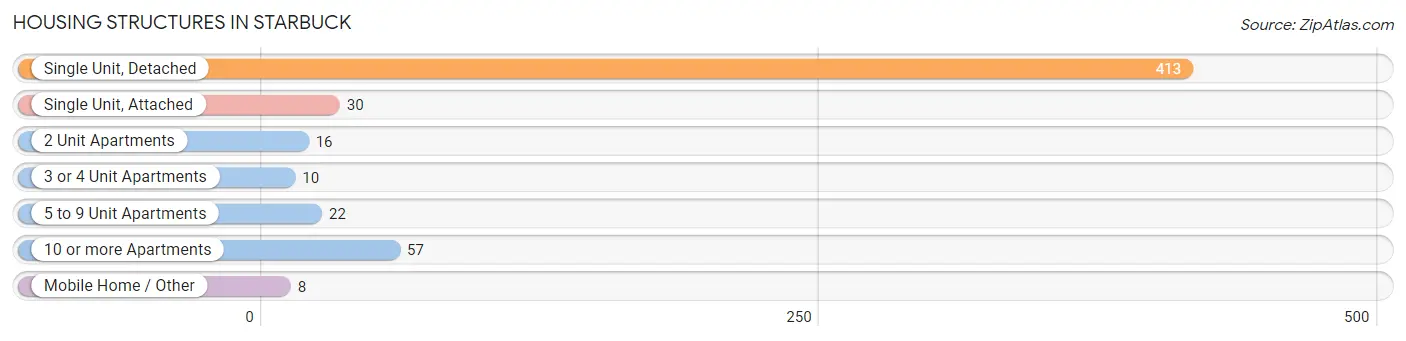
| Structure Type | # Housing Units | % Housing Units |
| Single Unit, Detached | 413 | 74.3% |
| Single Unit, Attached | 30 | 5.4% |
| 2 Unit Apartments | 16 | 2.9% |
| 3 or 4 Unit Apartments | 10 | 1.8% |
| 5 to 9 Unit Apartments | 22 | 4.0% |
| 10 or more Apartments | 57 | 10.2% |
| Mobile Home / Other | 8 | 1.4% |
| Total | 556 | 100.0% |
Housing Structures by Occupancy in Starbuck
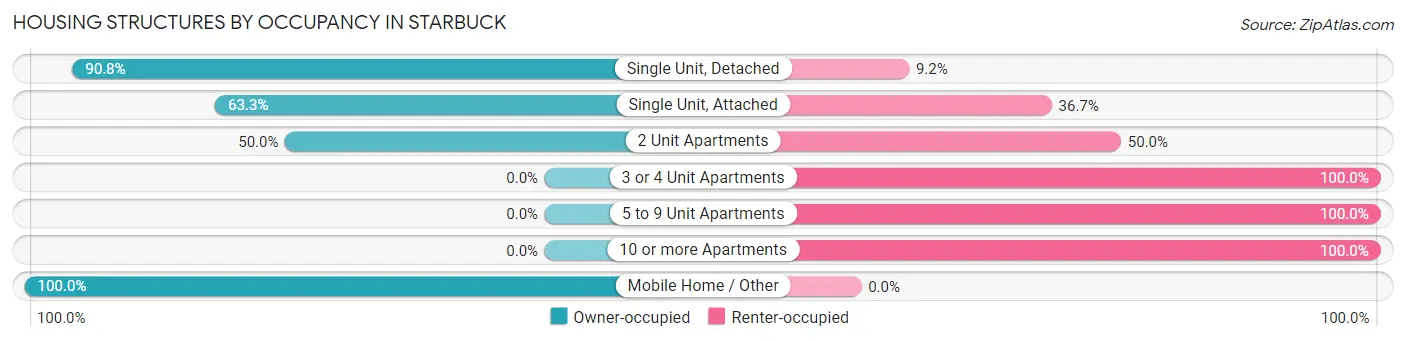
| Structure Type | Owner-occupied | Renter-occupied |
| Single Unit, Detached | 375 (90.8%) | 38 (9.2%) |
| Single Unit, Attached | 19 (63.3%) | 11 (36.7%) |
| 2 Unit Apartments | 8 (50.0%) | 8 (50.0%) |
| 3 or 4 Unit Apartments | 0 (0.0%) | 10 (100.0%) |
| 5 to 9 Unit Apartments | 0 (0.0%) | 22 (100.0%) |
| 10 or more Apartments | 0 (0.0%) | 57 (100.0%) |
| Mobile Home / Other | 8 (100.0%) | 0 (0.0%) |
| Total | 410 (73.7%) | 146 (26.3%) |
Housing Structures by Number of Rooms in Starbuck
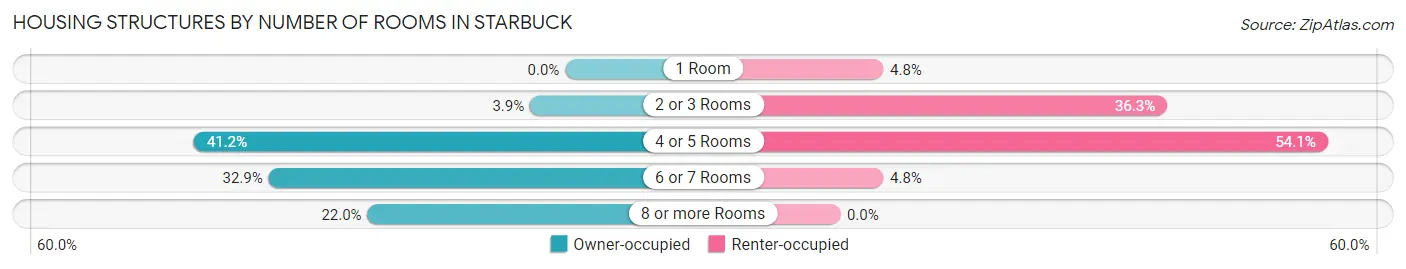
| Number of Rooms | Owner-occupied | Renter-occupied |
| 1 Room | 0 (0.0%) | 7 (4.8%) |
| 2 or 3 Rooms | 16 (3.9%) | 53 (36.3%) |
| 4 or 5 Rooms | 169 (41.2%) | 79 (54.1%) |
| 6 or 7 Rooms | 135 (32.9%) | 7 (4.8%) |
| 8 or more Rooms | 90 (22.0%) | 0 (0.0%) |
| Total | 410 (100.0%) | 146 (100.0%) |
Housing Structure by Heating Type in Starbuck
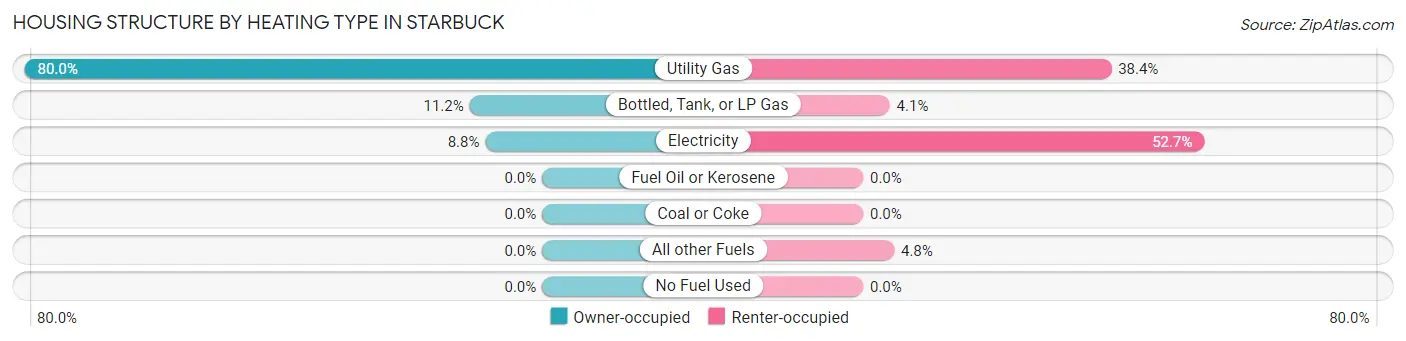
| Heating Type | Owner-occupied | Renter-occupied |
| Utility Gas | 328 (80.0%) | 56 (38.4%) |
| Bottled, Tank, or LP Gas | 46 (11.2%) | 6 (4.1%) |
| Electricity | 36 (8.8%) | 77 (52.7%) |
| Fuel Oil or Kerosene | 0 (0.0%) | 0 (0.0%) |
| Coal or Coke | 0 (0.0%) | 0 (0.0%) |
| All other Fuels | 0 (0.0%) | 7 (4.8%) |
| No Fuel Used | 0 (0.0%) | 0 (0.0%) |
| Total | 410 (100.0%) | 146 (100.0%) |
Household Vehicle Usage in Starbuck
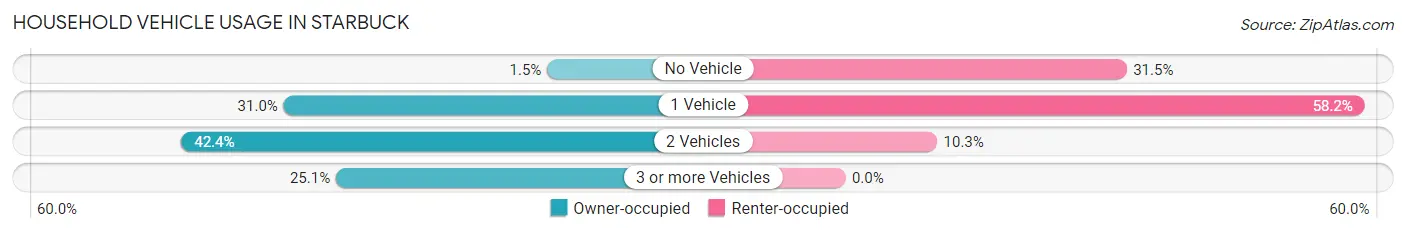
| Vehicles per Household | Owner-occupied | Renter-occupied |
| No Vehicle | 6 (1.5%) | 46 (31.5%) |
| 1 Vehicle | 127 (31.0%) | 85 (58.2%) |
| 2 Vehicles | 174 (42.4%) | 15 (10.3%) |
| 3 or more Vehicles | 103 (25.1%) | 0 (0.0%) |
| Total | 410 (100.0%) | 146 (100.0%) |
Real Estate & Mortgages in Starbuck
Real Estate and Mortgage Overview in Starbuck
| Characteristic | Without Mortgage | With Mortgage |
| Housing Units | 100 | 310 |
| Median Property Value | $129,500 | $141,400 |
| Median Household Income | $50,833 | $48 |
| Monthly Housing Costs | $486 | $10 |
| Real Estate Taxes | $1,656 | $4 |
Property Value by Mortgage Status in Starbuck
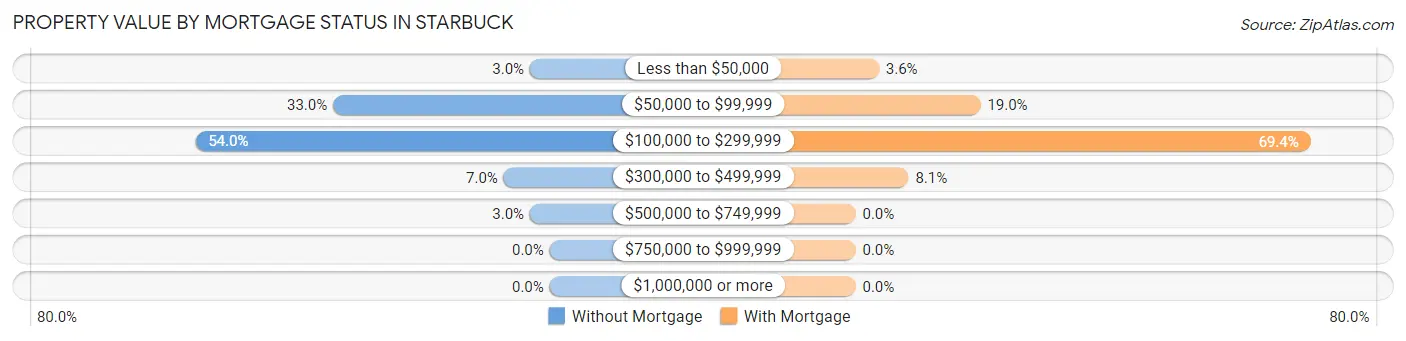
| Property Value | Without Mortgage | With Mortgage |
| Less than $50,000 | 3 (3.0%) | 11 (3.5%) |
| $50,000 to $99,999 | 33 (33.0%) | 59 (19.0%) |
| $100,000 to $299,999 | 54 (54.0%) | 215 (69.4%) |
| $300,000 to $499,999 | 7 (7.0%) | 25 (8.1%) |
| $500,000 to $749,999 | 3 (3.0%) | 0 (0.0%) |
| $750,000 to $999,999 | 0 (0.0%) | 0 (0.0%) |
| $1,000,000 or more | 0 (0.0%) | 0 (0.0%) |
| Total | 100 (100.0%) | 310 (100.0%) |
Household Income by Mortgage Status in Starbuck
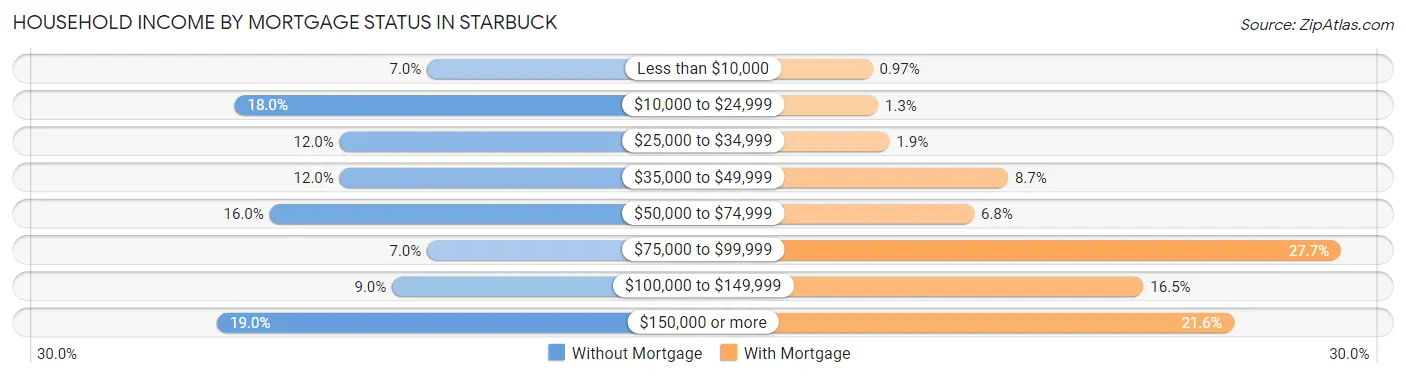
| Household Income | Without Mortgage | With Mortgage |
| Less than $10,000 | 7 (7.0%) | 3 (1.0%) |
| $10,000 to $24,999 | 18 (18.0%) | 4 (1.3%) |
| $25,000 to $34,999 | 12 (12.0%) | 6 (1.9%) |
| $35,000 to $49,999 | 12 (12.0%) | 27 (8.7%) |
| $50,000 to $74,999 | 16 (16.0%) | 21 (6.8%) |
| $75,000 to $99,999 | 7 (7.0%) | 86 (27.7%) |
| $100,000 to $149,999 | 9 (9.0%) | 51 (16.5%) |
| $150,000 or more | 19 (19.0%) | 67 (21.6%) |
| Total | 100 (100.0%) | 310 (100.0%) |
Property Value to Household Income Ratio in Starbuck
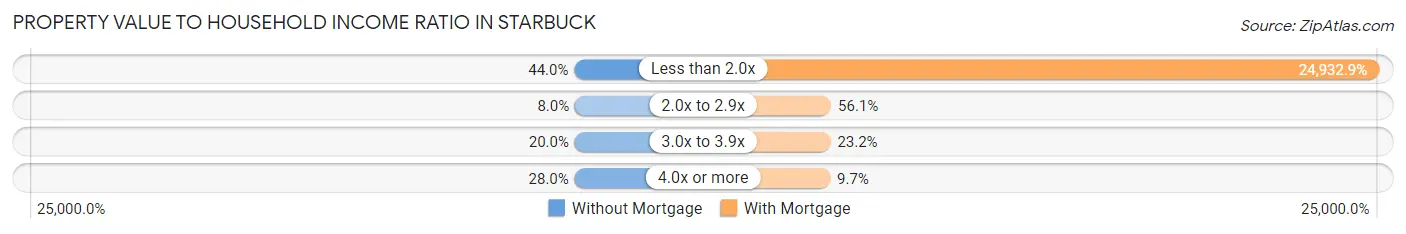
| Value-to-Income Ratio | Without Mortgage | With Mortgage |
| Less than 2.0x | 44 (44.0%) | 77,292 (24,932.9%) |
| 2.0x to 2.9x | 8 (8.0%) | 174 (56.1%) |
| 3.0x to 3.9x | 20 (20.0%) | 72 (23.2%) |
| 4.0x or more | 28 (28.0%) | 30 (9.7%) |
| Total | 100 (100.0%) | 310 (100.0%) |
Real Estate Taxes by Mortgage Status in Starbuck
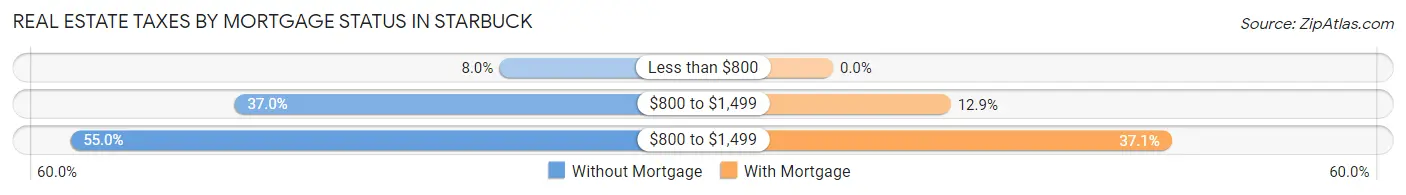
| Property Taxes | Without Mortgage | With Mortgage |
| Less than $800 | 8 (8.0%) | 0 (0.0%) |
| $800 to $1,499 | 37 (37.0%) | 40 (12.9%) |
| $800 to $1,499 | 55 (55.0%) | 115 (37.1%) |
| Total | 100 (100.0%) | 310 (100.0%) |
Health & Disability in Starbuck
Health Insurance Coverage by Age in Starbuck
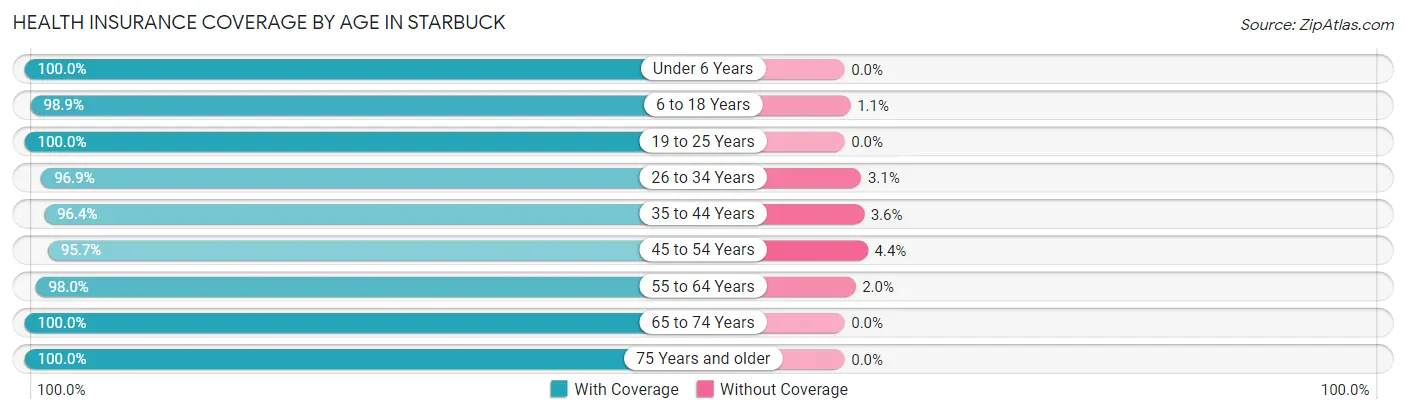
| Age Bracket | With Coverage | Without Coverage |
| Under 6 Years | 101 (100.0%) | 0 (0.0%) |
| 6 to 18 Years | 179 (98.9%) | 2 (1.1%) |
| 19 to 25 Years | 38 (100.0%) | 0 (0.0%) |
| 26 to 34 Years | 156 (96.9%) | 5 (3.1%) |
| 35 to 44 Years | 133 (96.4%) | 5 (3.6%) |
| 45 to 54 Years | 88 (95.7%) | 4 (4.3%) |
| 55 to 64 Years | 193 (98.0%) | 4 (2.0%) |
| 65 to 74 Years | 179 (100.0%) | 0 (0.0%) |
| 75 Years and older | 116 (100.0%) | 0 (0.0%) |
| Total | 1,183 (98.3%) | 20 (1.7%) |
Health Insurance Coverage by Citizenship Status in Starbuck
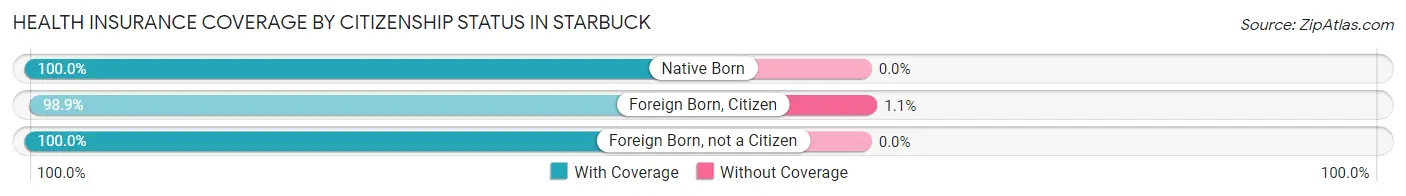
| Citizenship Status | With Coverage | Without Coverage |
| Native Born | 101 (100.0%) | 0 (0.0%) |
| Foreign Born, Citizen | 179 (98.9%) | 2 (1.1%) |
| Foreign Born, not a Citizen | 38 (100.0%) | 0 (0.0%) |
Health Insurance Coverage by Household Income in Starbuck
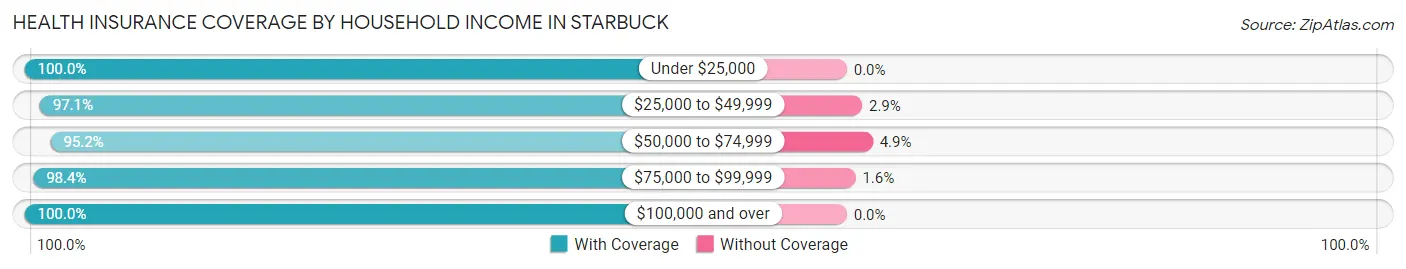
| Household Income | With Coverage | Without Coverage |
| Under $25,000 | 164 (100.0%) | 0 (0.0%) |
| $25,000 to $49,999 | 204 (97.1%) | 6 (2.9%) |
| $50,000 to $74,999 | 216 (95.2%) | 11 (4.9%) |
| $75,000 to $99,999 | 182 (98.4%) | 3 (1.6%) |
| $100,000 and over | 403 (100.0%) | 0 (0.0%) |
Public vs Private Health Insurance Coverage by Age in Starbuck
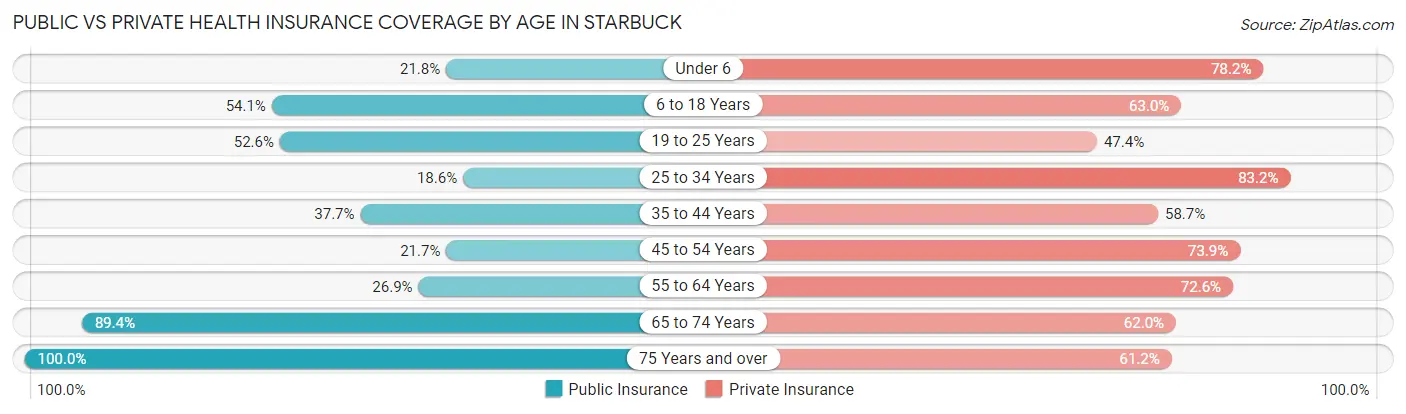
| Age Bracket | Public Insurance | Private Insurance |
| Under 6 | 22 (21.8%) | 79 (78.2%) |
| 6 to 18 Years | 98 (54.1%) | 114 (63.0%) |
| 19 to 25 Years | 20 (52.6%) | 18 (47.4%) |
| 25 to 34 Years | 30 (18.6%) | 134 (83.2%) |
| 35 to 44 Years | 52 (37.7%) | 81 (58.7%) |
| 45 to 54 Years | 20 (21.7%) | 68 (73.9%) |
| 55 to 64 Years | 53 (26.9%) | 143 (72.6%) |
| 65 to 74 Years | 160 (89.4%) | 111 (62.0%) |
| 75 Years and over | 116 (100.0%) | 71 (61.2%) |
| Total | 571 (47.5%) | 819 (68.1%) |
Disability Status by Sex by Age in Starbuck
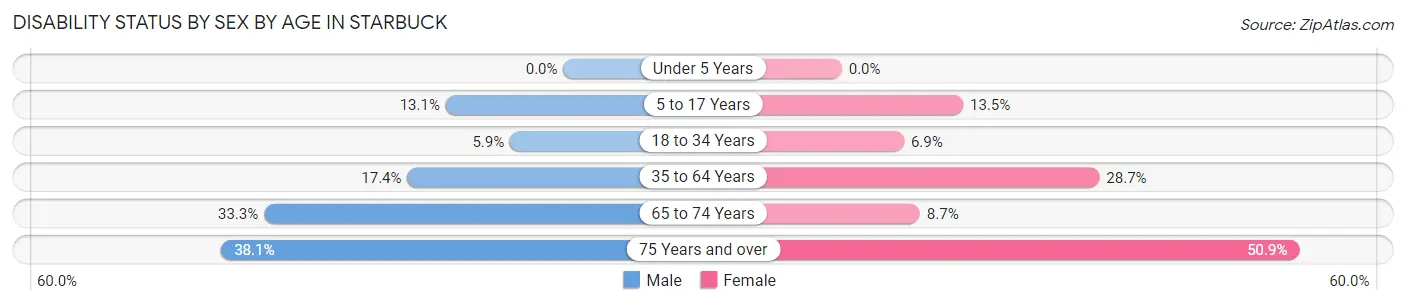
| Age Bracket | Male | Female |
| Under 5 Years | 0 (0.0%) | 0 (0.0%) |
| 5 to 17 Years | 11 (13.1%) | 10 (13.5%) |
| 18 to 34 Years | 6 (5.9%) | 9 (6.9%) |
| 35 to 64 Years | 33 (17.4%) | 68 (28.7%) |
| 65 to 74 Years | 29 (33.3%) | 8 (8.7%) |
| 75 Years and over | 24 (38.1%) | 27 (50.9%) |
Disability Class by Sex by Age in Starbuck
Disability Class: Hearing Difficulty
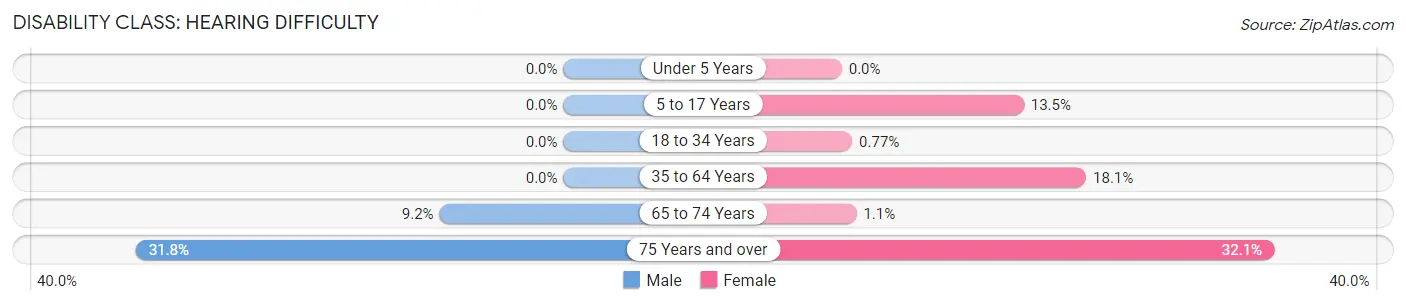
| Age Bracket | Male | Female |
| Under 5 Years | 0 (0.0%) | 0 (0.0%) |
| 5 to 17 Years | 0 (0.0%) | 10 (13.5%) |
| 18 to 34 Years | 0 (0.0%) | 1 (0.8%) |
| 35 to 64 Years | 0 (0.0%) | 43 (18.1%) |
| 65 to 74 Years | 8 (9.2%) | 1 (1.1%) |
| 75 Years and over | 20 (31.8%) | 17 (32.1%) |
Disability Class: Vision Difficulty
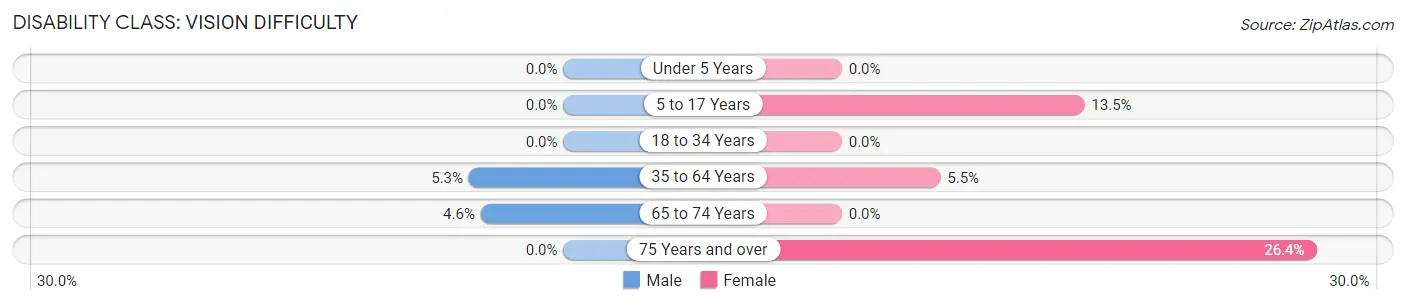
| Age Bracket | Male | Female |
| Under 5 Years | 0 (0.0%) | 0 (0.0%) |
| 5 to 17 Years | 0 (0.0%) | 10 (13.5%) |
| 18 to 34 Years | 0 (0.0%) | 0 (0.0%) |
| 35 to 64 Years | 10 (5.3%) | 13 (5.5%) |
| 65 to 74 Years | 4 (4.6%) | 0 (0.0%) |
| 75 Years and over | 0 (0.0%) | 14 (26.4%) |
Disability Class: Cognitive Difficulty
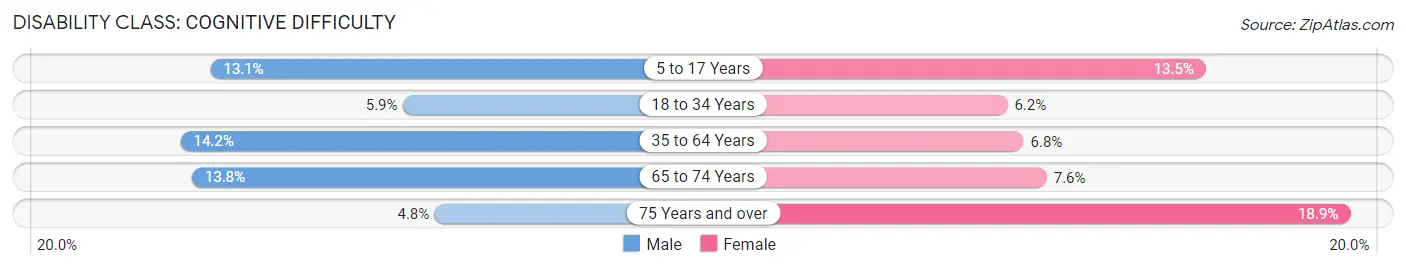
| Age Bracket | Male | Female |
| 5 to 17 Years | 11 (13.1%) | 10 (13.5%) |
| 18 to 34 Years | 6 (5.9%) | 8 (6.1%) |
| 35 to 64 Years | 27 (14.2%) | 16 (6.8%) |
| 65 to 74 Years | 12 (13.8%) | 7 (7.6%) |
| 75 Years and over | 3 (4.8%) | 10 (18.9%) |
Disability Class: Ambulatory Difficulty
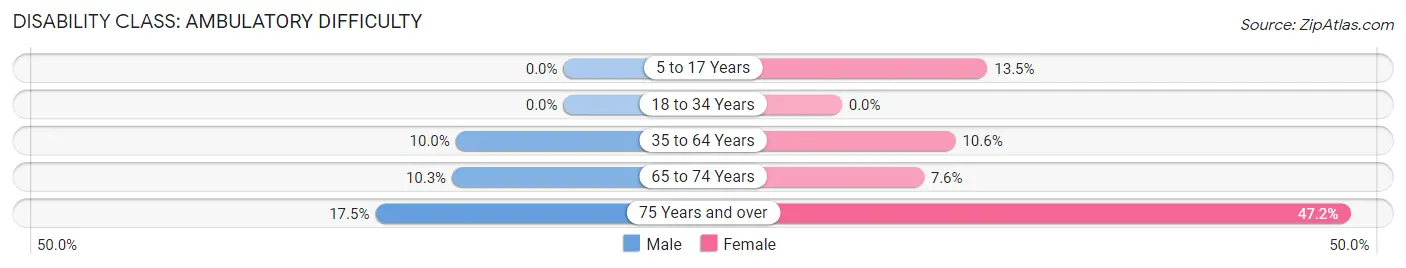
| Age Bracket | Male | Female |
| 5 to 17 Years | 0 (0.0%) | 10 (13.5%) |
| 18 to 34 Years | 0 (0.0%) | 0 (0.0%) |
| 35 to 64 Years | 19 (10.0%) | 25 (10.5%) |
| 65 to 74 Years | 9 (10.3%) | 7 (7.6%) |
| 75 Years and over | 11 (17.5%) | 25 (47.2%) |
Disability Class: Self-Care Difficulty
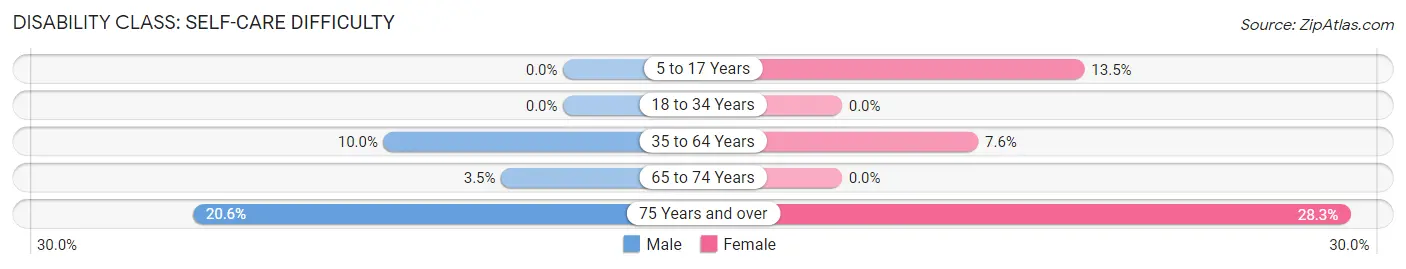
| Age Bracket | Male | Female |
| 5 to 17 Years | 0 (0.0%) | 10 (13.5%) |
| 18 to 34 Years | 0 (0.0%) | 0 (0.0%) |
| 35 to 64 Years | 19 (10.0%) | 18 (7.6%) |
| 65 to 74 Years | 3 (3.5%) | 0 (0.0%) |
| 75 Years and over | 13 (20.6%) | 15 (28.3%) |
Technology Access in Starbuck
Computing Device Access in Starbuck
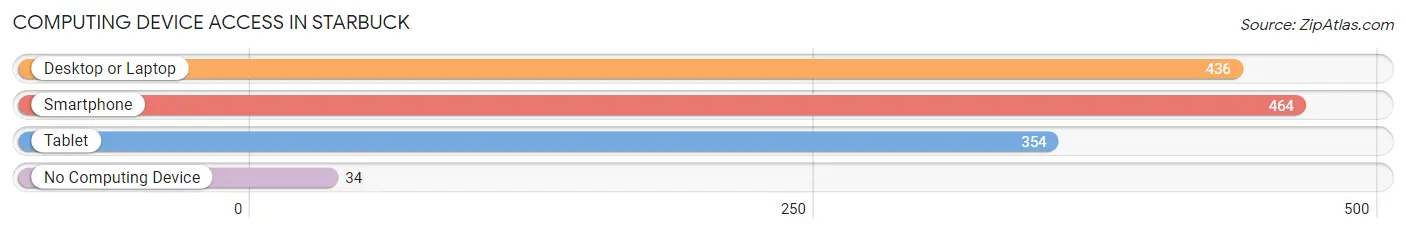
| Device Type | # Households | % Households |
| Desktop or Laptop | 436 | 78.4% |
| Smartphone | 464 | 83.5% |
| Tablet | 354 | 63.7% |
| No Computing Device | 34 | 6.1% |
| Total | 556 | 100.0% |
Internet Access in Starbuck
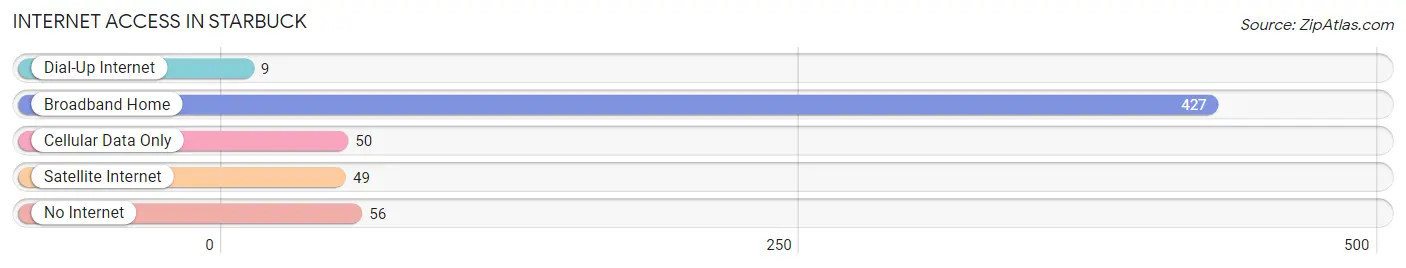
| Internet Type | # Households | % Households |
| Dial-Up Internet | 9 | 1.6% |
| Broadband Home | 427 | 76.8% |
| Cellular Data Only | 50 | 9.0% |
| Satellite Internet | 49 | 8.8% |
| No Internet | 56 | 10.1% |
| Total | 556 | 100.0% |
Starbuck Summary
Starbuck, Minnesota is a small city located in Pope County, in the west-central part of the state. It is situated on the banks of the Chippewa River, and is home to a population of 1,717 people, according to the 2010 census.
History
Starbuck was founded in 1856 by a group of settlers from Wisconsin. The town was named after a local Native American chief, Chief Starbuck. The settlers were attracted to the area due to its abundance of natural resources, including timber, fish, and game.
The town quickly grew, and by the late 1800s, it had become a thriving community. It was home to a variety of businesses, including a sawmill, a flour mill, a blacksmith shop, and a general store. The town also had a school, a post office, and a newspaper.
In the early 1900s, Starbuck began to experience a decline in population. This was due to the fact that the town was bypassed by the railroad, which had been built to connect the larger cities in the area. Despite this, the town continued to thrive, and by the 1950s, it had become a popular tourist destination.
Geography
Starbuck is located in Pope County, in the west-central part of Minnesota. It is situated on the banks of the Chippewa River, and is surrounded by rolling hills and farmland. The town is located approximately 50 miles northwest of Minneapolis, and is part of the larger St. Cloud metropolitan area.
The climate in Starbuck is typical of the Midwest, with cold winters and hot summers. The average temperature in the winter is around 20 degrees Fahrenheit, and in the summer it is around 70 degrees Fahrenheit.
Economy
The economy of Starbuck is largely based on agriculture and tourism. The town is home to several farms, which produce a variety of crops, including corn, soybeans, and wheat. The town is also home to several tourist attractions, including a golf course, a museum, and a historic downtown area.
In addition to agriculture and tourism, Starbuck is home to several small businesses, including restaurants, retail stores, and service providers. The town is also home to a variety of manufacturing companies, which produce a variety of products, including furniture, clothing, and electronics.
Demographics
According to the 2010 census, the population of Starbuck was 1,717 people. The racial makeup of the town was 97.3% White, 0.6% African American, 0.3% Native American, 0.2% Asian, 0.1% Pacific Islander, and 1.5% from other races. The median household income in Starbuck was $41,944, and the median age was 39.7 years.
Conclusion
Starbuck, Minnesota is a small city located in Pope County, in the west-central part of the state. It is situated on the banks of the Chippewa River, and is home to a population of 1,717 people, according to the 2010 census. The town was founded in 1856 by a group of settlers from Wisconsin, and has since become a popular tourist destination. The economy of Starbuck is largely based on agriculture and tourism, and the town is home to a variety of small businesses. The racial makeup of the town is 97.3% White, 0.6% African American, 0.3% Native American, 0.2% Asian, 0.1% Pacific Islander, and 1.5% from other races. The median household income in Starbuck was $41,944, and the median age was 39.7 years.
Common Questions
What is Per Capita Income in Starbuck?
Per Capita income in Starbuck is $32,271.
What is the Median Family Income in Starbuck?
Median Family Income in Starbuck is $78,281.
What is the Median Household income in Starbuck?
Median Household Income in Starbuck is $57,167.
What is Income or Wage Gap in Starbuck?
Income or Wage Gap in Starbuck is 20.2%.
Women in Starbuck earn 79.8 cents for every dollar earned by a man.
What is Inequality or Gini Index in Starbuck?
Inequality or Gini Index in Starbuck is 0.42.
What is the Total Population of Starbuck?
Total Population of Starbuck is 1,269.
What is the Total Male Population of Starbuck?
Total Male Population of Starbuck is 590.
What is the Total Female Population of Starbuck?
Total Female Population of Starbuck is 679.
What is the Ratio of Males per 100 Females in Starbuck?
There are 86.89 Males per 100 Females in Starbuck.
What is the Ratio of Females per 100 Males in Starbuck?
There are 115.08 Females per 100 Males in Starbuck.
What is the Median Population Age in Starbuck?
Median Population Age in Starbuck is 48.1 Years.
What is the Average Family Size in Starbuck
Average Family Size in Starbuck is 2.7 People.
What is the Average Household Size in Starbuck
Average Household Size in Starbuck is 2.1 People.
How Large is the Labor Force in Starbuck?
There are 673 People in the Labor Forcein in Starbuck.
What is the Percentage of People in the Labor Force in Starbuck?
64.0% of People are in the Labor Force in Starbuck.
What is the Unemployment Rate in Starbuck?
Unemployment Rate in Starbuck is 0.6%.