Vandercook Lake, MI Map & Demographics
Vandercook Lake Map
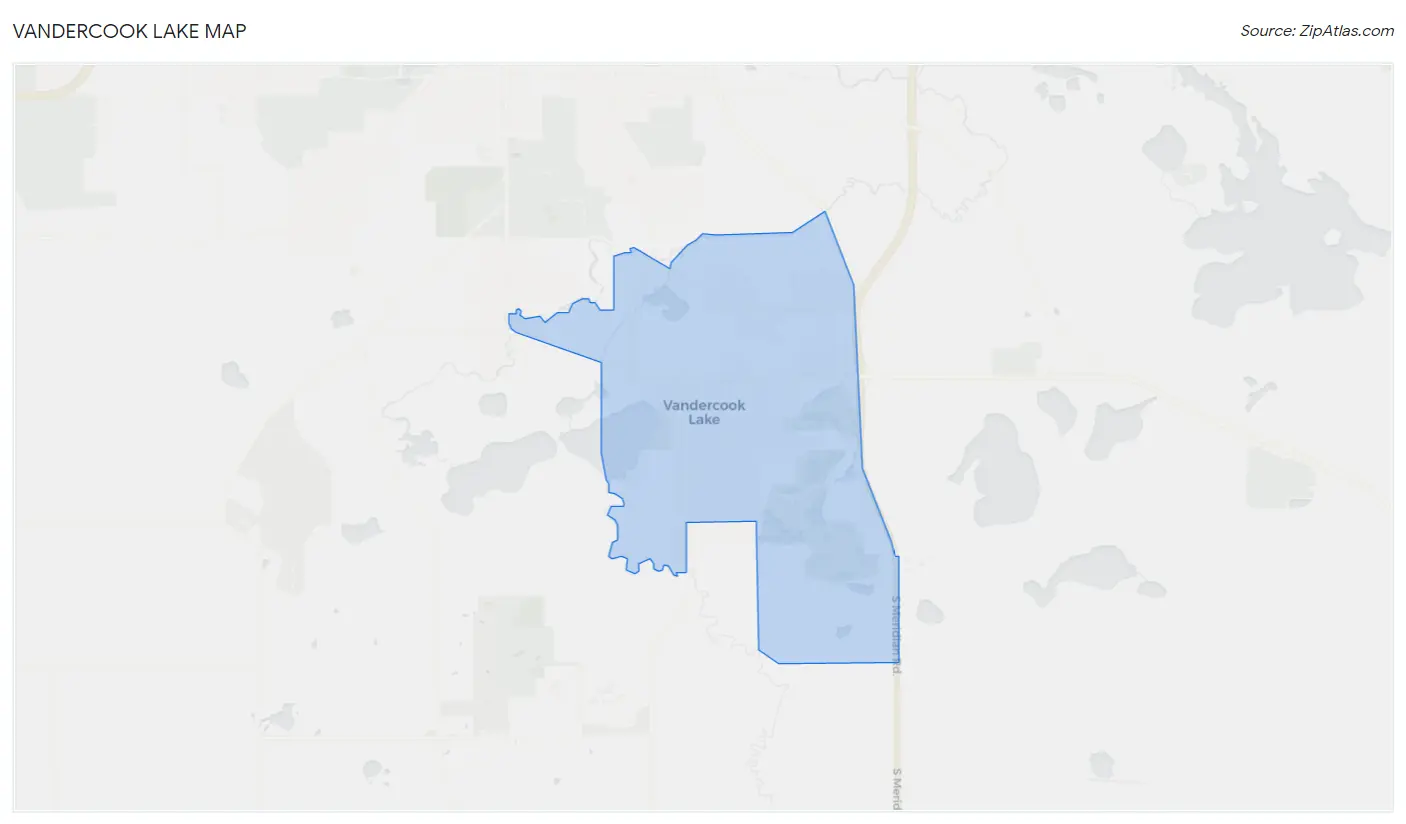
Vandercook Lake Overview
$30,277
PER CAPITA INCOME
$65,556
AVG FAMILY INCOME
$51,332
AVG HOUSEHOLD INCOME
40.8%
WAGE / INCOME GAP [ % ]
59.2¢/ $1
WAGE / INCOME GAP [ $ ]
0.43
INEQUALITY / GINI INDEX
4,635
TOTAL POPULATION
2,313
MALE POPULATION
2,322
FEMALE POPULATION
99.61
MALES / 100 FEMALES
100.39
FEMALES / 100 MALES
40.2
MEDIAN AGE
3.1
AVG FAMILY SIZE
2.4
AVG HOUSEHOLD SIZE
1,960
LABOR FORCE [ PEOPLE ]
51.6%
PERCENT IN LABOR FORCE
1.9%
UNEMPLOYMENT RATE
Income in Vandercook Lake
Income Overview in Vandercook Lake
Per Capita Income in Vandercook Lake is $30,277, while median incomes of families and households are $65,556 and $51,332 respectively.
| Characteristic | Number | Measure |
| Per Capita Income | 4,635 | $30,277 |
| Median Family Income | 1,246 | $65,556 |
| Mean Family Income | 1,246 | $86,238 |
| Median Household Income | 1,913 | $51,332 |
| Mean Household Income | 1,913 | $70,270 |
| Income Deficit | 1,246 | $0 |
| Wage / Income Gap (%) | 4,635 | 40.81% |
| Wage / Income Gap ($) | 4,635 | 59.19¢ per $1 |
| Gini / Inequality Index | 4,635 | 0.43 |
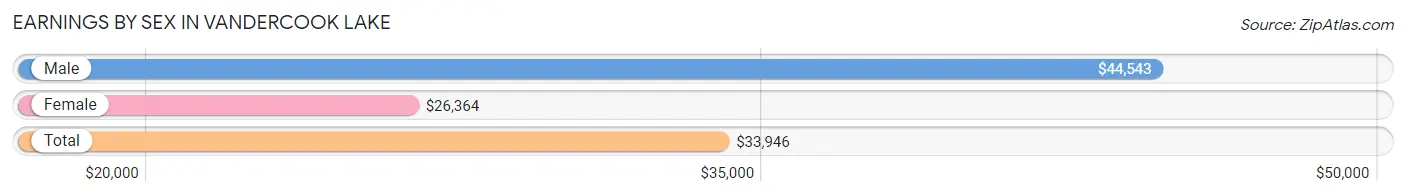
Earnings by Sex in Vandercook Lake
Average Earnings in Vandercook Lake are $33,946, $44,543 for men and $26,364 for women, a difference of 40.8%.
| Sex | Number | Average Earnings |
| Male | 1,157 (50.6%) | $44,543 |
| Female | 1,128 (49.4%) | $26,364 |
| Total | 2,285 (100.0%) | $33,946 |
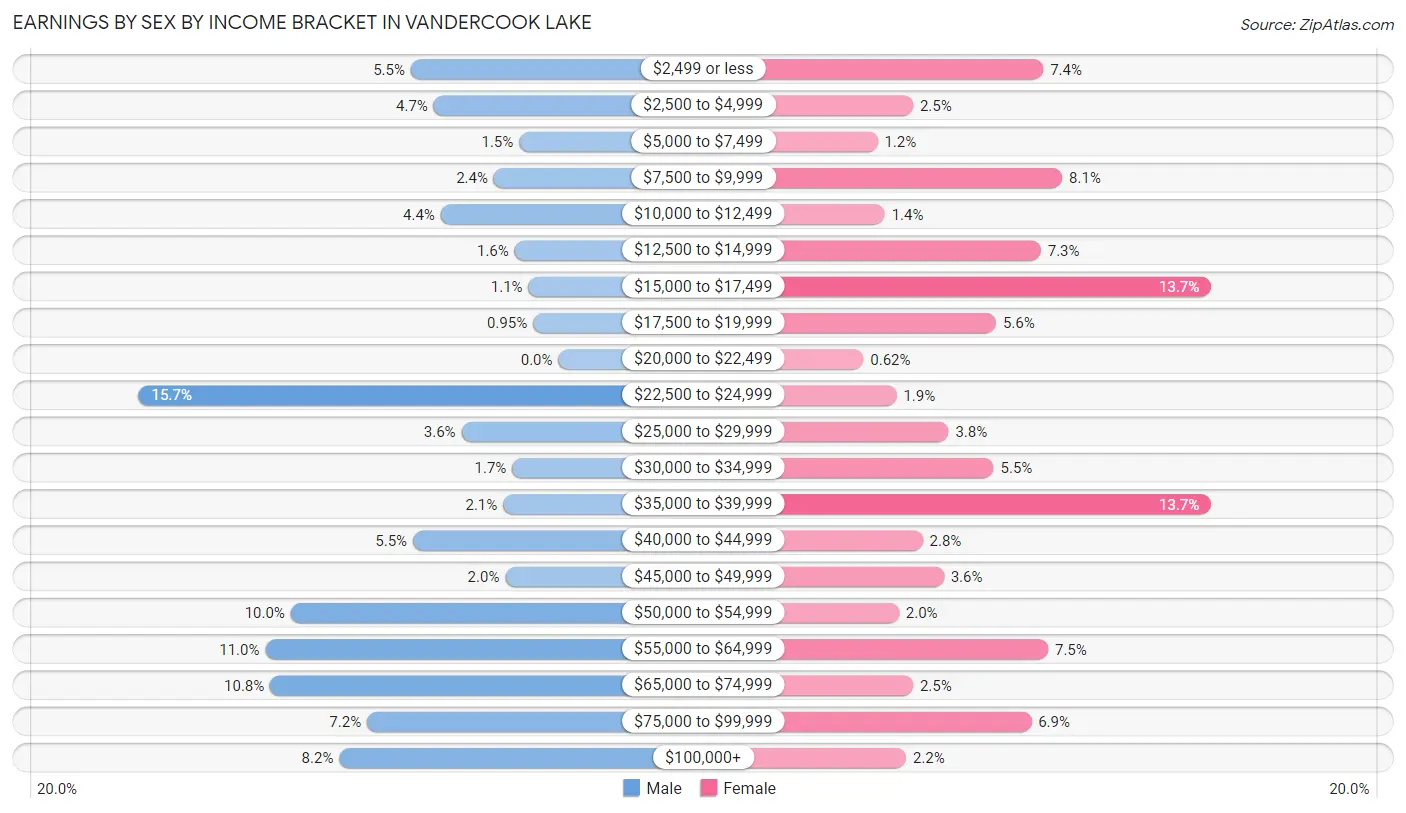
Earnings by Sex by Income Bracket in Vandercook Lake
The most common earnings brackets in Vandercook Lake are $22,500 to $24,999 for men (182 | 15.7%) and $15,000 to $17,499 for women (154 | 13.7%).
| Income | Male | Female |
| $2,499 or less | 64 (5.5%) | 83 (7.4%) |
| $2,500 to $4,999 | 54 (4.7%) | 28 (2.5%) |
| $5,000 to $7,499 | 17 (1.5%) | 13 (1.1%) |
| $7,500 to $9,999 | 28 (2.4%) | 91 (8.1%) |
| $10,000 to $12,499 | 51 (4.4%) | 16 (1.4%) |
| $12,500 to $14,999 | 19 (1.6%) | 82 (7.3%) |
| $15,000 to $17,499 | 13 (1.1%) | 154 (13.7%) |
| $17,500 to $19,999 | 11 (0.9%) | 63 (5.6%) |
| $20,000 to $22,499 | 0 (0.0%) | 7 (0.6%) |
| $22,500 to $24,999 | 182 (15.7%) | 21 (1.9%) |
| $25,000 to $29,999 | 42 (3.6%) | 43 (3.8%) |
| $30,000 to $34,999 | 20 (1.7%) | 62 (5.5%) |
| $35,000 to $39,999 | 24 (2.1%) | 154 (13.7%) |
| $40,000 to $44,999 | 63 (5.4%) | 32 (2.8%) |
| $45,000 to $49,999 | 23 (2.0%) | 41 (3.6%) |
| $50,000 to $54,999 | 116 (10.0%) | 22 (1.9%) |
| $55,000 to $64,999 | 127 (11.0%) | 85 (7.5%) |
| $65,000 to $74,999 | 125 (10.8%) | 28 (2.5%) |
| $75,000 to $99,999 | 83 (7.2%) | 78 (6.9%) |
| $100,000+ | 95 (8.2%) | 25 (2.2%) |
| Total | 1,157 (100.0%) | 1,128 (100.0%) |
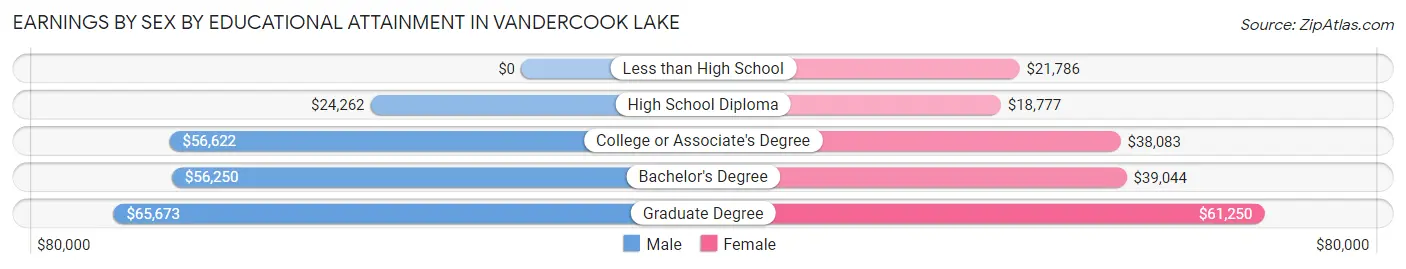
Earnings by Sex by Educational Attainment in Vandercook Lake
Average earnings in Vandercook Lake are $46,250 for men and $37,277 for women, a difference of 19.4%. Men with an educational attainment of graduate degree enjoy the highest average annual earnings of $65,673, while those with high school diploma education earn the least with $24,262. Women with an educational attainment of graduate degree earn the most with the average annual earnings of $61,250, while those with high school diploma education have the smallest earnings of $18,777.
| Educational Attainment | Male Income | Female Income |
| Less than High School | - | - |
| High School Diploma | $24,262 | $18,777 |
| College or Associate's Degree | $56,622 | $38,083 |
| Bachelor's Degree | $56,250 | $39,044 |
| Graduate Degree | $65,673 | $61,250 |
| Total | $46,250 | $37,277 |
Family Income in Vandercook Lake
Family Income Brackets in Vandercook Lake
According to the Vandercook Lake family income data, there are 288 families falling into the $35,000 to $49,999 income range, which is the most common income bracket and makes up 23.1% of all families. Conversely, the $10,000 to $14,999 income bracket is the least frequent group with only 24 families (1.9%) belonging to this category.
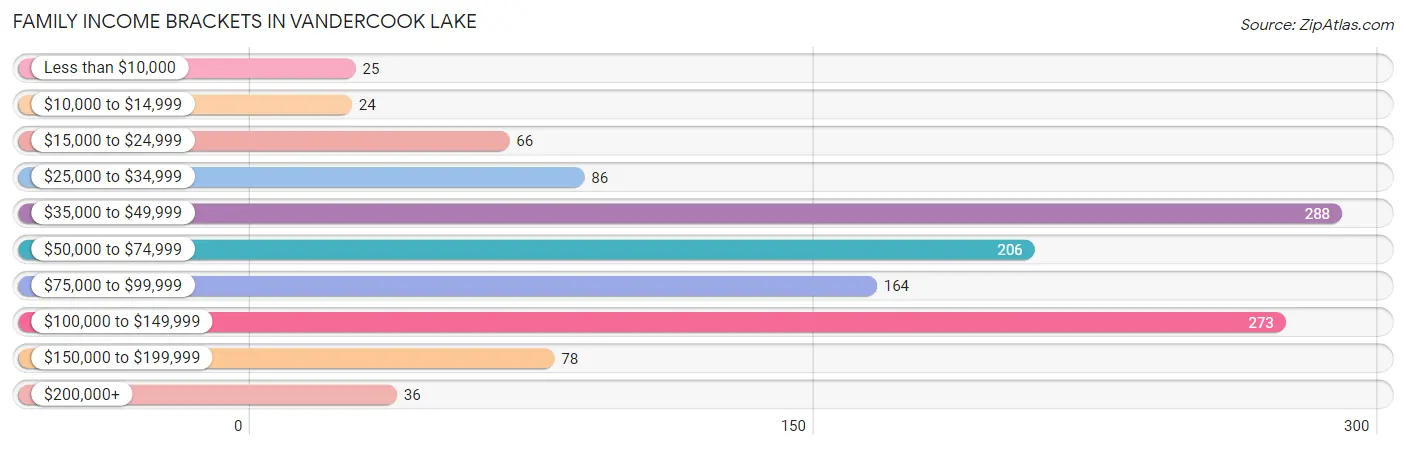
| Income Bracket | # Families | % Families |
| Less than $10,000 | 25 | 2.0% |
| $10,000 to $14,999 | 24 | 1.9% |
| $15,000 to $24,999 | 66 | 5.3% |
| $25,000 to $34,999 | 86 | 6.9% |
| $35,000 to $49,999 | 288 | 23.1% |
| $50,000 to $74,999 | 206 | 16.5% |
| $75,000 to $99,999 | 164 | 13.2% |
| $100,000 to $149,999 | 273 | 21.9% |
| $150,000 to $199,999 | 78 | 6.3% |
| $200,000+ | 36 | 2.9% |
Family Income by Famaliy Size in Vandercook Lake
3-person families (343 | 27.5%) account for the highest median family income in Vandercook Lake with $106,979 per family, while 3-person families (343 | 27.5%) have the highest median income of $35,660 per family member.
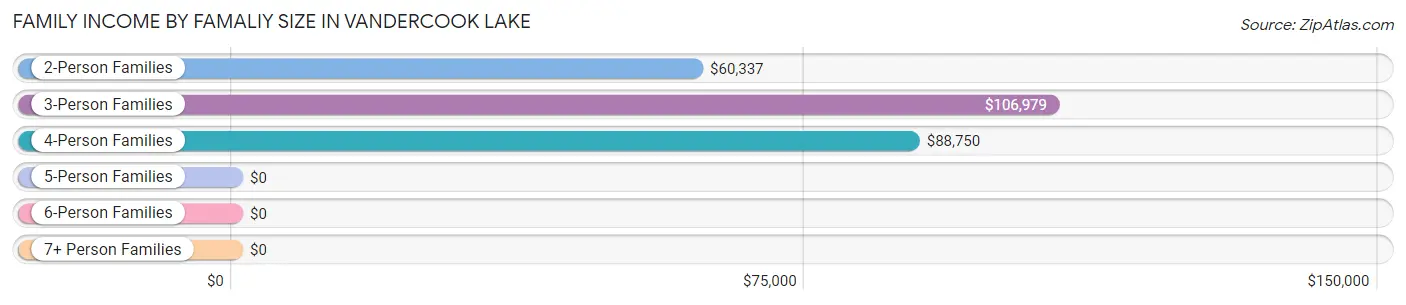
| Income Bracket | # Families | Median Income |
| 2-Person Families | 612 (49.1%) | $60,337 |
| 3-Person Families | 343 (27.5%) | $106,979 |
| 4-Person Families | 146 (11.7%) | $88,750 |
| 5-Person Families | 110 (8.8%) | $0 |
| 6-Person Families | 20 (1.6%) | $0 |
| 7+ Person Families | 15 (1.2%) | $0 |
| Total | 1,246 (100.0%) | $65,556 |
Family Income by Number of Earners in Vandercook Lake
The median family income in Vandercook Lake is $65,556, with families comprising 3+ earners (98) having the highest median family income of $148,167, while families with no earners (258) have the lowest median family income of $49,167, accounting for 7.9% and 20.7% of families, respectively.
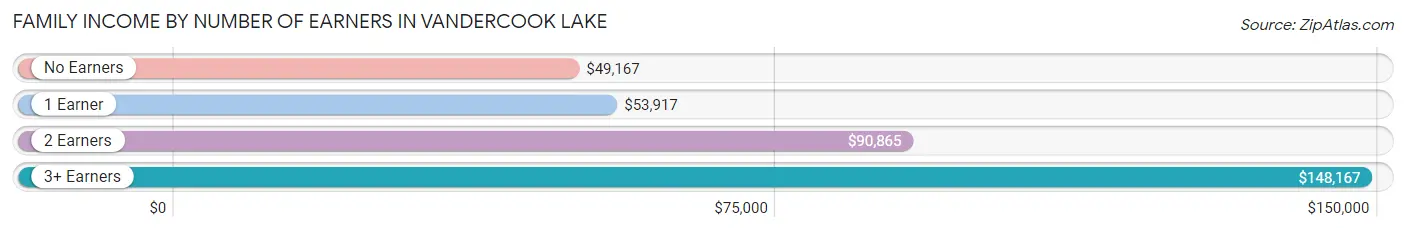
| Number of Earners | # Families | Median Income |
| No Earners | 258 (20.7%) | $49,167 |
| 1 Earner | 369 (29.6%) | $53,917 |
| 2 Earners | 521 (41.8%) | $90,865 |
| 3+ Earners | 98 (7.9%) | $148,167 |
| Total | 1,246 (100.0%) | $65,556 |
Household Income in Vandercook Lake
Household Income Brackets in Vandercook Lake
With 371 households falling in the category, the $50,000 to $74,999 income range is the most frequent in Vandercook Lake, accounting for 19.4% of all households. In contrast, only 36 households (1.9%) fall into the $200,000+ income bracket, making it the least populous group.
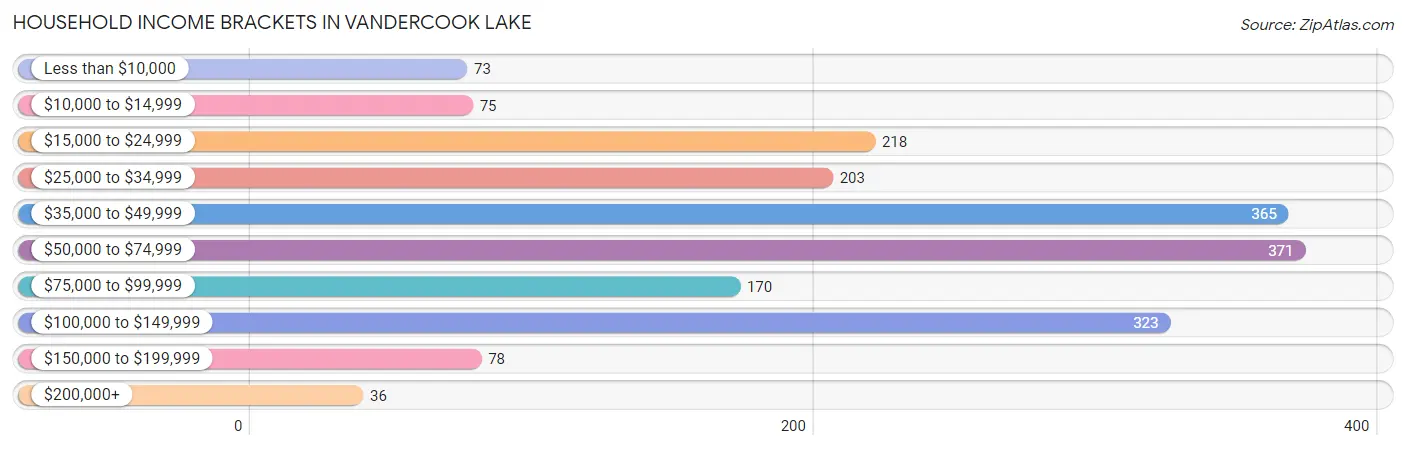
| Income Bracket | # Households | % Households |
| Less than $10,000 | 73 | 3.8% |
| $10,000 to $14,999 | 75 | 3.9% |
| $15,000 to $24,999 | 218 | 11.4% |
| $25,000 to $34,999 | 203 | 10.6% |
| $35,000 to $49,999 | 365 | 19.1% |
| $50,000 to $74,999 | 371 | 19.4% |
| $75,000 to $99,999 | 170 | 8.9% |
| $100,000 to $149,999 | 323 | 16.9% |
| $150,000 to $199,999 | 78 | 4.1% |
| $200,000+ | 36 | 1.9% |
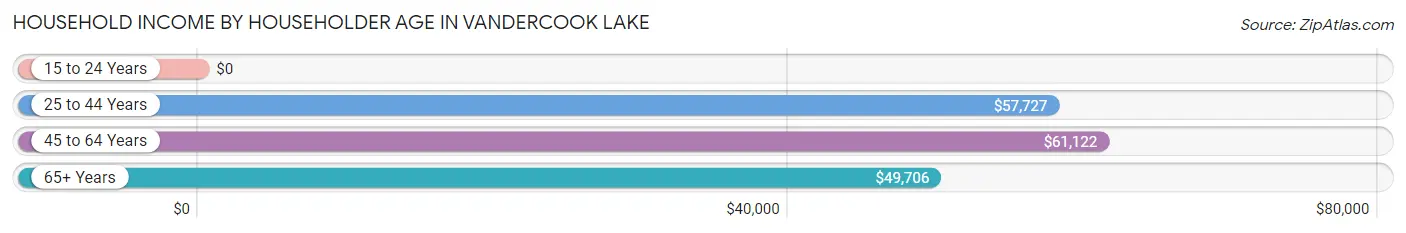
Household Income by Householder Age in Vandercook Lake
The median household income in Vandercook Lake is $51,332, with the highest median household income of $61,122 found in the 45 to 64 years age bracket for the primary householder. A total of 758 households (39.6%) fall into this category. Meanwhile, the 15 to 24 years age bracket for the primary householder has the lowest median household income of $0, with 139 households (7.3%) in this group.
| Income Bracket | # Households | Median Income |
| 15 to 24 Years | 139 (7.3%) | $0 |
| 25 to 44 Years | 504 (26.4%) | $57,727 |
| 45 to 64 Years | 758 (39.6%) | $61,122 |
| 65+ Years | 512 (26.8%) | $49,706 |
| Total | 1,913 (100.0%) | $51,332 |
Poverty in Vandercook Lake
Income Below Poverty by Sex and Age in Vandercook Lake
With 11.5% poverty level for males and 16.9% for females among the residents of Vandercook Lake, 6 to 11 year old males and 12 to 14 year old females are the most vulnerable to poverty, with 85 males (48.8%) and 31 females (51.7%) in their respective age groups living below the poverty level.
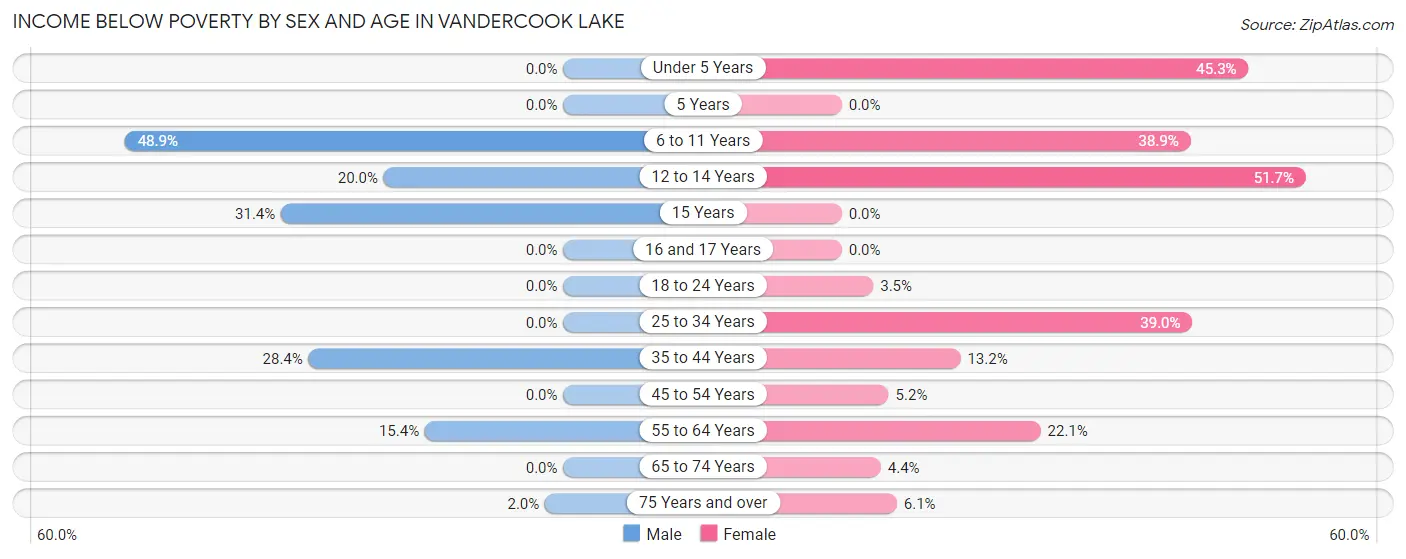
| Age Bracket | Male | Female |
| Under 5 Years | 0 (0.0%) | 48 (45.3%) |
| 5 Years | 0 (0.0%) | 0 (0.0%) |
| 6 to 11 Years | 85 (48.8%) | 54 (38.9%) |
| 12 to 14 Years | 30 (20.0%) | 31 (51.7%) |
| 15 Years | 33 (31.4%) | 0 (0.0%) |
| 16 and 17 Years | 0 (0.0%) | 0 (0.0%) |
| 18 to 24 Years | 0 (0.0%) | 11 (3.5%) |
| 25 to 34 Years | 0 (0.0%) | 73 (39.0%) |
| 35 to 44 Years | 61 (28.4%) | 39 (13.2%) |
| 45 to 54 Years | 0 (0.0%) | 14 (5.2%) |
| 55 to 64 Years | 53 (15.4%) | 95 (22.1%) |
| 65 to 74 Years | 0 (0.0%) | 10 (4.3%) |
| 75 Years and over | 4 (2.0%) | 13 (6.1%) |
| Total | 266 (11.5%) | 388 (16.9%) |
Income Above Poverty by Sex and Age in Vandercook Lake
According to the poverty statistics in Vandercook Lake, males aged under 5 years and females aged 15 years are the age groups that are most secure financially, with 100.0% of males and 100.0% of females in these age groups living above the poverty line.
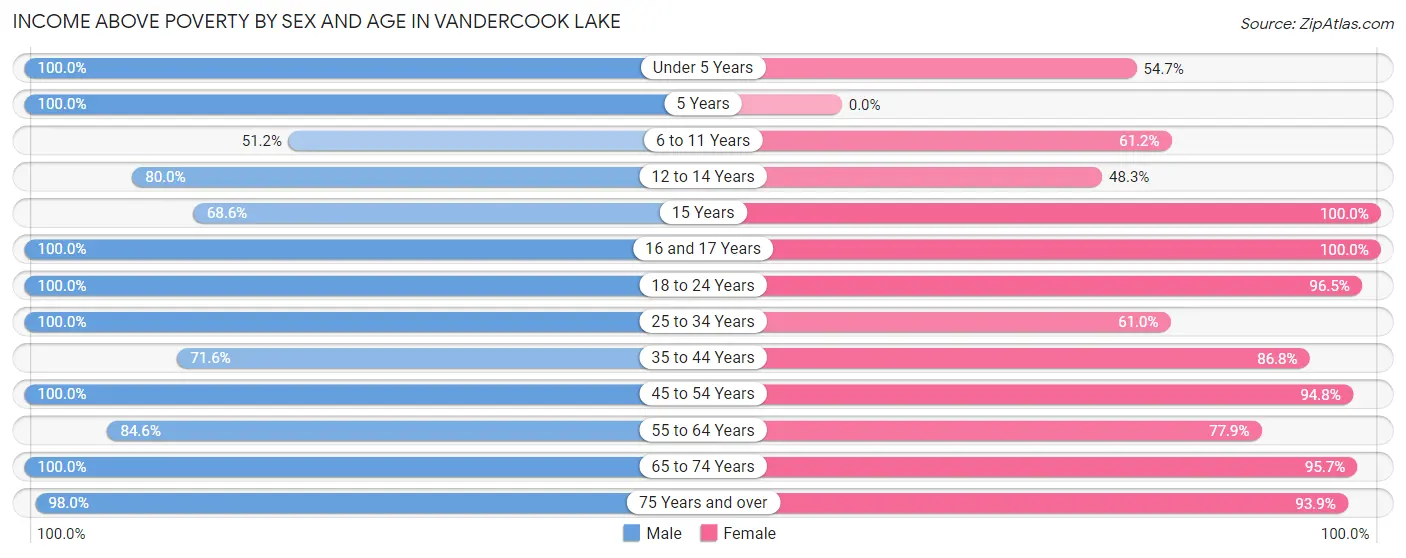
| Age Bracket | Male | Female |
| Under 5 Years | 56 (100.0%) | 58 (54.7%) |
| 5 Years | 13 (100.0%) | 0 (0.0%) |
| 6 to 11 Years | 89 (51.1%) | 85 (61.2%) |
| 12 to 14 Years | 120 (80.0%) | 29 (48.3%) |
| 15 Years | 72 (68.6%) | 8 (100.0%) |
| 16 and 17 Years | 117 (100.0%) | 49 (100.0%) |
| 18 to 24 Years | 185 (100.0%) | 302 (96.5%) |
| 25 to 34 Years | 392 (100.0%) | 114 (61.0%) |
| 35 to 44 Years | 154 (71.6%) | 256 (86.8%) |
| 45 to 54 Years | 175 (100.0%) | 254 (94.8%) |
| 55 to 64 Years | 291 (84.6%) | 334 (77.9%) |
| 65 to 74 Years | 190 (100.0%) | 220 (95.7%) |
| 75 Years and over | 193 (98.0%) | 199 (93.9%) |
| Total | 2,047 (88.5%) | 1,908 (83.1%) |
Income Below Poverty Among Married-Couple Families in Vandercook Lake
The poverty statistics for married-couple families in Vandercook Lake show that 5.7% or 52 of the total 915 families live below the poverty line. Families with 3 or 4 children have the highest poverty rate of 45.3%, comprising of 24 families. On the other hand, families with no children have the lowest poverty rate of 2.9%, which includes 18 families.
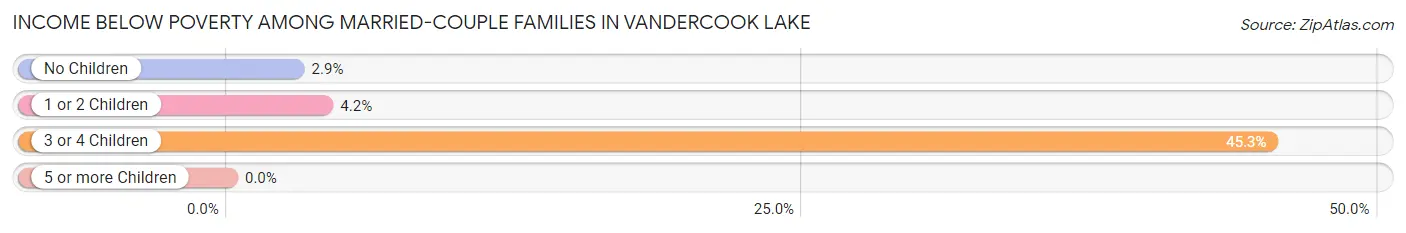
| Children | Above Poverty | Below Poverty |
| No Children | 603 (97.1%) | 18 (2.9%) |
| 1 or 2 Children | 231 (95.9%) | 10 (4.2%) |
| 3 or 4 Children | 29 (54.7%) | 24 (45.3%) |
| 5 or more Children | 0 (0.0%) | 0 (0.0%) |
| Total | 863 (94.3%) | 52 (5.7%) |
Income Below Poverty Among Single-Parent Households in Vandercook Lake
According to the poverty data in Vandercook Lake, 63.0% or 29 single-father households and 14.0% or 40 single-mother households are living below the poverty line. Among single-father households, those with 3 or 4 children have the highest poverty rate, with 29 households (100.0%) experiencing poverty. Likewise, among single-mother households, those with 1 or 2 children have the highest poverty rate, with 40 households (23.4%) falling below the poverty line.
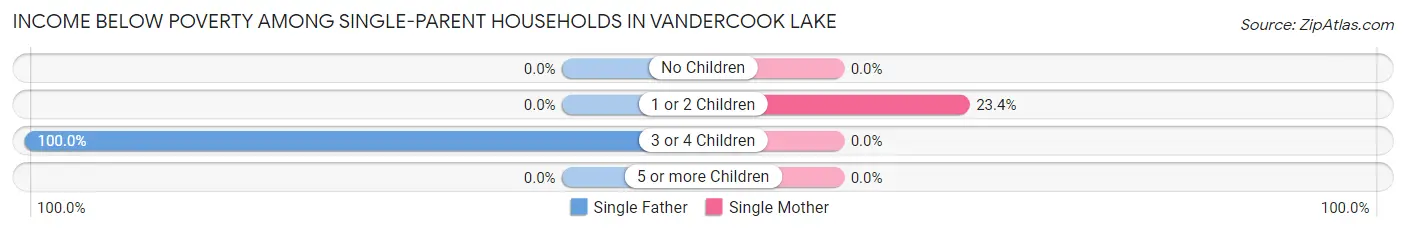
| Children | Single Father | Single Mother |
| No Children | 0 (0.0%) | 0 (0.0%) |
| 1 or 2 Children | 0 (0.0%) | 40 (23.4%) |
| 3 or 4 Children | 29 (100.0%) | 0 (0.0%) |
| 5 or more Children | 0 (0.0%) | 0 (0.0%) |
| Total | 29 (63.0%) | 40 (14.0%) |
Income Below Poverty Among Married-Couple vs Single-Parent Households in Vandercook Lake
The poverty data for Vandercook Lake shows that 52 of the married-couple family households (5.7%) and 69 of the single-parent households (20.8%) are living below the poverty level. Within the married-couple family households, those with 3 or 4 children have the highest poverty rate, with 24 households (45.3%) falling below the poverty line. Among the single-parent households, those with 3 or 4 children have the highest poverty rate, with 29 household (67.4%) living below poverty.
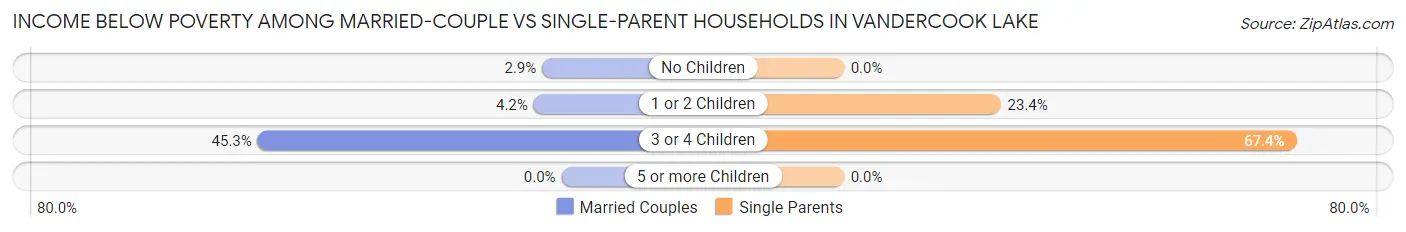
| Children | Married-Couple Families | Single-Parent Households |
| No Children | 18 (2.9%) | 0 (0.0%) |
| 1 or 2 Children | 10 (4.2%) | 40 (23.4%) |
| 3 or 4 Children | 24 (45.3%) | 29 (67.4%) |
| 5 or more Children | 0 (0.0%) | 0 (0.0%) |
| Total | 52 (5.7%) | 69 (20.8%) |
Race in Vandercook Lake
The most populous races in Vandercook Lake are White / Caucasian (4,297 | 92.7%), Two or more Races (273 | 5.9%), and Hispanic or Latino (212 | 4.6%).
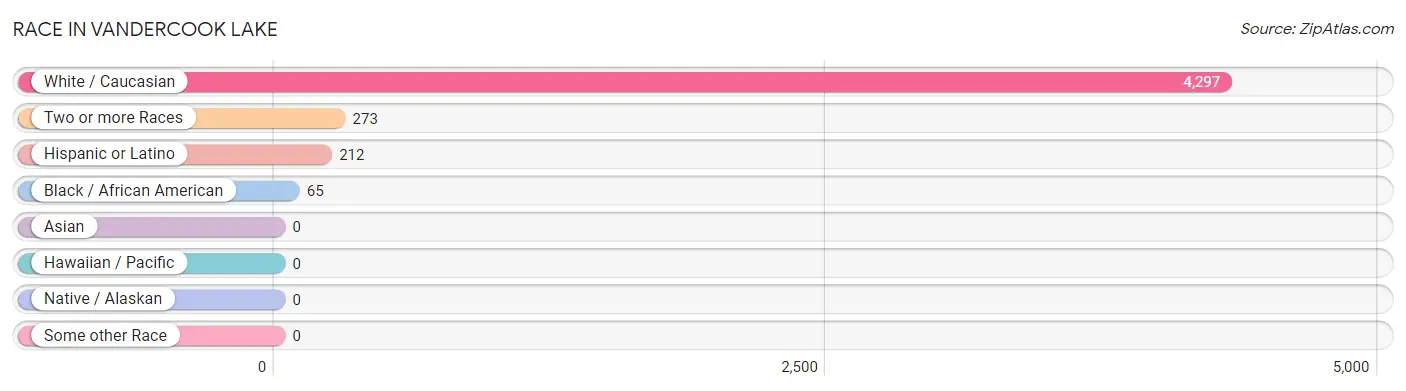
| Race | # Population | % Population |
| Asian | 0 | 0.0% |
| Black / African American | 65 | 1.4% |
| Hawaiian / Pacific | 0 | 0.0% |
| Hispanic or Latino | 212 | 4.6% |
| Native / Alaskan | 0 | 0.0% |
| White / Caucasian | 4,297 | 92.7% |
| Two or more Races | 273 | 5.9% |
| Some other Race | 0 | 0.0% |
| Total | 4,635 | 100.0% |
Ancestry in Vandercook Lake
The most populous ancestries reported in Vandercook Lake are German (1,304 | 28.1%), English (965 | 20.8%), Irish (617 | 13.3%), Italian (275 | 5.9%), and Polish (188 | 4.1%), together accounting for 72.3% of all Vandercook Lake residents.
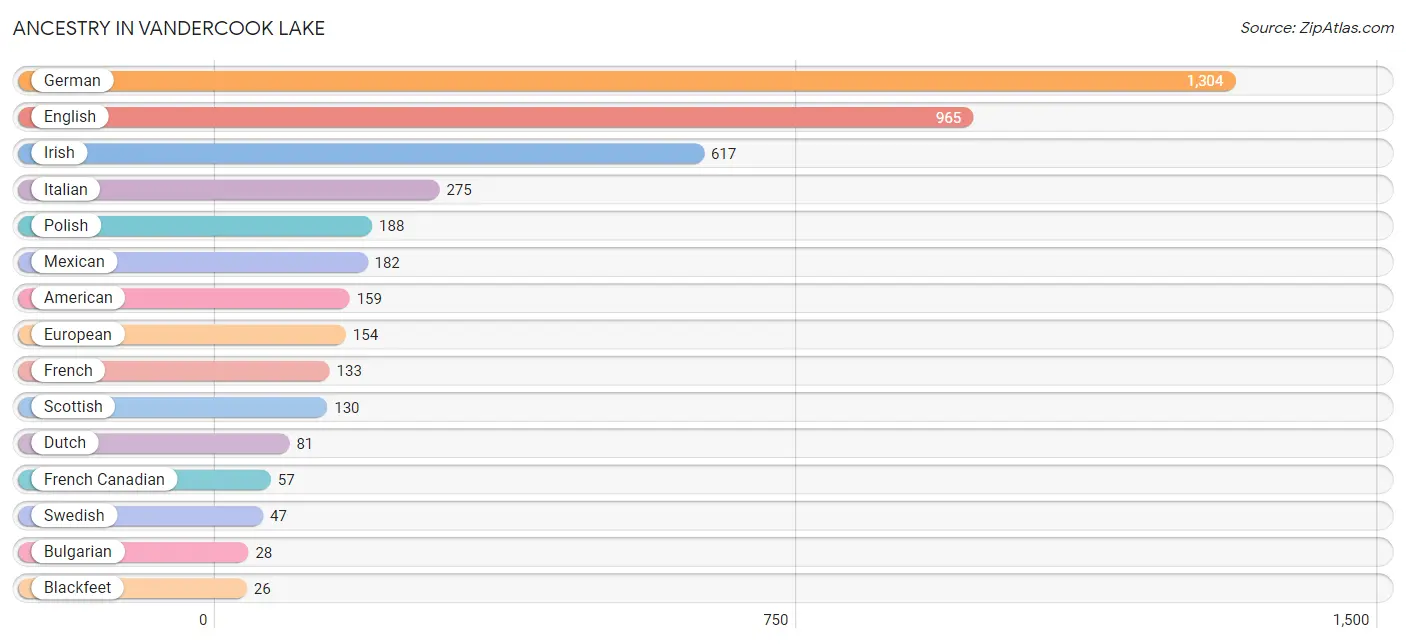
| Ancestry | # Population | % Population |
| American | 159 | 3.4% |
| Arab | 13 | 0.3% |
| Belgian | 12 | 0.3% |
| Blackfeet | 26 | 0.6% |
| British | 26 | 0.6% |
| Bulgarian | 28 | 0.6% |
| Canadian | 21 | 0.4% |
| Central American | 21 | 0.4% |
| Dutch | 81 | 1.8% |
| English | 965 | 20.8% |
| European | 154 | 3.3% |
| French | 133 | 2.9% |
| French Canadian | 57 | 1.2% |
| German | 1,304 | 28.1% |
| Guatemalan | 21 | 0.4% |
| Hungarian | 16 | 0.4% |
| Irish | 617 | 13.3% |
| Italian | 275 | 5.9% |
| Lebanese | 13 | 0.3% |
| Lithuanian | 7 | 0.2% |
| Mexican | 182 | 3.9% |
| Polish | 188 | 4.1% |
| Puerto Rican | 9 | 0.2% |
| Russian | 13 | 0.3% |
| Scotch-Irish | 8 | 0.2% |
| Scottish | 130 | 2.8% |
| Slavic | 16 | 0.4% |
| Swedish | 47 | 1.0% | View All 28 Rows |
Immigrants in Vandercook Lake
The most numerous immigrant groups reported in Vandercook Lake came from , and Canada (22 | 0.5%), together accounting for 0.5% of all Vandercook Lake residents.

| Immigration Origin | # Population | % Population |
| Canada | 22 | 0.5% | View All 1 Rows |
Sex and Age in Vandercook Lake
Sex and Age in Vandercook Lake
The most populous age groups in Vandercook Lake are 15 to 19 Years (280 | 12.1%) for men and 20 to 24 Years (262 | 11.3%) for women.
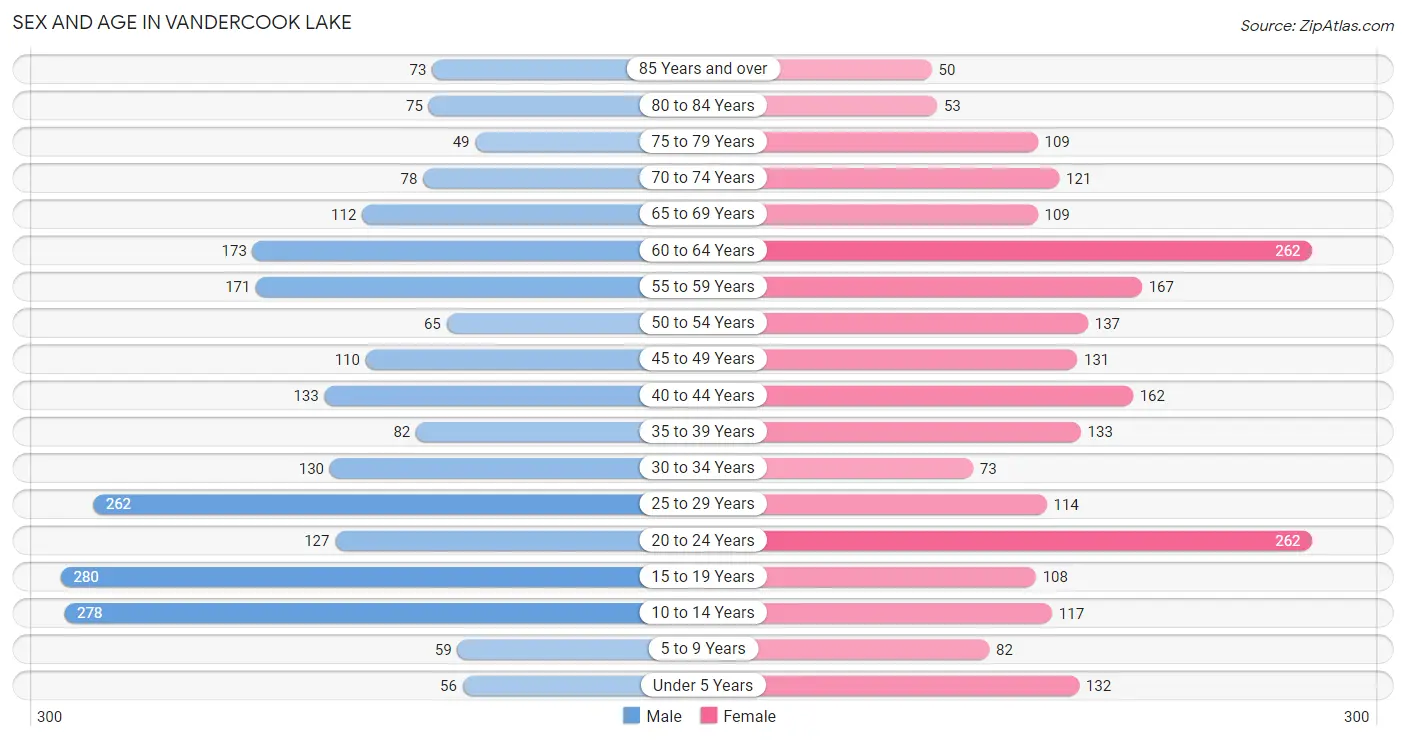
| Age Bracket | Male | Female |
| Under 5 Years | 56 (2.4%) | 132 (5.7%) |
| 5 to 9 Years | 59 (2.5%) | 82 (3.5%) |
| 10 to 14 Years | 278 (12.0%) | 117 (5.0%) |
| 15 to 19 Years | 280 (12.1%) | 108 (4.6%) |
| 20 to 24 Years | 127 (5.5%) | 262 (11.3%) |
| 25 to 29 Years | 262 (11.3%) | 114 (4.9%) |
| 30 to 34 Years | 130 (5.6%) | 73 (3.1%) |
| 35 to 39 Years | 82 (3.5%) | 133 (5.7%) |
| 40 to 44 Years | 133 (5.8%) | 162 (7.0%) |
| 45 to 49 Years | 110 (4.8%) | 131 (5.6%) |
| 50 to 54 Years | 65 (2.8%) | 137 (5.9%) |
| 55 to 59 Years | 171 (7.4%) | 167 (7.2%) |
| 60 to 64 Years | 173 (7.5%) | 262 (11.3%) |
| 65 to 69 Years | 112 (4.8%) | 109 (4.7%) |
| 70 to 74 Years | 78 (3.4%) | 121 (5.2%) |
| 75 to 79 Years | 49 (2.1%) | 109 (4.7%) |
| 80 to 84 Years | 75 (3.2%) | 53 (2.3%) |
| 85 Years and over | 73 (3.2%) | 50 (2.1%) |
| Total | 2,313 (100.0%) | 2,322 (100.0%) |
Families and Households in Vandercook Lake
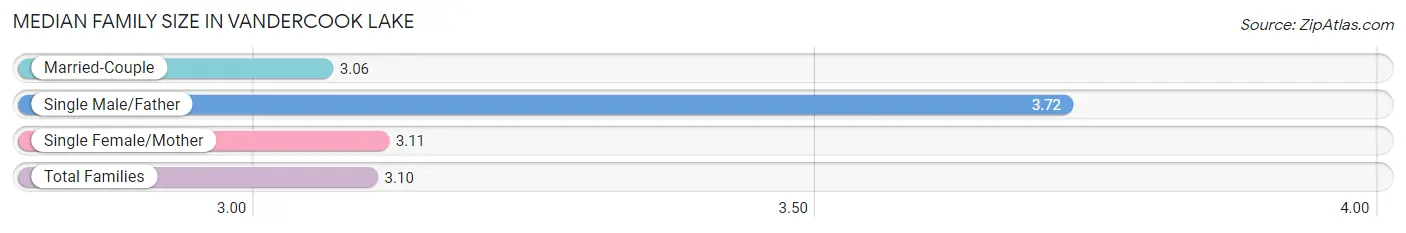
Median Family Size in Vandercook Lake
The median family size in Vandercook Lake is 3.10 persons per family, with single male/father families (46 | 3.7%) accounting for the largest median family size of 3.72 persons per family. On the other hand, married-couple families (915 | 73.4%) represent the smallest median family size with 3.06 persons per family.
| Family Type | # Families | Family Size |
| Married-Couple | 915 (73.4%) | 3.06 |
| Single Male/Father | 46 (3.7%) | 3.72 |
| Single Female/Mother | 285 (22.9%) | 3.11 |
| Total Families | 1,246 (100.0%) | 3.10 |
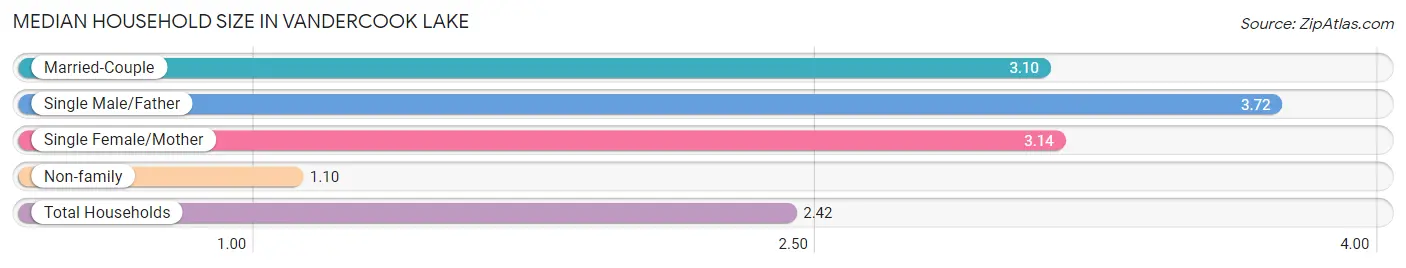
Median Household Size in Vandercook Lake
The median household size in Vandercook Lake is 2.42 persons per household, with single male/father households (46 | 2.4%) accounting for the largest median household size of 3.72 persons per household. non-family households (667 | 34.9%) represent the smallest median household size with 1.10 persons per household.
| Household Type | # Households | Household Size |
| Married-Couple | 915 (47.8%) | 3.10 |
| Single Male/Father | 46 (2.4%) | 3.72 |
| Single Female/Mother | 285 (14.9%) | 3.14 |
| Non-family | 667 (34.9%) | 1.10 |
| Total Households | 1,913 (100.0%) | 2.42 |
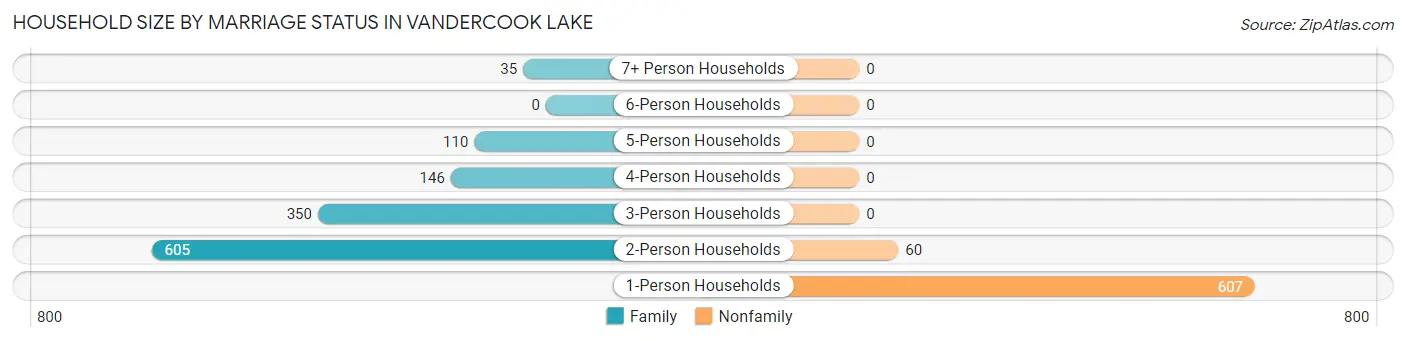
Household Size by Marriage Status in Vandercook Lake
Out of a total of 1,913 households in Vandercook Lake, 1,246 (65.1%) are family households, while 667 (34.9%) are nonfamily households. The most numerous type of family households are 2-person households, comprising 605, and the most common type of nonfamily households are 1-person households, comprising 607.
| Household Size | Family Households | Nonfamily Households |
| 1-Person Households | - | 607 (31.7%) |
| 2-Person Households | 605 (31.6%) | 60 (3.1%) |
| 3-Person Households | 350 (18.3%) | 0 (0.0%) |
| 4-Person Households | 146 (7.6%) | 0 (0.0%) |
| 5-Person Households | 110 (5.8%) | 0 (0.0%) |
| 6-Person Households | 0 (0.0%) | 0 (0.0%) |
| 7+ Person Households | 35 (1.8%) | 0 (0.0%) |
| Total | 1,246 (65.1%) | 667 (34.9%) |
Female Fertility in Vandercook Lake
Fertility by Age in Vandercook Lake
Average fertility rate in Vandercook Lake is 29.0 births per 1,000 women. Women in the age bracket of 20 to 34 years have the highest fertility rate with 65.0 births per 1,000 women. Women in the age bracket of 20 to 34 years acount for 100.0% of all women with births.
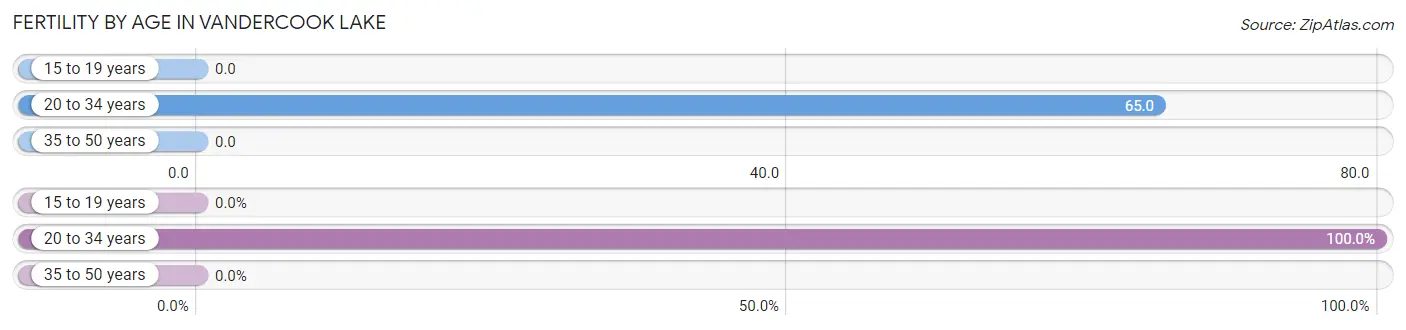
| Age Bracket | Women with Births | Births / 1,000 Women |
| 15 to 19 years | 0 (0.0%) | 0.0 |
| 20 to 34 years | 29 (100.0%) | 65.0 |
| 35 to 50 years | 0 (0.0%) | 0.0 |
| Total | 29 (100.0%) | 29.0 |
Fertility by Age by Marriage Status in Vandercook Lake
51.7% of women with births (29) in Vandercook Lake are married. The highest percentage of unmarried women with births falls into 20 to 34 years age bracket with 48.3% of them unmarried at the time of birth, while the lowest percentage of unmarried women with births belong to 20 to 34 years age bracket with 48.3% of them unmarried.
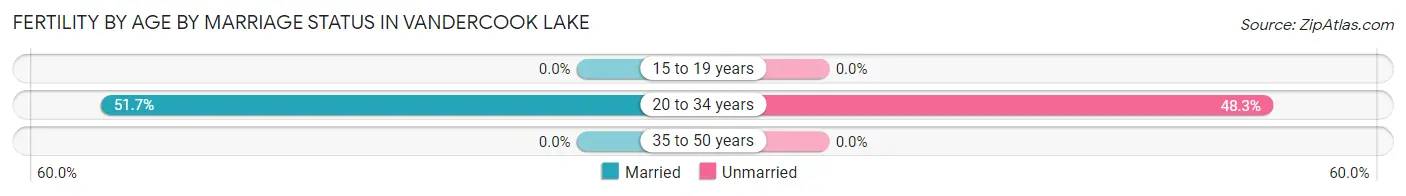
| Age Bracket | Married | Unmarried |
| 15 to 19 years | 0 (0.0%) | 0 (0.0%) |
| 20 to 34 years | 15 (51.7%) | 14 (48.3%) |
| 35 to 50 years | 0 (0.0%) | 0 (0.0%) |
| Total | 15 (51.7%) | 14 (48.3%) |
Fertility by Education in Vandercook Lake
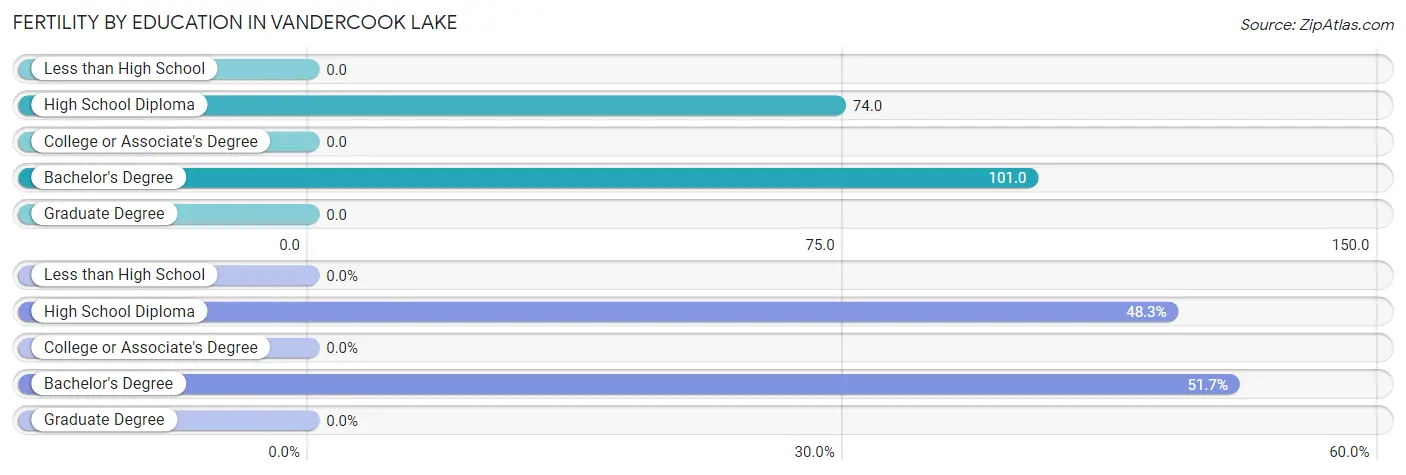
| Educational Attainment | Women with Births | Births / 1,000 Women |
| Less than High School | 0 (0.0%) | 0.0 |
| High School Diploma | 14 (48.3%) | 74.0 |
| College or Associate's Degree | 0 (0.0%) | 0.0 |
| Bachelor's Degree | 15 (51.7%) | 101.0 |
| Graduate Degree | 0 (0.0%) | 0.0 |
| Total | 29 (100.0%) | 29.0 |
Fertility by Education by Marriage Status in Vandercook Lake
48.3% of women with births in Vandercook Lake are unmarried. Women with the educational attainment of bachelor's degree are most likely to be married with 100.0% of them married at childbirth, while women with the educational attainment of high school diploma are least likely to be married with 100.0% of them unmarried at childbirth.
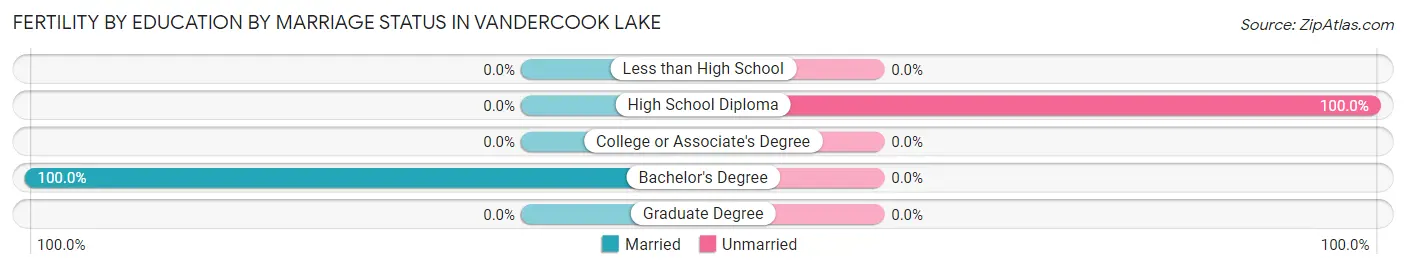
| Educational Attainment | Married | Unmarried |
| Less than High School | 0 (0.0%) | 0 (0.0%) |
| High School Diploma | 0 (0.0%) | 14 (100.0%) |
| College or Associate's Degree | 0 (0.0%) | 0 (0.0%) |
| Bachelor's Degree | 15 (100.0%) | 0 (0.0%) |
| Graduate Degree | 0 (0.0%) | 0 (0.0%) |
| Total | 15 (51.7%) | 14 (48.3%) |
Employment Characteristics in Vandercook Lake
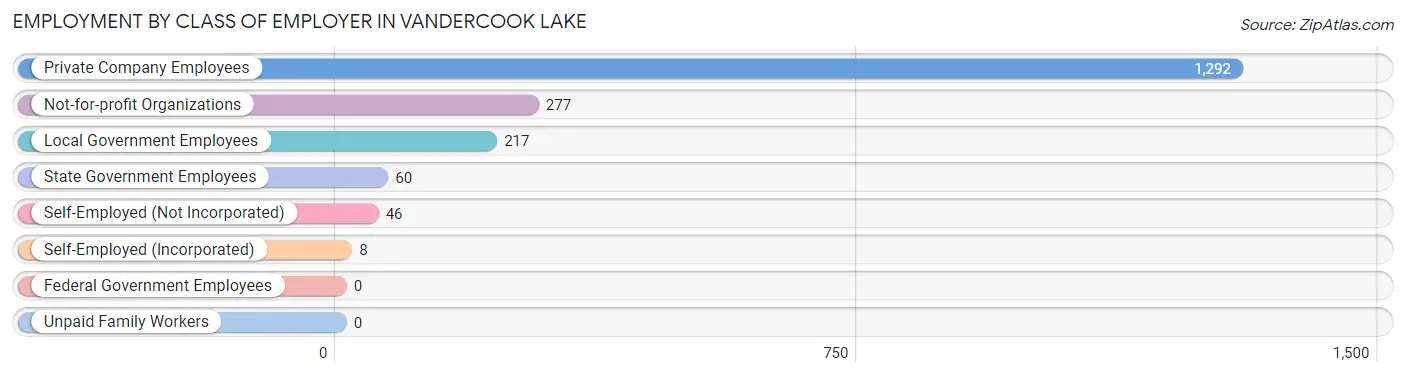
Employment by Class of Employer in Vandercook Lake
Among the 1,900 employed individuals in Vandercook Lake, private company employees (1,292 | 68.0%), not-for-profit organizations (277 | 14.6%), and local government employees (217 | 11.4%) make up the most common classes of employment.
| Employer Class | # Employees | % Employees |
| Private Company Employees | 1,292 | 68.0% |
| Self-Employed (Incorporated) | 8 | 0.4% |
| Self-Employed (Not Incorporated) | 46 | 2.4% |
| Not-for-profit Organizations | 277 | 14.6% |
| Local Government Employees | 217 | 11.4% |
| State Government Employees | 60 | 3.2% |
| Federal Government Employees | 0 | 0.0% |
| Unpaid Family Workers | 0 | 0.0% |
| Total | 1,900 | 100.0% |
Employment Status by Age in Vandercook Lake
According to the labor force statistics for Vandercook Lake, out of the total population over 16 years of age (3,798), 51.6% or 1,960 individuals are in the labor force, with 1.9% or 37 of them unemployed. The age group with the highest labor force participation rate is 45 to 54 years, with 95.0% or 421 individuals in the labor force. Within the labor force, the 65 to 74 years age range has the highest percentage of unemployed individuals, with 10.7% or 8 of them being unemployed.
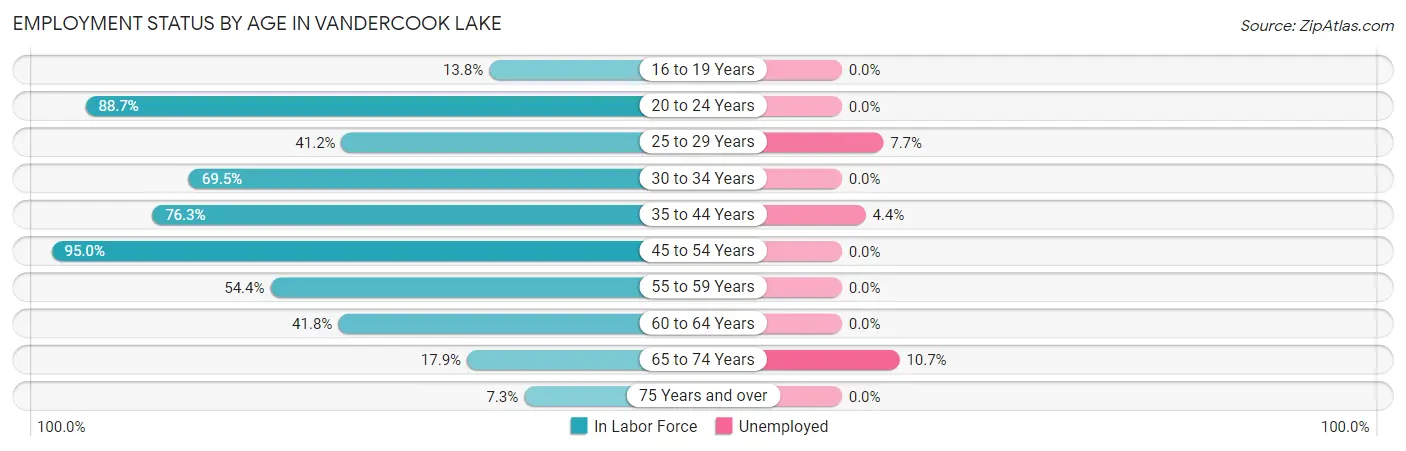
| Age Bracket | In Labor Force | Unemployed |
| 16 to 19 Years | 38 (13.8%) | 0 (0.0%) |
| 20 to 24 Years | 345 (88.7%) | 0 (0.0%) |
| 25 to 29 Years | 155 (41.2%) | 12 (7.7%) |
| 30 to 34 Years | 141 (69.5%) | 0 (0.0%) |
| 35 to 44 Years | 389 (76.3%) | 17 (4.4%) |
| 45 to 54 Years | 421 (95.0%) | 0 (0.0%) |
| 55 to 59 Years | 184 (54.4%) | 0 (0.0%) |
| 60 to 64 Years | 182 (41.8%) | 0 (0.0%) |
| 65 to 74 Years | 75 (17.9%) | 8 (10.7%) |
| 75 Years and over | 30 (7.3%) | 0 (0.0%) |
| Total | 1,960 (51.6%) | 37 (1.9%) |
Employment Status by Educational Attainment in Vandercook Lake
According to labor force statistics for Vandercook Lake, 63.9% of individuals (1,473) out of the total population between 25 and 64 years of age (2,305) are in the labor force, with 2.0% or 29 of them being unemployed. The group with the highest labor force participation rate are those with the educational attainment of bachelor's degree or higher, with 89.2% or 403 individuals in the labor force. Within the labor force, individuals with bachelor's degree or higher education have the highest percentage of unemployment, with 3.0% or 12 of them being unemployed.
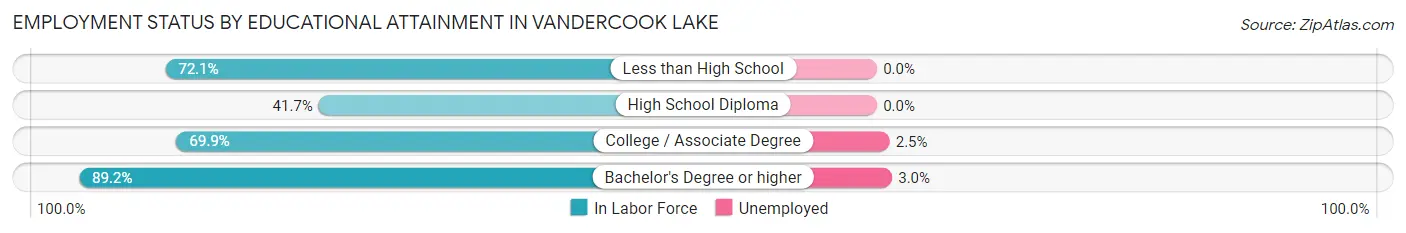
| Educational Attainment | In Labor Force | Unemployed |
| Less than High School | 62 (72.1%) | 0 (0.0%) |
| High School Diploma | 337 (41.7%) | 0 (0.0%) |
| College / Associate Degree | 670 (69.9%) | 24 (2.5%) |
| Bachelor's Degree or higher | 403 (89.2%) | 14 (3.0%) |
| Total | 1,473 (63.9%) | 46 (2.0%) |
Employment Occupations by Sex in Vandercook Lake
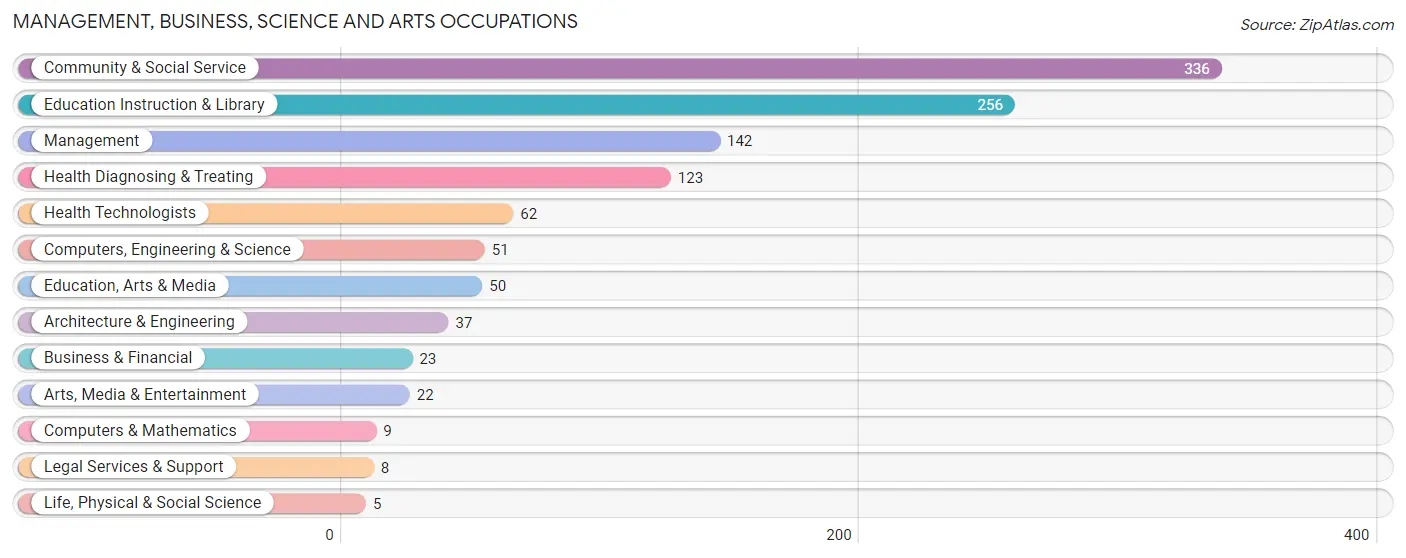
Management, Business, Science and Arts Occupations
The most common Management, Business, Science and Arts occupations in Vandercook Lake are Community & Social Service (336 | 17.5%), Education Instruction & Library (256 | 13.3%), Management (142 | 7.4%), Health Diagnosing & Treating (123 | 6.4%), and Health Technologists (62 | 3.2%).
Management, Business, Science and Arts Occupations by Sex
Within the Management, Business, Science and Arts occupations in Vandercook Lake, the most male-oriented occupations are Business & Financial (100.0%), Architecture & Engineering (100.0%), and Legal Services & Support (100.0%), while the most female-oriented occupations are Computers & Mathematics (100.0%), Life, Physical & Social Science (100.0%), and Education Instruction & Library (100.0%).
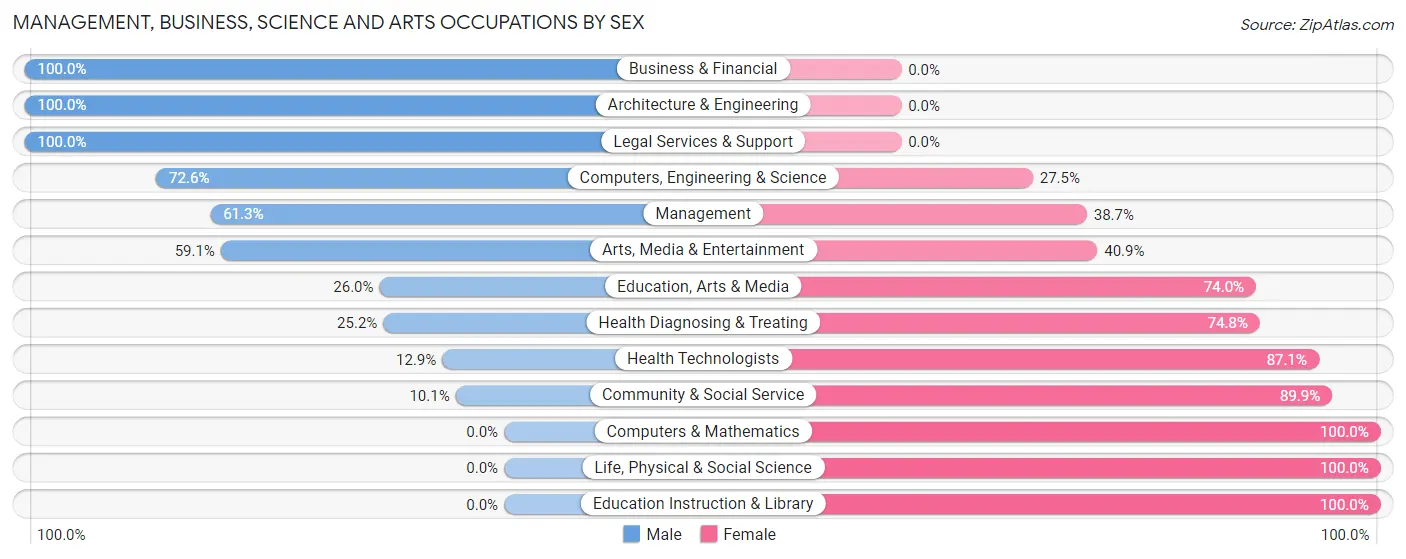
| Occupation | Male | Female |
| Management | 87 (61.3%) | 55 (38.7%) |
| Business & Financial | 23 (100.0%) | 0 (0.0%) |
| Computers, Engineering & Science | 37 (72.6%) | 14 (27.5%) |
| Computers & Mathematics | 0 (0.0%) | 9 (100.0%) |
| Architecture & Engineering | 37 (100.0%) | 0 (0.0%) |
| Life, Physical & Social Science | 0 (0.0%) | 5 (100.0%) |
| Community & Social Service | 34 (10.1%) | 302 (89.9%) |
| Education, Arts & Media | 13 (26.0%) | 37 (74.0%) |
| Legal Services & Support | 8 (100.0%) | 0 (0.0%) |
| Education Instruction & Library | 0 (0.0%) | 256 (100.0%) |
| Arts, Media & Entertainment | 13 (59.1%) | 9 (40.9%) |
| Health Diagnosing & Treating | 31 (25.2%) | 92 (74.8%) |
| Health Technologists | 8 (12.9%) | 54 (87.1%) |
| Total (Category) | 212 (31.4%) | 463 (68.6%) |
| Total (Overall) | 857 (44.6%) | 1,066 (55.4%) |
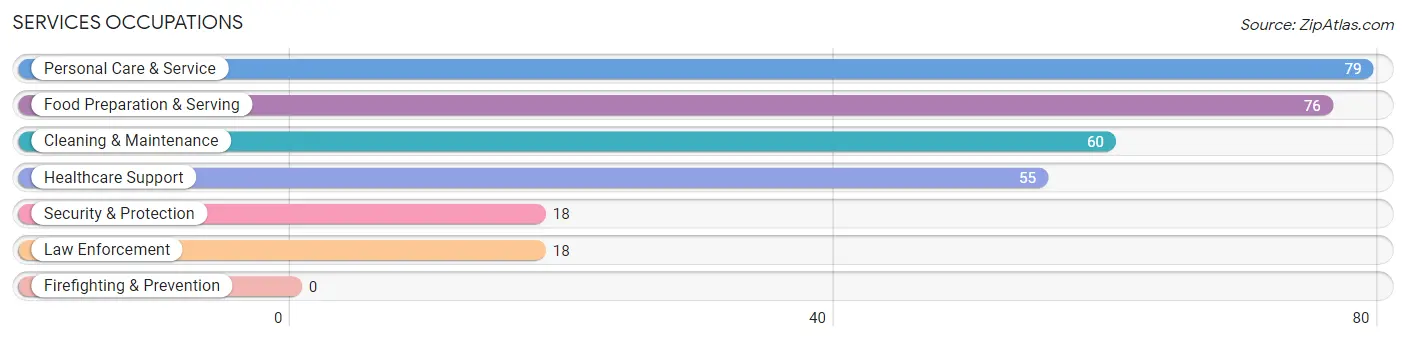
Services Occupations
The most common Services occupations in Vandercook Lake are Personal Care & Service (79 | 4.1%), Food Preparation & Serving (76 | 4.0%), Cleaning & Maintenance (60 | 3.1%), Healthcare Support (55 | 2.9%), and Security & Protection (18 | 0.9%).
Services Occupations by Sex
Within the Services occupations in Vandercook Lake, the most male-oriented occupations are Security & Protection (100.0%), Law Enforcement (100.0%), and Food Preparation & Serving (38.2%), while the most female-oriented occupations are Healthcare Support (100.0%), Personal Care & Service (100.0%), and Cleaning & Maintenance (85.0%).
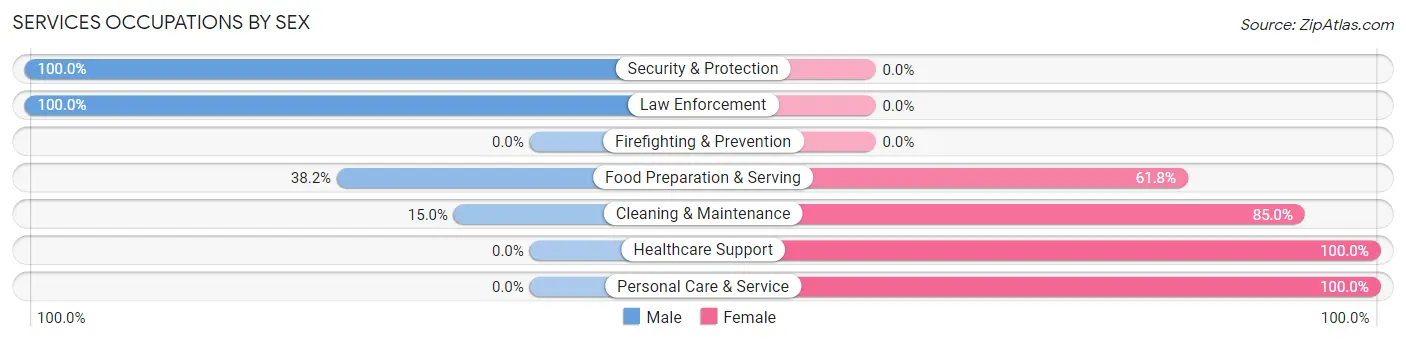
| Occupation | Male | Female |
| Healthcare Support | 0 (0.0%) | 55 (100.0%) |
| Security & Protection | 18 (100.0%) | 0 (0.0%) |
| Firefighting & Prevention | 0 (0.0%) | 0 (0.0%) |
| Law Enforcement | 18 (100.0%) | 0 (0.0%) |
| Food Preparation & Serving | 29 (38.2%) | 47 (61.8%) |
| Cleaning & Maintenance | 9 (15.0%) | 51 (85.0%) |
| Personal Care & Service | 0 (0.0%) | 79 (100.0%) |
| Total (Category) | 56 (19.4%) | 232 (80.6%) |
| Total (Overall) | 857 (44.6%) | 1,066 (55.4%) |
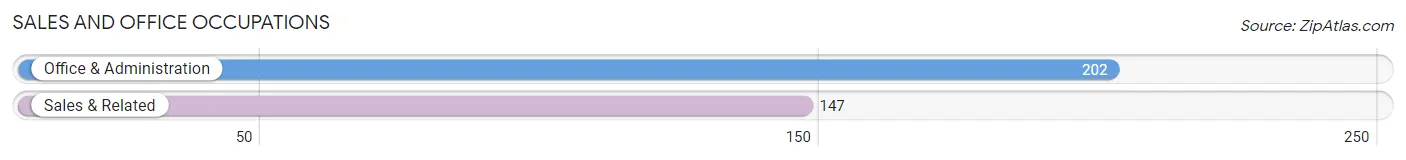
Sales and Office Occupations
The most common Sales and Office occupations in Vandercook Lake are Office & Administration (202 | 10.5%), and Sales & Related (147 | 7.6%).
Sales and Office Occupations by Sex
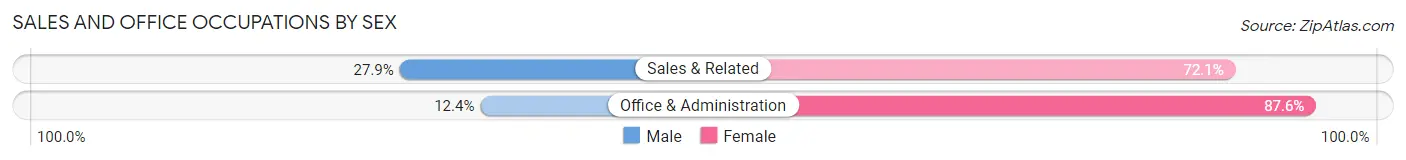
| Occupation | Male | Female |
| Sales & Related | 41 (27.9%) | 106 (72.1%) |
| Office & Administration | 25 (12.4%) | 177 (87.6%) |
| Total (Category) | 66 (18.9%) | 283 (81.1%) |
| Total (Overall) | 857 (44.6%) | 1,066 (55.4%) |
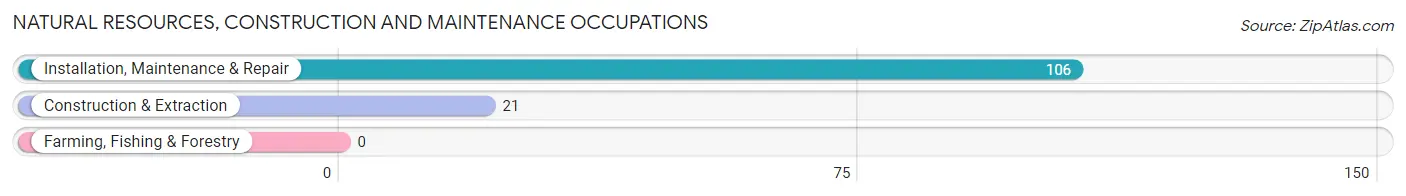
Natural Resources, Construction and Maintenance Occupations
The most common Natural Resources, Construction and Maintenance occupations in Vandercook Lake are Installation, Maintenance & Repair (106 | 5.5%), and Construction & Extraction (21 | 1.1%).
Natural Resources, Construction and Maintenance Occupations by Sex
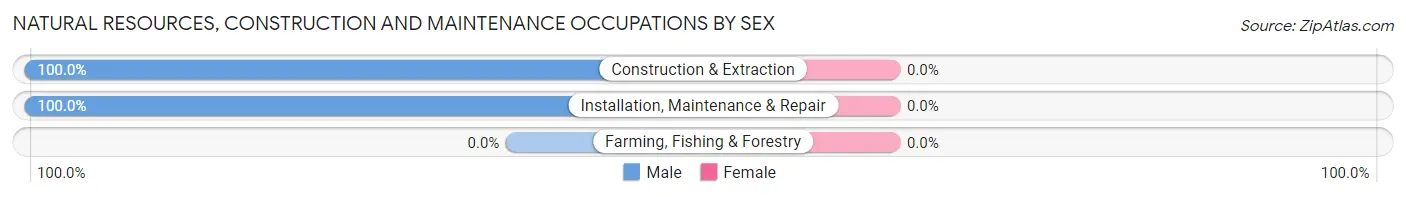
| Occupation | Male | Female |
| Farming, Fishing & Forestry | 0 (0.0%) | 0 (0.0%) |
| Construction & Extraction | 21 (100.0%) | 0 (0.0%) |
| Installation, Maintenance & Repair | 106 (100.0%) | 0 (0.0%) |
| Total (Category) | 127 (100.0%) | 0 (0.0%) |
| Total (Overall) | 857 (44.6%) | 1,066 (55.4%) |
Production, Transportation and Moving Occupations
The most common Production, Transportation and Moving occupations in Vandercook Lake are Production (250 | 13.0%), Material Moving (154 | 8.0%), and Transportation (80 | 4.2%).
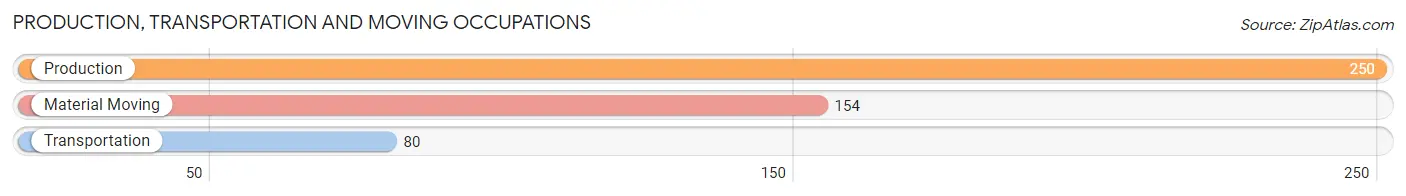
Production, Transportation and Moving Occupations by Sex
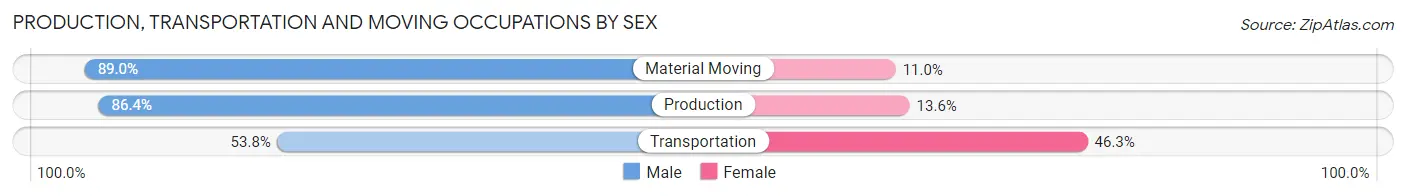
| Occupation | Male | Female |
| Production | 216 (86.4%) | 34 (13.6%) |
| Transportation | 43 (53.7%) | 37 (46.3%) |
| Material Moving | 137 (89.0%) | 17 (11.0%) |
| Total (Category) | 396 (81.8%) | 88 (18.2%) |
| Total (Overall) | 857 (44.6%) | 1,066 (55.4%) |
Employment Industries by Sex in Vandercook Lake
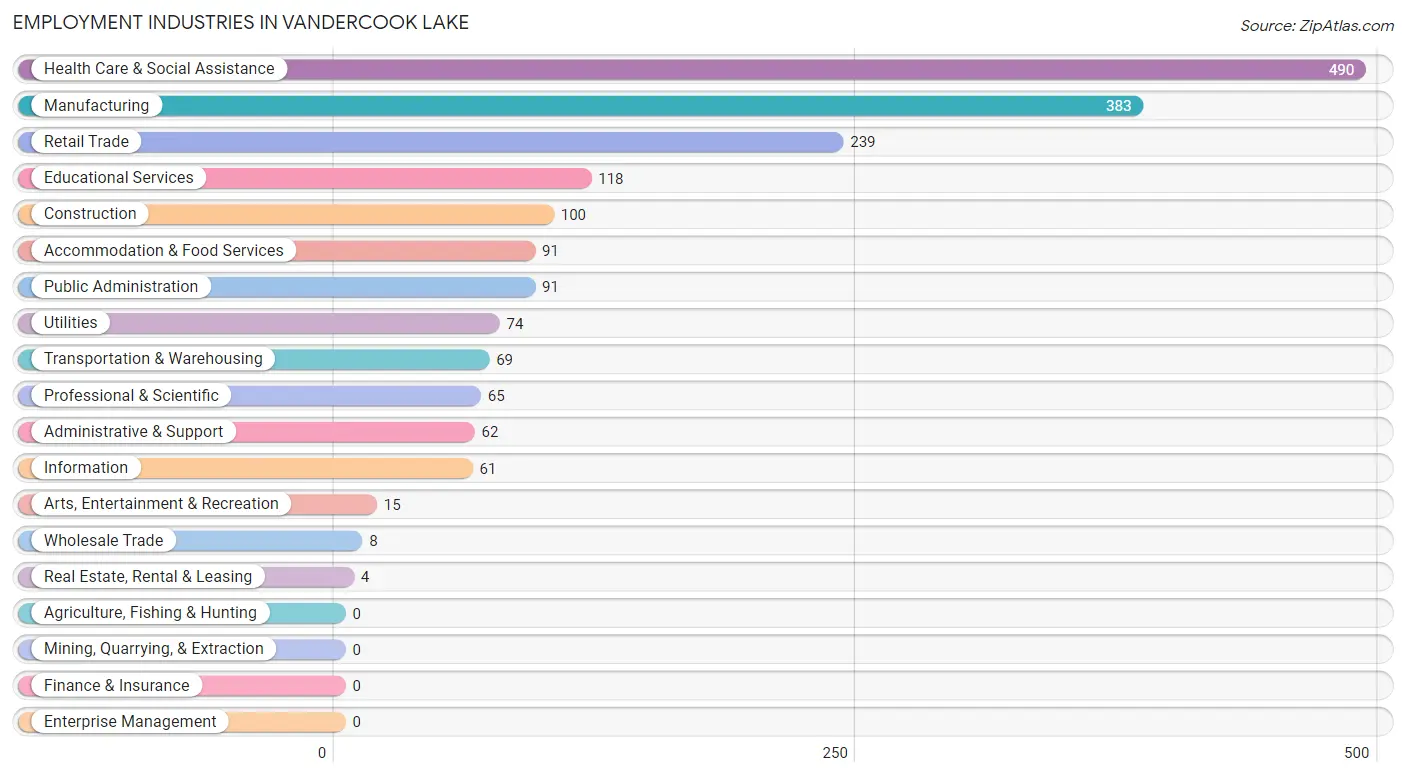
Employment Industries in Vandercook Lake
The major employment industries in Vandercook Lake include Health Care & Social Assistance (490 | 25.5%), Manufacturing (383 | 19.9%), Retail Trade (239 | 12.4%), Educational Services (118 | 6.1%), and Construction (100 | 5.2%).
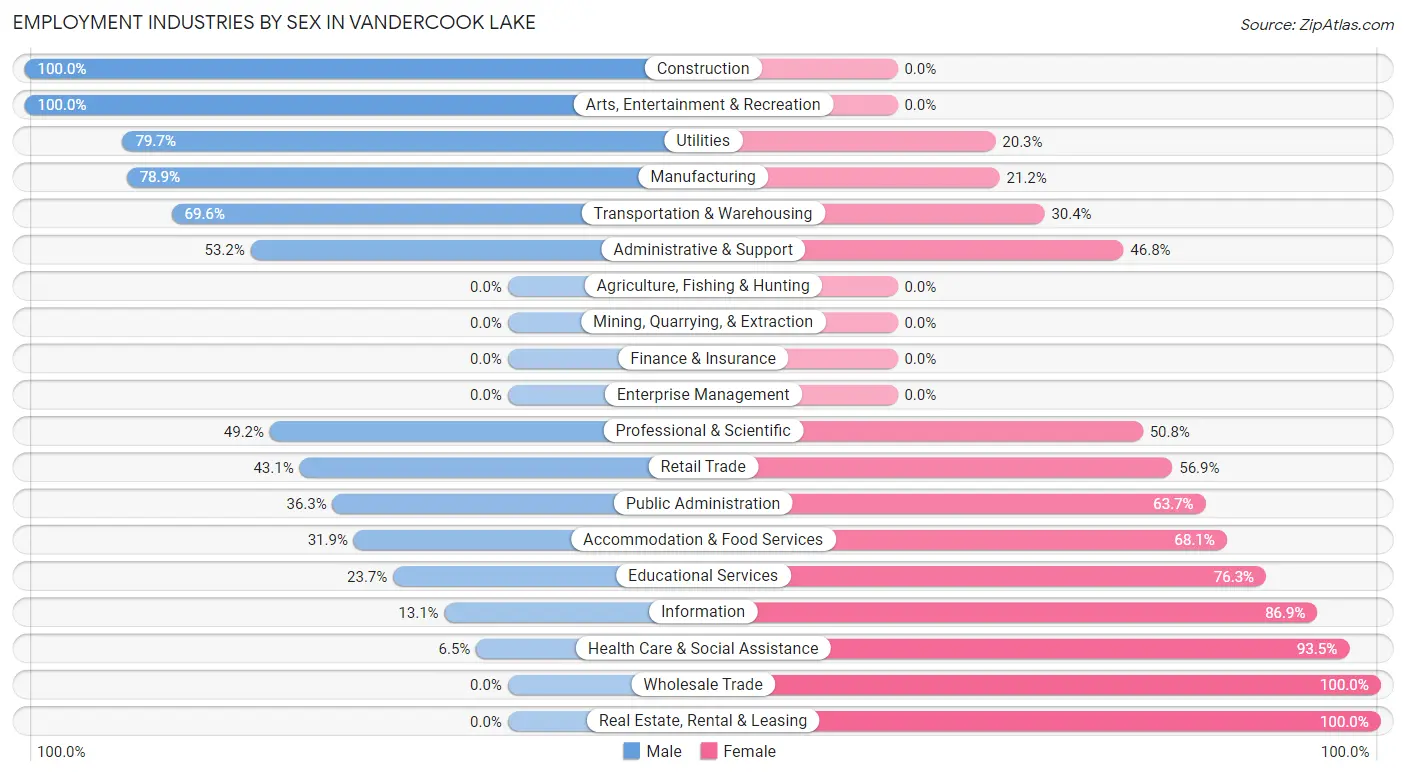
Employment Industries by Sex in Vandercook Lake
The Vandercook Lake industries that see more men than women are Construction (100.0%), Arts, Entertainment & Recreation (100.0%), and Utilities (79.7%), whereas the industries that tend to have a higher number of women are Wholesale Trade (100.0%), Real Estate, Rental & Leasing (100.0%), and Health Care & Social Assistance (93.5%).
| Industry | Male | Female |
| Agriculture, Fishing & Hunting | 0 (0.0%) | 0 (0.0%) |
| Mining, Quarrying, & Extraction | 0 (0.0%) | 0 (0.0%) |
| Construction | 100 (100.0%) | 0 (0.0%) |
| Manufacturing | 302 (78.8%) | 81 (21.1%) |
| Wholesale Trade | 0 (0.0%) | 8 (100.0%) |
| Retail Trade | 103 (43.1%) | 136 (56.9%) |
| Transportation & Warehousing | 48 (69.6%) | 21 (30.4%) |
| Utilities | 59 (79.7%) | 15 (20.3%) |
| Information | 8 (13.1%) | 53 (86.9%) |
| Finance & Insurance | 0 (0.0%) | 0 (0.0%) |
| Real Estate, Rental & Leasing | 0 (0.0%) | 4 (100.0%) |
| Professional & Scientific | 32 (49.2%) | 33 (50.8%) |
| Enterprise Management | 0 (0.0%) | 0 (0.0%) |
| Administrative & Support | 33 (53.2%) | 29 (46.8%) |
| Educational Services | 28 (23.7%) | 90 (76.3%) |
| Health Care & Social Assistance | 32 (6.5%) | 458 (93.5%) |
| Arts, Entertainment & Recreation | 15 (100.0%) | 0 (0.0%) |
| Accommodation & Food Services | 29 (31.9%) | 62 (68.1%) |
| Public Administration | 33 (36.3%) | 58 (63.7%) |
| Total | 857 (44.6%) | 1,066 (55.4%) |
Education in Vandercook Lake
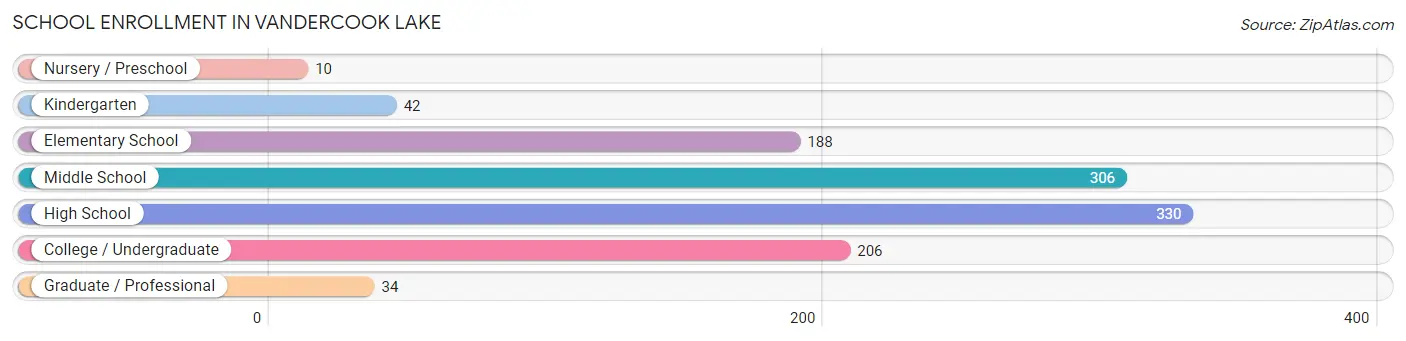
School Enrollment in Vandercook Lake
The most common levels of schooling among the 1,116 students in Vandercook Lake are high school (330 | 29.6%), middle school (306 | 27.4%), and college / undergraduate (206 | 18.5%).
| School Level | # Students | % Students |
| Nursery / Preschool | 10 | 0.9% |
| Kindergarten | 42 | 3.8% |
| Elementary School | 188 | 16.9% |
| Middle School | 306 | 27.4% |
| High School | 330 | 29.6% |
| College / Undergraduate | 206 | 18.5% |
| Graduate / Professional | 34 | 3.0% |
| Total | 1,116 | 100.0% |
School Enrollment by Age by Funding Source in Vandercook Lake
Out of a total of 1,116 students who are enrolled in schools in Vandercook Lake, 109 (9.8%) attend a private institution, while the remaining 1,007 (90.2%) are enrolled in public schools. The age group of 35 years and over has the highest likelihood of being enrolled in private schools, with 8 (25.0% in the age bracket) enrolled. Conversely, the age group of 3 to 4 year olds has the lowest likelihood of being enrolled in a private school, with 20 (100.0% in the age bracket) attending a public institution.
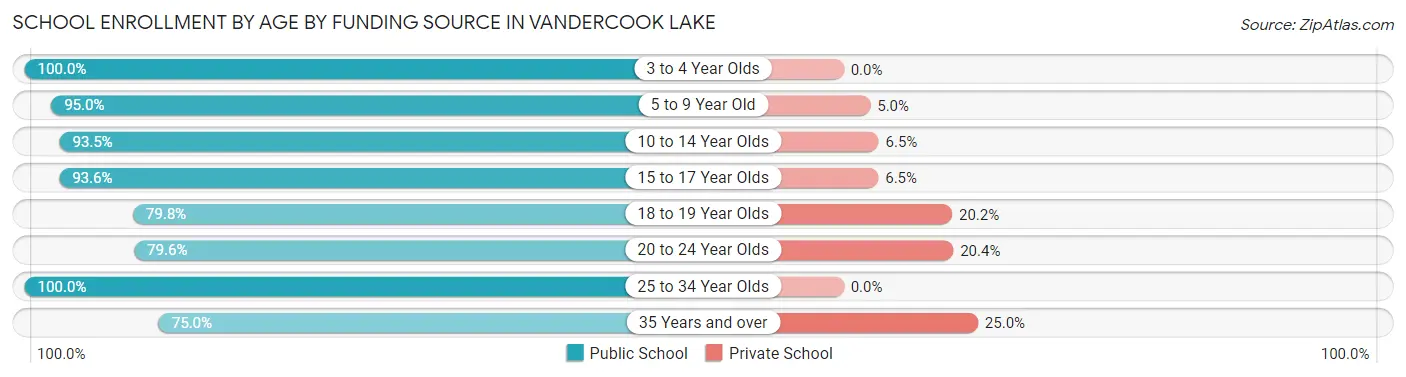
| Age Bracket | Public School | Private School |
| 3 to 4 Year Olds | 20 (100.0%) | 0 (0.0%) |
| 5 to 9 Year Old | 134 (95.0%) | 7 (5.0%) |
| 10 to 14 Year Olds | 345 (93.5%) | 24 (6.5%) |
| 15 to 17 Year Olds | 261 (93.5%) | 18 (6.5%) |
| 18 to 19 Year Olds | 87 (79.8%) | 22 (20.2%) |
| 20 to 24 Year Olds | 117 (79.6%) | 30 (20.4%) |
| 25 to 34 Year Olds | 19 (100.0%) | 0 (0.0%) |
| 35 Years and over | 24 (75.0%) | 8 (25.0%) |
| Total | 1,007 (90.2%) | 109 (9.8%) |
Educational Attainment by Field of Study in Vandercook Lake
Education (102 | 15.7%), business (96 | 14.8%), arts & humanities (84 | 13.0%), science & technology (73 | 11.3%), and physical & health sciences (51 | 7.9%) are the most common fields of study among 648 individuals in Vandercook Lake who have obtained a bachelor's degree or higher.
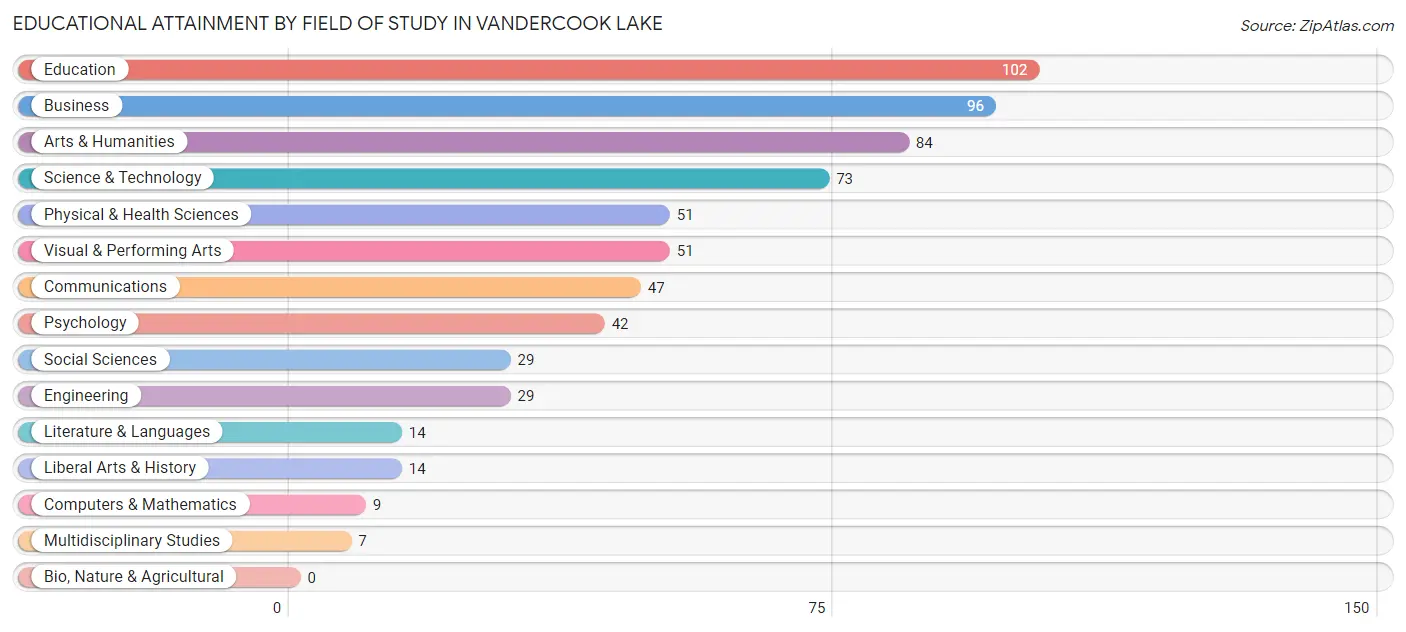
| Field of Study | # Graduates | % Graduates |
| Computers & Mathematics | 9 | 1.4% |
| Bio, Nature & Agricultural | 0 | 0.0% |
| Physical & Health Sciences | 51 | 7.9% |
| Psychology | 42 | 6.5% |
| Social Sciences | 29 | 4.5% |
| Engineering | 29 | 4.5% |
| Multidisciplinary Studies | 7 | 1.1% |
| Science & Technology | 73 | 11.3% |
| Business | 96 | 14.8% |
| Education | 102 | 15.7% |
| Literature & Languages | 14 | 2.2% |
| Liberal Arts & History | 14 | 2.2% |
| Visual & Performing Arts | 51 | 7.9% |
| Communications | 47 | 7.2% |
| Arts & Humanities | 84 | 13.0% |
| Total | 648 | 100.0% |
Transportation & Commute in Vandercook Lake
Vehicle Availability by Sex in Vandercook Lake
The most prevalent vehicle ownership categories in Vandercook Lake are males with 2 vehicles (326, accounting for 38.3%) and females with 2 vehicles (428, making up 31.1%).
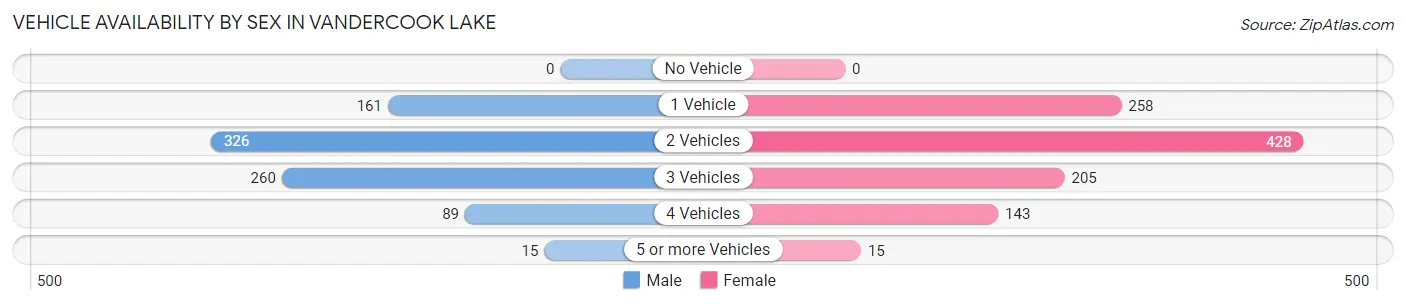
| Vehicles Available | Male | Female |
| No Vehicle | 0 (0.0%) | 0 (0.0%) |
| 1 Vehicle | 161 (18.9%) | 258 (24.6%) |
| 2 Vehicles | 326 (38.3%) | 428 (40.8%) |
| 3 Vehicles | 260 (30.5%) | 205 (19.5%) |
| 4 Vehicles | 89 (10.5%) | 143 (13.6%) |
| 5 or more Vehicles | 15 (1.8%) | 15 (1.4%) |
| Total | 851 (100.0%) | 1,049 (100.0%) |
Commute Time in Vandercook Lake
The most frequently occuring commute durations in Vandercook Lake are 15 to 19 minutes (435 commuters, 23.6%), 5 to 9 minutes (310 commuters, 16.8%), and 10 to 14 minutes (300 commuters, 16.3%).
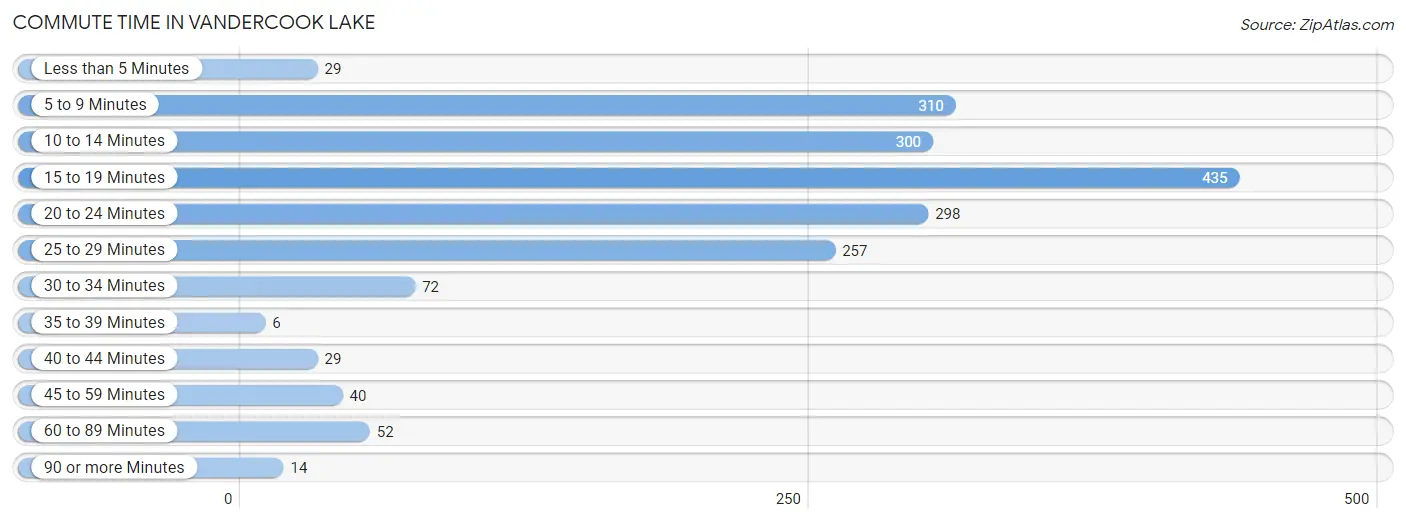
| Commute Time | # Commuters | % Commuters |
| Less than 5 Minutes | 29 | 1.6% |
| 5 to 9 Minutes | 310 | 16.8% |
| 10 to 14 Minutes | 300 | 16.3% |
| 15 to 19 Minutes | 435 | 23.6% |
| 20 to 24 Minutes | 298 | 16.2% |
| 25 to 29 Minutes | 257 | 14.0% |
| 30 to 34 Minutes | 72 | 3.9% |
| 35 to 39 Minutes | 6 | 0.3% |
| 40 to 44 Minutes | 29 | 1.6% |
| 45 to 59 Minutes | 40 | 2.2% |
| 60 to 89 Minutes | 52 | 2.8% |
| 90 or more Minutes | 14 | 0.8% |
Commute Time by Sex in Vandercook Lake
The most common commute times in Vandercook Lake are 15 to 19 minutes (190 commuters, 23.2%) for males and 15 to 19 minutes (245 commuters, 23.9%) for females.
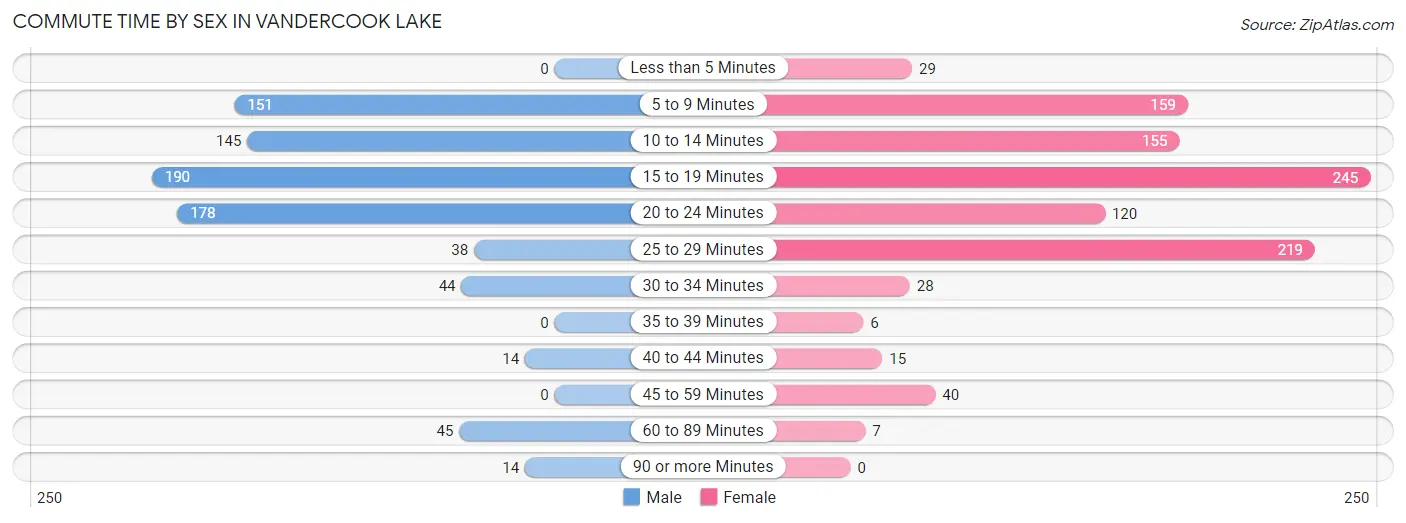
| Commute Time | Male | Female |
| Less than 5 Minutes | 0 (0.0%) | 29 (2.8%) |
| 5 to 9 Minutes | 151 (18.4%) | 159 (15.5%) |
| 10 to 14 Minutes | 145 (17.7%) | 155 (15.1%) |
| 15 to 19 Minutes | 190 (23.2%) | 245 (23.9%) |
| 20 to 24 Minutes | 178 (21.7%) | 120 (11.7%) |
| 25 to 29 Minutes | 38 (4.6%) | 219 (21.4%) |
| 30 to 34 Minutes | 44 (5.4%) | 28 (2.7%) |
| 35 to 39 Minutes | 0 (0.0%) | 6 (0.6%) |
| 40 to 44 Minutes | 14 (1.7%) | 15 (1.5%) |
| 45 to 59 Minutes | 0 (0.0%) | 40 (3.9%) |
| 60 to 89 Minutes | 45 (5.5%) | 7 (0.7%) |
| 90 or more Minutes | 14 (1.7%) | 0 (0.0%) |
Time of Departure to Work by Sex in Vandercook Lake
The most frequent times of departure to work in Vandercook Lake are 7:00 AM to 7:29 AM (118, 14.4%) for males and 6:30 AM to 6:59 AM (225, 22.0%) for females.
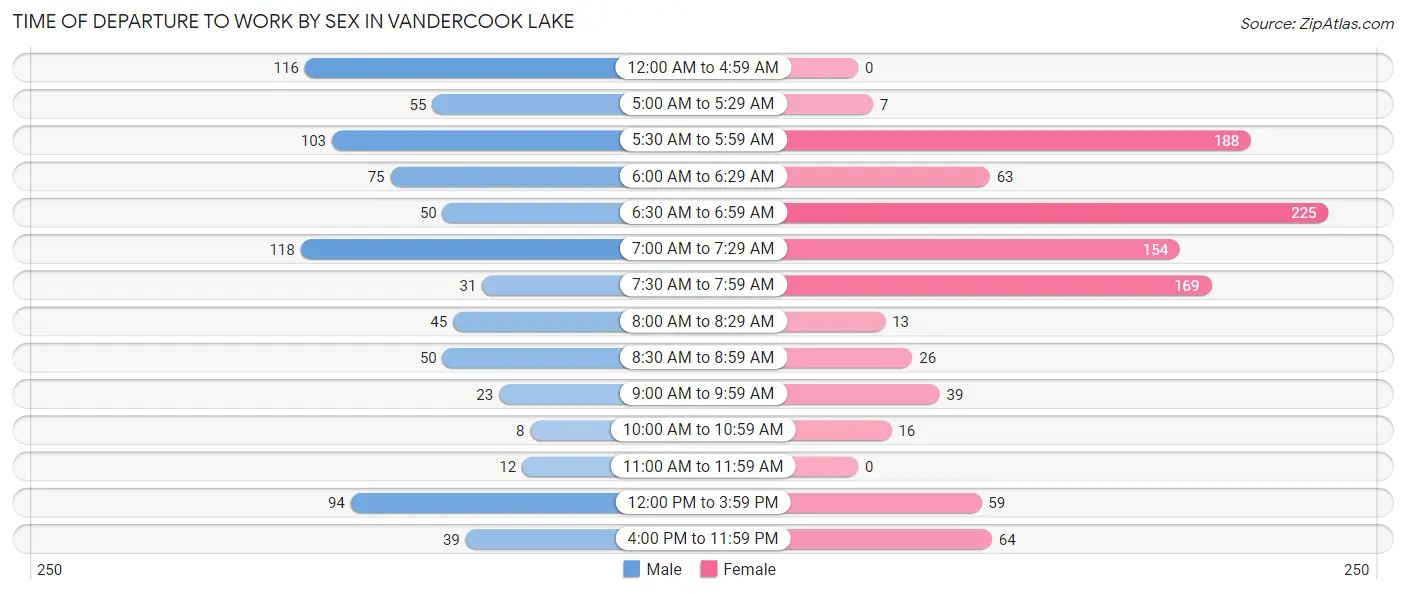
| Time of Departure | Male | Female |
| 12:00 AM to 4:59 AM | 116 (14.2%) | 0 (0.0%) |
| 5:00 AM to 5:29 AM | 55 (6.7%) | 7 (0.7%) |
| 5:30 AM to 5:59 AM | 103 (12.6%) | 188 (18.4%) |
| 6:00 AM to 6:29 AM | 75 (9.2%) | 63 (6.2%) |
| 6:30 AM to 6:59 AM | 50 (6.1%) | 225 (22.0%) |
| 7:00 AM to 7:29 AM | 118 (14.4%) | 154 (15.0%) |
| 7:30 AM to 7:59 AM | 31 (3.8%) | 169 (16.5%) |
| 8:00 AM to 8:29 AM | 45 (5.5%) | 13 (1.3%) |
| 8:30 AM to 8:59 AM | 50 (6.1%) | 26 (2.5%) |
| 9:00 AM to 9:59 AM | 23 (2.8%) | 39 (3.8%) |
| 10:00 AM to 10:59 AM | 8 (1.0%) | 16 (1.6%) |
| 11:00 AM to 11:59 AM | 12 (1.5%) | 0 (0.0%) |
| 12:00 PM to 3:59 PM | 94 (11.5%) | 59 (5.8%) |
| 4:00 PM to 11:59 PM | 39 (4.8%) | 64 (6.3%) |
| Total | 819 (100.0%) | 1,023 (100.0%) |
Housing Occupancy in Vandercook Lake
Occupancy by Ownership in Vandercook Lake
Of the total 1,913 dwellings in Vandercook Lake, owner-occupied units account for 1,744 (91.2%), while renter-occupied units make up 169 (8.8%).
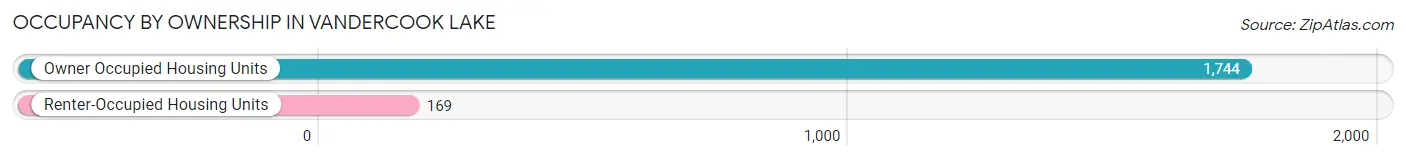
| Occupancy | # Housing Units | % Housing Units |
| Owner Occupied Housing Units | 1,744 | 91.2% |
| Renter-Occupied Housing Units | 169 | 8.8% |
| Total Occupied Housing Units | 1,913 | 100.0% |
Occupancy by Household Size in Vandercook Lake
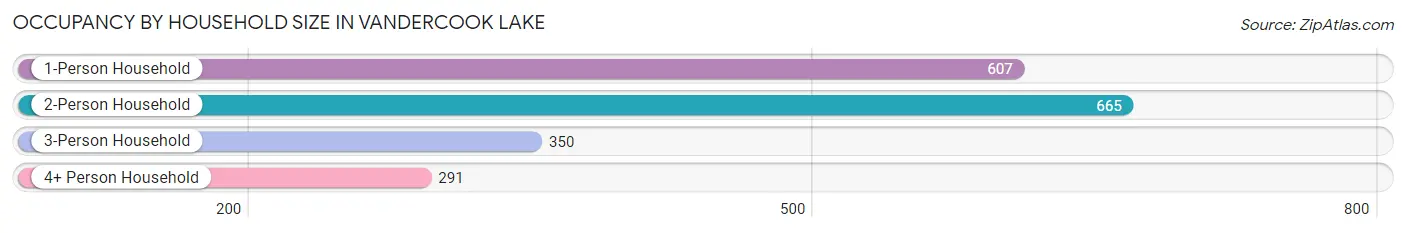
| Household Size | # Housing Units | % Housing Units |
| 1-Person Household | 607 | 31.7% |
| 2-Person Household | 665 | 34.8% |
| 3-Person Household | 350 | 18.3% |
| 4+ Person Household | 291 | 15.2% |
| Total Housing Units | 1,913 | 100.0% |
Occupancy by Ownership by Household Size in Vandercook Lake
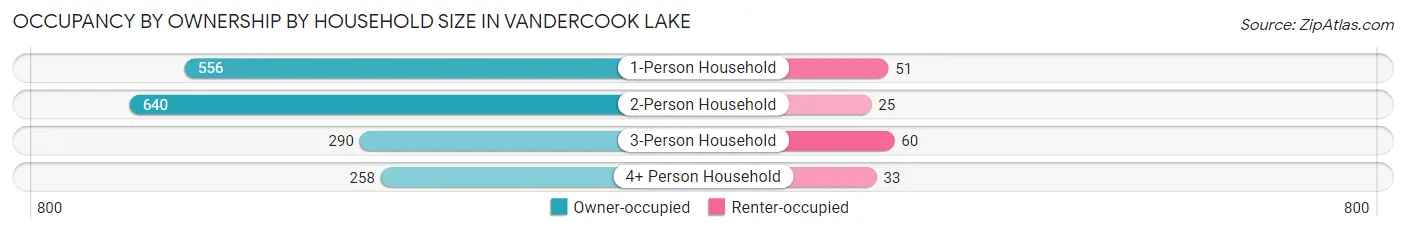
| Household Size | Owner-occupied | Renter-occupied |
| 1-Person Household | 556 (91.6%) | 51 (8.4%) |
| 2-Person Household | 640 (96.2%) | 25 (3.8%) |
| 3-Person Household | 290 (82.9%) | 60 (17.1%) |
| 4+ Person Household | 258 (88.7%) | 33 (11.3%) |
| Total Housing Units | 1,744 (91.2%) | 169 (8.8%) |
Occupancy by Educational Attainment in Vandercook Lake
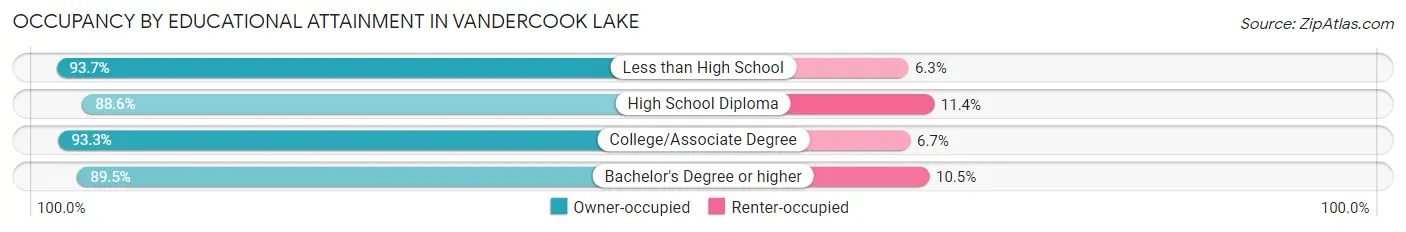
| Household Size | Owner-occupied | Renter-occupied |
| Less than High School | 89 (93.7%) | 6 (6.3%) |
| High School Diploma | 503 (88.6%) | 65 (11.4%) |
| College/Associate Degree | 819 (93.3%) | 59 (6.7%) |
| Bachelor's Degree or higher | 333 (89.5%) | 39 (10.5%) |
Occupancy by Age of Householder in Vandercook Lake
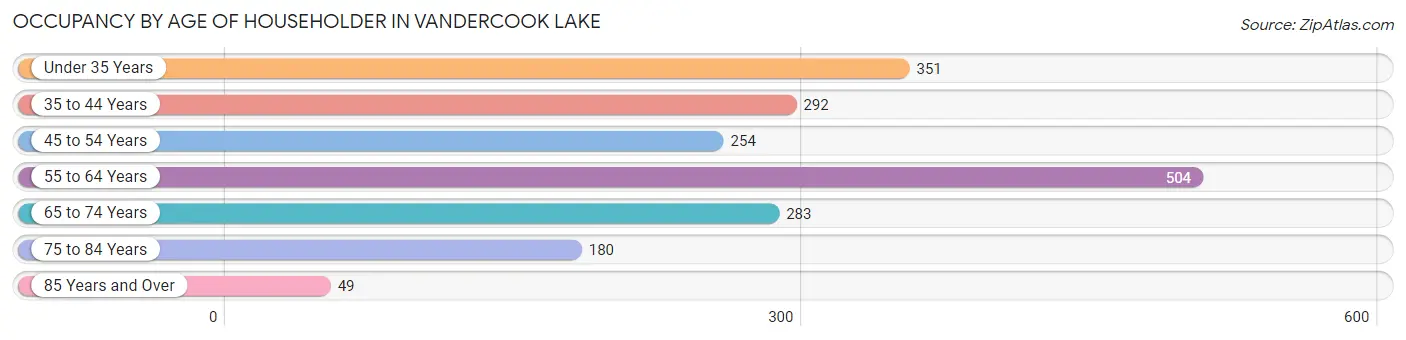
| Age Bracket | # Households | % Households |
| Under 35 Years | 351 | 18.3% |
| 35 to 44 Years | 292 | 15.3% |
| 45 to 54 Years | 254 | 13.3% |
| 55 to 64 Years | 504 | 26.4% |
| 65 to 74 Years | 283 | 14.8% |
| 75 to 84 Years | 180 | 9.4% |
| 85 Years and Over | 49 | 2.6% |
| Total | 1,913 | 100.0% |
Housing Finances in Vandercook Lake
Median Income by Occupancy in Vandercook Lake
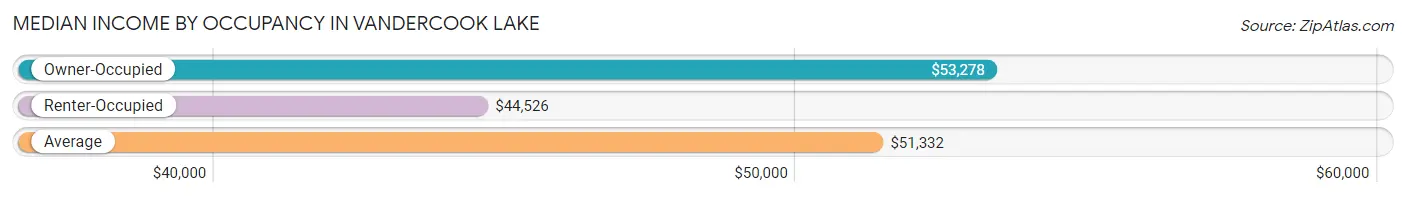
| Occupancy Type | # Households | Median Income |
| Owner-Occupied | 1,744 (91.2%) | $53,278 |
| Renter-Occupied | 169 (8.8%) | $44,526 |
| Average | 1,913 (100.0%) | $51,332 |
Occupancy by Householder Income Bracket in Vandercook Lake
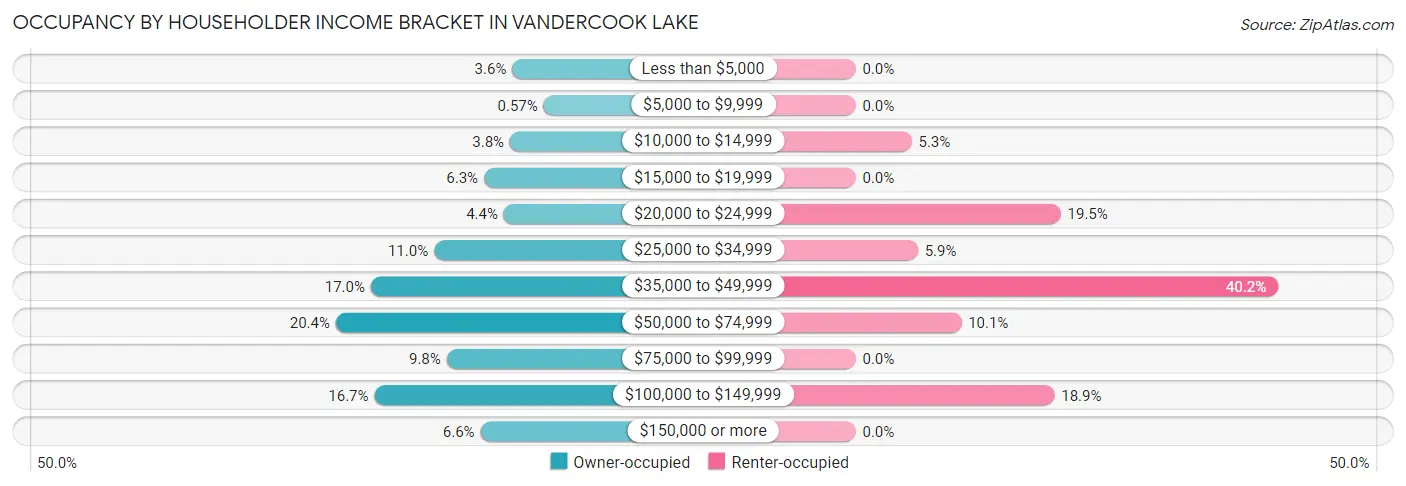
| Income Bracket | Owner-occupied | Renter-occupied |
| Less than $5,000 | 62 (3.6%) | 0 (0.0%) |
| $5,000 to $9,999 | 10 (0.6%) | 0 (0.0%) |
| $10,000 to $14,999 | 66 (3.8%) | 9 (5.3%) |
| $15,000 to $19,999 | 109 (6.2%) | 0 (0.0%) |
| $20,000 to $24,999 | 76 (4.4%) | 33 (19.5%) |
| $25,000 to $34,999 | 192 (11.0%) | 10 (5.9%) |
| $35,000 to $49,999 | 297 (17.0%) | 68 (40.2%) |
| $50,000 to $74,999 | 355 (20.4%) | 17 (10.1%) |
| $75,000 to $99,999 | 171 (9.8%) | 0 (0.0%) |
| $100,000 to $149,999 | 291 (16.7%) | 32 (18.9%) |
| $150,000 or more | 115 (6.6%) | 0 (0.0%) |
| Total | 1,744 (100.0%) | 169 (100.0%) |
Monthly Housing Cost Tiers in Vandercook Lake
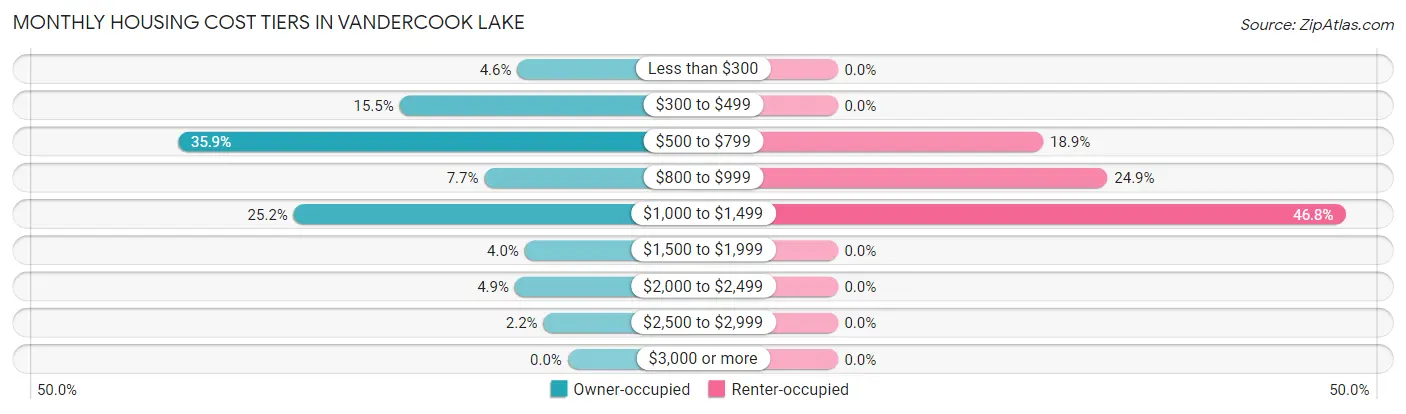
| Monthly Cost | Owner-occupied | Renter-occupied |
| Less than $300 | 81 (4.6%) | 0 (0.0%) |
| $300 to $499 | 270 (15.5%) | 0 (0.0%) |
| $500 to $799 | 626 (35.9%) | 32 (18.9%) |
| $800 to $999 | 134 (7.7%) | 42 (24.8%) |
| $1,000 to $1,499 | 440 (25.2%) | 79 (46.8%) |
| $1,500 to $1,999 | 69 (4.0%) | 0 (0.0%) |
| $2,000 to $2,499 | 85 (4.9%) | 0 (0.0%) |
| $2,500 to $2,999 | 39 (2.2%) | 0 (0.0%) |
| $3,000 or more | 0 (0.0%) | 0 (0.0%) |
| Total | 1,744 (100.0%) | 169 (100.0%) |
Physical Housing Characteristics in Vandercook Lake
Housing Structures in Vandercook Lake
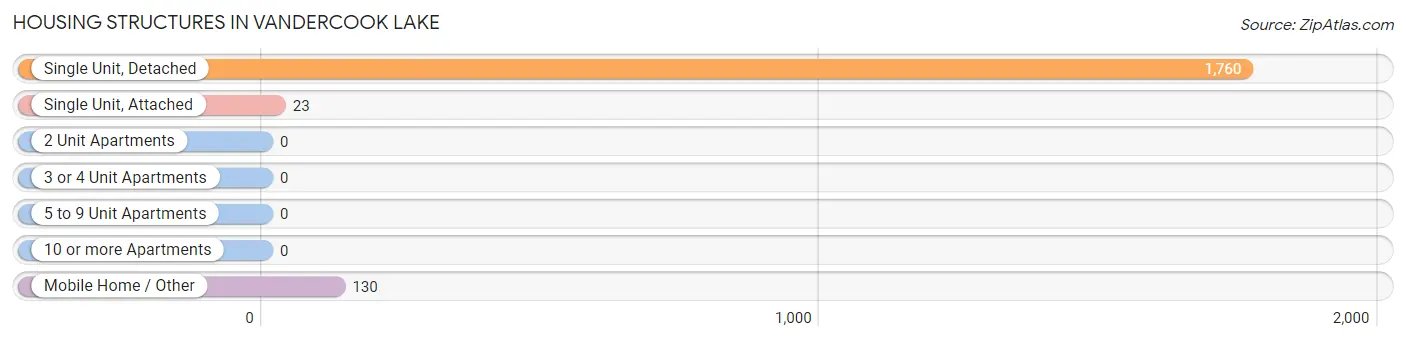
| Structure Type | # Housing Units | % Housing Units |
| Single Unit, Detached | 1,760 | 92.0% |
| Single Unit, Attached | 23 | 1.2% |
| 2 Unit Apartments | 0 | 0.0% |
| 3 or 4 Unit Apartments | 0 | 0.0% |
| 5 to 9 Unit Apartments | 0 | 0.0% |
| 10 or more Apartments | 0 | 0.0% |
| Mobile Home / Other | 130 | 6.8% |
| Total | 1,913 | 100.0% |
Housing Structures by Occupancy in Vandercook Lake
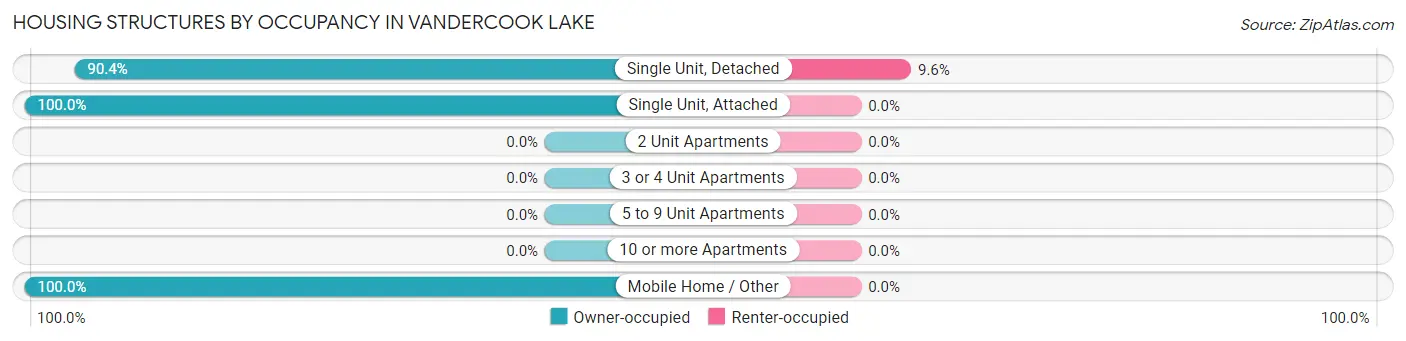
| Structure Type | Owner-occupied | Renter-occupied |
| Single Unit, Detached | 1,591 (90.4%) | 169 (9.6%) |
| Single Unit, Attached | 23 (100.0%) | 0 (0.0%) |
| 2 Unit Apartments | 0 (0.0%) | 0 (0.0%) |
| 3 or 4 Unit Apartments | 0 (0.0%) | 0 (0.0%) |
| 5 to 9 Unit Apartments | 0 (0.0%) | 0 (0.0%) |
| 10 or more Apartments | 0 (0.0%) | 0 (0.0%) |
| Mobile Home / Other | 130 (100.0%) | 0 (0.0%) |
| Total | 1,744 (91.2%) | 169 (8.8%) |
Housing Structures by Number of Rooms in Vandercook Lake
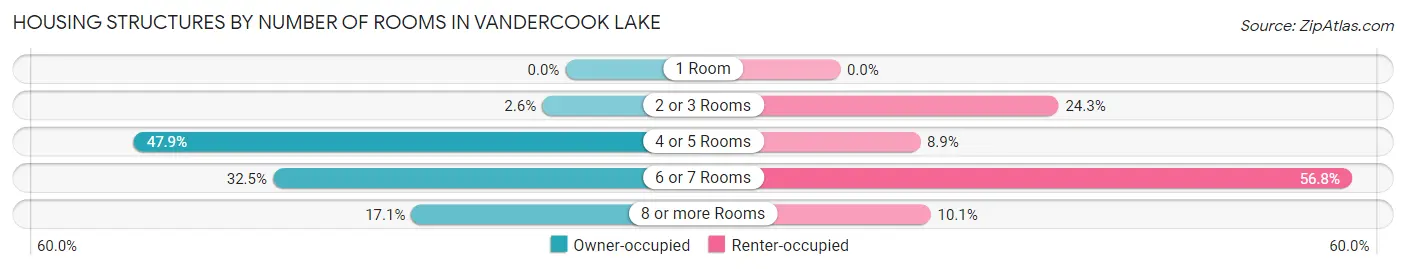
| Number of Rooms | Owner-occupied | Renter-occupied |
| 1 Room | 0 (0.0%) | 0 (0.0%) |
| 2 or 3 Rooms | 45 (2.6%) | 41 (24.3%) |
| 4 or 5 Rooms | 835 (47.9%) | 15 (8.9%) |
| 6 or 7 Rooms | 566 (32.5%) | 96 (56.8%) |
| 8 or more Rooms | 298 (17.1%) | 17 (10.1%) |
| Total | 1,744 (100.0%) | 169 (100.0%) |
Housing Structure by Heating Type in Vandercook Lake
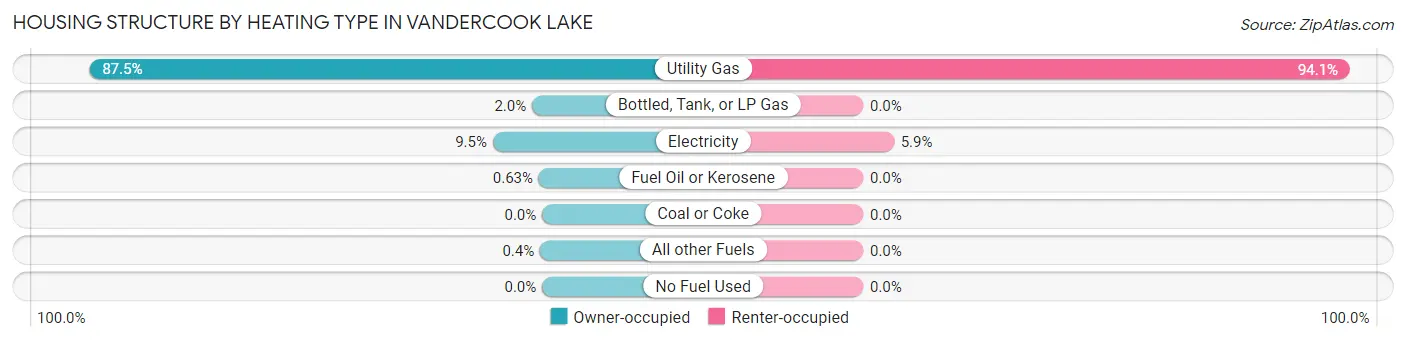
| Heating Type | Owner-occupied | Renter-occupied |
| Utility Gas | 1,526 (87.5%) | 159 (94.1%) |
| Bottled, Tank, or LP Gas | 34 (1.9%) | 0 (0.0%) |
| Electricity | 166 (9.5%) | 10 (5.9%) |
| Fuel Oil or Kerosene | 11 (0.6%) | 0 (0.0%) |
| Coal or Coke | 0 (0.0%) | 0 (0.0%) |
| All other Fuels | 7 (0.4%) | 0 (0.0%) |
| No Fuel Used | 0 (0.0%) | 0 (0.0%) |
| Total | 1,744 (100.0%) | 169 (100.0%) |
Household Vehicle Usage in Vandercook Lake
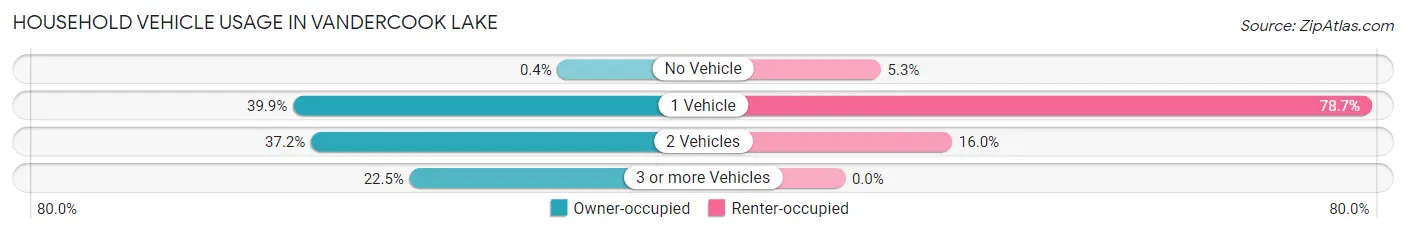
| Vehicles per Household | Owner-occupied | Renter-occupied |
| No Vehicle | 7 (0.4%) | 9 (5.3%) |
| 1 Vehicle | 696 (39.9%) | 133 (78.7%) |
| 2 Vehicles | 649 (37.2%) | 27 (16.0%) |
| 3 or more Vehicles | 392 (22.5%) | 0 (0.0%) |
| Total | 1,744 (100.0%) | 169 (100.0%) |
Real Estate & Mortgages in Vandercook Lake
Real Estate and Mortgage Overview in Vandercook Lake
| Characteristic | Without Mortgage | With Mortgage |
| Housing Units | 852 | 892 |
| Median Property Value | $109,000 | $140,800 |
| Median Household Income | $38,663 | $74 |
| Monthly Housing Costs | $528 | $0 |
| Real Estate Taxes | $1,884 | $46 |
Property Value by Mortgage Status in Vandercook Lake
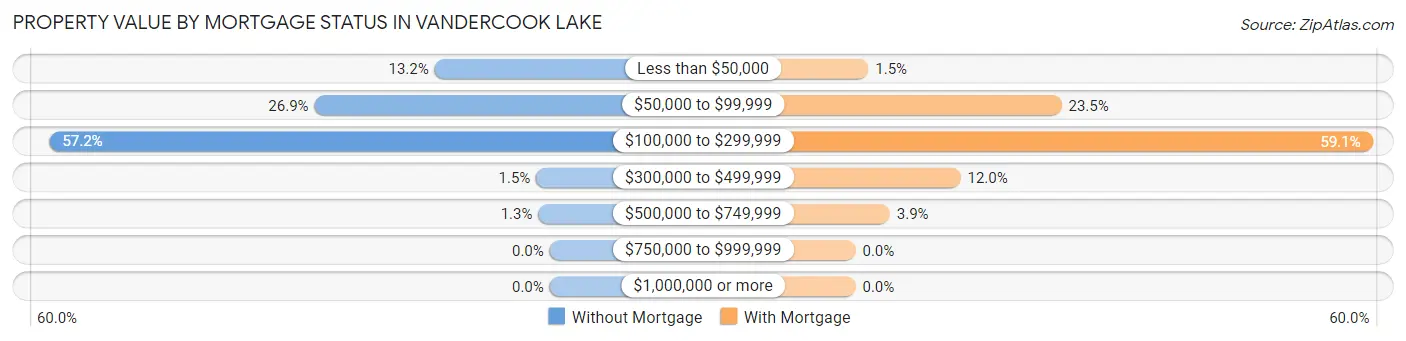
| Property Value | Without Mortgage | With Mortgage |
| Less than $50,000 | 112 (13.2%) | 13 (1.5%) |
| $50,000 to $99,999 | 229 (26.9%) | 210 (23.5%) |
| $100,000 to $299,999 | 487 (57.2%) | 527 (59.1%) |
| $300,000 to $499,999 | 13 (1.5%) | 107 (12.0%) |
| $500,000 to $749,999 | 11 (1.3%) | 35 (3.9%) |
| $750,000 to $999,999 | 0 (0.0%) | 0 (0.0%) |
| $1,000,000 or more | 0 (0.0%) | 0 (0.0%) |
| Total | 852 (100.0%) | 892 (100.0%) |
Household Income by Mortgage Status in Vandercook Lake
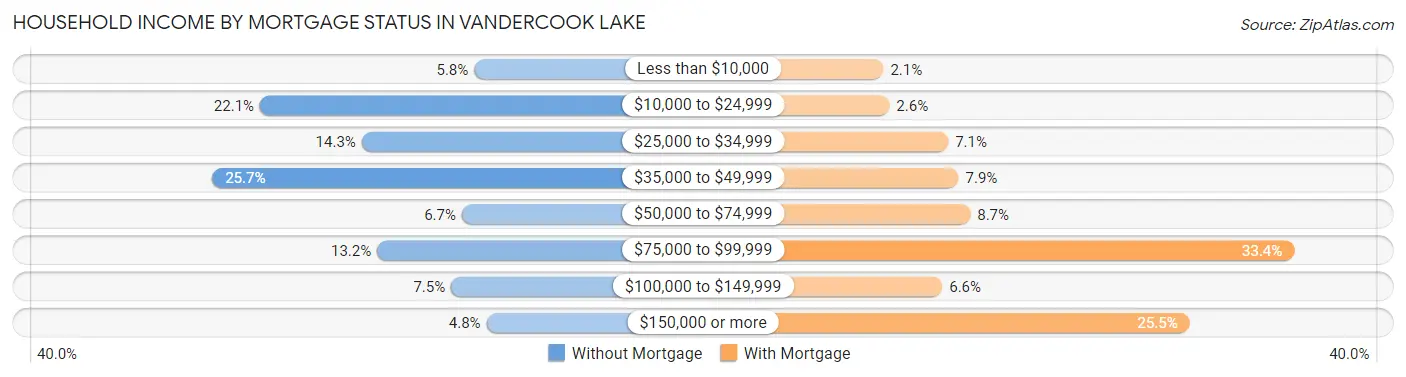
| Household Income | Without Mortgage | With Mortgage |
| Less than $10,000 | 49 (5.8%) | 19 (2.1%) |
| $10,000 to $24,999 | 188 (22.1%) | 23 (2.6%) |
| $25,000 to $34,999 | 122 (14.3%) | 63 (7.1%) |
| $35,000 to $49,999 | 219 (25.7%) | 70 (7.9%) |
| $50,000 to $74,999 | 57 (6.7%) | 78 (8.7%) |
| $75,000 to $99,999 | 112 (13.2%) | 298 (33.4%) |
| $100,000 to $149,999 | 64 (7.5%) | 59 (6.6%) |
| $150,000 or more | 41 (4.8%) | 227 (25.5%) |
| Total | 852 (100.0%) | 892 (100.0%) |
Property Value to Household Income Ratio in Vandercook Lake
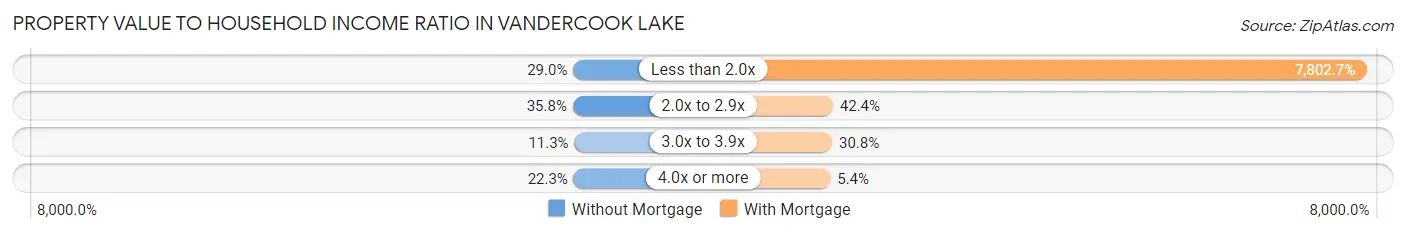
| Value-to-Income Ratio | Without Mortgage | With Mortgage |
| Less than 2.0x | 247 (29.0%) | 69,600 (7,802.7%) |
| 2.0x to 2.9x | 305 (35.8%) | 378 (42.4%) |
| 3.0x to 3.9x | 96 (11.3%) | 275 (30.8%) |
| 4.0x or more | 190 (22.3%) | 48 (5.4%) |
| Total | 852 (100.0%) | 892 (100.0%) |
Real Estate Taxes by Mortgage Status in Vandercook Lake
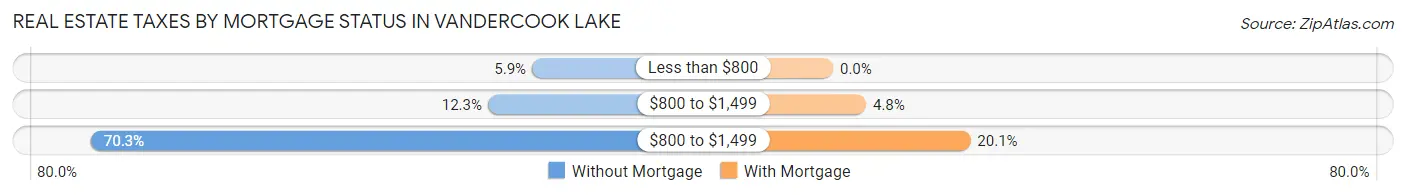
| Property Taxes | Without Mortgage | With Mortgage |
| Less than $800 | 50 (5.9%) | 0 (0.0%) |
| $800 to $1,499 | 105 (12.3%) | 43 (4.8%) |
| $800 to $1,499 | 599 (70.3%) | 179 (20.1%) |
| Total | 852 (100.0%) | 892 (100.0%) |
Health & Disability in Vandercook Lake
Health Insurance Coverage by Age in Vandercook Lake
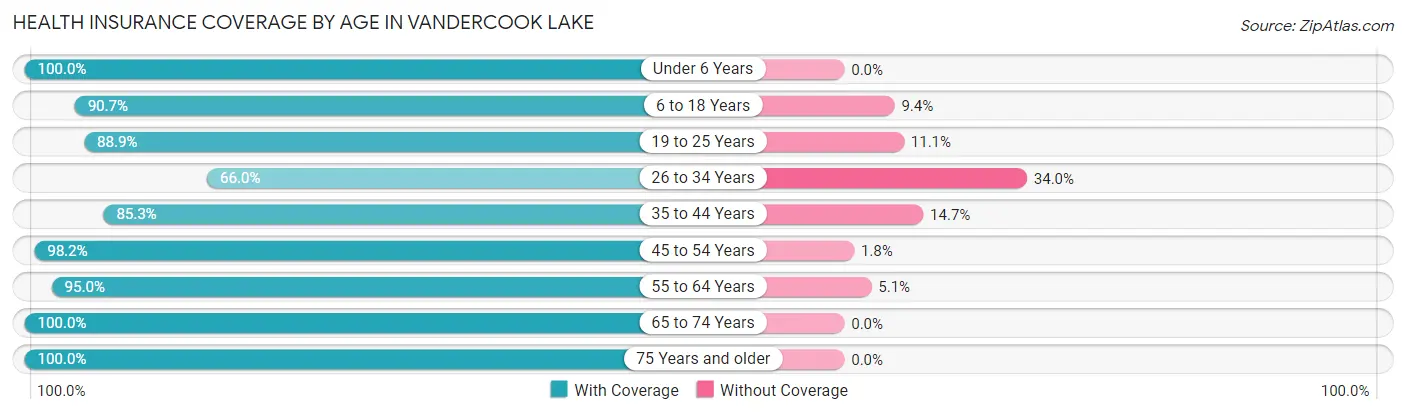
| Age Bracket | With Coverage | Without Coverage |
| Under 6 Years | 201 (100.0%) | 0 (0.0%) |
| 6 to 18 Years | 814 (90.6%) | 84 (9.3%) |
| 19 to 25 Years | 368 (88.9%) | 46 (11.1%) |
| 26 to 34 Years | 374 (66.0%) | 193 (34.0%) |
| 35 to 44 Years | 435 (85.3%) | 75 (14.7%) |
| 45 to 54 Years | 435 (98.2%) | 8 (1.8%) |
| 55 to 64 Years | 734 (95.0%) | 39 (5.1%) |
| 65 to 74 Years | 420 (100.0%) | 0 (0.0%) |
| 75 Years and older | 409 (100.0%) | 0 (0.0%) |
| Total | 4,190 (90.4%) | 445 (9.6%) |
Health Insurance Coverage by Citizenship Status in Vandercook Lake
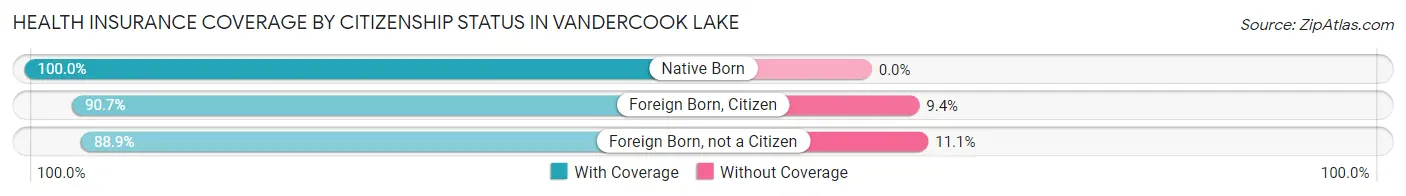
| Citizenship Status | With Coverage | Without Coverage |
| Native Born | 201 (100.0%) | 0 (0.0%) |
| Foreign Born, Citizen | 814 (90.6%) | 84 (9.3%) |
| Foreign Born, not a Citizen | 368 (88.9%) | 46 (11.1%) |
Health Insurance Coverage by Household Income in Vandercook Lake
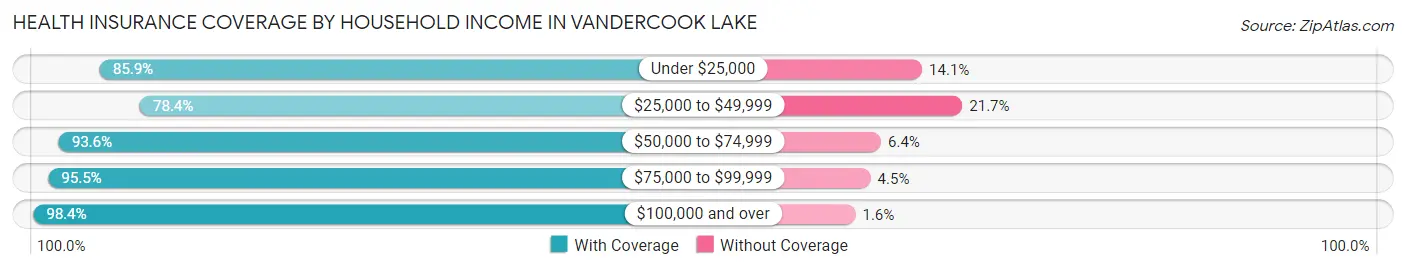
| Household Income | With Coverage | Without Coverage |
| Under $25,000 | 584 (85.9%) | 96 (14.1%) |
| $25,000 to $49,999 | 905 (78.3%) | 250 (21.6%) |
| $50,000 to $74,999 | 729 (93.6%) | 50 (6.4%) |
| $75,000 to $99,999 | 534 (95.5%) | 25 (4.5%) |
| $100,000 and over | 1,438 (98.4%) | 24 (1.6%) |
Public vs Private Health Insurance Coverage by Age in Vandercook Lake
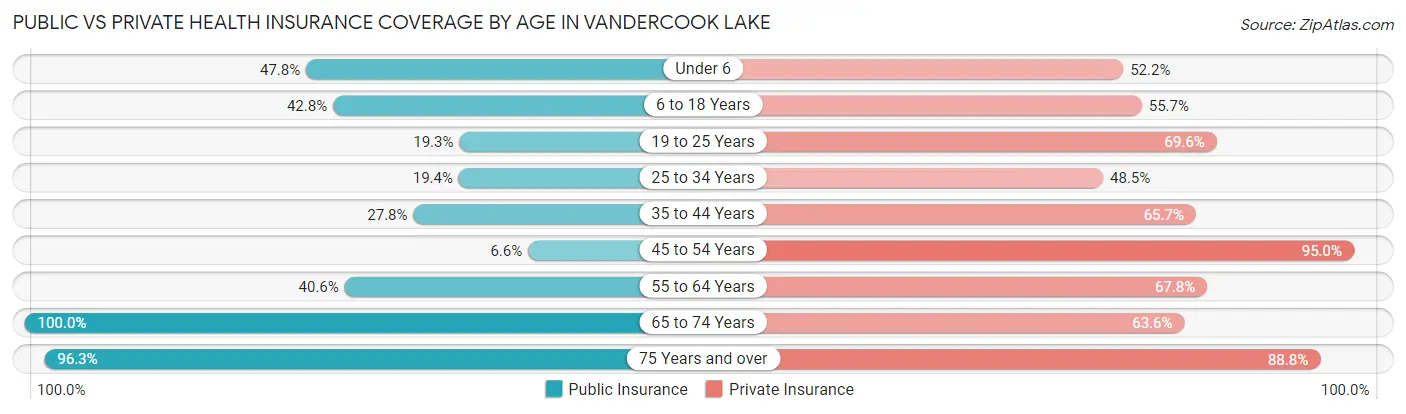
| Age Bracket | Public Insurance | Private Insurance |
| Under 6 | 96 (47.8%) | 105 (52.2%) |
| 6 to 18 Years | 384 (42.8%) | 500 (55.7%) |
| 19 to 25 Years | 80 (19.3%) | 288 (69.6%) |
| 25 to 34 Years | 110 (19.4%) | 275 (48.5%) |
| 35 to 44 Years | 142 (27.8%) | 335 (65.7%) |
| 45 to 54 Years | 29 (6.6%) | 421 (95.0%) |
| 55 to 64 Years | 314 (40.6%) | 524 (67.8%) |
| 65 to 74 Years | 420 (100.0%) | 267 (63.6%) |
| 75 Years and over | 394 (96.3%) | 363 (88.7%) |
| Total | 1,969 (42.5%) | 3,078 (66.4%) |
Disability Status by Sex by Age in Vandercook Lake
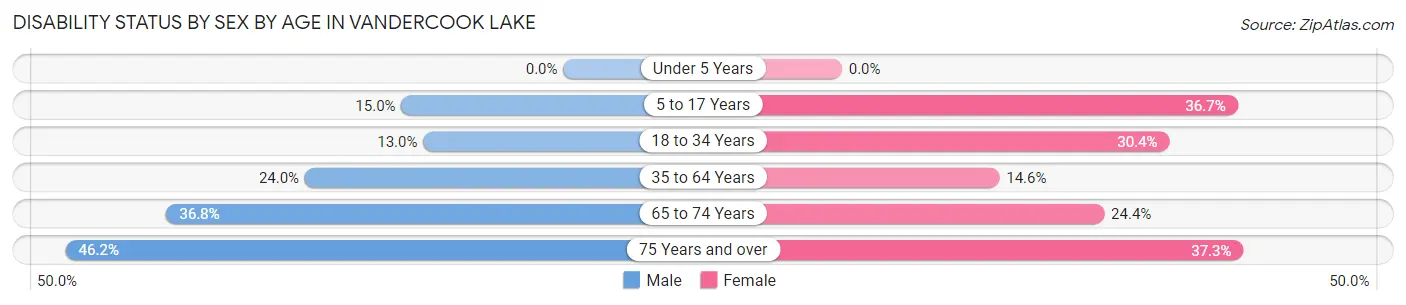
| Age Bracket | Male | Female |
| Under 5 Years | 0 (0.0%) | 0 (0.0%) |
| 5 to 17 Years | 84 (15.0%) | 94 (36.7%) |
| 18 to 34 Years | 75 (13.0%) | 152 (30.4%) |
| 35 to 64 Years | 176 (24.0%) | 145 (14.6%) |
| 65 to 74 Years | 70 (36.8%) | 56 (24.3%) |
| 75 Years and over | 91 (46.2%) | 79 (37.3%) |
Disability Class by Sex by Age in Vandercook Lake
Disability Class: Hearing Difficulty
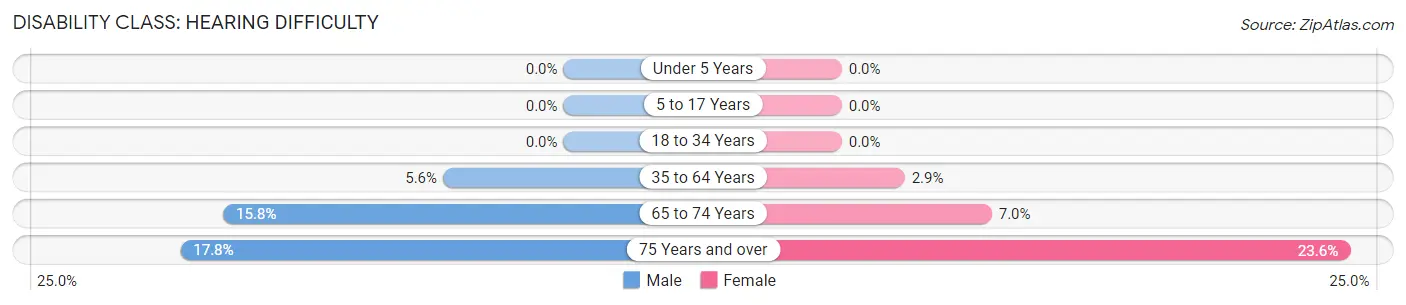
| Age Bracket | Male | Female |
| Under 5 Years | 0 (0.0%) | 0 (0.0%) |
| 5 to 17 Years | 0 (0.0%) | 0 (0.0%) |
| 18 to 34 Years | 0 (0.0%) | 0 (0.0%) |
| 35 to 64 Years | 41 (5.6%) | 29 (2.9%) |
| 65 to 74 Years | 30 (15.8%) | 16 (7.0%) |
| 75 Years and over | 35 (17.8%) | 50 (23.6%) |
Disability Class: Vision Difficulty
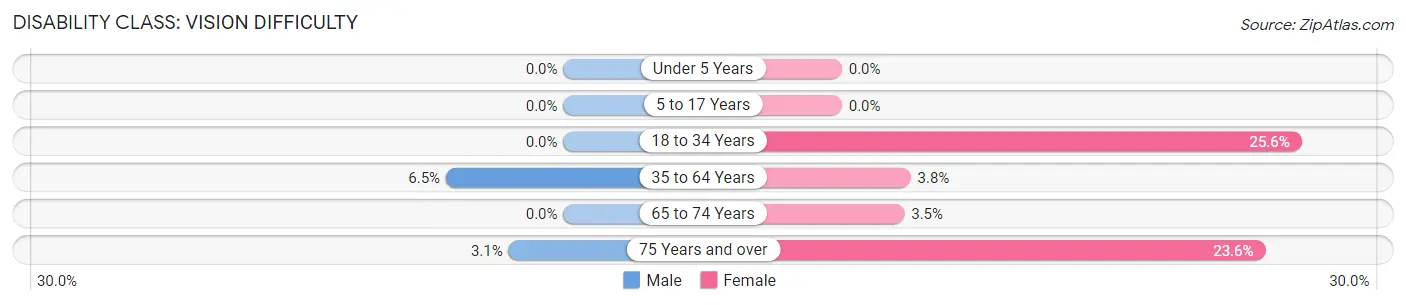
| Age Bracket | Male | Female |
| Under 5 Years | 0 (0.0%) | 0 (0.0%) |
| 5 to 17 Years | 0 (0.0%) | 0 (0.0%) |
| 18 to 34 Years | 0 (0.0%) | 128 (25.6%) |
| 35 to 64 Years | 48 (6.5%) | 38 (3.8%) |
| 65 to 74 Years | 0 (0.0%) | 8 (3.5%) |
| 75 Years and over | 6 (3.0%) | 50 (23.6%) |
Disability Class: Cognitive Difficulty
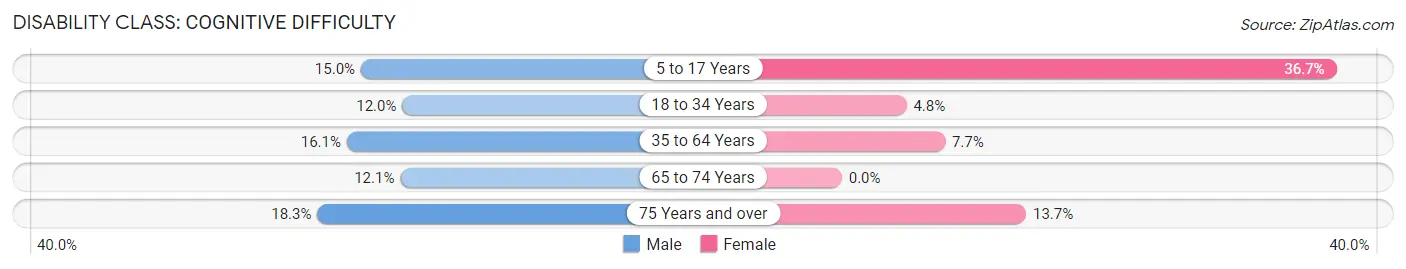
| Age Bracket | Male | Female |
| 5 to 17 Years | 84 (15.0%) | 94 (36.7%) |
| 18 to 34 Years | 69 (12.0%) | 24 (4.8%) |
| 35 to 64 Years | 118 (16.1%) | 76 (7.7%) |
| 65 to 74 Years | 23 (12.1%) | 0 (0.0%) |
| 75 Years and over | 36 (18.3%) | 29 (13.7%) |
Disability Class: Ambulatory Difficulty
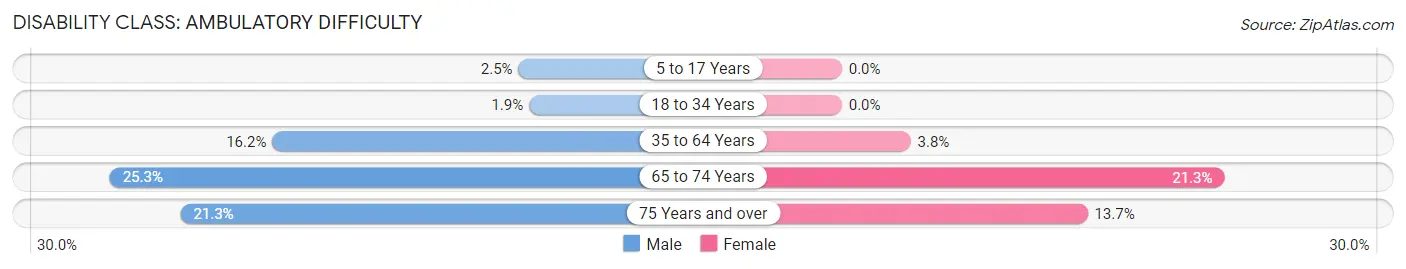
| Age Bracket | Male | Female |
| 5 to 17 Years | 14 (2.5%) | 0 (0.0%) |
| 18 to 34 Years | 11 (1.9%) | 0 (0.0%) |
| 35 to 64 Years | 119 (16.2%) | 38 (3.8%) |
| 65 to 74 Years | 48 (25.3%) | 49 (21.3%) |
| 75 Years and over | 42 (21.3%) | 29 (13.7%) |
Disability Class: Self-Care Difficulty
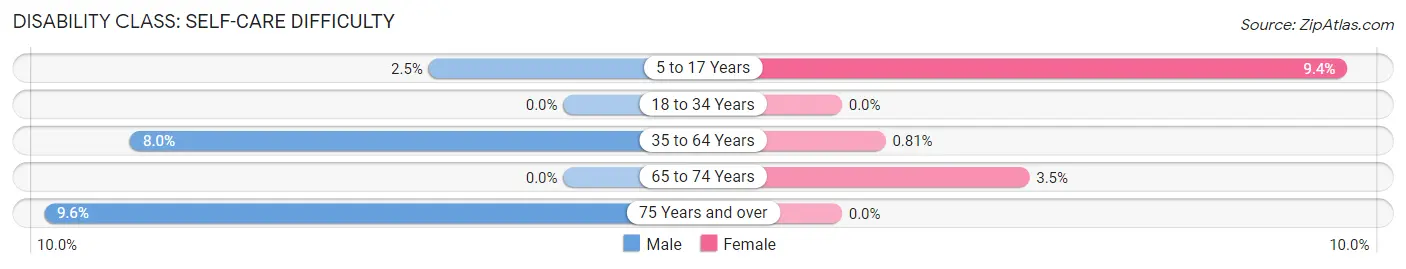
| Age Bracket | Male | Female |
| 5 to 17 Years | 14 (2.5%) | 24 (9.4%) |
| 18 to 34 Years | 0 (0.0%) | 0 (0.0%) |
| 35 to 64 Years | 59 (8.0%) | 8 (0.8%) |
| 65 to 74 Years | 0 (0.0%) | 8 (3.5%) |
| 75 Years and over | 19 (9.6%) | 0 (0.0%) |
Technology Access in Vandercook Lake
Computing Device Access in Vandercook Lake
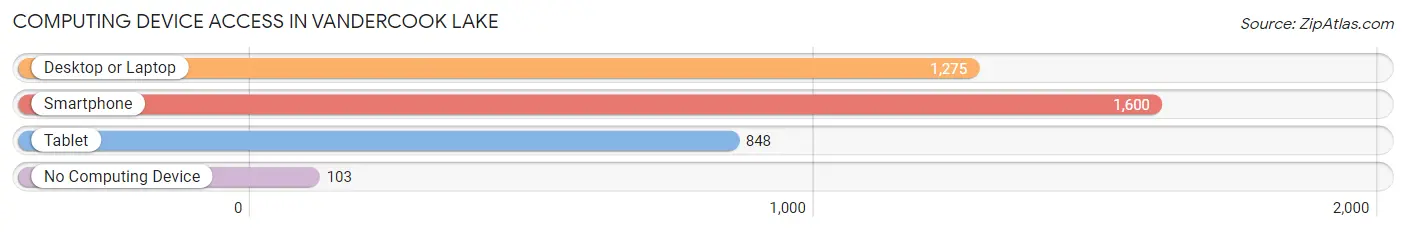
| Device Type | # Households | % Households |
| Desktop or Laptop | 1,275 | 66.6% |
| Smartphone | 1,600 | 83.6% |
| Tablet | 848 | 44.3% |
| No Computing Device | 103 | 5.4% |
| Total | 1,913 | 100.0% |
Internet Access in Vandercook Lake
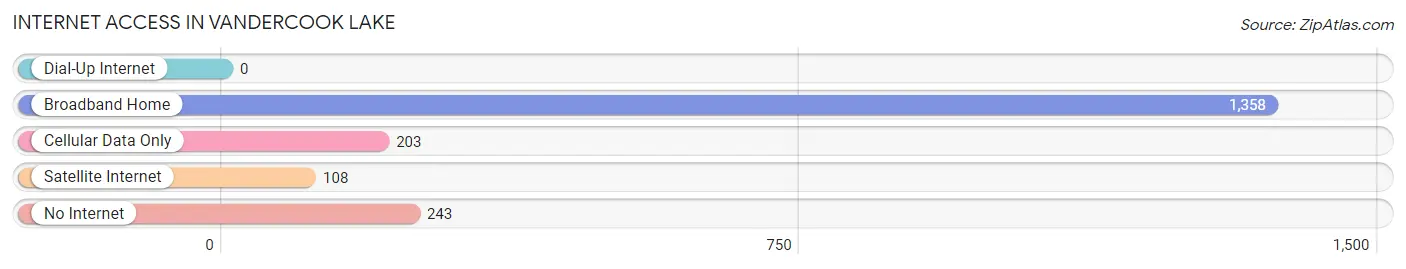
| Internet Type | # Households | % Households |
| Dial-Up Internet | 0 | 0.0% |
| Broadband Home | 1,358 | 71.0% |
| Cellular Data Only | 203 | 10.6% |
| Satellite Internet | 108 | 5.7% |
| No Internet | 243 | 12.7% |
| Total | 1,913 | 100.0% |
Vandercook Lake Summary
Vandercook Lake is a small unincorporated community located in Jackson County, Michigan. It is situated on the western shore of Vandercook Lake, a small lake of approximately 1,000 acres. The community is located approximately 10 miles south of the city of Jackson and is part of the Jackson Metropolitan Statistical Area.
History
The area around Vandercook Lake was first settled in the early 1800s by settlers from New York and New England. The first settlers were primarily farmers and loggers, and the area was known as Vandercook Lake Township. The township was officially organized in 1837 and was named after the lake.
In the late 1800s, the area began to develop as a resort destination. The lake was a popular spot for fishing and boating, and several resorts were built along the shore. The resorts attracted visitors from all over the Midwest, and the area became known as a popular summer destination.
In the early 1900s, the area began to develop as a residential community. Several small businesses were established, including a general store, a post office, and a school. The community was also home to a number of churches, including the Vandercook Lake Methodist Church, which was established in 1908.
Geography
Vandercook Lake is located in Jackson County, Michigan. It is situated on the western shore of Vandercook Lake, a small lake of approximately 1,000 acres. The lake is surrounded by rolling hills and is fed by several small streams. The area is mostly rural, with a few small towns and villages scattered throughout the area.
The climate in Vandercook Lake is typical of the Midwest, with hot summers and cold winters. The average temperature in the summer is around 75 degrees Fahrenheit, and the average temperature in the winter is around 25 degrees Fahrenheit.
Economy
The economy of Vandercook Lake is largely based on tourism and agriculture. The area is home to several small businesses, including a general store, a post office, and a school. The area is also home to several resorts, which attract visitors from all over the Midwest.
Agriculture is also an important part of the local economy. The area is home to several farms, which produce a variety of crops, including corn, soybeans, and wheat.
Demographics
As of the 2010 census, the population of Vandercook Lake was 1,845. The population is primarily white, with a small percentage of African Americans and Hispanics. The median household income is $45,000, and the median home value is $150,000.
Conclusion
Vandercook Lake is a small unincorporated community located in Jackson County, Michigan. It is situated on the western shore of Vandercook Lake, a small lake of approximately 1,000 acres. The area was first settled in the early 1800s by settlers from New York and New England, and the area has since developed as a resort destination and residential community. The economy of Vandercook Lake is largely based on tourism and agriculture, and the population is primarily white.
Common Questions
What is Per Capita Income in Vandercook Lake?
Per Capita income in Vandercook Lake is $30,277.
What is the Median Family Income in Vandercook Lake?
Median Family Income in Vandercook Lake is $65,556.
What is the Median Household income in Vandercook Lake?
Median Household Income in Vandercook Lake is $51,332.
What is Income or Wage Gap in Vandercook Lake?
Income or Wage Gap in Vandercook Lake is 40.8%.
Women in Vandercook Lake earn 59.2 cents for every dollar earned by a man.
What is Inequality or Gini Index in Vandercook Lake?
Inequality or Gini Index in Vandercook Lake is 0.43.
What is the Total Population of Vandercook Lake?
Total Population of Vandercook Lake is 4,635.
What is the Total Male Population of Vandercook Lake?
Total Male Population of Vandercook Lake is 2,313.
What is the Total Female Population of Vandercook Lake?
Total Female Population of Vandercook Lake is 2,322.
What is the Ratio of Males per 100 Females in Vandercook Lake?
There are 99.61 Males per 100 Females in Vandercook Lake.
What is the Ratio of Females per 100 Males in Vandercook Lake?
There are 100.39 Females per 100 Males in Vandercook Lake.
What is the Median Population Age in Vandercook Lake?
Median Population Age in Vandercook Lake is 40.2 Years.
What is the Average Family Size in Vandercook Lake
Average Family Size in Vandercook Lake is 3.1 People.
What is the Average Household Size in Vandercook Lake
Average Household Size in Vandercook Lake is 2.4 People.
How Large is the Labor Force in Vandercook Lake?
There are 1,960 People in the Labor Forcein in Vandercook Lake.
What is the Percentage of People in the Labor Force in Vandercook Lake?
51.6% of People are in the Labor Force in Vandercook Lake.
What is the Unemployment Rate in Vandercook Lake?
Unemployment Rate in Vandercook Lake is 1.9%.