South Haven, MI Map & Demographics
South Haven Map
South Haven Overview
$44,173
PER CAPITA INCOME
$87,647
AVG FAMILY INCOME
$63,202
AVG HOUSEHOLD INCOME
26.2%
WAGE / INCOME GAP [ % ]
73.8¢/ $1
WAGE / INCOME GAP [ $ ]
0.49
INEQUALITY / GINI INDEX
3,999
TOTAL POPULATION
1,844
MALE POPULATION
2,155
FEMALE POPULATION
85.57
MALES / 100 FEMALES
116.87
FEMALES / 100 MALES
61.0
MEDIAN AGE
2.4
AVG FAMILY SIZE
2.0
AVG HOUSEHOLD SIZE
1,666
LABOR FORCE [ PEOPLE ]
47.8%
PERCENT IN LABOR FORCE
3.8%
UNEMPLOYMENT RATE
South Haven Zip Codes
South Haven Area Codes
Income in South Haven
Income Overview in South Haven
Per Capita Income in South Haven is $44,173, while median incomes of families and households are $87,647 and $63,202 respectively.
| Characteristic | Number | Measure |
| Per Capita Income | 3,999 | $44,173 |
| Median Family Income | 1,230 | $87,647 |
| Mean Family Income | 1,230 | $118,608 |
| Median Household Income | 1,943 | $63,202 |
| Mean Household Income | 1,943 | $92,677 |
| Income Deficit | 1,230 | $0 |
| Wage / Income Gap (%) | 3,999 | 26.24% |
| Wage / Income Gap ($) | 3,999 | 73.76¢ per $1 |
| Gini / Inequality Index | 3,999 | 0.49 |
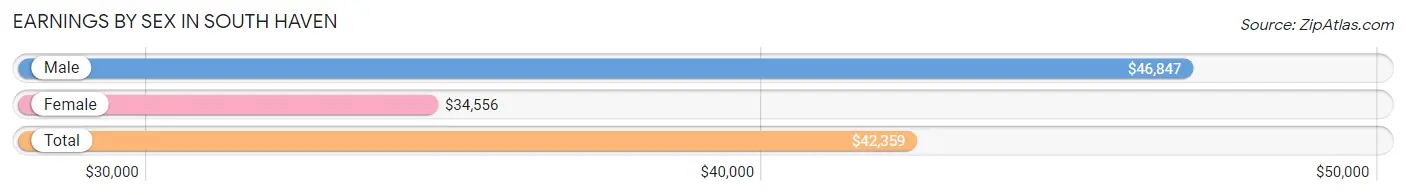
Earnings by Sex in South Haven
Average Earnings in South Haven are $42,359, $46,847 for men and $34,556 for women, a difference of 26.2%.
| Sex | Number | Average Earnings |
| Male | 1,009 (55.5%) | $46,847 |
| Female | 809 (44.5%) | $34,556 |
| Total | 1,818 (100.0%) | $42,359 |
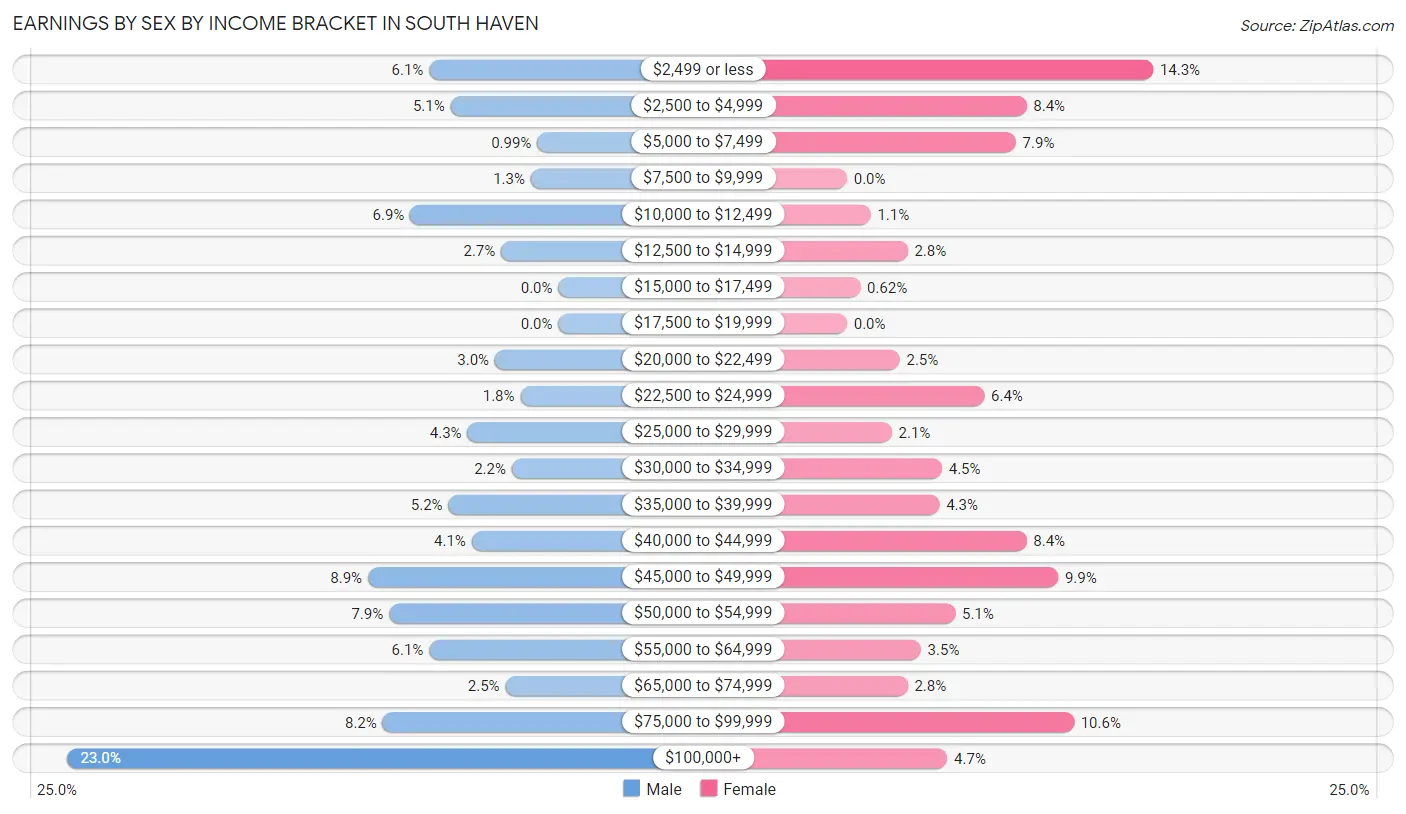
Earnings by Sex by Income Bracket in South Haven
The most common earnings brackets in South Haven are $100,000+ for men (232 | 23.0%) and $2,499 or less for women (116 | 14.3%).
| Income | Male | Female |
| $2,499 or less | 61 (6.0%) | 116 (14.3%) |
| $2,500 to $4,999 | 51 (5.1%) | 68 (8.4%) |
| $5,000 to $7,499 | 10 (1.0%) | 64 (7.9%) |
| $7,500 to $9,999 | 13 (1.3%) | 0 (0.0%) |
| $10,000 to $12,499 | 70 (6.9%) | 9 (1.1%) |
| $12,500 to $14,999 | 27 (2.7%) | 23 (2.8%) |
| $15,000 to $17,499 | 0 (0.0%) | 5 (0.6%) |
| $17,500 to $19,999 | 0 (0.0%) | 0 (0.0%) |
| $20,000 to $22,499 | 30 (3.0%) | 20 (2.5%) |
| $22,500 to $24,999 | 18 (1.8%) | 52 (6.4%) |
| $25,000 to $29,999 | 43 (4.3%) | 17 (2.1%) |
| $30,000 to $34,999 | 22 (2.2%) | 36 (4.4%) |
| $35,000 to $39,999 | 52 (5.1%) | 35 (4.3%) |
| $40,000 to $44,999 | 41 (4.1%) | 68 (8.4%) |
| $45,000 to $49,999 | 90 (8.9%) | 80 (9.9%) |
| $50,000 to $54,999 | 80 (7.9%) | 41 (5.1%) |
| $55,000 to $64,999 | 61 (6.0%) | 28 (3.5%) |
| $65,000 to $74,999 | 25 (2.5%) | 23 (2.8%) |
| $75,000 to $99,999 | 83 (8.2%) | 86 (10.6%) |
| $100,000+ | 232 (23.0%) | 38 (4.7%) |
| Total | 1,009 (100.0%) | 809 (100.0%) |
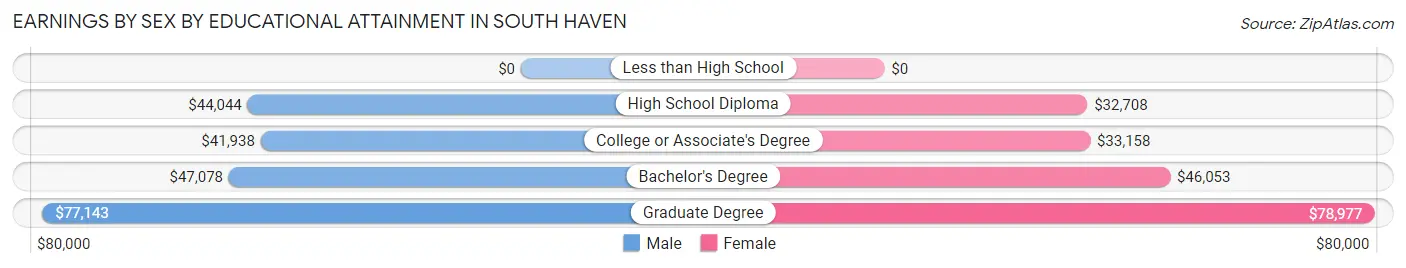
Earnings by Sex by Educational Attainment in South Haven
Average earnings in South Haven are $47,125 for men and $40,851 for women, a difference of 13.3%. Men with an educational attainment of graduate degree enjoy the highest average annual earnings of $77,143, while those with college or associate's degree education earn the least with $41,938. Women with an educational attainment of graduate degree earn the most with the average annual earnings of $78,977, while those with high school diploma education have the smallest earnings of $32,708.
| Educational Attainment | Male Income | Female Income |
| Less than High School | - | - |
| High School Diploma | $44,044 | $32,708 |
| College or Associate's Degree | $41,938 | $33,158 |
| Bachelor's Degree | $47,078 | $46,053 |
| Graduate Degree | $77,143 | $78,977 |
| Total | $47,125 | $40,851 |
Family Income in South Haven
Family Income Brackets in South Haven
According to the South Haven family income data, there are 216 families falling into the $50,000 to $74,999 income range, which is the most common income bracket and makes up 17.6% of all families. Conversely, the $10,000 to $14,999 income bracket is the least frequent group with only 7 families (0.6%) belonging to this category.
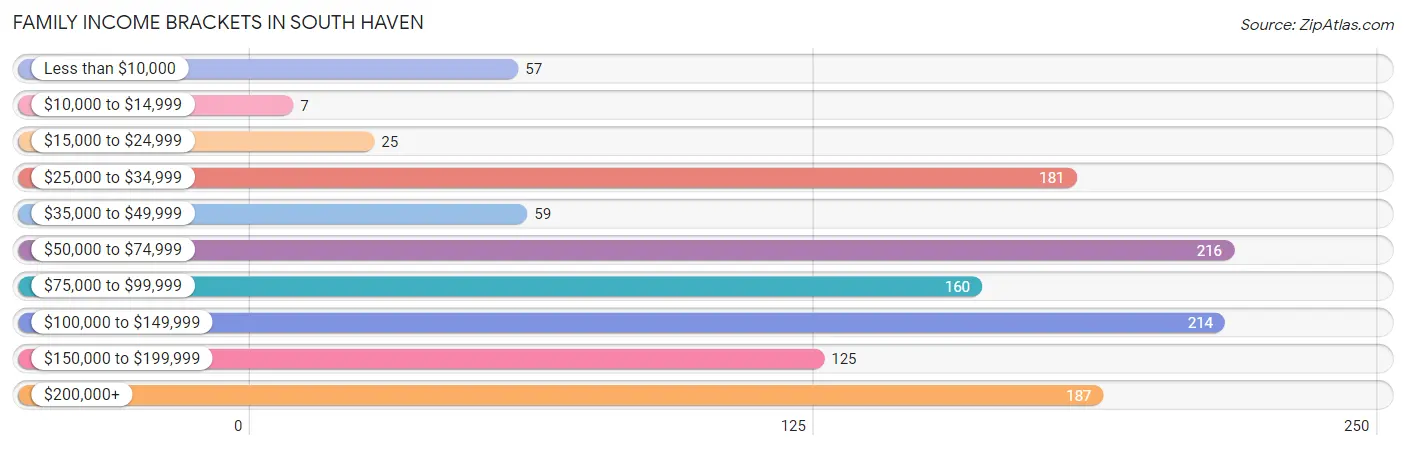
| Income Bracket | # Families | % Families |
| Less than $10,000 | 57 | 4.6% |
| $10,000 to $14,999 | 7 | 0.6% |
| $15,000 to $24,999 | 25 | 2.0% |
| $25,000 to $34,999 | 181 | 14.7% |
| $35,000 to $49,999 | 59 | 4.8% |
| $50,000 to $74,999 | 216 | 17.6% |
| $75,000 to $99,999 | 160 | 13.0% |
| $100,000 to $149,999 | 214 | 17.4% |
| $150,000 to $199,999 | 125 | 10.2% |
| $200,000+ | 187 | 15.2% |
Family Income by Famaliy Size in South Haven
3-person families (105 | 8.5%) account for the highest median family income in South Haven with $130,665 per family, while 2-person families (901 | 73.3%) have the highest median income of $46,168 per family member.
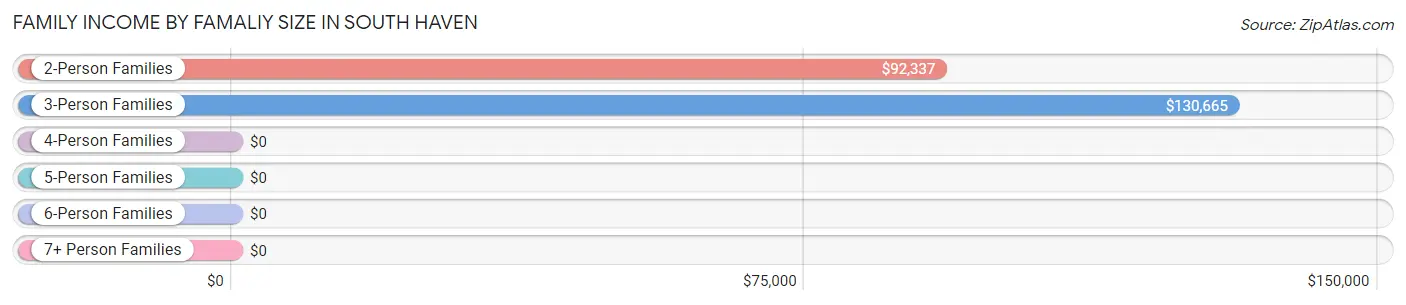
| Income Bracket | # Families | Median Income |
| 2-Person Families | 901 (73.3%) | $92,337 |
| 3-Person Families | 105 (8.5%) | $130,665 |
| 4-Person Families | 149 (12.1%) | $0 |
| 5-Person Families | 62 (5.0%) | $0 |
| 6-Person Families | 13 (1.1%) | $0 |
| 7+ Person Families | 0 (0.0%) | $0 |
| Total | 1,230 (100.0%) | $87,647 |
Family Income by Number of Earners in South Haven
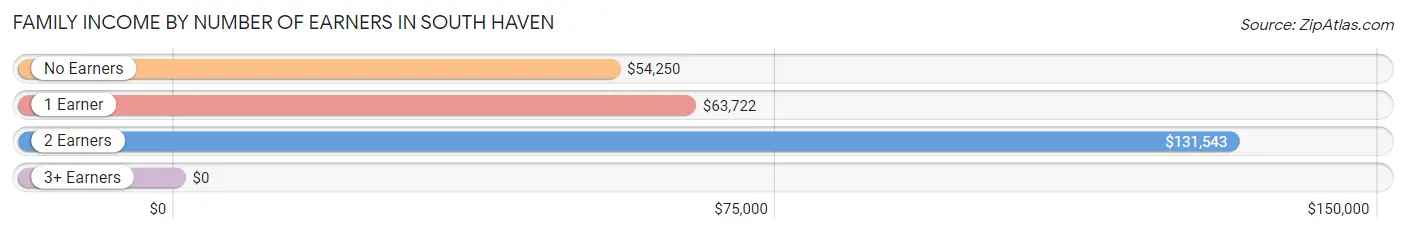
| Number of Earners | # Families | Median Income |
| No Earners | 402 (32.7%) | $54,250 |
| 1 Earner | 318 (25.9%) | $63,722 |
| 2 Earners | 430 (35.0%) | $131,543 |
| 3+ Earners | 80 (6.5%) | $0 |
| Total | 1,230 (100.0%) | $87,647 |
Household Income in South Haven
Household Income Brackets in South Haven
With 381 households falling in the category, the $50,000 to $74,999 income range is the most frequent in South Haven, accounting for 19.6% of all households. In contrast, only 51 households (2.6%) fall into the $10,000 to $14,999 income bracket, making it the least populous group.
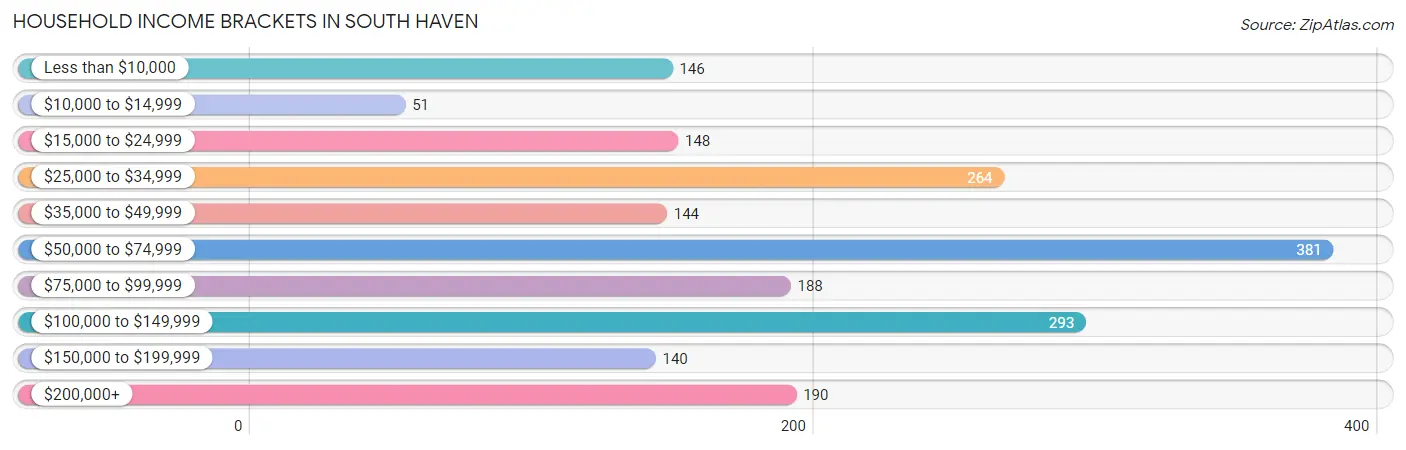
| Income Bracket | # Households | % Households |
| Less than $10,000 | 146 | 7.5% |
| $10,000 to $14,999 | 51 | 2.6% |
| $15,000 to $24,999 | 148 | 7.6% |
| $25,000 to $34,999 | 264 | 13.6% |
| $35,000 to $49,999 | 144 | 7.4% |
| $50,000 to $74,999 | 381 | 19.6% |
| $75,000 to $99,999 | 188 | 9.7% |
| $100,000 to $149,999 | 293 | 15.1% |
| $150,000 to $199,999 | 140 | 7.2% |
| $200,000+ | 190 | 9.8% |
Household Income by Householder Age in South Haven
The median household income in South Haven is $63,202, with the highest median household income of $84,500 found in the 45 to 64 years age bracket for the primary householder. A total of 578 households (29.7%) fall into this category. Meanwhile, the 15 to 24 years age bracket for the primary householder has the lowest median household income of $0, with 111 households (5.7%) in this group.
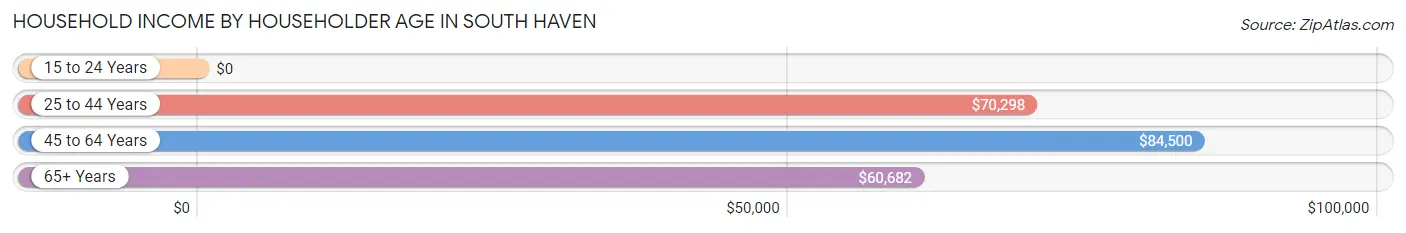
| Income Bracket | # Households | Median Income |
| 15 to 24 Years | 111 (5.7%) | $0 |
| 25 to 44 Years | 332 (17.1%) | $70,298 |
| 45 to 64 Years | 578 (29.7%) | $84,500 |
| 65+ Years | 922 (47.4%) | $60,682 |
| Total | 1,943 (100.0%) | $63,202 |
Poverty in South Haven
Income Below Poverty by Sex and Age in South Haven
With 16.7% poverty level for males and 24.0% for females among the residents of South Haven, 16 and 17 year old males and 16 and 17 year old females are the most vulnerable to poverty, with 65 males (67.7%) and 42 females (100.0%) in their respective age groups living below the poverty level.
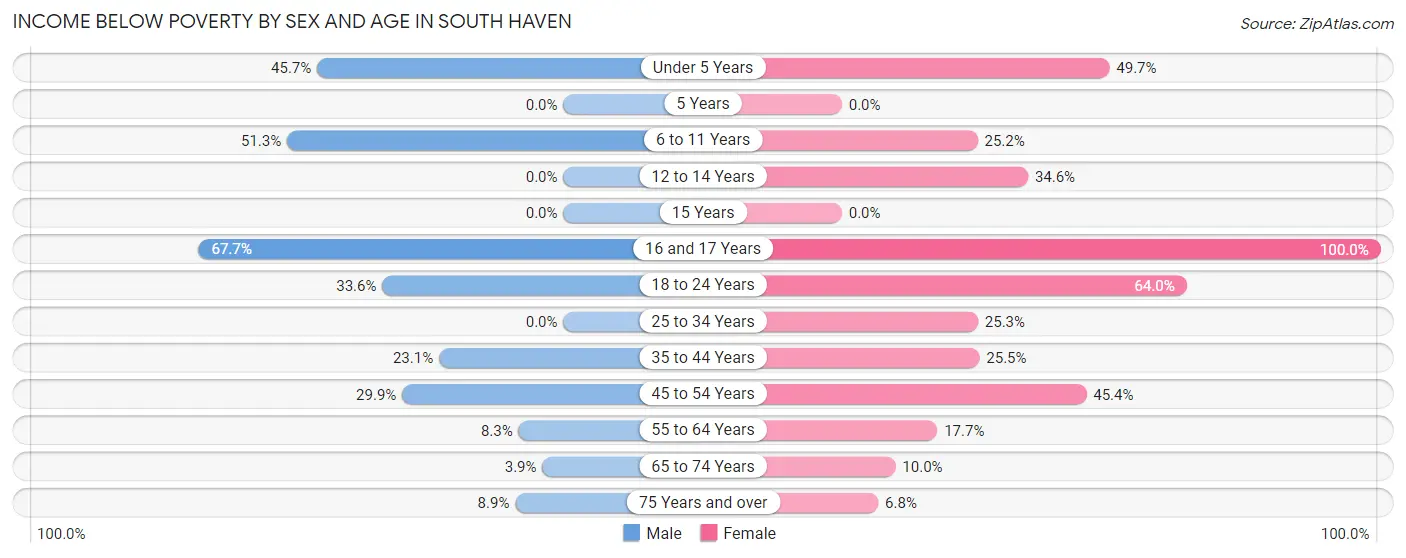
| Age Bracket | Male | Female |
| Under 5 Years | 16 (45.7%) | 73 (49.7%) |
| 5 Years | 0 (0.0%) | 0 (0.0%) |
| 6 to 11 Years | 40 (51.3%) | 34 (25.2%) |
| 12 to 14 Years | 0 (0.0%) | 19 (34.5%) |
| 15 Years | 0 (0.0%) | 0 (0.0%) |
| 16 and 17 Years | 65 (67.7%) | 42 (100.0%) |
| 18 to 24 Years | 40 (33.6%) | 64 (64.0%) |
| 25 to 34 Years | 0 (0.0%) | 24 (25.3%) |
| 35 to 44 Years | 27 (23.1%) | 59 (25.5%) |
| 45 to 54 Years | 38 (29.9%) | 59 (45.4%) |
| 55 to 64 Years | 28 (8.3%) | 59 (17.7%) |
| 65 to 74 Years | 13 (3.9%) | 44 (10.0%) |
| 75 Years and over | 30 (8.9%) | 26 (6.8%) |
| Total | 297 (16.7%) | 503 (24.0%) |
Income Above Poverty by Sex and Age in South Haven
According to the poverty statistics in South Haven, males aged 5 years and females aged 75 years and over are the age groups that are most secure financially, with 100.0% of males and 93.2% of females in these age groups living above the poverty line.
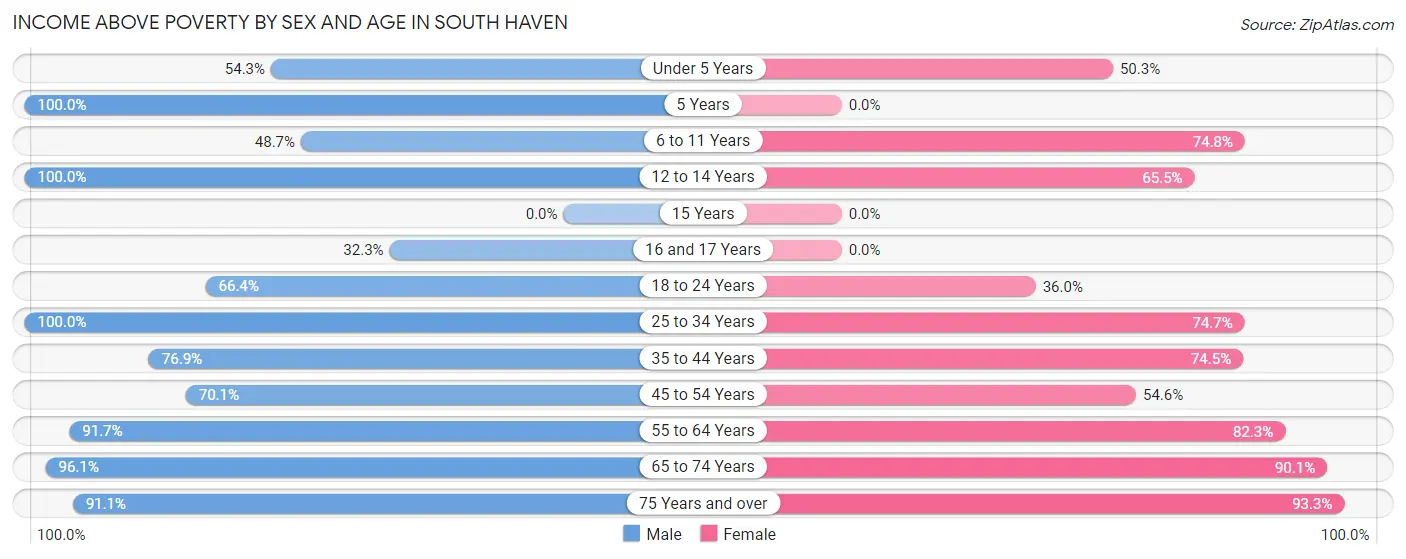
| Age Bracket | Male | Female |
| Under 5 Years | 19 (54.3%) | 74 (50.3%) |
| 5 Years | 17 (100.0%) | 0 (0.0%) |
| 6 to 11 Years | 38 (48.7%) | 101 (74.8%) |
| 12 to 14 Years | 47 (100.0%) | 36 (65.4%) |
| 15 Years | 0 (0.0%) | 0 (0.0%) |
| 16 and 17 Years | 31 (32.3%) | 0 (0.0%) |
| 18 to 24 Years | 79 (66.4%) | 36 (36.0%) |
| 25 to 34 Years | 133 (100.0%) | 71 (74.7%) |
| 35 to 44 Years | 90 (76.9%) | 172 (74.5%) |
| 45 to 54 Years | 89 (70.1%) | 71 (54.6%) |
| 55 to 64 Years | 309 (91.7%) | 274 (82.3%) |
| 65 to 74 Years | 320 (96.1%) | 398 (90.0%) |
| 75 Years and over | 306 (91.1%) | 359 (93.2%) |
| Total | 1,478 (83.3%) | 1,592 (76.0%) |
Income Below Poverty Among Married-Couple Families in South Haven
The poverty statistics for married-couple families in South Haven show that 5.1% or 51 of the total 999 families live below the poverty line. Families with 1 or 2 children have the highest poverty rate of 41.1%, comprising of 51 families. On the other hand, families with no children have the lowest poverty rate of 0.0%, which includes 0 families.
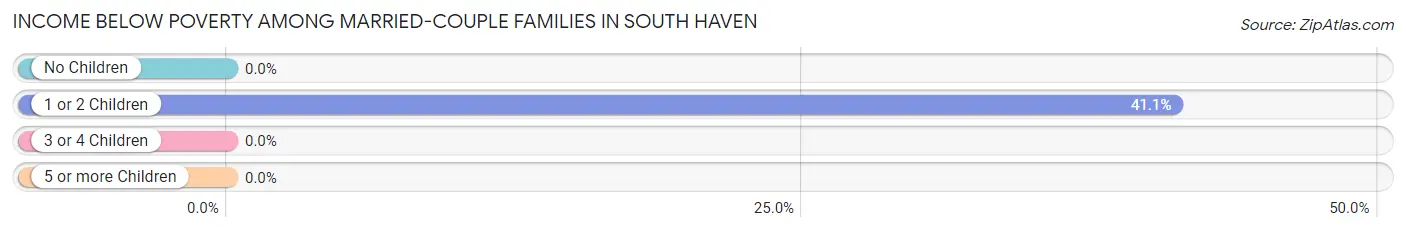
| Children | Above Poverty | Below Poverty |
| No Children | 848 (100.0%) | 0 (0.0%) |
| 1 or 2 Children | 73 (58.9%) | 51 (41.1%) |
| 3 or 4 Children | 27 (100.0%) | 0 (0.0%) |
| 5 or more Children | 0 (0.0%) | 0 (0.0%) |
| Total | 948 (94.9%) | 51 (5.1%) |
Income Below Poverty Among Single-Parent Households in South Haven
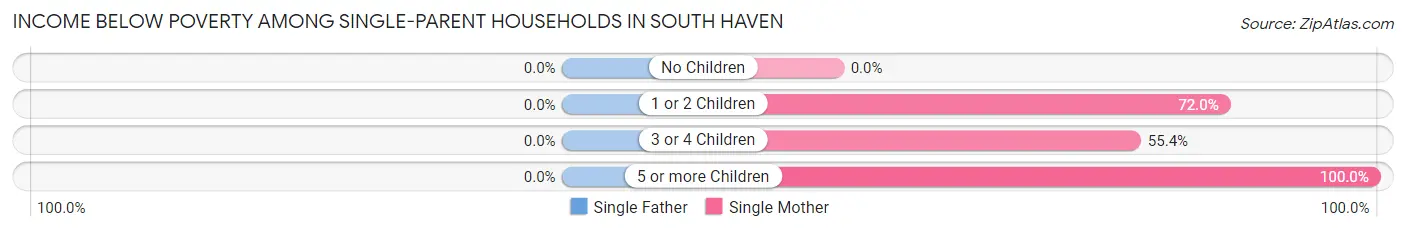
| Children | Single Father | Single Mother |
| No Children | 0 (0.0%) | 0 (0.0%) |
| 1 or 2 Children | 0 (0.0%) | 67 (72.0%) |
| 3 or 4 Children | 0 (0.0%) | 31 (55.4%) |
| 5 or more Children | 0 (0.0%) | 13 (100.0%) |
| Total | 0 (0.0%) | 111 (61.3%) |
Income Below Poverty Among Married-Couple vs Single-Parent Households in South Haven
The poverty data for South Haven shows that 51 of the married-couple family households (5.1%) and 111 of the single-parent households (48.0%) are living below the poverty level. Within the married-couple family households, those with 1 or 2 children have the highest poverty rate, with 51 households (41.1%) falling below the poverty line. Among the single-parent households, those with 5 or more children have the highest poverty rate, with 13 household (100.0%) living below poverty.
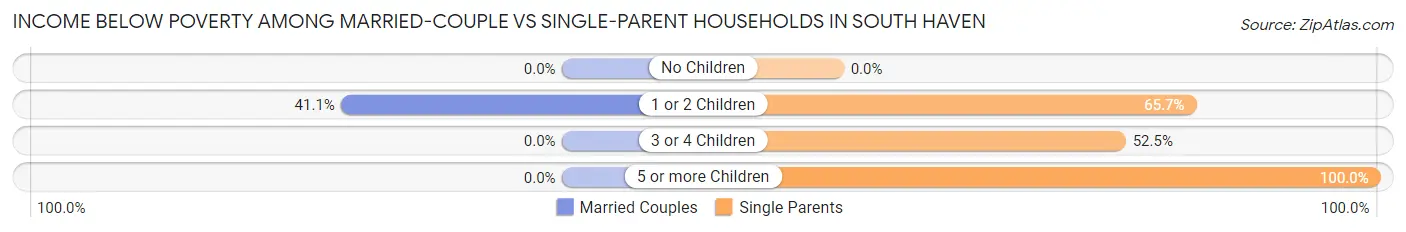
| Children | Married-Couple Families | Single-Parent Households |
| No Children | 0 (0.0%) | 0 (0.0%) |
| 1 or 2 Children | 51 (41.1%) | 67 (65.7%) |
| 3 or 4 Children | 0 (0.0%) | 31 (52.5%) |
| 5 or more Children | 0 (0.0%) | 13 (100.0%) |
| Total | 51 (5.1%) | 111 (48.0%) |
Race in South Haven
The most populous races in South Haven are White / Caucasian (3,196 | 79.9%), Black / African American (437 | 10.9%), and Two or more Races (284 | 7.1%).
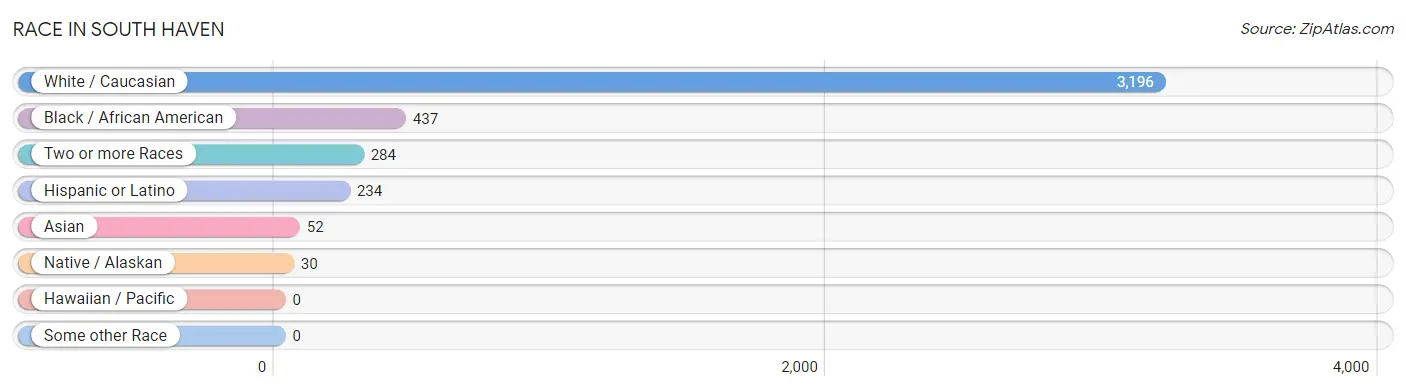
| Race | # Population | % Population |
| Asian | 52 | 1.3% |
| Black / African American | 437 | 10.9% |
| Hawaiian / Pacific | 0 | 0.0% |
| Hispanic or Latino | 234 | 5.9% |
| Native / Alaskan | 30 | 0.7% |
| White / Caucasian | 3,196 | 79.9% |
| Two or more Races | 284 | 7.1% |
| Some other Race | 0 | 0.0% |
| Total | 3,999 | 100.0% |
Ancestry in South Haven
The most populous ancestries reported in South Haven are German (680 | 17.0%), Irish (649 | 16.2%), English (378 | 9.5%), Polish (230 | 5.8%), and Mexican (207 | 5.2%), together accounting for 53.6% of all South Haven residents.
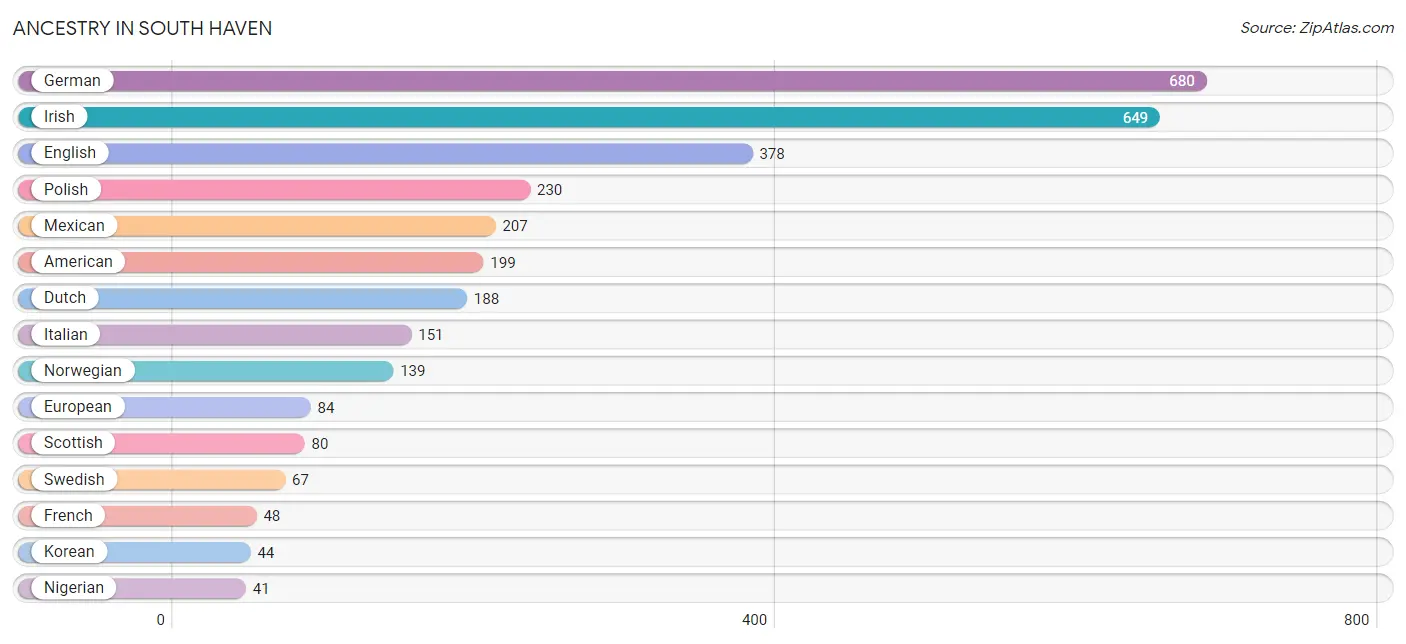
| Ancestry | # Population | % Population |
| American | 199 | 5.0% |
| Arab | 16 | 0.4% |
| Austrian | 8 | 0.2% |
| Belgian | 21 | 0.5% |
| Bhutanese | 21 | 0.5% |
| British | 32 | 0.8% |
| Cuban | 10 | 0.3% |
| Czech | 6 | 0.2% |
| Dutch | 188 | 4.7% |
| Eastern European | 5 | 0.1% |
| English | 378 | 9.5% |
| European | 84 | 2.1% |
| French | 48 | 1.2% |
| French Canadian | 25 | 0.6% |
| German | 680 | 17.0% |
| Hungarian | 23 | 0.6% |
| Indian (Asian) | 17 | 0.4% |
| Irish | 649 | 16.2% |
| Italian | 151 | 3.8% |
| Korean | 44 | 1.1% |
| Lebanese | 6 | 0.2% |
| Lithuanian | 13 | 0.3% |
| Mexican | 207 | 5.2% |
| Navajo | 14 | 0.4% |
| Nigerian | 41 | 1.0% |
| Northern European | 18 | 0.4% |
| Norwegian | 139 | 3.5% |
| Ottawa | 16 | 0.4% |
| Polish | 230 | 5.8% |
| Russian | 12 | 0.3% |
| Scandinavian | 16 | 0.4% |
| Scottish | 80 | 2.0% |
| Slovak | 8 | 0.2% |
| Subsaharan African | 41 | 1.0% |
| Swedish | 67 | 1.7% |
| Syrian | 10 | 0.3% |
| Thai | 20 | 0.5% |
| Ukrainian | 3 | 0.1% |
| Welsh | 34 | 0.9% |
| Yugoslavian | 22 | 0.5% | View All 40 Rows |
Immigrants in South Haven
The most numerous immigrant groups reported in South Haven came from Central America (101 | 2.5%), Latin America (101 | 2.5%), Mexico (101 | 2.5%), Asia (44 | 1.1%), and Philippines (44 | 1.1%), together accounting for 9.8% of all South Haven residents.
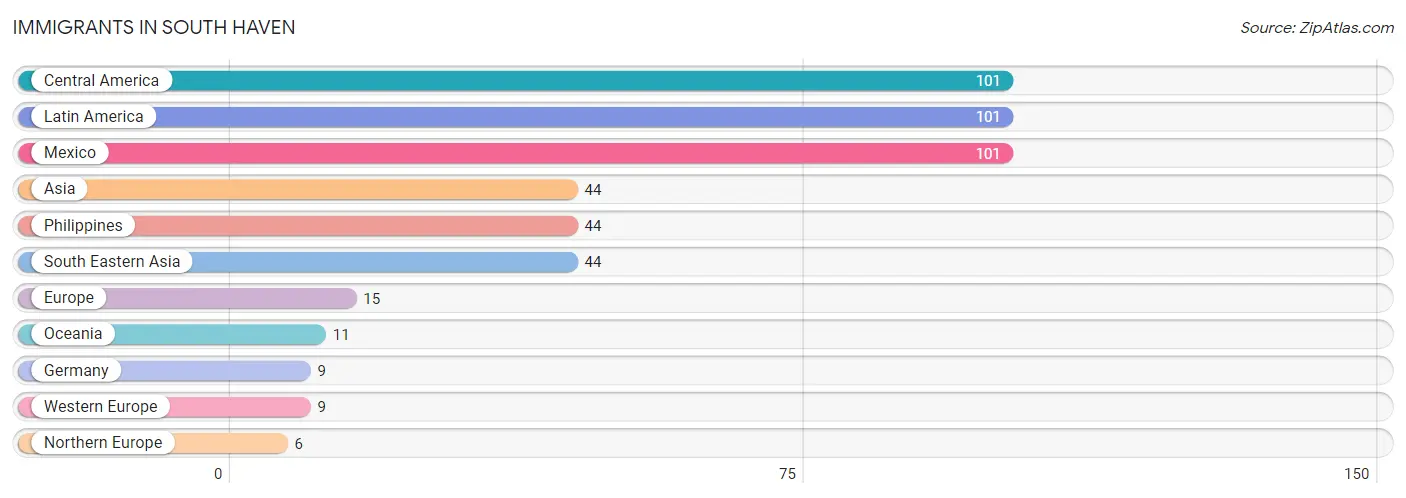
| Immigration Origin | # Population | % Population |
| Asia | 44 | 1.1% |
| Central America | 101 | 2.5% |
| Europe | 15 | 0.4% |
| Germany | 9 | 0.2% |
| Latin America | 101 | 2.5% |
| Mexico | 101 | 2.5% |
| Northern Europe | 6 | 0.2% |
| Oceania | 11 | 0.3% |
| Philippines | 44 | 1.1% |
| South Eastern Asia | 44 | 1.1% |
| Western Europe | 9 | 0.2% | View All 11 Rows |
Sex and Age in South Haven
Sex and Age in South Haven
The most populous age groups in South Haven are 65 to 69 Years (219 | 11.9%) for men and 65 to 69 Years (284 | 13.2%) for women.
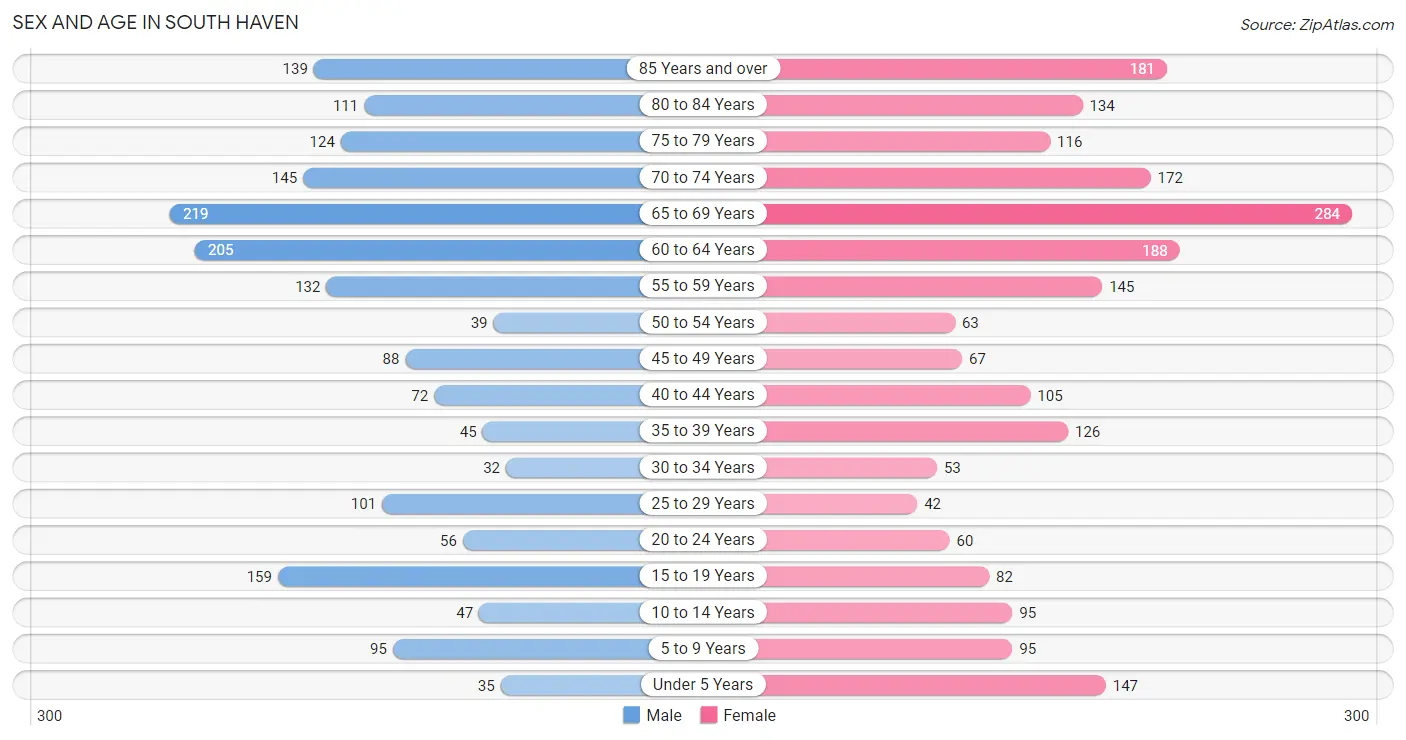
| Age Bracket | Male | Female |
| Under 5 Years | 35 (1.9%) | 147 (6.8%) |
| 5 to 9 Years | 95 (5.1%) | 95 (4.4%) |
| 10 to 14 Years | 47 (2.5%) | 95 (4.4%) |
| 15 to 19 Years | 159 (8.6%) | 82 (3.8%) |
| 20 to 24 Years | 56 (3.0%) | 60 (2.8%) |
| 25 to 29 Years | 101 (5.5%) | 42 (1.9%) |
| 30 to 34 Years | 32 (1.7%) | 53 (2.5%) |
| 35 to 39 Years | 45 (2.4%) | 126 (5.9%) |
| 40 to 44 Years | 72 (3.9%) | 105 (4.9%) |
| 45 to 49 Years | 88 (4.8%) | 67 (3.1%) |
| 50 to 54 Years | 39 (2.1%) | 63 (2.9%) |
| 55 to 59 Years | 132 (7.2%) | 145 (6.7%) |
| 60 to 64 Years | 205 (11.1%) | 188 (8.7%) |
| 65 to 69 Years | 219 (11.9%) | 284 (13.2%) |
| 70 to 74 Years | 145 (7.9%) | 172 (8.0%) |
| 75 to 79 Years | 124 (6.7%) | 116 (5.4%) |
| 80 to 84 Years | 111 (6.0%) | 134 (6.2%) |
| 85 Years and over | 139 (7.5%) | 181 (8.4%) |
| Total | 1,844 (100.0%) | 2,155 (100.0%) |
Families and Households in South Haven
Median Family Size in South Haven
The median family size in South Haven is 2.42 persons per family, with single female/mother families (181 | 14.7%) accounting for the largest median family size of 3.1 persons per family. On the other hand, single male/father families (50 | 4.1%) represent the smallest median family size with 1.88 persons per family.
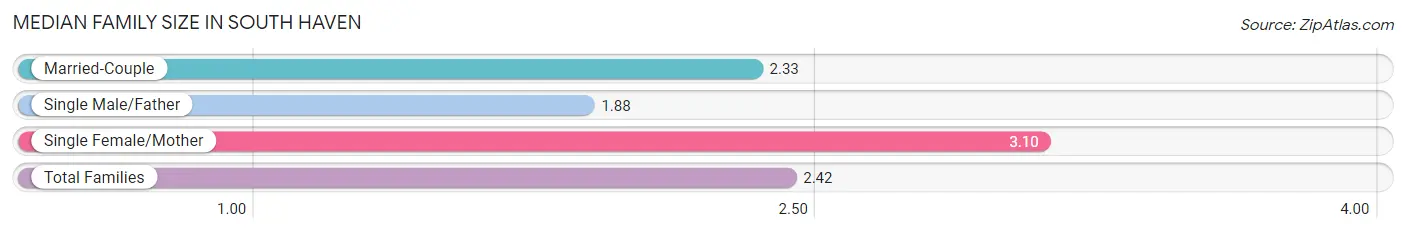
| Family Type | # Families | Family Size |
| Married-Couple | 999 (81.2%) | 2.33 |
| Single Male/Father | 50 (4.1%) | 1.88 |
| Single Female/Mother | 181 (14.7%) | 3.10 |
| Total Families | 1,230 (100.0%) | 2.42 |
Median Household Size in South Haven
The median household size in South Haven is 1.99 persons per household, with single female/mother households (181 | 9.3%) accounting for the largest median household size of 3.14 persons per household. non-family households (713 | 36.7%) represent the smallest median household size with 1.24 persons per household.
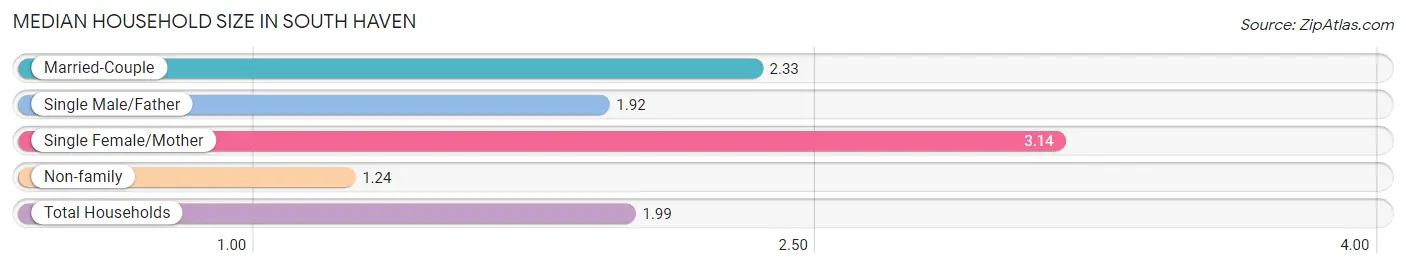
| Household Type | # Households | Household Size |
| Married-Couple | 999 (51.4%) | 2.33 |
| Single Male/Father | 50 (2.6%) | 1.92 |
| Single Female/Mother | 181 (9.3%) | 3.14 |
| Non-family | 713 (36.7%) | 1.24 |
| Total Households | 1,943 (100.0%) | 1.99 |
Household Size by Marriage Status in South Haven
Out of a total of 1,943 households in South Haven, 1,230 (63.3%) are family households, while 713 (36.7%) are nonfamily households. The most numerous type of family households are 2-person households, comprising 901, and the most common type of nonfamily households are 1-person households, comprising 546.
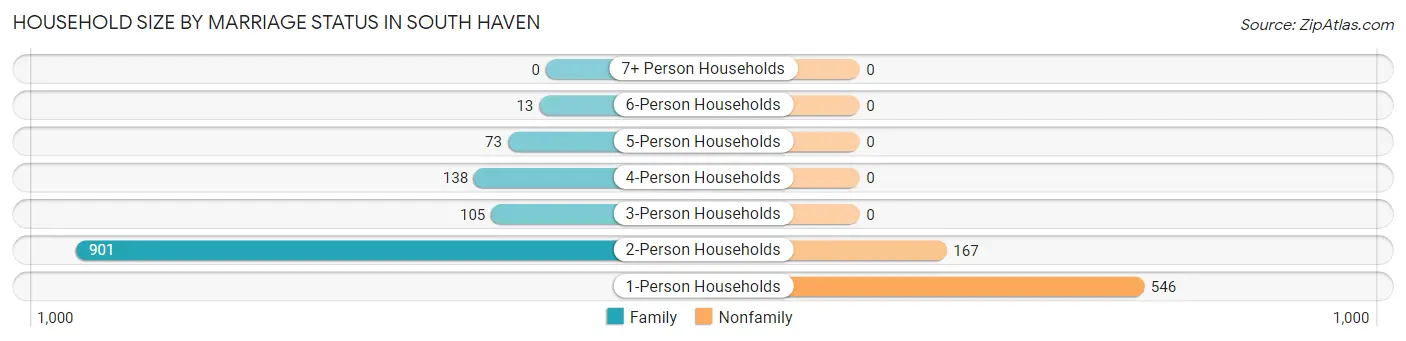
| Household Size | Family Households | Nonfamily Households |
| 1-Person Households | - | 546 (28.1%) |
| 2-Person Households | 901 (46.4%) | 167 (8.6%) |
| 3-Person Households | 105 (5.4%) | 0 (0.0%) |
| 4-Person Households | 138 (7.1%) | 0 (0.0%) |
| 5-Person Households | 73 (3.8%) | 0 (0.0%) |
| 6-Person Households | 13 (0.7%) | 0 (0.0%) |
| 7+ Person Households | 0 (0.0%) | 0 (0.0%) |
| Total | 1,230 (63.3%) | 713 (36.7%) |
Female Fertility in South Haven
Fertility by Age in South Haven
Average fertility rate in South Haven is 22.0 births per 1,000 women. Women in the age bracket of 20 to 34 years have the highest fertility rate with 77.0 births per 1,000 women. Women in the age bracket of 20 to 34 years acount for 100.0% of all women with births.
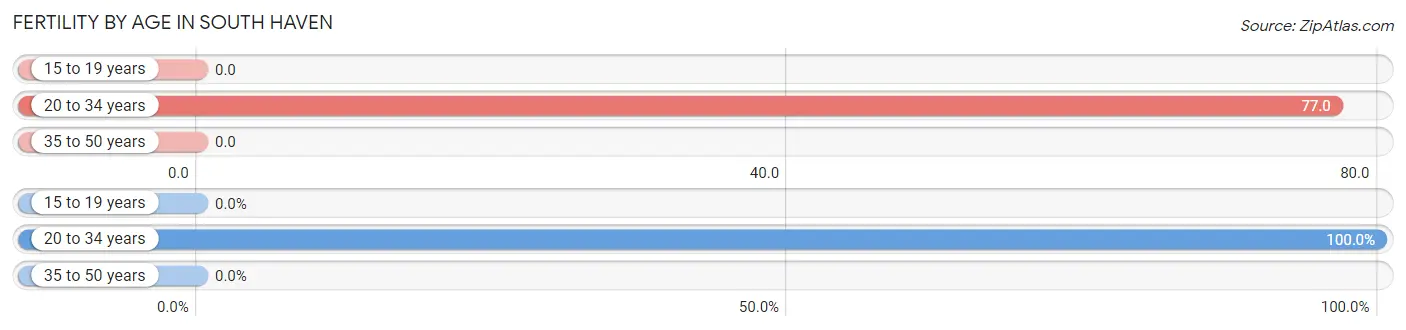
| Age Bracket | Women with Births | Births / 1,000 Women |
| 15 to 19 years | 0 (0.0%) | 0.0 |
| 20 to 34 years | 12 (100.0%) | 77.0 |
| 35 to 50 years | 0 (0.0%) | 0.0 |
| Total | 12 (100.0%) | 22.0 |
Fertility by Age by Marriage Status in South Haven
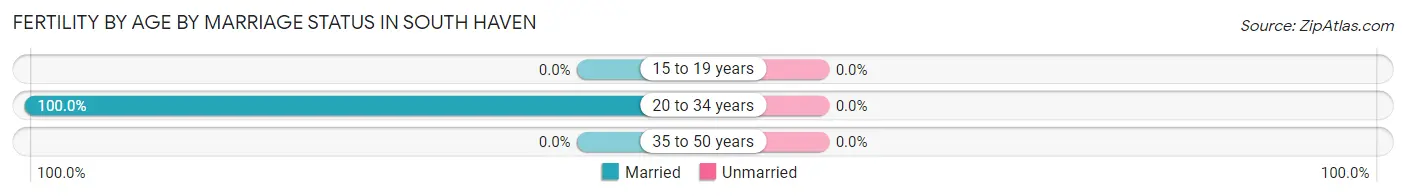
| Age Bracket | Married | Unmarried |
| 15 to 19 years | 0 (0.0%) | 0 (0.0%) |
| 20 to 34 years | 12 (100.0%) | 0 (0.0%) |
| 35 to 50 years | 0 (0.0%) | 0 (0.0%) |
| Total | 12 (100.0%) | 0 (0.0%) |
Fertility by Education in South Haven
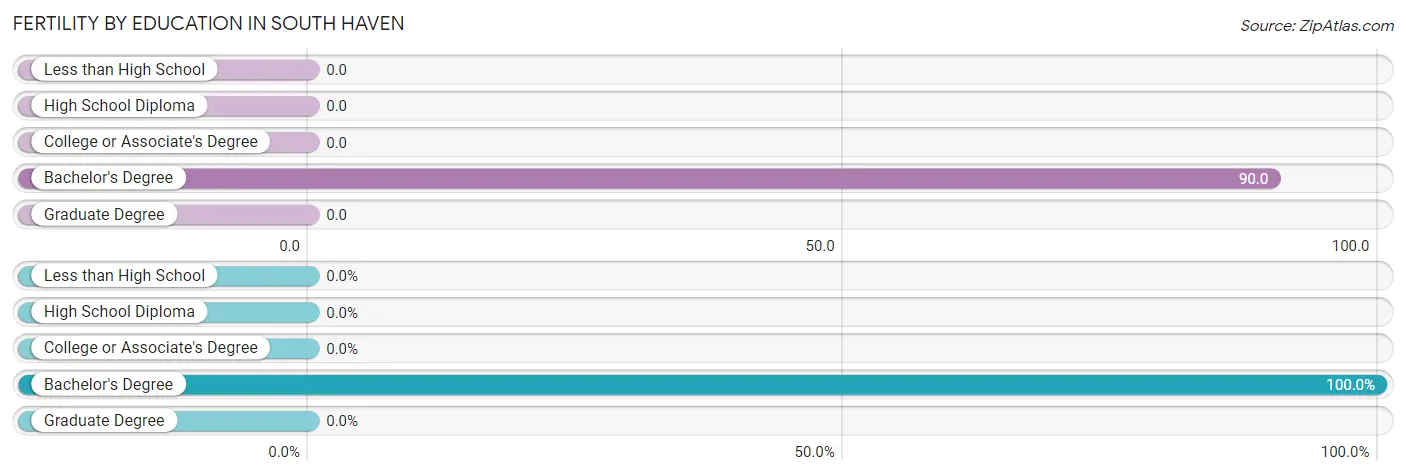
| Educational Attainment | Women with Births | Births / 1,000 Women |
| Less than High School | 0 (0.0%) | 0.0 |
| High School Diploma | 0 (0.0%) | 0.0 |
| College or Associate's Degree | 0 (0.0%) | 0.0 |
| Bachelor's Degree | 12 (100.0%) | 90.0 |
| Graduate Degree | 0 (0.0%) | 0.0 |
| Total | 12 (100.0%) | 22.0 |
Fertility by Education by Marriage Status in South Haven
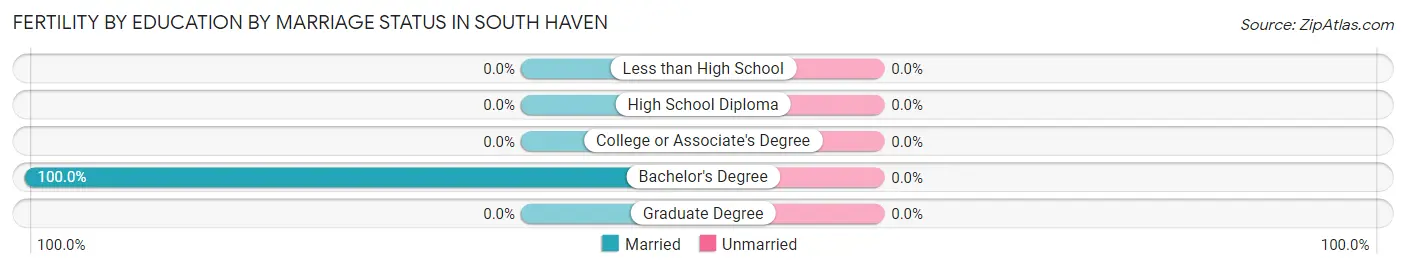
| Educational Attainment | Married | Unmarried |
| Less than High School | 0 (0.0%) | 0 (0.0%) |
| High School Diploma | 0 (0.0%) | 0 (0.0%) |
| College or Associate's Degree | 0 (0.0%) | 0 (0.0%) |
| Bachelor's Degree | 12 (100.0%) | 0 (0.0%) |
| Graduate Degree | 0 (0.0%) | 0 (0.0%) |
| Total | 12 (100.0%) | 0 (0.0%) |
Employment Characteristics in South Haven
Employment by Class of Employer in South Haven
Among the 1,596 employed individuals in South Haven, private company employees (868 | 54.4%), self-employed (not incorporated) (240 | 15.0%), and self-employed (incorporated) (184 | 11.5%) make up the most common classes of employment.
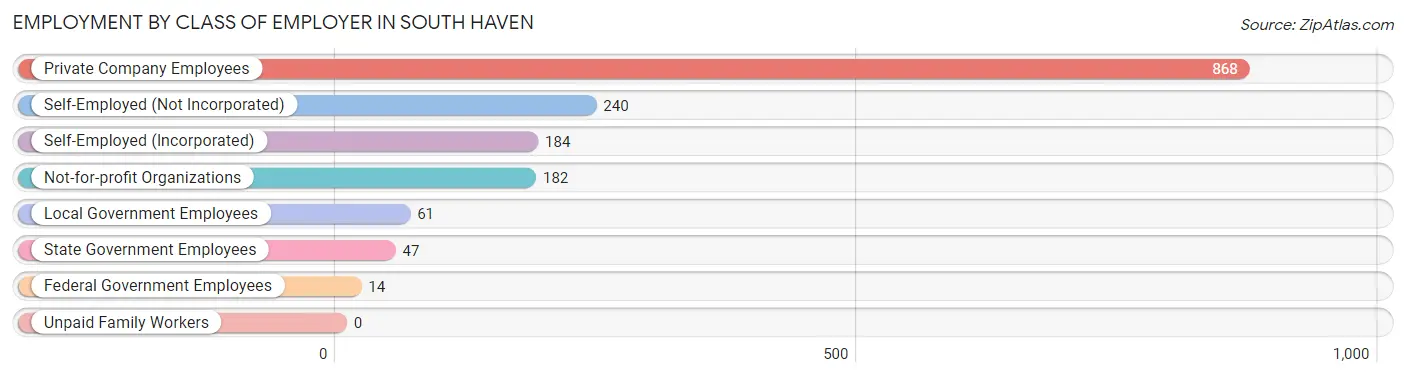
| Employer Class | # Employees | % Employees |
| Private Company Employees | 868 | 54.4% |
| Self-Employed (Incorporated) | 184 | 11.5% |
| Self-Employed (Not Incorporated) | 240 | 15.0% |
| Not-for-profit Organizations | 182 | 11.4% |
| Local Government Employees | 61 | 3.8% |
| State Government Employees | 47 | 2.9% |
| Federal Government Employees | 14 | 0.9% |
| Unpaid Family Workers | 0 | 0.0% |
| Total | 1,596 | 100.0% |
Employment Status by Age in South Haven
According to the labor force statistics for South Haven, out of the total population over 16 years of age (3,485), 47.8% or 1,666 individuals are in the labor force, with 3.8% or 63 of them unemployed. The age group with the highest labor force participation rate is 25 to 29 years, with 100.0% or 143 individuals in the labor force. Within the labor force, the 16 to 19 years age range has the highest percentage of unemployed individuals, with 16.9% or 18 of them being unemployed.
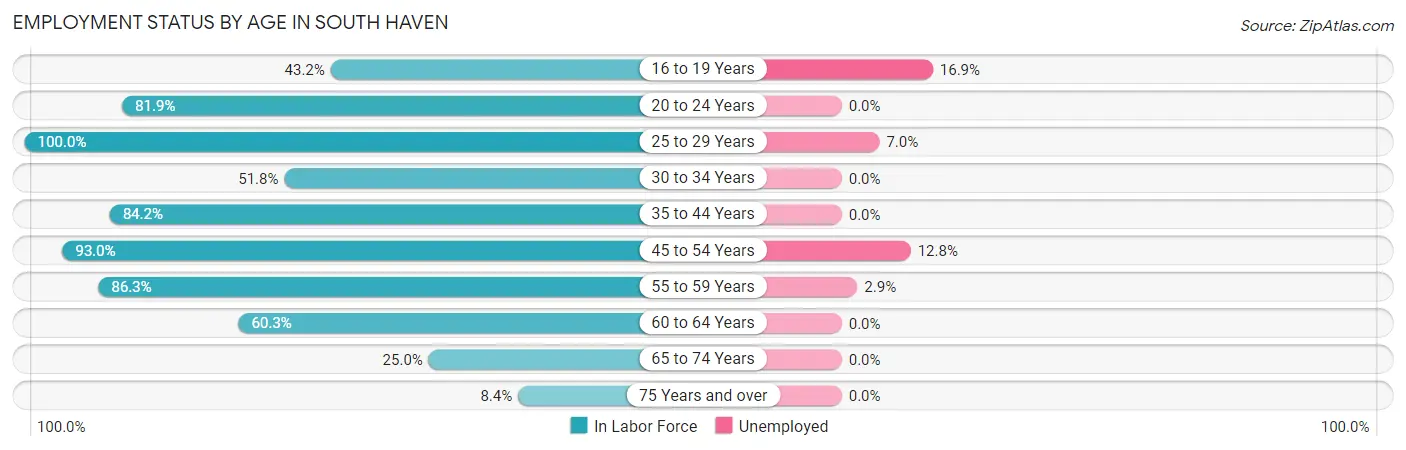
| Age Bracket | In Labor Force | Unemployed |
| 16 to 19 Years | 104 (43.2%) | 18 (16.9%) |
| 20 to 24 Years | 95 (81.9%) | 0 (0.0%) |
| 25 to 29 Years | 143 (100.0%) | 10 (7.0%) |
| 30 to 34 Years | 44 (51.8%) | 0 (0.0%) |
| 35 to 44 Years | 293 (84.2%) | 0 (0.0%) |
| 45 to 54 Years | 239 (93.0%) | 31 (12.8%) |
| 55 to 59 Years | 239 (86.3%) | 7 (2.9%) |
| 60 to 64 Years | 237 (60.3%) | 0 (0.0%) |
| 65 to 74 Years | 205 (25.0%) | 0 (0.0%) |
| 75 Years and over | 68 (8.4%) | 0 (0.0%) |
| Total | 1,666 (47.8%) | 63 (3.8%) |
Employment Status by Educational Attainment in South Haven
According to labor force statistics for South Haven, 79.5% of individuals (1,195) out of the total population between 25 and 64 years of age (1,503) are in the labor force, with 3.9% or 47 of them being unemployed. The group with the highest labor force participation rate are those with the educational attainment of high school diploma, with 88.6% or 226 individuals in the labor force. Within the labor force, individuals with less than high school education have the highest percentage of unemployment, with 48.2% or 40 of them being unemployed.
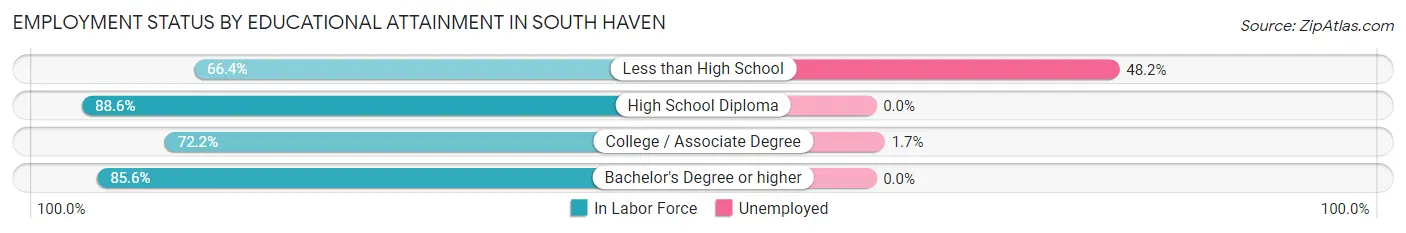
| Educational Attainment | In Labor Force | Unemployed |
| Less than High School | 83 (66.4%) | 60 (48.2%) |
| High School Diploma | 226 (88.6%) | 0 (0.0%) |
| College / Associate Degree | 406 (72.2%) | 10 (1.7%) |
| Bachelor's Degree or higher | 480 (85.6%) | 0 (0.0%) |
| Total | 1,195 (79.5%) | 59 (3.9%) |
Employment Occupations by Sex in South Haven
Management, Business, Science and Arts Occupations
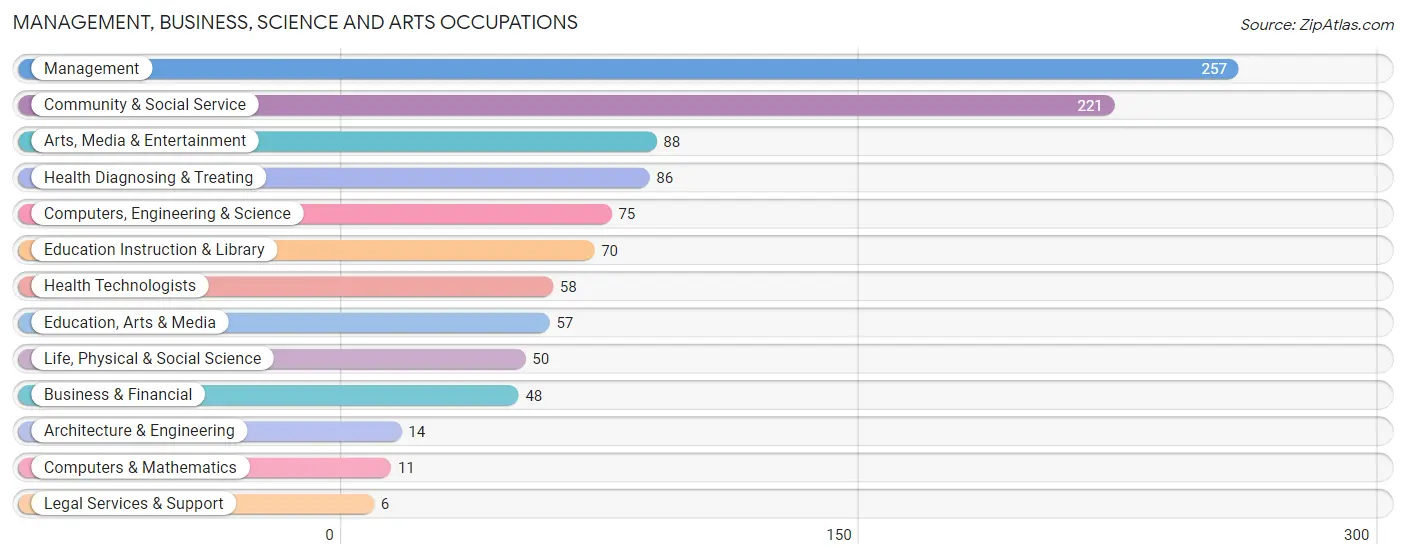
The most common Management, Business, Science and Arts occupations in South Haven are Management (257 | 16.2%), Community & Social Service (221 | 13.9%), Arts, Media & Entertainment (88 | 5.6%), Health Diagnosing & Treating (86 | 5.4%), and Computers, Engineering & Science (75 | 4.7%).
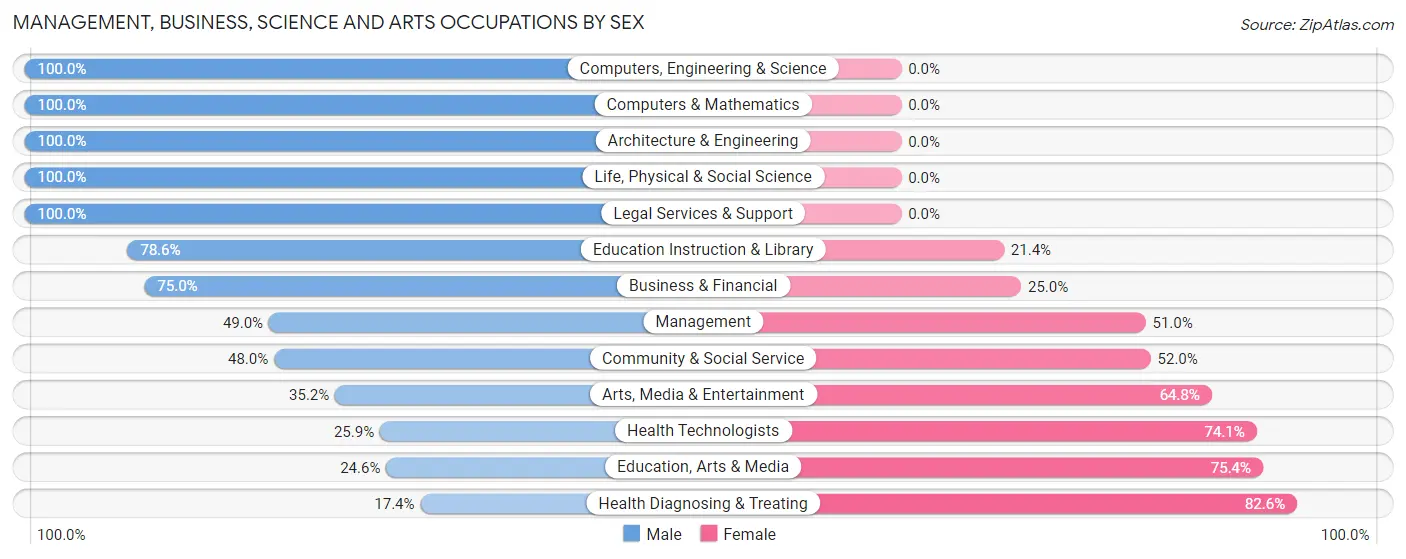
Management, Business, Science and Arts Occupations by Sex
Within the Management, Business, Science and Arts occupations in South Haven, the most male-oriented occupations are Computers, Engineering & Science (100.0%), Computers & Mathematics (100.0%), and Architecture & Engineering (100.0%), while the most female-oriented occupations are Health Diagnosing & Treating (82.6%), Education, Arts & Media (75.4%), and Health Technologists (74.1%).
| Occupation | Male | Female |
| Management | 126 (49.0%) | 131 (51.0%) |
| Business & Financial | 36 (75.0%) | 12 (25.0%) |
| Computers, Engineering & Science | 75 (100.0%) | 0 (0.0%) |
| Computers & Mathematics | 11 (100.0%) | 0 (0.0%) |
| Architecture & Engineering | 14 (100.0%) | 0 (0.0%) |
| Life, Physical & Social Science | 50 (100.0%) | 0 (0.0%) |
| Community & Social Service | 106 (48.0%) | 115 (52.0%) |
| Education, Arts & Media | 14 (24.6%) | 43 (75.4%) |
| Legal Services & Support | 6 (100.0%) | 0 (0.0%) |
| Education Instruction & Library | 55 (78.6%) | 15 (21.4%) |
| Arts, Media & Entertainment | 31 (35.2%) | 57 (64.8%) |
| Health Diagnosing & Treating | 15 (17.4%) | 71 (82.6%) |
| Health Technologists | 15 (25.9%) | 43 (74.1%) |
| Total (Category) | 358 (52.1%) | 329 (47.9%) |
| Total (Overall) | 893 (56.3%) | 692 (43.7%) |
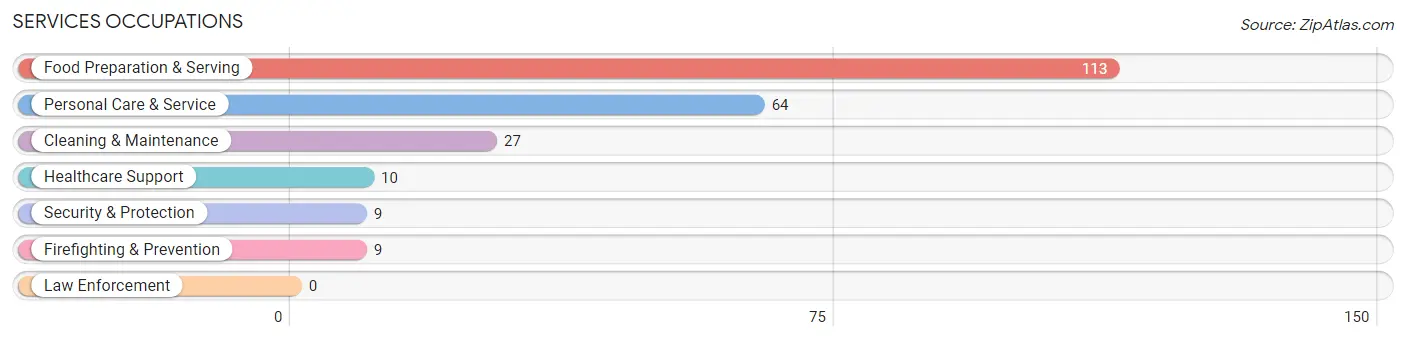
Services Occupations
The most common Services occupations in South Haven are Food Preparation & Serving (113 | 7.1%), Personal Care & Service (64 | 4.0%), Cleaning & Maintenance (27 | 1.7%), Healthcare Support (10 | 0.6%), and Security & Protection (9 | 0.6%).
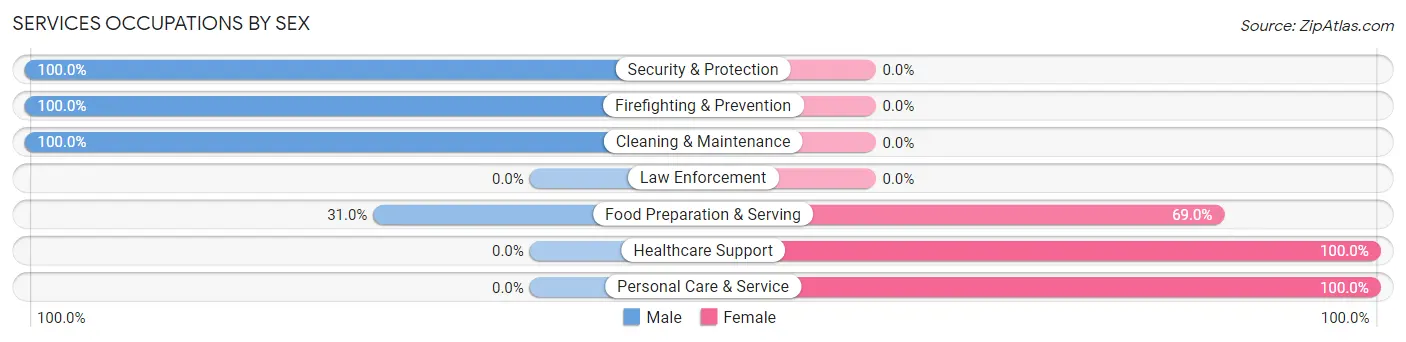
Services Occupations by Sex
Within the Services occupations in South Haven, the most male-oriented occupations are Security & Protection (100.0%), Firefighting & Prevention (100.0%), and Cleaning & Maintenance (100.0%), while the most female-oriented occupations are Healthcare Support (100.0%), Personal Care & Service (100.0%), and Food Preparation & Serving (69.0%).
| Occupation | Male | Female |
| Healthcare Support | 0 (0.0%) | 10 (100.0%) |
| Security & Protection | 9 (100.0%) | 0 (0.0%) |
| Firefighting & Prevention | 9 (100.0%) | 0 (0.0%) |
| Law Enforcement | 0 (0.0%) | 0 (0.0%) |
| Food Preparation & Serving | 35 (31.0%) | 78 (69.0%) |
| Cleaning & Maintenance | 27 (100.0%) | 0 (0.0%) |
| Personal Care & Service | 0 (0.0%) | 64 (100.0%) |
| Total (Category) | 71 (31.8%) | 152 (68.2%) |
| Total (Overall) | 893 (56.3%) | 692 (43.7%) |
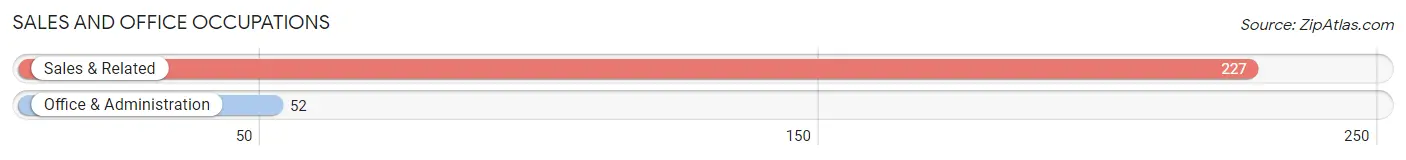
Sales and Office Occupations
The most common Sales and Office occupations in South Haven are Sales & Related (227 | 14.3%), and Office & Administration (52 | 3.3%).
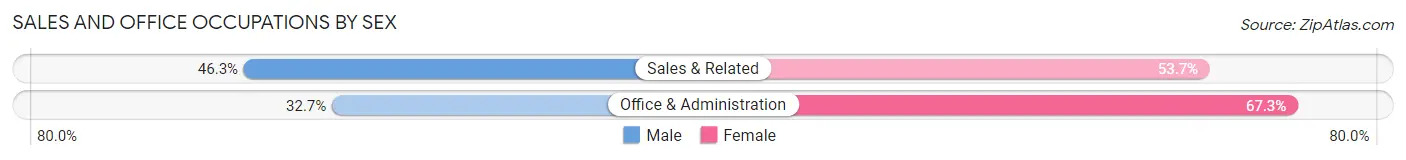
Sales and Office Occupations by Sex
| Occupation | Male | Female |
| Sales & Related | 105 (46.3%) | 122 (53.7%) |
| Office & Administration | 17 (32.7%) | 35 (67.3%) |
| Total (Category) | 122 (43.7%) | 157 (56.3%) |
| Total (Overall) | 893 (56.3%) | 692 (43.7%) |
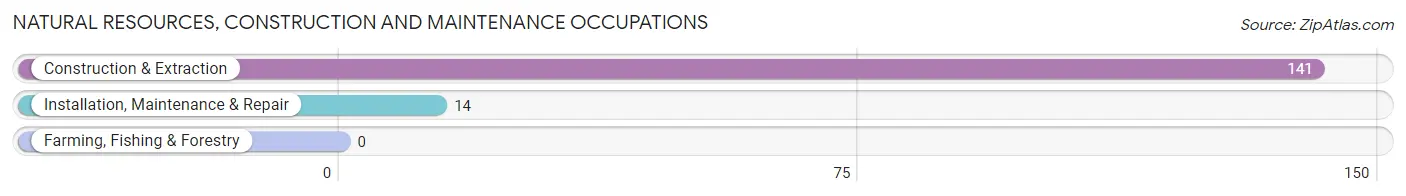
Natural Resources, Construction and Maintenance Occupations
The most common Natural Resources, Construction and Maintenance occupations in South Haven are Construction & Extraction (141 | 8.9%), and Installation, Maintenance & Repair (14 | 0.9%).
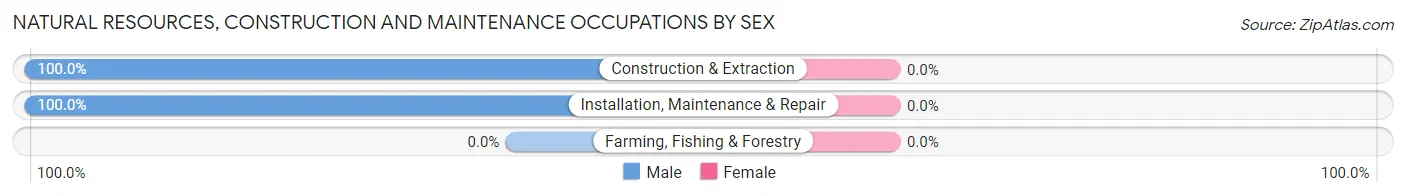
Natural Resources, Construction and Maintenance Occupations by Sex
| Occupation | Male | Female |
| Farming, Fishing & Forestry | 0 (0.0%) | 0 (0.0%) |
| Construction & Extraction | 141 (100.0%) | 0 (0.0%) |
| Installation, Maintenance & Repair | 14 (100.0%) | 0 (0.0%) |
| Total (Category) | 155 (100.0%) | 0 (0.0%) |
| Total (Overall) | 893 (56.3%) | 692 (43.7%) |
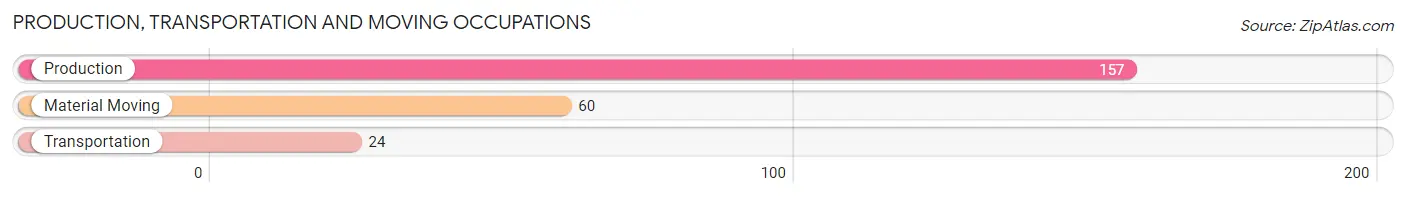
Production, Transportation and Moving Occupations
The most common Production, Transportation and Moving occupations in South Haven are Production (157 | 9.9%), Material Moving (60 | 3.8%), and Transportation (24 | 1.5%).
Production, Transportation and Moving Occupations by Sex
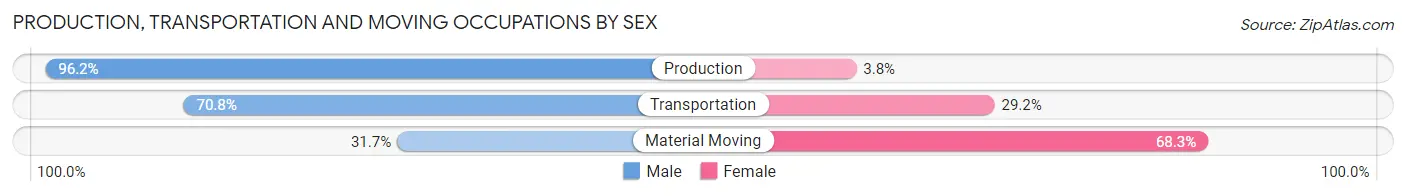
| Occupation | Male | Female |
| Production | 151 (96.2%) | 6 (3.8%) |
| Transportation | 17 (70.8%) | 7 (29.2%) |
| Material Moving | 19 (31.7%) | 41 (68.3%) |
| Total (Category) | 187 (77.6%) | 54 (22.4%) |
| Total (Overall) | 893 (56.3%) | 692 (43.7%) |
Employment Industries by Sex in South Haven
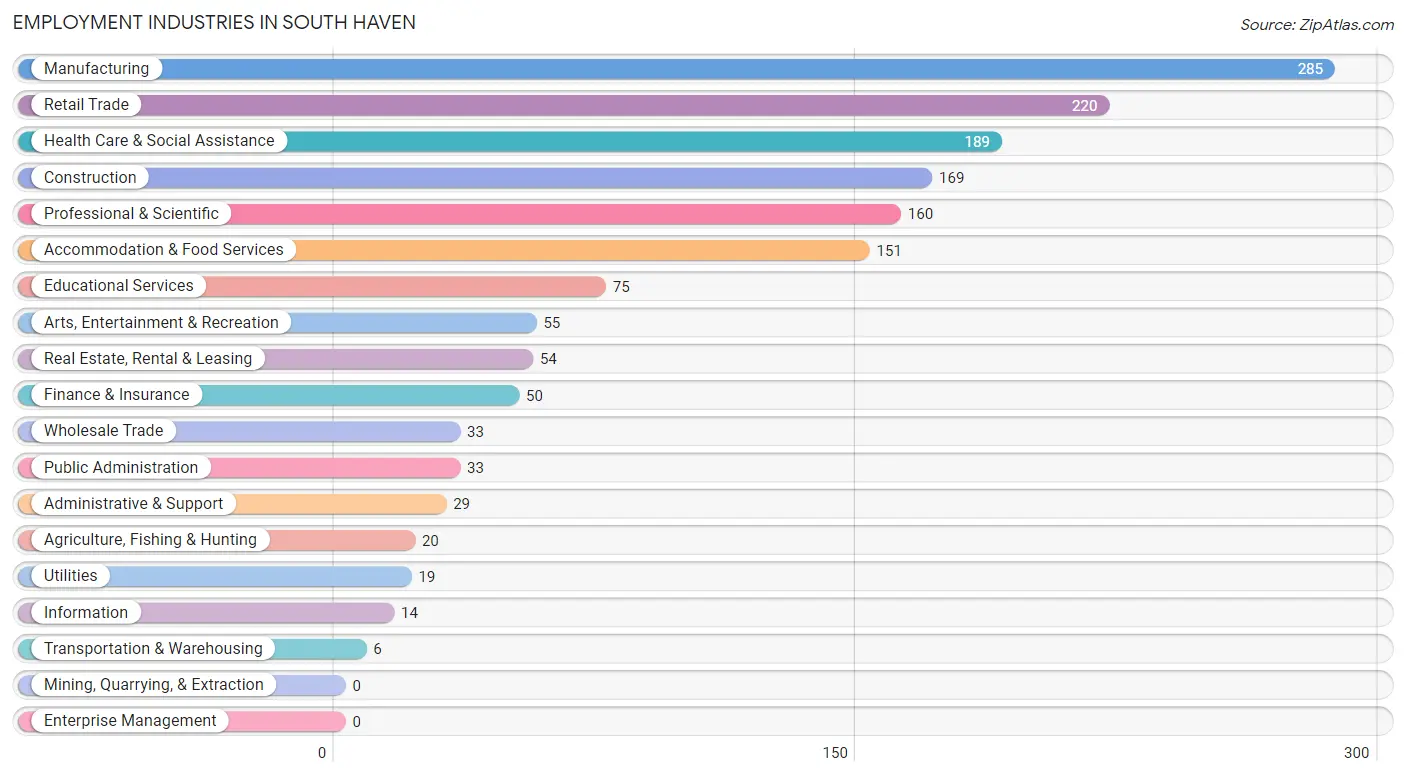
Employment Industries in South Haven
The major employment industries in South Haven include Manufacturing (285 | 18.0%), Retail Trade (220 | 13.9%), Health Care & Social Assistance (189 | 11.9%), Construction (169 | 10.7%), and Professional & Scientific (160 | 10.1%).
Employment Industries by Sex in South Haven
The South Haven industries that see more men than women are Transportation & Warehousing (100.0%), Utilities (100.0%), and Construction (94.7%), whereas the industries that tend to have a higher number of women are Public Administration (100.0%), Health Care & Social Assistance (88.4%), and Accommodation & Food Services (80.1%).
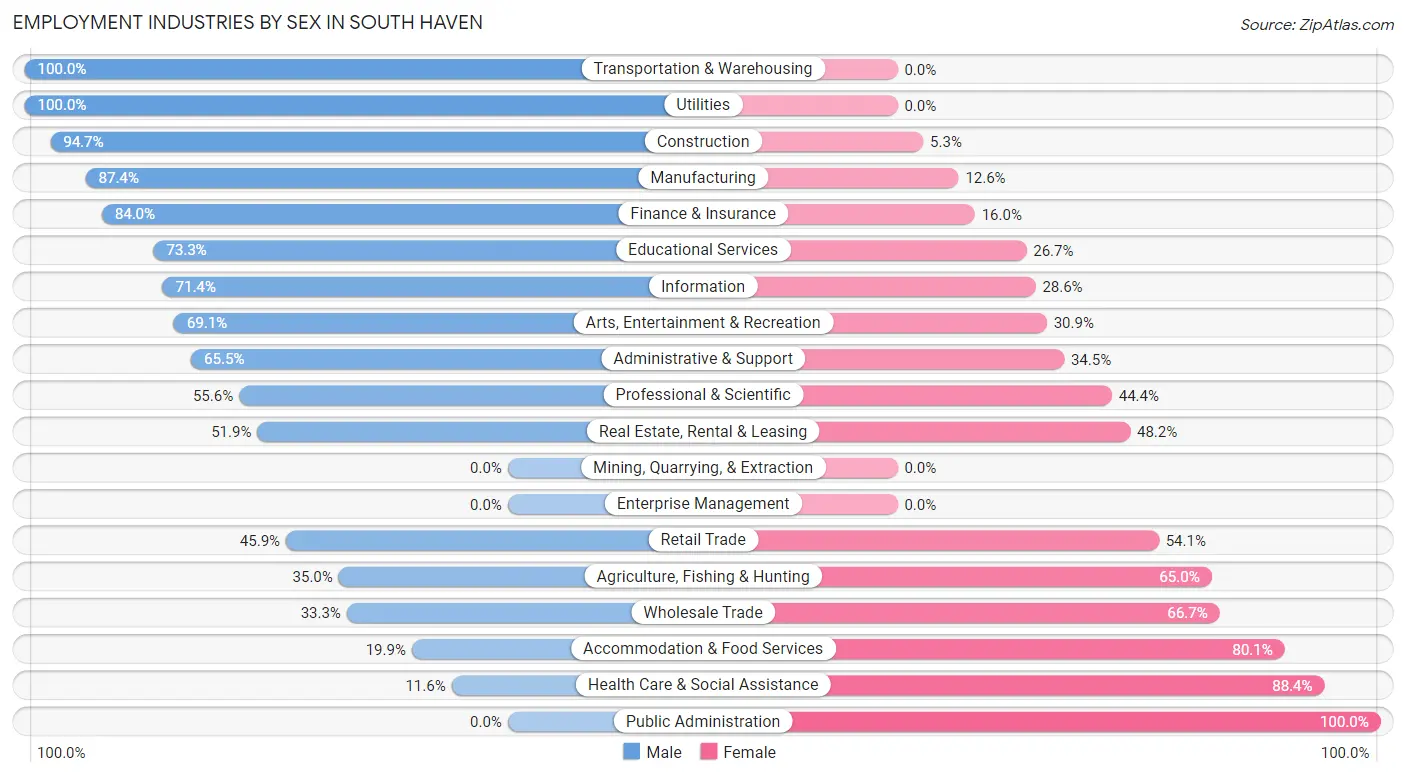
| Industry | Male | Female |
| Agriculture, Fishing & Hunting | 7 (35.0%) | 13 (65.0%) |
| Mining, Quarrying, & Extraction | 0 (0.0%) | 0 (0.0%) |
| Construction | 160 (94.7%) | 9 (5.3%) |
| Manufacturing | 249 (87.4%) | 36 (12.6%) |
| Wholesale Trade | 11 (33.3%) | 22 (66.7%) |
| Retail Trade | 101 (45.9%) | 119 (54.1%) |
| Transportation & Warehousing | 6 (100.0%) | 0 (0.0%) |
| Utilities | 19 (100.0%) | 0 (0.0%) |
| Information | 10 (71.4%) | 4 (28.6%) |
| Finance & Insurance | 42 (84.0%) | 8 (16.0%) |
| Real Estate, Rental & Leasing | 28 (51.8%) | 26 (48.1%) |
| Professional & Scientific | 89 (55.6%) | 71 (44.4%) |
| Enterprise Management | 0 (0.0%) | 0 (0.0%) |
| Administrative & Support | 19 (65.5%) | 10 (34.5%) |
| Educational Services | 55 (73.3%) | 20 (26.7%) |
| Health Care & Social Assistance | 22 (11.6%) | 167 (88.4%) |
| Arts, Entertainment & Recreation | 38 (69.1%) | 17 (30.9%) |
| Accommodation & Food Services | 30 (19.9%) | 121 (80.1%) |
| Public Administration | 0 (0.0%) | 33 (100.0%) |
| Total | 893 (56.3%) | 692 (43.7%) |
Education in South Haven
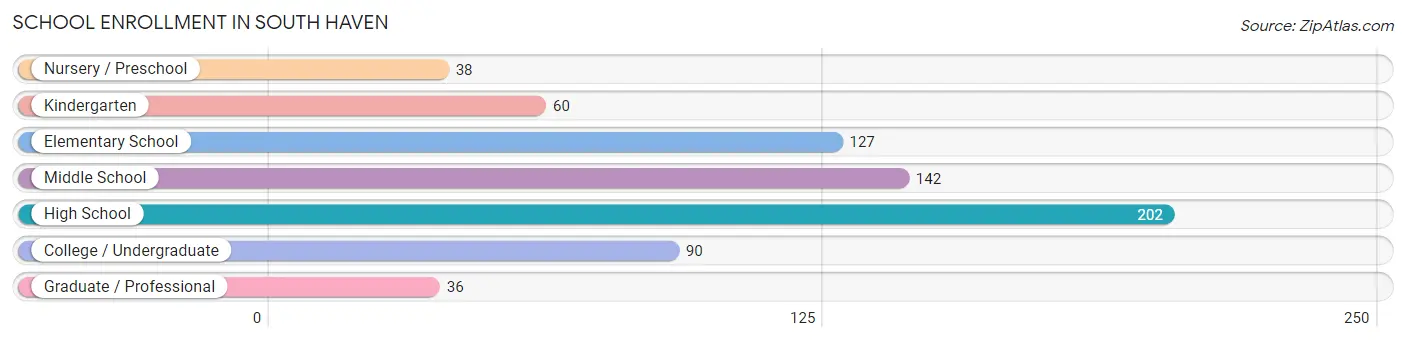
School Enrollment in South Haven
The most common levels of schooling among the 695 students in South Haven are high school (202 | 29.1%), middle school (142 | 20.4%), and elementary school (127 | 18.3%).
| School Level | # Students | % Students |
| Nursery / Preschool | 38 | 5.5% |
| Kindergarten | 60 | 8.6% |
| Elementary School | 127 | 18.3% |
| Middle School | 142 | 20.4% |
| High School | 202 | 29.1% |
| College / Undergraduate | 90 | 13.0% |
| Graduate / Professional | 36 | 5.2% |
| Total | 695 | 100.0% |
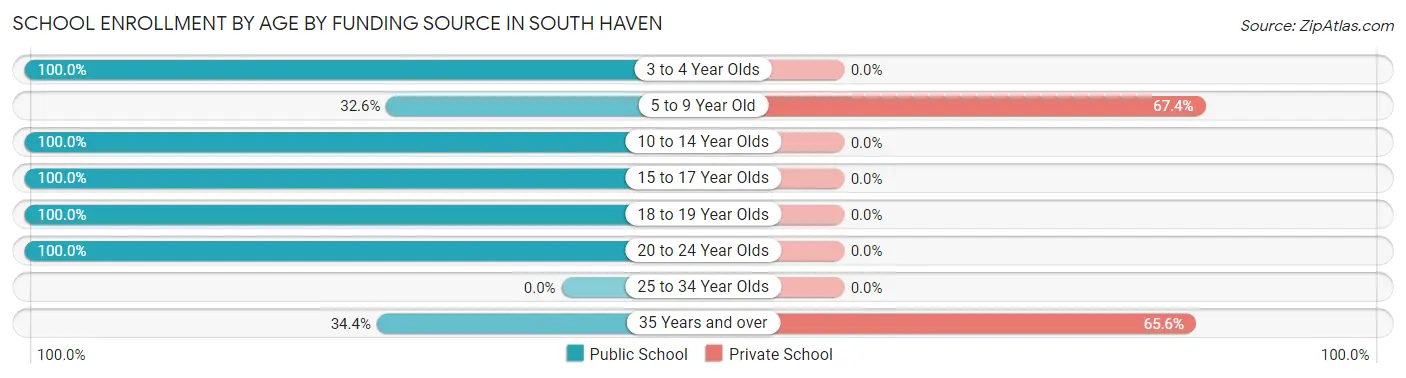
School Enrollment by Age by Funding Source in South Haven
Out of a total of 695 students who are enrolled in schools in South Haven, 189 (27.2%) attend a private institution, while the remaining 506 (72.8%) are enrolled in public schools. The age group of 5 to 9 year old has the highest likelihood of being enrolled in private schools, with 128 (67.4% in the age bracket) enrolled. Conversely, the age group of 3 to 4 year olds has the lowest likelihood of being enrolled in a private school, with 35 (100.0% in the age bracket) attending a public institution.
| Age Bracket | Public School | Private School |
| 3 to 4 Year Olds | 35 (100.0%) | 0 (0.0%) |
| 5 to 9 Year Old | 62 (32.6%) | 128 (67.4%) |
| 10 to 14 Year Olds | 142 (100.0%) | 0 (0.0%) |
| 15 to 17 Year Olds | 138 (100.0%) | 0 (0.0%) |
| 18 to 19 Year Olds | 86 (100.0%) | 0 (0.0%) |
| 20 to 24 Year Olds | 11 (100.0%) | 0 (0.0%) |
| 25 to 34 Year Olds | 0 (0.0%) | 0 (0.0%) |
| 35 Years and over | 32 (34.4%) | 61 (65.6%) |
| Total | 506 (72.8%) | 189 (27.2%) |
Educational Attainment by Field of Study in South Haven
Education (340 | 24.6%), business (253 | 18.3%), science & technology (150 | 10.9%), engineering (93 | 6.7%), and arts & humanities (88 | 6.4%) are the most common fields of study among 1,381 individuals in South Haven who have obtained a bachelor's degree or higher.
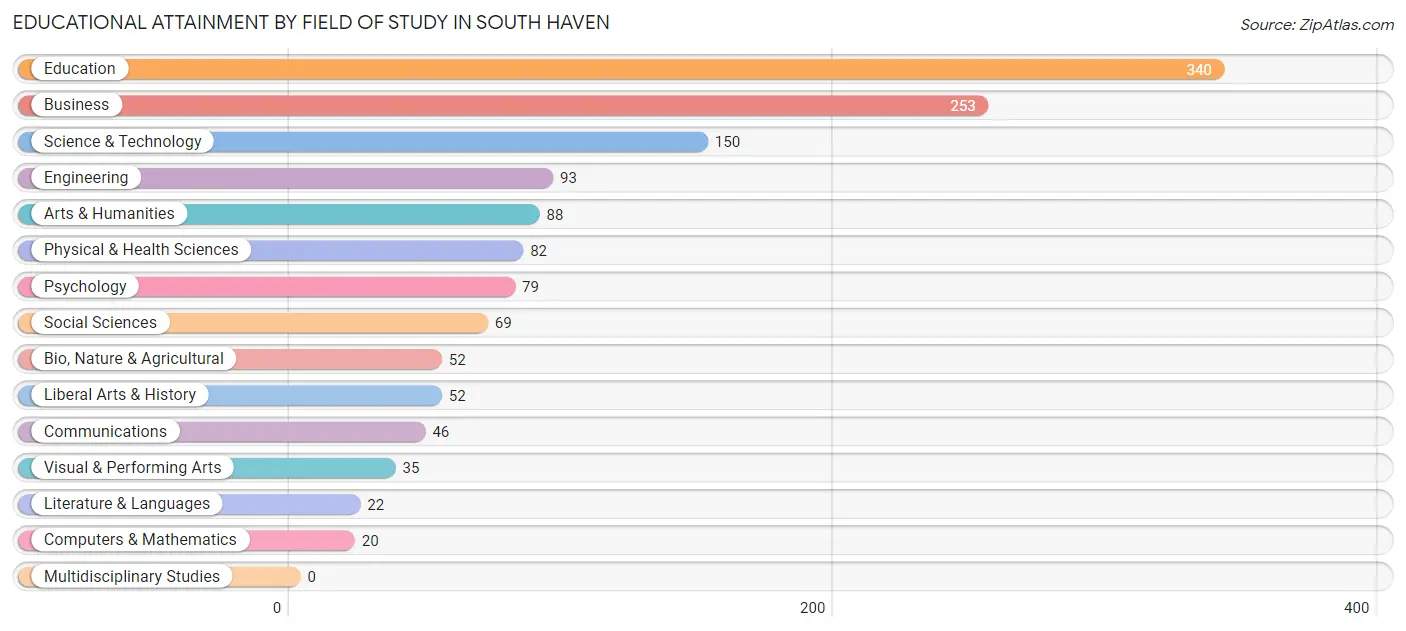
| Field of Study | # Graduates | % Graduates |
| Computers & Mathematics | 20 | 1.5% |
| Bio, Nature & Agricultural | 52 | 3.8% |
| Physical & Health Sciences | 82 | 5.9% |
| Psychology | 79 | 5.7% |
| Social Sciences | 69 | 5.0% |
| Engineering | 93 | 6.7% |
| Multidisciplinary Studies | 0 | 0.0% |
| Science & Technology | 150 | 10.9% |
| Business | 253 | 18.3% |
| Education | 340 | 24.6% |
| Literature & Languages | 22 | 1.6% |
| Liberal Arts & History | 52 | 3.8% |
| Visual & Performing Arts | 35 | 2.5% |
| Communications | 46 | 3.3% |
| Arts & Humanities | 88 | 6.4% |
| Total | 1,381 | 100.0% |
Transportation & Commute in South Haven
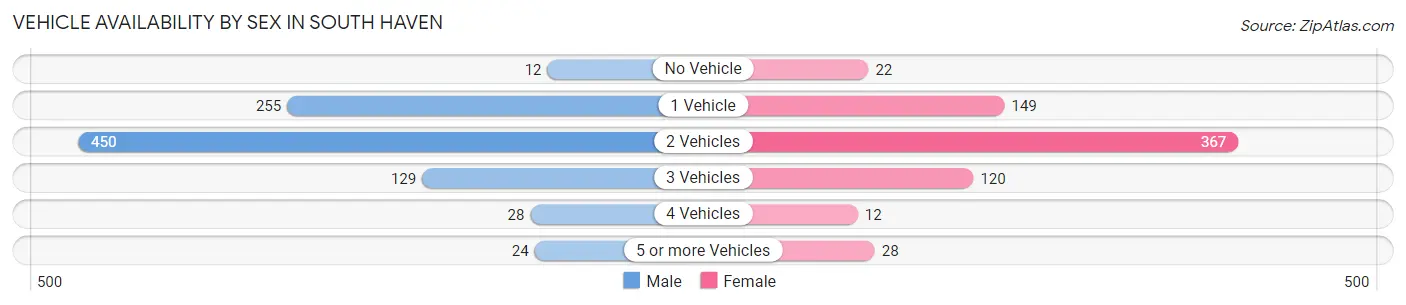
Vehicle Availability by Sex in South Haven
The most prevalent vehicle ownership categories in South Haven are males with 2 vehicles (450, accounting for 50.1%) and females with 2 vehicles (367, making up 64.5%).
| Vehicles Available | Male | Female |
| No Vehicle | 12 (1.3%) | 22 (3.2%) |
| 1 Vehicle | 255 (28.4%) | 149 (21.3%) |
| 2 Vehicles | 450 (50.1%) | 367 (52.6%) |
| 3 Vehicles | 129 (14.4%) | 120 (17.2%) |
| 4 Vehicles | 28 (3.1%) | 12 (1.7%) |
| 5 or more Vehicles | 24 (2.7%) | 28 (4.0%) |
| Total | 898 (100.0%) | 698 (100.0%) |
Commute Time in South Haven
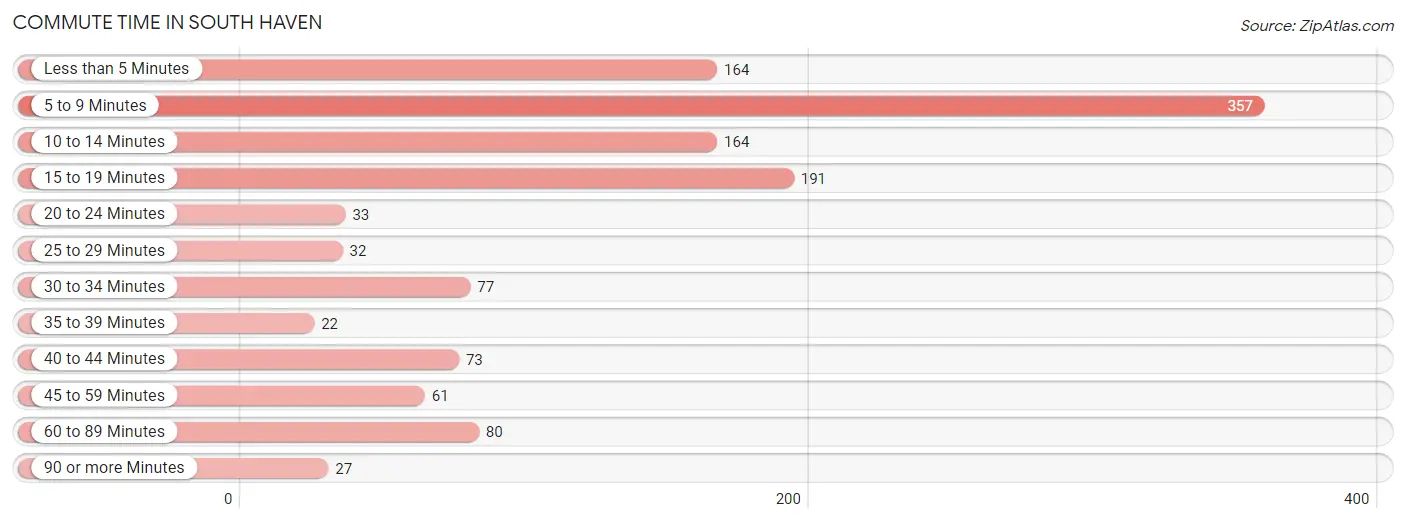
The most frequently occuring commute durations in South Haven are 5 to 9 minutes (357 commuters, 27.9%), 15 to 19 minutes (191 commuters, 14.9%), and less than 5 minutes (164 commuters, 12.8%).
| Commute Time | # Commuters | % Commuters |
| Less than 5 Minutes | 164 | 12.8% |
| 5 to 9 Minutes | 357 | 27.9% |
| 10 to 14 Minutes | 164 | 12.8% |
| 15 to 19 Minutes | 191 | 14.9% |
| 20 to 24 Minutes | 33 | 2.6% |
| 25 to 29 Minutes | 32 | 2.5% |
| 30 to 34 Minutes | 77 | 6.0% |
| 35 to 39 Minutes | 22 | 1.7% |
| 40 to 44 Minutes | 73 | 5.7% |
| 45 to 59 Minutes | 61 | 4.8% |
| 60 to 89 Minutes | 80 | 6.2% |
| 90 or more Minutes | 27 | 2.1% |
Commute Time by Sex in South Haven
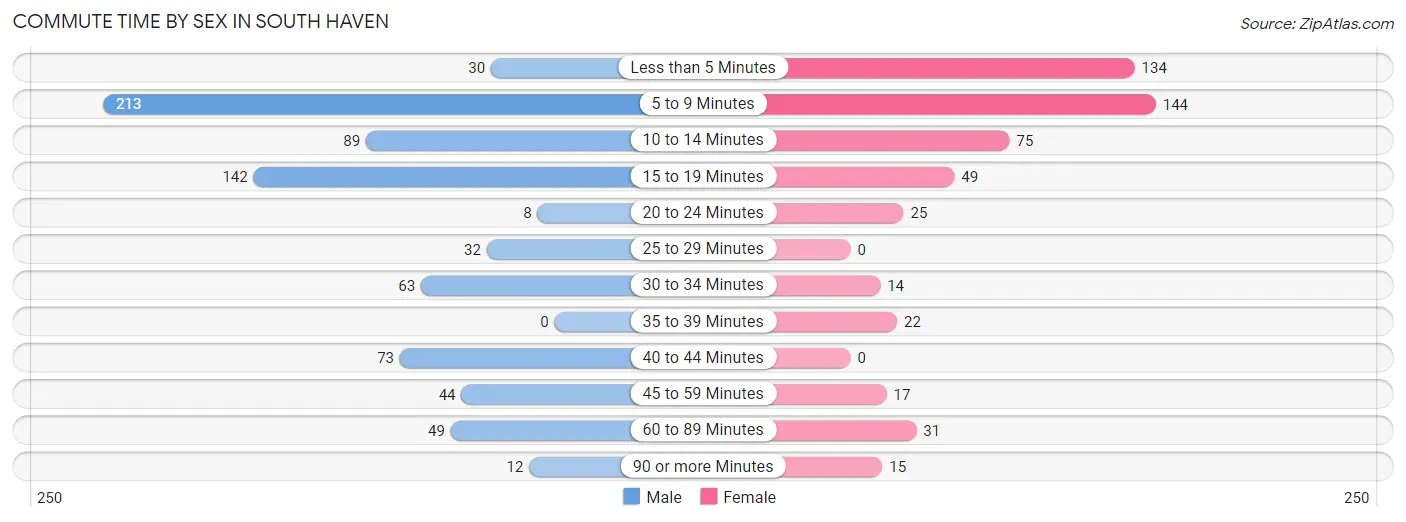
The most common commute times in South Haven are 5 to 9 minutes (213 commuters, 28.2%) for males and 5 to 9 minutes (144 commuters, 27.4%) for females.
| Commute Time | Male | Female |
| Less than 5 Minutes | 30 (4.0%) | 134 (25.5%) |
| 5 to 9 Minutes | 213 (28.2%) | 144 (27.4%) |
| 10 to 14 Minutes | 89 (11.8%) | 75 (14.3%) |
| 15 to 19 Minutes | 142 (18.8%) | 49 (9.3%) |
| 20 to 24 Minutes | 8 (1.1%) | 25 (4.8%) |
| 25 to 29 Minutes | 32 (4.2%) | 0 (0.0%) |
| 30 to 34 Minutes | 63 (8.3%) | 14 (2.7%) |
| 35 to 39 Minutes | 0 (0.0%) | 22 (4.2%) |
| 40 to 44 Minutes | 73 (9.7%) | 0 (0.0%) |
| 45 to 59 Minutes | 44 (5.8%) | 17 (3.2%) |
| 60 to 89 Minutes | 49 (6.5%) | 31 (5.9%) |
| 90 or more Minutes | 12 (1.6%) | 15 (2.9%) |
Time of Departure to Work by Sex in South Haven
The most frequent times of departure to work in South Haven are 8:00 AM to 8:29 AM (130, 17.2%) for males and 7:30 AM to 7:59 AM (101, 19.2%) for females.

| Time of Departure | Male | Female |
| 12:00 AM to 4:59 AM | 74 (9.8%) | 11 (2.1%) |
| 5:00 AM to 5:29 AM | 6 (0.8%) | 15 (2.9%) |
| 5:30 AM to 5:59 AM | 47 (6.2%) | 0 (0.0%) |
| 6:00 AM to 6:29 AM | 53 (7.0%) | 6 (1.1%) |
| 6:30 AM to 6:59 AM | 60 (8.0%) | 9 (1.7%) |
| 7:00 AM to 7:29 AM | 126 (16.7%) | 57 (10.8%) |
| 7:30 AM to 7:59 AM | 56 (7.4%) | 101 (19.2%) |
| 8:00 AM to 8:29 AM | 130 (17.2%) | 86 (16.4%) |
| 8:30 AM to 8:59 AM | 15 (2.0%) | 66 (12.6%) |
| 9:00 AM to 9:59 AM | 69 (9.1%) | 33 (6.3%) |
| 10:00 AM to 10:59 AM | 12 (1.6%) | 37 (7.0%) |
| 11:00 AM to 11:59 AM | 10 (1.3%) | 16 (3.0%) |
| 12:00 PM to 3:59 PM | 41 (5.4%) | 42 (8.0%) |
| 4:00 PM to 11:59 PM | 56 (7.4%) | 47 (8.9%) |
| Total | 755 (100.0%) | 526 (100.0%) |
Housing Occupancy in South Haven
Occupancy by Ownership in South Haven
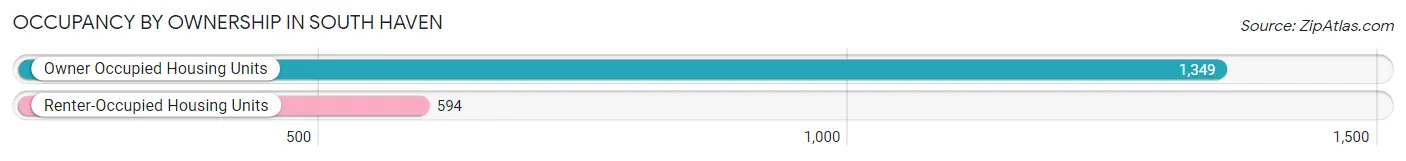
Of the total 1,943 dwellings in South Haven, owner-occupied units account for 1,349 (69.4%), while renter-occupied units make up 594 (30.6%).
| Occupancy | # Housing Units | % Housing Units |
| Owner Occupied Housing Units | 1,349 | 69.4% |
| Renter-Occupied Housing Units | 594 | 30.6% |
| Total Occupied Housing Units | 1,943 | 100.0% |
Occupancy by Household Size in South Haven
| Household Size | # Housing Units | % Housing Units |
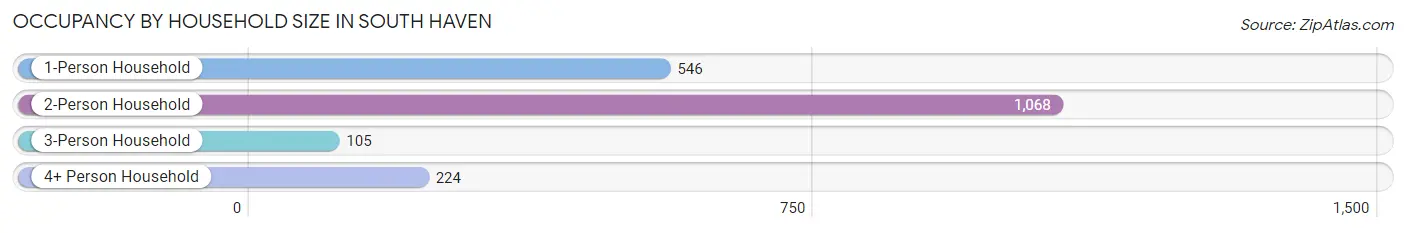
| 1-Person Household | 546 | 28.1% |
| 2-Person Household | 1,068 | 55.0% |
| 3-Person Household | 105 | 5.4% |
| 4+ Person Household | 224 | 11.5% |
| Total Housing Units | 1,943 | 100.0% |
Occupancy by Ownership by Household Size in South Haven
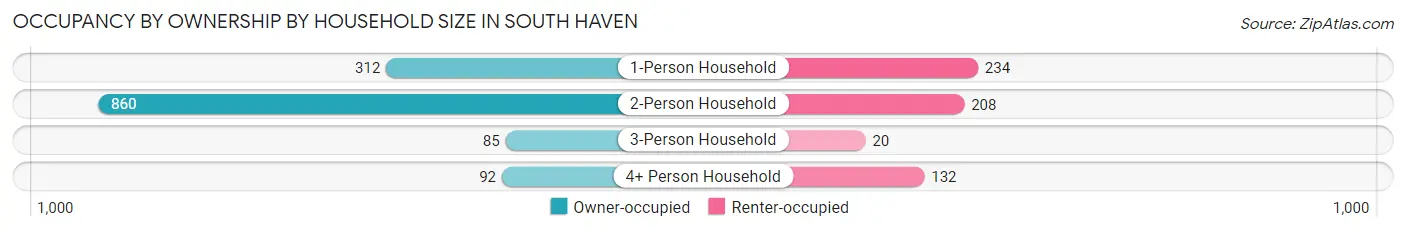
| Household Size | Owner-occupied | Renter-occupied |
| 1-Person Household | 312 (57.1%) | 234 (42.9%) |
| 2-Person Household | 860 (80.5%) | 208 (19.5%) |
| 3-Person Household | 85 (80.9%) | 20 (19.1%) |
| 4+ Person Household | 92 (41.1%) | 132 (58.9%) |
| Total Housing Units | 1,349 (69.4%) | 594 (30.6%) |
Occupancy by Educational Attainment in South Haven
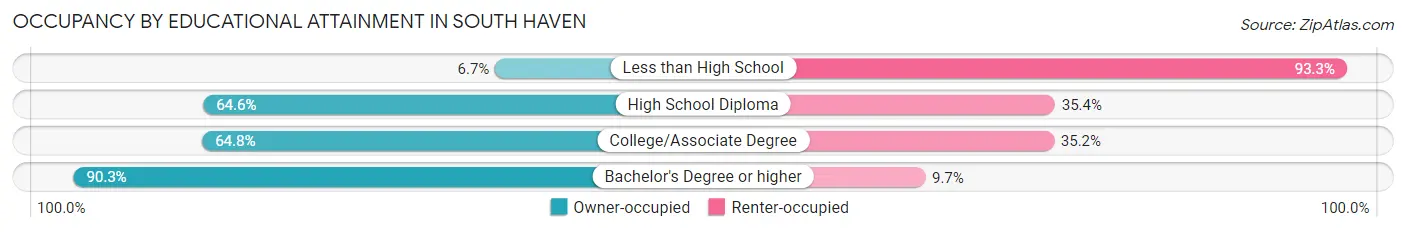
| Household Size | Owner-occupied | Renter-occupied |
| Less than High School | 12 (6.7%) | 167 (93.3%) |
| High School Diploma | 248 (64.6%) | 136 (35.4%) |
| College/Associate Degree | 399 (64.8%) | 217 (35.2%) |
| Bachelor's Degree or higher | 690 (90.3%) | 74 (9.7%) |
Occupancy by Age of Householder in South Haven
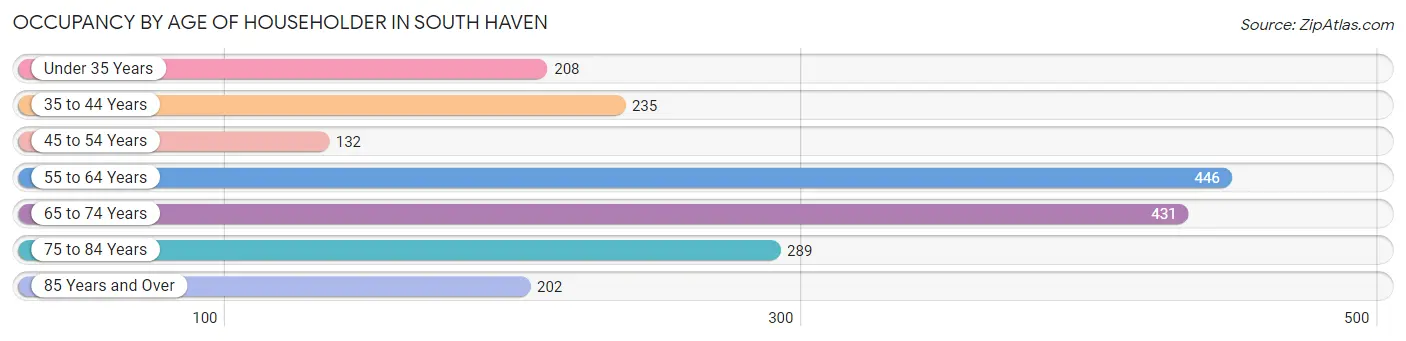
| Age Bracket | # Households | % Households |
| Under 35 Years | 208 | 10.7% |
| 35 to 44 Years | 235 | 12.1% |
| 45 to 54 Years | 132 | 6.8% |
| 55 to 64 Years | 446 | 23.0% |
| 65 to 74 Years | 431 | 22.2% |
| 75 to 84 Years | 289 | 14.9% |
| 85 Years and Over | 202 | 10.4% |
| Total | 1,943 | 100.0% |
Housing Finances in South Haven
Median Income by Occupancy in South Haven
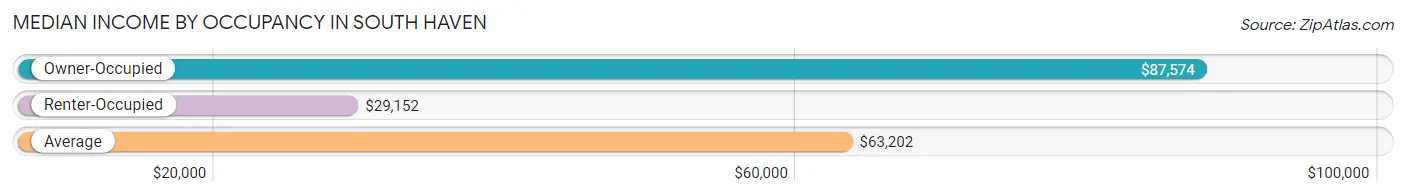
| Occupancy Type | # Households | Median Income |
| Owner-Occupied | 1,349 (69.4%) | $87,574 |
| Renter-Occupied | 594 (30.6%) | $29,152 |
| Average | 1,943 (100.0%) | $63,202 |
Occupancy by Householder Income Bracket in South Haven
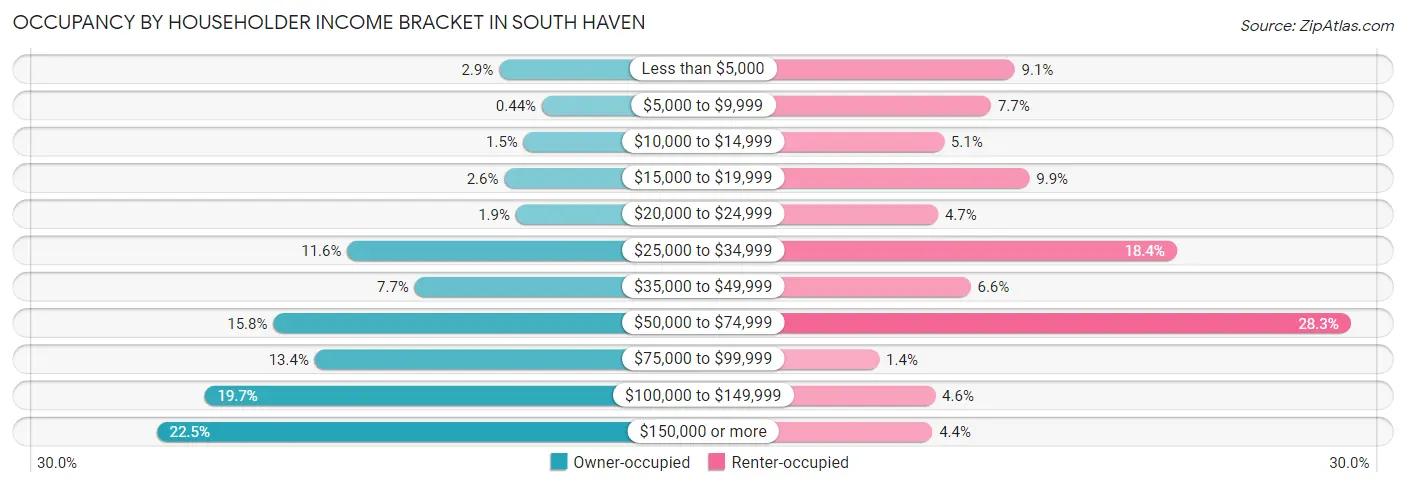
| Income Bracket | Owner-occupied | Renter-occupied |
| Less than $5,000 | 39 (2.9%) | 54 (9.1%) |
| $5,000 to $9,999 | 6 (0.4%) | 46 (7.7%) |
| $10,000 to $14,999 | 20 (1.5%) | 30 (5.1%) |
| $15,000 to $19,999 | 35 (2.6%) | 59 (9.9%) |
| $20,000 to $24,999 | 26 (1.9%) | 28 (4.7%) |
| $25,000 to $34,999 | 156 (11.6%) | 109 (18.3%) |
| $35,000 to $49,999 | 104 (7.7%) | 39 (6.6%) |
| $50,000 to $74,999 | 213 (15.8%) | 168 (28.3%) |
| $75,000 to $99,999 | 181 (13.4%) | 8 (1.3%) |
| $100,000 to $149,999 | 266 (19.7%) | 27 (4.5%) |
| $150,000 or more | 303 (22.5%) | 26 (4.4%) |
| Total | 1,349 (100.0%) | 594 (100.0%) |
Monthly Housing Cost Tiers in South Haven
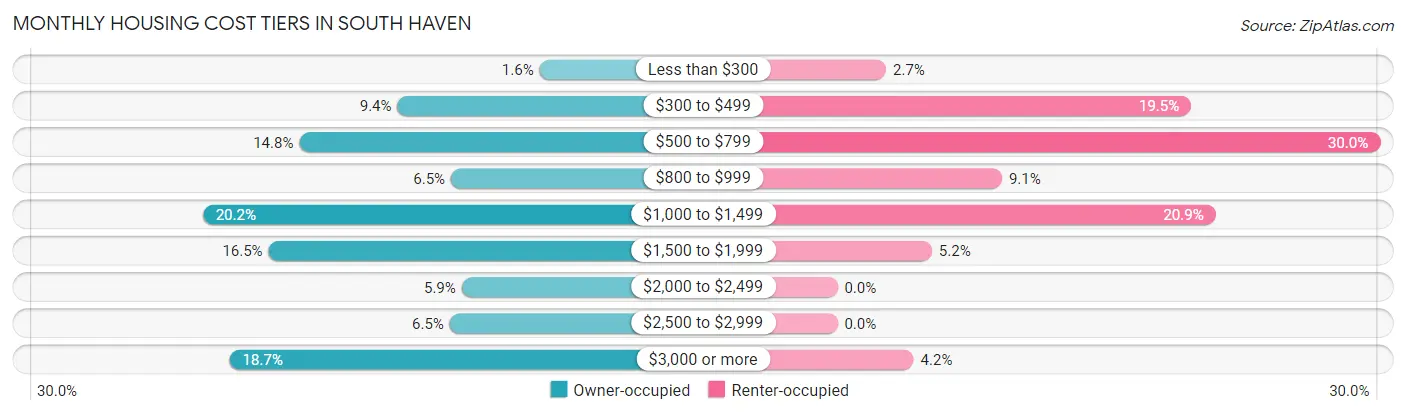
| Monthly Cost | Owner-occupied | Renter-occupied |
| Less than $300 | 21 (1.6%) | 16 (2.7%) |
| $300 to $499 | 127 (9.4%) | 116 (19.5%) |
| $500 to $799 | 200 (14.8%) | 178 (30.0%) |
| $800 to $999 | 87 (6.5%) | 54 (9.1%) |
| $1,000 to $1,499 | 272 (20.2%) | 124 (20.9%) |
| $1,500 to $1,999 | 223 (16.5%) | 31 (5.2%) |
| $2,000 to $2,499 | 79 (5.9%) | 0 (0.0%) |
| $2,500 to $2,999 | 88 (6.5%) | 0 (0.0%) |
| $3,000 or more | 252 (18.7%) | 25 (4.2%) |
| Total | 1,349 (100.0%) | 594 (100.0%) |
Physical Housing Characteristics in South Haven
Housing Structures in South Haven
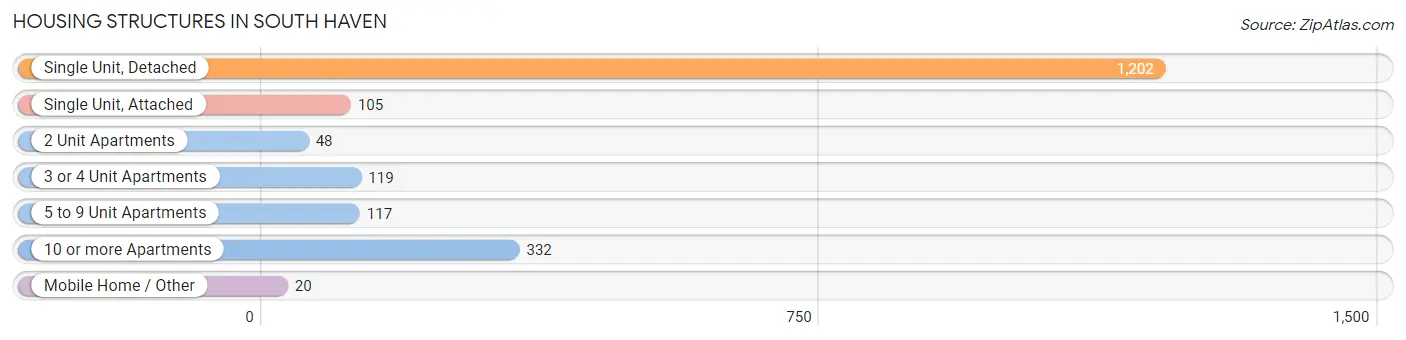
| Structure Type | # Housing Units | % Housing Units |
| Single Unit, Detached | 1,202 | 61.9% |
| Single Unit, Attached | 105 | 5.4% |
| 2 Unit Apartments | 48 | 2.5% |
| 3 or 4 Unit Apartments | 119 | 6.1% |
| 5 to 9 Unit Apartments | 117 | 6.0% |
| 10 or more Apartments | 332 | 17.1% |
| Mobile Home / Other | 20 | 1.0% |
| Total | 1,943 | 100.0% |
Housing Structures by Occupancy in South Haven
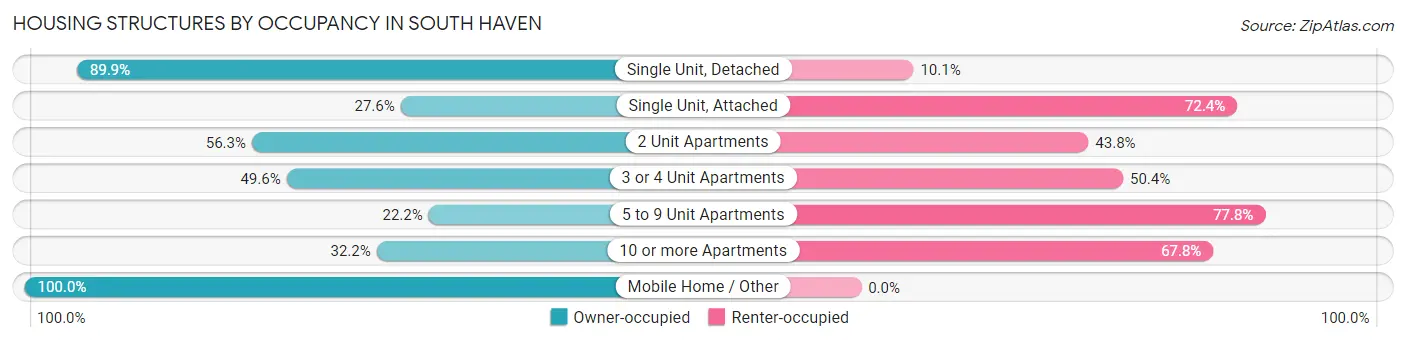
| Structure Type | Owner-occupied | Renter-occupied |
| Single Unit, Detached | 1,081 (89.9%) | 121 (10.1%) |
| Single Unit, Attached | 29 (27.6%) | 76 (72.4%) |
| 2 Unit Apartments | 27 (56.2%) | 21 (43.8%) |
| 3 or 4 Unit Apartments | 59 (49.6%) | 60 (50.4%) |
| 5 to 9 Unit Apartments | 26 (22.2%) | 91 (77.8%) |
| 10 or more Apartments | 107 (32.2%) | 225 (67.8%) |
| Mobile Home / Other | 20 (100.0%) | 0 (0.0%) |
| Total | 1,349 (69.4%) | 594 (30.6%) |
Housing Structures by Number of Rooms in South Haven
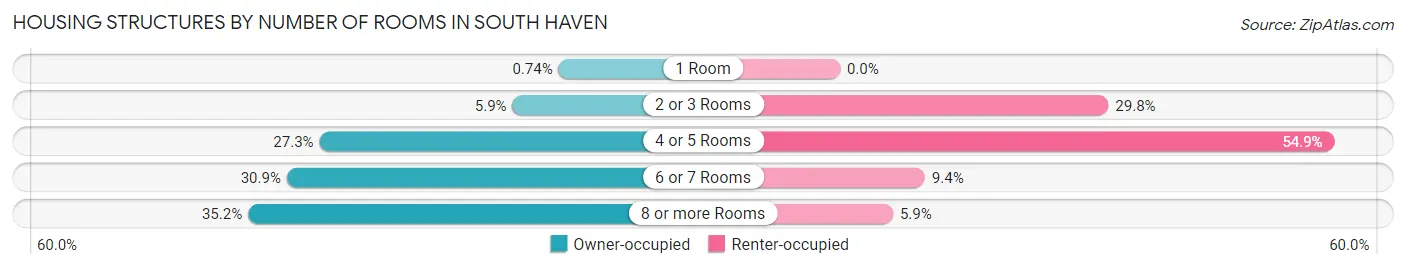
| Number of Rooms | Owner-occupied | Renter-occupied |
| 1 Room | 10 (0.7%) | 0 (0.0%) |
| 2 or 3 Rooms | 79 (5.9%) | 177 (29.8%) |
| 4 or 5 Rooms | 368 (27.3%) | 326 (54.9%) |
| 6 or 7 Rooms | 417 (30.9%) | 56 (9.4%) |
| 8 or more Rooms | 475 (35.2%) | 35 (5.9%) |
| Total | 1,349 (100.0%) | 594 (100.0%) |
Housing Structure by Heating Type in South Haven
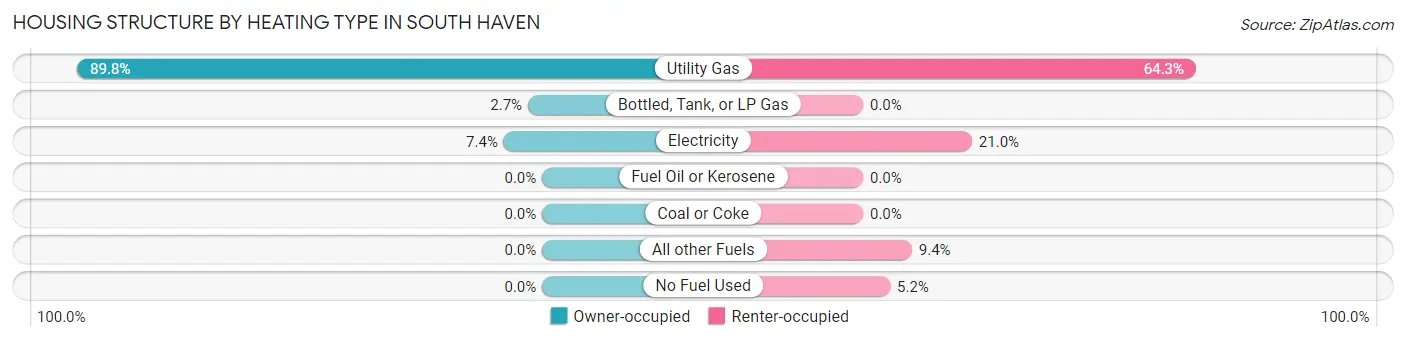
| Heating Type | Owner-occupied | Renter-occupied |
| Utility Gas | 1,212 (89.8%) | 382 (64.3%) |
| Bottled, Tank, or LP Gas | 37 (2.7%) | 0 (0.0%) |
| Electricity | 100 (7.4%) | 125 (21.0%) |
| Fuel Oil or Kerosene | 0 (0.0%) | 0 (0.0%) |
| Coal or Coke | 0 (0.0%) | 0 (0.0%) |
| All other Fuels | 0 (0.0%) | 56 (9.4%) |
| No Fuel Used | 0 (0.0%) | 31 (5.2%) |
| Total | 1,349 (100.0%) | 594 (100.0%) |
Household Vehicle Usage in South Haven
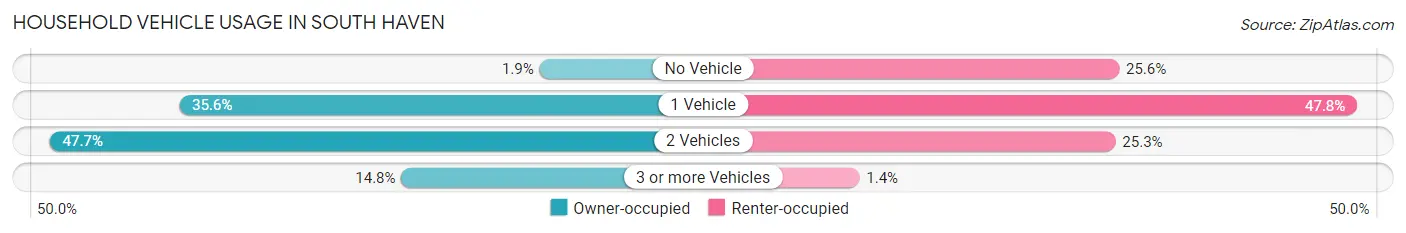
| Vehicles per Household | Owner-occupied | Renter-occupied |
| No Vehicle | 26 (1.9%) | 152 (25.6%) |
| 1 Vehicle | 480 (35.6%) | 284 (47.8%) |
| 2 Vehicles | 643 (47.7%) | 150 (25.3%) |
| 3 or more Vehicles | 200 (14.8%) | 8 (1.3%) |
| Total | 1,349 (100.0%) | 594 (100.0%) |
Real Estate & Mortgages in South Haven
Real Estate and Mortgage Overview in South Haven
| Characteristic | Without Mortgage | With Mortgage |
| Housing Units | 539 | 810 |
| Median Property Value | $312,800 | $367,500 |
| Median Household Income | $89,044 | $198 |
| Monthly Housing Costs | $762 | $252 |
| Real Estate Taxes | $5,266 | $0 |
Property Value by Mortgage Status in South Haven
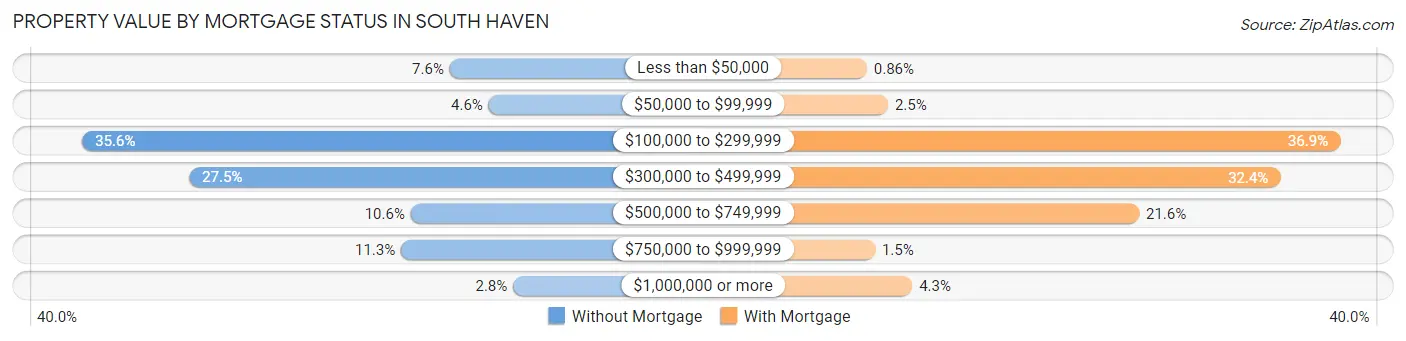
| Property Value | Without Mortgage | With Mortgage |
| Less than $50,000 | 41 (7.6%) | 7 (0.9%) |
| $50,000 to $99,999 | 25 (4.6%) | 20 (2.5%) |
| $100,000 to $299,999 | 192 (35.6%) | 299 (36.9%) |
| $300,000 to $499,999 | 148 (27.5%) | 262 (32.4%) |
| $500,000 to $749,999 | 57 (10.6%) | 175 (21.6%) |
| $750,000 to $999,999 | 61 (11.3%) | 12 (1.5%) |
| $1,000,000 or more | 15 (2.8%) | 35 (4.3%) |
| Total | 539 (100.0%) | 810 (100.0%) |
Household Income by Mortgage Status in South Haven
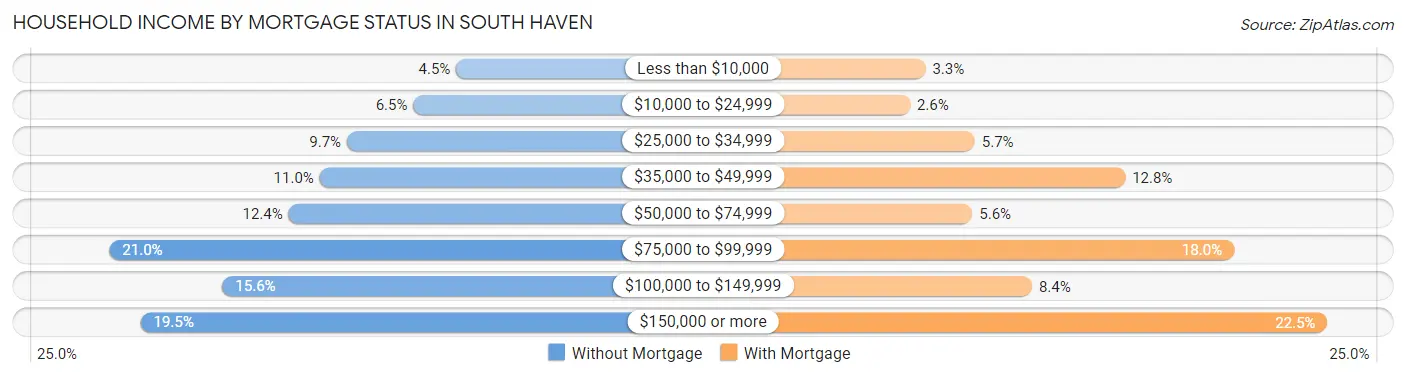
| Household Income | Without Mortgage | With Mortgage |
| Less than $10,000 | 24 (4.4%) | 27 (3.3%) |
| $10,000 to $24,999 | 35 (6.5%) | 21 (2.6%) |
| $25,000 to $34,999 | 52 (9.7%) | 46 (5.7%) |
| $35,000 to $49,999 | 59 (11.0%) | 104 (12.8%) |
| $50,000 to $74,999 | 67 (12.4%) | 45 (5.6%) |
| $75,000 to $99,999 | 113 (21.0%) | 146 (18.0%) |
| $100,000 to $149,999 | 84 (15.6%) | 68 (8.4%) |
| $150,000 or more | 105 (19.5%) | 182 (22.5%) |
| Total | 539 (100.0%) | 810 (100.0%) |
Property Value to Household Income Ratio in South Haven
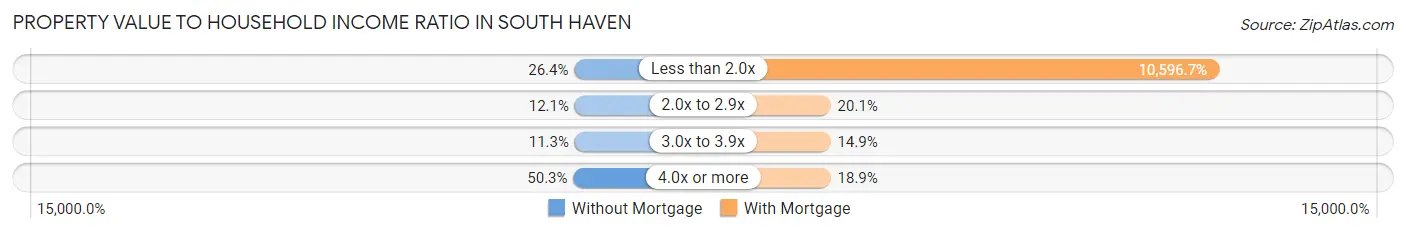
| Value-to-Income Ratio | Without Mortgage | With Mortgage |
| Less than 2.0x | 142 (26.4%) | 85,833 (10,596.7%) |
| 2.0x to 2.9x | 65 (12.1%) | 163 (20.1%) |
| 3.0x to 3.9x | 61 (11.3%) | 121 (14.9%) |
| 4.0x or more | 271 (50.3%) | 153 (18.9%) |
| Total | 539 (100.0%) | 810 (100.0%) |
Real Estate Taxes by Mortgage Status in South Haven
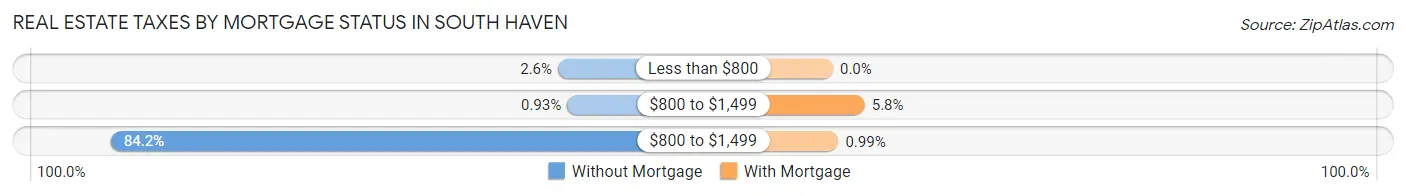
| Property Taxes | Without Mortgage | With Mortgage |
| Less than $800 | 14 (2.6%) | 0 (0.0%) |
| $800 to $1,499 | 5 (0.9%) | 47 (5.8%) |
| $800 to $1,499 | 454 (84.2%) | 8 (1.0%) |
| Total | 539 (100.0%) | 810 (100.0%) |
Health & Disability in South Haven
Health Insurance Coverage by Age in South Haven
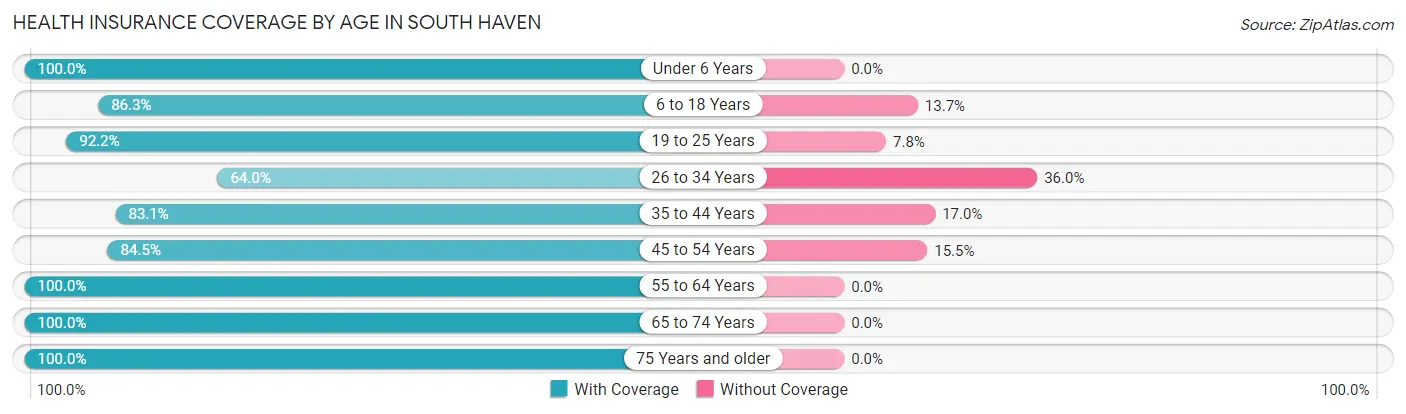
| Age Bracket | With Coverage | Without Coverage |
| Under 6 Years | 199 (100.0%) | 0 (0.0%) |
| 6 to 18 Years | 446 (86.3%) | 71 (13.7%) |
| 19 to 25 Years | 142 (92.2%) | 12 (7.8%) |
| 26 to 34 Years | 137 (64.0%) | 77 (36.0%) |
| 35 to 44 Years | 289 (83.1%) | 59 (17.0%) |
| 45 to 54 Years | 213 (84.5%) | 39 (15.5%) |
| 55 to 64 Years | 670 (100.0%) | 0 (0.0%) |
| 65 to 74 Years | 775 (100.0%) | 0 (0.0%) |
| 75 Years and older | 721 (100.0%) | 0 (0.0%) |
| Total | 3,592 (93.3%) | 258 (6.7%) |
Health Insurance Coverage by Citizenship Status in South Haven
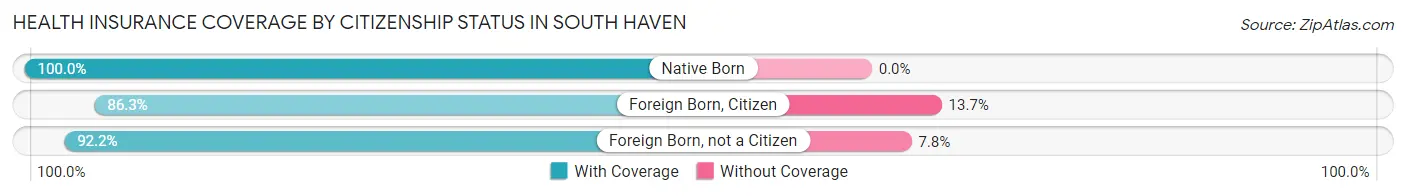
| Citizenship Status | With Coverage | Without Coverage |
| Native Born | 199 (100.0%) | 0 (0.0%) |
| Foreign Born, Citizen | 446 (86.3%) | 71 (13.7%) |
| Foreign Born, not a Citizen | 142 (92.2%) | 12 (7.8%) |
Health Insurance Coverage by Household Income in South Haven
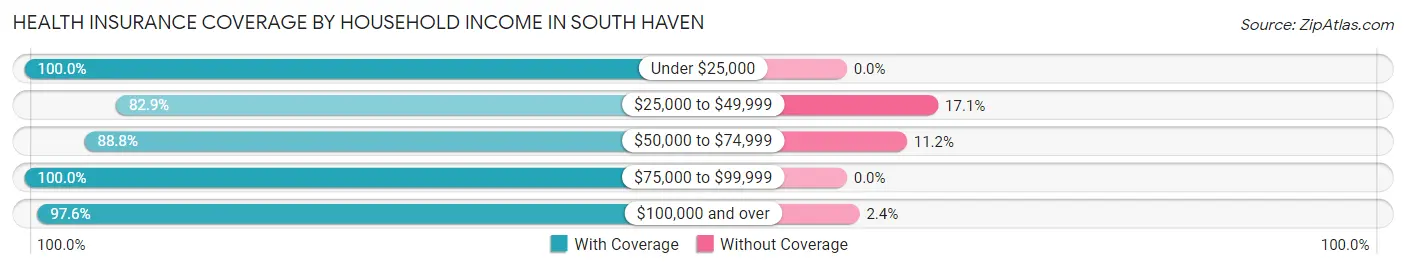
| Household Income | With Coverage | Without Coverage |
| Under $25,000 | 569 (100.0%) | 0 (0.0%) |
| $25,000 to $49,999 | 639 (82.9%) | 132 (17.1%) |
| $50,000 to $74,999 | 750 (88.8%) | 95 (11.2%) |
| $75,000 to $99,999 | 362 (100.0%) | 0 (0.0%) |
| $100,000 and over | 1,272 (97.6%) | 31 (2.4%) |
Public vs Private Health Insurance Coverage by Age in South Haven
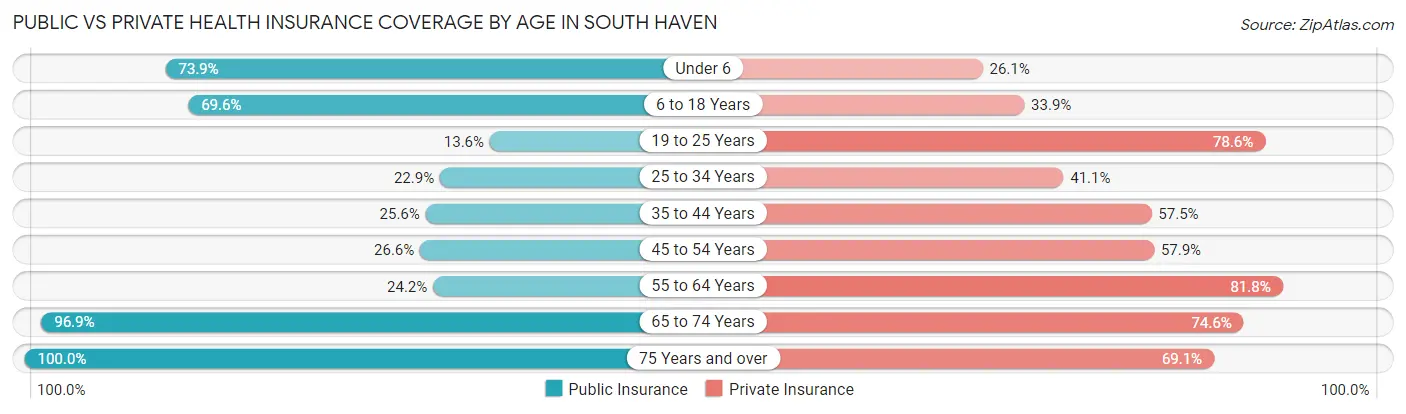
| Age Bracket | Public Insurance | Private Insurance |
| Under 6 | 147 (73.9%) | 52 (26.1%) |
| 6 to 18 Years | 360 (69.6%) | 175 (33.9%) |
| 19 to 25 Years | 21 (13.6%) | 121 (78.6%) |
| 25 to 34 Years | 49 (22.9%) | 88 (41.1%) |
| 35 to 44 Years | 89 (25.6%) | 200 (57.5%) |
| 45 to 54 Years | 67 (26.6%) | 146 (57.9%) |
| 55 to 64 Years | 162 (24.2%) | 548 (81.8%) |
| 65 to 74 Years | 751 (96.9%) | 578 (74.6%) |
| 75 Years and over | 721 (100.0%) | 498 (69.1%) |
| Total | 2,367 (61.5%) | 2,406 (62.5%) |
Disability Status by Sex by Age in South Haven
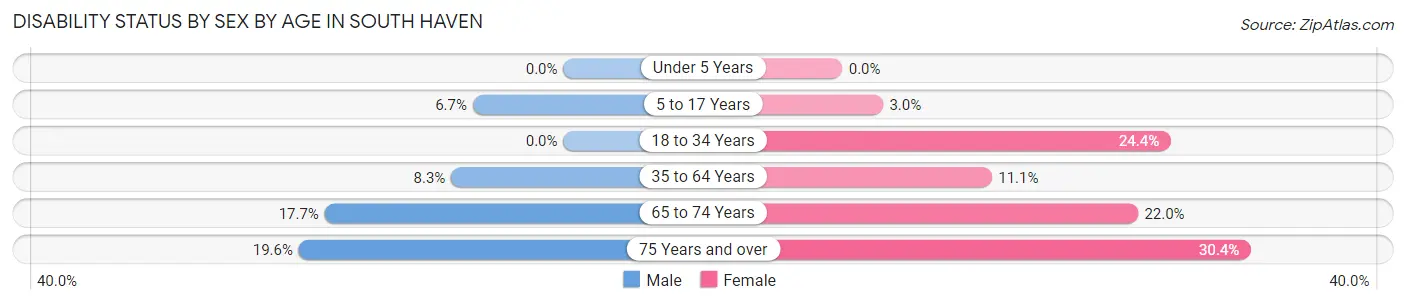
| Age Bracket | Male | Female |
| Under 5 Years | 0 (0.0%) | 0 (0.0%) |
| 5 to 17 Years | 16 (6.7%) | 7 (3.0%) |
| 18 to 34 Years | 0 (0.0%) | 44 (24.4%) |
| 35 to 64 Years | 48 (8.3%) | 77 (11.1%) |
| 65 to 74 Years | 59 (17.7%) | 97 (22.0%) |
| 75 Years and over | 66 (19.6%) | 117 (30.4%) |
Disability Class by Sex by Age in South Haven
Disability Class: Hearing Difficulty
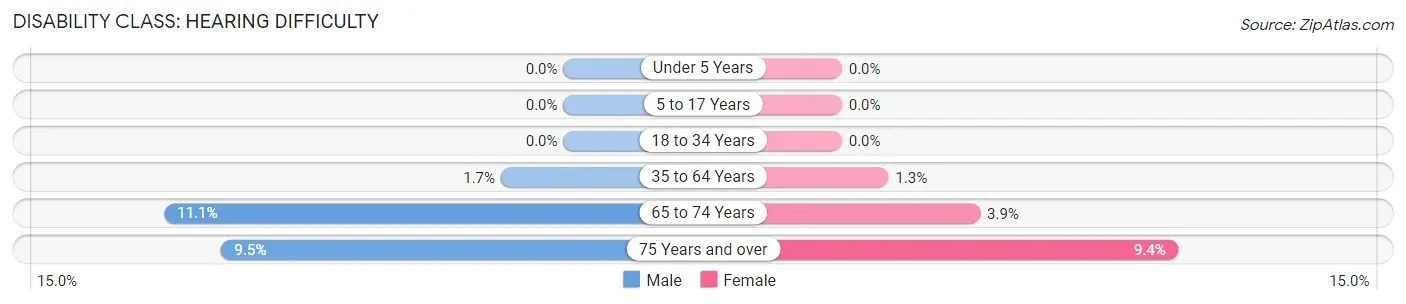
| Age Bracket | Male | Female |
| Under 5 Years | 0 (0.0%) | 0 (0.0%) |
| 5 to 17 Years | 0 (0.0%) | 0 (0.0%) |
| 18 to 34 Years | 0 (0.0%) | 0 (0.0%) |
| 35 to 64 Years | 10 (1.7%) | 9 (1.3%) |
| 65 to 74 Years | 37 (11.1%) | 17 (3.8%) |
| 75 Years and over | 32 (9.5%) | 36 (9.3%) |
Disability Class: Vision Difficulty
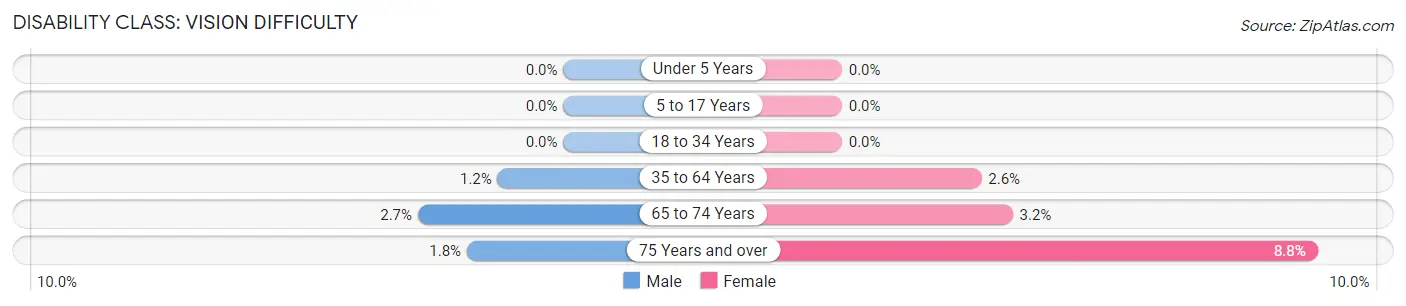
| Age Bracket | Male | Female |
| Under 5 Years | 0 (0.0%) | 0 (0.0%) |
| 5 to 17 Years | 0 (0.0%) | 0 (0.0%) |
| 18 to 34 Years | 0 (0.0%) | 0 (0.0%) |
| 35 to 64 Years | 7 (1.2%) | 18 (2.6%) |
| 65 to 74 Years | 9 (2.7%) | 14 (3.2%) |
| 75 Years and over | 6 (1.8%) | 34 (8.8%) |
Disability Class: Cognitive Difficulty
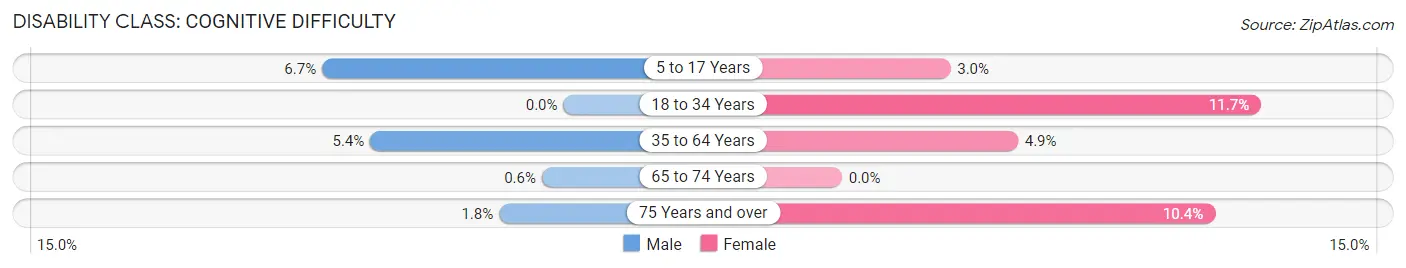
| Age Bracket | Male | Female |
| 5 to 17 Years | 16 (6.7%) | 7 (3.0%) |
| 18 to 34 Years | 0 (0.0%) | 21 (11.7%) |
| 35 to 64 Years | 31 (5.4%) | 34 (4.9%) |
| 65 to 74 Years | 2 (0.6%) | 0 (0.0%) |
| 75 Years and over | 6 (1.8%) | 40 (10.4%) |
Disability Class: Ambulatory Difficulty
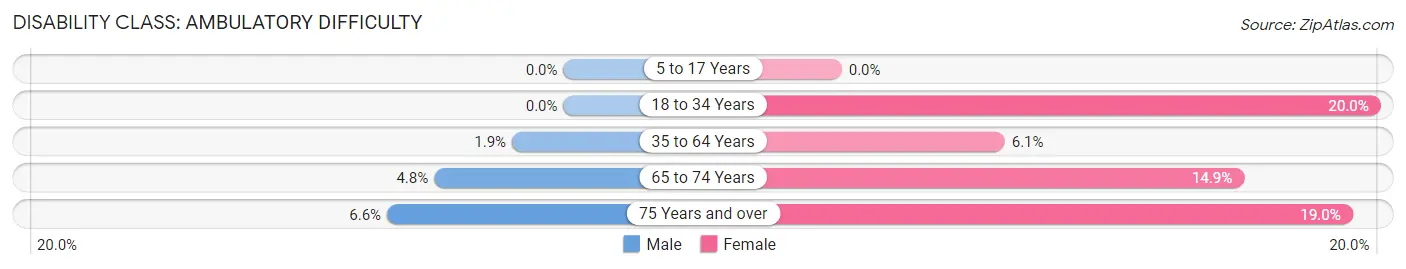
| Age Bracket | Male | Female |
| 5 to 17 Years | 0 (0.0%) | 0 (0.0%) |
| 18 to 34 Years | 0 (0.0%) | 36 (20.0%) |
| 35 to 64 Years | 11 (1.9%) | 42 (6.0%) |
| 65 to 74 Years | 16 (4.8%) | 66 (14.9%) |
| 75 Years and over | 22 (6.6%) | 73 (19.0%) |
Disability Class: Self-Care Difficulty
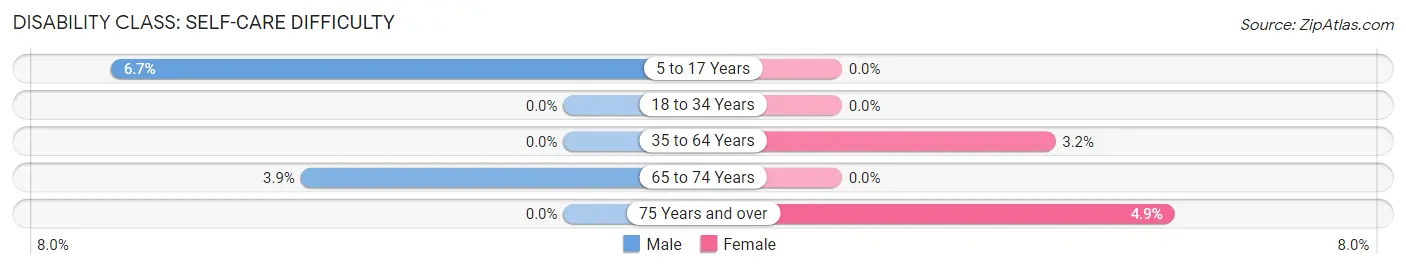
| Age Bracket | Male | Female |
| 5 to 17 Years | 16 (6.7%) | 0 (0.0%) |
| 18 to 34 Years | 0 (0.0%) | 0 (0.0%) |
| 35 to 64 Years | 0 (0.0%) | 22 (3.2%) |
| 65 to 74 Years | 13 (3.9%) | 0 (0.0%) |
| 75 Years and over | 0 (0.0%) | 19 (4.9%) |
Technology Access in South Haven
Computing Device Access in South Haven
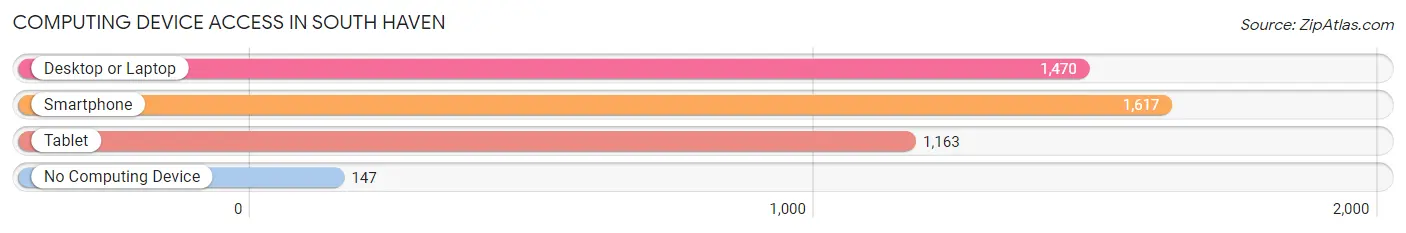
| Device Type | # Households | % Households |
| Desktop or Laptop | 1,470 | 75.7% |
| Smartphone | 1,617 | 83.2% |
| Tablet | 1,163 | 59.9% |
| No Computing Device | 147 | 7.6% |
| Total | 1,943 | 100.0% |
Internet Access in South Haven
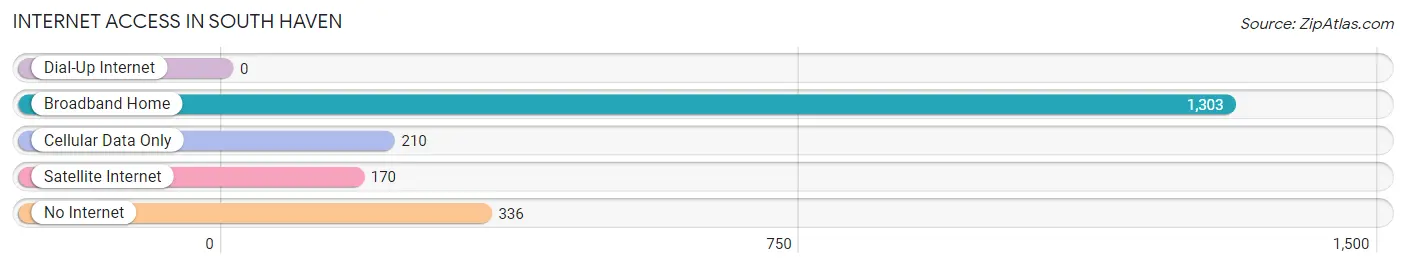
| Internet Type | # Households | % Households |
| Dial-Up Internet | 0 | 0.0% |
| Broadband Home | 1,303 | 67.1% |
| Cellular Data Only | 210 | 10.8% |
| Satellite Internet | 170 | 8.7% |
| No Internet | 336 | 17.3% |
| Total | 1,943 | 100.0% |
South Haven Summary
History
South Haven, Michigan is a small city located in the southwestern corner of the state, along the shores of Lake Michigan. It is a popular tourist destination, known for its sandy beaches, historic downtown, and vibrant arts and culture scene. The city was founded in 1835 by settlers from New York and Ohio, and was incorporated in 1869.
The city’s early economy was based on lumber and agriculture, with the first sawmill being built in 1837. The city’s first newspaper, the South Haven Tribune, was established in 1845. In the late 19th century, the city’s economy shifted to tourism, with the opening of the first hotel in 1871. The city’s first pier was built in 1872, and the first lighthouse was built in 1873.
The city’s economy continued to be based on tourism throughout the 20th century, with the opening of the South Haven Yacht Club in 1921, and the South Haven Center for the Arts in the 1950s. The city also became a popular destination for retirees, with the opening of the South Haven Retirement Community in the 1970s.
Geography
South Haven is located in the southwestern corner of Michigan, along the shores of Lake Michigan. The city is situated on the Black River, which flows into the lake. The city is surrounded by Van Buren County, and is approximately 50 miles from the state capital of Lansing.
The city has a total area of 8.3 square miles, with 6.3 square miles of land and 2.0 square miles of water. The city has a humid continental climate, with hot summers and cold winters. The average annual temperature is 48°F, and the average annual precipitation is 33 inches.
Economy
South Haven’s economy is largely based on tourism, with the city’s beaches, historic downtown, and vibrant arts and culture scene attracting visitors from around the world. The city is also home to several manufacturing companies, including a paper mill, a plastics factory, and a boat manufacturing plant.
The city’s largest employer is the South Haven Public School District, which employs over 1,000 people. Other major employers include the South Haven Health System, the South Haven Center for the Arts, and the South Haven Yacht Club.
Demographics
As of the 2010 census, South Haven had a population of 4,403. The racial makeup of the city was 92.3% White, 4.2% African American, 0.7% Native American, 0.7% Asian, 0.2% Pacific Islander, 0.7% from other races, and 1.4% from two or more races. Hispanic or Latino of any race were 2.3% of the population.
The median household income in South Haven was $41,944, and the median family income was $50,917. The per capita income for the city was $21,945. About 11.3% of families and 14.2% of the population were below the poverty line, including 19.2% of those under age 18 and 8.2% of those age 65 or over.
Common Questions
What is Per Capita Income in South Haven?
Per Capita income in South Haven is $44,173.
What is the Median Family Income in South Haven?
Median Family Income in South Haven is $87,647.
What is the Median Household income in South Haven?
Median Household Income in South Haven is $63,202.
What is Income or Wage Gap in South Haven?
Income or Wage Gap in South Haven is 26.2%.
Women in South Haven earn 73.8 cents for every dollar earned by a man.
What is Inequality or Gini Index in South Haven?
Inequality or Gini Index in South Haven is 0.49.
What is the Total Population of South Haven?
Total Population of South Haven is 3,999.
What is the Total Male Population of South Haven?
Total Male Population of South Haven is 1,844.
What is the Total Female Population of South Haven?
Total Female Population of South Haven is 2,155.
What is the Ratio of Males per 100 Females in South Haven?
There are 85.57 Males per 100 Females in South Haven.
What is the Ratio of Females per 100 Males in South Haven?
There are 116.87 Females per 100 Males in South Haven.
What is the Median Population Age in South Haven?
Median Population Age in South Haven is 61.0 Years.
What is the Average Family Size in South Haven
Average Family Size in South Haven is 2.4 People.
What is the Average Household Size in South Haven
Average Household Size in South Haven is 2.0 People.
How Large is the Labor Force in South Haven?
There are 1,666 People in the Labor Forcein in South Haven.
What is the Percentage of People in the Labor Force in South Haven?
47.8% of People are in the Labor Force in South Haven.
What is the Unemployment Rate in South Haven?
Unemployment Rate in South Haven is 3.8%.