Brethren, MI Map & Demographics
Brethren Map
Brethren Overview
$25,381
PER CAPITA INCOME
$39,063
AVG FAMILY INCOME
$38,810
AVG HOUSEHOLD INCOME
0.51
INEQUALITY / GINI INDEX
392
TOTAL POPULATION
156
MALE POPULATION
236
FEMALE POPULATION
66.10
MALES / 100 FEMALES
151.28
FEMALES / 100 MALES
42.8
MEDIAN AGE
3.0
AVG FAMILY SIZE
2.7
AVG HOUSEHOLD SIZE
134
LABOR FORCE [ PEOPLE ]
43.2%
PERCENT IN LABOR FORCE
1.5%
UNEMPLOYMENT RATE
Brethren Zip Codes
Brethren Area Codes
Income in Brethren
Income Overview in Brethren
Per Capita Income in Brethren is $25,381, while median incomes of families and households are $39,063 and $38,810 respectively.
| Characteristic | Number | Measure |
| Per Capita Income | 392 | $25,381 |
| Median Family Income | 111 | $39,063 |
| Mean Family Income | 111 | $59,780 |
| Median Household Income | 144 | $38,810 |
| Mean Household Income | 144 | $65,765 |
| Income Deficit | 111 | $0 |
| Wage / Income Gap (%) | 392 | 0.00% |
| Wage / Income Gap ($) | 392 | 100.00¢ per $1 |
| Gini / Inequality Index | 392 | 0.51 |
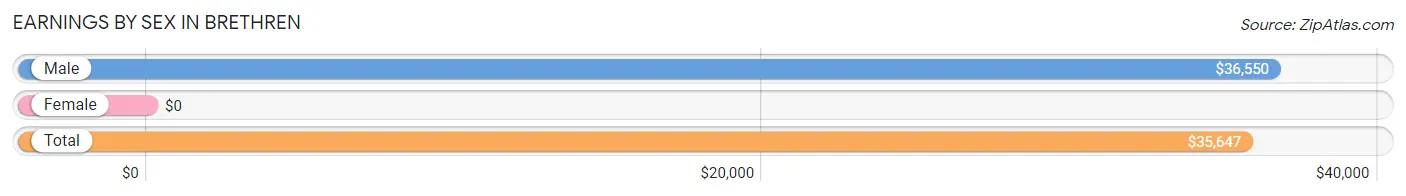
Earnings by Sex in Brethren
| Sex | Number | Average Earnings |
| Male | 71 (49.0%) | $36,550 |
| Female | 74 (51.0%) | $0 |
| Total | 145 (100.0%) | $35,647 |
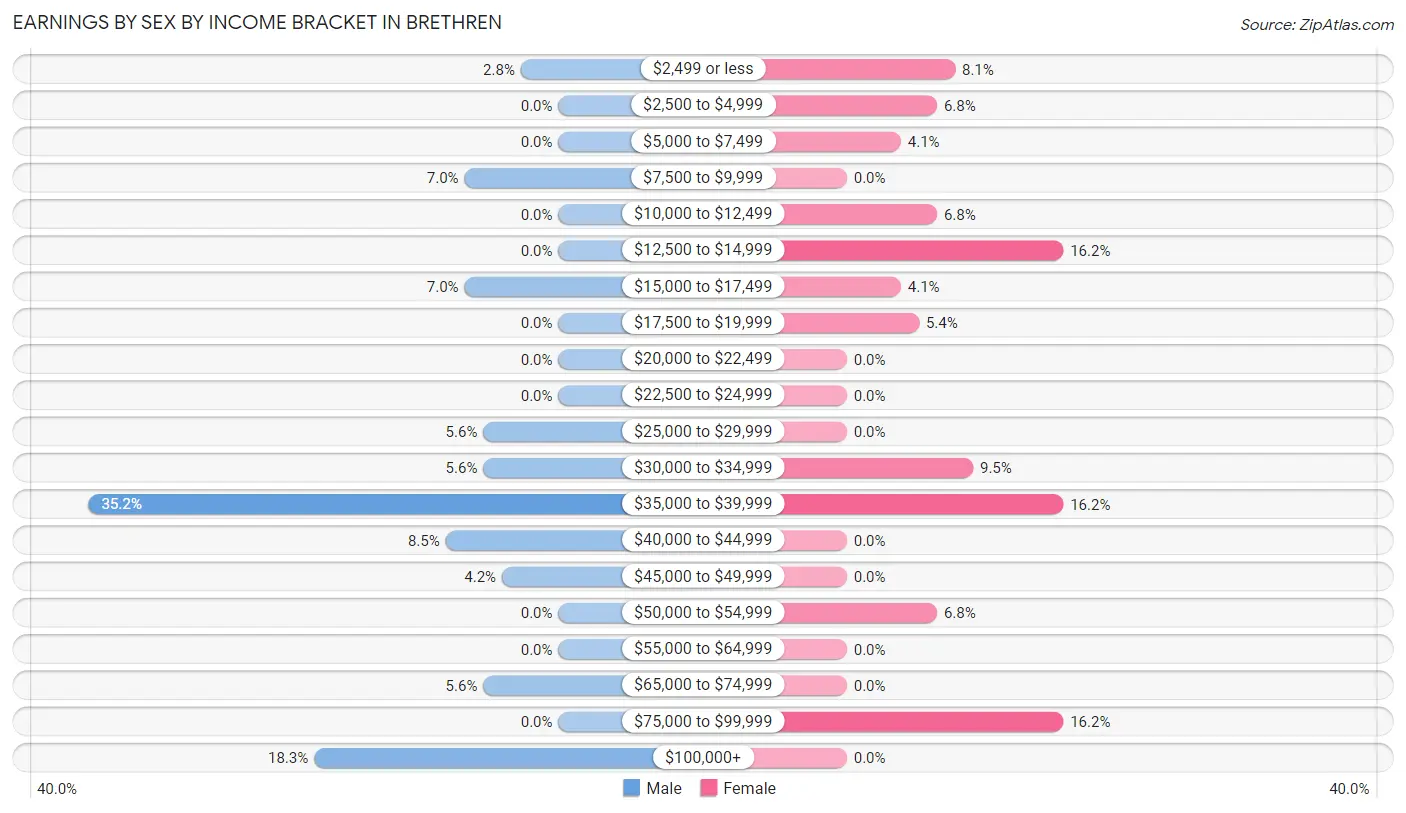
Earnings by Sex by Income Bracket in Brethren
The most common earnings brackets in Brethren are $35,000 to $39,999 for men (25 | 35.2%) and $12,500 to $14,999 for women (12 | 16.2%).
| Income | Male | Female |
| $2,499 or less | 2 (2.8%) | 6 (8.1%) |
| $2,500 to $4,999 | 0 (0.0%) | 5 (6.8%) |
| $5,000 to $7,499 | 0 (0.0%) | 3 (4.1%) |
| $7,500 to $9,999 | 5 (7.0%) | 0 (0.0%) |
| $10,000 to $12,499 | 0 (0.0%) | 5 (6.8%) |
| $12,500 to $14,999 | 0 (0.0%) | 12 (16.2%) |
| $15,000 to $17,499 | 5 (7.0%) | 3 (4.1%) |
| $17,500 to $19,999 | 0 (0.0%) | 4 (5.4%) |
| $20,000 to $22,499 | 0 (0.0%) | 0 (0.0%) |
| $22,500 to $24,999 | 0 (0.0%) | 0 (0.0%) |
| $25,000 to $29,999 | 4 (5.6%) | 0 (0.0%) |
| $30,000 to $34,999 | 4 (5.6%) | 7 (9.5%) |
| $35,000 to $39,999 | 25 (35.2%) | 12 (16.2%) |
| $40,000 to $44,999 | 6 (8.5%) | 0 (0.0%) |
| $45,000 to $49,999 | 3 (4.2%) | 0 (0.0%) |
| $50,000 to $54,999 | 0 (0.0%) | 5 (6.8%) |
| $55,000 to $64,999 | 0 (0.0%) | 0 (0.0%) |
| $65,000 to $74,999 | 4 (5.6%) | 0 (0.0%) |
| $75,000 to $99,999 | 0 (0.0%) | 12 (16.2%) |
| $100,000+ | 13 (18.3%) | 0 (0.0%) |
| Total | 71 (100.0%) | 74 (100.0%) |
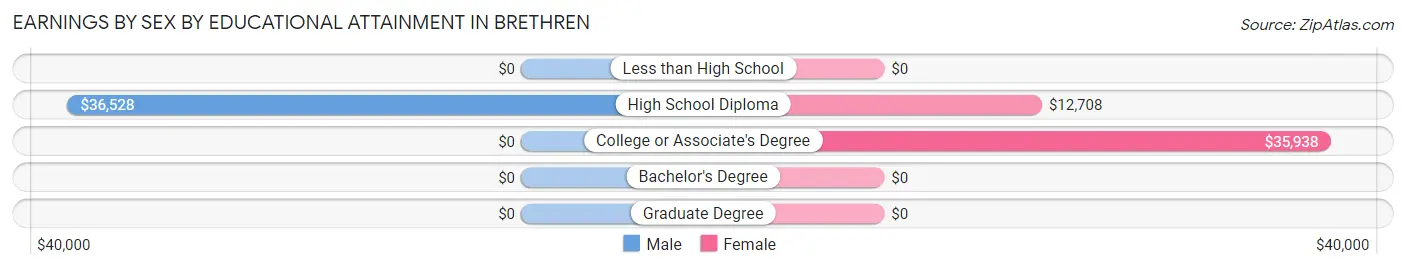
Earnings by Sex by Educational Attainment in Brethren
Average earnings in Brethren are $36,250 for men and $31,667 for women, a difference of 12.6%. Men with an educational attainment of high school diploma enjoy the highest average annual earnings of $36,528, while those with high school diploma education earn the least with $36,528. Women with an educational attainment of college or associate's degree earn the most with the average annual earnings of $35,938, while those with high school diploma education have the smallest earnings of $12,708.
| Educational Attainment | Male Income | Female Income |
| Less than High School | - | - |
| High School Diploma | $36,528 | $12,708 |
| College or Associate's Degree | - | - |
| Bachelor's Degree | - | - |
| Graduate Degree | - | - |
| Total | $36,250 | $31,667 |
Family Income in Brethren
Family Income Brackets in Brethren
According to the Brethren family income data, there are 21 families falling into the $25,000 to $34,999 income range, which is the most common income bracket and makes up 18.9% of all families.
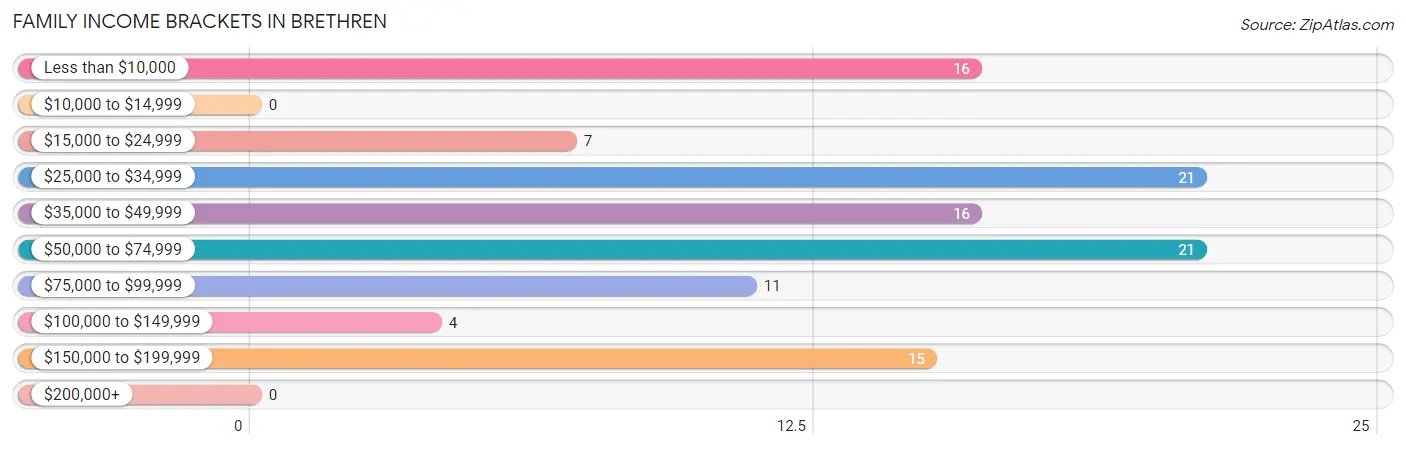
| Income Bracket | # Families | % Families |
| Less than $10,000 | 16 | 14.4% |
| $10,000 to $14,999 | 0 | 0.0% |
| $15,000 to $24,999 | 7 | 6.3% |
| $25,000 to $34,999 | 21 | 18.9% |
| $35,000 to $49,999 | 16 | 14.4% |
| $50,000 to $74,999 | 21 | 18.9% |
| $75,000 to $99,999 | 11 | 9.9% |
| $100,000 to $149,999 | 4 | 3.6% |
| $150,000 to $199,999 | 15 | 13.5% |
| $200,000+ | 0 | 0.0% |
Family Income by Famaliy Size in Brethren
3-person families (46 | 41.4%) account for the highest median family income in Brethren with $64,250 per family, while 3-person families (46 | 41.4%) have the highest median income of $21,417 per family member.
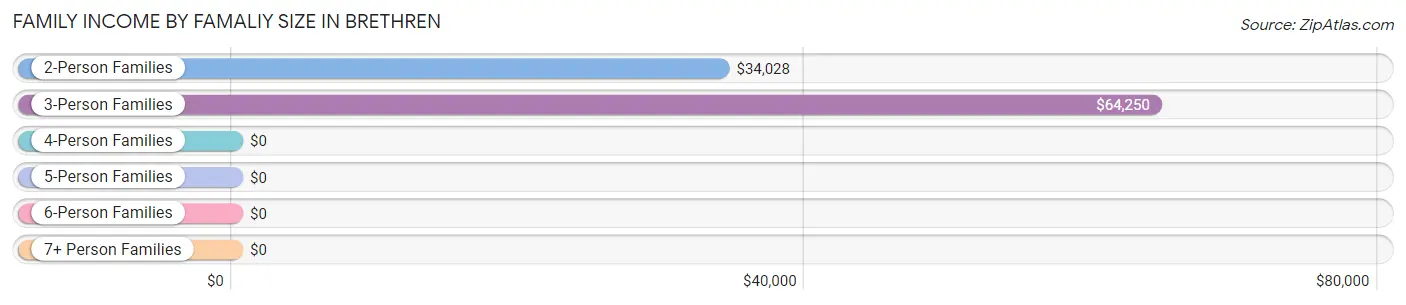
| Income Bracket | # Families | Median Income |
| 2-Person Families | 49 (44.1%) | $34,028 |
| 3-Person Families | 46 (41.4%) | $64,250 |
| 4-Person Families | 16 (14.4%) | $0 |
| 5-Person Families | 0 (0.0%) | $0 |
| 6-Person Families | 0 (0.0%) | $0 |
| 7+ Person Families | 0 (0.0%) | $0 |
| Total | 111 (100.0%) | $39,063 |
Family Income by Number of Earners in Brethren
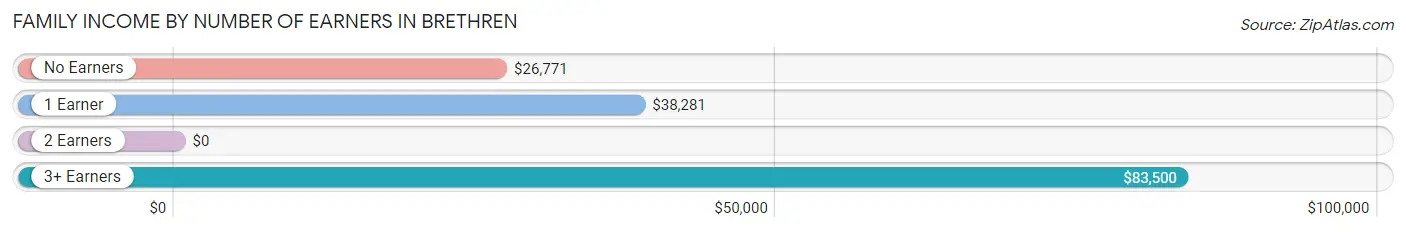
| Number of Earners | # Families | Median Income |
| No Earners | 49 (44.1%) | $26,771 |
| 1 Earner | 27 (24.3%) | $38,281 |
| 2 Earners | 23 (20.7%) | $0 |
| 3+ Earners | 12 (10.8%) | $83,500 |
| Total | 111 (100.0%) | $39,063 |
Household Income in Brethren
Household Income Brackets in Brethren
With 25 households falling in the category, the $35,000 to $49,999 income range is the most frequent in Brethren, accounting for 17.4% of all households. In contrast, only 3 households (2.1%) fall into the $10,000 to $14,999 income bracket, making it the least populous group.
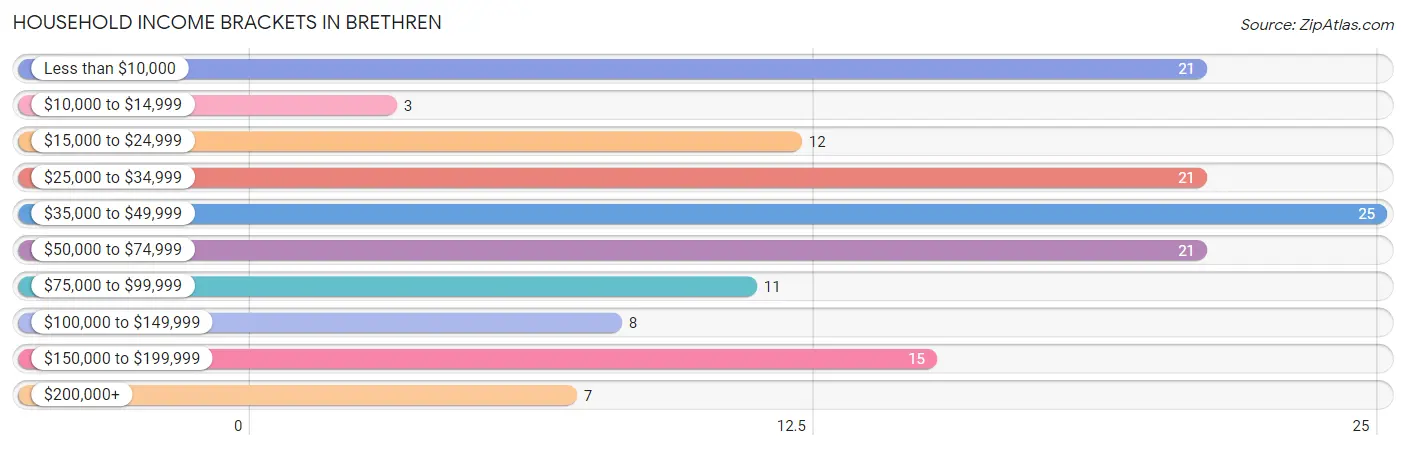
| Income Bracket | # Households | % Households |
| Less than $10,000 | 21 | 14.6% |
| $10,000 to $14,999 | 3 | 2.1% |
| $15,000 to $24,999 | 12 | 8.3% |
| $25,000 to $34,999 | 21 | 14.6% |
| $35,000 to $49,999 | 25 | 17.4% |
| $50,000 to $74,999 | 21 | 14.6% |
| $75,000 to $99,999 | 11 | 7.6% |
| $100,000 to $149,999 | 8 | 5.6% |
| $150,000 to $199,999 | 15 | 10.4% |
| $200,000+ | 7 | 4.9% |
Household Income by Householder Age in Brethren
The median household income in Brethren is $38,810, with the highest median household income of $78,125 found in the 45 to 64 years age bracket for the primary householder. A total of 36 households (25.0%) fall into this category. Meanwhile, the 15 to 24 years age bracket for the primary householder has the lowest median household income of $0, with 4 households (2.8%) in this group.
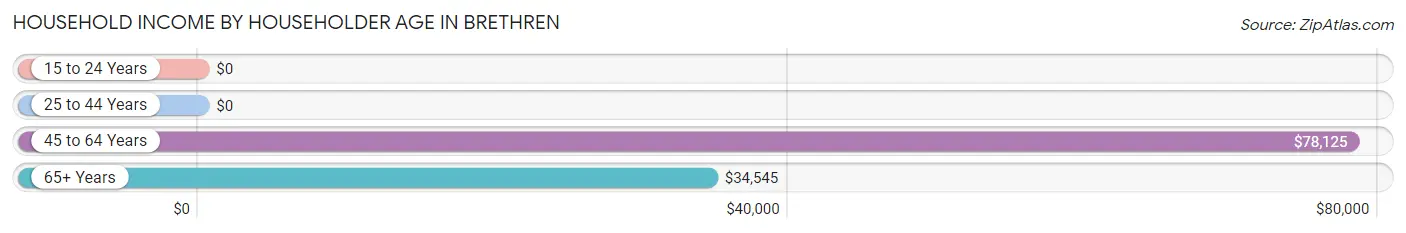
| Income Bracket | # Households | Median Income |
| 15 to 24 Years | 4 (2.8%) | $0 |
| 25 to 44 Years | 52 (36.1%) | $0 |
| 45 to 64 Years | 36 (25.0%) | $78,125 |
| 65+ Years | 52 (36.1%) | $34,545 |
| Total | 144 (100.0%) | $38,810 |
Poverty in Brethren
Income Below Poverty by Sex and Age in Brethren
With 15.4% poverty level for males and 24.6% for females among the residents of Brethren, under 5 year old males and 5 year old females are the most vulnerable to poverty, with 10 males (66.7%) and 4 females (100.0%) in their respective age groups living below the poverty level.
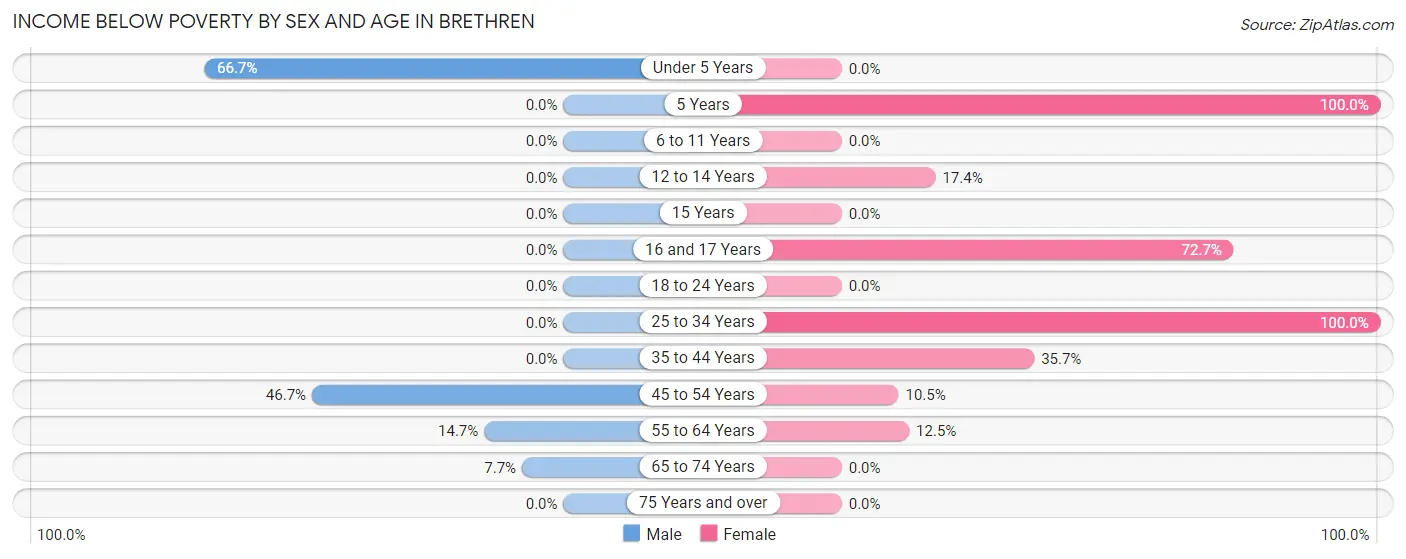
| Age Bracket | Male | Female |
| Under 5 Years | 10 (66.7%) | 0 (0.0%) |
| 5 Years | 0 (0.0%) | 4 (100.0%) |
| 6 to 11 Years | 0 (0.0%) | 0 (0.0%) |
| 12 to 14 Years | 0 (0.0%) | 4 (17.4%) |
| 15 Years | 0 (0.0%) | 0 (0.0%) |
| 16 and 17 Years | 0 (0.0%) | 16 (72.7%) |
| 18 to 24 Years | 0 (0.0%) | 0 (0.0%) |
| 25 to 34 Years | 0 (0.0%) | 14 (100.0%) |
| 35 to 44 Years | 0 (0.0%) | 15 (35.7%) |
| 45 to 54 Years | 7 (46.7%) | 2 (10.5%) |
| 55 to 64 Years | 5 (14.7%) | 3 (12.5%) |
| 65 to 74 Years | 2 (7.7%) | 0 (0.0%) |
| 75 Years and over | 0 (0.0%) | 0 (0.0%) |
| Total | 24 (15.4%) | 58 (24.6%) |
Income Above Poverty by Sex and Age in Brethren
According to the poverty statistics in Brethren, males aged 12 to 14 years and females aged under 5 years are the age groups that are most secure financially, with 100.0% of males and 100.0% of females in these age groups living above the poverty line.
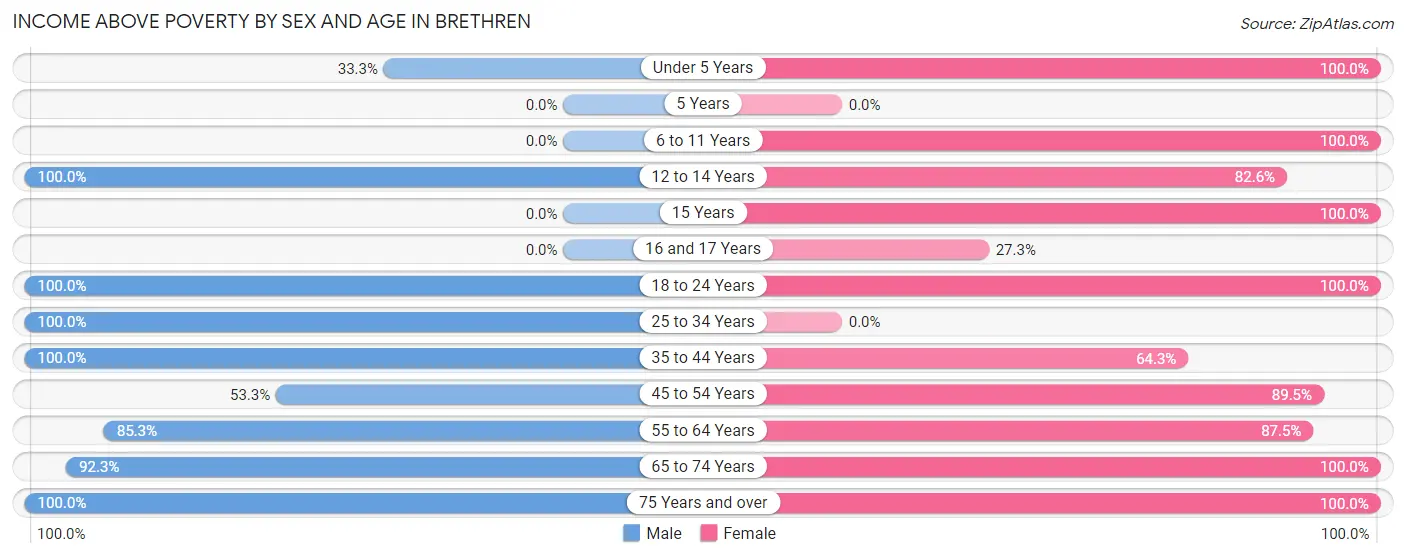
| Age Bracket | Male | Female |
| Under 5 Years | 5 (33.3%) | 5 (100.0%) |
| 5 Years | 0 (0.0%) | 0 (0.0%) |
| 6 to 11 Years | 0 (0.0%) | 13 (100.0%) |
| 12 to 14 Years | 5 (100.0%) | 19 (82.6%) |
| 15 Years | 0 (0.0%) | 17 (100.0%) |
| 16 and 17 Years | 0 (0.0%) | 6 (27.3%) |
| 18 to 24 Years | 22 (100.0%) | 9 (100.0%) |
| 25 to 34 Years | 14 (100.0%) | 0 (0.0%) |
| 35 to 44 Years | 20 (100.0%) | 27 (64.3%) |
| 45 to 54 Years | 8 (53.3%) | 17 (89.5%) |
| 55 to 64 Years | 29 (85.3%) | 21 (87.5%) |
| 65 to 74 Years | 24 (92.3%) | 19 (100.0%) |
| 75 Years and over | 5 (100.0%) | 25 (100.0%) |
| Total | 132 (84.6%) | 178 (75.4%) |
Income Below Poverty Among Married-Couple Families in Brethren
The poverty statistics for married-couple families in Brethren show that 12.2% or 9 of the total 74 families live below the poverty line. Families with 1 or 2 children have the highest poverty rate of 17.9%, comprising of 7 families. On the other hand, families with no children have the lowest poverty rate of 5.7%, which includes 2 families.
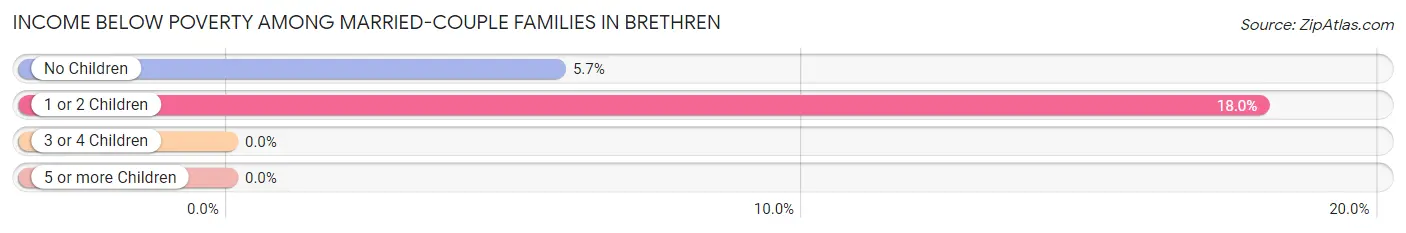
| Children | Above Poverty | Below Poverty |
| No Children | 33 (94.3%) | 2 (5.7%) |
| 1 or 2 Children | 32 (82.1%) | 7 (17.9%) |
| 3 or 4 Children | 0 (0.0%) | 0 (0.0%) |
| 5 or more Children | 0 (0.0%) | 0 (0.0%) |
| Total | 65 (87.8%) | 9 (12.2%) |
Income Below Poverty Among Single-Parent Households in Brethren
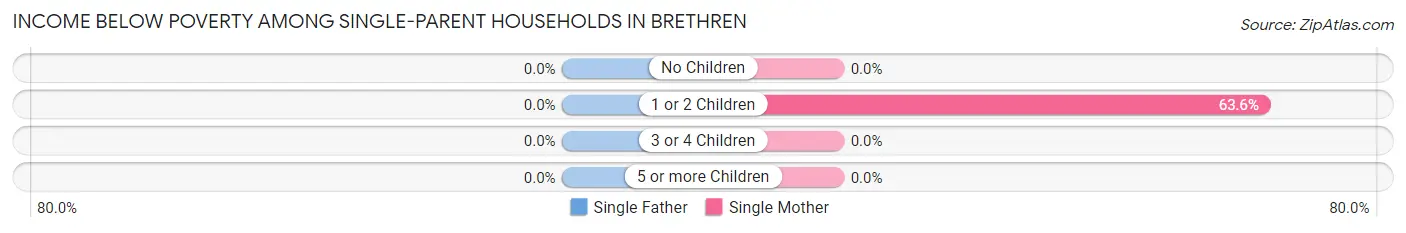
| Children | Single Father | Single Mother |
| No Children | 0 (0.0%) | 0 (0.0%) |
| 1 or 2 Children | 0 (0.0%) | 14 (63.6%) |
| 3 or 4 Children | 0 (0.0%) | 0 (0.0%) |
| 5 or more Children | 0 (0.0%) | 0 (0.0%) |
| Total | 0 (0.0%) | 14 (41.2%) |
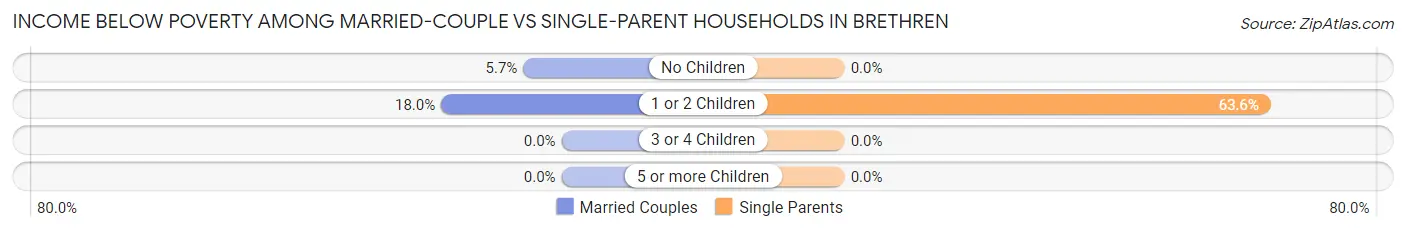
Income Below Poverty Among Married-Couple vs Single-Parent Households in Brethren
The poverty data for Brethren shows that 9 of the married-couple family households (12.2%) and 14 of the single-parent households (37.8%) are living below the poverty level. Within the married-couple family households, those with 1 or 2 children have the highest poverty rate, with 7 households (17.9%) falling below the poverty line. Among the single-parent households, those with 1 or 2 children have the highest poverty rate, with 14 household (63.6%) living below poverty.
| Children | Married-Couple Families | Single-Parent Households |
| No Children | 2 (5.7%) | 0 (0.0%) |
| 1 or 2 Children | 7 (17.9%) | 14 (63.6%) |
| 3 or 4 Children | 0 (0.0%) | 0 (0.0%) |
| 5 or more Children | 0 (0.0%) | 0 (0.0%) |
| Total | 9 (12.2%) | 14 (37.8%) |
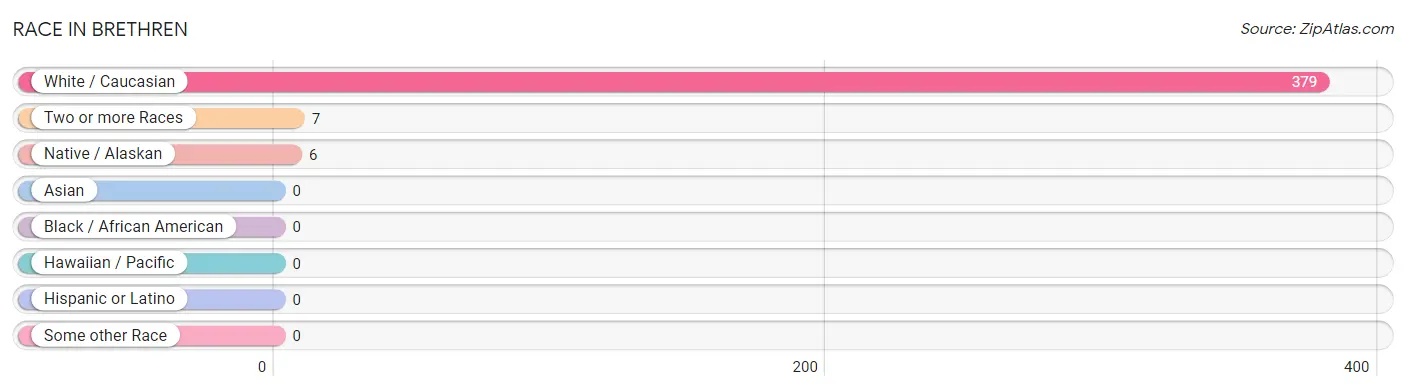
Race in Brethren
The most populous races in Brethren are White / Caucasian (379 | 96.7%), Two or more Races (7 | 1.8%), and Native / Alaskan (6 | 1.5%).
| Race | # Population | % Population |
| Asian | 0 | 0.0% |
| Black / African American | 0 | 0.0% |
| Hawaiian / Pacific | 0 | 0.0% |
| Hispanic or Latino | 0 | 0.0% |
| Native / Alaskan | 6 | 1.5% |
| White / Caucasian | 379 | 96.7% |
| Two or more Races | 7 | 1.8% |
| Some other Race | 0 | 0.0% |
| Total | 392 | 100.0% |
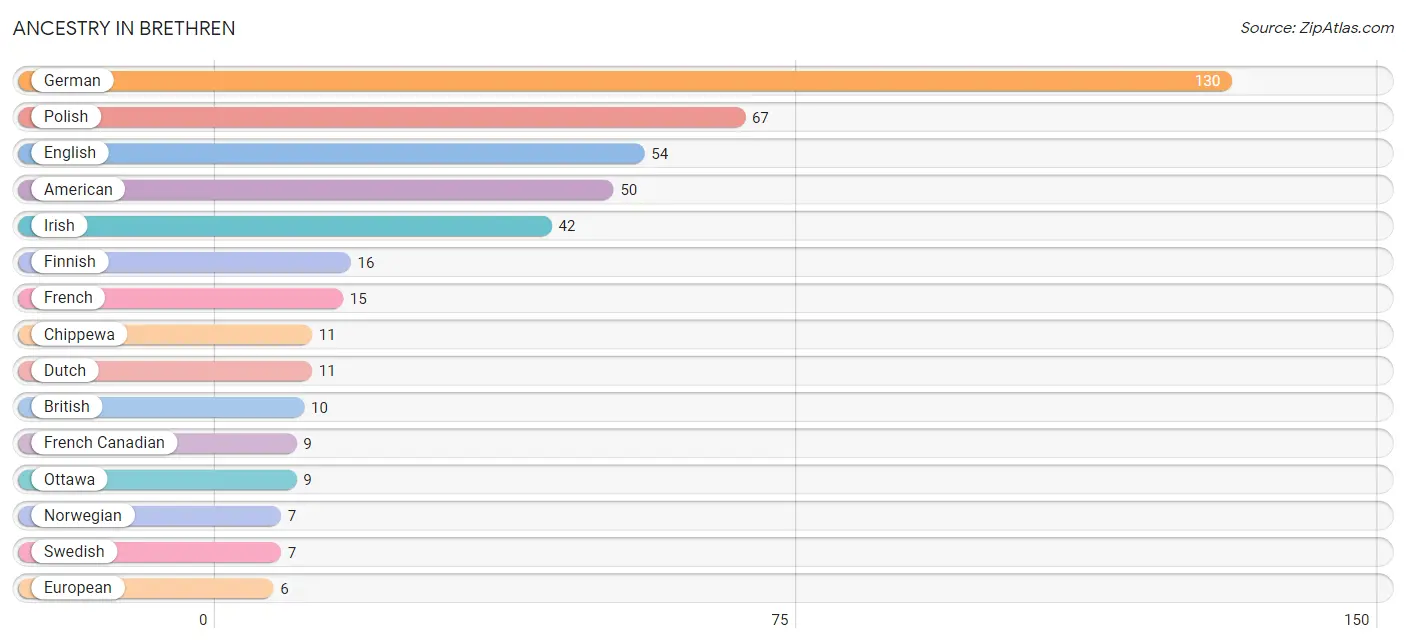
Ancestry in Brethren
The most populous ancestries reported in Brethren are German (130 | 33.2%), Polish (67 | 17.1%), English (54 | 13.8%), American (50 | 12.8%), and Irish (42 | 10.7%), together accounting for 87.5% of all Brethren residents.
| Ancestry | # Population | % Population |
| American | 50 | 12.8% |
| British | 10 | 2.5% |
| Chippewa | 11 | 2.8% |
| Dutch | 11 | 2.8% |
| Eastern European | 3 | 0.8% |
| English | 54 | 13.8% |
| European | 6 | 1.5% |
| Finnish | 16 | 4.1% |
| French | 15 | 3.8% |
| French Canadian | 9 | 2.3% |
| German | 130 | 33.2% |
| Irish | 42 | 10.7% |
| Norwegian | 7 | 1.8% |
| Ottawa | 9 | 2.3% |
| Polish | 67 | 17.1% |
| Slovak | 3 | 0.8% |
| Swedish | 7 | 1.8% | View All 17 Rows |
Immigrants in Brethren
The most numerous immigrant groups reported in Brethren came from , and Canada (4 | 1.0%), together accounting for 1.0% of all Brethren residents.

| Immigration Origin | # Population | % Population |
| Canada | 4 | 1.0% | View All 1 Rows |
Sex and Age in Brethren
Sex and Age in Brethren
The most populous age groups in Brethren are 60 to 64 Years (22 | 14.1%) for men and 15 to 19 Years (39 | 16.5%) for women.
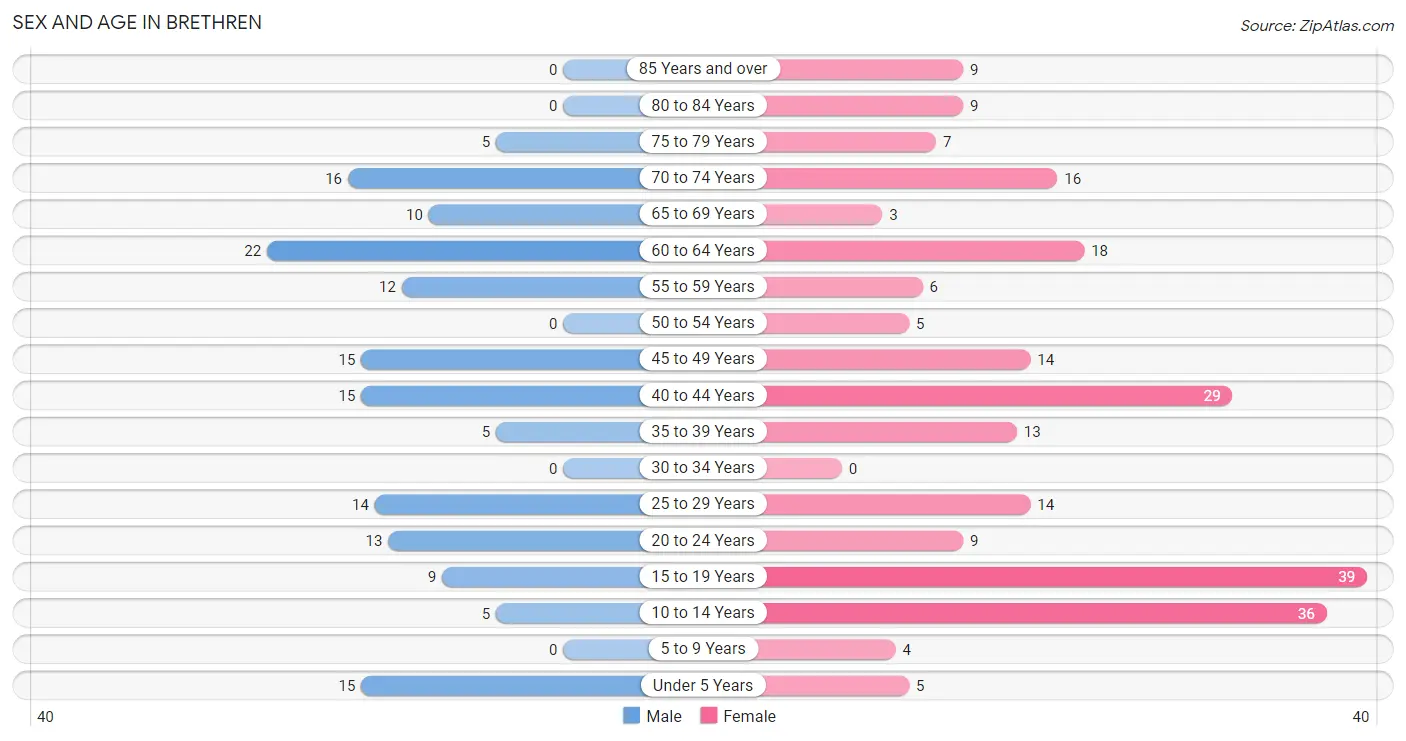
| Age Bracket | Male | Female |
| Under 5 Years | 15 (9.6%) | 5 (2.1%) |
| 5 to 9 Years | 0 (0.0%) | 4 (1.7%) |
| 10 to 14 Years | 5 (3.2%) | 36 (15.2%) |
| 15 to 19 Years | 9 (5.8%) | 39 (16.5%) |
| 20 to 24 Years | 13 (8.3%) | 9 (3.8%) |
| 25 to 29 Years | 14 (9.0%) | 14 (5.9%) |
| 30 to 34 Years | 0 (0.0%) | 0 (0.0%) |
| 35 to 39 Years | 5 (3.2%) | 13 (5.5%) |
| 40 to 44 Years | 15 (9.6%) | 29 (12.3%) |
| 45 to 49 Years | 15 (9.6%) | 14 (5.9%) |
| 50 to 54 Years | 0 (0.0%) | 5 (2.1%) |
| 55 to 59 Years | 12 (7.7%) | 6 (2.5%) |
| 60 to 64 Years | 22 (14.1%) | 18 (7.6%) |
| 65 to 69 Years | 10 (6.4%) | 3 (1.3%) |
| 70 to 74 Years | 16 (10.3%) | 16 (6.8%) |
| 75 to 79 Years | 5 (3.2%) | 7 (3.0%) |
| 80 to 84 Years | 0 (0.0%) | 9 (3.8%) |
| 85 Years and over | 0 (0.0%) | 9 (3.8%) |
| Total | 156 (100.0%) | 236 (100.0%) |
Families and Households in Brethren
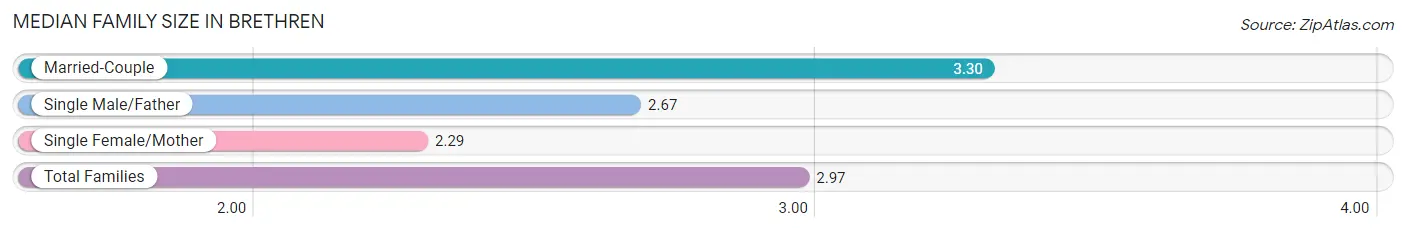
Median Family Size in Brethren
The median family size in Brethren is 2.97 persons per family, with married-couple families (74 | 66.7%) accounting for the largest median family size of 3.3 persons per family. On the other hand, single female/mother families (34 | 30.6%) represent the smallest median family size with 2.29 persons per family.
| Family Type | # Families | Family Size |
| Married-Couple | 74 (66.7%) | 3.30 |
| Single Male/Father | 3 (2.7%) | 2.67 |
| Single Female/Mother | 34 (30.6%) | 2.29 |
| Total Families | 111 (100.0%) | 2.97 |
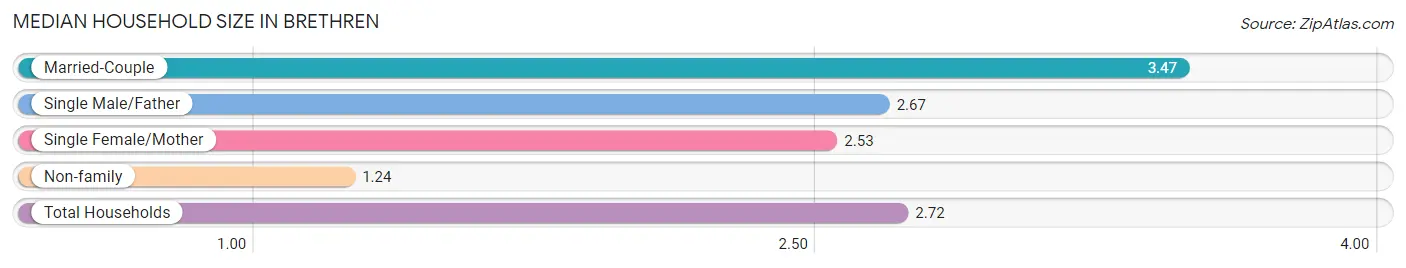
Median Household Size in Brethren
The median household size in Brethren is 2.72 persons per household, with married-couple households (74 | 51.4%) accounting for the largest median household size of 3.47 persons per household. non-family households (33 | 22.9%) represent the smallest median household size with 1.24 persons per household.
| Household Type | # Households | Household Size |
| Married-Couple | 74 (51.4%) | 3.47 |
| Single Male/Father | 3 (2.1%) | 2.67 |
| Single Female/Mother | 34 (23.6%) | 2.53 |
| Non-family | 33 (22.9%) | 1.24 |
| Total Households | 144 (100.0%) | 2.72 |
Household Size by Marriage Status in Brethren
Out of a total of 144 households in Brethren, 111 (77.1%) are family households, while 33 (22.9%) are nonfamily households. The most numerous type of family households are 2-person households, comprising 49, and the most common type of nonfamily households are 1-person households, comprising 29.
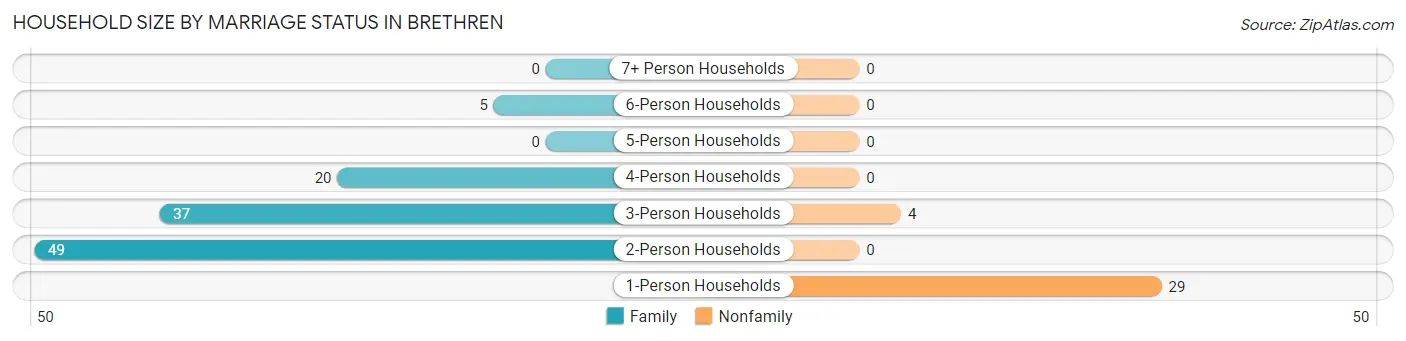
| Household Size | Family Households | Nonfamily Households |
| 1-Person Households | - | 29 (20.1%) |
| 2-Person Households | 49 (34.0%) | 0 (0.0%) |
| 3-Person Households | 37 (25.7%) | 4 (2.8%) |
| 4-Person Households | 20 (13.9%) | 0 (0.0%) |
| 5-Person Households | 0 (0.0%) | 0 (0.0%) |
| 6-Person Households | 5 (3.5%) | 0 (0.0%) |
| 7+ Person Households | 0 (0.0%) | 0 (0.0%) |
| Total | 111 (77.1%) | 33 (22.9%) |
Female Fertility in Brethren
Fertility by Age in Brethren
Average fertility rate in Brethren is 34.0 births per 1,000 women. Women in the age bracket of 20 to 34 years have the highest fertility rate with 174.0 births per 1,000 women. Women in the age bracket of 20 to 34 years acount for 100.0% of all women with births.
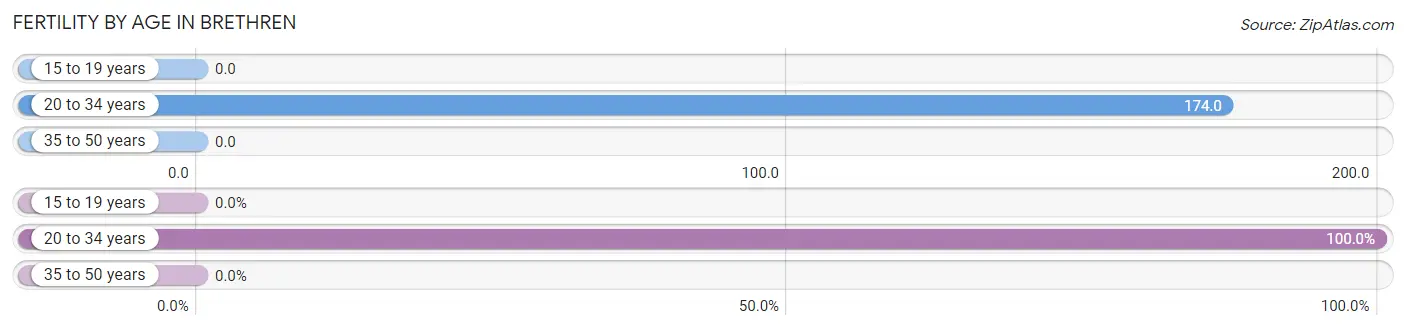
| Age Bracket | Women with Births | Births / 1,000 Women |
| 15 to 19 years | 0 (0.0%) | 0.0 |
| 20 to 34 years | 4 (100.0%) | 174.0 |
| 35 to 50 years | 0 (0.0%) | 0.0 |
| Total | 4 (100.0%) | 34.0 |
Fertility by Age by Marriage Status in Brethren
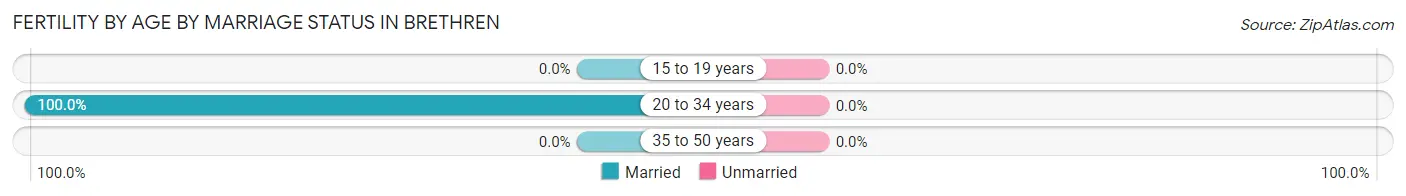
| Age Bracket | Married | Unmarried |
| 15 to 19 years | 0 (0.0%) | 0 (0.0%) |
| 20 to 34 years | 4 (100.0%) | 0 (0.0%) |
| 35 to 50 years | 0 (0.0%) | 0 (0.0%) |
| Total | 4 (100.0%) | 0 (0.0%) |
Fertility by Education in Brethren
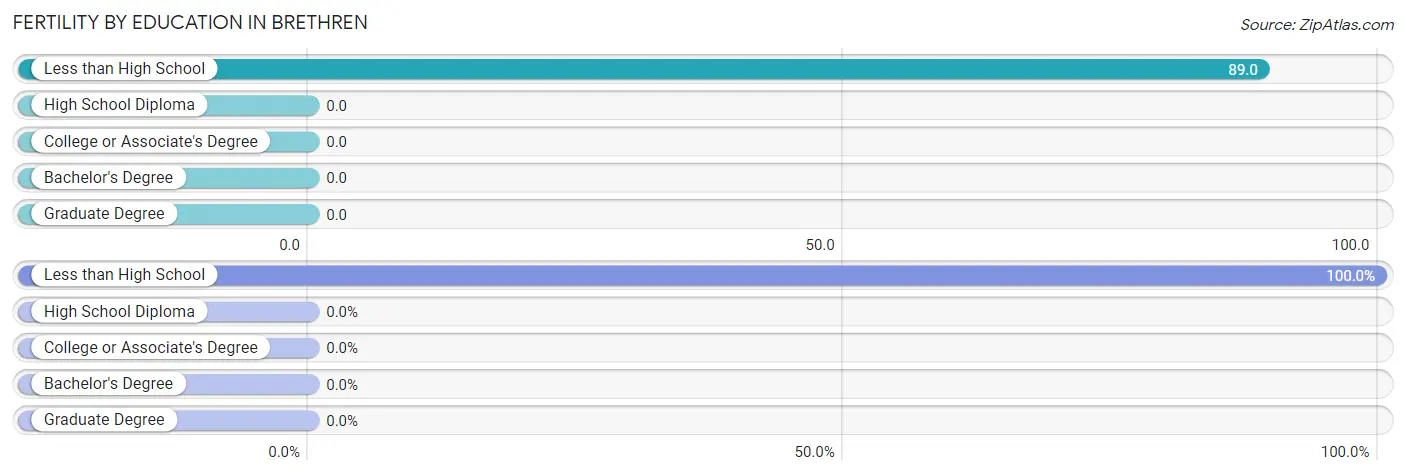
| Educational Attainment | Women with Births | Births / 1,000 Women |
| Less than High School | 4 (100.0%) | 89.0 |
| High School Diploma | 0 (0.0%) | 0.0 |
| College or Associate's Degree | 0 (0.0%) | 0.0 |
| Bachelor's Degree | 0 (0.0%) | 0.0 |
| Graduate Degree | 0 (0.0%) | 0.0 |
| Total | 4 (100.0%) | 34.0 |
Fertility by Education by Marriage Status in Brethren
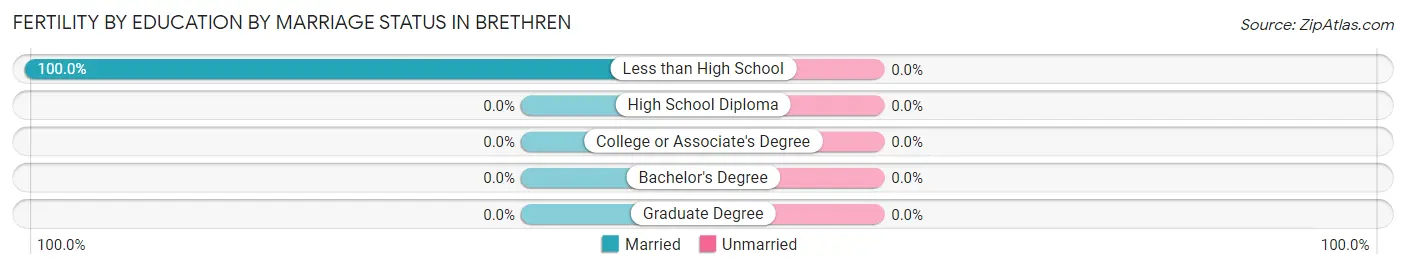
| Educational Attainment | Married | Unmarried |
| Less than High School | 4 (100.0%) | 0 (0.0%) |
| High School Diploma | 0 (0.0%) | 0 (0.0%) |
| College or Associate's Degree | 0 (0.0%) | 0 (0.0%) |
| Bachelor's Degree | 0 (0.0%) | 0 (0.0%) |
| Graduate Degree | 0 (0.0%) | 0 (0.0%) |
| Total | 4 (100.0%) | 0 (0.0%) |
Employment Characteristics in Brethren
Employment by Class of Employer in Brethren
Among the 127 employed individuals in Brethren, private company employees (83 | 65.3%), local government employees (25 | 19.7%), and not-for-profit organizations (9 | 7.1%) make up the most common classes of employment.
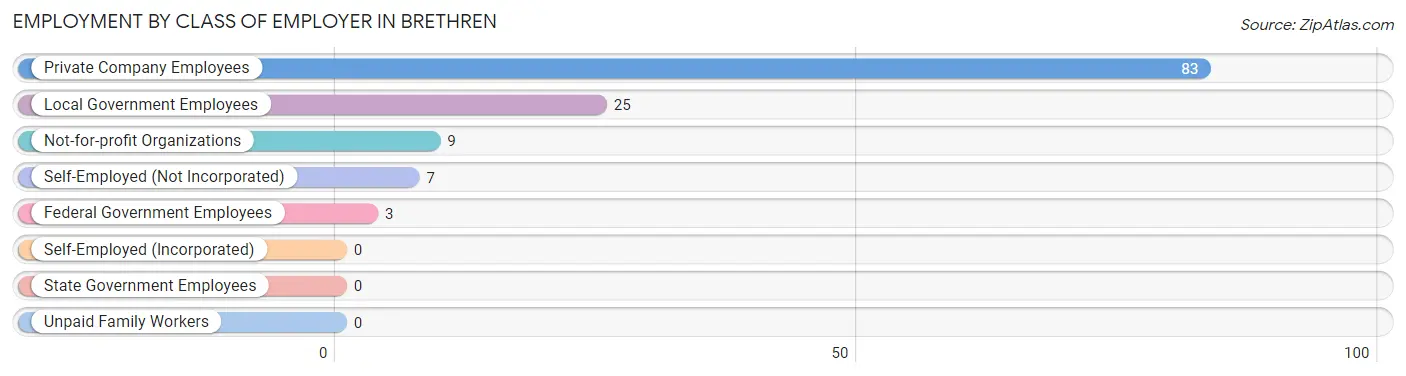
| Employer Class | # Employees | % Employees |
| Private Company Employees | 83 | 65.3% |
| Self-Employed (Incorporated) | 0 | 0.0% |
| Self-Employed (Not Incorporated) | 7 | 5.5% |
| Not-for-profit Organizations | 9 | 7.1% |
| Local Government Employees | 25 | 19.7% |
| State Government Employees | 0 | 0.0% |
| Federal Government Employees | 3 | 2.4% |
| Unpaid Family Workers | 0 | 0.0% |
| Total | 127 | 100.0% |
Employment Status by Age in Brethren
According to the labor force statistics for Brethren, out of the total population over 16 years of age (310), 43.2% or 134 individuals are in the labor force, with 1.5% or 2 of them unemployed. The age group with the highest labor force participation rate is 35 to 44 years, with 87.1% or 54 individuals in the labor force. Within the labor force, the 55 to 59 years age range has the highest percentage of unemployed individuals, with 15.4% or 2 of them being unemployed.
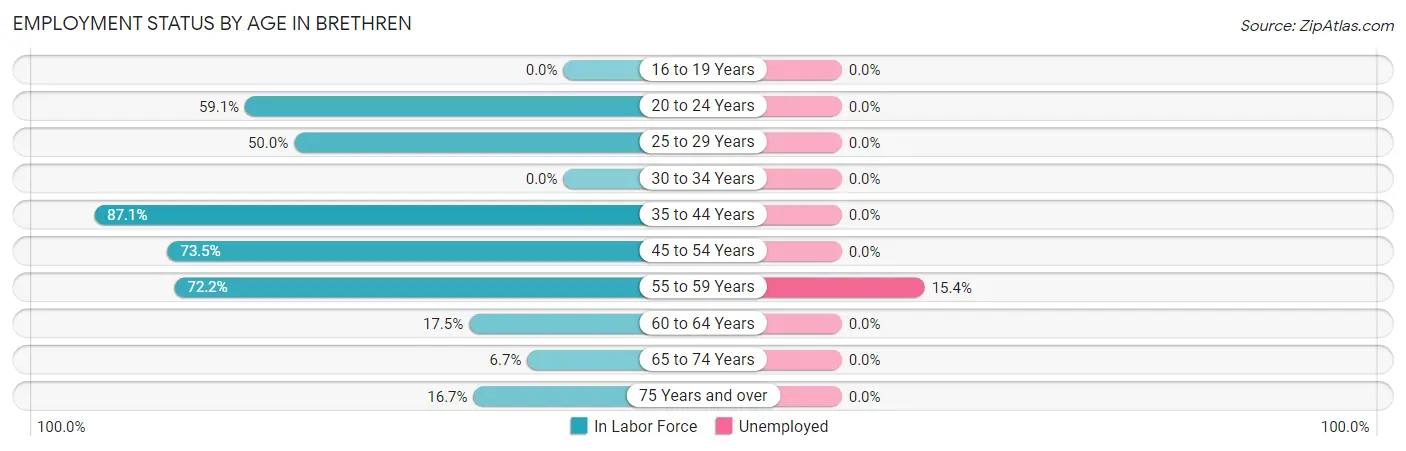
| Age Bracket | In Labor Force | Unemployed |
| 16 to 19 Years | 0 (0.0%) | 0 (0.0%) |
| 20 to 24 Years | 13 (59.1%) | 0 (0.0%) |
| 25 to 29 Years | 14 (50.0%) | 0 (0.0%) |
| 30 to 34 Years | 0 (0.0%) | 0 (0.0%) |
| 35 to 44 Years | 54 (87.1%) | 0 (0.0%) |
| 45 to 54 Years | 25 (73.5%) | 0 (0.0%) |
| 55 to 59 Years | 13 (72.2%) | 2 (15.4%) |
| 60 to 64 Years | 7 (17.5%) | 0 (0.0%) |
| 65 to 74 Years | 3 (6.7%) | 0 (0.0%) |
| 75 Years and over | 5 (16.7%) | 0 (0.0%) |
| Total | 134 (43.2%) | 2 (1.5%) |
Employment Status by Educational Attainment in Brethren
According to labor force statistics for Brethren, 62.1% of individuals (113) out of the total population between 25 and 64 years of age (182) are in the labor force, with 1.8% or 2 of them being unemployed. The group with the highest labor force participation rate are those with the educational attainment of college / associate degree, with 87.0% or 47 individuals in the labor force. Within the labor force, individuals with bachelor's degree or higher education have the highest percentage of unemployment, with 11.8% or 2 of them being unemployed.
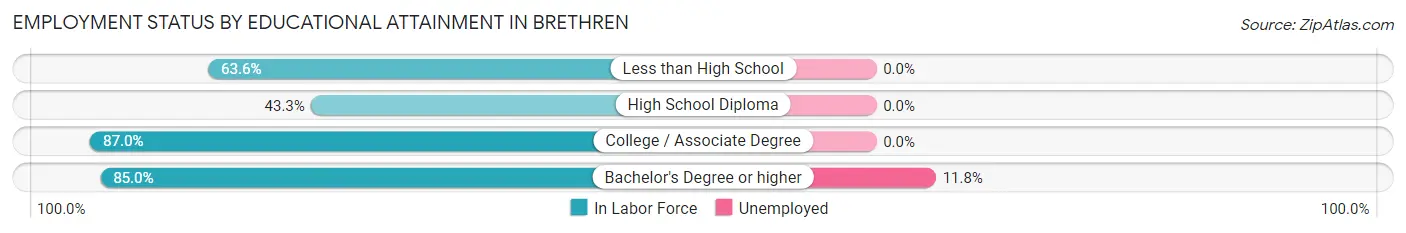
| Educational Attainment | In Labor Force | Unemployed |
| Less than High School | 7 (63.6%) | 0 (0.0%) |
| High School Diploma | 42 (43.3%) | 0 (0.0%) |
| College / Associate Degree | 47 (87.0%) | 0 (0.0%) |
| Bachelor's Degree or higher | 17 (85.0%) | 2 (11.8%) |
| Total | 113 (62.1%) | 3 (1.8%) |
Employment Occupations by Sex in Brethren
Management, Business, Science and Arts Occupations
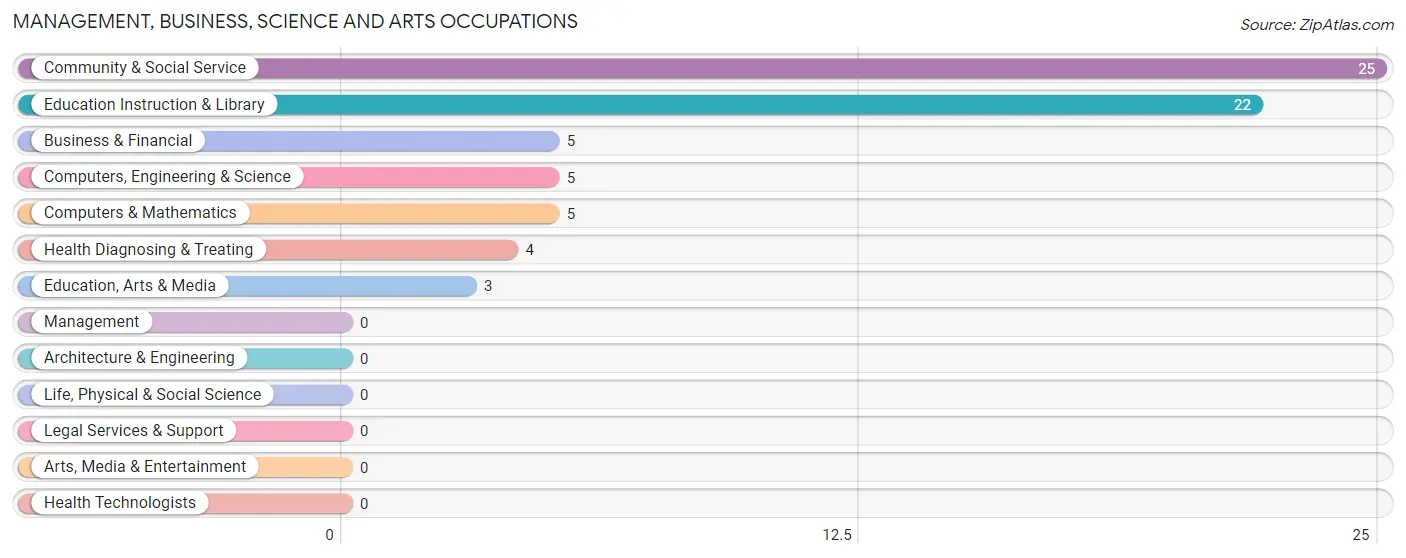
The most common Management, Business, Science and Arts occupations in Brethren are Community & Social Service (25 | 18.9%), Education Instruction & Library (22 | 16.7%), Business & Financial (5 | 3.8%), Computers, Engineering & Science (5 | 3.8%), and Computers & Mathematics (5 | 3.8%).
Management, Business, Science and Arts Occupations by Sex
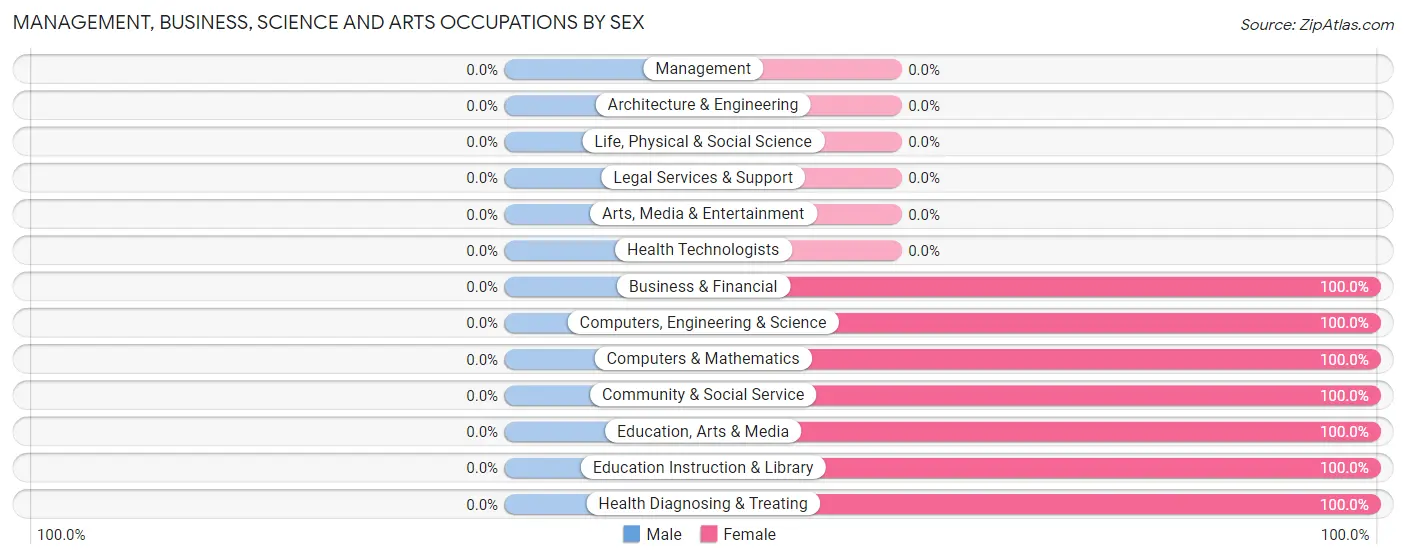
| Occupation | Male | Female |
| Management | 0 (0.0%) | 0 (0.0%) |
| Business & Financial | 0 (0.0%) | 5 (100.0%) |
| Computers, Engineering & Science | 0 (0.0%) | 5 (100.0%) |
| Computers & Mathematics | 0 (0.0%) | 5 (100.0%) |
| Architecture & Engineering | 0 (0.0%) | 0 (0.0%) |
| Life, Physical & Social Science | 0 (0.0%) | 0 (0.0%) |
| Community & Social Service | 0 (0.0%) | 25 (100.0%) |
| Education, Arts & Media | 0 (0.0%) | 3 (100.0%) |
| Legal Services & Support | 0 (0.0%) | 0 (0.0%) |
| Education Instruction & Library | 0 (0.0%) | 22 (100.0%) |
| Arts, Media & Entertainment | 0 (0.0%) | 0 (0.0%) |
| Health Diagnosing & Treating | 0 (0.0%) | 4 (100.0%) |
| Health Technologists | 0 (0.0%) | 0 (0.0%) |
| Total (Category) | 0 (0.0%) | 39 (100.0%) |
| Total (Overall) | 64 (48.5%) | 68 (51.5%) |
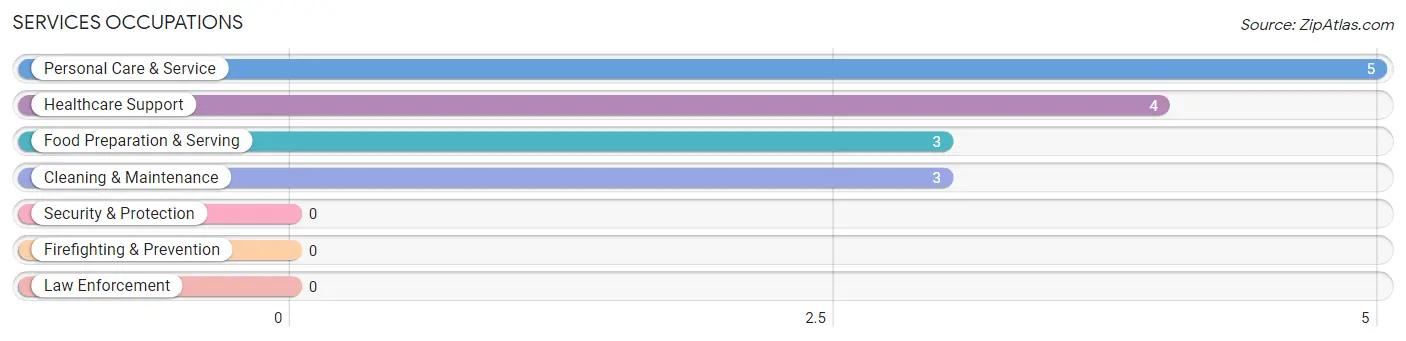
Services Occupations
The most common Services occupations in Brethren are Personal Care & Service (5 | 3.8%), Healthcare Support (4 | 3.0%), Food Preparation & Serving (3 | 2.3%), and Cleaning & Maintenance (3 | 2.3%).
Services Occupations by Sex
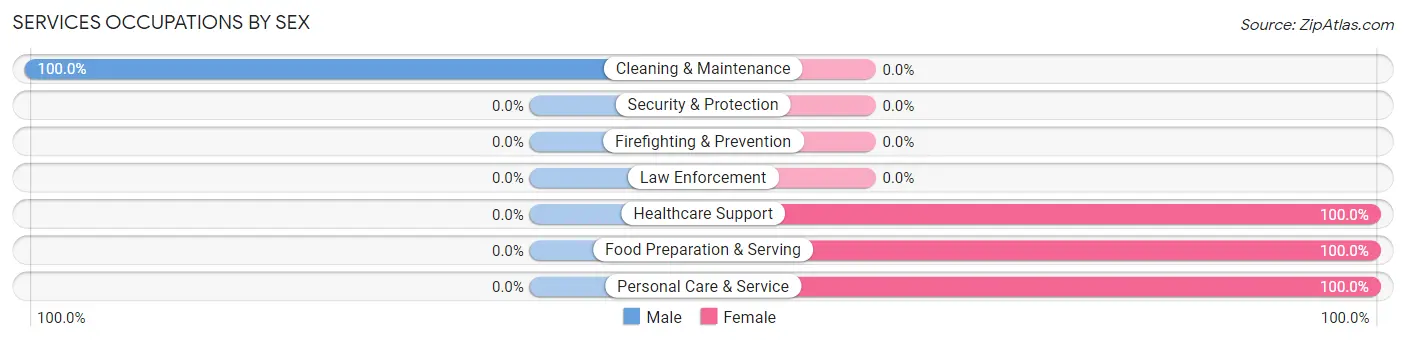
| Occupation | Male | Female |
| Healthcare Support | 0 (0.0%) | 4 (100.0%) |
| Security & Protection | 0 (0.0%) | 0 (0.0%) |
| Firefighting & Prevention | 0 (0.0%) | 0 (0.0%) |
| Law Enforcement | 0 (0.0%) | 0 (0.0%) |
| Food Preparation & Serving | 0 (0.0%) | 3 (100.0%) |
| Cleaning & Maintenance | 3 (100.0%) | 0 (0.0%) |
| Personal Care & Service | 0 (0.0%) | 5 (100.0%) |
| Total (Category) | 3 (20.0%) | 12 (80.0%) |
| Total (Overall) | 64 (48.5%) | 68 (51.5%) |
Sales and Office Occupations
The most common Sales and Office occupations in Brethren are Office & Administration (15 | 11.4%), and Sales & Related (3 | 2.3%).
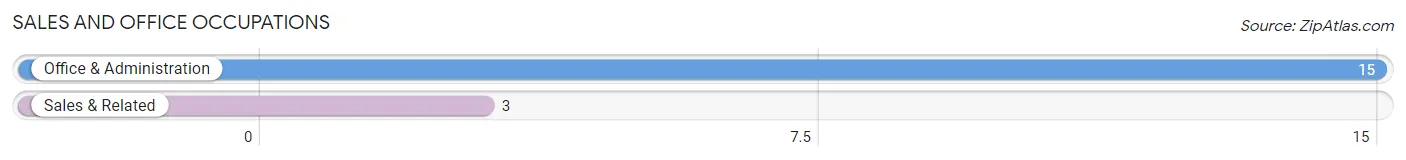
Sales and Office Occupations by Sex
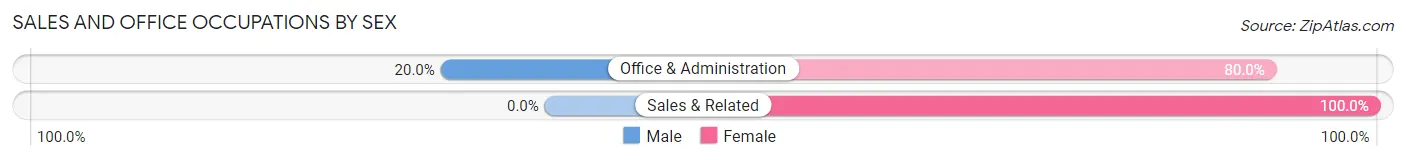
| Occupation | Male | Female |
| Sales & Related | 0 (0.0%) | 3 (100.0%) |
| Office & Administration | 3 (20.0%) | 12 (80.0%) |
| Total (Category) | 3 (16.7%) | 15 (83.3%) |
| Total (Overall) | 64 (48.5%) | 68 (51.5%) |
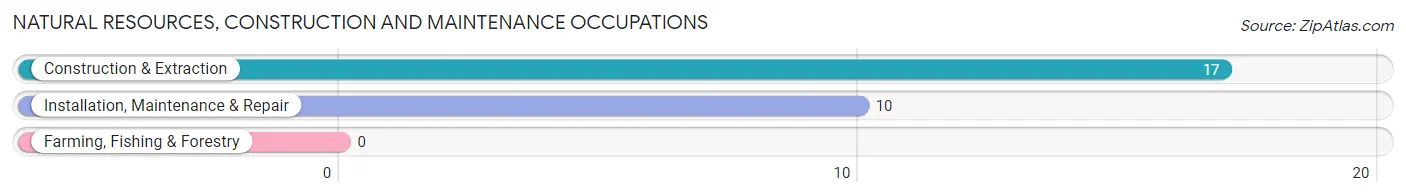
Natural Resources, Construction and Maintenance Occupations
The most common Natural Resources, Construction and Maintenance occupations in Brethren are Construction & Extraction (17 | 12.9%), and Installation, Maintenance & Repair (10 | 7.6%).
Natural Resources, Construction and Maintenance Occupations by Sex
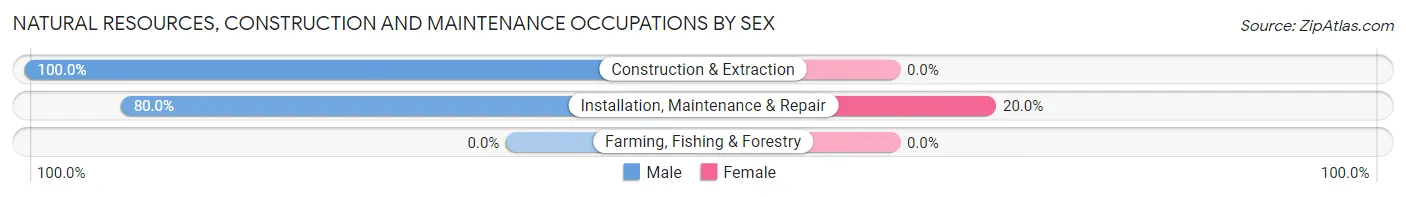
| Occupation | Male | Female |
| Farming, Fishing & Forestry | 0 (0.0%) | 0 (0.0%) |
| Construction & Extraction | 17 (100.0%) | 0 (0.0%) |
| Installation, Maintenance & Repair | 8 (80.0%) | 2 (20.0%) |
| Total (Category) | 25 (92.6%) | 2 (7.4%) |
| Total (Overall) | 64 (48.5%) | 68 (51.5%) |
Production, Transportation and Moving Occupations
The most common Production, Transportation and Moving occupations in Brethren are Transportation (18 | 13.6%), Production (10 | 7.6%), and Material Moving (5 | 3.8%).
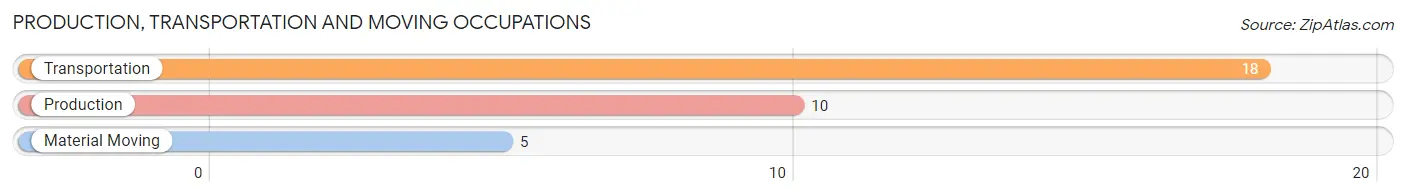
Production, Transportation and Moving Occupations by Sex
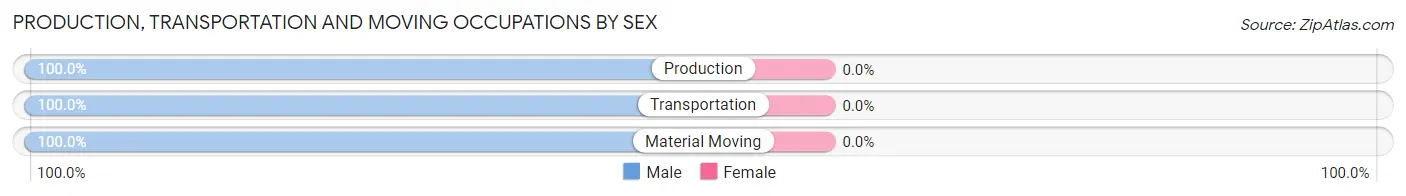
| Occupation | Male | Female |
| Production | 10 (100.0%) | 0 (0.0%) |
| Transportation | 18 (100.0%) | 0 (0.0%) |
| Material Moving | 5 (100.0%) | 0 (0.0%) |
| Total (Category) | 33 (100.0%) | 0 (0.0%) |
| Total (Overall) | 64 (48.5%) | 68 (51.5%) |
Employment Industries by Sex in Brethren
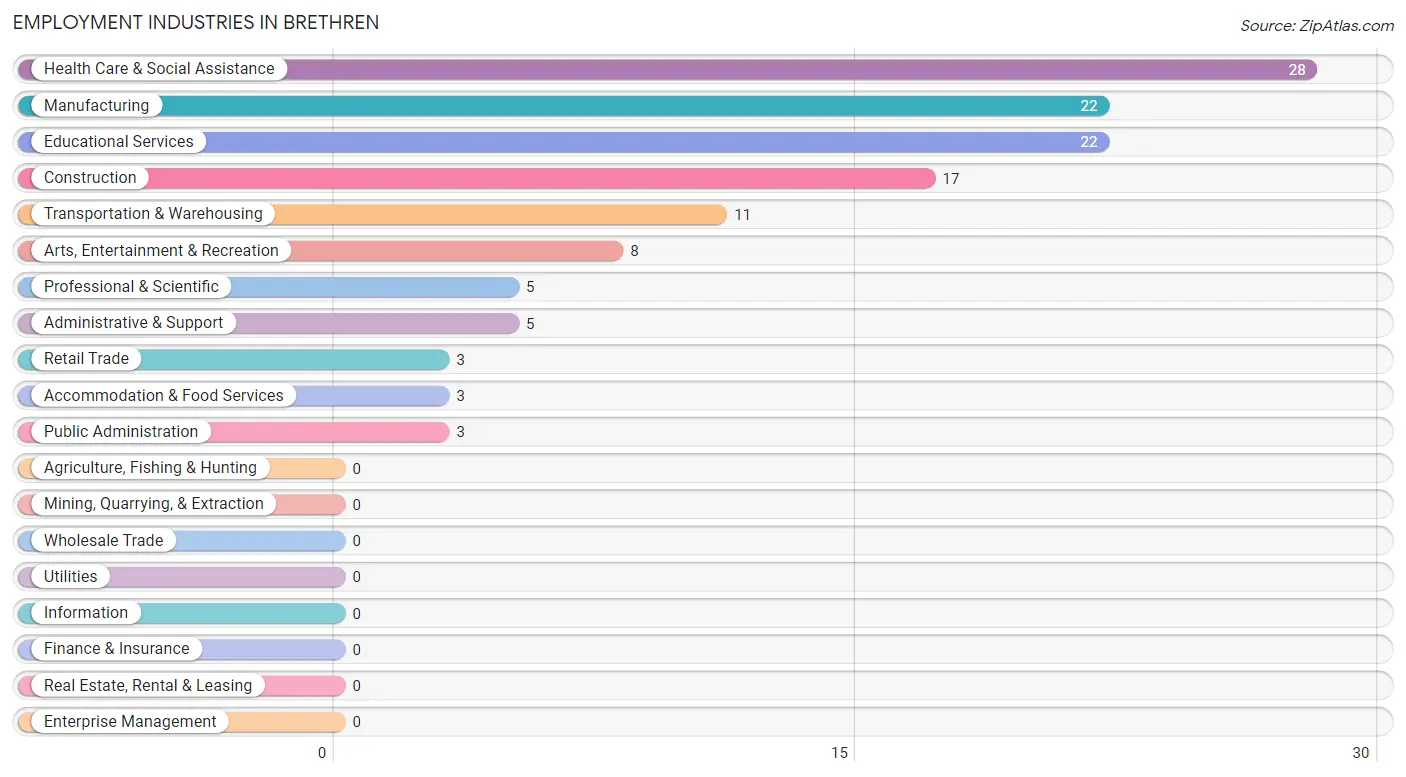
Employment Industries in Brethren
The major employment industries in Brethren include Health Care & Social Assistance (28 | 21.2%), Manufacturing (22 | 16.7%), Educational Services (22 | 16.7%), Construction (17 | 12.9%), and Transportation & Warehousing (11 | 8.3%).
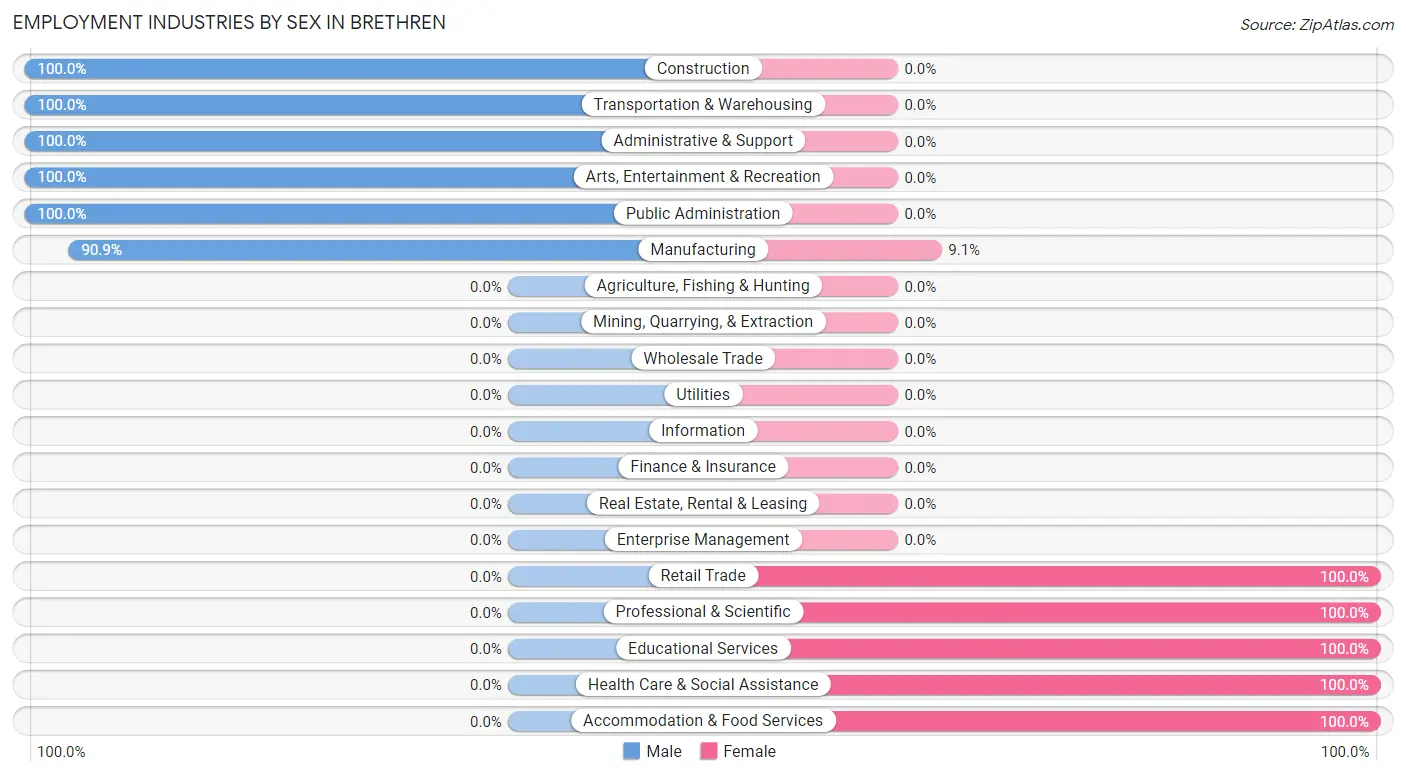
Employment Industries by Sex in Brethren
The Brethren industries that see more men than women are Construction (100.0%), Transportation & Warehousing (100.0%), and Administrative & Support (100.0%), whereas the industries that tend to have a higher number of women are Retail Trade (100.0%), Professional & Scientific (100.0%), and Educational Services (100.0%).
| Industry | Male | Female |
| Agriculture, Fishing & Hunting | 0 (0.0%) | 0 (0.0%) |
| Mining, Quarrying, & Extraction | 0 (0.0%) | 0 (0.0%) |
| Construction | 17 (100.0%) | 0 (0.0%) |
| Manufacturing | 20 (90.9%) | 2 (9.1%) |
| Wholesale Trade | 0 (0.0%) | 0 (0.0%) |
| Retail Trade | 0 (0.0%) | 3 (100.0%) |
| Transportation & Warehousing | 11 (100.0%) | 0 (0.0%) |
| Utilities | 0 (0.0%) | 0 (0.0%) |
| Information | 0 (0.0%) | 0 (0.0%) |
| Finance & Insurance | 0 (0.0%) | 0 (0.0%) |
| Real Estate, Rental & Leasing | 0 (0.0%) | 0 (0.0%) |
| Professional & Scientific | 0 (0.0%) | 5 (100.0%) |
| Enterprise Management | 0 (0.0%) | 0 (0.0%) |
| Administrative & Support | 5 (100.0%) | 0 (0.0%) |
| Educational Services | 0 (0.0%) | 22 (100.0%) |
| Health Care & Social Assistance | 0 (0.0%) | 28 (100.0%) |
| Arts, Entertainment & Recreation | 8 (100.0%) | 0 (0.0%) |
| Accommodation & Food Services | 0 (0.0%) | 3 (100.0%) |
| Public Administration | 3 (100.0%) | 0 (0.0%) |
| Total | 64 (48.5%) | 68 (51.5%) |
Education in Brethren
School Enrollment in Brethren
The most common levels of schooling among the 97 students in Brethren are high school (74 | 76.3%), elementary school (13 | 13.4%), and nursery / preschool (5 | 5.1%).
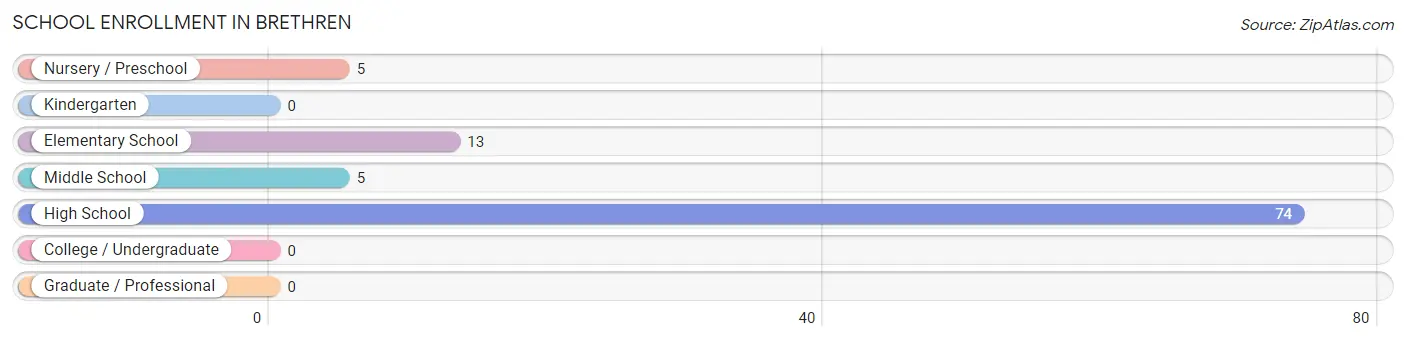
| School Level | # Students | % Students |
| Nursery / Preschool | 5 | 5.1% |
| Kindergarten | 0 | 0.0% |
| Elementary School | 13 | 13.4% |
| Middle School | 5 | 5.1% |
| High School | 74 | 76.3% |
| College / Undergraduate | 0 | 0.0% |
| Graduate / Professional | 0 | 0.0% |
| Total | 97 | 100.0% |
School Enrollment by Age by Funding Source in Brethren
Out of a total of 97 students who are enrolled in schools in Brethren, 9 (9.3%) attend a private institution, while the remaining 88 (90.7%) are enrolled in public schools. The age group of 35 years and over has the highest likelihood of being enrolled in private schools, with 9 (100.0% in the age bracket) enrolled. Conversely, the age group of 3 to 4 year olds has the lowest likelihood of being enrolled in a private school, with 5 (100.0% in the age bracket) attending a public institution.
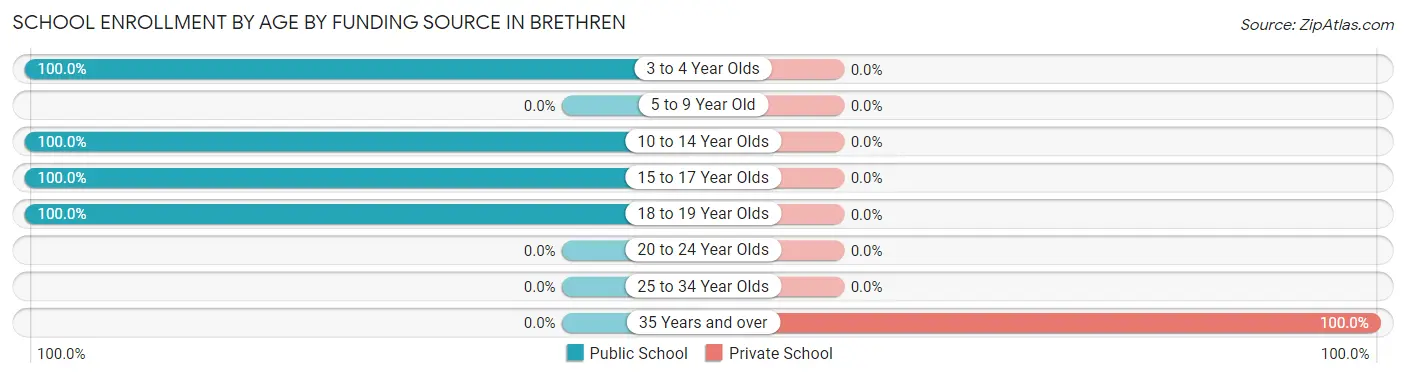
| Age Bracket | Public School | Private School |
| 3 to 4 Year Olds | 5 (100.0%) | 0 (0.0%) |
| 5 to 9 Year Old | 0 (0.0%) | 0 (0.0%) |
| 10 to 14 Year Olds | 41 (100.0%) | 0 (0.0%) |
| 15 to 17 Year Olds | 33 (100.0%) | 0 (0.0%) |
| 18 to 19 Year Olds | 9 (100.0%) | 0 (0.0%) |
| 20 to 24 Year Olds | 0 (0.0%) | 0 (0.0%) |
| 25 to 34 Year Olds | 0 (0.0%) | 0 (0.0%) |
| 35 Years and over | 0 (0.0%) | 9 (100.0%) |
| Total | 88 (90.7%) | 9 (9.3%) |
Educational Attainment by Field of Study in Brethren
Science & technology (6 | 30.0%), business (5 | 25.0%), education (4 | 20.0%), bio, nature & agricultural (3 | 15.0%), and physical & health sciences (2 | 10.0%) are the most common fields of study among 20 individuals in Brethren who have obtained a bachelor's degree or higher.
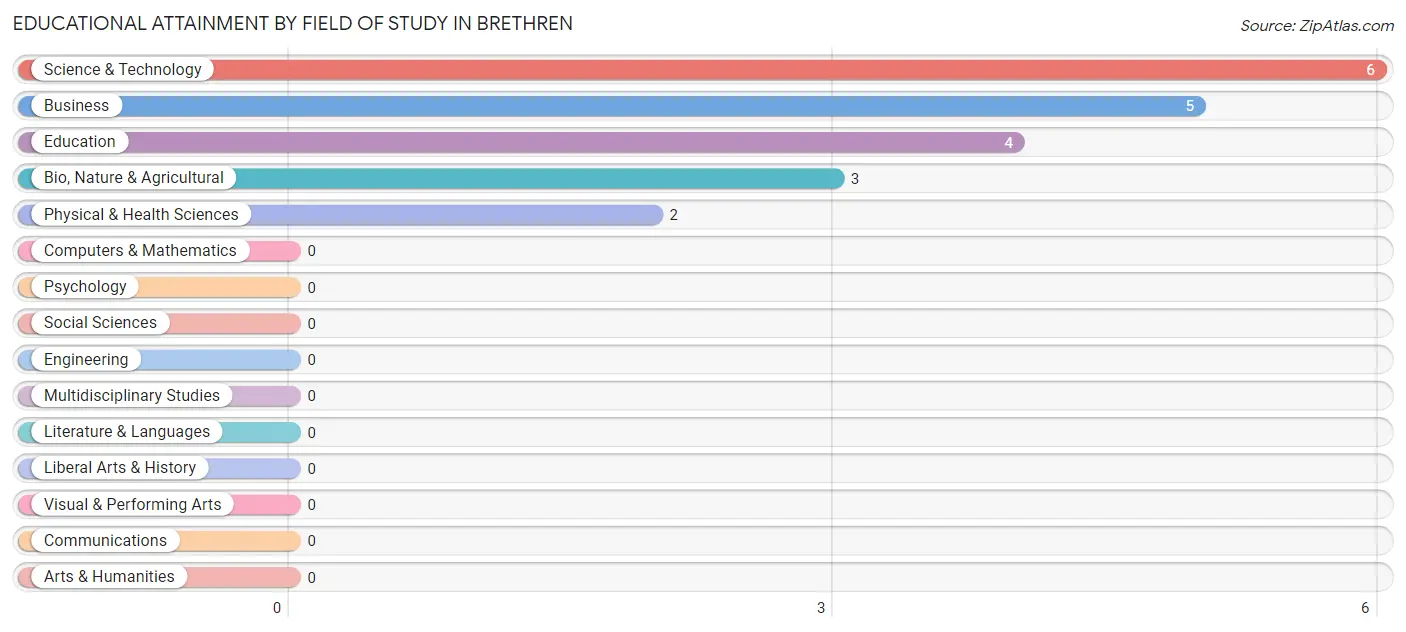
| Field of Study | # Graduates | % Graduates |
| Computers & Mathematics | 0 | 0.0% |
| Bio, Nature & Agricultural | 3 | 15.0% |
| Physical & Health Sciences | 2 | 10.0% |
| Psychology | 0 | 0.0% |
| Social Sciences | 0 | 0.0% |
| Engineering | 0 | 0.0% |
| Multidisciplinary Studies | 0 | 0.0% |
| Science & Technology | 6 | 30.0% |
| Business | 5 | 25.0% |
| Education | 4 | 20.0% |
| Literature & Languages | 0 | 0.0% |
| Liberal Arts & History | 0 | 0.0% |
| Visual & Performing Arts | 0 | 0.0% |
| Communications | 0 | 0.0% |
| Arts & Humanities | 0 | 0.0% |
| Total | 20 | 100.0% |
Transportation & Commute in Brethren
Vehicle Availability by Sex in Brethren
The most prevalent vehicle ownership categories in Brethren are males with 2 vehicles (18, accounting for 28.1%) and females with 2 vehicles (23, making up 28.6%).
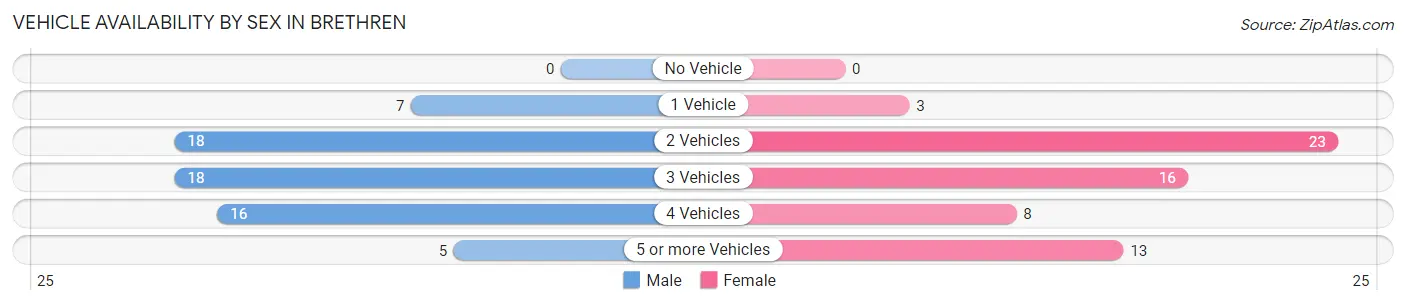
| Vehicles Available | Male | Female |
| No Vehicle | 0 (0.0%) | 0 (0.0%) |
| 1 Vehicle | 7 (10.9%) | 3 (4.8%) |
| 2 Vehicles | 18 (28.1%) | 23 (36.5%) |
| 3 Vehicles | 18 (28.1%) | 16 (25.4%) |
| 4 Vehicles | 16 (25.0%) | 8 (12.7%) |
| 5 or more Vehicles | 5 (7.8%) | 13 (20.6%) |
| Total | 64 (100.0%) | 63 (100.0%) |
Commute Time in Brethren
The most frequently occuring commute durations in Brethren are 5 to 9 minutes (20 commuters, 17.1%), 25 to 29 minutes (20 commuters, 17.1%), and 10 to 14 minutes (18 commuters, 15.4%).
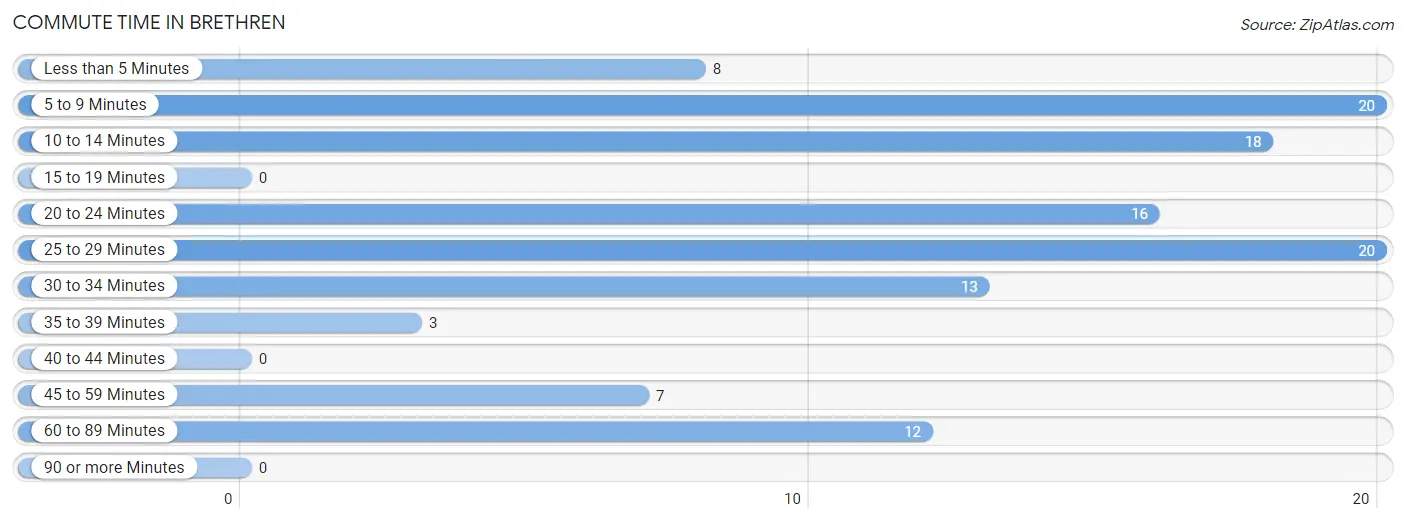
| Commute Time | # Commuters | % Commuters |
| Less than 5 Minutes | 8 | 6.8% |
| 5 to 9 Minutes | 20 | 17.1% |
| 10 to 14 Minutes | 18 | 15.4% |
| 15 to 19 Minutes | 0 | 0.0% |
| 20 to 24 Minutes | 16 | 13.7% |
| 25 to 29 Minutes | 20 | 17.1% |
| 30 to 34 Minutes | 13 | 11.1% |
| 35 to 39 Minutes | 3 | 2.6% |
| 40 to 44 Minutes | 0 | 0.0% |
| 45 to 59 Minutes | 7 | 6.0% |
| 60 to 89 Minutes | 12 | 10.3% |
| 90 or more Minutes | 0 | 0.0% |
Commute Time by Sex in Brethren
The most common commute times in Brethren are 25 to 29 minutes (16 commuters, 25.0%) for males and 5 to 9 minutes (13 commuters, 24.5%) for females.
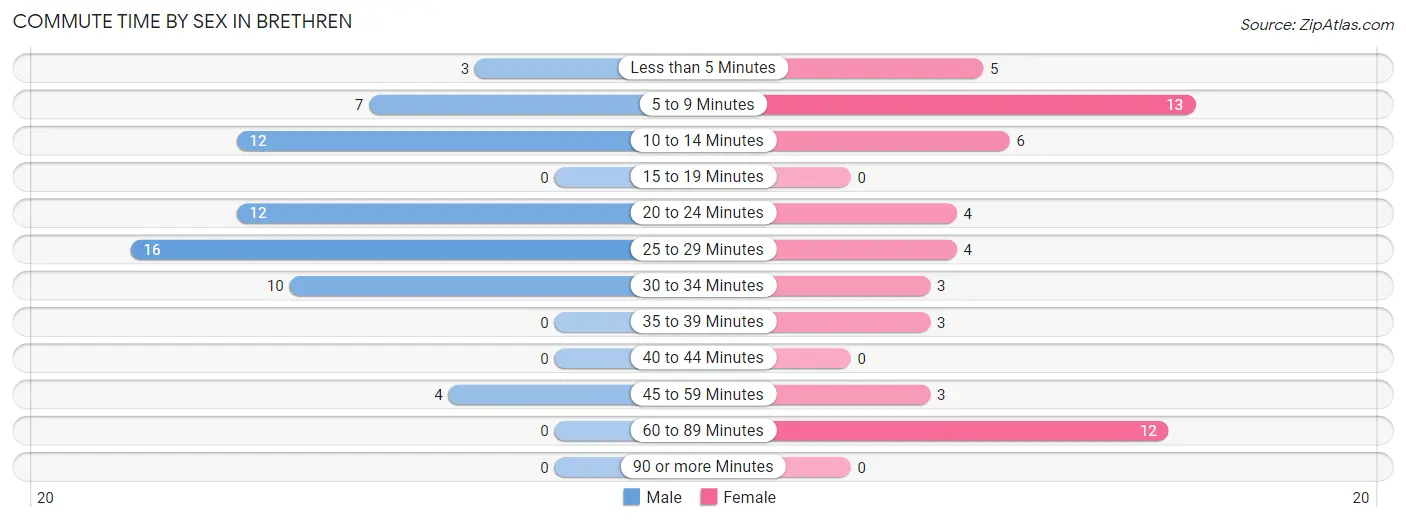
| Commute Time | Male | Female |
| Less than 5 Minutes | 3 (4.7%) | 5 (9.4%) |
| 5 to 9 Minutes | 7 (10.9%) | 13 (24.5%) |
| 10 to 14 Minutes | 12 (18.8%) | 6 (11.3%) |
| 15 to 19 Minutes | 0 (0.0%) | 0 (0.0%) |
| 20 to 24 Minutes | 12 (18.8%) | 4 (7.5%) |
| 25 to 29 Minutes | 16 (25.0%) | 4 (7.5%) |
| 30 to 34 Minutes | 10 (15.6%) | 3 (5.7%) |
| 35 to 39 Minutes | 0 (0.0%) | 3 (5.7%) |
| 40 to 44 Minutes | 0 (0.0%) | 0 (0.0%) |
| 45 to 59 Minutes | 4 (6.2%) | 3 (5.7%) |
| 60 to 89 Minutes | 0 (0.0%) | 12 (22.6%) |
| 90 or more Minutes | 0 (0.0%) | 0 (0.0%) |
Time of Departure to Work by Sex in Brethren
The most frequent times of departure to work in Brethren are 6:00 AM to 6:29 AM (26, 40.6%) for males and 7:30 AM to 7:59 AM (19, 35.8%) for females.
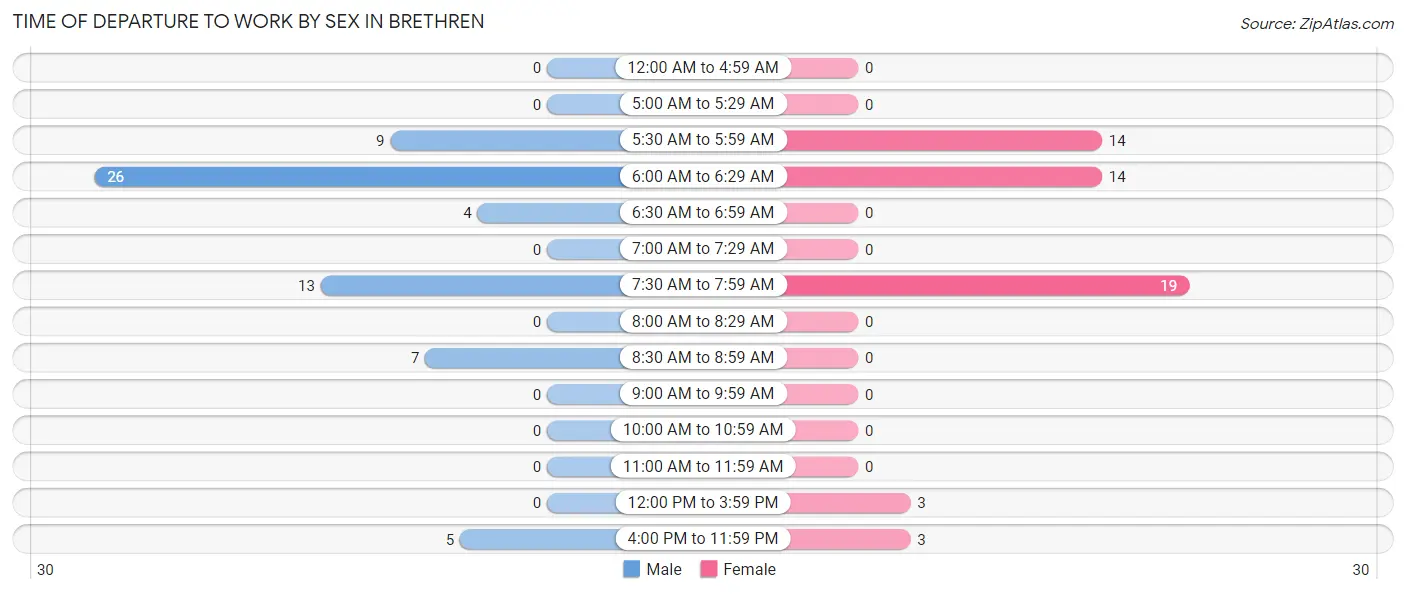
| Time of Departure | Male | Female |
| 12:00 AM to 4:59 AM | 0 (0.0%) | 0 (0.0%) |
| 5:00 AM to 5:29 AM | 0 (0.0%) | 0 (0.0%) |
| 5:30 AM to 5:59 AM | 9 (14.1%) | 14 (26.4%) |
| 6:00 AM to 6:29 AM | 26 (40.6%) | 14 (26.4%) |
| 6:30 AM to 6:59 AM | 4 (6.2%) | 0 (0.0%) |
| 7:00 AM to 7:29 AM | 0 (0.0%) | 0 (0.0%) |
| 7:30 AM to 7:59 AM | 13 (20.3%) | 19 (35.8%) |
| 8:00 AM to 8:29 AM | 0 (0.0%) | 0 (0.0%) |
| 8:30 AM to 8:59 AM | 7 (10.9%) | 0 (0.0%) |
| 9:00 AM to 9:59 AM | 0 (0.0%) | 0 (0.0%) |
| 10:00 AM to 10:59 AM | 0 (0.0%) | 0 (0.0%) |
| 11:00 AM to 11:59 AM | 0 (0.0%) | 0 (0.0%) |
| 12:00 PM to 3:59 PM | 0 (0.0%) | 3 (5.7%) |
| 4:00 PM to 11:59 PM | 5 (7.8%) | 3 (5.7%) |
| Total | 64 (100.0%) | 53 (100.0%) |
Housing Occupancy in Brethren
Occupancy by Ownership in Brethren
Of the total 144 dwellings in Brethren, owner-occupied units account for 129 (89.6%), while renter-occupied units make up 15 (10.4%).
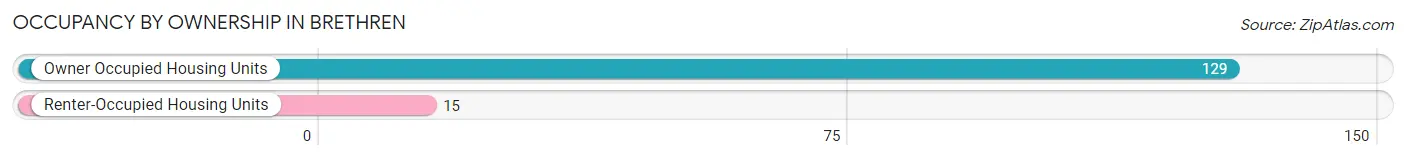
| Occupancy | # Housing Units | % Housing Units |
| Owner Occupied Housing Units | 129 | 89.6% |
| Renter-Occupied Housing Units | 15 | 10.4% |
| Total Occupied Housing Units | 144 | 100.0% |
Occupancy by Household Size in Brethren
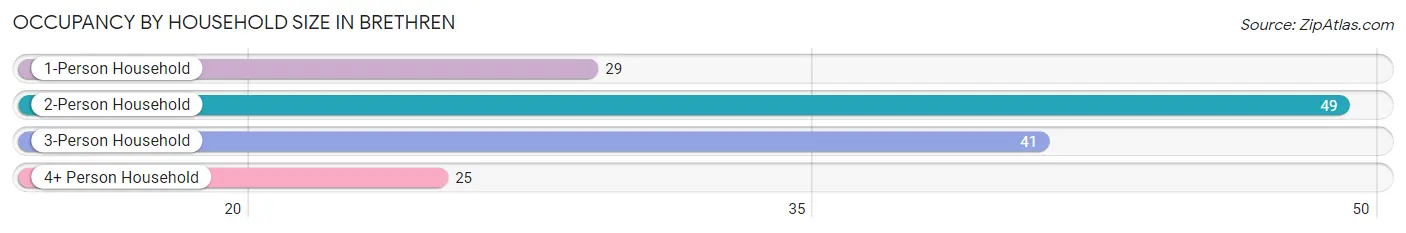
| Household Size | # Housing Units | % Housing Units |
| 1-Person Household | 29 | 20.1% |
| 2-Person Household | 49 | 34.0% |
| 3-Person Household | 41 | 28.5% |
| 4+ Person Household | 25 | 17.4% |
| Total Housing Units | 144 | 100.0% |
Occupancy by Ownership by Household Size in Brethren
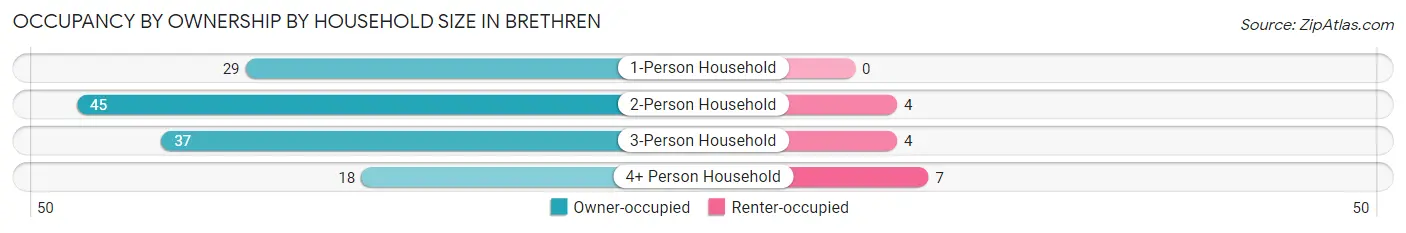
| Household Size | Owner-occupied | Renter-occupied |
| 1-Person Household | 29 (100.0%) | 0 (0.0%) |
| 2-Person Household | 45 (91.8%) | 4 (8.2%) |
| 3-Person Household | 37 (90.2%) | 4 (9.8%) |
| 4+ Person Household | 18 (72.0%) | 7 (28.0%) |
| Total Housing Units | 129 (89.6%) | 15 (10.4%) |
Occupancy by Educational Attainment in Brethren
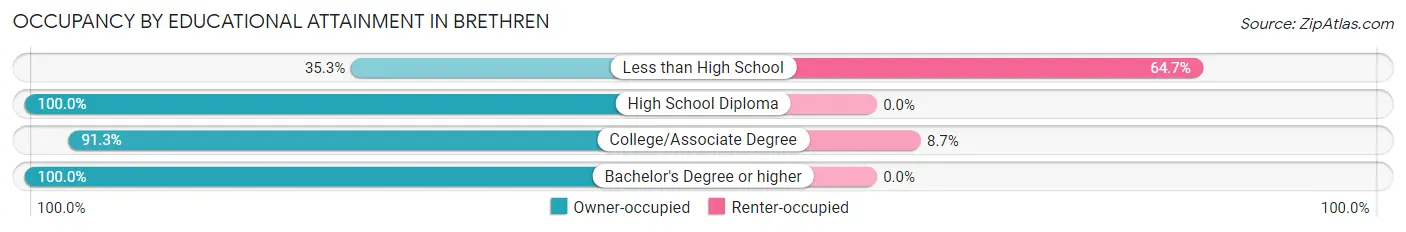
| Household Size | Owner-occupied | Renter-occupied |
| Less than High School | 6 (35.3%) | 11 (64.7%) |
| High School Diploma | 64 (100.0%) | 0 (0.0%) |
| College/Associate Degree | 42 (91.3%) | 4 (8.7%) |
| Bachelor's Degree or higher | 17 (100.0%) | 0 (0.0%) |
Occupancy by Age of Householder in Brethren
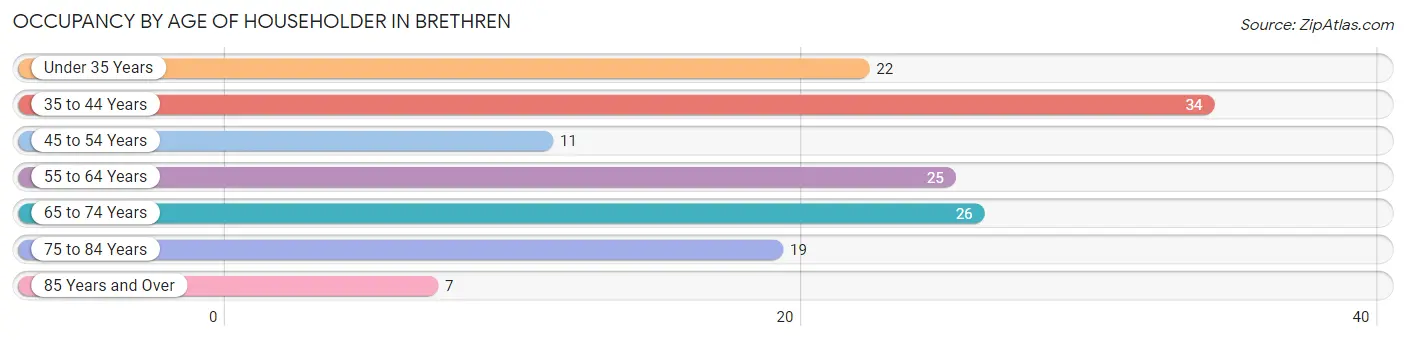
| Age Bracket | # Households | % Households |
| Under 35 Years | 22 | 15.3% |
| 35 to 44 Years | 34 | 23.6% |
| 45 to 54 Years | 11 | 7.6% |
| 55 to 64 Years | 25 | 17.4% |
| 65 to 74 Years | 26 | 18.1% |
| 75 to 84 Years | 19 | 13.2% |
| 85 Years and Over | 7 | 4.9% |
| Total | 144 | 100.0% |
Housing Finances in Brethren
Median Income by Occupancy in Brethren
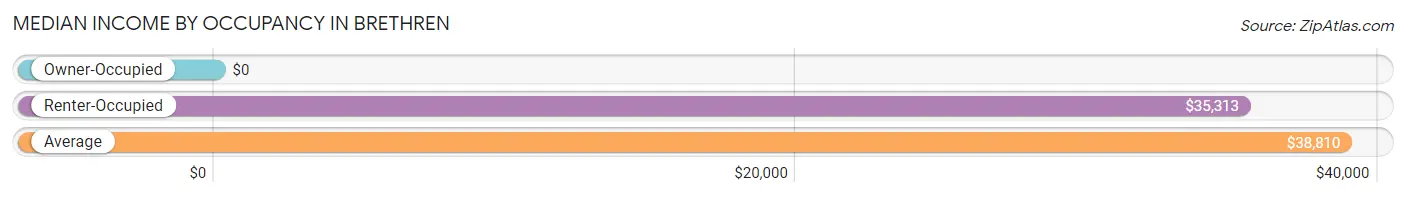
| Occupancy Type | # Households | Median Income |
| Owner-Occupied | 129 (89.6%) | $0 |
| Renter-Occupied | 15 (10.4%) | $35,313 |
| Average | 144 (100.0%) | $38,810 |
Occupancy by Householder Income Bracket in Brethren
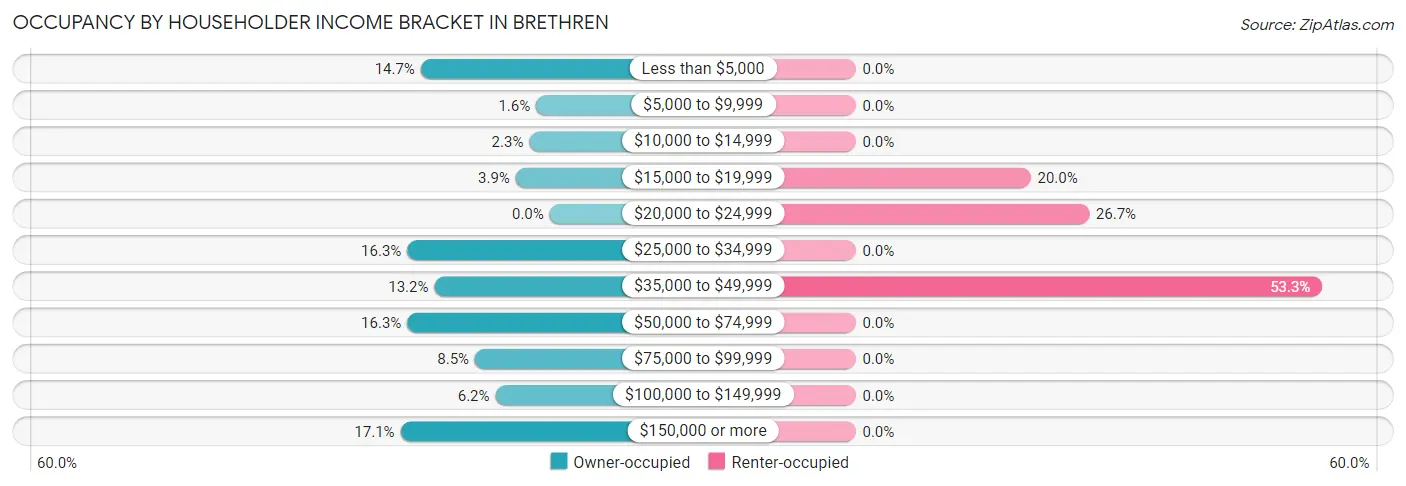
| Income Bracket | Owner-occupied | Renter-occupied |
| Less than $5,000 | 19 (14.7%) | 0 (0.0%) |
| $5,000 to $9,999 | 2 (1.5%) | 0 (0.0%) |
| $10,000 to $14,999 | 3 (2.3%) | 0 (0.0%) |
| $15,000 to $19,999 | 5 (3.9%) | 3 (20.0%) |
| $20,000 to $24,999 | 0 (0.0%) | 4 (26.7%) |
| $25,000 to $34,999 | 21 (16.3%) | 0 (0.0%) |
| $35,000 to $49,999 | 17 (13.2%) | 8 (53.3%) |
| $50,000 to $74,999 | 21 (16.3%) | 0 (0.0%) |
| $75,000 to $99,999 | 11 (8.5%) | 0 (0.0%) |
| $100,000 to $149,999 | 8 (6.2%) | 0 (0.0%) |
| $150,000 or more | 22 (17.1%) | 0 (0.0%) |
| Total | 129 (100.0%) | 15 (100.0%) |
Monthly Housing Cost Tiers in Brethren
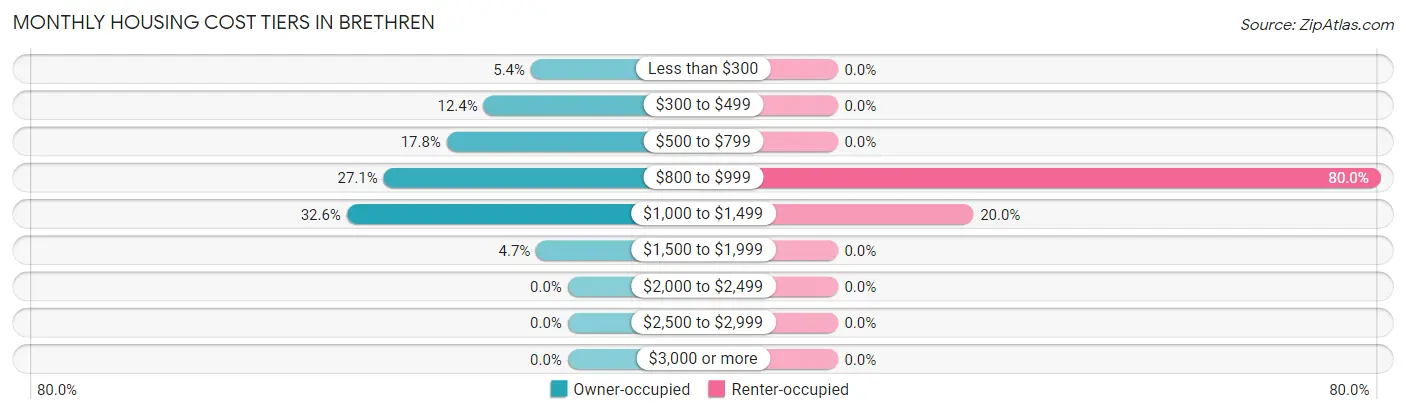
| Monthly Cost | Owner-occupied | Renter-occupied |
| Less than $300 | 7 (5.4%) | 0 (0.0%) |
| $300 to $499 | 16 (12.4%) | 0 (0.0%) |
| $500 to $799 | 23 (17.8%) | 0 (0.0%) |
| $800 to $999 | 35 (27.1%) | 12 (80.0%) |
| $1,000 to $1,499 | 42 (32.6%) | 3 (20.0%) |
| $1,500 to $1,999 | 6 (4.6%) | 0 (0.0%) |
| $2,000 to $2,499 | 0 (0.0%) | 0 (0.0%) |
| $2,500 to $2,999 | 0 (0.0%) | 0 (0.0%) |
| $3,000 or more | 0 (0.0%) | 0 (0.0%) |
| Total | 129 (100.0%) | 15 (100.0%) |
Physical Housing Characteristics in Brethren
Housing Structures in Brethren
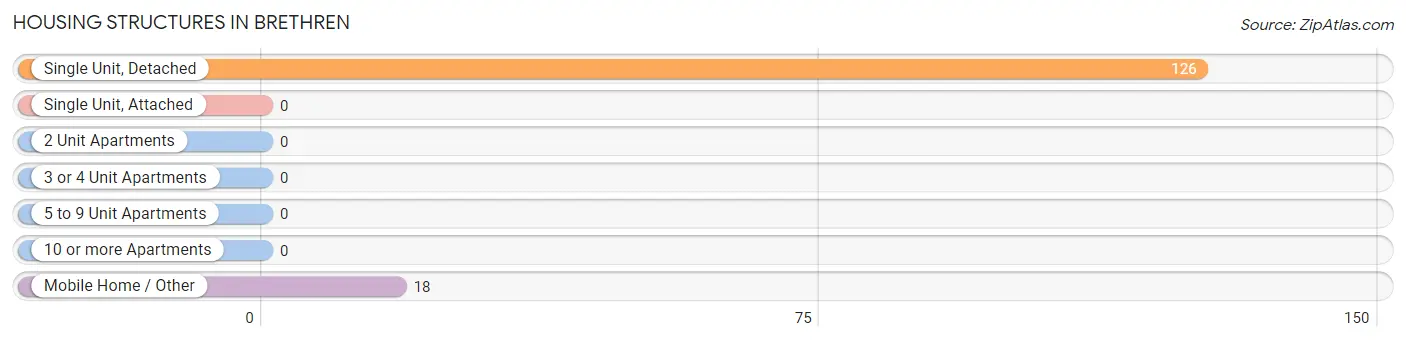
| Structure Type | # Housing Units | % Housing Units |
| Single Unit, Detached | 126 | 87.5% |
| Single Unit, Attached | 0 | 0.0% |
| 2 Unit Apartments | 0 | 0.0% |
| 3 or 4 Unit Apartments | 0 | 0.0% |
| 5 to 9 Unit Apartments | 0 | 0.0% |
| 10 or more Apartments | 0 | 0.0% |
| Mobile Home / Other | 18 | 12.5% |
| Total | 144 | 100.0% |
Housing Structures by Occupancy in Brethren
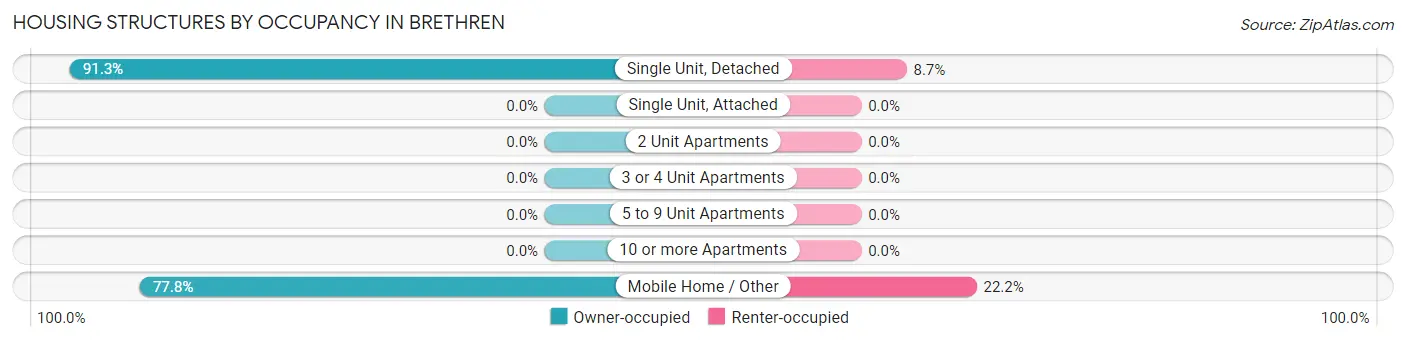
| Structure Type | Owner-occupied | Renter-occupied |
| Single Unit, Detached | 115 (91.3%) | 11 (8.7%) |
| Single Unit, Attached | 0 (0.0%) | 0 (0.0%) |
| 2 Unit Apartments | 0 (0.0%) | 0 (0.0%) |
| 3 or 4 Unit Apartments | 0 (0.0%) | 0 (0.0%) |
| 5 to 9 Unit Apartments | 0 (0.0%) | 0 (0.0%) |
| 10 or more Apartments | 0 (0.0%) | 0 (0.0%) |
| Mobile Home / Other | 14 (77.8%) | 4 (22.2%) |
| Total | 129 (89.6%) | 15 (10.4%) |
Housing Structures by Number of Rooms in Brethren
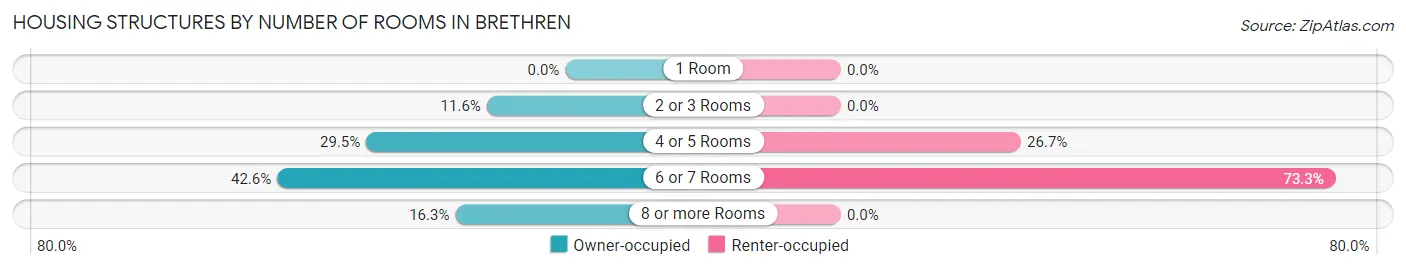
| Number of Rooms | Owner-occupied | Renter-occupied |
| 1 Room | 0 (0.0%) | 0 (0.0%) |
| 2 or 3 Rooms | 15 (11.6%) | 0 (0.0%) |
| 4 or 5 Rooms | 38 (29.5%) | 4 (26.7%) |
| 6 or 7 Rooms | 55 (42.6%) | 11 (73.3%) |
| 8 or more Rooms | 21 (16.3%) | 0 (0.0%) |
| Total | 129 (100.0%) | 15 (100.0%) |
Housing Structure by Heating Type in Brethren
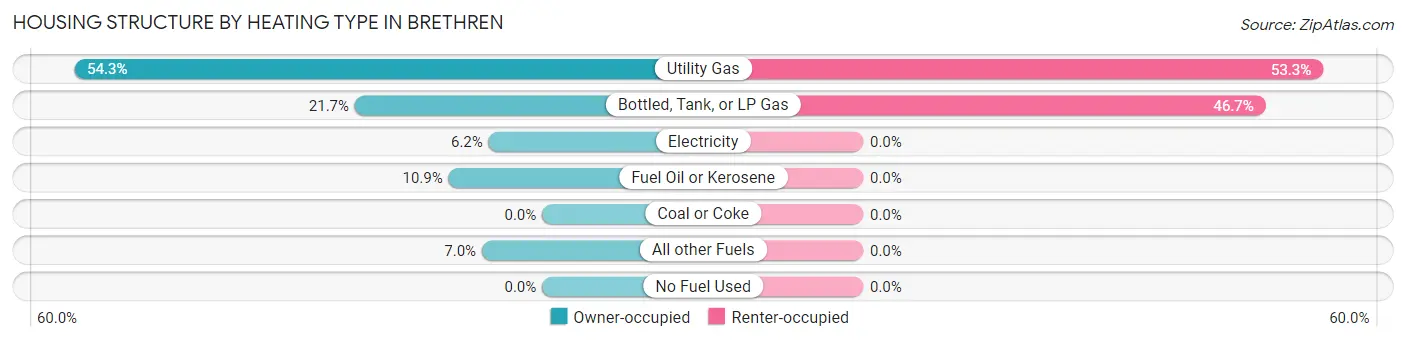
| Heating Type | Owner-occupied | Renter-occupied |
| Utility Gas | 70 (54.3%) | 8 (53.3%) |
| Bottled, Tank, or LP Gas | 28 (21.7%) | 7 (46.7%) |
| Electricity | 8 (6.2%) | 0 (0.0%) |
| Fuel Oil or Kerosene | 14 (10.8%) | 0 (0.0%) |
| Coal or Coke | 0 (0.0%) | 0 (0.0%) |
| All other Fuels | 9 (7.0%) | 0 (0.0%) |
| No Fuel Used | 0 (0.0%) | 0 (0.0%) |
| Total | 129 (100.0%) | 15 (100.0%) |
Household Vehicle Usage in Brethren
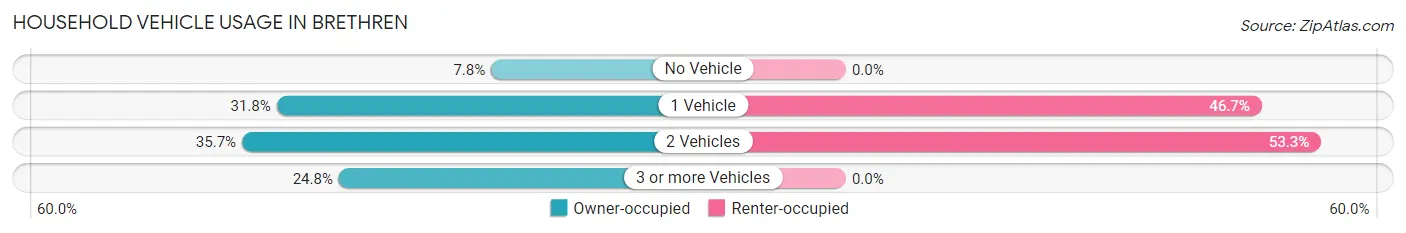
| Vehicles per Household | Owner-occupied | Renter-occupied |
| No Vehicle | 10 (7.7%) | 0 (0.0%) |
| 1 Vehicle | 41 (31.8%) | 7 (46.7%) |
| 2 Vehicles | 46 (35.7%) | 8 (53.3%) |
| 3 or more Vehicles | 32 (24.8%) | 0 (0.0%) |
| Total | 129 (100.0%) | 15 (100.0%) |
Real Estate & Mortgages in Brethren
Real Estate and Mortgage Overview in Brethren
| Characteristic | Without Mortgage | With Mortgage |
| Housing Units | 28 | 101 |
| Median Property Value | $112,500 | $89,800 |
| Median Household Income | - | - |
| Monthly Housing Costs | $339 | $0 |
| Real Estate Taxes | $1,042 | $10 |
Property Value by Mortgage Status in Brethren
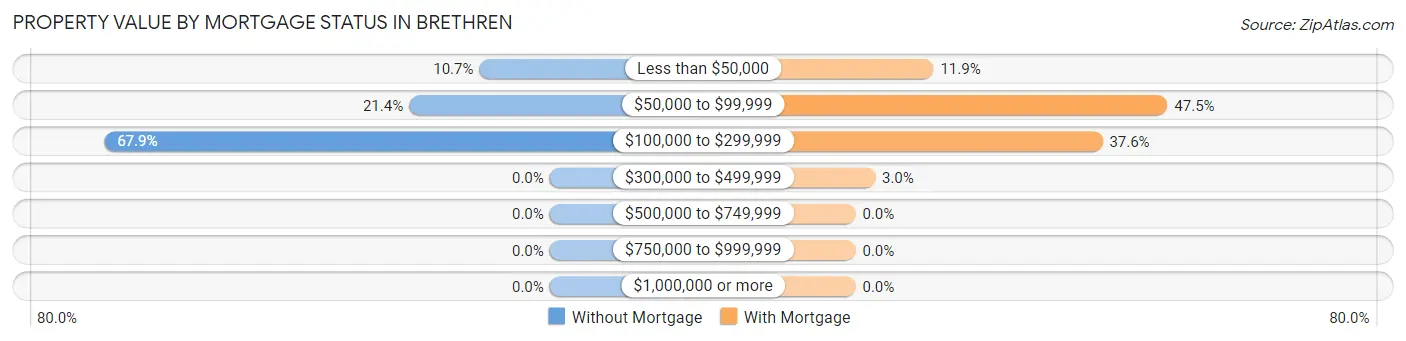
| Property Value | Without Mortgage | With Mortgage |
| Less than $50,000 | 3 (10.7%) | 12 (11.9%) |
| $50,000 to $99,999 | 6 (21.4%) | 48 (47.5%) |
| $100,000 to $299,999 | 19 (67.9%) | 38 (37.6%) |
| $300,000 to $499,999 | 0 (0.0%) | 3 (3.0%) |
| $500,000 to $749,999 | 0 (0.0%) | 0 (0.0%) |
| $750,000 to $999,999 | 0 (0.0%) | 0 (0.0%) |
| $1,000,000 or more | 0 (0.0%) | 0 (0.0%) |
| Total | 28 (100.0%) | 101 (100.0%) |
Household Income by Mortgage Status in Brethren
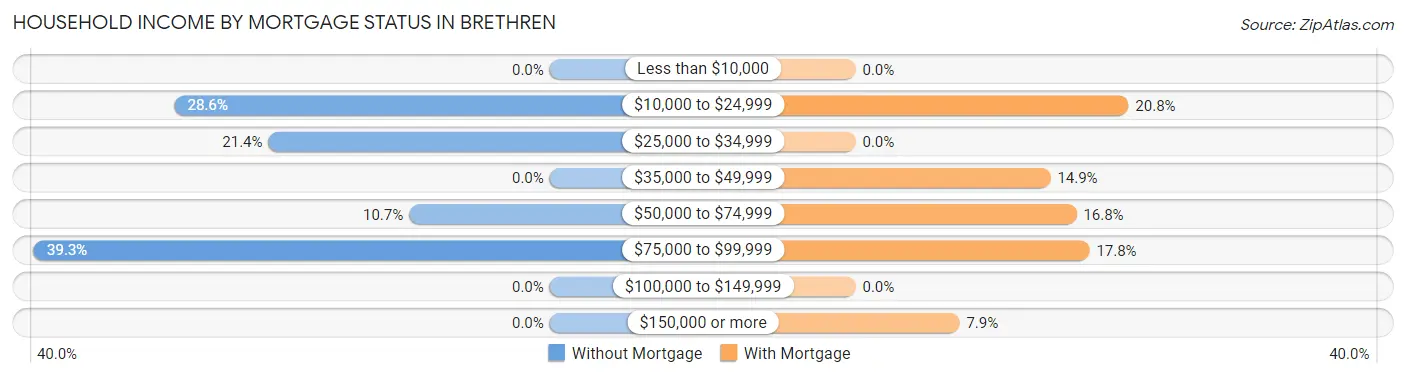
| Household Income | Without Mortgage | With Mortgage |
| Less than $10,000 | 0 (0.0%) | 0 (0.0%) |
| $10,000 to $24,999 | 8 (28.6%) | 21 (20.8%) |
| $25,000 to $34,999 | 6 (21.4%) | 0 (0.0%) |
| $35,000 to $49,999 | 0 (0.0%) | 15 (14.8%) |
| $50,000 to $74,999 | 3 (10.7%) | 17 (16.8%) |
| $75,000 to $99,999 | 11 (39.3%) | 18 (17.8%) |
| $100,000 to $149,999 | 0 (0.0%) | 0 (0.0%) |
| $150,000 or more | 0 (0.0%) | 8 (7.9%) |
| Total | 28 (100.0%) | 101 (100.0%) |
Property Value to Household Income Ratio in Brethren
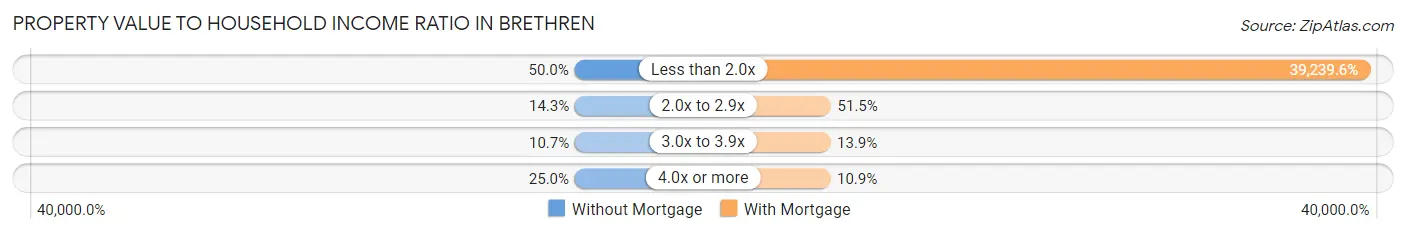
| Value-to-Income Ratio | Without Mortgage | With Mortgage |
| Less than 2.0x | 14 (50.0%) | 39,632 (39,239.6%) |
| 2.0x to 2.9x | 4 (14.3%) | 52 (51.5%) |
| 3.0x to 3.9x | 3 (10.7%) | 14 (13.9%) |
| 4.0x or more | 7 (25.0%) | 11 (10.9%) |
| Total | 28 (100.0%) | 101 (100.0%) |
Real Estate Taxes by Mortgage Status in Brethren
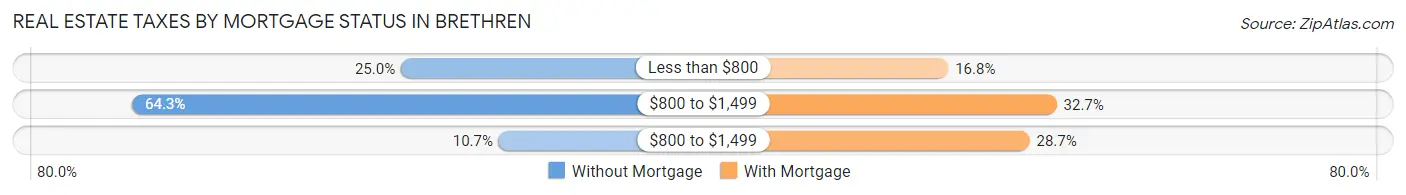
| Property Taxes | Without Mortgage | With Mortgage |
| Less than $800 | 7 (25.0%) | 17 (16.8%) |
| $800 to $1,499 | 18 (64.3%) | 33 (32.7%) |
| $800 to $1,499 | 3 (10.7%) | 29 (28.7%) |
| Total | 28 (100.0%) | 101 (100.0%) |
Health & Disability in Brethren
Health Insurance Coverage by Age in Brethren
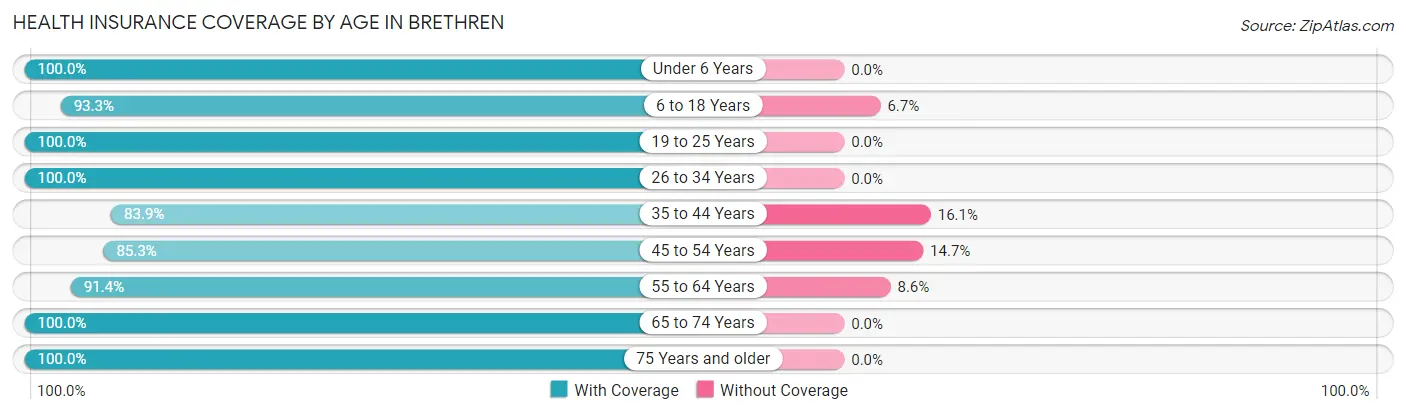
| Age Bracket | With Coverage | Without Coverage |
| Under 6 Years | 24 (100.0%) | 0 (0.0%) |
| 6 to 18 Years | 83 (93.3%) | 6 (6.7%) |
| 19 to 25 Years | 22 (100.0%) | 0 (0.0%) |
| 26 to 34 Years | 28 (100.0%) | 0 (0.0%) |
| 35 to 44 Years | 52 (83.9%) | 10 (16.1%) |
| 45 to 54 Years | 29 (85.3%) | 5 (14.7%) |
| 55 to 64 Years | 53 (91.4%) | 5 (8.6%) |
| 65 to 74 Years | 45 (100.0%) | 0 (0.0%) |
| 75 Years and older | 30 (100.0%) | 0 (0.0%) |
| Total | 366 (93.4%) | 26 (6.6%) |
Health Insurance Coverage by Citizenship Status in Brethren
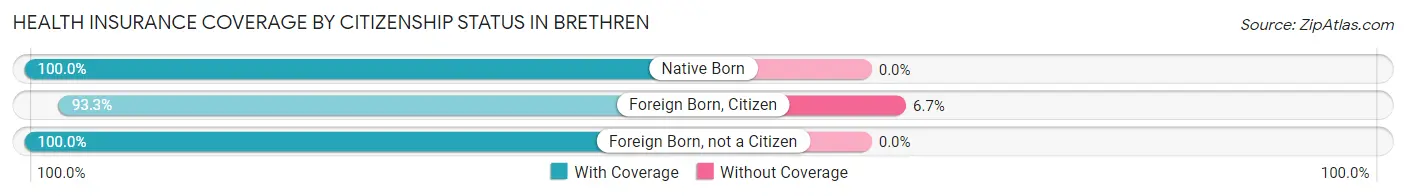
| Citizenship Status | With Coverage | Without Coverage |
| Native Born | 24 (100.0%) | 0 (0.0%) |
| Foreign Born, Citizen | 83 (93.3%) | 6 (6.7%) |
| Foreign Born, not a Citizen | 22 (100.0%) | 0 (0.0%) |
Health Insurance Coverage by Household Income in Brethren
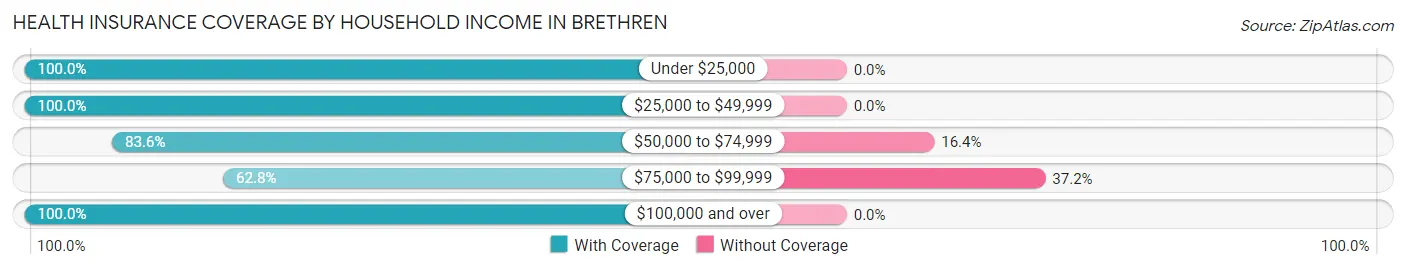
| Household Income | With Coverage | Without Coverage |
| Under $25,000 | 67 (100.0%) | 0 (0.0%) |
| $25,000 to $49,999 | 109 (100.0%) | 0 (0.0%) |
| $50,000 to $74,999 | 51 (83.6%) | 10 (16.4%) |
| $75,000 to $99,999 | 27 (62.8%) | 16 (37.2%) |
| $100,000 and over | 112 (100.0%) | 0 (0.0%) |
Public vs Private Health Insurance Coverage by Age in Brethren
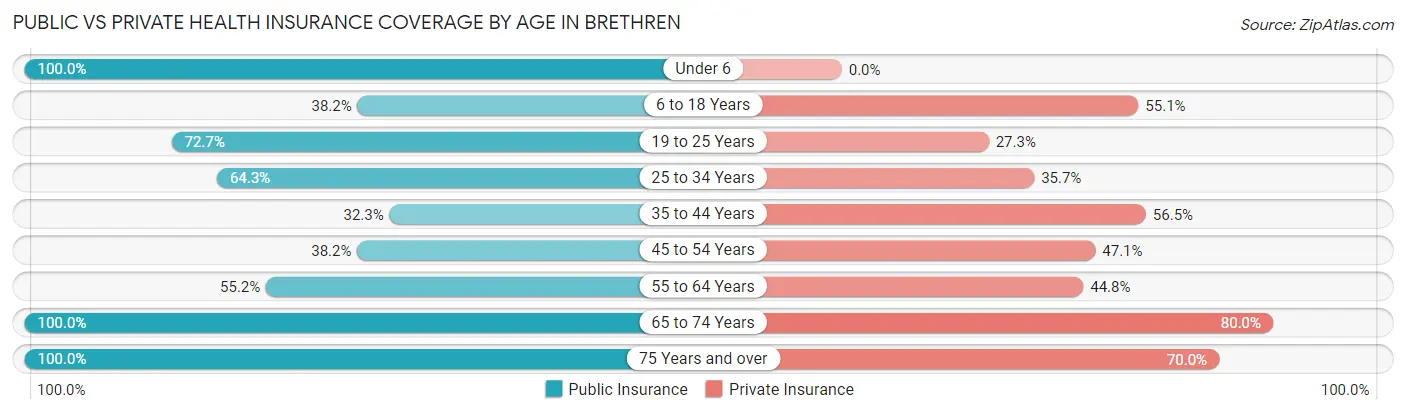
| Age Bracket | Public Insurance | Private Insurance |
| Under 6 | 24 (100.0%) | 0 (0.0%) |
| 6 to 18 Years | 34 (38.2%) | 49 (55.1%) |
| 19 to 25 Years | 16 (72.7%) | 6 (27.3%) |
| 25 to 34 Years | 18 (64.3%) | 10 (35.7%) |
| 35 to 44 Years | 20 (32.3%) | 35 (56.5%) |
| 45 to 54 Years | 13 (38.2%) | 16 (47.1%) |
| 55 to 64 Years | 32 (55.2%) | 26 (44.8%) |
| 65 to 74 Years | 45 (100.0%) | 36 (80.0%) |
| 75 Years and over | 30 (100.0%) | 21 (70.0%) |
| Total | 232 (59.2%) | 199 (50.8%) |
Disability Status by Sex by Age in Brethren
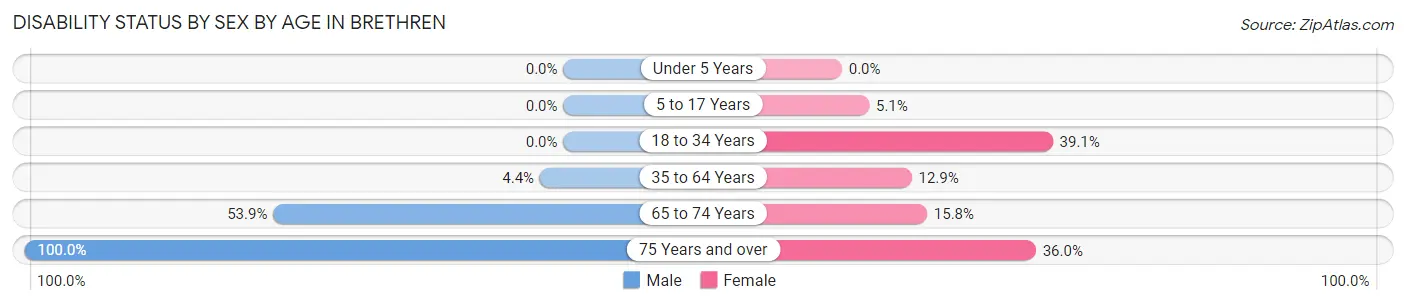
| Age Bracket | Male | Female |
| Under 5 Years | 0 (0.0%) | 0 (0.0%) |
| 5 to 17 Years | 0 (0.0%) | 4 (5.1%) |
| 18 to 34 Years | 0 (0.0%) | 9 (39.1%) |
| 35 to 64 Years | 3 (4.3%) | 11 (12.9%) |
| 65 to 74 Years | 14 (53.8%) | 3 (15.8%) |
| 75 Years and over | 5 (100.0%) | 9 (36.0%) |
Disability Class by Sex by Age in Brethren
Disability Class: Hearing Difficulty
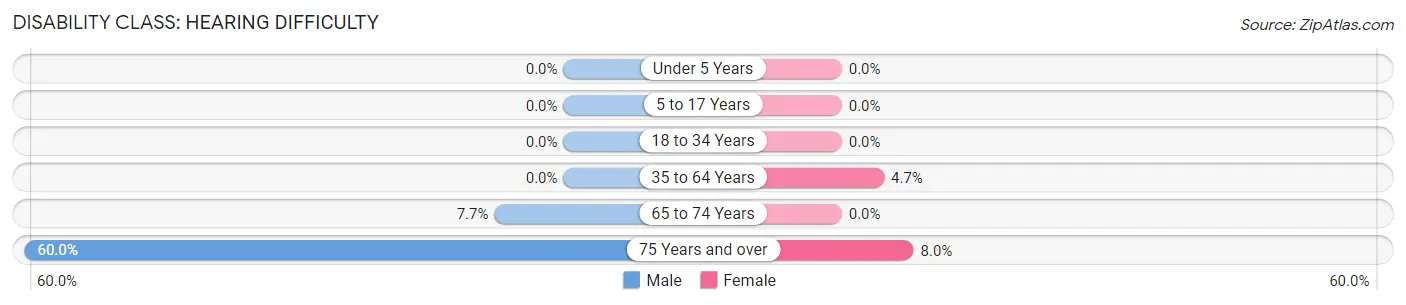
| Age Bracket | Male | Female |
| Under 5 Years | 0 (0.0%) | 0 (0.0%) |
| 5 to 17 Years | 0 (0.0%) | 0 (0.0%) |
| 18 to 34 Years | 0 (0.0%) | 0 (0.0%) |
| 35 to 64 Years | 0 (0.0%) | 4 (4.7%) |
| 65 to 74 Years | 2 (7.7%) | 0 (0.0%) |
| 75 Years and over | 3 (60.0%) | 2 (8.0%) |
Disability Class: Vision Difficulty
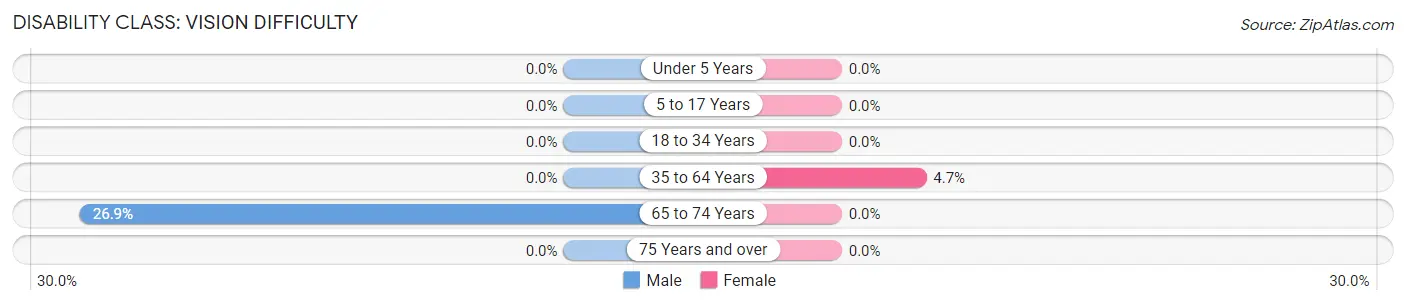
| Age Bracket | Male | Female |
| Under 5 Years | 0 (0.0%) | 0 (0.0%) |
| 5 to 17 Years | 0 (0.0%) | 0 (0.0%) |
| 18 to 34 Years | 0 (0.0%) | 0 (0.0%) |
| 35 to 64 Years | 0 (0.0%) | 4 (4.7%) |
| 65 to 74 Years | 7 (26.9%) | 0 (0.0%) |
| 75 Years and over | 0 (0.0%) | 0 (0.0%) |
Disability Class: Cognitive Difficulty
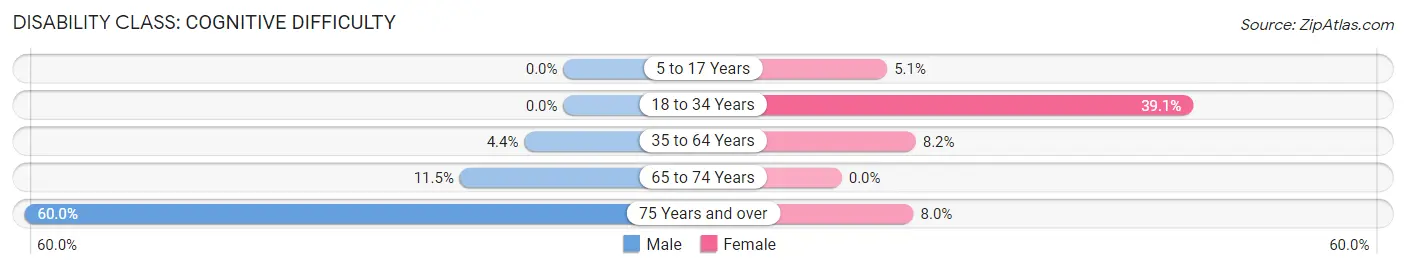
| Age Bracket | Male | Female |
| 5 to 17 Years | 0 (0.0%) | 4 (5.1%) |
| 18 to 34 Years | 0 (0.0%) | 9 (39.1%) |
| 35 to 64 Years | 3 (4.3%) | 7 (8.2%) |
| 65 to 74 Years | 3 (11.5%) | 0 (0.0%) |
| 75 Years and over | 3 (60.0%) | 2 (8.0%) |
Disability Class: Ambulatory Difficulty
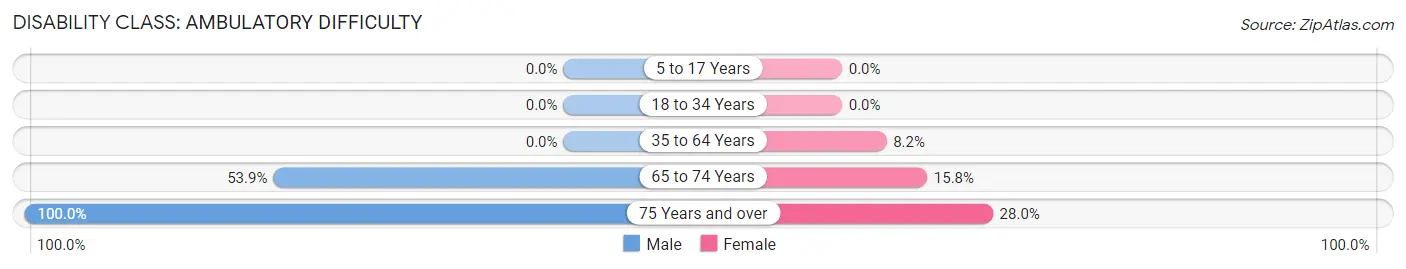
| Age Bracket | Male | Female |
| 5 to 17 Years | 0 (0.0%) | 0 (0.0%) |
| 18 to 34 Years | 0 (0.0%) | 0 (0.0%) |
| 35 to 64 Years | 0 (0.0%) | 7 (8.2%) |
| 65 to 74 Years | 14 (53.8%) | 3 (15.8%) |
| 75 Years and over | 5 (100.0%) | 7 (28.0%) |
Disability Class: Self-Care Difficulty
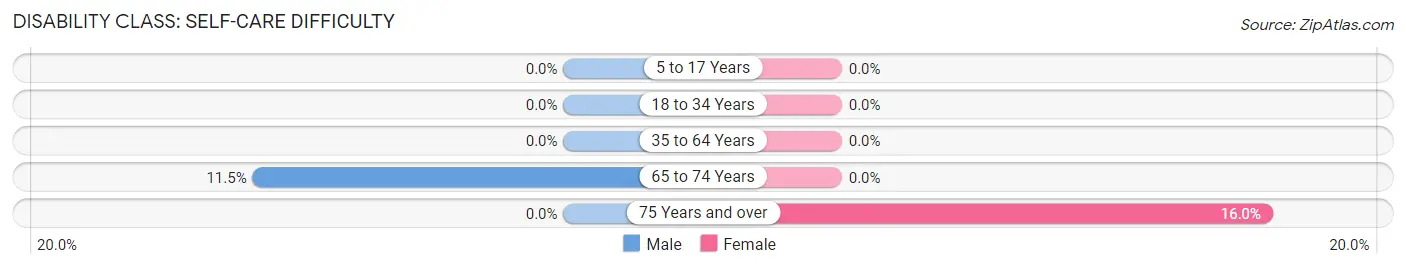
| Age Bracket | Male | Female |
| 5 to 17 Years | 0 (0.0%) | 0 (0.0%) |
| 18 to 34 Years | 0 (0.0%) | 0 (0.0%) |
| 35 to 64 Years | 0 (0.0%) | 0 (0.0%) |
| 65 to 74 Years | 3 (11.5%) | 0 (0.0%) |
| 75 Years and over | 0 (0.0%) | 4 (16.0%) |
Technology Access in Brethren
Computing Device Access in Brethren
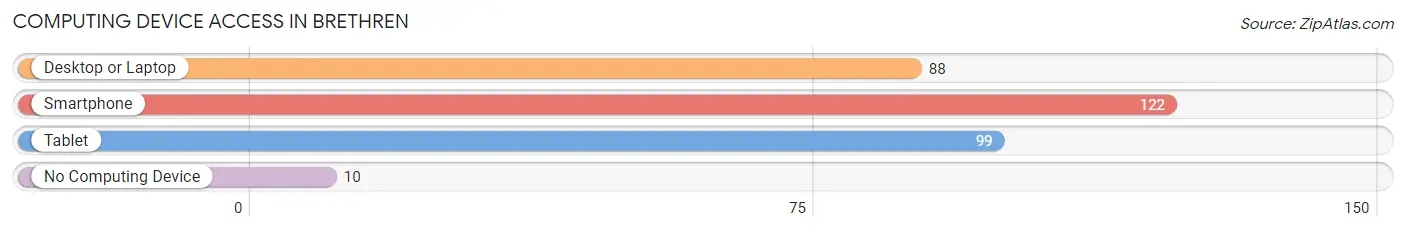
| Device Type | # Households | % Households |
| Desktop or Laptop | 88 | 61.1% |
| Smartphone | 122 | 84.7% |
| Tablet | 99 | 68.8% |
| No Computing Device | 10 | 6.9% |
| Total | 144 | 100.0% |
Internet Access in Brethren
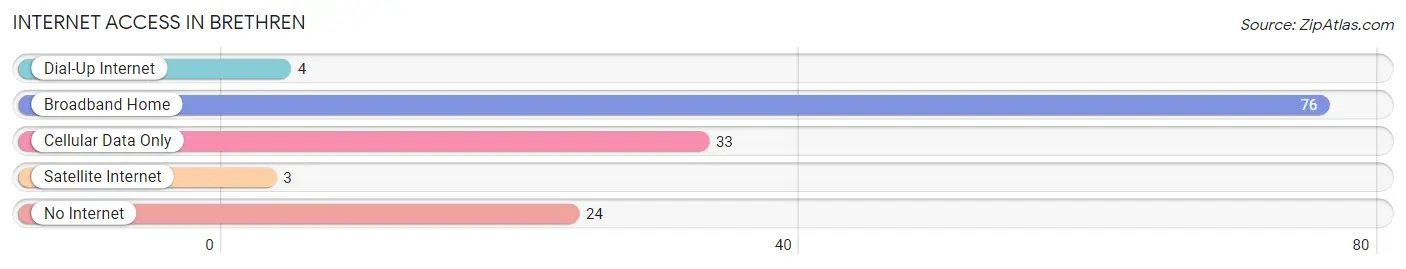
| Internet Type | # Households | % Households |
| Dial-Up Internet | 4 | 2.8% |
| Broadband Home | 76 | 52.8% |
| Cellular Data Only | 33 | 22.9% |
| Satellite Internet | 3 | 2.1% |
| No Internet | 24 | 16.7% |
| Total | 144 | 100.0% |
Brethren Summary
Brethren, Michigan is a small village located in Manistee County in the northwestern part of the state. It is situated on the banks of the Manistee River, about 10 miles east of Lake Michigan. The village has a population of about 500 people and is part of the larger Manistee County area.
Geography
Brethren is located in the northwest corner of Manistee County, Michigan. It is situated on the banks of the Manistee River, about 10 miles east of Lake Michigan. The village is surrounded by rolling hills and forests, and is home to a variety of wildlife. The area is known for its abundance of lakes, rivers, and streams, which provide ample opportunities for fishing, boating, and other outdoor activities.
The village is located in the Central Lake Michigan Lowlands, a region characterized by flat terrain and sandy soils. The area is known for its mild climate, with temperatures rarely dropping below freezing in the winter months.
Economy
The economy of Brethren is largely based on tourism and agriculture. The village is home to several small businesses, including a grocery store, a hardware store, and a few restaurants. The village also has a small marina, which provides access to the Manistee River and Lake Michigan.
Agriculture is also an important part of the local economy. The area is known for its production of apples, cherries, and other fruits and vegetables. The village also has a number of dairy farms, which produce milk and other dairy products.
Demographics
As of the 2010 census, the population of Brethren was 498. The racial makeup of the village was 97.2% White, 0.2% African American, 0.4% Native American, 0.2% Asian, 0.2% from other races, and 1.9% from two or more races. Hispanic or Latino of any race were 1.2% of the population.
The median household income in Brethren was $37,500, and the median family income was $45,000. The per capita income for the village was $19,000. About 11.2% of families and 14.2% of the population were below the poverty line, including 18.2% of those under age 18 and 8.3% of those age 65 or over.
Conclusion
Brethren, Michigan is a small village located in Manistee County in the northwestern part of the state. It is situated on the banks of the Manistee River, about 10 miles east of Lake Michigan. The village has a population of about 500 people and is part of the larger Manistee County area. The economy of Brethren is largely based on tourism and agriculture, and the area is known for its mild climate and abundance of lakes, rivers, and streams. The racial makeup of the village is predominantly White, with a small percentage of African American, Native American, and Asian residents. The median household income in Brethren was $37,500, and the median family income was $45,000. The village is home to several small businesses, and provides ample opportunities for fishing, boating, and other outdoor activities.
Common Questions
What is Per Capita Income in Brethren?
Per Capita income in Brethren is $25,381.
What is the Median Family Income in Brethren?
Median Family Income in Brethren is $39,063.
What is the Median Household income in Brethren?
Median Household Income in Brethren is $38,810.
What is Inequality or Gini Index in Brethren?
Inequality or Gini Index in Brethren is 0.51.
What is the Total Population of Brethren?
Total Population of Brethren is 392.
What is the Total Male Population of Brethren?
Total Male Population of Brethren is 156.
What is the Total Female Population of Brethren?
Total Female Population of Brethren is 236.
What is the Ratio of Males per 100 Females in Brethren?
There are 66.10 Males per 100 Females in Brethren.
What is the Ratio of Females per 100 Males in Brethren?
There are 151.28 Females per 100 Males in Brethren.
What is the Median Population Age in Brethren?
Median Population Age in Brethren is 42.8 Years.
What is the Average Family Size in Brethren
Average Family Size in Brethren is 3.0 People.
What is the Average Household Size in Brethren
Average Household Size in Brethren is 2.7 People.
How Large is the Labor Force in Brethren?
There are 134 People in the Labor Forcein in Brethren.
What is the Percentage of People in the Labor Force in Brethren?
43.2% of People are in the Labor Force in Brethren.
What is the Unemployment Rate in Brethren?
Unemployment Rate in Brethren is 1.5%.