Lincoln, MI Map & Demographics
Lincoln Map
Lincoln Overview
$30,075
PER CAPITA INCOME
$46,250
AVG FAMILY INCOME
$28,125
AVG HOUSEHOLD INCOME
33.3%
WAGE / INCOME GAP [ % ]
66.7¢/ $1
WAGE / INCOME GAP [ $ ]
0.59
INEQUALITY / GINI INDEX
233
TOTAL POPULATION
94
MALE POPULATION
139
FEMALE POPULATION
67.63
MALES / 100 FEMALES
147.87
FEMALES / 100 MALES
59.4
MEDIAN AGE
2.4
AVG FAMILY SIZE
1.6
AVG HOUSEHOLD SIZE
90
LABOR FORCE [ PEOPLE ]
42.3%
PERCENT IN LABOR FORCE
8.9%
UNEMPLOYMENT RATE
Lincoln Zip Codes
Lincoln Area Codes
Income in Lincoln
Income Overview in Lincoln
Per Capita Income in Lincoln is $30,075, while median incomes of families and households are $46,250 and $28,125 respectively.
| Characteristic | Number | Measure |
| Per Capita Income | 233 | $30,075 |
| Median Family Income | 51 | $46,250 |
| Mean Family Income | 51 | $62,631 |
| Median Household Income | 145 | $28,125 |
| Mean Household Income | 145 | $47,198 |
| Income Deficit | 51 | $0 |
| Wage / Income Gap (%) | 233 | 33.33% |
| Wage / Income Gap ($) | 233 | 66.67¢ per $1 |
| Gini / Inequality Index | 233 | 0.59 |
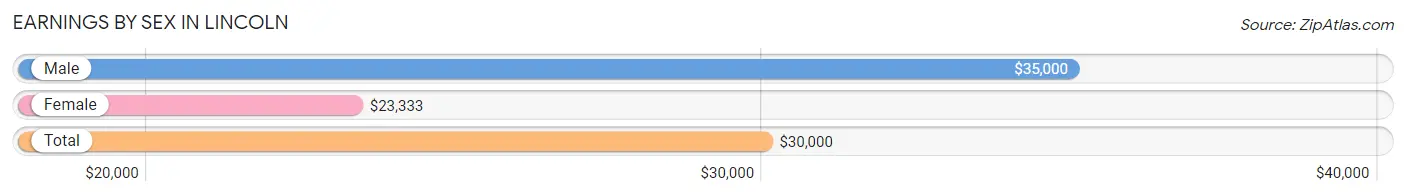
Earnings by Sex in Lincoln
Average Earnings in Lincoln are $30,000, $35,000 for men and $23,333 for women, a difference of 33.3%.
| Sex | Number | Average Earnings |
| Male | 46 (45.1%) | $35,000 |
| Female | 56 (54.9%) | $23,333 |
| Total | 102 (100.0%) | $30,000 |
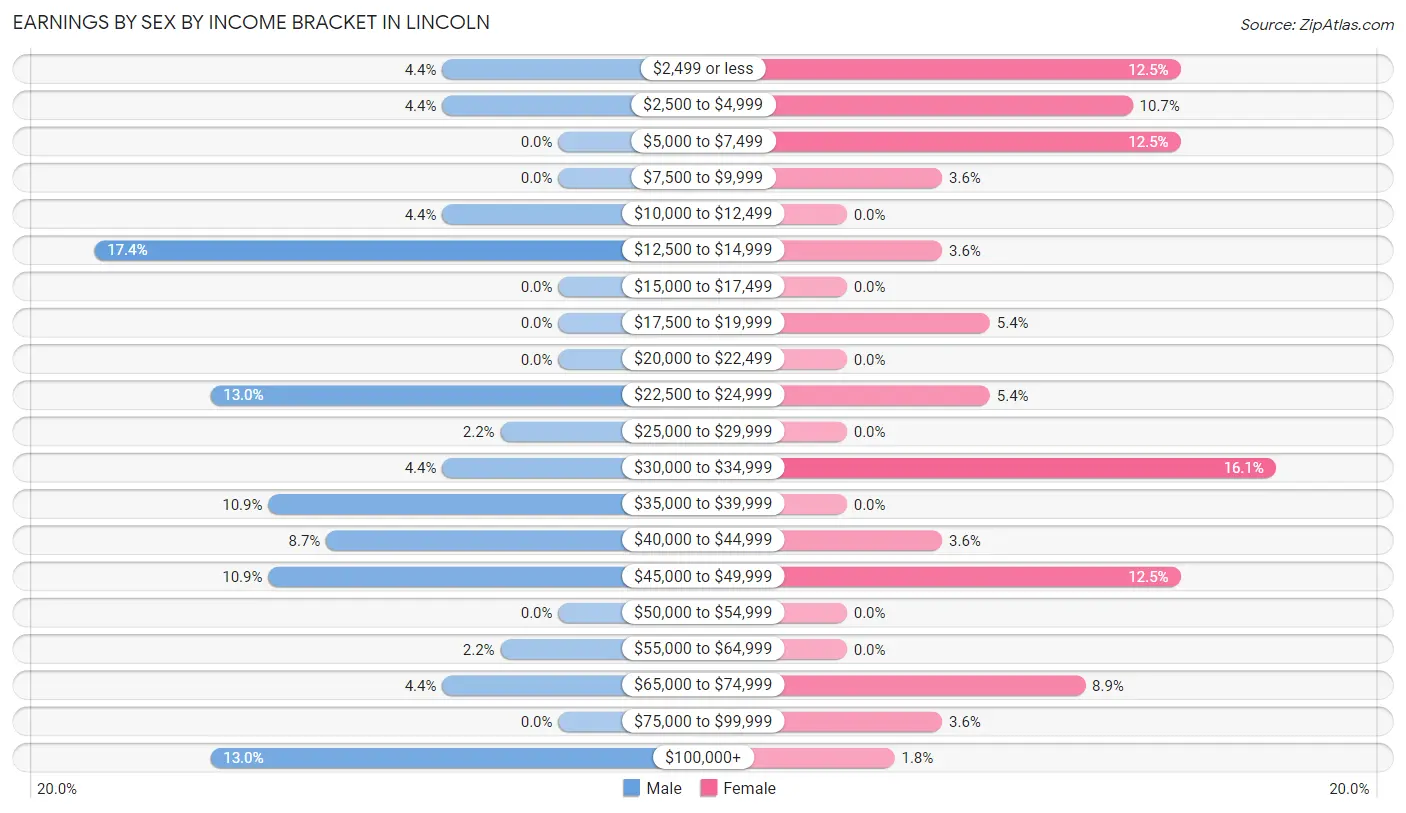
Earnings by Sex by Income Bracket in Lincoln
The most common earnings brackets in Lincoln are $12,500 to $14,999 for men (8 | 17.4%) and $30,000 to $34,999 for women (9 | 16.1%).
| Income | Male | Female |
| $2,499 or less | 2 (4.3%) | 7 (12.5%) |
| $2,500 to $4,999 | 2 (4.3%) | 6 (10.7%) |
| $5,000 to $7,499 | 0 (0.0%) | 7 (12.5%) |
| $7,500 to $9,999 | 0 (0.0%) | 2 (3.6%) |
| $10,000 to $12,499 | 2 (4.3%) | 0 (0.0%) |
| $12,500 to $14,999 | 8 (17.4%) | 2 (3.6%) |
| $15,000 to $17,499 | 0 (0.0%) | 0 (0.0%) |
| $17,500 to $19,999 | 0 (0.0%) | 3 (5.4%) |
| $20,000 to $22,499 | 0 (0.0%) | 0 (0.0%) |
| $22,500 to $24,999 | 6 (13.0%) | 3 (5.4%) |
| $25,000 to $29,999 | 1 (2.2%) | 0 (0.0%) |
| $30,000 to $34,999 | 2 (4.3%) | 9 (16.1%) |
| $35,000 to $39,999 | 5 (10.9%) | 0 (0.0%) |
| $40,000 to $44,999 | 4 (8.7%) | 2 (3.6%) |
| $45,000 to $49,999 | 5 (10.9%) | 7 (12.5%) |
| $50,000 to $54,999 | 0 (0.0%) | 0 (0.0%) |
| $55,000 to $64,999 | 1 (2.2%) | 0 (0.0%) |
| $65,000 to $74,999 | 2 (4.3%) | 5 (8.9%) |
| $75,000 to $99,999 | 0 (0.0%) | 2 (3.6%) |
| $100,000+ | 6 (13.0%) | 1 (1.8%) |
| Total | 46 (100.0%) | 56 (100.0%) |
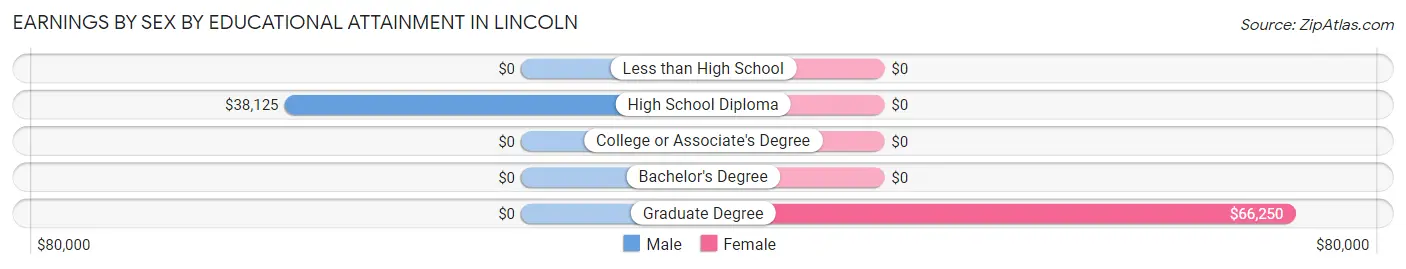
Earnings by Sex by Educational Attainment in Lincoln
Average earnings in Lincoln are $38,125 for men and $24,583 for women, a difference of 35.5%. Men with an educational attainment of high school diploma enjoy the highest average annual earnings of $38,125, while those with high school diploma education earn the least with $38,125. Women with an educational attainment of graduate degree earn the most with the average annual earnings of $66,250, while those with graduate degree education have the smallest earnings of $66,250.
| Educational Attainment | Male Income | Female Income |
| Less than High School | - | - |
| High School Diploma | $38,125 | $0 |
| College or Associate's Degree | - | - |
| Bachelor's Degree | - | - |
| Graduate Degree | - | - |
| Total | $38,125 | $24,583 |
Family Income in Lincoln
Family Income Brackets in Lincoln
According to the Lincoln family income data, there are 11 families falling into the $35,000 to $49,999 income range, which is the most common income bracket and makes up 21.6% of all families. Conversely, the $150,000 to $199,999 income bracket is the least frequent group with only 1 families (2.0%) belonging to this category.
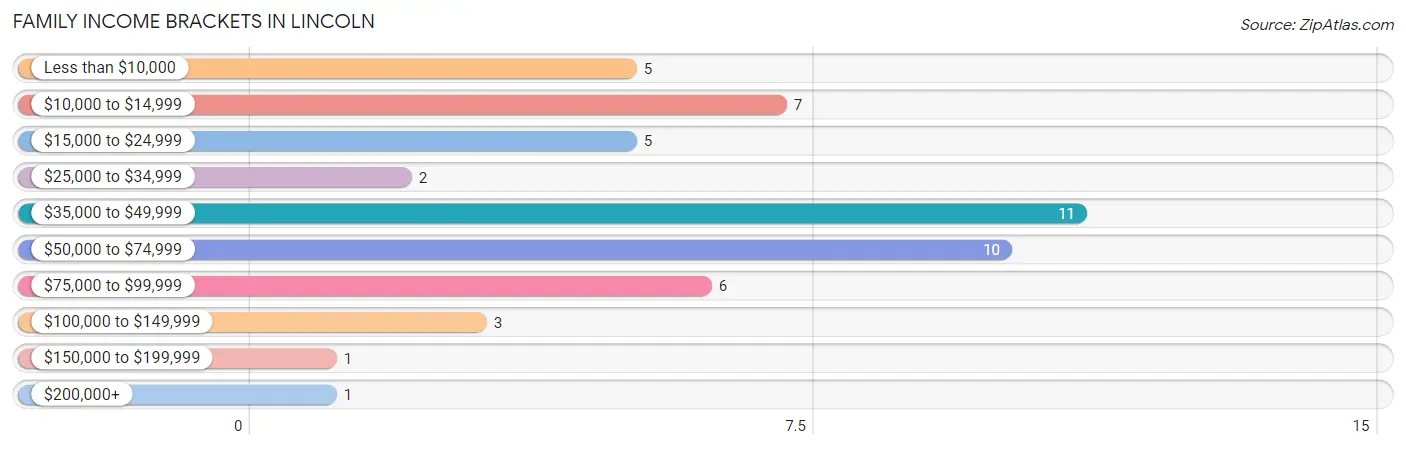
| Income Bracket | # Families | % Families |
| Less than $10,000 | 5 | 9.8% |
| $10,000 to $14,999 | 7 | 13.7% |
| $15,000 to $24,999 | 5 | 9.8% |
| $25,000 to $34,999 | 2 | 3.9% |
| $35,000 to $49,999 | 11 | 21.6% |
| $50,000 to $74,999 | 10 | 19.6% |
| $75,000 to $99,999 | 6 | 11.8% |
| $100,000 to $149,999 | 3 | 5.9% |
| $150,000 to $199,999 | 1 | 2.0% |
| $200,000+ | 1 | 2.0% |
Family Income by Famaliy Size in Lincoln
2-person families (39 | 76.5%) account for the highest median family income in Lincoln with $48,125 per family, while 2-person families (39 | 76.5%) have the highest median income of $24,062 per family member.
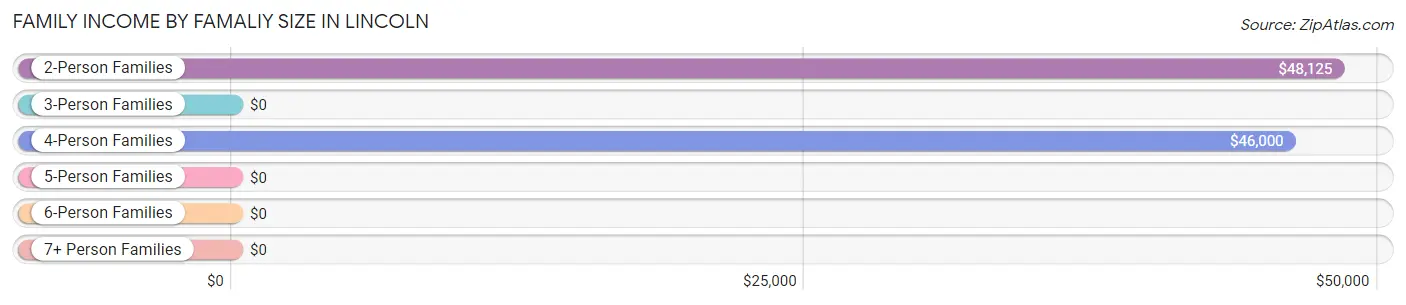
| Income Bracket | # Families | Median Income |
| 2-Person Families | 39 (76.5%) | $48,125 |
| 3-Person Families | 4 (7.8%) | $0 |
| 4-Person Families | 8 (15.7%) | $46,000 |
| 5-Person Families | 0 (0.0%) | $0 |
| 6-Person Families | 0 (0.0%) | $0 |
| 7+ Person Families | 0 (0.0%) | $0 |
| Total | 51 (100.0%) | $46,250 |
Family Income by Number of Earners in Lincoln
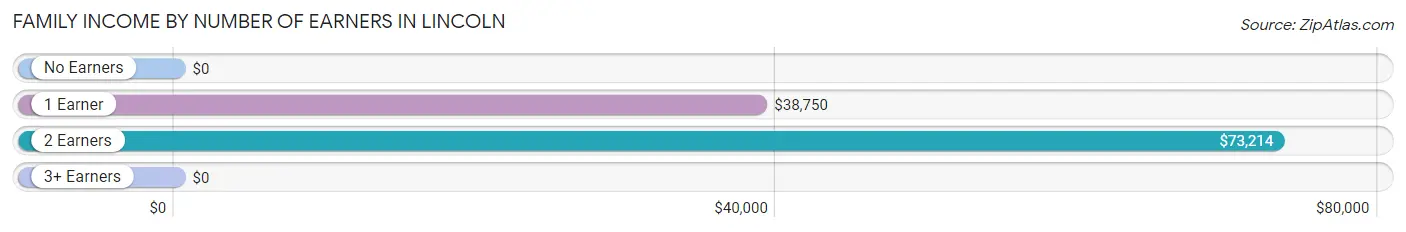
| Number of Earners | # Families | Median Income |
| No Earners | 15 (29.4%) | $0 |
| 1 Earner | 17 (33.3%) | $38,750 |
| 2 Earners | 18 (35.3%) | $73,214 |
| 3+ Earners | 1 (2.0%) | $0 |
| Total | 51 (100.0%) | $46,250 |
Household Income in Lincoln
Household Income Brackets in Lincoln
With 27 households falling in the category, the $10,000 to $14,999 income range is the most frequent in Lincoln, accounting for 18.6% of all households. In contrast, only 2 households (1.4%) fall into the $100,000 to $149,999 income bracket, making it the least populous group.
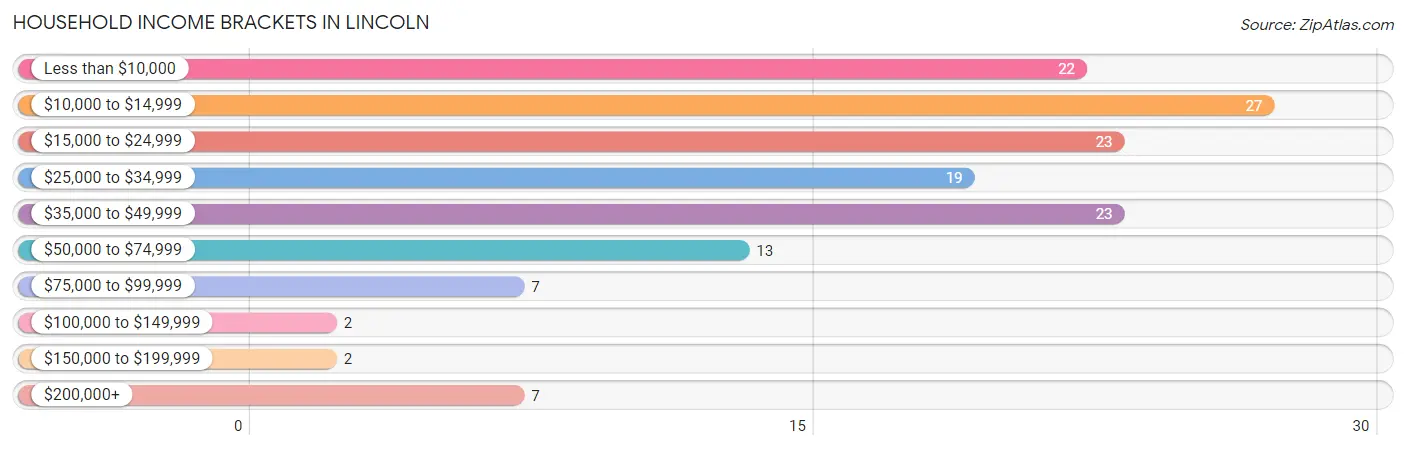
| Income Bracket | # Households | % Households |
| Less than $10,000 | 22 | 15.2% |
| $10,000 to $14,999 | 27 | 18.6% |
| $15,000 to $24,999 | 23 | 15.9% |
| $25,000 to $34,999 | 19 | 13.1% |
| $35,000 to $49,999 | 23 | 15.9% |
| $50,000 to $74,999 | 13 | 9.0% |
| $75,000 to $99,999 | 7 | 4.8% |
| $100,000 to $149,999 | 2 | 1.4% |
| $150,000 to $199,999 | 2 | 1.4% |
| $200,000+ | 7 | 4.8% |
Household Income by Householder Age in Lincoln
The median household income in Lincoln is $28,125, with the highest median household income of $45,208 found in the 25 to 44 years age bracket for the primary householder. A total of 21 households (14.5%) fall into this category. Meanwhile, the 15 to 24 years age bracket for the primary householder has the lowest median household income of $0, with 1 households (0.7%) in this group.
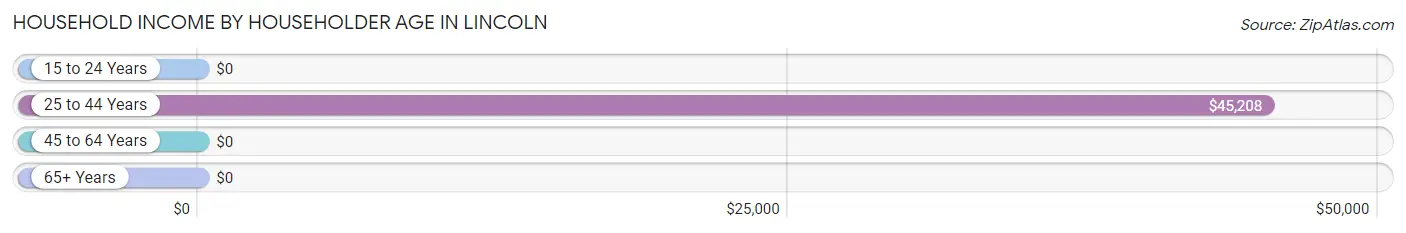
| Income Bracket | # Households | Median Income |
| 15 to 24 Years | 1 (0.7%) | $0 |
| 25 to 44 Years | 21 (14.5%) | $45,208 |
| 45 to 64 Years | 56 (38.6%) | $0 |
| 65+ Years | 67 (46.2%) | $0 |
| Total | 145 (100.0%) | $28,125 |
Poverty in Lincoln
Income Below Poverty by Sex and Age in Lincoln
With 28.7% poverty level for males and 33.1% for females among the residents of Lincoln, 35 to 44 year old males and 16 and 17 year old females are the most vulnerable to poverty, with 6 males (75.0%) and 7 females (100.0%) in their respective age groups living below the poverty level.
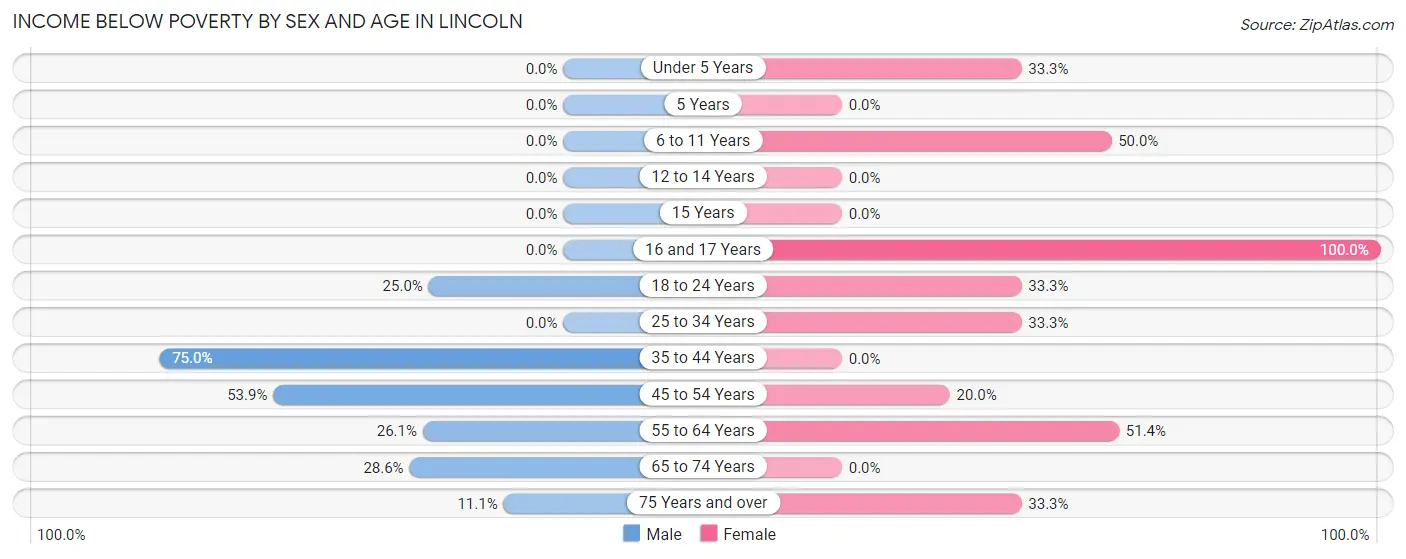
| Age Bracket | Male | Female |
| Under 5 Years | 0 (0.0%) | 1 (33.3%) |
| 5 Years | 0 (0.0%) | 0 (0.0%) |
| 6 to 11 Years | 0 (0.0%) | 4 (50.0%) |
| 12 to 14 Years | 0 (0.0%) | 0 (0.0%) |
| 15 Years | 0 (0.0%) | 0 (0.0%) |
| 16 and 17 Years | 0 (0.0%) | 7 (100.0%) |
| 18 to 24 Years | 1 (25.0%) | 1 (33.3%) |
| 25 to 34 Years | 0 (0.0%) | 4 (33.3%) |
| 35 to 44 Years | 6 (75.0%) | 0 (0.0%) |
| 45 to 54 Years | 7 (53.8%) | 2 (20.0%) |
| 55 to 64 Years | 6 (26.1%) | 18 (51.4%) |
| 65 to 74 Years | 6 (28.6%) | 0 (0.0%) |
| 75 Years and over | 1 (11.1%) | 9 (33.3%) |
| Total | 27 (28.7%) | 46 (33.1%) |
Income Above Poverty by Sex and Age in Lincoln
According to the poverty statistics in Lincoln, males aged under 5 years and females aged 12 to 14 years are the age groups that are most secure financially, with 100.0% of males and 100.0% of females in these age groups living above the poverty line.
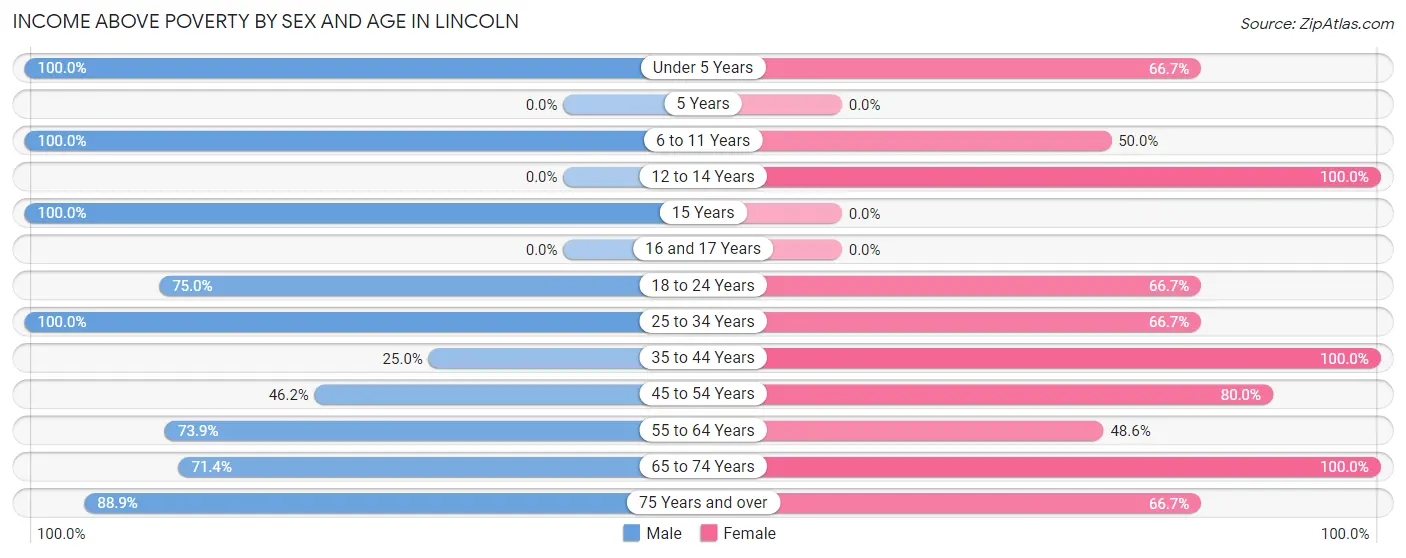
| Age Bracket | Male | Female |
| Under 5 Years | 4 (100.0%) | 2 (66.7%) |
| 5 Years | 0 (0.0%) | 0 (0.0%) |
| 6 to 11 Years | 1 (100.0%) | 4 (50.0%) |
| 12 to 14 Years | 0 (0.0%) | 2 (100.0%) |
| 15 Years | 2 (100.0%) | 0 (0.0%) |
| 16 and 17 Years | 0 (0.0%) | 0 (0.0%) |
| 18 to 24 Years | 3 (75.0%) | 2 (66.7%) |
| 25 to 34 Years | 9 (100.0%) | 8 (66.7%) |
| 35 to 44 Years | 2 (25.0%) | 9 (100.0%) |
| 45 to 54 Years | 6 (46.2%) | 8 (80.0%) |
| 55 to 64 Years | 17 (73.9%) | 17 (48.6%) |
| 65 to 74 Years | 15 (71.4%) | 23 (100.0%) |
| 75 Years and over | 8 (88.9%) | 18 (66.7%) |
| Total | 67 (71.3%) | 93 (66.9%) |
Income Below Poverty Among Married-Couple Families in Lincoln
The poverty statistics for married-couple families in Lincoln show that 9.4% or 3 of the total 32 families live below the poverty line. Families with no children have the highest poverty rate of 12.5%, comprising of 3 families. On the other hand, families with 1 or 2 children have the lowest poverty rate of 0.0%, which includes 0 families.
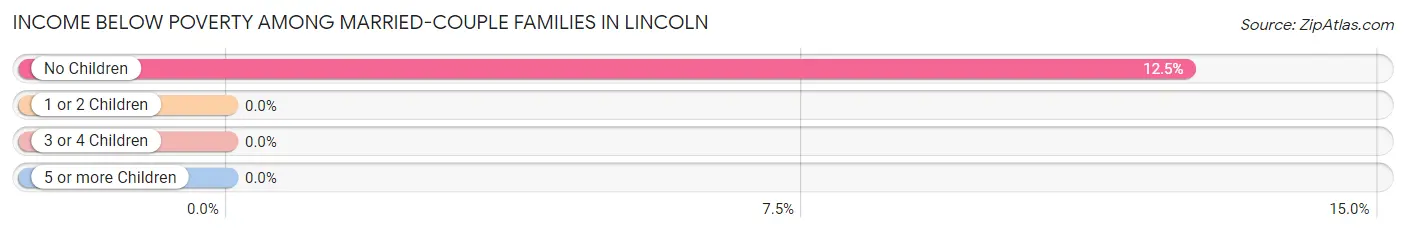
| Children | Above Poverty | Below Poverty |
| No Children | 21 (87.5%) | 3 (12.5%) |
| 1 or 2 Children | 8 (100.0%) | 0 (0.0%) |
| 3 or 4 Children | 0 (0.0%) | 0 (0.0%) |
| 5 or more Children | 0 (0.0%) | 0 (0.0%) |
| Total | 29 (90.6%) | 3 (9.4%) |
Income Below Poverty Among Single-Parent Households in Lincoln
According to the poverty data in Lincoln, 30.0% or 3 single-father households and 66.7% or 6 single-mother households are living below the poverty line. Among single-father households, those with 1 or 2 children have the highest poverty rate, with 3 households (37.5%) experiencing poverty. Likewise, among single-mother households, those with 1 or 2 children have the highest poverty rate, with 6 households (85.7%) falling below the poverty line.
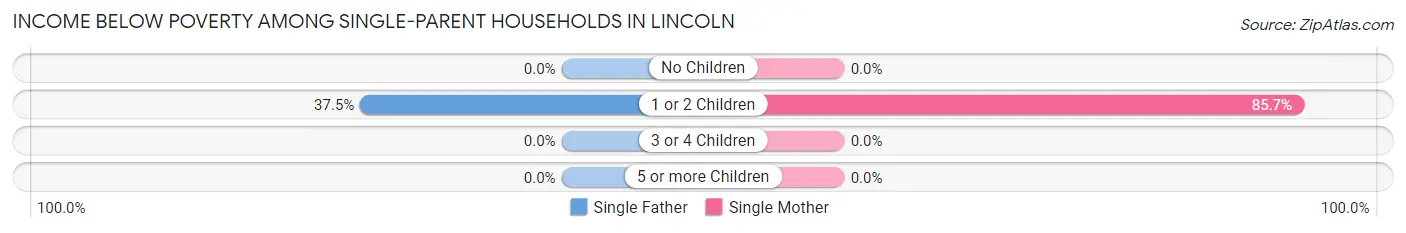
| Children | Single Father | Single Mother |
| No Children | 0 (0.0%) | 0 (0.0%) |
| 1 or 2 Children | 3 (37.5%) | 6 (85.7%) |
| 3 or 4 Children | 0 (0.0%) | 0 (0.0%) |
| 5 or more Children | 0 (0.0%) | 0 (0.0%) |
| Total | 3 (30.0%) | 6 (66.7%) |
Income Below Poverty Among Married-Couple vs Single-Parent Households in Lincoln
The poverty data for Lincoln shows that 3 of the married-couple family households (9.4%) and 9 of the single-parent households (47.4%) are living below the poverty level. Within the married-couple family households, those with no children have the highest poverty rate, with 3 households (12.5%) falling below the poverty line. Among the single-parent households, those with 1 or 2 children have the highest poverty rate, with 9 household (60.0%) living below poverty.
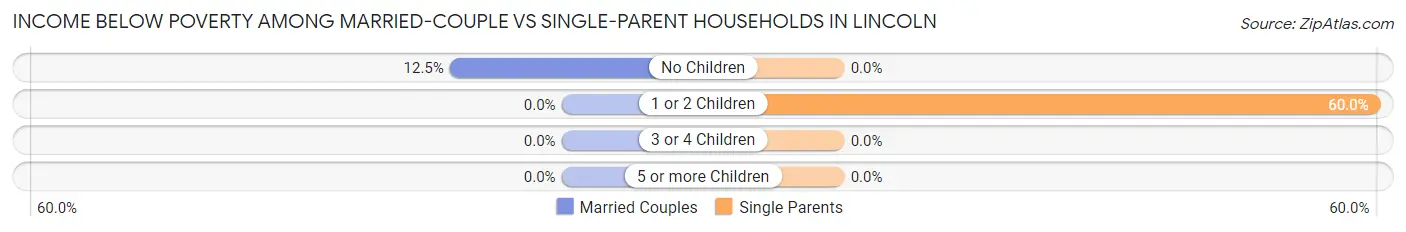
| Children | Married-Couple Families | Single-Parent Households |
| No Children | 3 (12.5%) | 0 (0.0%) |
| 1 or 2 Children | 0 (0.0%) | 9 (60.0%) |
| 3 or 4 Children | 0 (0.0%) | 0 (0.0%) |
| 5 or more Children | 0 (0.0%) | 0 (0.0%) |
| Total | 3 (9.4%) | 9 (47.4%) |
Race in Lincoln
The most populous races in Lincoln are White / Caucasian (218 | 93.6%), Two or more Races (11 | 4.7%), and Native / Alaskan (4 | 1.7%).
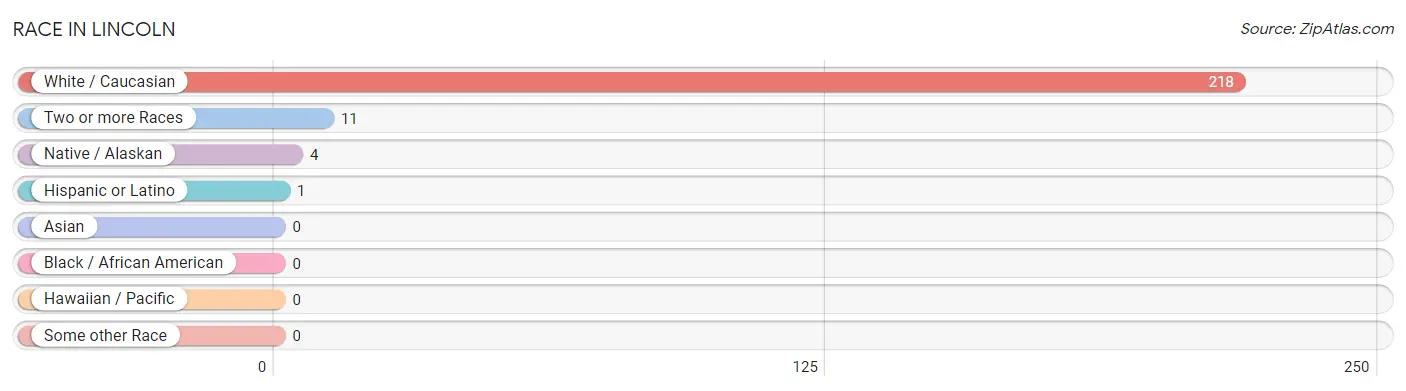
| Race | # Population | % Population |
| Asian | 0 | 0.0% |
| Black / African American | 0 | 0.0% |
| Hawaiian / Pacific | 0 | 0.0% |
| Hispanic or Latino | 1 | 0.4% |
| Native / Alaskan | 4 | 1.7% |
| White / Caucasian | 218 | 93.6% |
| Two or more Races | 11 | 4.7% |
| Some other Race | 0 | 0.0% |
| Total | 233 | 100.0% |
Ancestry in Lincoln
The most populous ancestries reported in Lincoln are German (54 | 23.2%), American (39 | 16.7%), English (30 | 12.9%), Polish (23 | 9.9%), and Irish (18 | 7.7%), together accounting for 70.4% of all Lincoln residents.
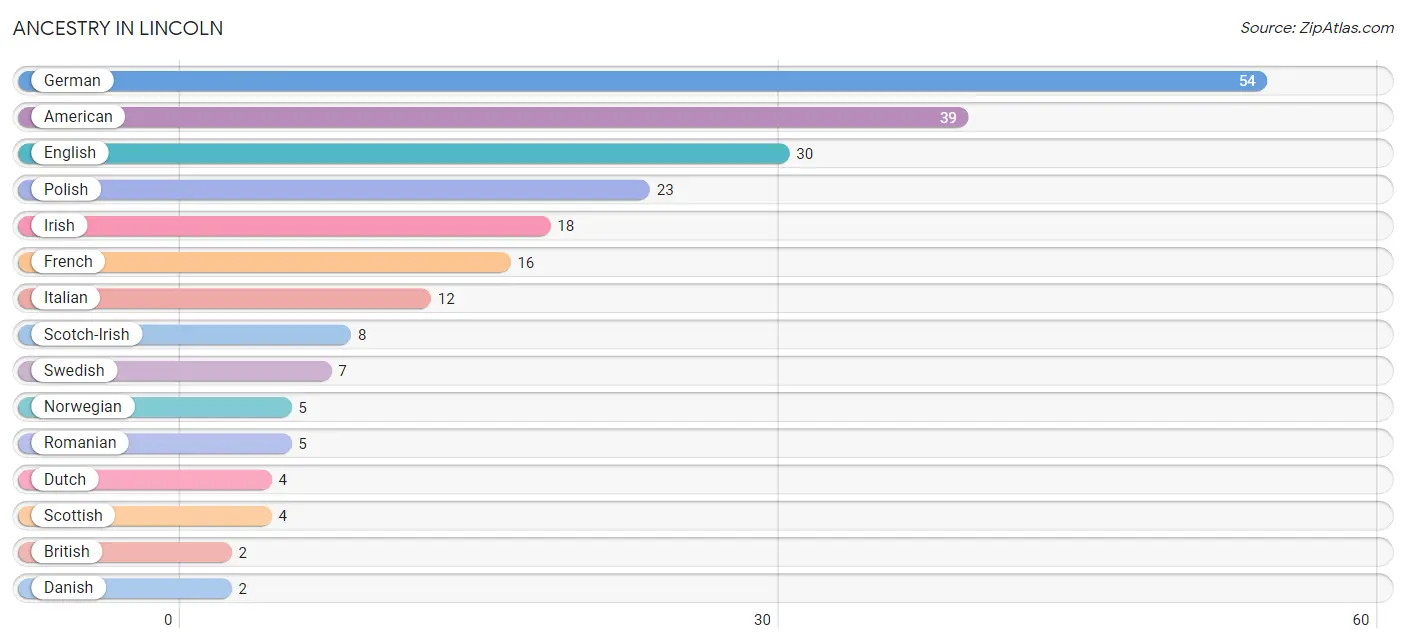
| Ancestry | # Population | % Population |
| American | 39 | 16.7% |
| British | 2 | 0.9% |
| Danish | 2 | 0.9% |
| Dutch | 4 | 1.7% |
| English | 30 | 12.9% |
| European | 1 | 0.4% |
| French | 16 | 6.9% |
| French Canadian | 2 | 0.9% |
| German | 54 | 23.2% |
| Irish | 18 | 7.7% |
| Italian | 12 | 5.1% |
| Mexican | 1 | 0.4% |
| Norwegian | 5 | 2.1% |
| Polish | 23 | 9.9% |
| Romanian | 5 | 2.1% |
| Scotch-Irish | 8 | 3.4% |
| Scottish | 4 | 1.7% |
| Slovak | 1 | 0.4% |
| Swedish | 7 | 3.0% | View All 19 Rows |
Immigrants in Lincoln

| Immigration Origin | # Population | % Population | View All 0 Rows |
Sex and Age in Lincoln
Sex and Age in Lincoln
The most populous age groups in Lincoln are 65 to 69 Years (16 | 17.0%) for men and 55 to 59 Years (21 | 15.1%) for women.
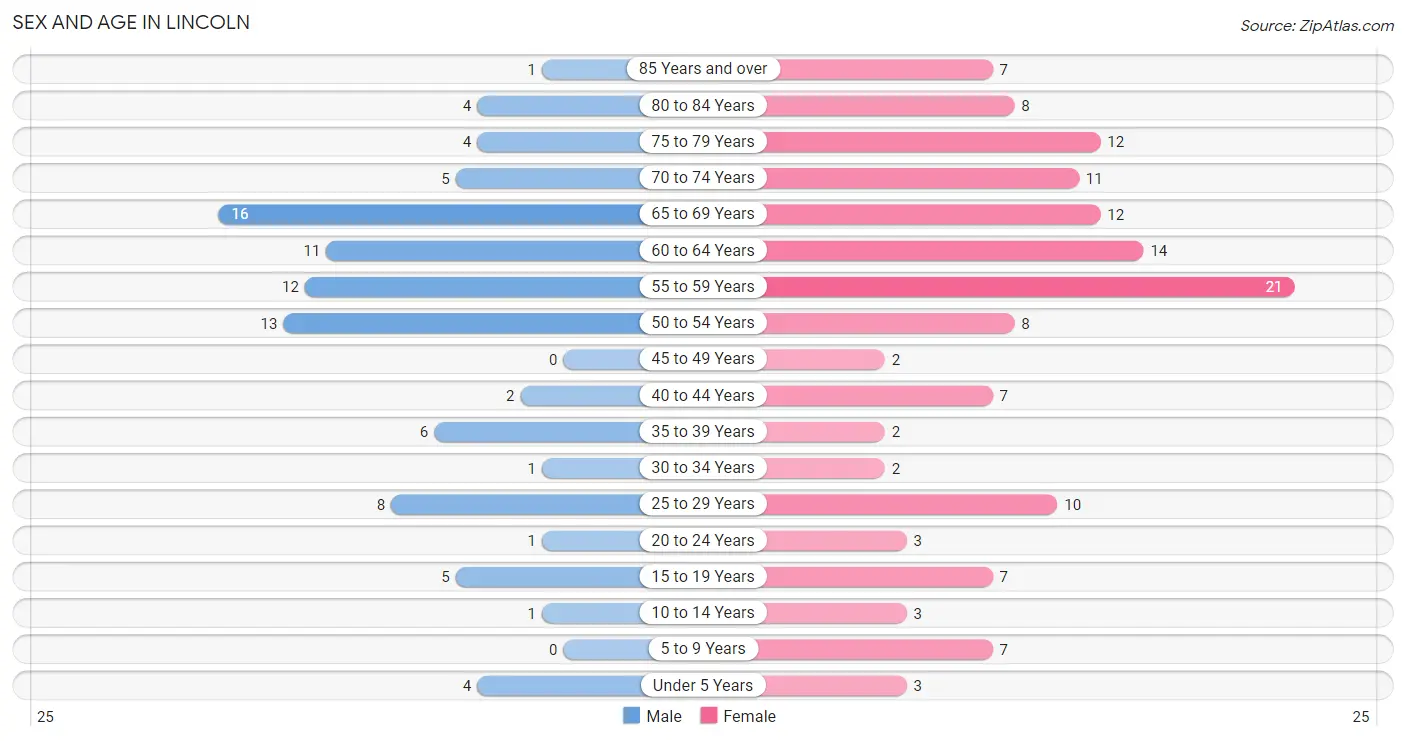
| Age Bracket | Male | Female |
| Under 5 Years | 4 (4.3%) | 3 (2.2%) |
| 5 to 9 Years | 0 (0.0%) | 7 (5.0%) |
| 10 to 14 Years | 1 (1.1%) | 3 (2.2%) |
| 15 to 19 Years | 5 (5.3%) | 7 (5.0%) |
| 20 to 24 Years | 1 (1.1%) | 3 (2.2%) |
| 25 to 29 Years | 8 (8.5%) | 10 (7.2%) |
| 30 to 34 Years | 1 (1.1%) | 2 (1.4%) |
| 35 to 39 Years | 6 (6.4%) | 2 (1.4%) |
| 40 to 44 Years | 2 (2.1%) | 7 (5.0%) |
| 45 to 49 Years | 0 (0.0%) | 2 (1.4%) |
| 50 to 54 Years | 13 (13.8%) | 8 (5.8%) |
| 55 to 59 Years | 12 (12.8%) | 21 (15.1%) |
| 60 to 64 Years | 11 (11.7%) | 14 (10.1%) |
| 65 to 69 Years | 16 (17.0%) | 12 (8.6%) |
| 70 to 74 Years | 5 (5.3%) | 11 (7.9%) |
| 75 to 79 Years | 4 (4.3%) | 12 (8.6%) |
| 80 to 84 Years | 4 (4.3%) | 8 (5.8%) |
| 85 Years and over | 1 (1.1%) | 7 (5.0%) |
| Total | 94 (100.0%) | 139 (100.0%) |
Families and Households in Lincoln
Median Family Size in Lincoln
The median family size in Lincoln is 2.41 persons per family, with single female/mother families (9 | 17.6%) accounting for the largest median family size of 2.89 persons per family. On the other hand, single male/father families (10 | 19.6%) represent the smallest median family size with 1.90 persons per family.
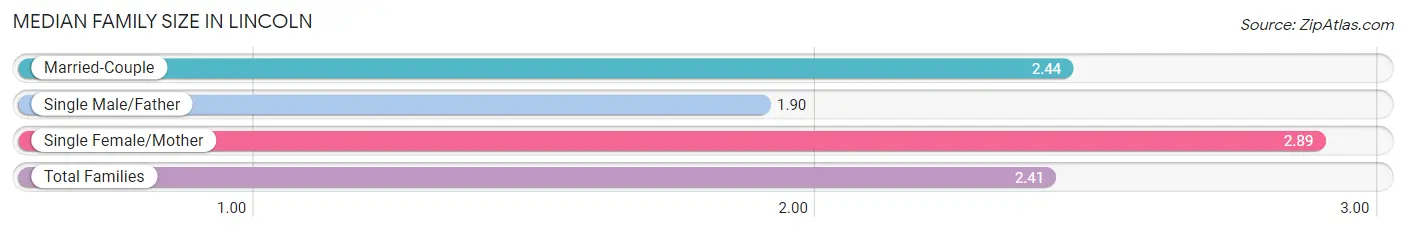
| Family Type | # Families | Family Size |
| Married-Couple | 32 (62.7%) | 2.44 |
| Single Male/Father | 10 (19.6%) | 1.90 |
| Single Female/Mother | 9 (17.6%) | 2.89 |
| Total Families | 51 (100.0%) | 2.41 |
Median Household Size in Lincoln
The median household size in Lincoln is 1.61 persons per household, with single female/mother households (9 | 6.2%) accounting for the largest median household size of 3.56 persons per household. non-family households (94 | 64.8%) represent the smallest median household size with 1.05 persons per household.
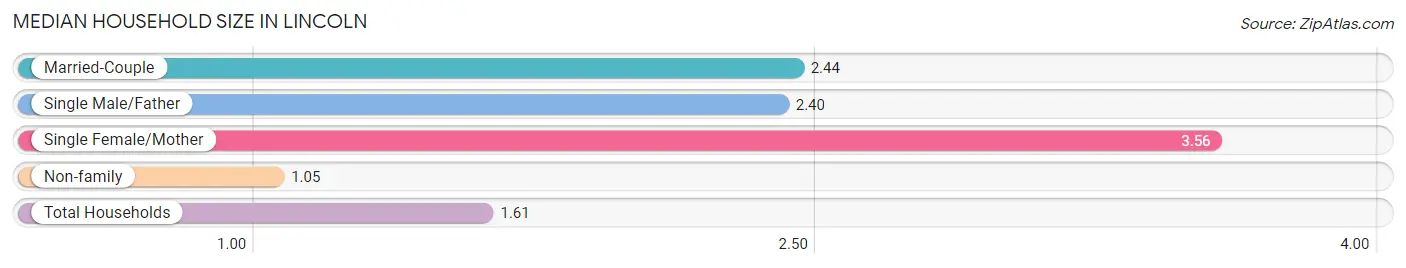
| Household Type | # Households | Household Size |
| Married-Couple | 32 (22.1%) | 2.44 |
| Single Male/Father | 10 (6.9%) | 2.40 |
| Single Female/Mother | 9 (6.2%) | 3.56 |
| Non-family | 94 (64.8%) | 1.05 |
| Total Households | 145 (100.0%) | 1.61 |
Household Size by Marriage Status in Lincoln
Out of a total of 145 households in Lincoln, 51 (35.2%) are family households, while 94 (64.8%) are nonfamily households. The most numerous type of family households are 2-person households, comprising 28, and the most common type of nonfamily households are 1-person households, comprising 88.
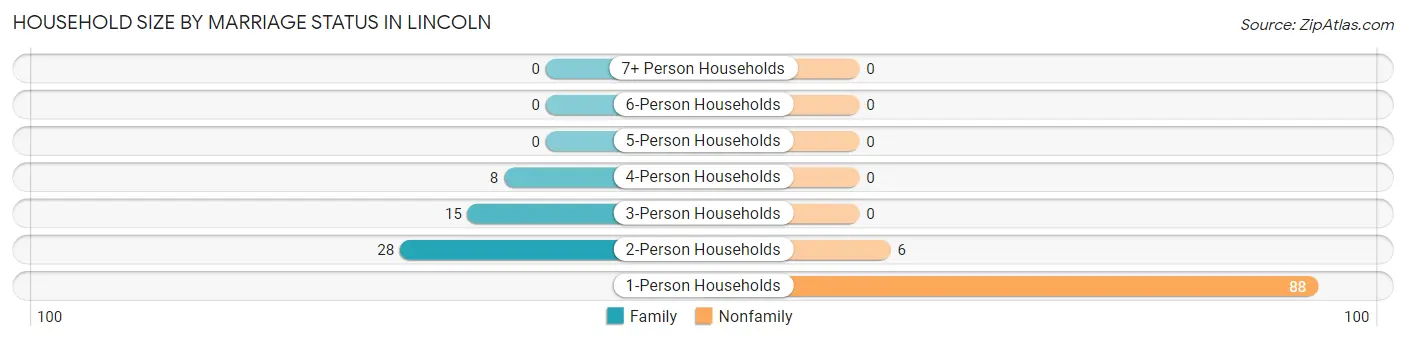
| Household Size | Family Households | Nonfamily Households |
| 1-Person Households | - | 88 (60.7%) |
| 2-Person Households | 28 (19.3%) | 6 (4.1%) |
| 3-Person Households | 15 (10.3%) | 0 (0.0%) |
| 4-Person Households | 8 (5.5%) | 0 (0.0%) |
| 5-Person Households | 0 (0.0%) | 0 (0.0%) |
| 6-Person Households | 0 (0.0%) | 0 (0.0%) |
| 7+ Person Households | 0 (0.0%) | 0 (0.0%) |
| Total | 51 (35.2%) | 94 (64.8%) |
Female Fertility in Lincoln
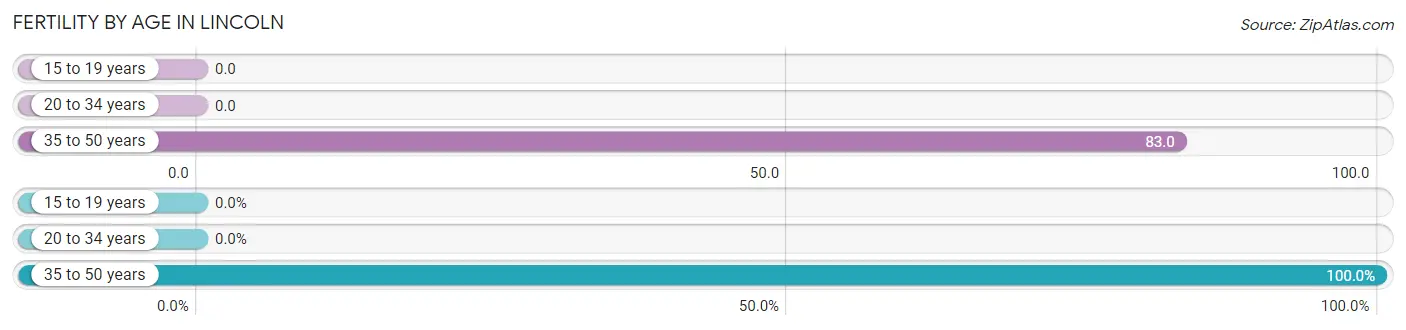
Fertility by Age in Lincoln
Average fertility rate in Lincoln is 29.0 births per 1,000 women. Women in the age bracket of 35 to 50 years have the highest fertility rate with 83.0 births per 1,000 women. Women in the age bracket of 35 to 50 years acount for 100.0% of all women with births.
| Age Bracket | Women with Births | Births / 1,000 Women |
| 15 to 19 years | 0 (0.0%) | 0.0 |
| 20 to 34 years | 0 (0.0%) | 0.0 |
| 35 to 50 years | 1 (100.0%) | 83.0 |
| Total | 1 (100.0%) | 29.0 |
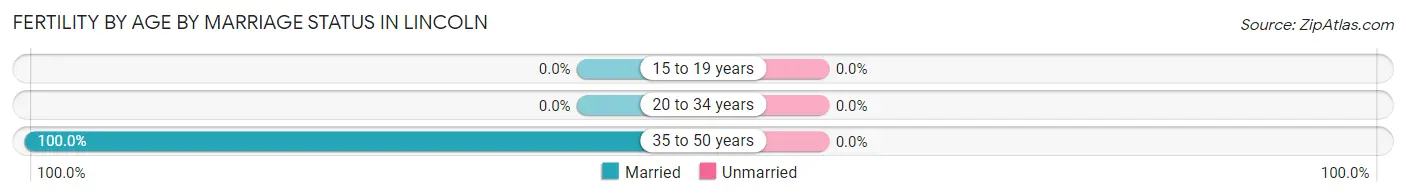
Fertility by Age by Marriage Status in Lincoln
| Age Bracket | Married | Unmarried |
| 15 to 19 years | 0 (0.0%) | 0 (0.0%) |
| 20 to 34 years | 0 (0.0%) | 0 (0.0%) |
| 35 to 50 years | 1 (100.0%) | 0 (0.0%) |
| Total | 1 (100.0%) | 0 (0.0%) |
Fertility by Education in Lincoln
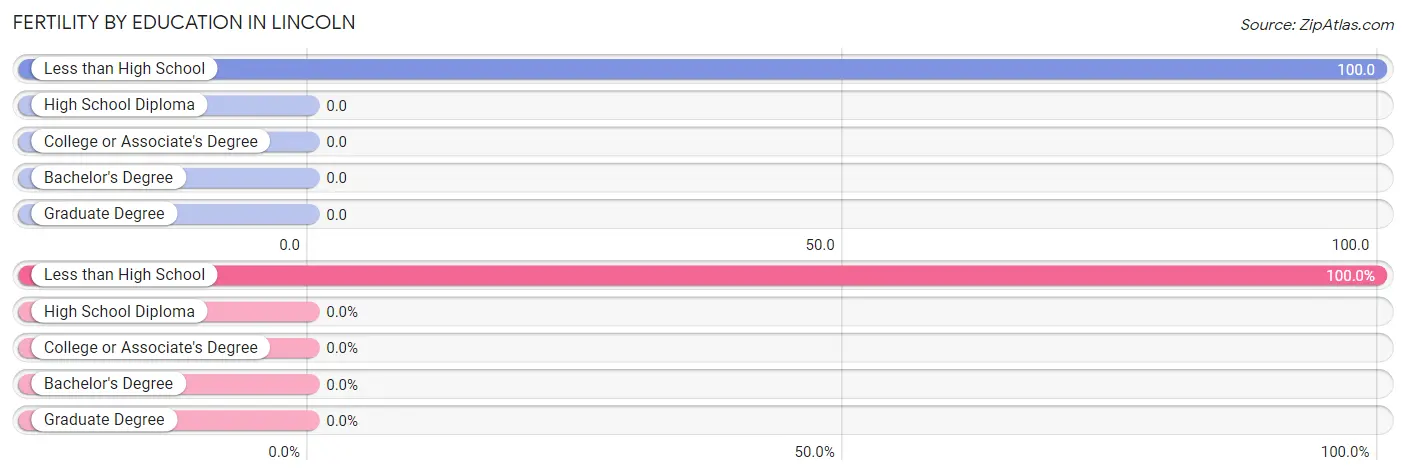
| Educational Attainment | Women with Births | Births / 1,000 Women |
| Less than High School | 1 (100.0%) | 100.0 |
| High School Diploma | 0 (0.0%) | 0.0 |
| College or Associate's Degree | 0 (0.0%) | 0.0 |
| Bachelor's Degree | 0 (0.0%) | 0.0 |
| Graduate Degree | 0 (0.0%) | 0.0 |
| Total | 1 (100.0%) | 29.0 |
Fertility by Education by Marriage Status in Lincoln

| Educational Attainment | Married | Unmarried |
| Less than High School | 1 (100.0%) | 0 (0.0%) |
| High School Diploma | 0 (0.0%) | 0 (0.0%) |
| College or Associate's Degree | 0 (0.0%) | 0 (0.0%) |
| Bachelor's Degree | 0 (0.0%) | 0 (0.0%) |
| Graduate Degree | 0 (0.0%) | 0 (0.0%) |
| Total | 1 (100.0%) | 0 (0.0%) |
Employment Characteristics in Lincoln
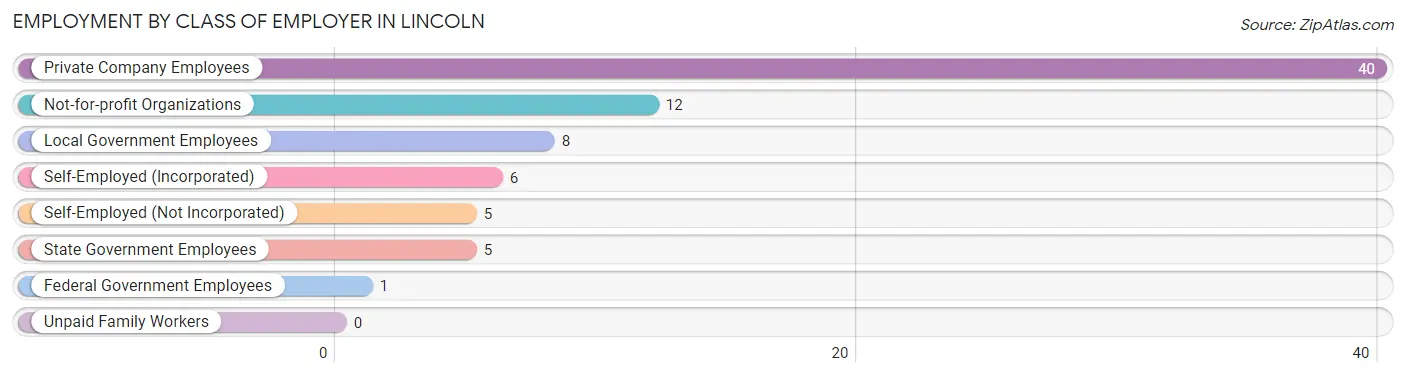
Employment by Class of Employer in Lincoln
Among the 77 employed individuals in Lincoln, private company employees (40 | 51.9%), not-for-profit organizations (12 | 15.6%), and local government employees (8 | 10.4%) make up the most common classes of employment.
| Employer Class | # Employees | % Employees |
| Private Company Employees | 40 | 51.9% |
| Self-Employed (Incorporated) | 6 | 7.8% |
| Self-Employed (Not Incorporated) | 5 | 6.5% |
| Not-for-profit Organizations | 12 | 15.6% |
| Local Government Employees | 8 | 10.4% |
| State Government Employees | 5 | 6.5% |
| Federal Government Employees | 1 | 1.3% |
| Unpaid Family Workers | 0 | 0.0% |
| Total | 77 | 100.0% |
Employment Status by Age in Lincoln
According to the labor force statistics for Lincoln, out of the total population over 16 years of age (213), 42.3% or 90 individuals are in the labor force, with 8.9% or 8 of them unemployed. The age group with the highest labor force participation rate is 25 to 29 years, with 100.0% or 18 individuals in the labor force. Within the labor force, the 25 to 29 years age range has the highest percentage of unemployed individuals, with 38.9% or 7 of them being unemployed.
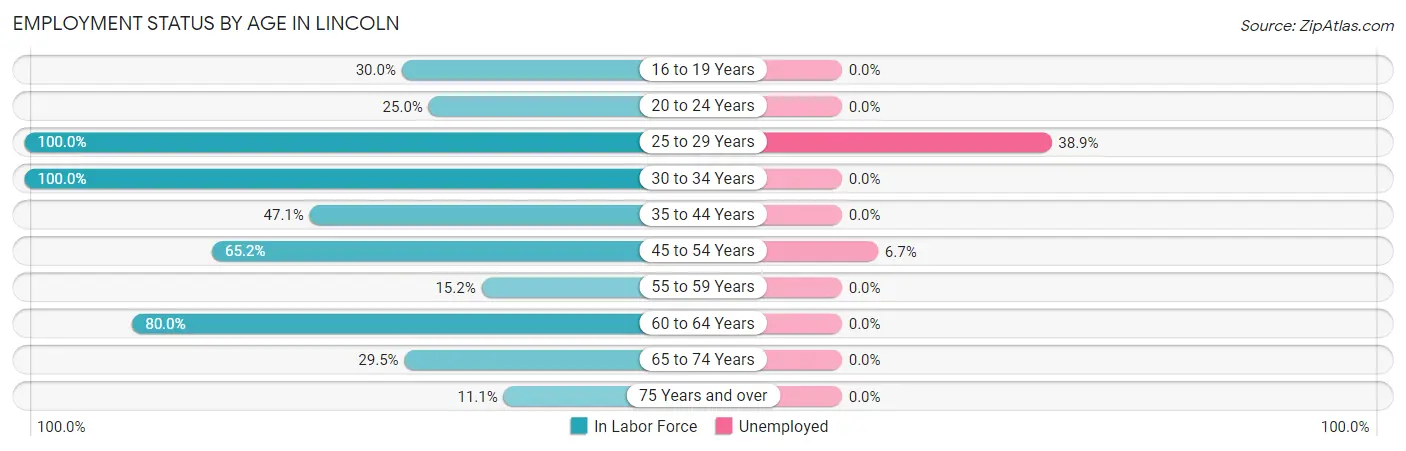
| Age Bracket | In Labor Force | Unemployed |
| 16 to 19 Years | 3 (30.0%) | 0 (0.0%) |
| 20 to 24 Years | 1 (25.0%) | 0 (0.0%) |
| 25 to 29 Years | 18 (100.0%) | 7 (38.9%) |
| 30 to 34 Years | 3 (100.0%) | 0 (0.0%) |
| 35 to 44 Years | 8 (47.1%) | 0 (0.0%) |
| 45 to 54 Years | 15 (65.2%) | 1 (6.7%) |
| 55 to 59 Years | 5 (15.2%) | 0 (0.0%) |
| 60 to 64 Years | 20 (80.0%) | 0 (0.0%) |
| 65 to 74 Years | 13 (29.5%) | 0 (0.0%) |
| 75 Years and over | 4 (11.1%) | 0 (0.0%) |
| Total | 90 (42.3%) | 8 (8.9%) |
Employment Status by Educational Attainment in Lincoln
According to labor force statistics for Lincoln, 58.0% of individuals (69) out of the total population between 25 and 64 years of age (119) are in the labor force, with 11.6% or 8 of them being unemployed. The group with the highest labor force participation rate are those with the educational attainment of less than high school, with 66.7% or 4 individuals in the labor force. Within the labor force, individuals with less than high school education have the highest percentage of unemployment, with 50.0% or 2 of them being unemployed.
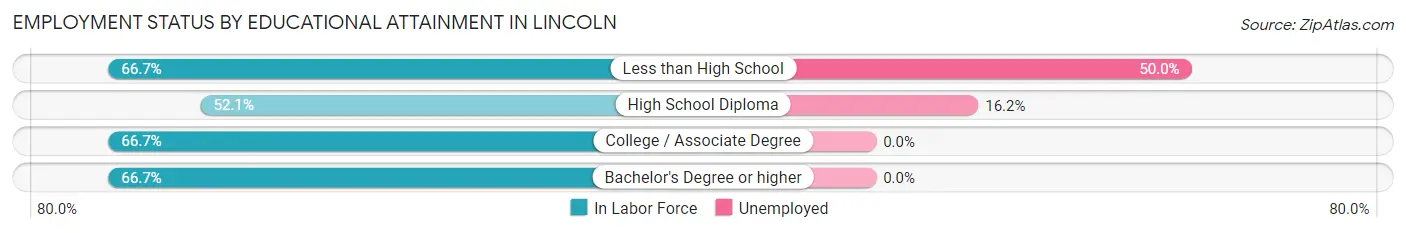
| Educational Attainment | In Labor Force | Unemployed |
| Less than High School | 4 (66.7%) | 3 (50.0%) |
| High School Diploma | 37 (52.1%) | 12 (16.2%) |
| College / Associate Degree | 18 (66.7%) | 0 (0.0%) |
| Bachelor's Degree or higher | 10 (66.7%) | 0 (0.0%) |
| Total | 69 (58.0%) | 14 (11.6%) |
Employment Occupations by Sex in Lincoln
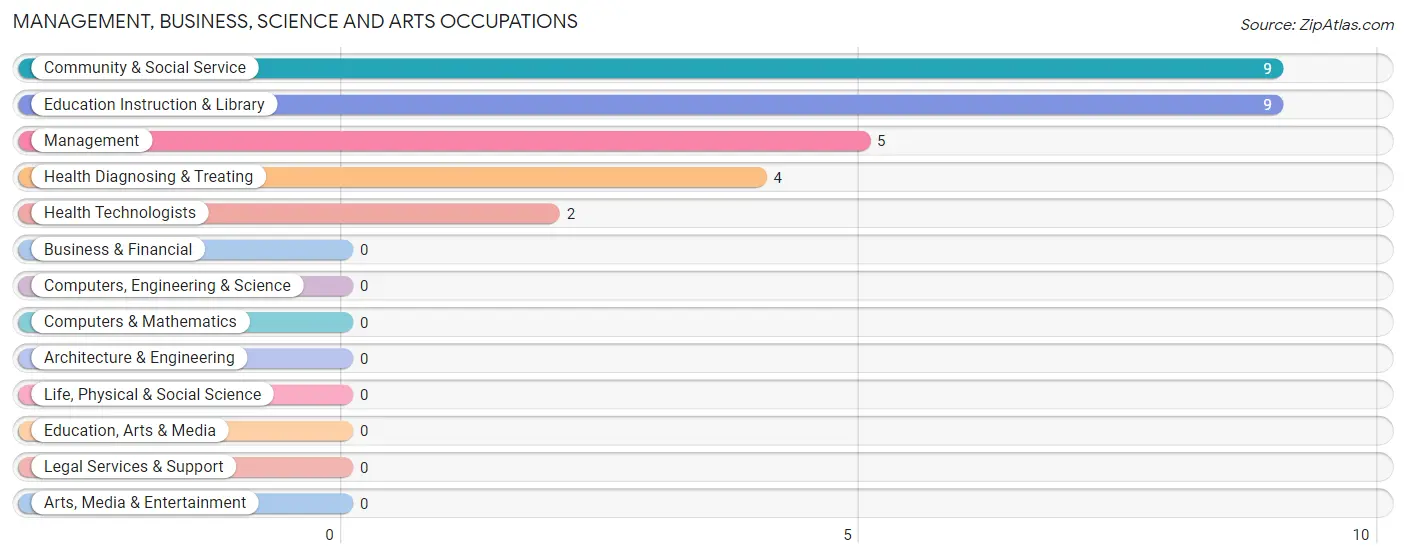
Management, Business, Science and Arts Occupations
The most common Management, Business, Science and Arts occupations in Lincoln are Community & Social Service (9 | 11.0%), Education Instruction & Library (9 | 11.0%), Management (5 | 6.1%), Health Diagnosing & Treating (4 | 4.9%), and Health Technologists (2 | 2.4%).
Management, Business, Science and Arts Occupations by Sex
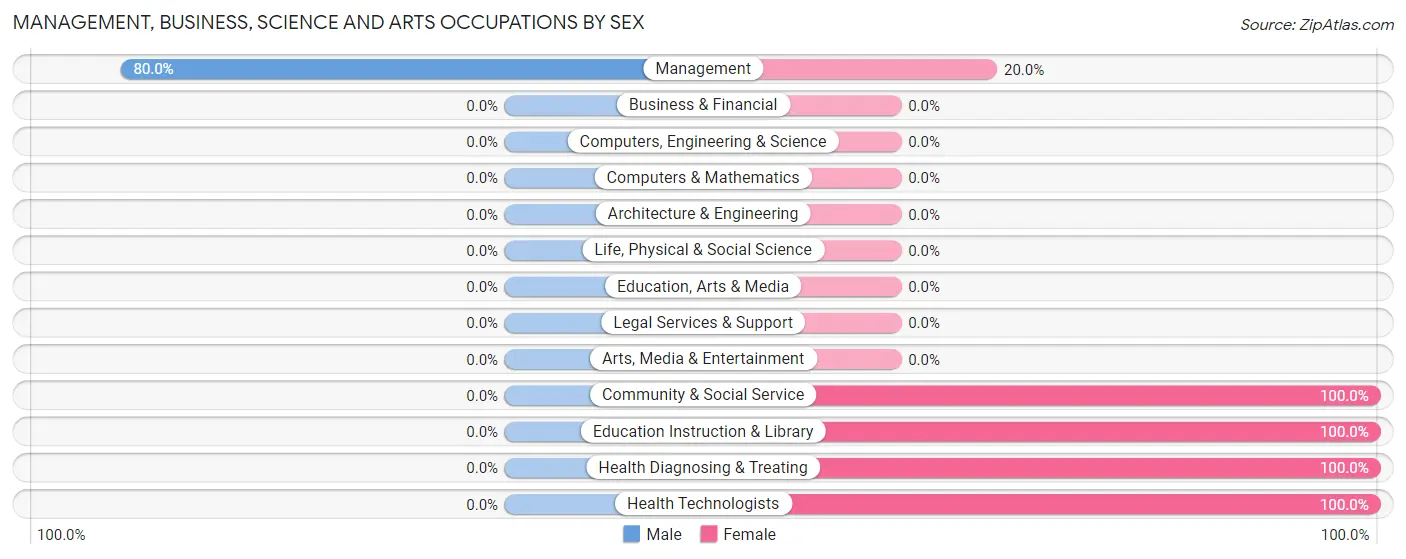
| Occupation | Male | Female |
| Management | 4 (80.0%) | 1 (20.0%) |
| Business & Financial | 0 (0.0%) | 0 (0.0%) |
| Computers, Engineering & Science | 0 (0.0%) | 0 (0.0%) |
| Computers & Mathematics | 0 (0.0%) | 0 (0.0%) |
| Architecture & Engineering | 0 (0.0%) | 0 (0.0%) |
| Life, Physical & Social Science | 0 (0.0%) | 0 (0.0%) |
| Community & Social Service | 0 (0.0%) | 9 (100.0%) |
| Education, Arts & Media | 0 (0.0%) | 0 (0.0%) |
| Legal Services & Support | 0 (0.0%) | 0 (0.0%) |
| Education Instruction & Library | 0 (0.0%) | 9 (100.0%) |
| Arts, Media & Entertainment | 0 (0.0%) | 0 (0.0%) |
| Health Diagnosing & Treating | 0 (0.0%) | 4 (100.0%) |
| Health Technologists | 0 (0.0%) | 2 (100.0%) |
| Total (Category) | 4 (22.2%) | 14 (77.8%) |
| Total (Overall) | 45 (54.9%) | 37 (45.1%) |
Services Occupations
The most common Services occupations in Lincoln are Cleaning & Maintenance (3 | 3.7%), Healthcare Support (2 | 2.4%), and Personal Care & Service (2 | 2.4%).
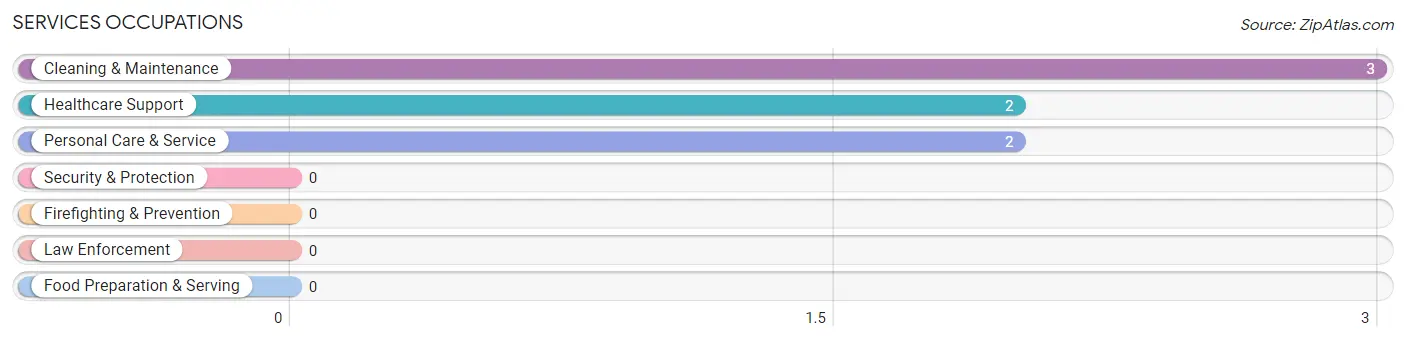
Services Occupations by Sex
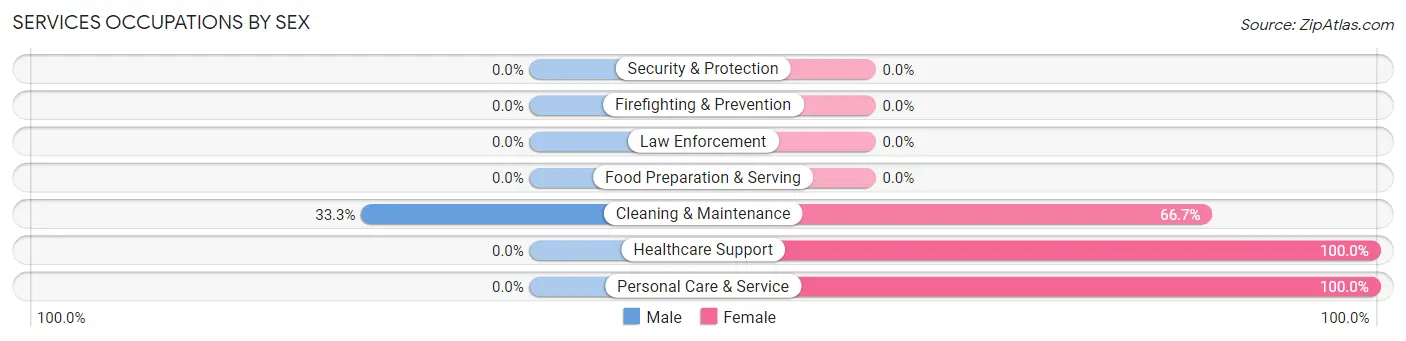
| Occupation | Male | Female |
| Healthcare Support | 0 (0.0%) | 2 (100.0%) |
| Security & Protection | 0 (0.0%) | 0 (0.0%) |
| Firefighting & Prevention | 0 (0.0%) | 0 (0.0%) |
| Law Enforcement | 0 (0.0%) | 0 (0.0%) |
| Food Preparation & Serving | 0 (0.0%) | 0 (0.0%) |
| Cleaning & Maintenance | 1 (33.3%) | 2 (66.7%) |
| Personal Care & Service | 0 (0.0%) | 2 (100.0%) |
| Total (Category) | 1 (14.3%) | 6 (85.7%) |
| Total (Overall) | 45 (54.9%) | 37 (45.1%) |
Sales and Office Occupations
The most common Sales and Office occupations in Lincoln are Office & Administration (17 | 20.7%), and Sales & Related (4 | 4.9%).
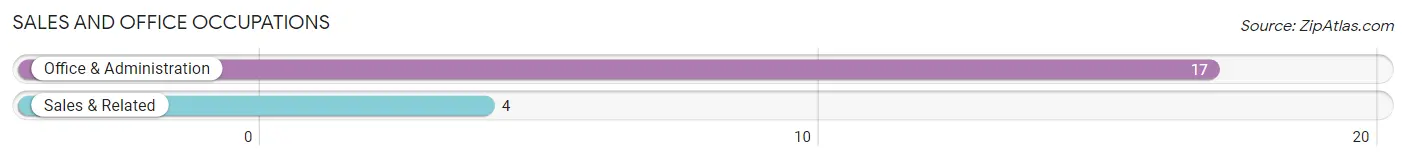
Sales and Office Occupations by Sex
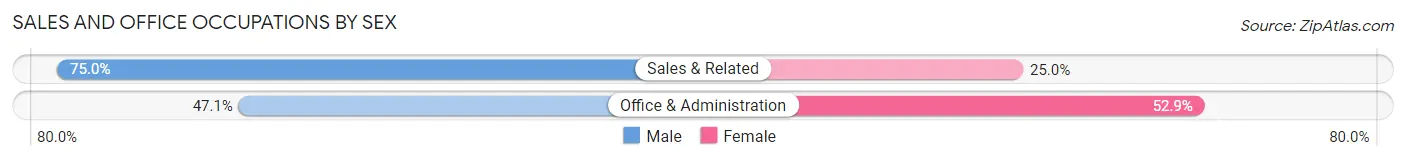
| Occupation | Male | Female |
| Sales & Related | 3 (75.0%) | 1 (25.0%) |
| Office & Administration | 8 (47.1%) | 9 (52.9%) |
| Total (Category) | 11 (52.4%) | 10 (47.6%) |
| Total (Overall) | 45 (54.9%) | 37 (45.1%) |
Natural Resources, Construction and Maintenance Occupations
The most common Natural Resources, Construction and Maintenance occupations in Lincoln are Construction & Extraction (10 | 12.2%), and Installation, Maintenance & Repair (3 | 3.7%).
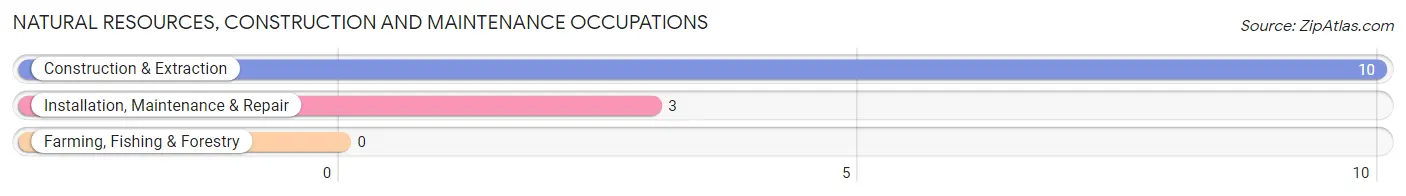
Natural Resources, Construction and Maintenance Occupations by Sex
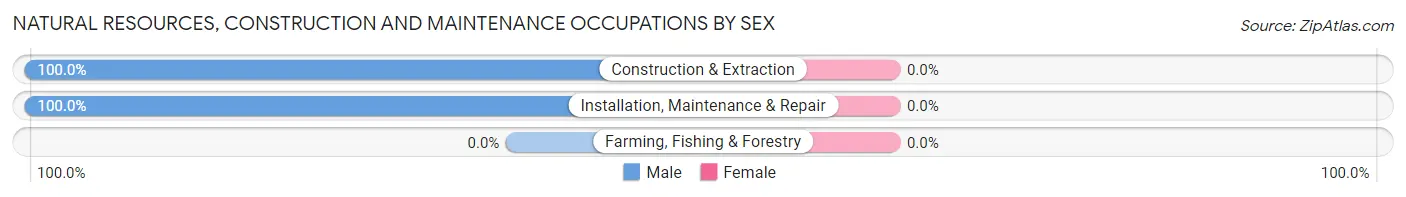
| Occupation | Male | Female |
| Farming, Fishing & Forestry | 0 (0.0%) | 0 (0.0%) |
| Construction & Extraction | 10 (100.0%) | 0 (0.0%) |
| Installation, Maintenance & Repair | 3 (100.0%) | 0 (0.0%) |
| Total (Category) | 13 (100.0%) | 0 (0.0%) |
| Total (Overall) | 45 (54.9%) | 37 (45.1%) |
Production, Transportation and Moving Occupations
The most common Production, Transportation and Moving occupations in Lincoln are Production (12 | 14.6%), Transportation (10 | 12.2%), and Material Moving (1 | 1.2%).
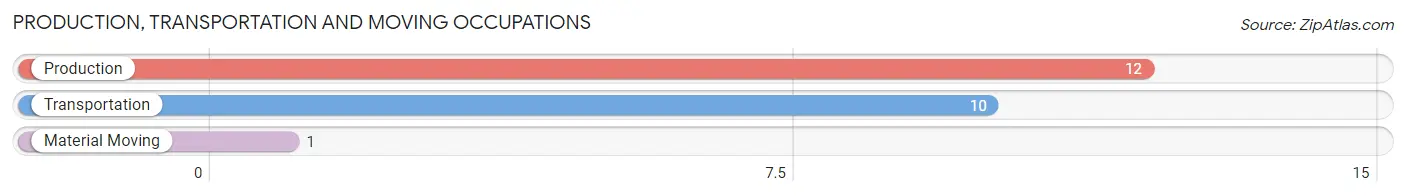
Production, Transportation and Moving Occupations by Sex
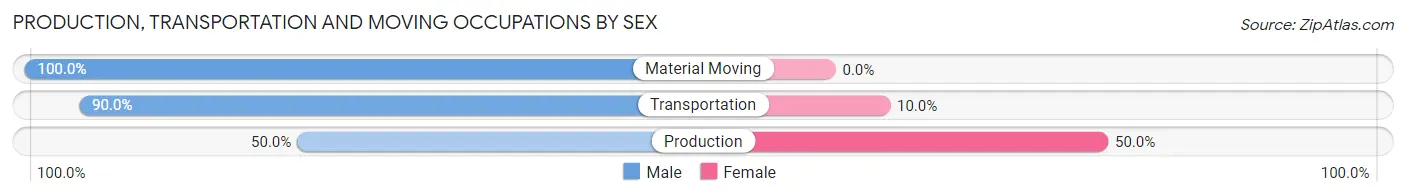
| Occupation | Male | Female |
| Production | 6 (50.0%) | 6 (50.0%) |
| Transportation | 9 (90.0%) | 1 (10.0%) |
| Material Moving | 1 (100.0%) | 0 (0.0%) |
| Total (Category) | 16 (69.6%) | 7 (30.4%) |
| Total (Overall) | 45 (54.9%) | 37 (45.1%) |
Employment Industries by Sex in Lincoln
Employment Industries in Lincoln
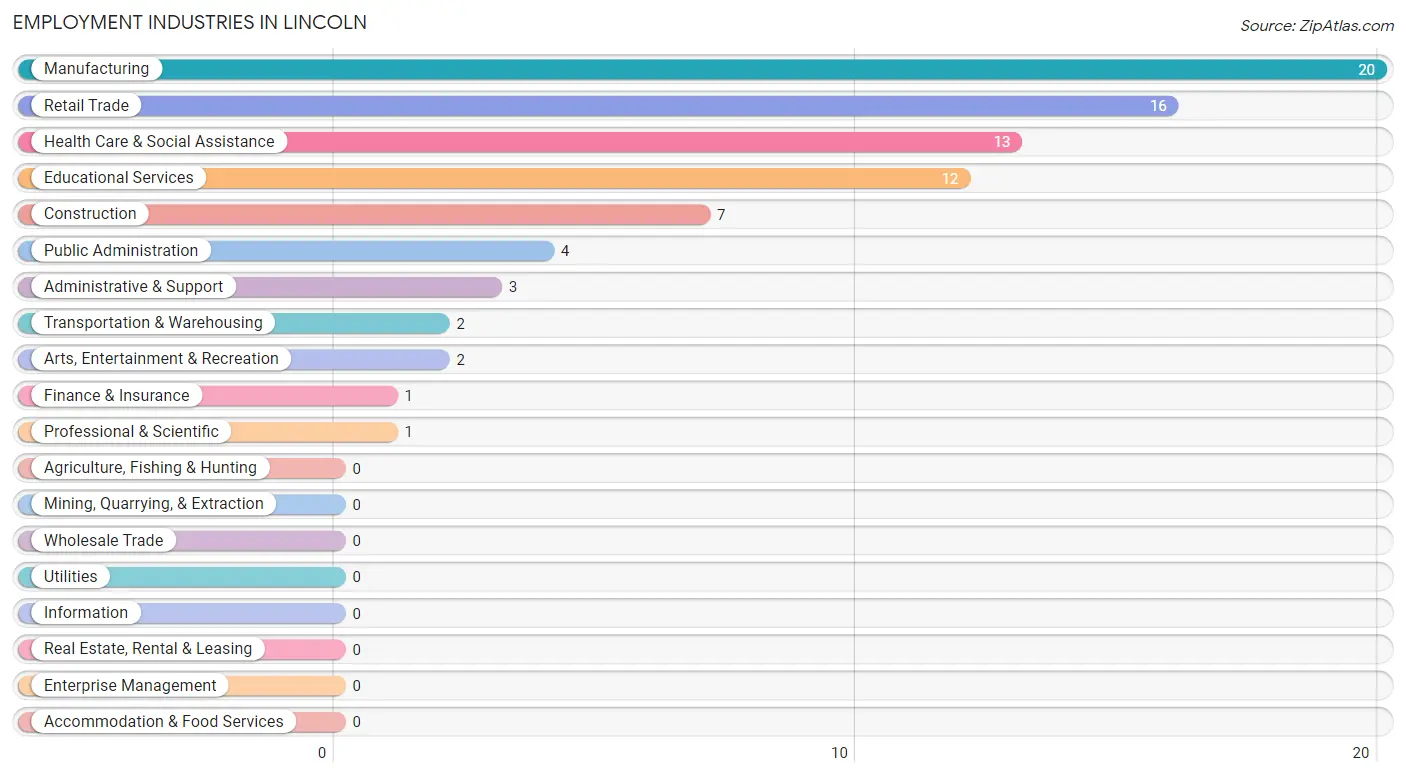
The major employment industries in Lincoln include Manufacturing (20 | 24.4%), Retail Trade (16 | 19.5%), Health Care & Social Assistance (13 | 15.9%), Educational Services (12 | 14.6%), and Construction (7 | 8.5%).
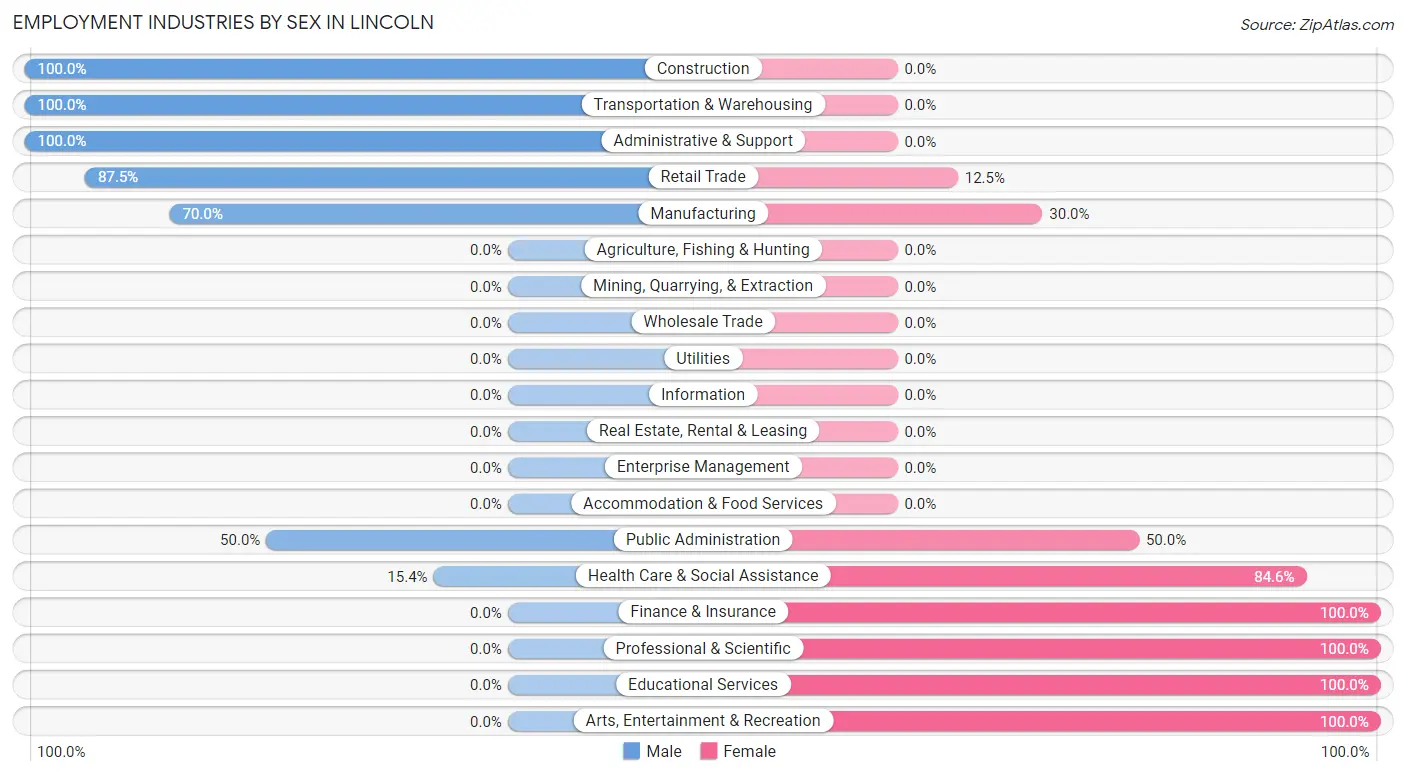
Employment Industries by Sex in Lincoln
The Lincoln industries that see more men than women are Construction (100.0%), Transportation & Warehousing (100.0%), and Administrative & Support (100.0%), whereas the industries that tend to have a higher number of women are Finance & Insurance (100.0%), Professional & Scientific (100.0%), and Educational Services (100.0%).
| Industry | Male | Female |
| Agriculture, Fishing & Hunting | 0 (0.0%) | 0 (0.0%) |
| Mining, Quarrying, & Extraction | 0 (0.0%) | 0 (0.0%) |
| Construction | 7 (100.0%) | 0 (0.0%) |
| Manufacturing | 14 (70.0%) | 6 (30.0%) |
| Wholesale Trade | 0 (0.0%) | 0 (0.0%) |
| Retail Trade | 14 (87.5%) | 2 (12.5%) |
| Transportation & Warehousing | 2 (100.0%) | 0 (0.0%) |
| Utilities | 0 (0.0%) | 0 (0.0%) |
| Information | 0 (0.0%) | 0 (0.0%) |
| Finance & Insurance | 0 (0.0%) | 1 (100.0%) |
| Real Estate, Rental & Leasing | 0 (0.0%) | 0 (0.0%) |
| Professional & Scientific | 0 (0.0%) | 1 (100.0%) |
| Enterprise Management | 0 (0.0%) | 0 (0.0%) |
| Administrative & Support | 3 (100.0%) | 0 (0.0%) |
| Educational Services | 0 (0.0%) | 12 (100.0%) |
| Health Care & Social Assistance | 2 (15.4%) | 11 (84.6%) |
| Arts, Entertainment & Recreation | 0 (0.0%) | 2 (100.0%) |
| Accommodation & Food Services | 0 (0.0%) | 0 (0.0%) |
| Public Administration | 2 (50.0%) | 2 (50.0%) |
| Total | 45 (54.9%) | 37 (45.1%) |
Education in Lincoln
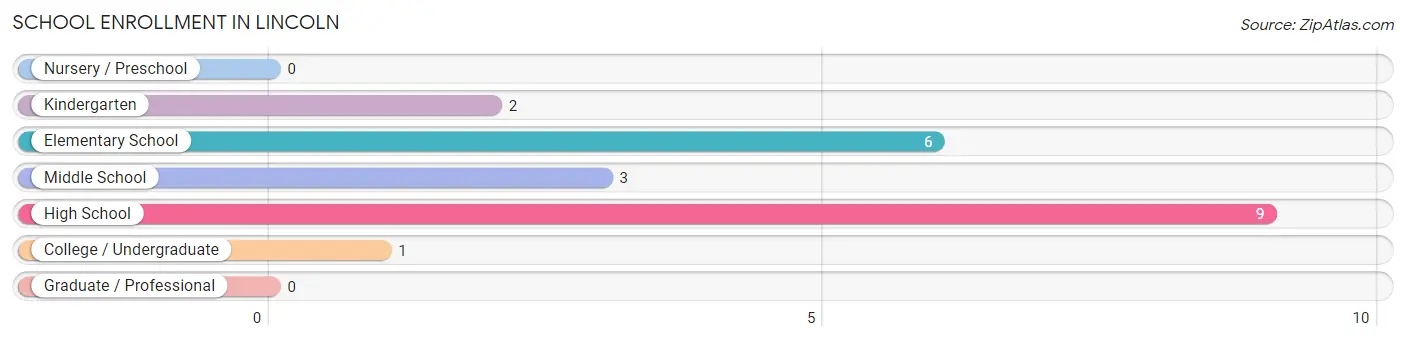
School Enrollment in Lincoln
The most common levels of schooling among the 21 students in Lincoln are high school (9 | 42.9%), elementary school (6 | 28.6%), and middle school (3 | 14.3%).
| School Level | # Students | % Students |
| Nursery / Preschool | 0 | 0.0% |
| Kindergarten | 2 | 9.5% |
| Elementary School | 6 | 28.6% |
| Middle School | 3 | 14.3% |
| High School | 9 | 42.9% |
| College / Undergraduate | 1 | 4.8% |
| Graduate / Professional | 0 | 0.0% |
| Total | 21 | 100.0% |
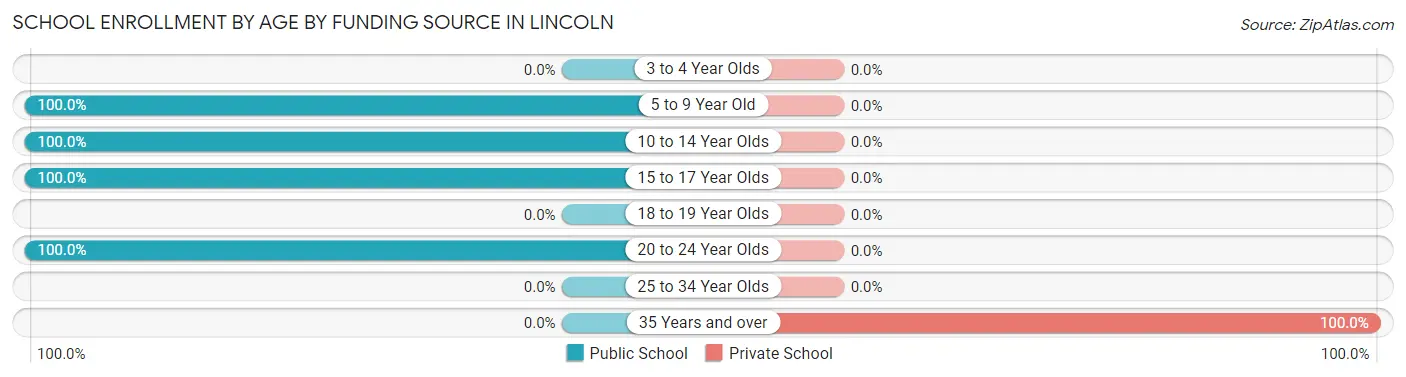
School Enrollment by Age by Funding Source in Lincoln
Out of a total of 21 students who are enrolled in schools in Lincoln, 1 (4.8%) attend a private institution, while the remaining 20 (95.2%) are enrolled in public schools. The age group of 35 years and over has the highest likelihood of being enrolled in private schools, with 1 (100.0% in the age bracket) enrolled. Conversely, the age group of 5 to 9 year old has the lowest likelihood of being enrolled in a private school, with 6 (100.0% in the age bracket) attending a public institution.
| Age Bracket | Public School | Private School |
| 3 to 4 Year Olds | 0 (0.0%) | 0 (0.0%) |
| 5 to 9 Year Old | 6 (100.0%) | 0 (0.0%) |
| 10 to 14 Year Olds | 4 (100.0%) | 0 (0.0%) |
| 15 to 17 Year Olds | 9 (100.0%) | 0 (0.0%) |
| 18 to 19 Year Olds | 0 (0.0%) | 0 (0.0%) |
| 20 to 24 Year Olds | 1 (100.0%) | 0 (0.0%) |
| 25 to 34 Year Olds | 0 (0.0%) | 0 (0.0%) |
| 35 Years and over | 0 (0.0%) | 1 (100.0%) |
| Total | 20 (95.2%) | 1 (4.8%) |
Educational Attainment by Field of Study in Lincoln
Science & technology (9 | 31.0%), education (7 | 24.1%), arts & humanities (5 | 17.2%), physical & health sciences (4 | 13.8%), and social sciences (2 | 6.9%) are the most common fields of study among 29 individuals in Lincoln who have obtained a bachelor's degree or higher.
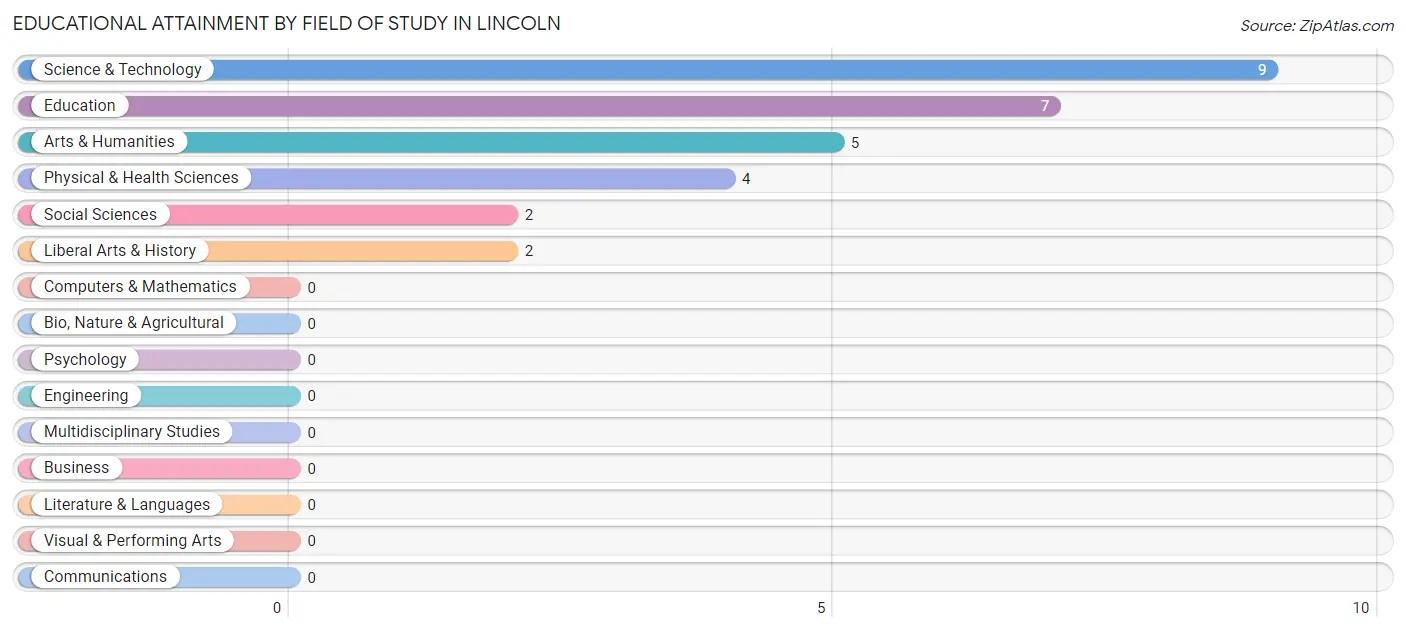
| Field of Study | # Graduates | % Graduates |
| Computers & Mathematics | 0 | 0.0% |
| Bio, Nature & Agricultural | 0 | 0.0% |
| Physical & Health Sciences | 4 | 13.8% |
| Psychology | 0 | 0.0% |
| Social Sciences | 2 | 6.9% |
| Engineering | 0 | 0.0% |
| Multidisciplinary Studies | 0 | 0.0% |
| Science & Technology | 9 | 31.0% |
| Business | 0 | 0.0% |
| Education | 7 | 24.1% |
| Literature & Languages | 0 | 0.0% |
| Liberal Arts & History | 2 | 6.9% |
| Visual & Performing Arts | 0 | 0.0% |
| Communications | 0 | 0.0% |
| Arts & Humanities | 5 | 17.2% |
| Total | 29 | 100.0% |
Transportation & Commute in Lincoln
Vehicle Availability by Sex in Lincoln
The most prevalent vehicle ownership categories in Lincoln are males with 2 vehicles (27, accounting for 67.5%) and females with 2 vehicles (17, making up 73.0%).
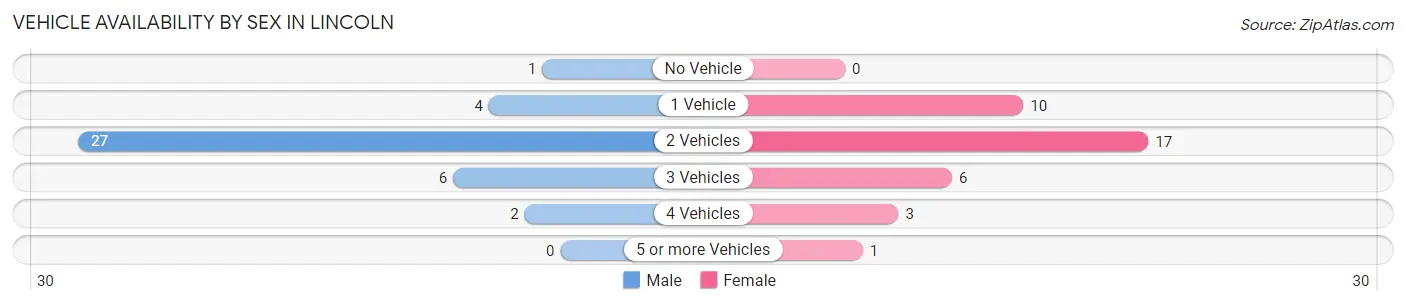
| Vehicles Available | Male | Female |
| No Vehicle | 1 (2.5%) | 0 (0.0%) |
| 1 Vehicle | 4 (10.0%) | 10 (27.0%) |
| 2 Vehicles | 27 (67.5%) | 17 (46.0%) |
| 3 Vehicles | 6 (15.0%) | 6 (16.2%) |
| 4 Vehicles | 2 (5.0%) | 3 (8.1%) |
| 5 or more Vehicles | 0 (0.0%) | 1 (2.7%) |
| Total | 40 (100.0%) | 37 (100.0%) |
Commute Time in Lincoln
The most frequently occuring commute durations in Lincoln are less than 5 minutes (30 commuters, 39.5%), 5 to 9 minutes (20 commuters, 26.3%), and 20 to 24 minutes (7 commuters, 9.2%).
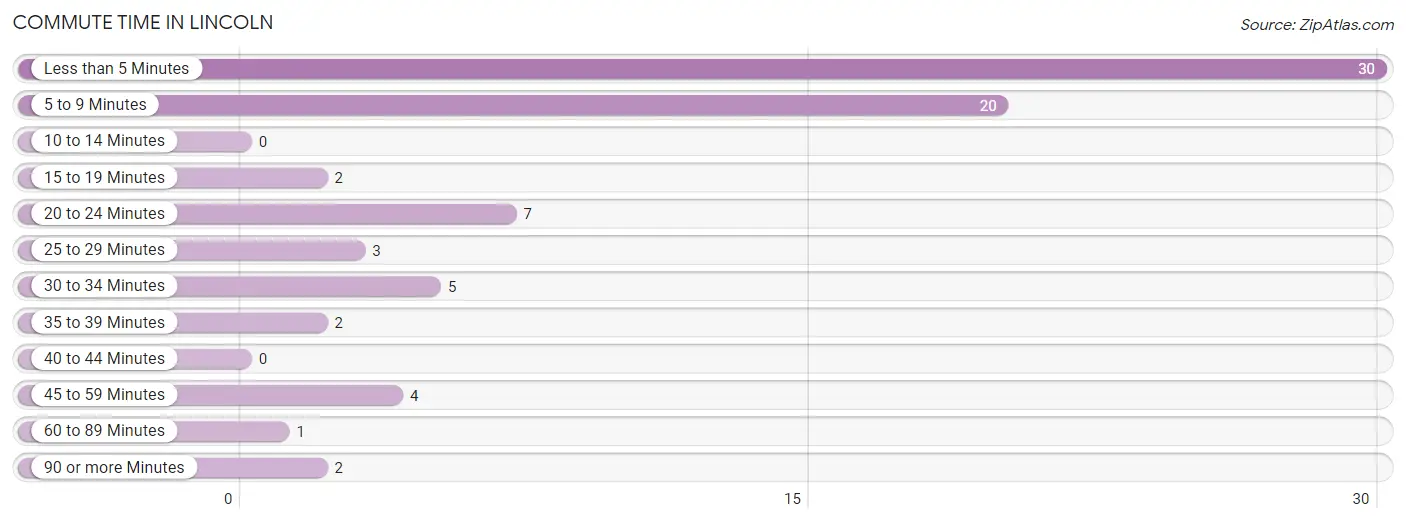
| Commute Time | # Commuters | % Commuters |
| Less than 5 Minutes | 30 | 39.5% |
| 5 to 9 Minutes | 20 | 26.3% |
| 10 to 14 Minutes | 0 | 0.0% |
| 15 to 19 Minutes | 2 | 2.6% |
| 20 to 24 Minutes | 7 | 9.2% |
| 25 to 29 Minutes | 3 | 4.0% |
| 30 to 34 Minutes | 5 | 6.6% |
| 35 to 39 Minutes | 2 | 2.6% |
| 40 to 44 Minutes | 0 | 0.0% |
| 45 to 59 Minutes | 4 | 5.3% |
| 60 to 89 Minutes | 1 | 1.3% |
| 90 or more Minutes | 2 | 2.6% |
Commute Time by Sex in Lincoln
The most common commute times in Lincoln are less than 5 minutes (14 commuters, 35.0%) for males and less than 5 minutes (16 commuters, 44.4%) for females.
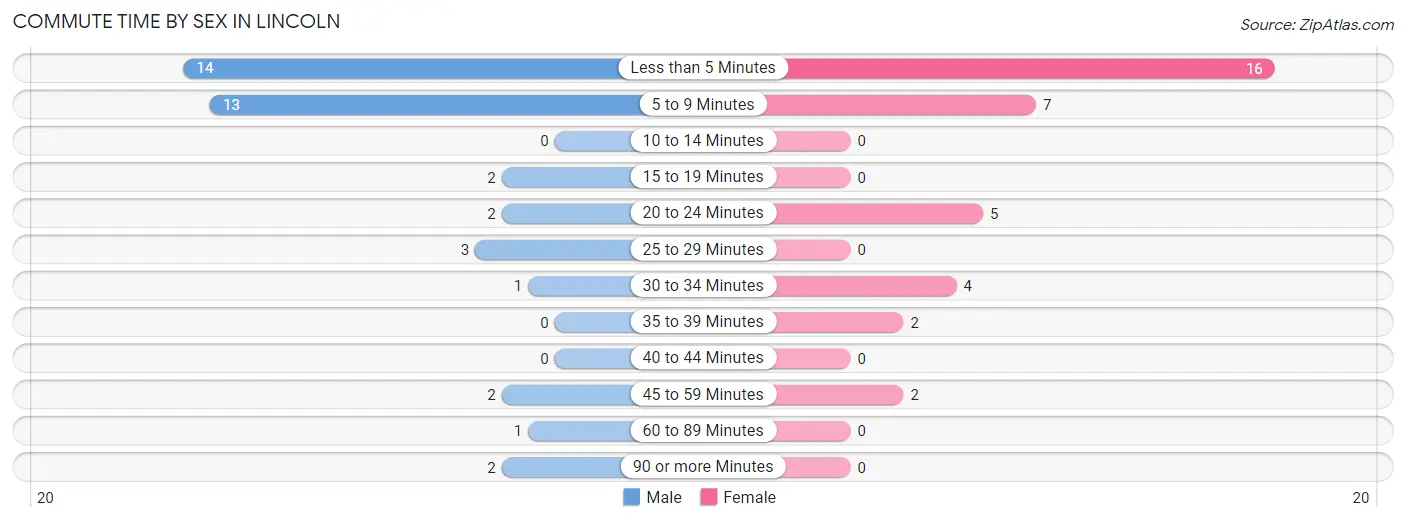
| Commute Time | Male | Female |
| Less than 5 Minutes | 14 (35.0%) | 16 (44.4%) |
| 5 to 9 Minutes | 13 (32.5%) | 7 (19.4%) |
| 10 to 14 Minutes | 0 (0.0%) | 0 (0.0%) |
| 15 to 19 Minutes | 2 (5.0%) | 0 (0.0%) |
| 20 to 24 Minutes | 2 (5.0%) | 5 (13.9%) |
| 25 to 29 Minutes | 3 (7.5%) | 0 (0.0%) |
| 30 to 34 Minutes | 1 (2.5%) | 4 (11.1%) |
| 35 to 39 Minutes | 0 (0.0%) | 2 (5.6%) |
| 40 to 44 Minutes | 0 (0.0%) | 0 (0.0%) |
| 45 to 59 Minutes | 2 (5.0%) | 2 (5.6%) |
| 60 to 89 Minutes | 1 (2.5%) | 0 (0.0%) |
| 90 or more Minutes | 2 (5.0%) | 0 (0.0%) |
Time of Departure to Work by Sex in Lincoln
The most frequent times of departure to work in Lincoln are 8:00 AM to 8:29 AM (12, 30.0%) for males and 7:30 AM to 7:59 AM (11, 30.6%) for females.
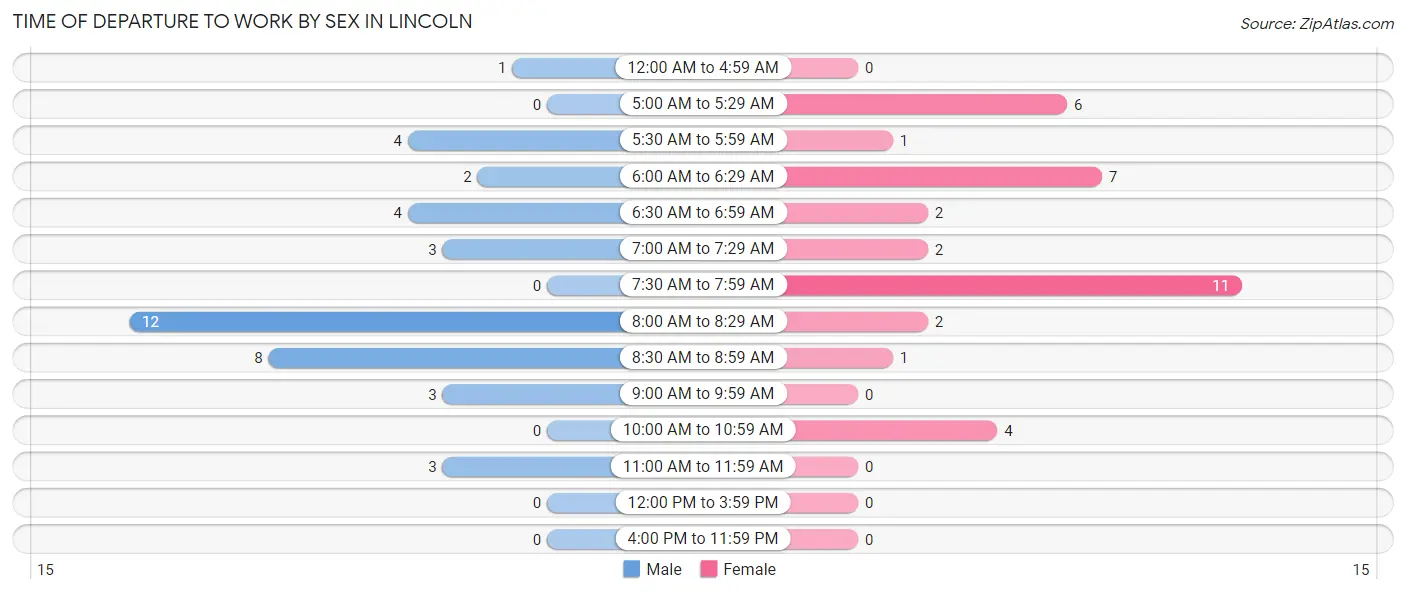
| Time of Departure | Male | Female |
| 12:00 AM to 4:59 AM | 1 (2.5%) | 0 (0.0%) |
| 5:00 AM to 5:29 AM | 0 (0.0%) | 6 (16.7%) |
| 5:30 AM to 5:59 AM | 4 (10.0%) | 1 (2.8%) |
| 6:00 AM to 6:29 AM | 2 (5.0%) | 7 (19.4%) |
| 6:30 AM to 6:59 AM | 4 (10.0%) | 2 (5.6%) |
| 7:00 AM to 7:29 AM | 3 (7.5%) | 2 (5.6%) |
| 7:30 AM to 7:59 AM | 0 (0.0%) | 11 (30.6%) |
| 8:00 AM to 8:29 AM | 12 (30.0%) | 2 (5.6%) |
| 8:30 AM to 8:59 AM | 8 (20.0%) | 1 (2.8%) |
| 9:00 AM to 9:59 AM | 3 (7.5%) | 0 (0.0%) |
| 10:00 AM to 10:59 AM | 0 (0.0%) | 4 (11.1%) |
| 11:00 AM to 11:59 AM | 3 (7.5%) | 0 (0.0%) |
| 12:00 PM to 3:59 PM | 0 (0.0%) | 0 (0.0%) |
| 4:00 PM to 11:59 PM | 0 (0.0%) | 0 (0.0%) |
| Total | 40 (100.0%) | 36 (100.0%) |
Housing Occupancy in Lincoln
Occupancy by Ownership in Lincoln
Of the total 145 dwellings in Lincoln, owner-occupied units account for 85 (58.6%), while renter-occupied units make up 60 (41.4%).
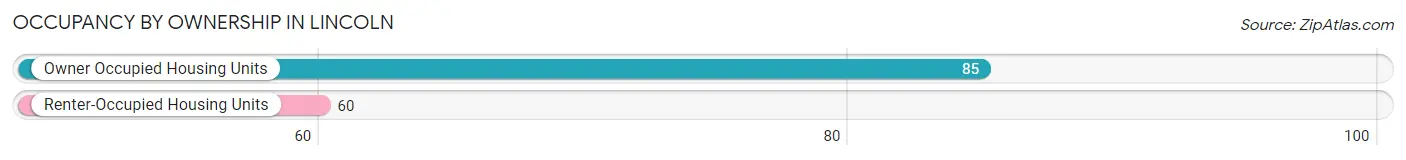
| Occupancy | # Housing Units | % Housing Units |
| Owner Occupied Housing Units | 85 | 58.6% |
| Renter-Occupied Housing Units | 60 | 41.4% |
| Total Occupied Housing Units | 145 | 100.0% |
Occupancy by Household Size in Lincoln
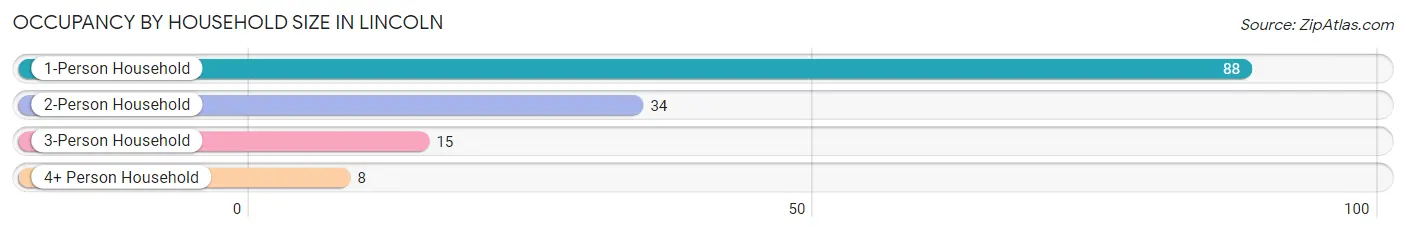
| Household Size | # Housing Units | % Housing Units |
| 1-Person Household | 88 | 60.7% |
| 2-Person Household | 34 | 23.4% |
| 3-Person Household | 15 | 10.3% |
| 4+ Person Household | 8 | 5.5% |
| Total Housing Units | 145 | 100.0% |
Occupancy by Ownership by Household Size in Lincoln
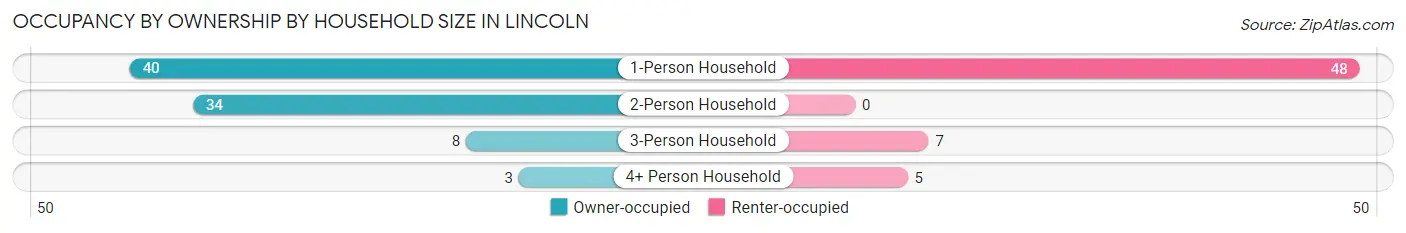
| Household Size | Owner-occupied | Renter-occupied |
| 1-Person Household | 40 (45.5%) | 48 (54.5%) |
| 2-Person Household | 34 (100.0%) | 0 (0.0%) |
| 3-Person Household | 8 (53.3%) | 7 (46.7%) |
| 4+ Person Household | 3 (37.5%) | 5 (62.5%) |
| Total Housing Units | 85 (58.6%) | 60 (41.4%) |
Occupancy by Educational Attainment in Lincoln
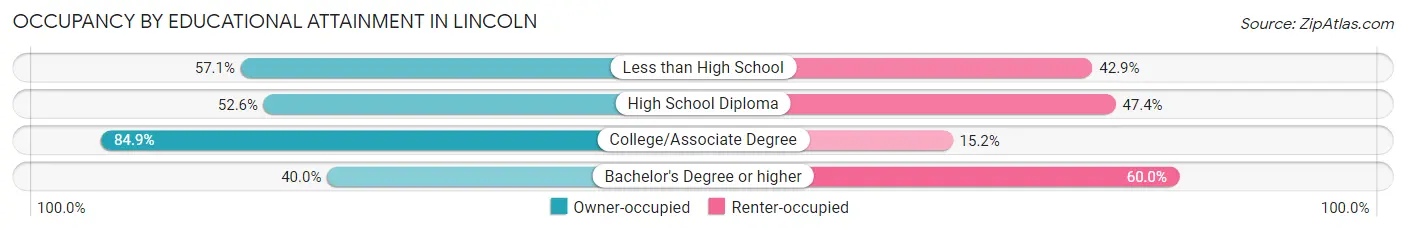
| Household Size | Owner-occupied | Renter-occupied |
| Less than High School | 8 (57.1%) | 6 (42.9%) |
| High School Diploma | 41 (52.6%) | 37 (47.4%) |
| College/Associate Degree | 28 (84.9%) | 5 (15.1%) |
| Bachelor's Degree or higher | 8 (40.0%) | 12 (60.0%) |
Occupancy by Age of Householder in Lincoln

| Age Bracket | # Households | % Households |
| Under 35 Years | 13 | 9.0% |
| 35 to 44 Years | 9 | 6.2% |
| 45 to 54 Years | 14 | 9.7% |
| 55 to 64 Years | 42 | 29.0% |
| 65 to 74 Years | 41 | 28.3% |
| 75 to 84 Years | 21 | 14.5% |
| 85 Years and Over | 5 | 3.5% |
| Total | 145 | 100.0% |
Housing Finances in Lincoln
Median Income by Occupancy in Lincoln
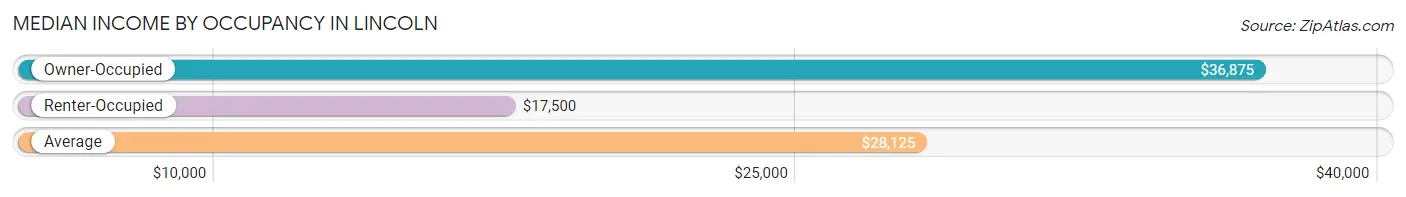
| Occupancy Type | # Households | Median Income |
| Owner-Occupied | 85 (58.6%) | $36,875 |
| Renter-Occupied | 60 (41.4%) | $17,500 |
| Average | 145 (100.0%) | $28,125 |
Occupancy by Householder Income Bracket in Lincoln
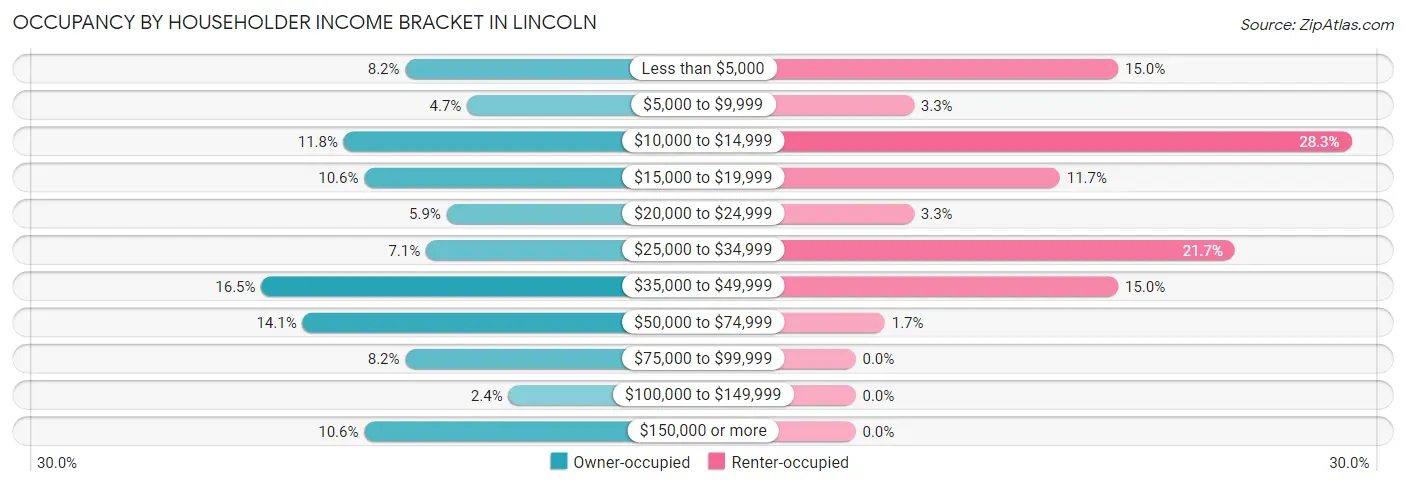
| Income Bracket | Owner-occupied | Renter-occupied |
| Less than $5,000 | 7 (8.2%) | 9 (15.0%) |
| $5,000 to $9,999 | 4 (4.7%) | 2 (3.3%) |
| $10,000 to $14,999 | 10 (11.8%) | 17 (28.3%) |
| $15,000 to $19,999 | 9 (10.6%) | 7 (11.7%) |
| $20,000 to $24,999 | 5 (5.9%) | 2 (3.3%) |
| $25,000 to $34,999 | 6 (7.1%) | 13 (21.7%) |
| $35,000 to $49,999 | 14 (16.5%) | 9 (15.0%) |
| $50,000 to $74,999 | 12 (14.1%) | 1 (1.7%) |
| $75,000 to $99,999 | 7 (8.2%) | 0 (0.0%) |
| $100,000 to $149,999 | 2 (2.4%) | 0 (0.0%) |
| $150,000 or more | 9 (10.6%) | 0 (0.0%) |
| Total | 85 (100.0%) | 60 (100.0%) |
Monthly Housing Cost Tiers in Lincoln
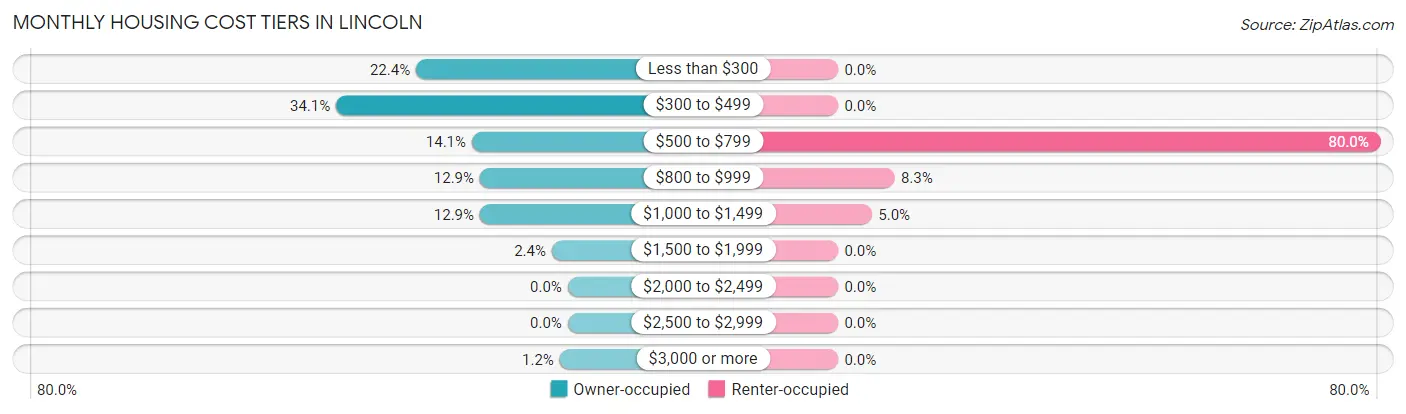
| Monthly Cost | Owner-occupied | Renter-occupied |
| Less than $300 | 19 (22.4%) | 0 (0.0%) |
| $300 to $499 | 29 (34.1%) | 0 (0.0%) |
| $500 to $799 | 12 (14.1%) | 48 (80.0%) |
| $800 to $999 | 11 (12.9%) | 5 (8.3%) |
| $1,000 to $1,499 | 11 (12.9%) | 3 (5.0%) |
| $1,500 to $1,999 | 2 (2.4%) | 0 (0.0%) |
| $2,000 to $2,499 | 0 (0.0%) | 0 (0.0%) |
| $2,500 to $2,999 | 0 (0.0%) | 0 (0.0%) |
| $3,000 or more | 1 (1.2%) | 0 (0.0%) |
| Total | 85 (100.0%) | 60 (100.0%) |
Physical Housing Characteristics in Lincoln
Housing Structures in Lincoln
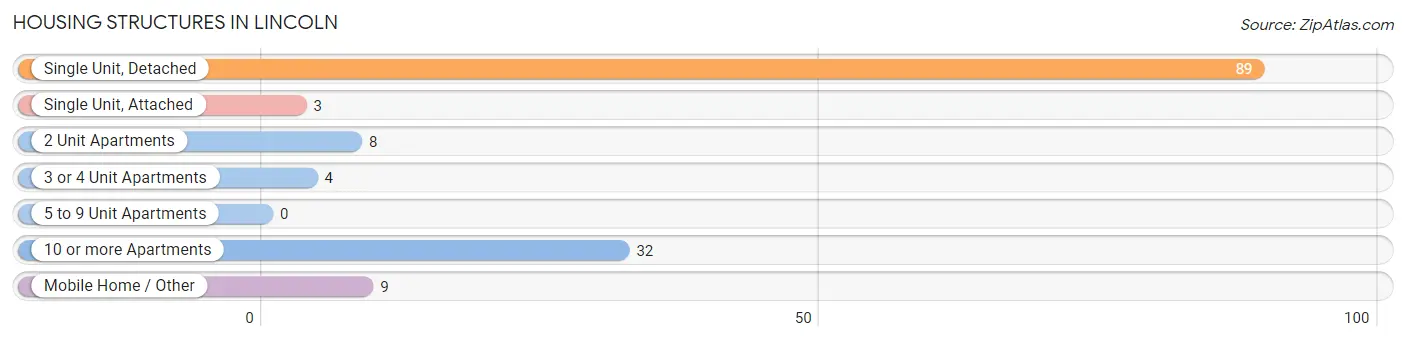
| Structure Type | # Housing Units | % Housing Units |
| Single Unit, Detached | 89 | 61.4% |
| Single Unit, Attached | 3 | 2.1% |
| 2 Unit Apartments | 8 | 5.5% |
| 3 or 4 Unit Apartments | 4 | 2.8% |
| 5 to 9 Unit Apartments | 0 | 0.0% |
| 10 or more Apartments | 32 | 22.1% |
| Mobile Home / Other | 9 | 6.2% |
| Total | 145 | 100.0% |
Housing Structures by Occupancy in Lincoln
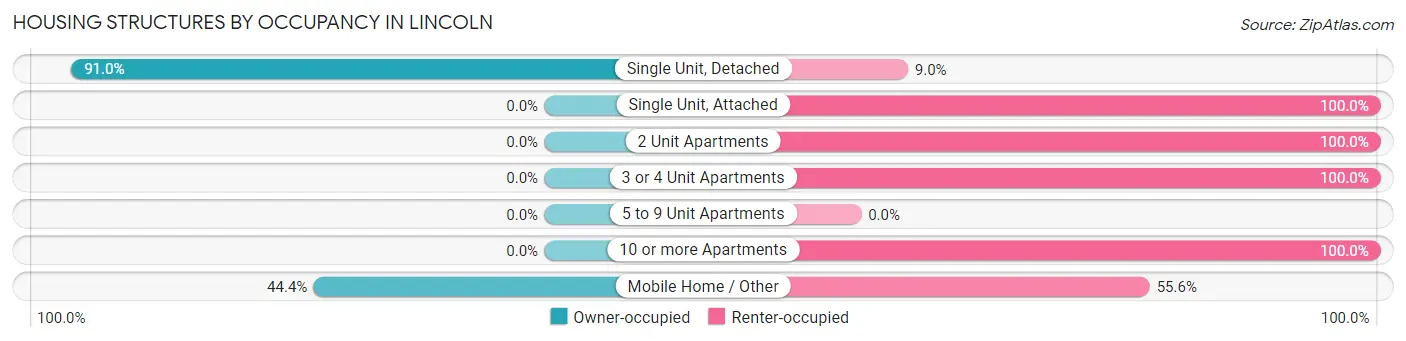
| Structure Type | Owner-occupied | Renter-occupied |
| Single Unit, Detached | 81 (91.0%) | 8 (9.0%) |
| Single Unit, Attached | 0 (0.0%) | 3 (100.0%) |
| 2 Unit Apartments | 0 (0.0%) | 8 (100.0%) |
| 3 or 4 Unit Apartments | 0 (0.0%) | 4 (100.0%) |
| 5 to 9 Unit Apartments | 0 (0.0%) | 0 (0.0%) |
| 10 or more Apartments | 0 (0.0%) | 32 (100.0%) |
| Mobile Home / Other | 4 (44.4%) | 5 (55.6%) |
| Total | 85 (58.6%) | 60 (41.4%) |
Housing Structures by Number of Rooms in Lincoln
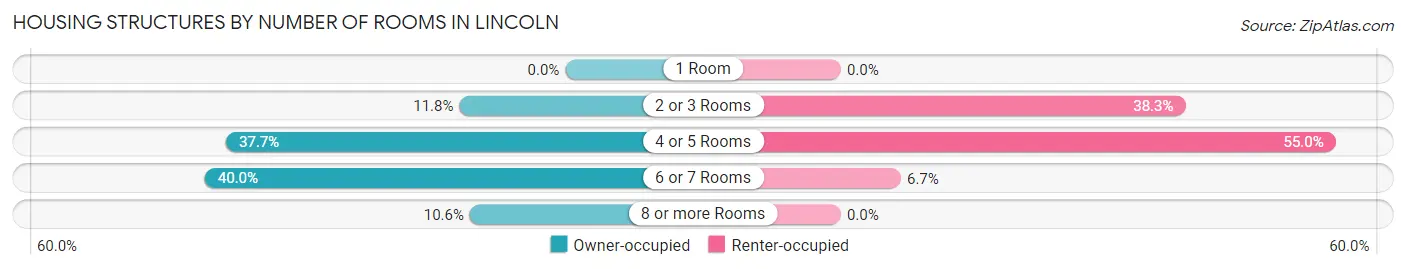
| Number of Rooms | Owner-occupied | Renter-occupied |
| 1 Room | 0 (0.0%) | 0 (0.0%) |
| 2 or 3 Rooms | 10 (11.8%) | 23 (38.3%) |
| 4 or 5 Rooms | 32 (37.7%) | 33 (55.0%) |
| 6 or 7 Rooms | 34 (40.0%) | 4 (6.7%) |
| 8 or more Rooms | 9 (10.6%) | 0 (0.0%) |
| Total | 85 (100.0%) | 60 (100.0%) |
Housing Structure by Heating Type in Lincoln
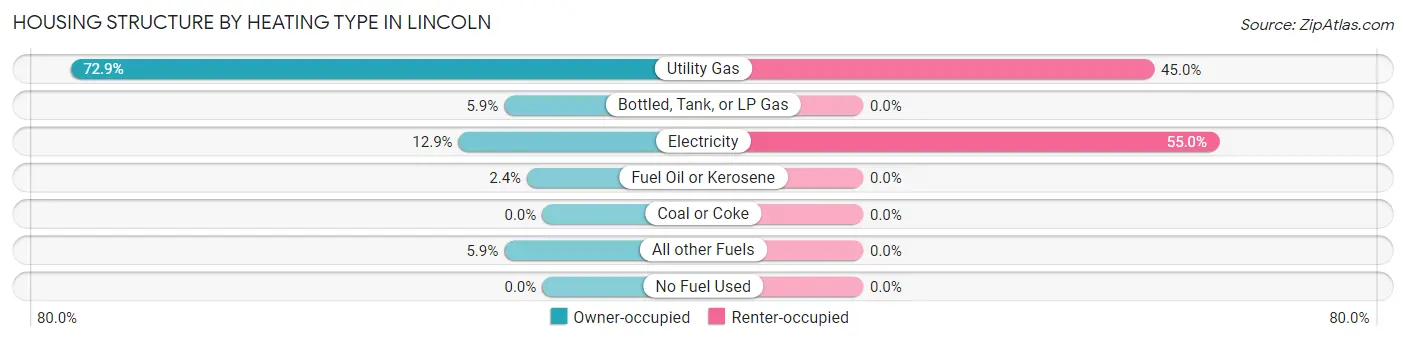
| Heating Type | Owner-occupied | Renter-occupied |
| Utility Gas | 62 (72.9%) | 27 (45.0%) |
| Bottled, Tank, or LP Gas | 5 (5.9%) | 0 (0.0%) |
| Electricity | 11 (12.9%) | 33 (55.0%) |
| Fuel Oil or Kerosene | 2 (2.4%) | 0 (0.0%) |
| Coal or Coke | 0 (0.0%) | 0 (0.0%) |
| All other Fuels | 5 (5.9%) | 0 (0.0%) |
| No Fuel Used | 0 (0.0%) | 0 (0.0%) |
| Total | 85 (100.0%) | 60 (100.0%) |
Household Vehicle Usage in Lincoln
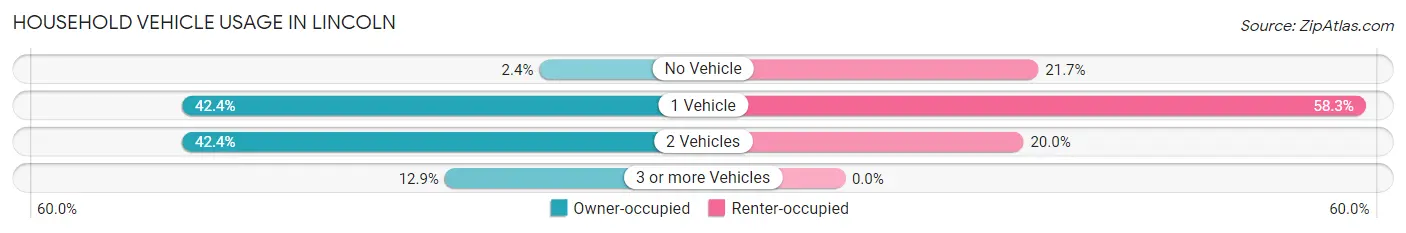
| Vehicles per Household | Owner-occupied | Renter-occupied |
| No Vehicle | 2 (2.4%) | 13 (21.7%) |
| 1 Vehicle | 36 (42.3%) | 35 (58.3%) |
| 2 Vehicles | 36 (42.3%) | 12 (20.0%) |
| 3 or more Vehicles | 11 (12.9%) | 0 (0.0%) |
| Total | 85 (100.0%) | 60 (100.0%) |
Real Estate & Mortgages in Lincoln
Real Estate and Mortgage Overview in Lincoln
| Characteristic | Without Mortgage | With Mortgage |
| Housing Units | 55 | 30 |
| Median Property Value | $101,600 | $178,600 |
| Median Household Income | $20,313 | $2 |
| Monthly Housing Costs | $346 | $0 |
| Real Estate Taxes | $1,118 | $4 |
Property Value by Mortgage Status in Lincoln
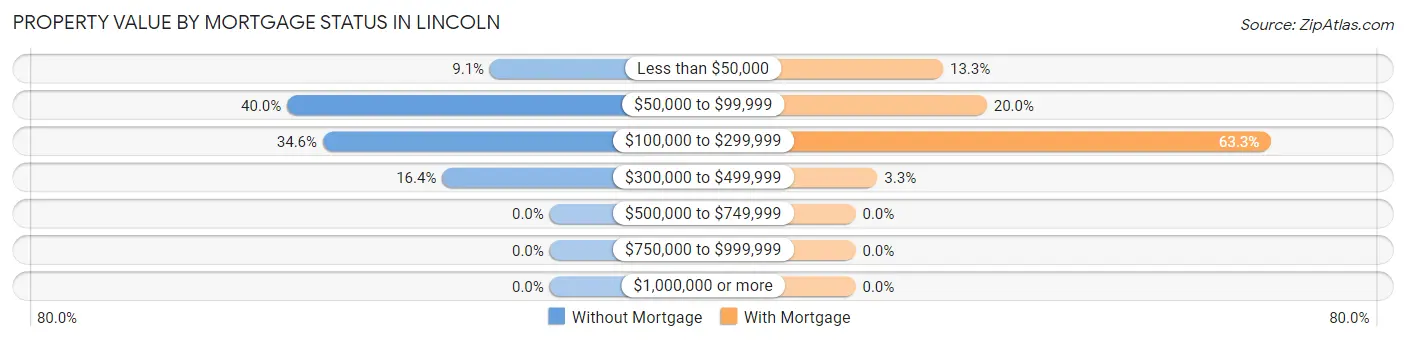
| Property Value | Without Mortgage | With Mortgage |
| Less than $50,000 | 5 (9.1%) | 4 (13.3%) |
| $50,000 to $99,999 | 22 (40.0%) | 6 (20.0%) |
| $100,000 to $299,999 | 19 (34.5%) | 19 (63.3%) |
| $300,000 to $499,999 | 9 (16.4%) | 1 (3.3%) |
| $500,000 to $749,999 | 0 (0.0%) | 0 (0.0%) |
| $750,000 to $999,999 | 0 (0.0%) | 0 (0.0%) |
| $1,000,000 or more | 0 (0.0%) | 0 (0.0%) |
| Total | 55 (100.0%) | 30 (100.0%) |
Household Income by Mortgage Status in Lincoln
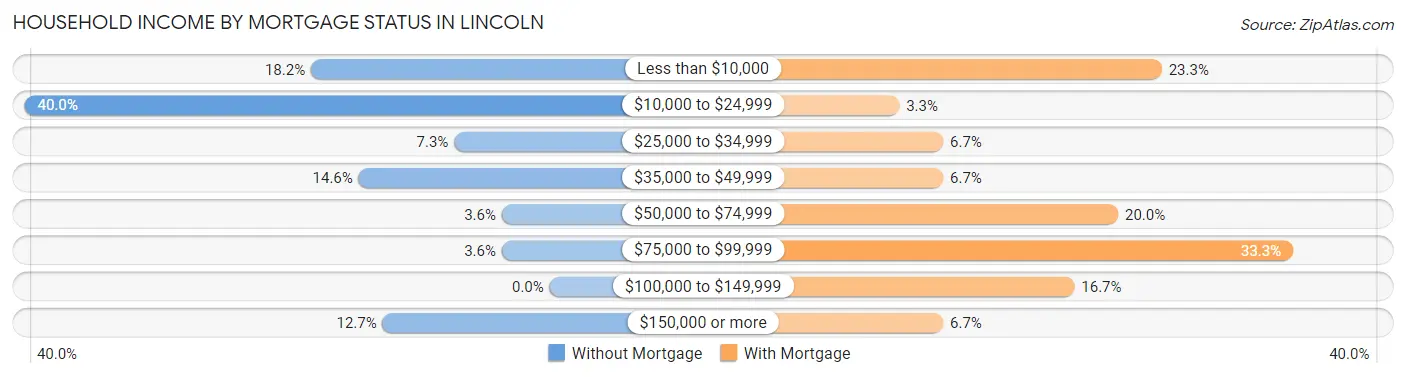
| Household Income | Without Mortgage | With Mortgage |
| Less than $10,000 | 10 (18.2%) | 7 (23.3%) |
| $10,000 to $24,999 | 22 (40.0%) | 1 (3.3%) |
| $25,000 to $34,999 | 4 (7.3%) | 2 (6.7%) |
| $35,000 to $49,999 | 8 (14.5%) | 2 (6.7%) |
| $50,000 to $74,999 | 2 (3.6%) | 6 (20.0%) |
| $75,000 to $99,999 | 2 (3.6%) | 10 (33.3%) |
| $100,000 to $149,999 | 0 (0.0%) | 5 (16.7%) |
| $150,000 or more | 7 (12.7%) | 2 (6.7%) |
| Total | 55 (100.0%) | 30 (100.0%) |
Property Value to Household Income Ratio in Lincoln
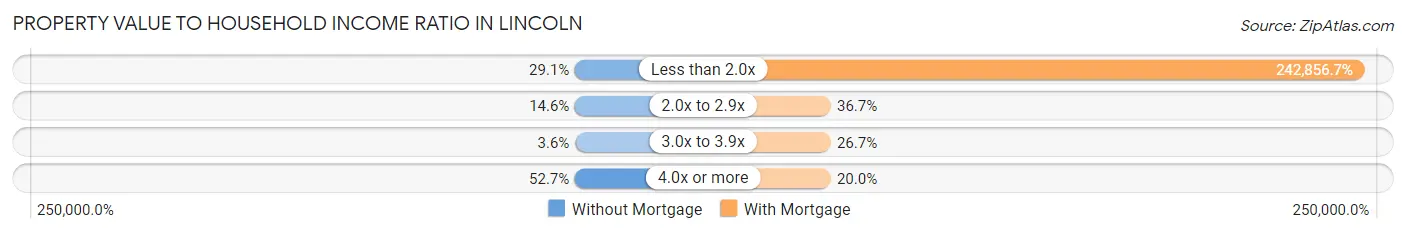
| Value-to-Income Ratio | Without Mortgage | With Mortgage |
| Less than 2.0x | 16 (29.1%) | 72,857 (242,856.7%) |
| 2.0x to 2.9x | 8 (14.5%) | 11 (36.7%) |
| 3.0x to 3.9x | 2 (3.6%) | 8 (26.7%) |
| 4.0x or more | 29 (52.7%) | 6 (20.0%) |
| Total | 55 (100.0%) | 30 (100.0%) |
Real Estate Taxes by Mortgage Status in Lincoln
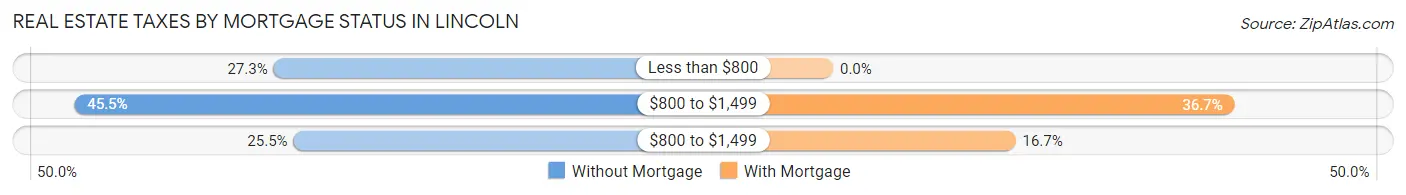
| Property Taxes | Without Mortgage | With Mortgage |
| Less than $800 | 15 (27.3%) | 0 (0.0%) |
| $800 to $1,499 | 25 (45.5%) | 11 (36.7%) |
| $800 to $1,499 | 14 (25.5%) | 5 (16.7%) |
| Total | 55 (100.0%) | 30 (100.0%) |
Health & Disability in Lincoln
Health Insurance Coverage by Age in Lincoln
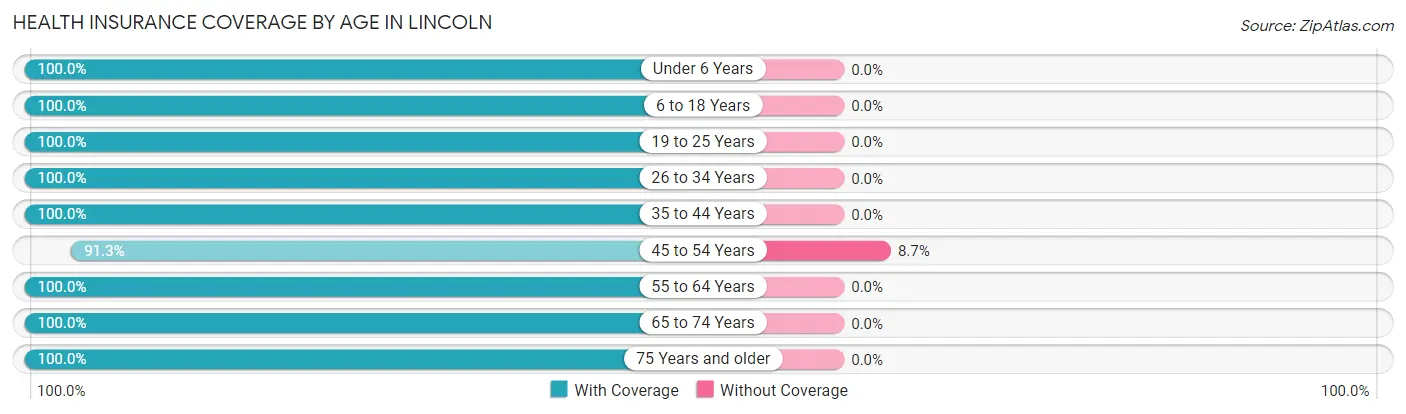
| Age Bracket | With Coverage | Without Coverage |
| Under 6 Years | 7 (100.0%) | 0 (0.0%) |
| 6 to 18 Years | 23 (100.0%) | 0 (0.0%) |
| 19 to 25 Years | 5 (100.0%) | 0 (0.0%) |
| 26 to 34 Years | 20 (100.0%) | 0 (0.0%) |
| 35 to 44 Years | 17 (100.0%) | 0 (0.0%) |
| 45 to 54 Years | 21 (91.3%) | 2 (8.7%) |
| 55 to 64 Years | 58 (100.0%) | 0 (0.0%) |
| 65 to 74 Years | 44 (100.0%) | 0 (0.0%) |
| 75 Years and older | 36 (100.0%) | 0 (0.0%) |
| Total | 231 (99.1%) | 2 (0.9%) |
Health Insurance Coverage by Citizenship Status in Lincoln
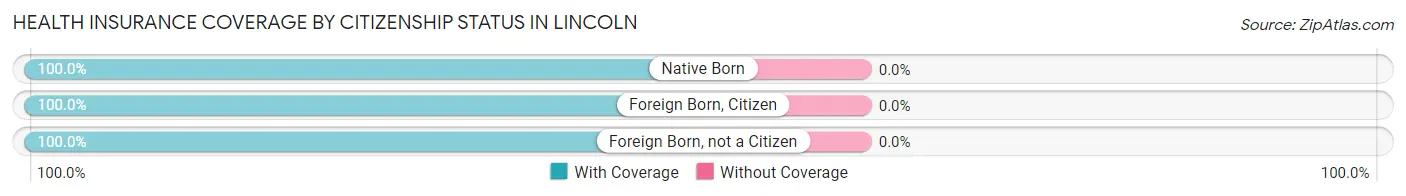
| Citizenship Status | With Coverage | Without Coverage |
| Native Born | 7 (100.0%) | 0 (0.0%) |
| Foreign Born, Citizen | 23 (100.0%) | 0 (0.0%) |
| Foreign Born, not a Citizen | 5 (100.0%) | 0 (0.0%) |
Health Insurance Coverage by Household Income in Lincoln
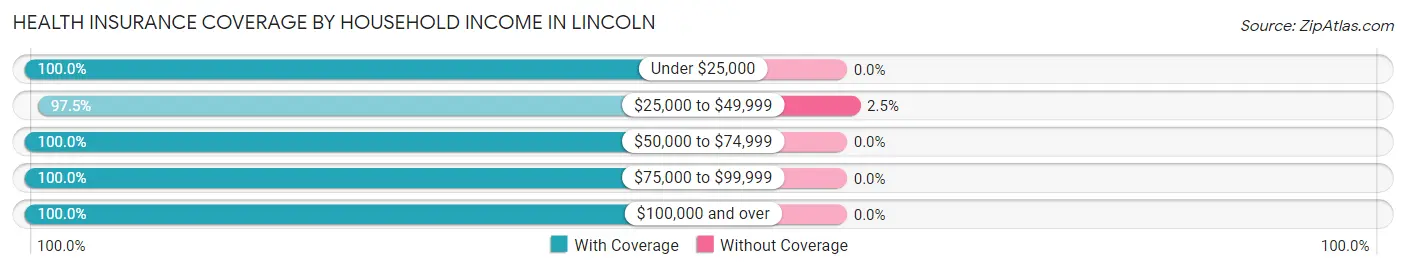
| Household Income | With Coverage | Without Coverage |
| Under $25,000 | 83 (100.0%) | 0 (0.0%) |
| $25,000 to $49,999 | 78 (97.5%) | 2 (2.5%) |
| $50,000 to $74,999 | 25 (100.0%) | 0 (0.0%) |
| $75,000 to $99,999 | 16 (100.0%) | 0 (0.0%) |
| $100,000 and over | 29 (100.0%) | 0 (0.0%) |
Public vs Private Health Insurance Coverage by Age in Lincoln
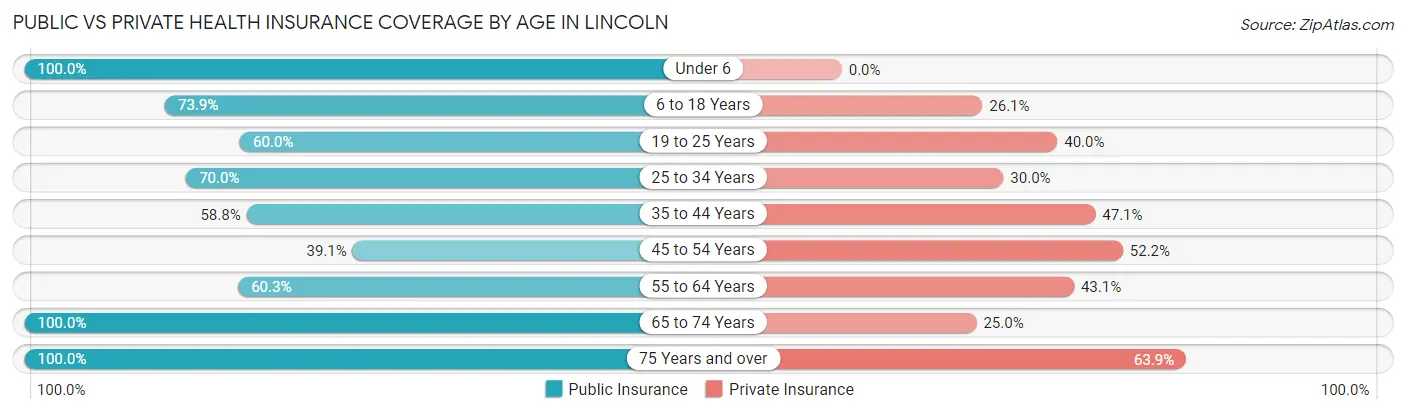
| Age Bracket | Public Insurance | Private Insurance |
| Under 6 | 7 (100.0%) | 0 (0.0%) |
| 6 to 18 Years | 17 (73.9%) | 6 (26.1%) |
| 19 to 25 Years | 3 (60.0%) | 2 (40.0%) |
| 25 to 34 Years | 14 (70.0%) | 6 (30.0%) |
| 35 to 44 Years | 10 (58.8%) | 8 (47.1%) |
| 45 to 54 Years | 9 (39.1%) | 12 (52.2%) |
| 55 to 64 Years | 35 (60.3%) | 25 (43.1%) |
| 65 to 74 Years | 44 (100.0%) | 11 (25.0%) |
| 75 Years and over | 36 (100.0%) | 23 (63.9%) |
| Total | 175 (75.1%) | 93 (39.9%) |
Disability Status by Sex by Age in Lincoln
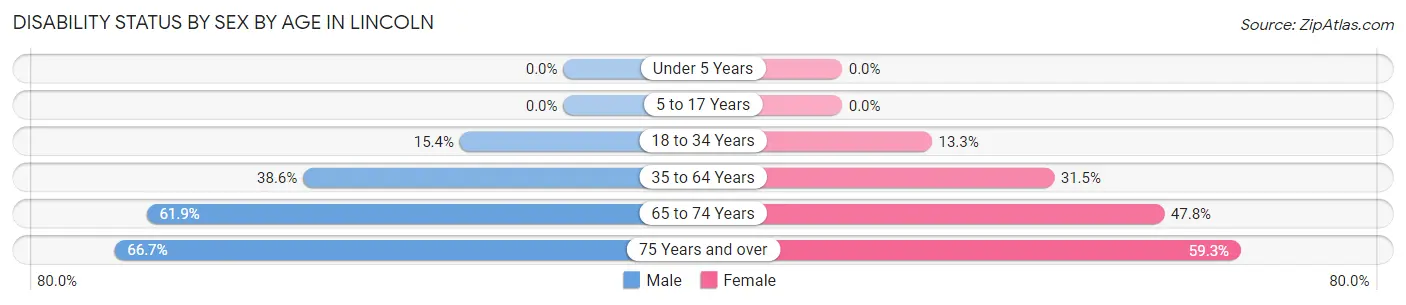
| Age Bracket | Male | Female |
| Under 5 Years | 0 (0.0%) | 0 (0.0%) |
| 5 to 17 Years | 0 (0.0%) | 0 (0.0%) |
| 18 to 34 Years | 2 (15.4%) | 2 (13.3%) |
| 35 to 64 Years | 17 (38.6%) | 17 (31.5%) |
| 65 to 74 Years | 13 (61.9%) | 11 (47.8%) |
| 75 Years and over | 6 (66.7%) | 16 (59.3%) |
Disability Class by Sex by Age in Lincoln
Disability Class: Hearing Difficulty
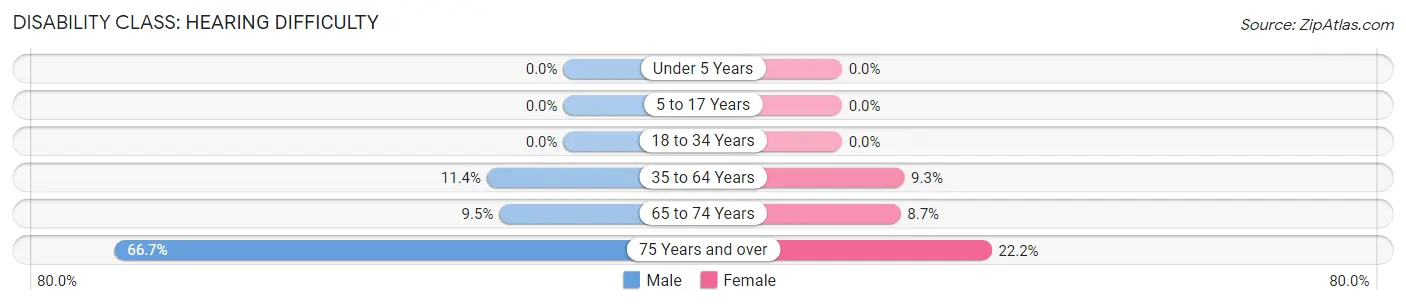
| Age Bracket | Male | Female |
| Under 5 Years | 0 (0.0%) | 0 (0.0%) |
| 5 to 17 Years | 0 (0.0%) | 0 (0.0%) |
| 18 to 34 Years | 0 (0.0%) | 0 (0.0%) |
| 35 to 64 Years | 5 (11.4%) | 5 (9.3%) |
| 65 to 74 Years | 2 (9.5%) | 2 (8.7%) |
| 75 Years and over | 6 (66.7%) | 6 (22.2%) |
Disability Class: Vision Difficulty
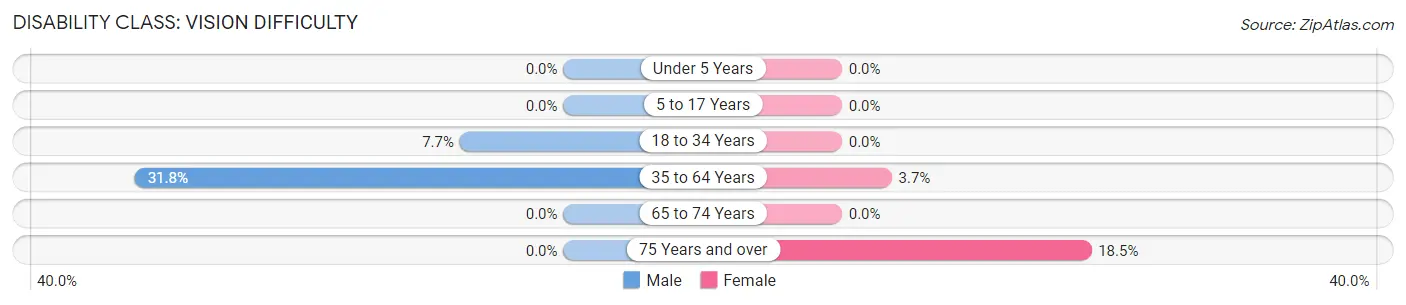
| Age Bracket | Male | Female |
| Under 5 Years | 0 (0.0%) | 0 (0.0%) |
| 5 to 17 Years | 0 (0.0%) | 0 (0.0%) |
| 18 to 34 Years | 1 (7.7%) | 0 (0.0%) |
| 35 to 64 Years | 14 (31.8%) | 2 (3.7%) |
| 65 to 74 Years | 0 (0.0%) | 0 (0.0%) |
| 75 Years and over | 0 (0.0%) | 5 (18.5%) |
Disability Class: Cognitive Difficulty
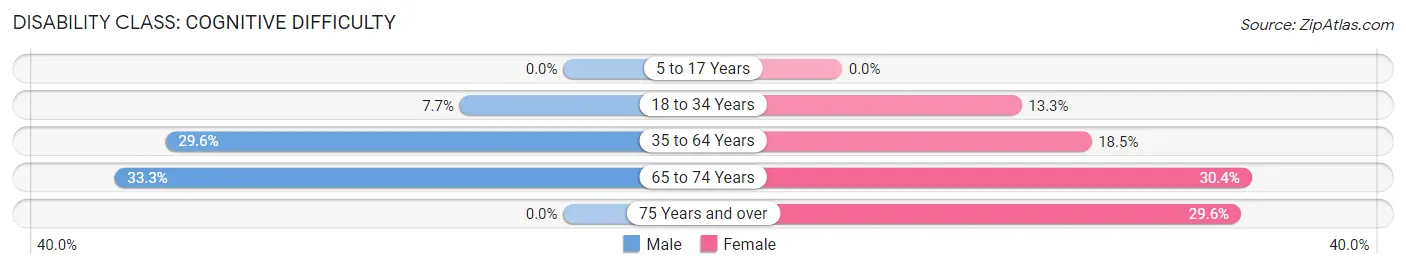
| Age Bracket | Male | Female |
| 5 to 17 Years | 0 (0.0%) | 0 (0.0%) |
| 18 to 34 Years | 1 (7.7%) | 2 (13.3%) |
| 35 to 64 Years | 13 (29.5%) | 10 (18.5%) |
| 65 to 74 Years | 7 (33.3%) | 7 (30.4%) |
| 75 Years and over | 0 (0.0%) | 8 (29.6%) |
Disability Class: Ambulatory Difficulty
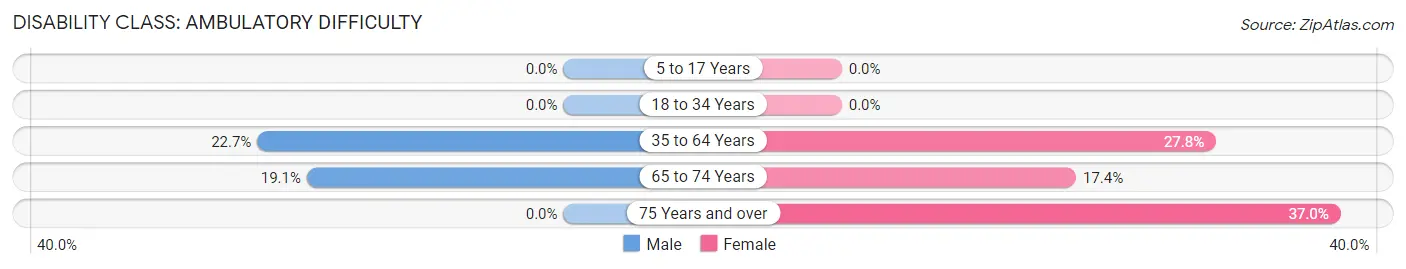
| Age Bracket | Male | Female |
| 5 to 17 Years | 0 (0.0%) | 0 (0.0%) |
| 18 to 34 Years | 0 (0.0%) | 0 (0.0%) |
| 35 to 64 Years | 10 (22.7%) | 15 (27.8%) |
| 65 to 74 Years | 4 (19.1%) | 4 (17.4%) |
| 75 Years and over | 0 (0.0%) | 10 (37.0%) |
Disability Class: Self-Care Difficulty
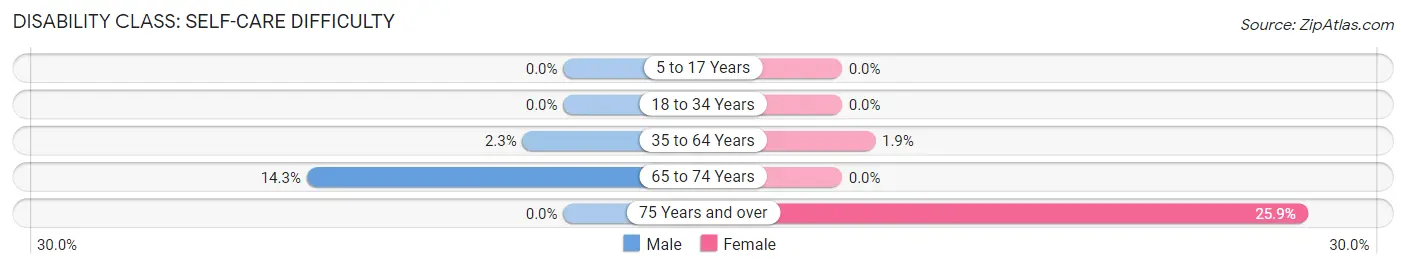
| Age Bracket | Male | Female |
| 5 to 17 Years | 0 (0.0%) | 0 (0.0%) |
| 18 to 34 Years | 0 (0.0%) | 0 (0.0%) |
| 35 to 64 Years | 1 (2.3%) | 1 (1.8%) |
| 65 to 74 Years | 3 (14.3%) | 0 (0.0%) |
| 75 Years and over | 0 (0.0%) | 7 (25.9%) |
Technology Access in Lincoln
Computing Device Access in Lincoln
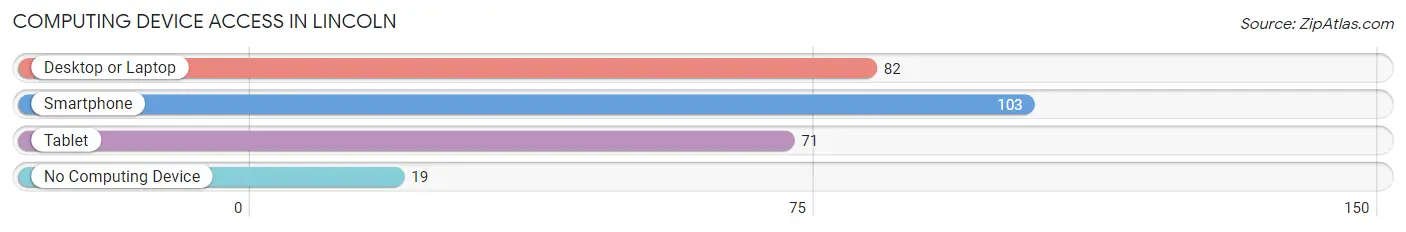
| Device Type | # Households | % Households |
| Desktop or Laptop | 82 | 56.6% |
| Smartphone | 103 | 71.0% |
| Tablet | 71 | 49.0% |
| No Computing Device | 19 | 13.1% |
| Total | 145 | 100.0% |
Internet Access in Lincoln
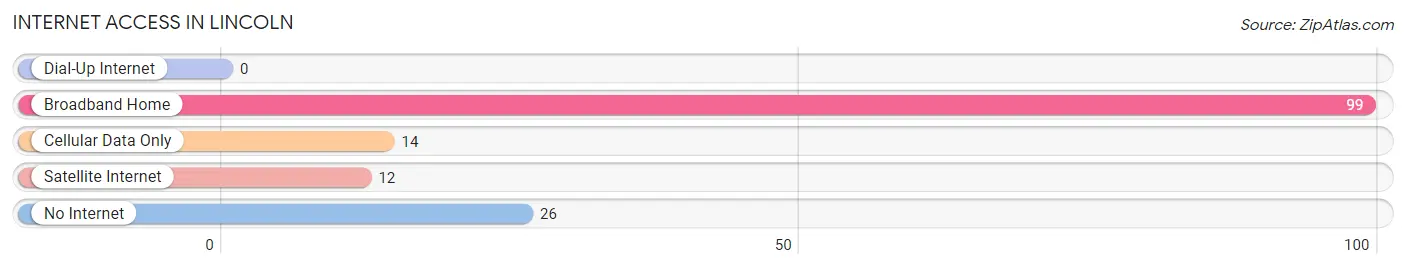
| Internet Type | # Households | % Households |
| Dial-Up Internet | 0 | 0.0% |
| Broadband Home | 99 | 68.3% |
| Cellular Data Only | 14 | 9.7% |
| Satellite Internet | 12 | 8.3% |
| No Internet | 26 | 17.9% |
| Total | 145 | 100.0% |
Lincoln Summary
Lincoln, Michigan is a small city located in the central part of the state, in the county of Alcona. It is situated on the banks of the Au Sable River, and is surrounded by the Huron National Forest. The city has a population of 1,845 people, according to the 2010 census.
History
Lincoln was first settled in 1871 by a group of lumbermen from Michigan's Upper Peninsula. The town was named after Abraham Lincoln, the 16th President of the United States. The lumber industry was the main source of income for the town, and it was a major contributor to the local economy. The town was incorporated in 1887.
In the early 1900s, the lumber industry began to decline, and the town began to look for other sources of income. In the 1920s, the town began to attract tourists, and the local economy began to shift towards tourism. The town was also home to a number of resorts, which attracted visitors from all over the country.
In the 1950s, the town began to experience a decline in population, as many of the residents moved away in search of better job opportunities. The town was also affected by the decline of the lumber industry, and the local economy began to suffer.
In the 1970s, the town began to experience a resurgence in population, as people began to move back to the area. The town was also home to a number of small businesses, which helped to revitalize the local economy.
Geography
Lincoln is located in the central part of Michigan, in the county of Alcona. It is situated on the banks of the Au Sable River, and is surrounded by the Huron National Forest. The city has a total area of 1.3 square miles, all of which is land.
The climate in Lincoln is classified as humid continental, with warm summers and cold winters. The average temperature in the summer is around 75 degrees Fahrenheit, and the average temperature in the winter is around 20 degrees Fahrenheit.
Economy
The economy of Lincoln is largely based on tourism and small businesses. The town is home to a number of resorts, which attract visitors from all over the country. The town is also home to a number of small businesses, which provide goods and services to the local community.
The town is also home to a number of manufacturing companies, which produce a variety of products. The town is also home to a number of agricultural businesses, which produce a variety of crops.
Demographics
According to the 2010 census, the population of Lincoln was 1,845 people. The racial makeup of the town was 97.3% White, 0.2% African American, 0.2% Native American, 0.2% Asian, 0.2% from other races, and 1.9% from two or more races. The median household income was $35,938, and the median family income was $41,250.
The town is home to a number of churches, including the First Presbyterian Church, the First United Methodist Church, and the St. Paul Lutheran Church. The town is also home to a number of schools, including the Lincoln Public Schools, the Lincoln High School, and the Lincoln Middle School.
Common Questions
What is Per Capita Income in Lincoln?
Per Capita income in Lincoln is $30,075.
What is the Median Family Income in Lincoln?
Median Family Income in Lincoln is $46,250.
What is the Median Household income in Lincoln?
Median Household Income in Lincoln is $28,125.
What is Income or Wage Gap in Lincoln?
Income or Wage Gap in Lincoln is 33.3%.
Women in Lincoln earn 66.7 cents for every dollar earned by a man.
What is Inequality or Gini Index in Lincoln?
Inequality or Gini Index in Lincoln is 0.59.
What is the Total Population of Lincoln?
Total Population of Lincoln is 233.
What is the Total Male Population of Lincoln?
Total Male Population of Lincoln is 94.
What is the Total Female Population of Lincoln?
Total Female Population of Lincoln is 139.
What is the Ratio of Males per 100 Females in Lincoln?
There are 67.63 Males per 100 Females in Lincoln.
What is the Ratio of Females per 100 Males in Lincoln?
There are 147.87 Females per 100 Males in Lincoln.
What is the Median Population Age in Lincoln?
Median Population Age in Lincoln is 59.4 Years.
What is the Average Family Size in Lincoln
Average Family Size in Lincoln is 2.4 People.
What is the Average Household Size in Lincoln
Average Household Size in Lincoln is 1.6 People.
How Large is the Labor Force in Lincoln?
There are 90 People in the Labor Forcein in Lincoln.
What is the Percentage of People in the Labor Force in Lincoln?
42.3% of People are in the Labor Force in Lincoln.
What is the Unemployment Rate in Lincoln?
Unemployment Rate in Lincoln is 8.9%.