Algonac, MI Map & Demographics
Algonac Map
Algonac Overview
$28,758
PER CAPITA INCOME
$54,828
AVG FAMILY INCOME
$50,703
AVG HOUSEHOLD INCOME
10.3%
WAGE / INCOME GAP [ % ]
89.7¢/ $1
WAGE / INCOME GAP [ $ ]
0.42
INEQUALITY / GINI INDEX
4,167
TOTAL POPULATION
1,963
MALE POPULATION
2,204
FEMALE POPULATION
89.07
MALES / 100 FEMALES
112.28
FEMALES / 100 MALES
46.2
MEDIAN AGE
2.8
AVG FAMILY SIZE
2.3
AVG HOUSEHOLD SIZE
2,030
LABOR FORCE [ PEOPLE ]
58.8%
PERCENT IN LABOR FORCE
6.0%
UNEMPLOYMENT RATE
Algonac Zip Codes
Algonac Area Codes
Income in Algonac
Income Overview in Algonac
Per Capita Income in Algonac is $28,758, while median incomes of families and households are $54,828 and $50,703 respectively.
| Characteristic | Number | Measure |
| Per Capita Income | 4,167 | $28,758 |
| Median Family Income | 1,111 | $54,828 |
| Mean Family Income | 1,111 | $72,693 |
| Median Household Income | 1,822 | $50,703 |
| Mean Household Income | 1,822 | $64,443 |
| Income Deficit | 1,111 | $0 |
| Wage / Income Gap (%) | 4,167 | 10.25% |
| Wage / Income Gap ($) | 4,167 | 89.75¢ per $1 |
| Gini / Inequality Index | 4,167 | 0.42 |
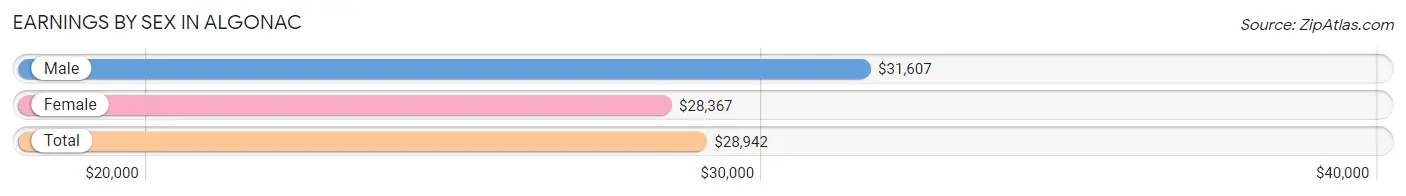
Earnings by Sex in Algonac
Average Earnings in Algonac are $28,942, $31,607 for men and $28,367 for women, a difference of 10.2%.
| Sex | Number | Average Earnings |
| Male | 1,110 (53.4%) | $31,607 |
| Female | 970 (46.6%) | $28,367 |
| Total | 2,080 (100.0%) | $28,942 |
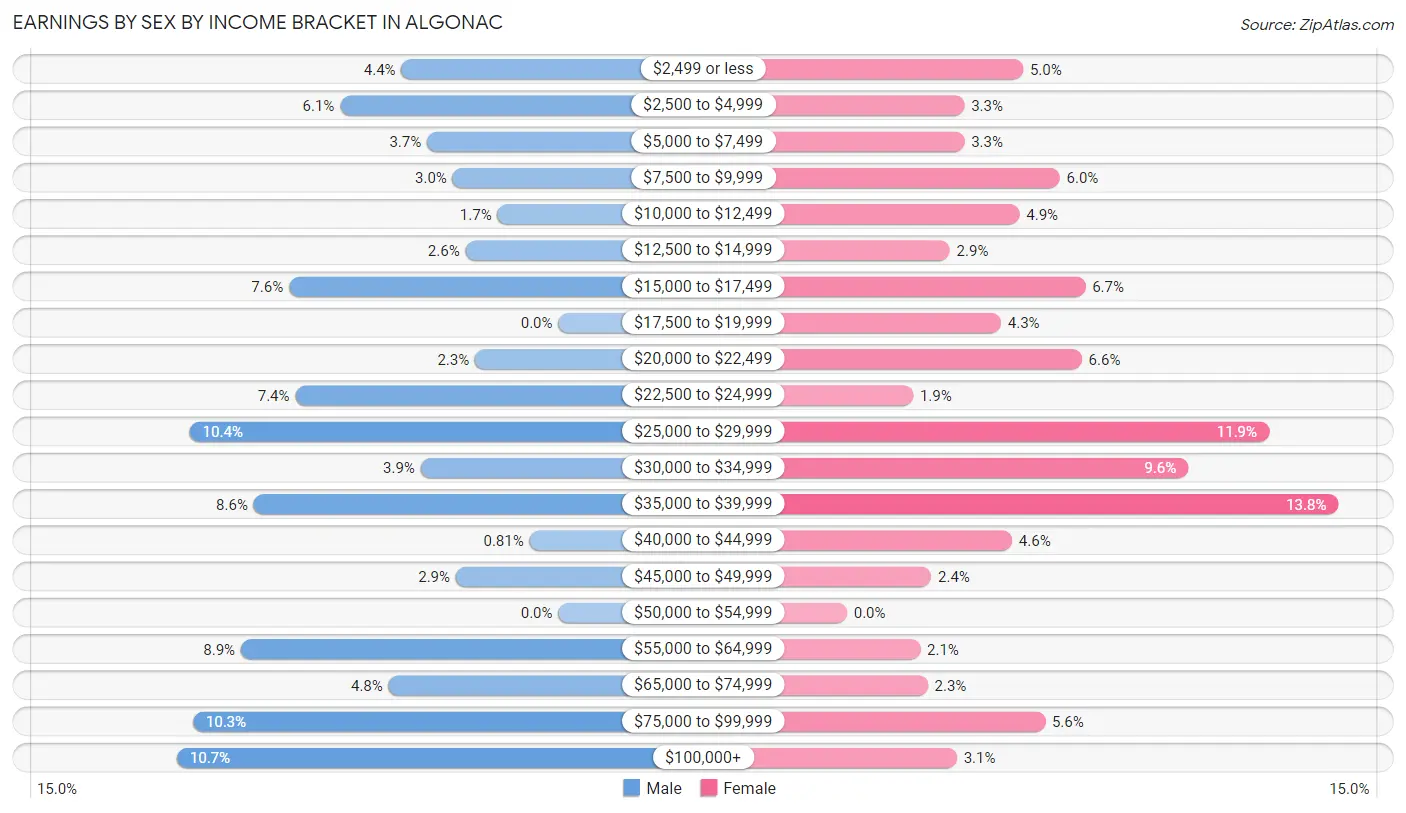
Earnings by Sex by Income Bracket in Algonac
The most common earnings brackets in Algonac are $100,000+ for men (119 | 10.7%) and $35,000 to $39,999 for women (134 | 13.8%).
| Income | Male | Female |
| $2,499 or less | 49 (4.4%) | 48 (5.0%) |
| $2,500 to $4,999 | 68 (6.1%) | 32 (3.3%) |
| $5,000 to $7,499 | 41 (3.7%) | 32 (3.3%) |
| $7,500 to $9,999 | 33 (3.0%) | 58 (6.0%) |
| $10,000 to $12,499 | 19 (1.7%) | 47 (4.9%) |
| $12,500 to $14,999 | 29 (2.6%) | 28 (2.9%) |
| $15,000 to $17,499 | 84 (7.6%) | 65 (6.7%) |
| $17,500 to $19,999 | 0 (0.0%) | 42 (4.3%) |
| $20,000 to $22,499 | 26 (2.3%) | 64 (6.6%) |
| $22,500 to $24,999 | 82 (7.4%) | 18 (1.9%) |
| $25,000 to $29,999 | 115 (10.4%) | 115 (11.9%) |
| $30,000 to $34,999 | 43 (3.9%) | 93 (9.6%) |
| $35,000 to $39,999 | 95 (8.6%) | 134 (13.8%) |
| $40,000 to $44,999 | 9 (0.8%) | 45 (4.6%) |
| $45,000 to $49,999 | 32 (2.9%) | 23 (2.4%) |
| $50,000 to $54,999 | 0 (0.0%) | 0 (0.0%) |
| $55,000 to $64,999 | 99 (8.9%) | 20 (2.1%) |
| $65,000 to $74,999 | 53 (4.8%) | 22 (2.3%) |
| $75,000 to $99,999 | 114 (10.3%) | 54 (5.6%) |
| $100,000+ | 119 (10.7%) | 30 (3.1%) |
| Total | 1,110 (100.0%) | 970 (100.0%) |
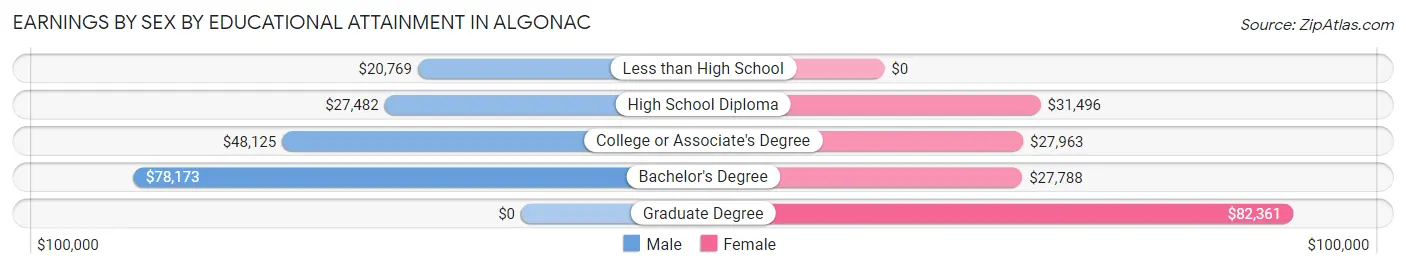
Earnings by Sex by Educational Attainment in Algonac
Average earnings in Algonac are $36,089 for men and $29,462 for women, a difference of 18.4%. Men with an educational attainment of bachelor's degree enjoy the highest average annual earnings of $78,173, while those with less than high school education earn the least with $20,769. Women with an educational attainment of graduate degree earn the most with the average annual earnings of $82,361, while those with bachelor's degree education have the smallest earnings of $27,788.
| Educational Attainment | Male Income | Female Income |
| Less than High School | $20,769 | $0 |
| High School Diploma | $27,482 | $31,496 |
| College or Associate's Degree | $48,125 | $27,963 |
| Bachelor's Degree | $78,173 | $27,788 |
| Graduate Degree | - | - |
| Total | $36,089 | $29,462 |
Family Income in Algonac
Family Income Brackets in Algonac
According to the Algonac family income data, there are 287 families falling into the $50,000 to $74,999 income range, which is the most common income bracket and makes up 25.8% of all families. Conversely, the $10,000 to $14,999 income bracket is the least frequent group with only 47 families (4.2%) belonging to this category.
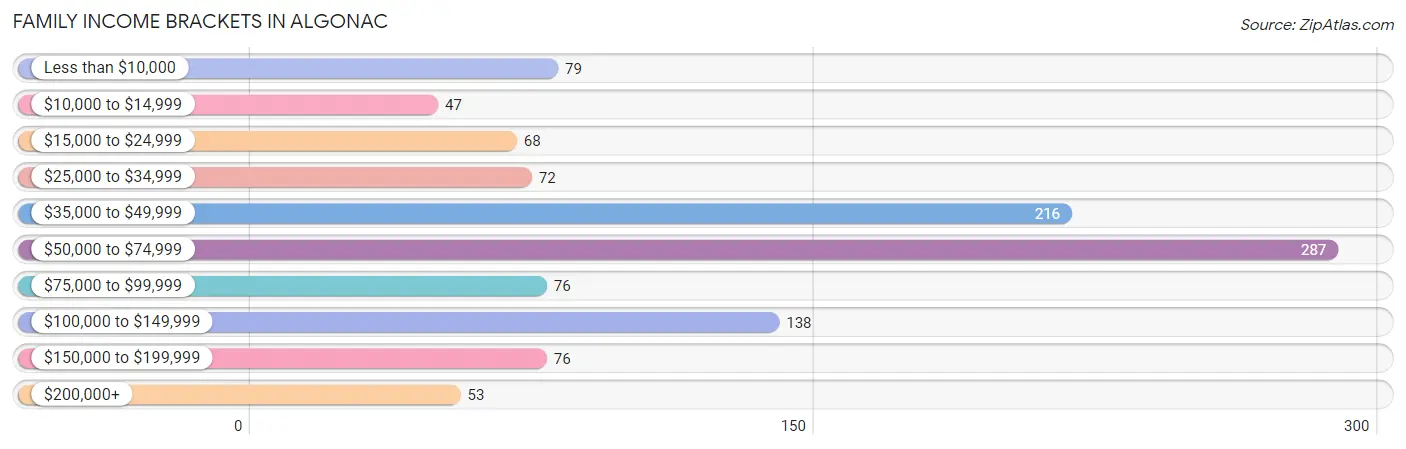
| Income Bracket | # Families | % Families |
| Less than $10,000 | 79 | 7.1% |
| $10,000 to $14,999 | 47 | 4.2% |
| $15,000 to $24,999 | 68 | 6.1% |
| $25,000 to $34,999 | 72 | 6.5% |
| $35,000 to $49,999 | 216 | 19.4% |
| $50,000 to $74,999 | 287 | 25.8% |
| $75,000 to $99,999 | 76 | 6.8% |
| $100,000 to $149,999 | 138 | 12.4% |
| $150,000 to $199,999 | 76 | 6.8% |
| $200,000+ | 53 | 4.8% |
Family Income by Famaliy Size in Algonac
7+ person families (19 | 1.7%) account for the highest median family income in Algonac with $108,375 per family, while 3-person families (283 | 25.5%) have the highest median income of $34,243 per family member.
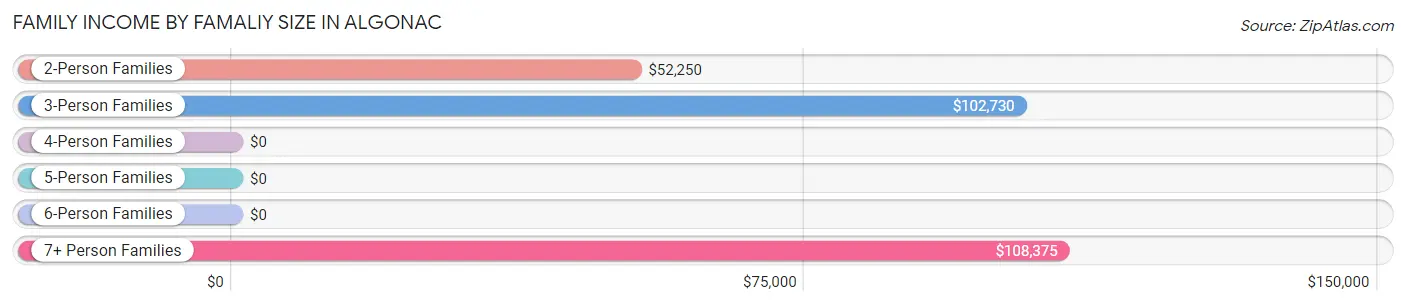
| Income Bracket | # Families | Median Income |
| 2-Person Families | 672 (60.5%) | $52,250 |
| 3-Person Families | 283 (25.5%) | $102,730 |
| 4-Person Families | 74 (6.7%) | $0 |
| 5-Person Families | 35 (3.2%) | $0 |
| 6-Person Families | 28 (2.5%) | $0 |
| 7+ Person Families | 19 (1.7%) | $108,375 |
| Total | 1,111 (100.0%) | $54,828 |
Family Income by Number of Earners in Algonac
The median family income in Algonac is $54,828, with families comprising 2 earners (369) having the highest median family income of $85,655, while families with no earners (265) have the lowest median family income of $44,776, accounting for 33.2% and 23.8% of families, respectively.
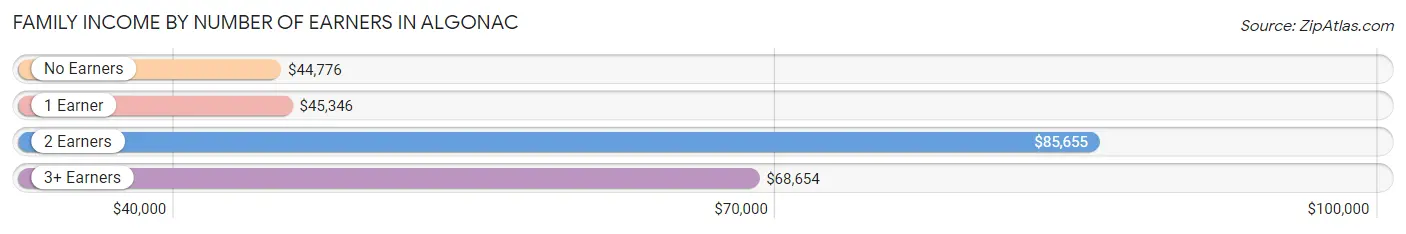
| Number of Earners | # Families | Median Income |
| No Earners | 265 (23.8%) | $44,776 |
| 1 Earner | 407 (36.6%) | $45,346 |
| 2 Earners | 369 (33.2%) | $85,655 |
| 3+ Earners | 70 (6.3%) | $68,654 |
| Total | 1,111 (100.0%) | $54,828 |
Household Income in Algonac
Household Income Brackets in Algonac
With 404 households falling in the category, the $50,000 to $74,999 income range is the most frequent in Algonac, accounting for 22.2% of all households. In contrast, only 66 households (3.6%) fall into the $200,000+ income bracket, making it the least populous group.
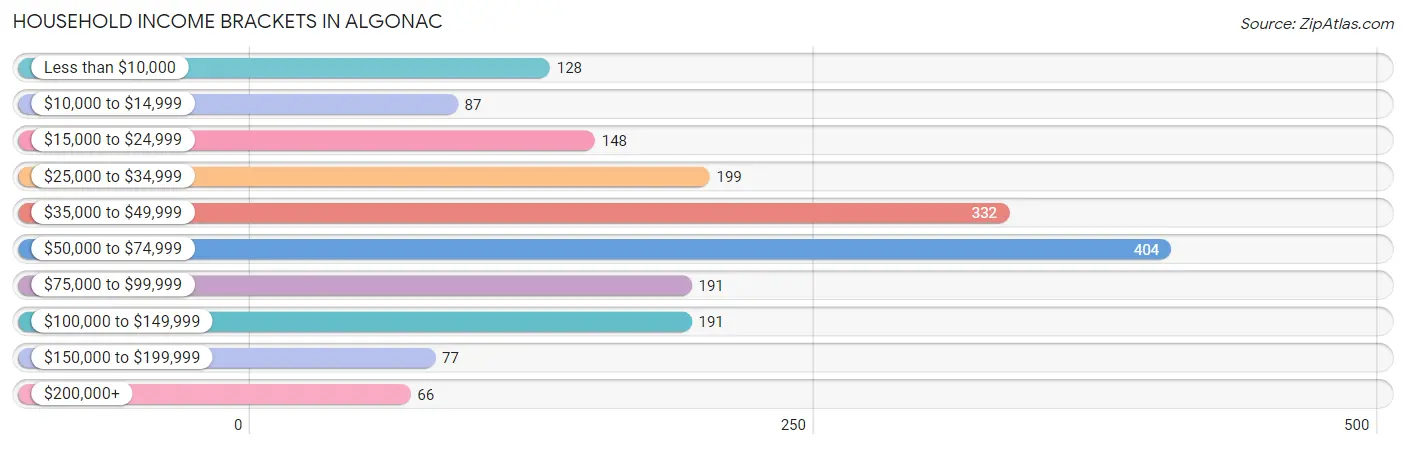
| Income Bracket | # Households | % Households |
| Less than $10,000 | 128 | 7.0% |
| $10,000 to $14,999 | 87 | 4.8% |
| $15,000 to $24,999 | 148 | 8.1% |
| $25,000 to $34,999 | 199 | 10.9% |
| $35,000 to $49,999 | 332 | 18.2% |
| $50,000 to $74,999 | 404 | 22.2% |
| $75,000 to $99,999 | 191 | 10.5% |
| $100,000 to $149,999 | 191 | 10.5% |
| $150,000 to $199,999 | 77 | 4.2% |
| $200,000+ | 66 | 3.6% |
Household Income by Householder Age in Algonac
The median household income in Algonac is $50,703, with the highest median household income of $53,590 found in the 25 to 44 years age bracket for the primary householder. A total of 468 households (25.7%) fall into this category. Meanwhile, the 15 to 24 years age bracket for the primary householder has the lowest median household income of $0, with 45 households (2.5%) in this group.
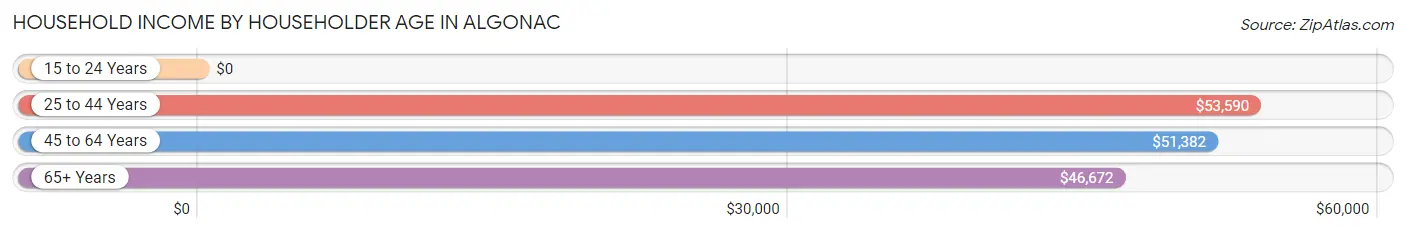
| Income Bracket | # Households | Median Income |
| 15 to 24 Years | 45 (2.5%) | $0 |
| 25 to 44 Years | 468 (25.7%) | $53,590 |
| 45 to 64 Years | 728 (40.0%) | $51,382 |
| 65+ Years | 581 (31.9%) | $46,672 |
| Total | 1,822 (100.0%) | $50,703 |
Poverty in Algonac
Income Below Poverty by Sex and Age in Algonac
With 11.5% poverty level for males and 23.0% for females among the residents of Algonac, 6 to 11 year old males and 5 year old females are the most vulnerable to poverty, with 42 males (50.6%) and 28 females (57.1%) in their respective age groups living below the poverty level.
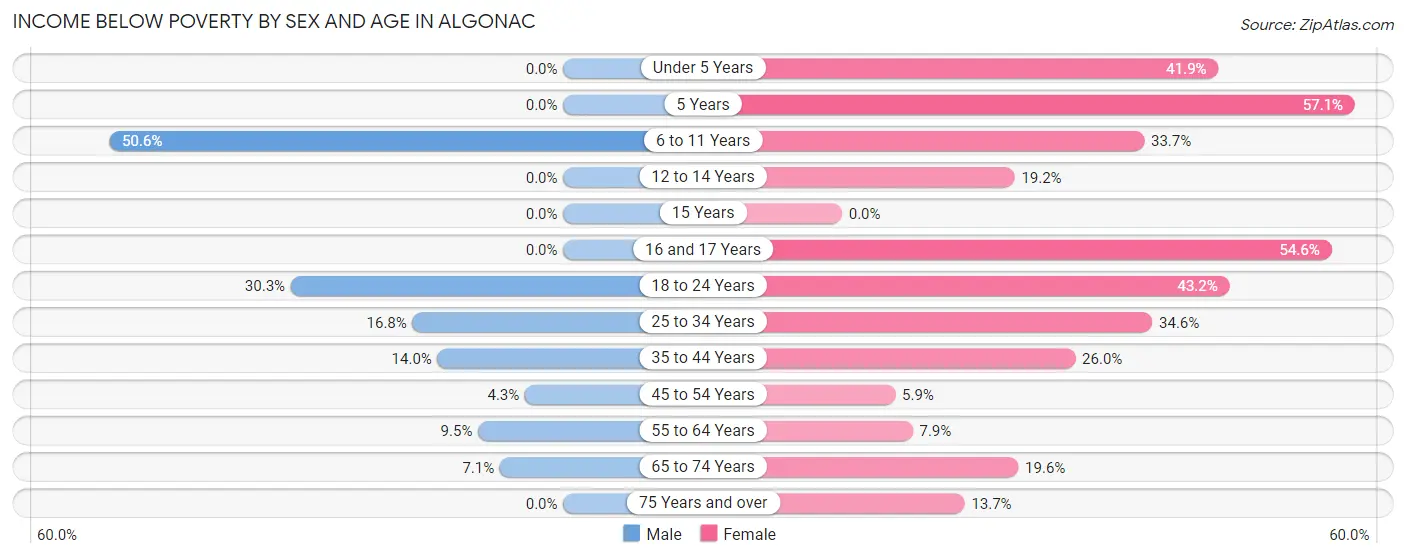
| Age Bracket | Male | Female |
| Under 5 Years | 0 (0.0%) | 65 (41.9%) |
| 5 Years | 0 (0.0%) | 28 (57.1%) |
| 6 to 11 Years | 42 (50.6%) | 69 (33.7%) |
| 12 to 14 Years | 0 (0.0%) | 10 (19.2%) |
| 15 Years | 0 (0.0%) | 0 (0.0%) |
| 16 and 17 Years | 0 (0.0%) | 6 (54.5%) |
| 18 to 24 Years | 44 (30.3%) | 57 (43.2%) |
| 25 to 34 Years | 44 (16.8%) | 94 (34.6%) |
| 35 to 44 Years | 28 (14.0%) | 59 (26.0%) |
| 45 to 54 Years | 13 (4.3%) | 12 (5.9%) |
| 55 to 64 Years | 31 (9.5%) | 36 (7.9%) |
| 65 to 74 Years | 22 (7.0%) | 33 (19.6%) |
| 75 Years and over | 0 (0.0%) | 31 (13.7%) |
| Total | 224 (11.5%) | 500 (23.0%) |
Income Above Poverty by Sex and Age in Algonac
According to the poverty statistics in Algonac, males aged under 5 years and females aged 15 years are the age groups that are most secure financially, with 100.0% of males and 100.0% of females in these age groups living above the poverty line.
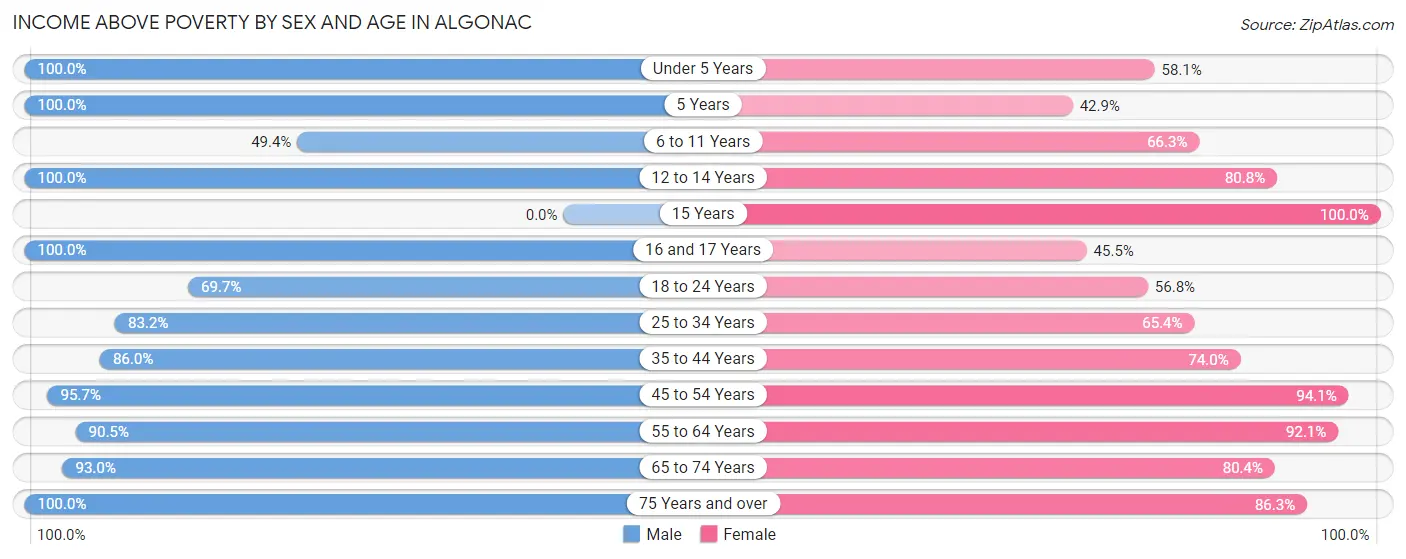
| Age Bracket | Male | Female |
| Under 5 Years | 76 (100.0%) | 90 (58.1%) |
| 5 Years | 8 (100.0%) | 21 (42.9%) |
| 6 to 11 Years | 41 (49.4%) | 136 (66.3%) |
| 12 to 14 Years | 37 (100.0%) | 42 (80.8%) |
| 15 Years | 0 (0.0%) | 17 (100.0%) |
| 16 and 17 Years | 61 (100.0%) | 5 (45.5%) |
| 18 to 24 Years | 101 (69.7%) | 75 (56.8%) |
| 25 to 34 Years | 218 (83.2%) | 178 (65.4%) |
| 35 to 44 Years | 172 (86.0%) | 168 (74.0%) |
| 45 to 54 Years | 292 (95.7%) | 190 (94.1%) |
| 55 to 64 Years | 296 (90.5%) | 421 (92.1%) |
| 65 to 74 Years | 290 (92.9%) | 135 (80.4%) |
| 75 Years and over | 137 (100.0%) | 196 (86.3%) |
| Total | 1,729 (88.5%) | 1,674 (77.0%) |
Income Below Poverty Among Married-Couple Families in Algonac
The poverty statistics for married-couple families in Algonac show that 8.0% or 60 of the total 750 families live below the poverty line. Families with 3 or 4 children have the highest poverty rate of 31.7%, comprising of 13 families. On the other hand, families with 1 or 2 children have the lowest poverty rate of 0.0%, which includes 0 families.
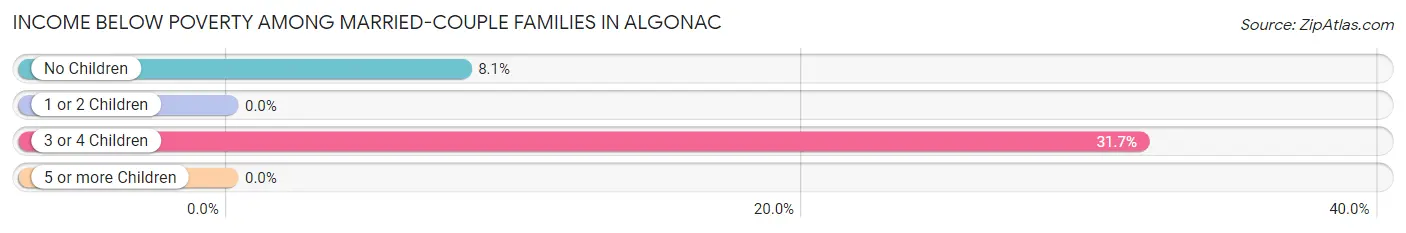
| Children | Above Poverty | Below Poverty |
| No Children | 532 (91.9%) | 47 (8.1%) |
| 1 or 2 Children | 124 (100.0%) | 0 (0.0%) |
| 3 or 4 Children | 28 (68.3%) | 13 (31.7%) |
| 5 or more Children | 6 (100.0%) | 0 (0.0%) |
| Total | 690 (92.0%) | 60 (8.0%) |
Income Below Poverty Among Single-Parent Households in Algonac
According to the poverty data in Algonac, 21.7% or 18 single-father households and 36.0% or 100 single-mother households are living below the poverty line. Among single-father households, those with 1 or 2 children have the highest poverty rate, with 18 households (36.0%) experiencing poverty. Likewise, among single-mother households, those with 1 or 2 children have the highest poverty rate, with 90 households (55.6%) falling below the poverty line.
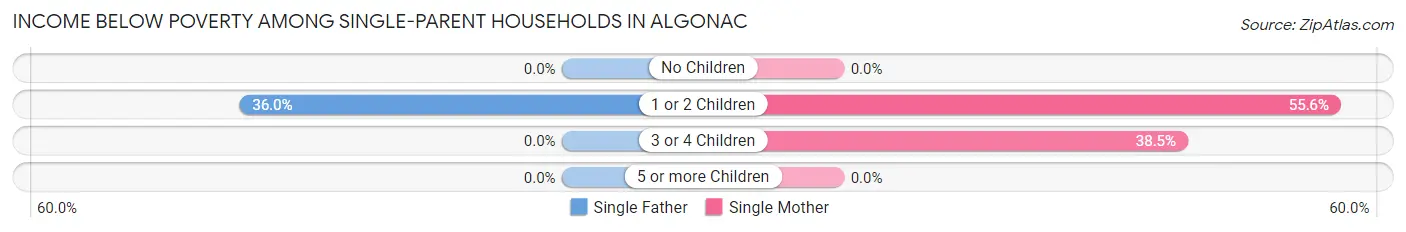
| Children | Single Father | Single Mother |
| No Children | 0 (0.0%) | 0 (0.0%) |
| 1 or 2 Children | 18 (36.0%) | 90 (55.6%) |
| 3 or 4 Children | 0 (0.0%) | 10 (38.5%) |
| 5 or more Children | 0 (0.0%) | 0 (0.0%) |
| Total | 18 (21.7%) | 100 (36.0%) |
Income Below Poverty Among Married-Couple vs Single-Parent Households in Algonac
The poverty data for Algonac shows that 60 of the married-couple family households (8.0%) and 118 of the single-parent households (32.7%) are living below the poverty level. Within the married-couple family households, those with 3 or 4 children have the highest poverty rate, with 13 households (31.7%) falling below the poverty line. Among the single-parent households, those with 1 or 2 children have the highest poverty rate, with 108 household (50.9%) living below poverty.
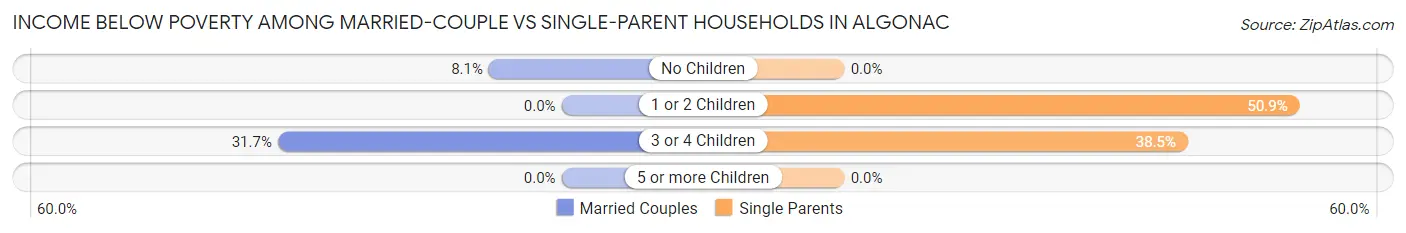
| Children | Married-Couple Families | Single-Parent Households |
| No Children | 47 (8.1%) | 0 (0.0%) |
| 1 or 2 Children | 0 (0.0%) | 108 (50.9%) |
| 3 or 4 Children | 13 (31.7%) | 10 (38.5%) |
| 5 or more Children | 0 (0.0%) | 0 (0.0%) |
| Total | 60 (8.0%) | 118 (32.7%) |
Race in Algonac
The most populous races in Algonac are White / Caucasian (3,870 | 92.9%), Two or more Races (254 | 6.1%), and Hispanic or Latino (122 | 2.9%).
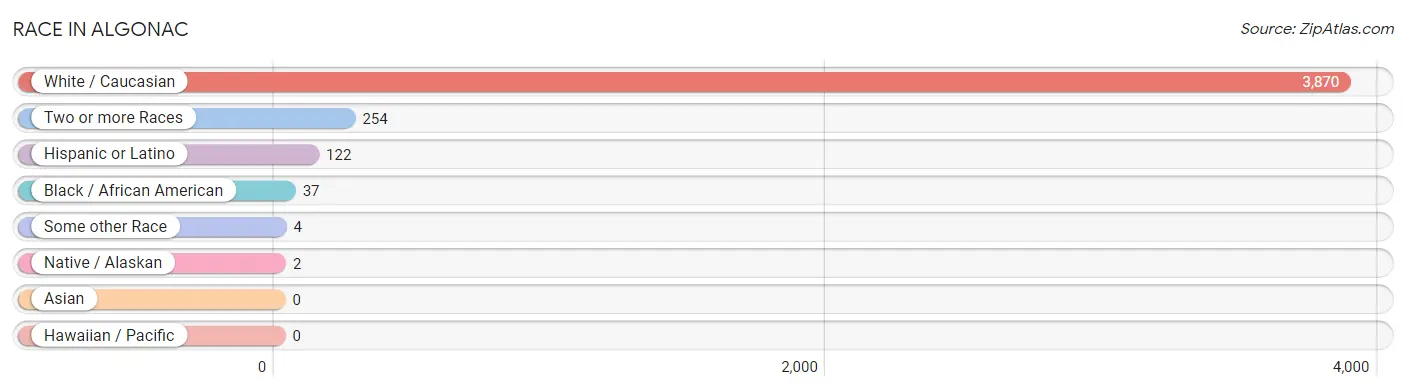
| Race | # Population | % Population |
| Asian | 0 | 0.0% |
| Black / African American | 37 | 0.9% |
| Hawaiian / Pacific | 0 | 0.0% |
| Hispanic or Latino | 122 | 2.9% |
| Native / Alaskan | 2 | 0.1% |
| White / Caucasian | 3,870 | 92.9% |
| Two or more Races | 254 | 6.1% |
| Some other Race | 4 | 0.1% |
| Total | 4,167 | 100.0% |
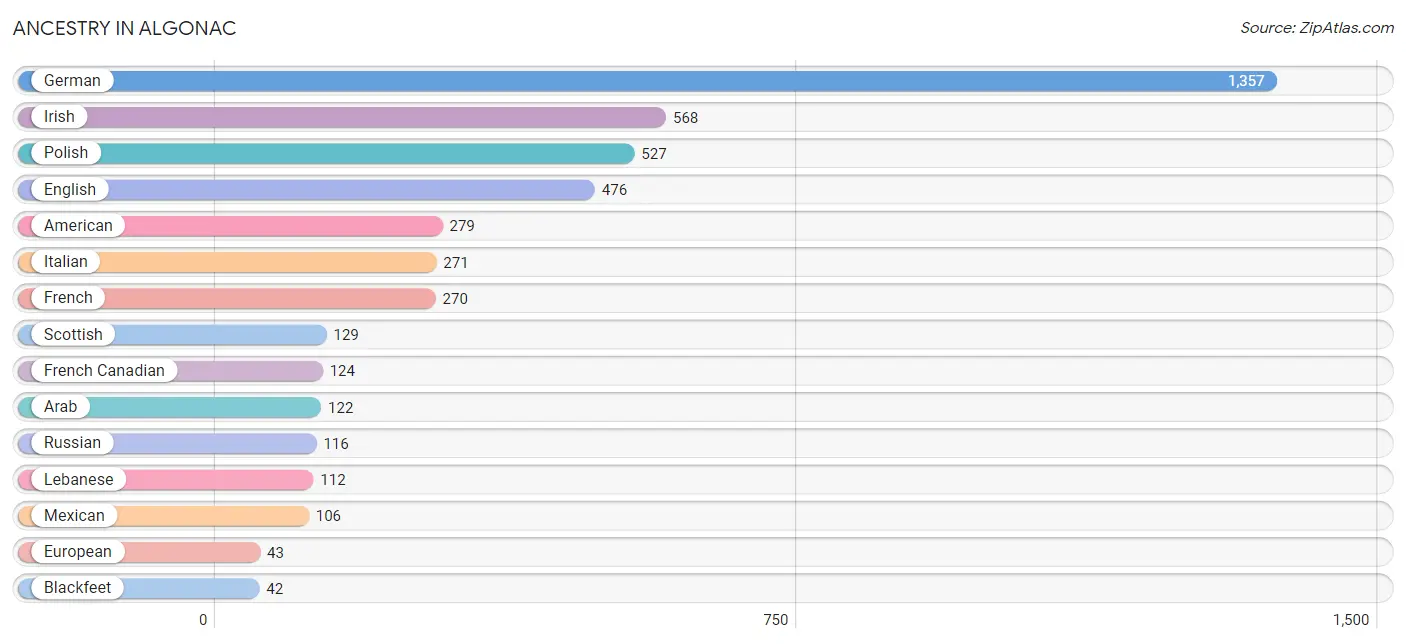
Ancestry in Algonac
The most populous ancestries reported in Algonac are German (1,357 | 32.6%), Irish (568 | 13.6%), Polish (527 | 12.7%), English (476 | 11.4%), and American (279 | 6.7%), together accounting for 77.0% of all Algonac residents.
| Ancestry | # Population | % Population |
| American | 279 | 6.7% |
| Arab | 122 | 2.9% |
| Austrian | 10 | 0.2% |
| Belgian | 40 | 1.0% |
| Blackfeet | 42 | 1.0% |
| British | 11 | 0.3% |
| Canadian | 24 | 0.6% |
| Central American | 1 | 0.0% |
| Cherokee | 3 | 0.1% |
| Chippewa | 2 | 0.1% |
| Czech | 1 | 0.0% |
| Dutch | 36 | 0.9% |
| English | 476 | 11.4% |
| European | 43 | 1.0% |
| French | 270 | 6.5% |
| French Canadian | 124 | 3.0% |
| German | 1,357 | 32.6% |
| Greek | 33 | 0.8% |
| Irish | 568 | 13.6% |
| Italian | 271 | 6.5% |
| Lebanese | 112 | 2.7% |
| Maltese | 22 | 0.5% |
| Mexican | 106 | 2.5% |
| Norwegian | 22 | 0.5% |
| Ottawa | 2 | 0.1% |
| Panamanian | 1 | 0.0% |
| Polish | 527 | 12.7% |
| Romanian | 36 | 0.9% |
| Russian | 116 | 2.8% |
| Scottish | 129 | 3.1% |
| Slavic | 11 | 0.3% |
| South American Indian | 4 | 0.1% |
| Spaniard | 11 | 0.3% |
| Swedish | 10 | 0.2% |
| Swiss | 11 | 0.3% |
| Syrian | 10 | 0.2% |
| Ukrainian | 24 | 0.6% |
| Welsh | 12 | 0.3% | View All 38 Rows |
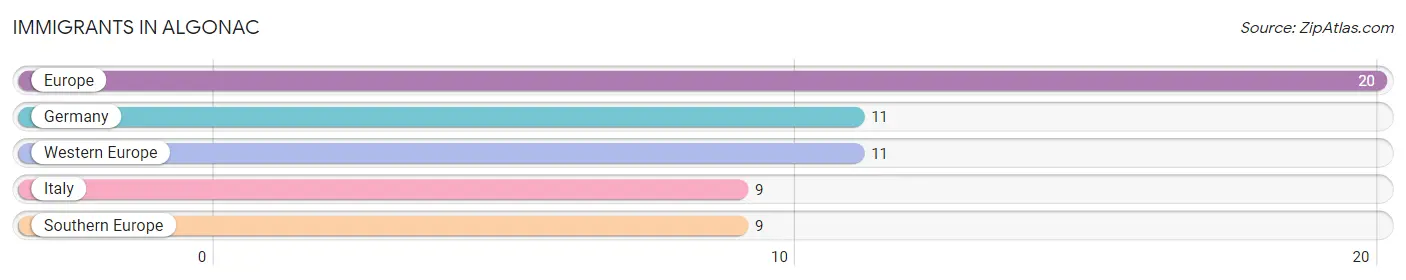
Immigrants in Algonac
The most numerous immigrant groups reported in Algonac came from Europe (20 | 0.5%), Germany (11 | 0.3%), Western Europe (11 | 0.3%), Italy (9 | 0.2%), and Southern Europe (9 | 0.2%), together accounting for 1.4% of all Algonac residents.
| Immigration Origin | # Population | % Population |
| Europe | 20 | 0.5% |
| Germany | 11 | 0.3% |
| Italy | 9 | 0.2% |
| Southern Europe | 9 | 0.2% |
| Western Europe | 11 | 0.3% | View All 5 Rows |
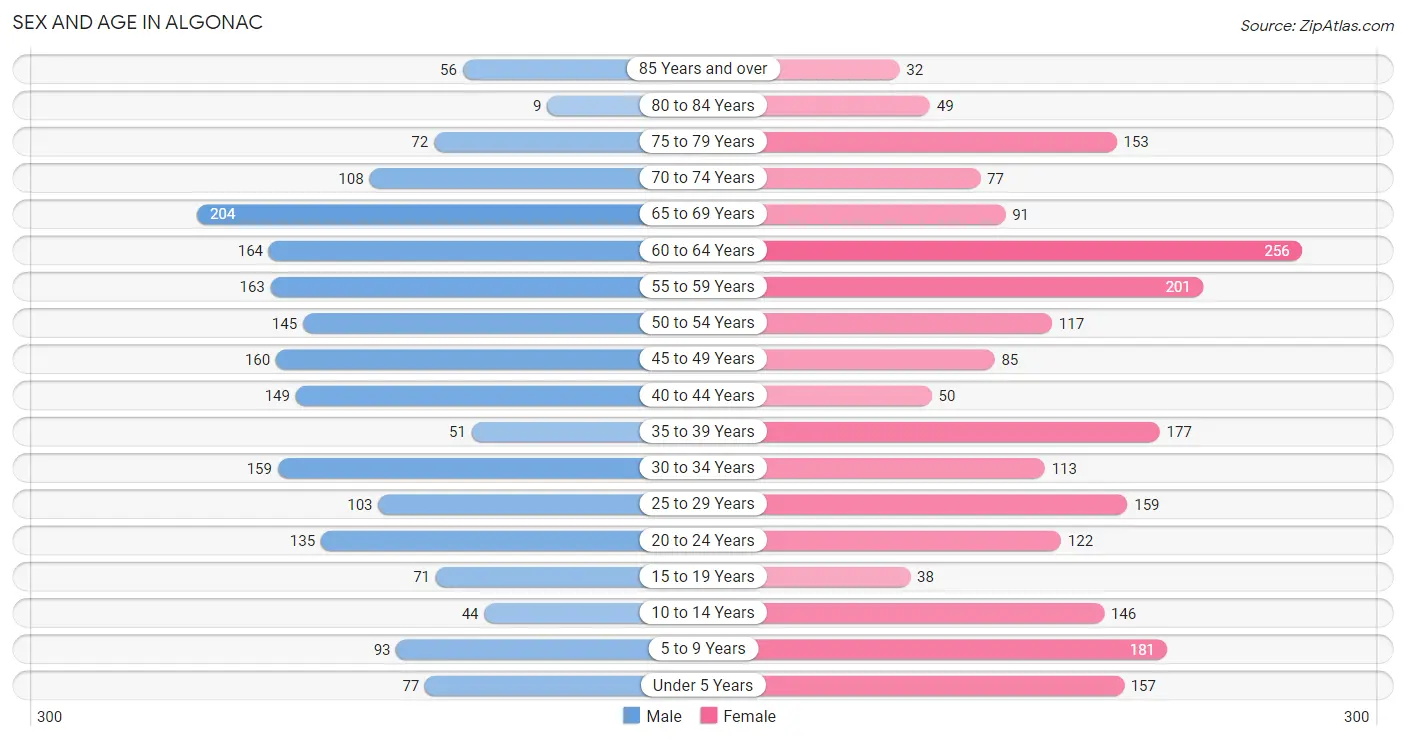
Sex and Age in Algonac
Sex and Age in Algonac
The most populous age groups in Algonac are 65 to 69 Years (204 | 10.4%) for men and 60 to 64 Years (256 | 11.6%) for women.
| Age Bracket | Male | Female |
| Under 5 Years | 77 (3.9%) | 157 (7.1%) |
| 5 to 9 Years | 93 (4.7%) | 181 (8.2%) |
| 10 to 14 Years | 44 (2.2%) | 146 (6.6%) |
| 15 to 19 Years | 71 (3.6%) | 38 (1.7%) |
| 20 to 24 Years | 135 (6.9%) | 122 (5.5%) |
| 25 to 29 Years | 103 (5.2%) | 159 (7.2%) |
| 30 to 34 Years | 159 (8.1%) | 113 (5.1%) |
| 35 to 39 Years | 51 (2.6%) | 177 (8.0%) |
| 40 to 44 Years | 149 (7.6%) | 50 (2.3%) |
| 45 to 49 Years | 160 (8.2%) | 85 (3.9%) |
| 50 to 54 Years | 145 (7.4%) | 117 (5.3%) |
| 55 to 59 Years | 163 (8.3%) | 201 (9.1%) |
| 60 to 64 Years | 164 (8.4%) | 256 (11.6%) |
| 65 to 69 Years | 204 (10.4%) | 91 (4.1%) |
| 70 to 74 Years | 108 (5.5%) | 77 (3.5%) |
| 75 to 79 Years | 72 (3.7%) | 153 (6.9%) |
| 80 to 84 Years | 9 (0.5%) | 49 (2.2%) |
| 85 Years and over | 56 (2.9%) | 32 (1.5%) |
| Total | 1,963 (100.0%) | 2,204 (100.0%) |
Families and Households in Algonac
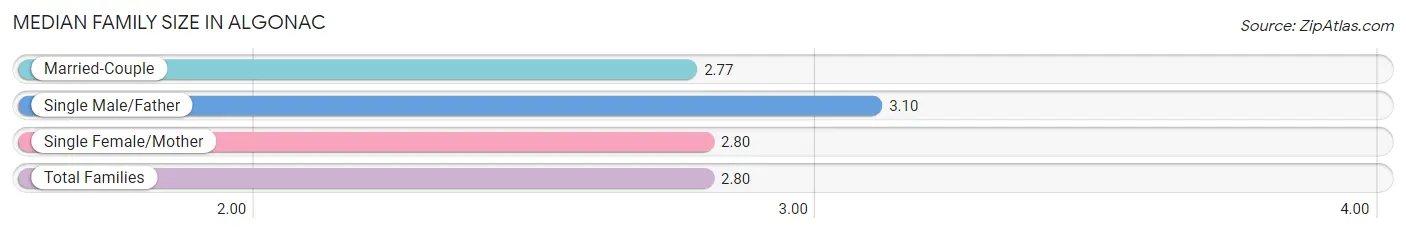
Median Family Size in Algonac
The median family size in Algonac is 2.80 persons per family, with single male/father families (83 | 7.5%) accounting for the largest median family size of 3.1 persons per family. On the other hand, married-couple families (750 | 67.5%) represent the smallest median family size with 2.77 persons per family.
| Family Type | # Families | Family Size |
| Married-Couple | 750 (67.5%) | 2.77 |
| Single Male/Father | 83 (7.5%) | 3.10 |
| Single Female/Mother | 278 (25.0%) | 2.80 |
| Total Families | 1,111 (100.0%) | 2.80 |
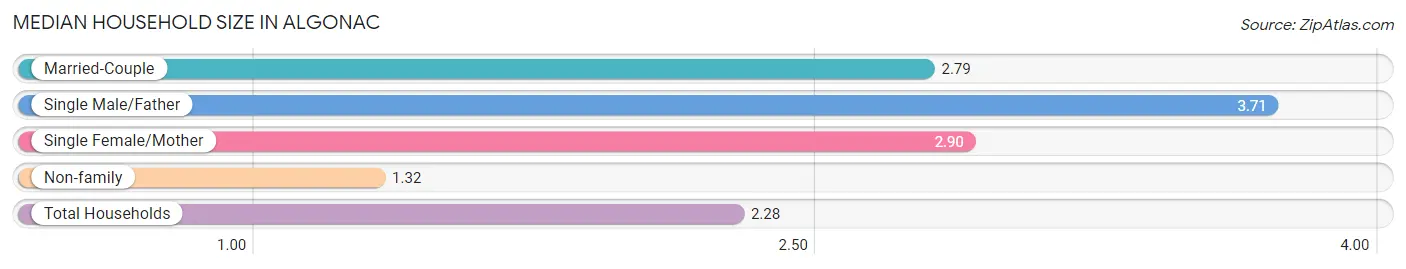
Median Household Size in Algonac
The median household size in Algonac is 2.28 persons per household, with single male/father households (83 | 4.6%) accounting for the largest median household size of 3.71 persons per household. non-family households (711 | 39.0%) represent the smallest median household size with 1.32 persons per household.
| Household Type | # Households | Household Size |
| Married-Couple | 750 (41.2%) | 2.79 |
| Single Male/Father | 83 (4.6%) | 3.71 |
| Single Female/Mother | 278 (15.3%) | 2.90 |
| Non-family | 711 (39.0%) | 1.32 |
| Total Households | 1,822 (100.0%) | 2.28 |
Household Size by Marriage Status in Algonac
Out of a total of 1,822 households in Algonac, 1,111 (61.0%) are family households, while 711 (39.0%) are nonfamily households. The most numerous type of family households are 2-person households, comprising 615, and the most common type of nonfamily households are 1-person households, comprising 605.
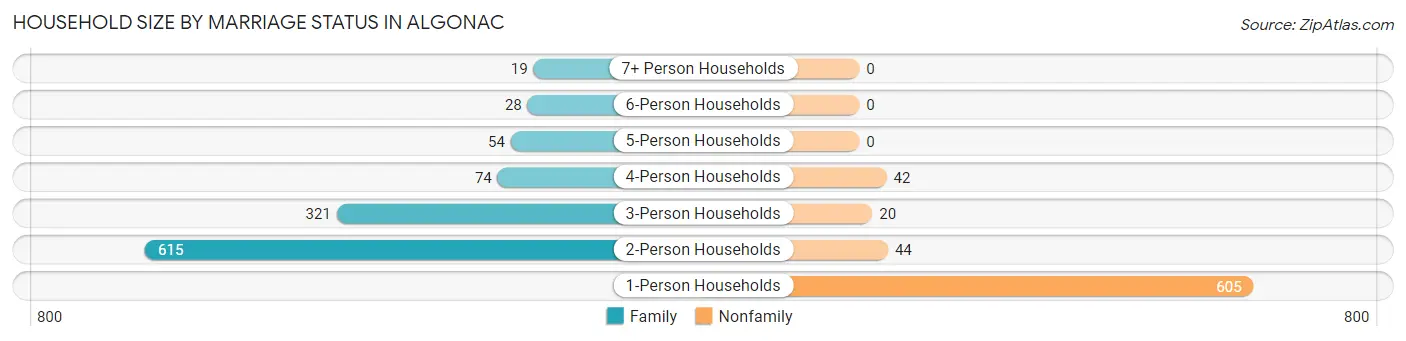
| Household Size | Family Households | Nonfamily Households |
| 1-Person Households | - | 605 (33.2%) |
| 2-Person Households | 615 (33.8%) | 44 (2.4%) |
| 3-Person Households | 321 (17.6%) | 20 (1.1%) |
| 4-Person Households | 74 (4.1%) | 42 (2.3%) |
| 5-Person Households | 54 (3.0%) | 0 (0.0%) |
| 6-Person Households | 28 (1.5%) | 0 (0.0%) |
| 7+ Person Households | 19 (1.0%) | 0 (0.0%) |
| Total | 1,111 (61.0%) | 711 (39.0%) |
Female Fertility in Algonac
Fertility by Age in Algonac
Average fertility rate in Algonac is 74.0 births per 1,000 women. Women in the age bracket of 20 to 34 years have the highest fertility rate with 142.0 births per 1,000 women. Women in the age bracket of 20 to 34 years acount for 100.0% of all women with births.
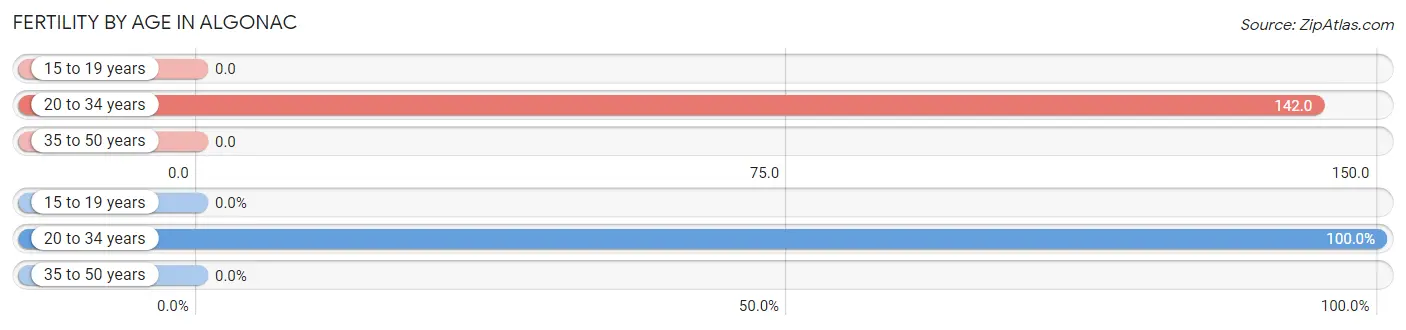
| Age Bracket | Women with Births | Births / 1,000 Women |
| 15 to 19 years | 0 (0.0%) | 0.0 |
| 20 to 34 years | 56 (100.0%) | 142.0 |
| 35 to 50 years | 0 (0.0%) | 0.0 |
| Total | 56 (100.0%) | 74.0 |
Fertility by Age by Marriage Status in Algonac
41.1% of women with births (56) in Algonac are married. The highest percentage of unmarried women with births falls into 20 to 34 years age bracket with 58.9% of them unmarried at the time of birth, while the lowest percentage of unmarried women with births belong to 20 to 34 years age bracket with 58.9% of them unmarried.
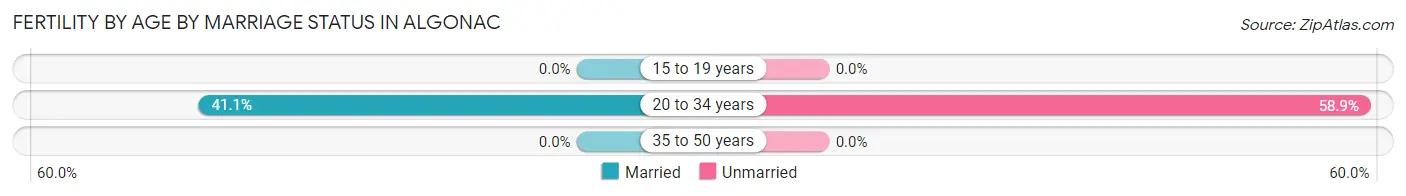
| Age Bracket | Married | Unmarried |
| 15 to 19 years | 0 (0.0%) | 0 (0.0%) |
| 20 to 34 years | 23 (41.1%) | 33 (58.9%) |
| 35 to 50 years | 0 (0.0%) | 0 (0.0%) |
| Total | 23 (41.1%) | 33 (58.9%) |
Fertility by Education in Algonac
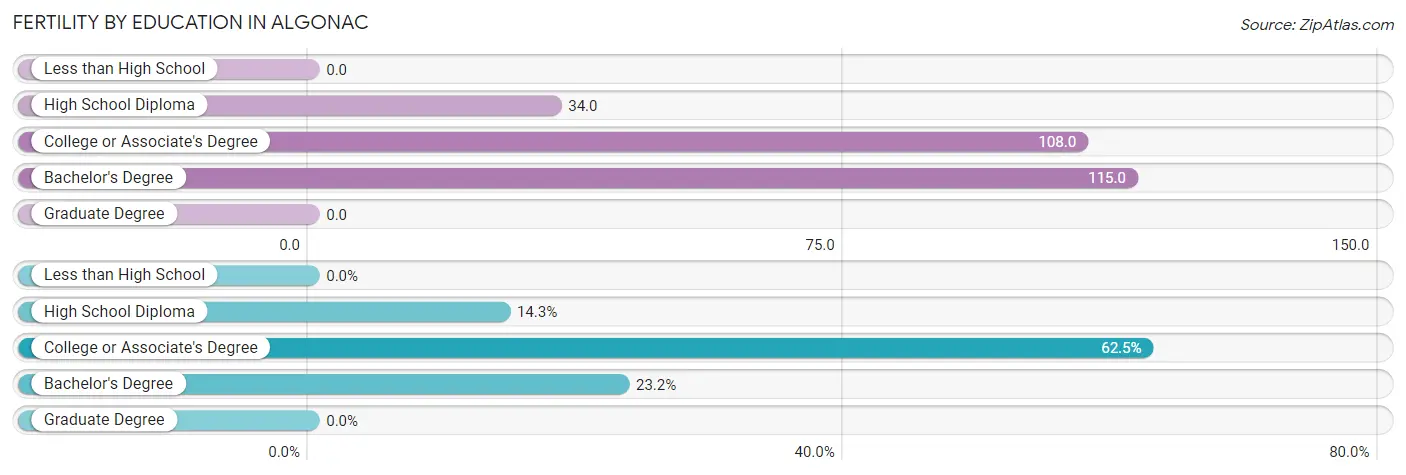
| Educational Attainment | Women with Births | Births / 1,000 Women |
| Less than High School | 0 (0.0%) | 0.0 |
| High School Diploma | 8 (14.3%) | 34.0 |
| College or Associate's Degree | 35 (62.5%) | 108.0 |
| Bachelor's Degree | 13 (23.2%) | 115.0 |
| Graduate Degree | 0 (0.0%) | 0.0 |
| Total | 56 (100.0%) | 74.0 |
Fertility by Education by Marriage Status in Algonac
58.9% of women with births in Algonac are unmarried. Women with the educational attainment of bachelor's degree are most likely to be married with 100.0% of them married at childbirth, while women with the educational attainment of high school diploma are least likely to be married with 100.0% of them unmarried at childbirth.
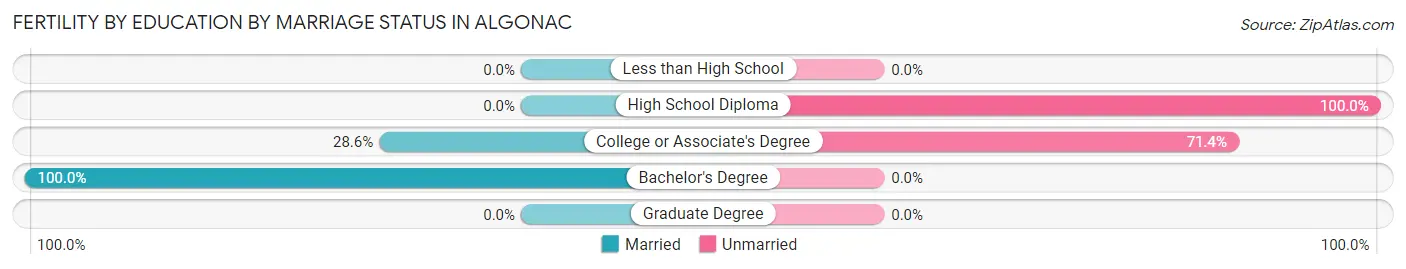
| Educational Attainment | Married | Unmarried |
| Less than High School | 0 (0.0%) | 0 (0.0%) |
| High School Diploma | 0 (0.0%) | 8 (100.0%) |
| College or Associate's Degree | 10 (28.6%) | 25 (71.4%) |
| Bachelor's Degree | 13 (100.0%) | 0 (0.0%) |
| Graduate Degree | 0 (0.0%) | 0 (0.0%) |
| Total | 23 (41.1%) | 33 (58.9%) |
Employment Characteristics in Algonac
Employment by Class of Employer in Algonac
Among the 1,874 employed individuals in Algonac, private company employees (1,224 | 65.3%), not-for-profit organizations (166 | 8.9%), and local government employees (134 | 7.1%) make up the most common classes of employment.
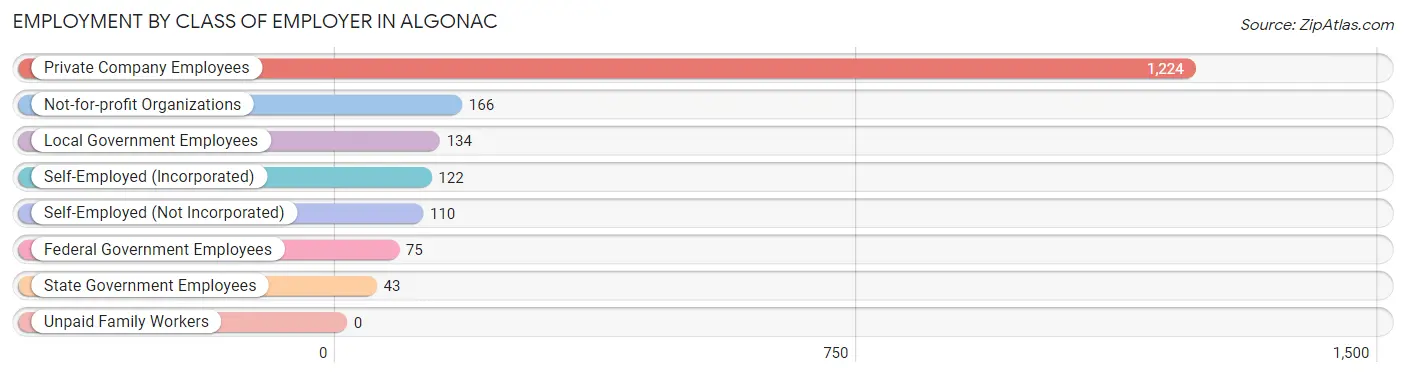
| Employer Class | # Employees | % Employees |
| Private Company Employees | 1,224 | 65.3% |
| Self-Employed (Incorporated) | 122 | 6.5% |
| Self-Employed (Not Incorporated) | 110 | 5.9% |
| Not-for-profit Organizations | 166 | 8.9% |
| Local Government Employees | 134 | 7.1% |
| State Government Employees | 43 | 2.3% |
| Federal Government Employees | 75 | 4.0% |
| Unpaid Family Workers | 0 | 0.0% |
| Total | 1,874 | 100.0% |
Employment Status by Age in Algonac
According to the labor force statistics for Algonac, out of the total population over 16 years of age (3,452), 58.8% or 2,030 individuals are in the labor force, with 6.0% or 122 of them unemployed. The age group with the highest labor force participation rate is 30 to 34 years, with 93.0% or 253 individuals in the labor force. Within the labor force, the 65 to 74 years age range has the highest percentage of unemployed individuals, with 37.7% or 26 of them being unemployed.
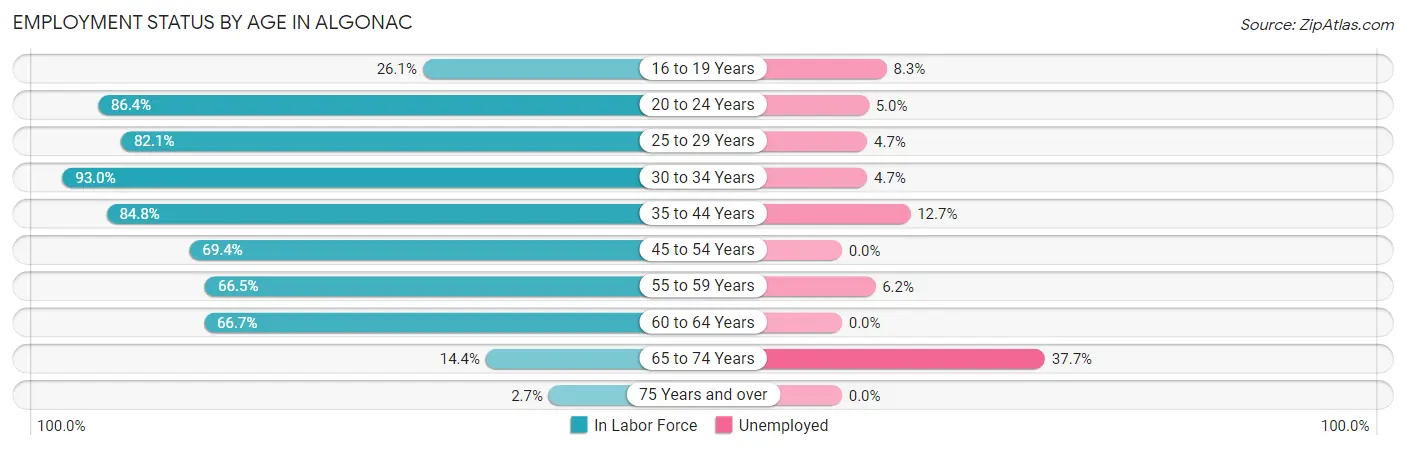
| Age Bracket | In Labor Force | Unemployed |
| 16 to 19 Years | 24 (26.1%) | 2 (8.3%) |
| 20 to 24 Years | 222 (86.4%) | 11 (5.0%) |
| 25 to 29 Years | 215 (82.1%) | 10 (4.7%) |
| 30 to 34 Years | 253 (93.0%) | 12 (4.7%) |
| 35 to 44 Years | 362 (84.8%) | 46 (12.7%) |
| 45 to 54 Years | 352 (69.4%) | 0 (0.0%) |
| 55 to 59 Years | 242 (66.5%) | 15 (6.2%) |
| 60 to 64 Years | 280 (66.7%) | 0 (0.0%) |
| 65 to 74 Years | 69 (14.4%) | 26 (37.7%) |
| 75 Years and over | 10 (2.7%) | 0 (0.0%) |
| Total | 2,030 (58.8%) | 122 (6.0%) |
Employment Status by Educational Attainment in Algonac
According to labor force statistics for Algonac, 75.7% of individuals (1,705) out of the total population between 25 and 64 years of age (2,252) are in the labor force, with 4.9% or 84 of them being unemployed. The group with the highest labor force participation rate are those with the educational attainment of bachelor's degree or higher, with 86.4% or 343 individuals in the labor force. Within the labor force, individuals with high school diploma education have the highest percentage of unemployment, with 7.5% or 46 of them being unemployed.
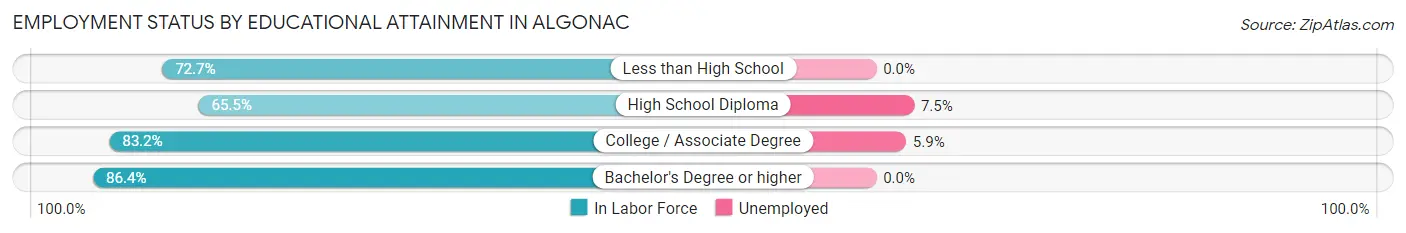
| Educational Attainment | In Labor Force | Unemployed |
| Less than High School | 120 (72.7%) | 0 (0.0%) |
| High School Diploma | 611 (65.5%) | 70 (7.5%) |
| College / Associate Degree | 630 (83.2%) | 45 (5.9%) |
| Bachelor's Degree or higher | 343 (86.4%) | 0 (0.0%) |
| Total | 1,705 (75.7%) | 110 (4.9%) |
Employment Occupations by Sex in Algonac
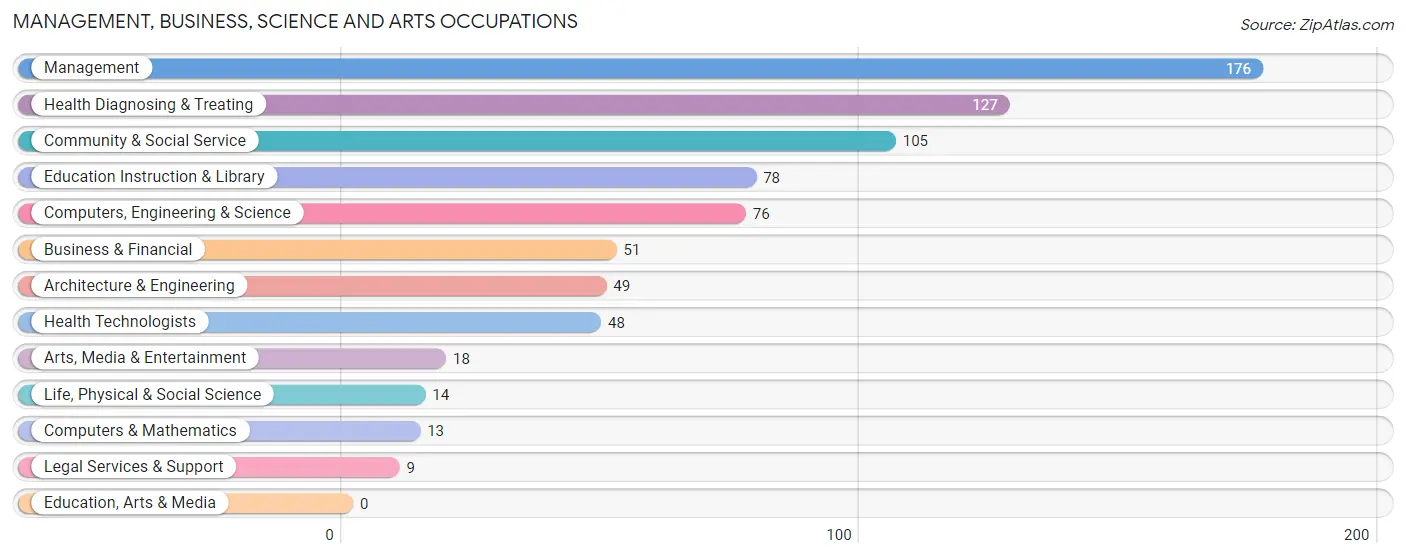
Management, Business, Science and Arts Occupations
The most common Management, Business, Science and Arts occupations in Algonac are Management (176 | 9.2%), Health Diagnosing & Treating (127 | 6.7%), Community & Social Service (105 | 5.5%), Education Instruction & Library (78 | 4.1%), and Computers, Engineering & Science (76 | 4.0%).
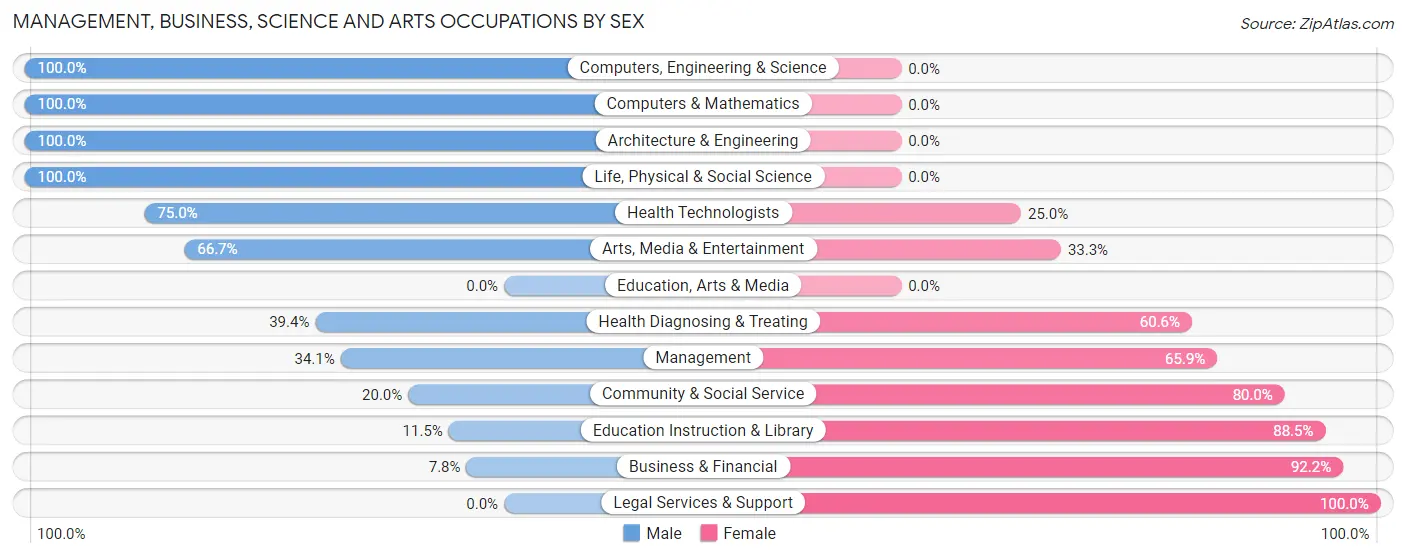
Management, Business, Science and Arts Occupations by Sex
Within the Management, Business, Science and Arts occupations in Algonac, the most male-oriented occupations are Computers, Engineering & Science (100.0%), Computers & Mathematics (100.0%), and Architecture & Engineering (100.0%), while the most female-oriented occupations are Legal Services & Support (100.0%), Business & Financial (92.2%), and Education Instruction & Library (88.5%).
| Occupation | Male | Female |
| Management | 60 (34.1%) | 116 (65.9%) |
| Business & Financial | 4 (7.8%) | 47 (92.2%) |
| Computers, Engineering & Science | 76 (100.0%) | 0 (0.0%) |
| Computers & Mathematics | 13 (100.0%) | 0 (0.0%) |
| Architecture & Engineering | 49 (100.0%) | 0 (0.0%) |
| Life, Physical & Social Science | 14 (100.0%) | 0 (0.0%) |
| Community & Social Service | 21 (20.0%) | 84 (80.0%) |
| Education, Arts & Media | 0 (0.0%) | 0 (0.0%) |
| Legal Services & Support | 0 (0.0%) | 9 (100.0%) |
| Education Instruction & Library | 9 (11.5%) | 69 (88.5%) |
| Arts, Media & Entertainment | 12 (66.7%) | 6 (33.3%) |
| Health Diagnosing & Treating | 50 (39.4%) | 77 (60.6%) |
| Health Technologists | 36 (75.0%) | 12 (25.0%) |
| Total (Category) | 211 (39.4%) | 324 (60.6%) |
| Total (Overall) | 995 (52.2%) | 912 (47.8%) |
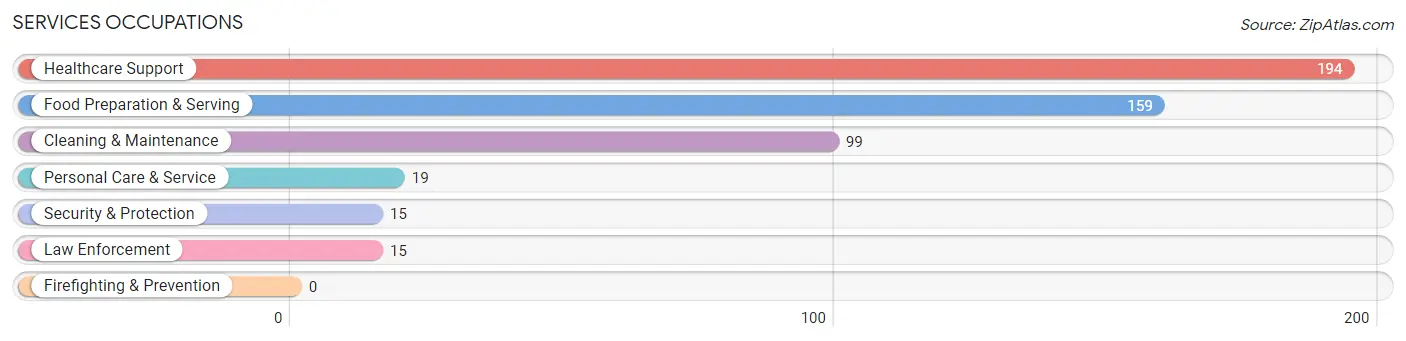
Services Occupations
The most common Services occupations in Algonac are Healthcare Support (194 | 10.2%), Food Preparation & Serving (159 | 8.3%), Cleaning & Maintenance (99 | 5.2%), Personal Care & Service (19 | 1.0%), and Security & Protection (15 | 0.8%).
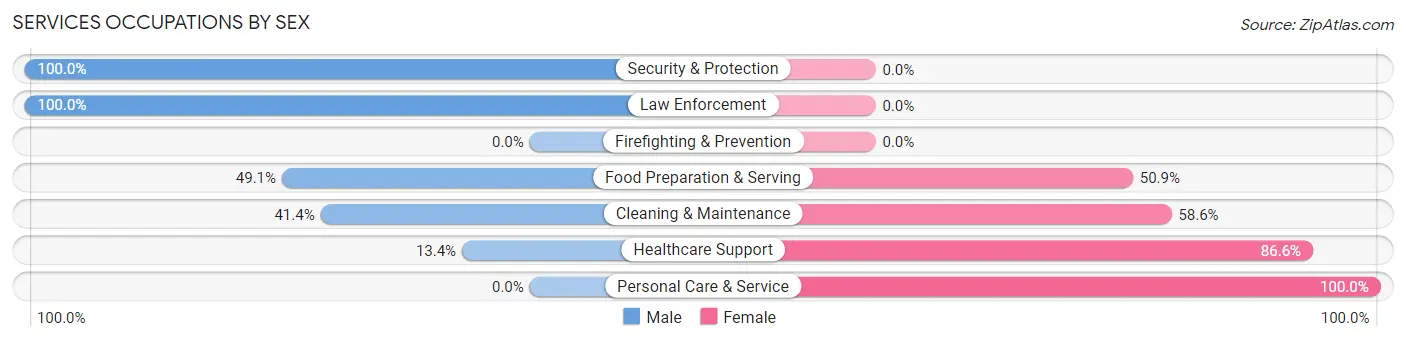
Services Occupations by Sex
Within the Services occupations in Algonac, the most male-oriented occupations are Security & Protection (100.0%), Law Enforcement (100.0%), and Food Preparation & Serving (49.1%), while the most female-oriented occupations are Personal Care & Service (100.0%), Healthcare Support (86.6%), and Cleaning & Maintenance (58.6%).
| Occupation | Male | Female |
| Healthcare Support | 26 (13.4%) | 168 (86.6%) |
| Security & Protection | 15 (100.0%) | 0 (0.0%) |
| Firefighting & Prevention | 0 (0.0%) | 0 (0.0%) |
| Law Enforcement | 15 (100.0%) | 0 (0.0%) |
| Food Preparation & Serving | 78 (49.1%) | 81 (50.9%) |
| Cleaning & Maintenance | 41 (41.4%) | 58 (58.6%) |
| Personal Care & Service | 0 (0.0%) | 19 (100.0%) |
| Total (Category) | 160 (32.9%) | 326 (67.1%) |
| Total (Overall) | 995 (52.2%) | 912 (47.8%) |
Sales and Office Occupations
The most common Sales and Office occupations in Algonac are Sales & Related (209 | 11.0%), and Office & Administration (154 | 8.1%).
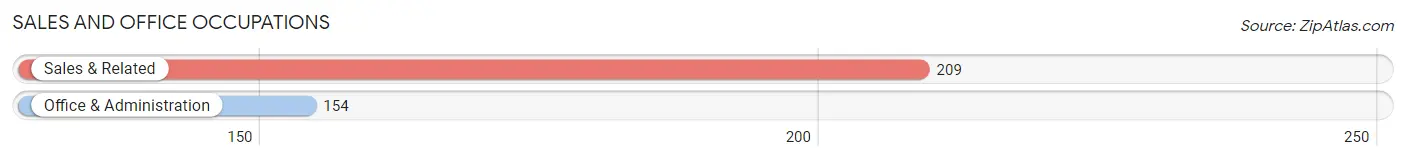
Sales and Office Occupations by Sex
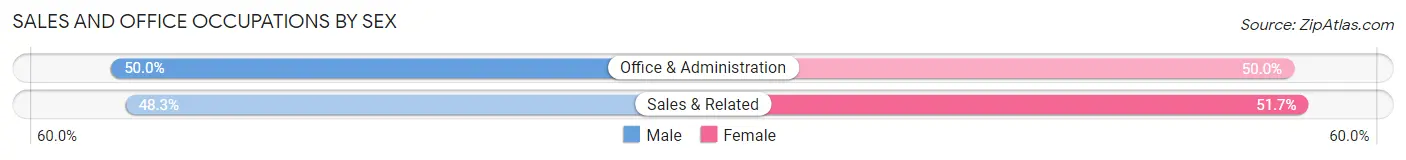
| Occupation | Male | Female |
| Sales & Related | 101 (48.3%) | 108 (51.7%) |
| Office & Administration | 77 (50.0%) | 77 (50.0%) |
| Total (Category) | 178 (49.0%) | 185 (51.0%) |
| Total (Overall) | 995 (52.2%) | 912 (47.8%) |
Natural Resources, Construction and Maintenance Occupations
The most common Natural Resources, Construction and Maintenance occupations in Algonac are Construction & Extraction (176 | 9.2%), and Installation, Maintenance & Repair (89 | 4.7%).
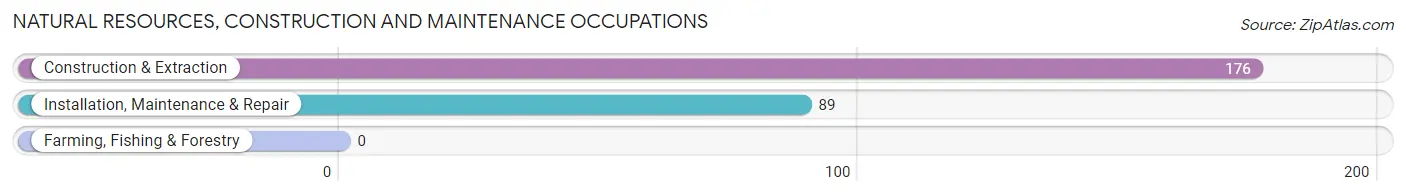
Natural Resources, Construction and Maintenance Occupations by Sex
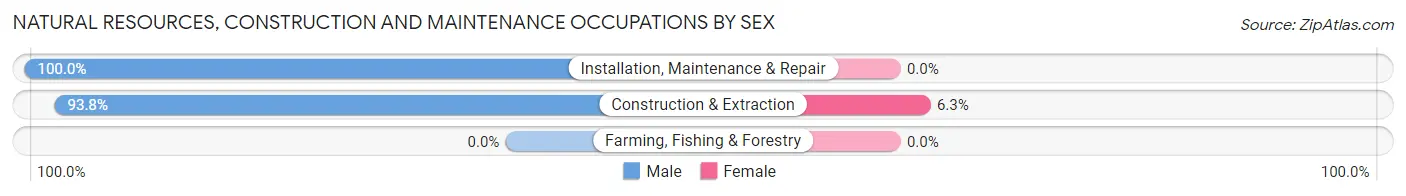
| Occupation | Male | Female |
| Farming, Fishing & Forestry | 0 (0.0%) | 0 (0.0%) |
| Construction & Extraction | 165 (93.8%) | 11 (6.2%) |
| Installation, Maintenance & Repair | 89 (100.0%) | 0 (0.0%) |
| Total (Category) | 254 (95.9%) | 11 (4.2%) |
| Total (Overall) | 995 (52.2%) | 912 (47.8%) |
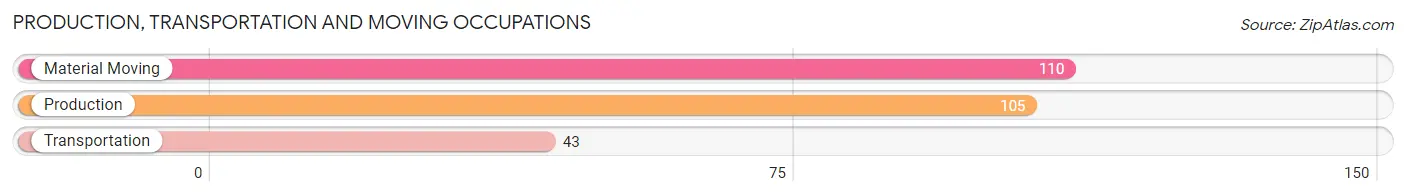
Production, Transportation and Moving Occupations
The most common Production, Transportation and Moving occupations in Algonac are Material Moving (110 | 5.8%), Production (105 | 5.5%), and Transportation (43 | 2.2%).
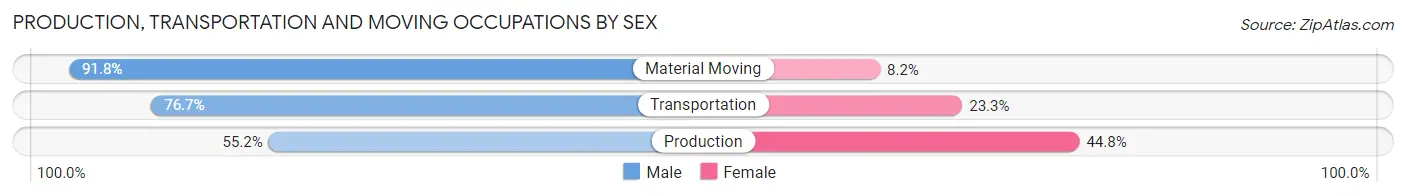
Production, Transportation and Moving Occupations by Sex
| Occupation | Male | Female |
| Production | 58 (55.2%) | 47 (44.8%) |
| Transportation | 33 (76.7%) | 10 (23.3%) |
| Material Moving | 101 (91.8%) | 9 (8.2%) |
| Total (Category) | 192 (74.4%) | 66 (25.6%) |
| Total (Overall) | 995 (52.2%) | 912 (47.8%) |
Employment Industries by Sex in Algonac
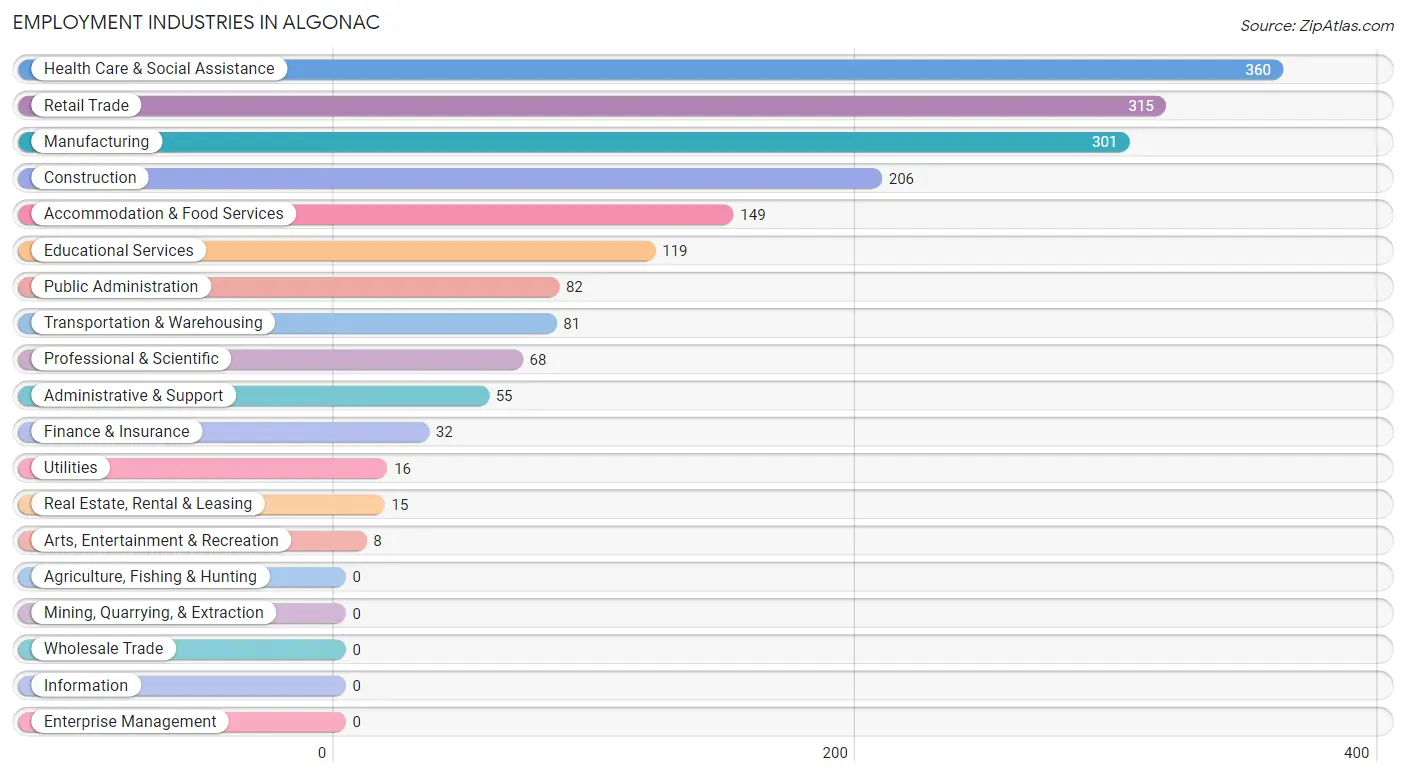
Employment Industries in Algonac
The major employment industries in Algonac include Health Care & Social Assistance (360 | 18.9%), Retail Trade (315 | 16.5%), Manufacturing (301 | 15.8%), Construction (206 | 10.8%), and Accommodation & Food Services (149 | 7.8%).
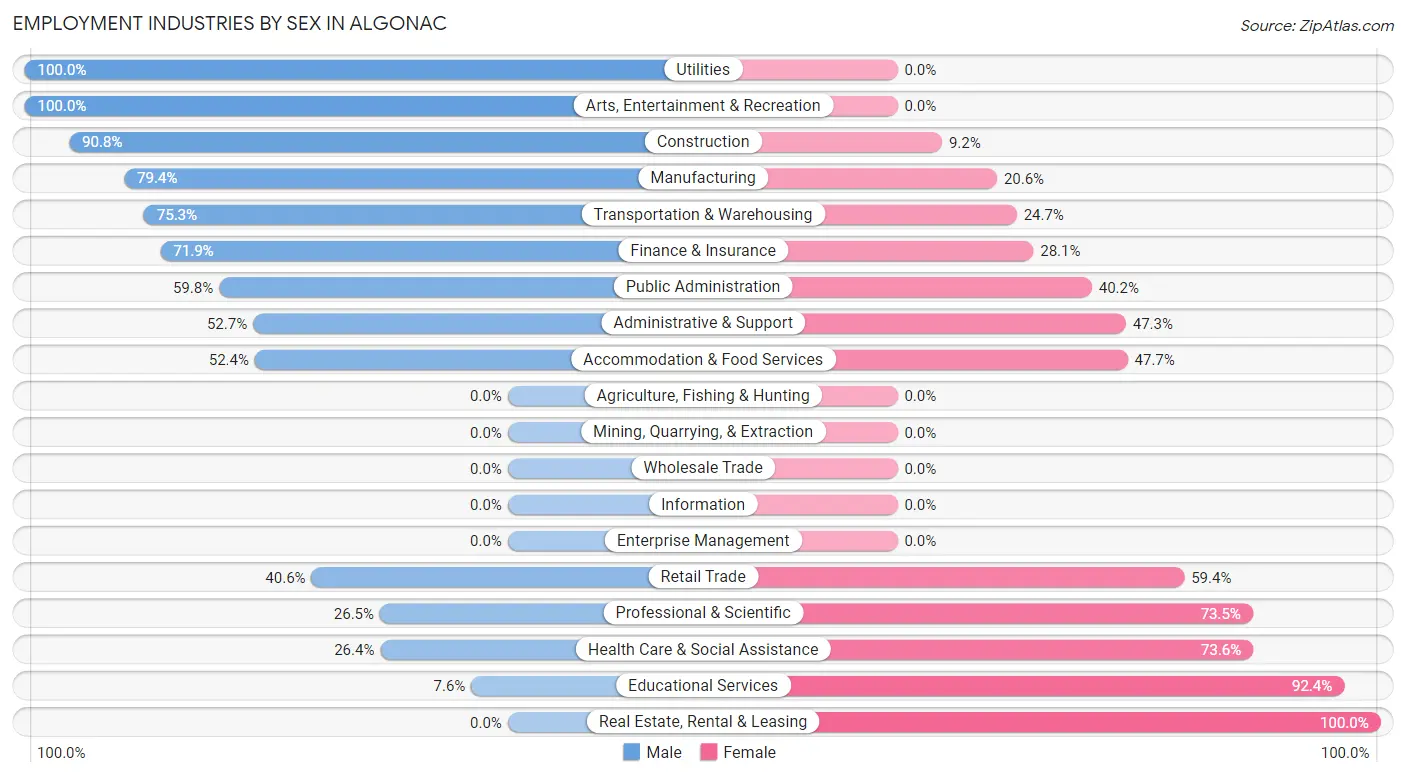
Employment Industries by Sex in Algonac
The Algonac industries that see more men than women are Utilities (100.0%), Arts, Entertainment & Recreation (100.0%), and Construction (90.8%), whereas the industries that tend to have a higher number of women are Real Estate, Rental & Leasing (100.0%), Educational Services (92.4%), and Health Care & Social Assistance (73.6%).
| Industry | Male | Female |
| Agriculture, Fishing & Hunting | 0 (0.0%) | 0 (0.0%) |
| Mining, Quarrying, & Extraction | 0 (0.0%) | 0 (0.0%) |
| Construction | 187 (90.8%) | 19 (9.2%) |
| Manufacturing | 239 (79.4%) | 62 (20.6%) |
| Wholesale Trade | 0 (0.0%) | 0 (0.0%) |
| Retail Trade | 128 (40.6%) | 187 (59.4%) |
| Transportation & Warehousing | 61 (75.3%) | 20 (24.7%) |
| Utilities | 16 (100.0%) | 0 (0.0%) |
| Information | 0 (0.0%) | 0 (0.0%) |
| Finance & Insurance | 23 (71.9%) | 9 (28.1%) |
| Real Estate, Rental & Leasing | 0 (0.0%) | 15 (100.0%) |
| Professional & Scientific | 18 (26.5%) | 50 (73.5%) |
| Enterprise Management | 0 (0.0%) | 0 (0.0%) |
| Administrative & Support | 29 (52.7%) | 26 (47.3%) |
| Educational Services | 9 (7.6%) | 110 (92.4%) |
| Health Care & Social Assistance | 95 (26.4%) | 265 (73.6%) |
| Arts, Entertainment & Recreation | 8 (100.0%) | 0 (0.0%) |
| Accommodation & Food Services | 78 (52.3%) | 71 (47.6%) |
| Public Administration | 49 (59.8%) | 33 (40.2%) |
| Total | 995 (52.2%) | 912 (47.8%) |
Education in Algonac
School Enrollment in Algonac
The most common levels of schooling among the 702 students in Algonac are elementary school (158 | 22.5%), middle school (157 | 22.4%), and high school (132 | 18.8%).
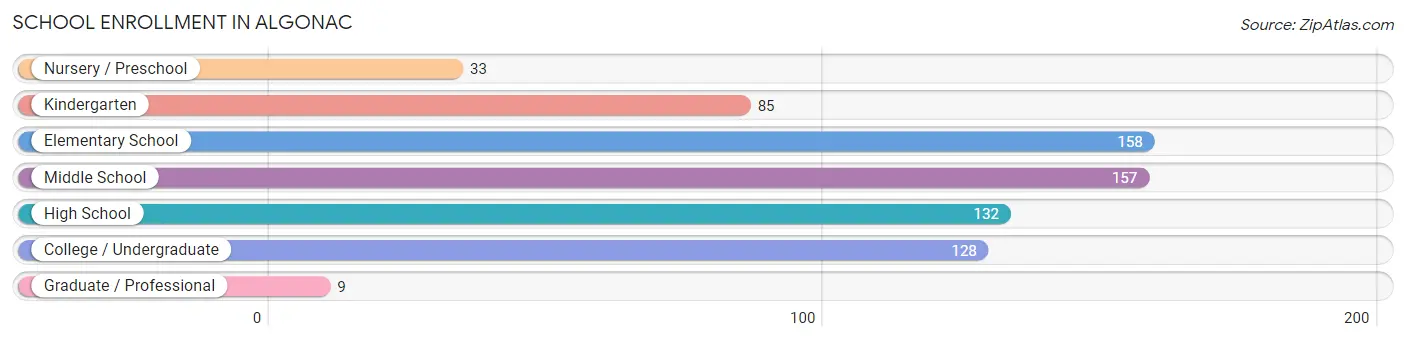
| School Level | # Students | % Students |
| Nursery / Preschool | 33 | 4.7% |
| Kindergarten | 85 | 12.1% |
| Elementary School | 158 | 22.5% |
| Middle School | 157 | 22.4% |
| High School | 132 | 18.8% |
| College / Undergraduate | 128 | 18.2% |
| Graduate / Professional | 9 | 1.3% |
| Total | 702 | 100.0% |
School Enrollment by Age by Funding Source in Algonac
Out of a total of 702 students who are enrolled in schools in Algonac, 36 (5.1%) attend a private institution, while the remaining 666 (94.9%) are enrolled in public schools. The age group of 20 to 24 year olds has the highest likelihood of being enrolled in private schools, with 24 (30.8% in the age bracket) enrolled. Conversely, the age group of 3 to 4 year olds has the lowest likelihood of being enrolled in a private school, with 25 (100.0% in the age bracket) attending a public institution.
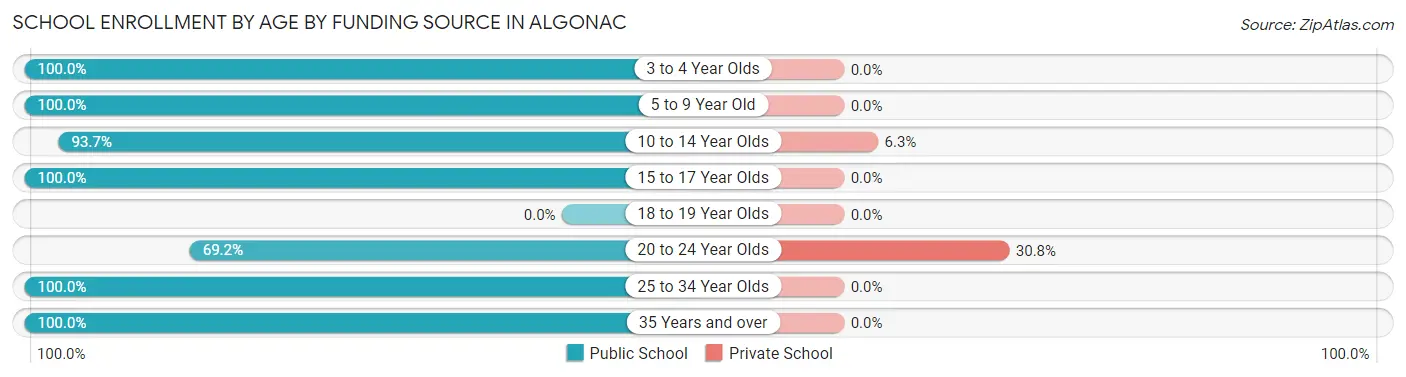
| Age Bracket | Public School | Private School |
| 3 to 4 Year Olds | 25 (100.0%) | 0 (0.0%) |
| 5 to 9 Year Old | 238 (100.0%) | 0 (0.0%) |
| 10 to 14 Year Olds | 178 (93.7%) | 12 (6.3%) |
| 15 to 17 Year Olds | 89 (100.0%) | 0 (0.0%) |
| 18 to 19 Year Olds | 0 (0.0%) | 0 (0.0%) |
| 20 to 24 Year Olds | 54 (69.2%) | 24 (30.8%) |
| 25 to 34 Year Olds | 48 (100.0%) | 0 (0.0%) |
| 35 Years and over | 34 (100.0%) | 0 (0.0%) |
| Total | 666 (94.9%) | 36 (5.1%) |
Educational Attainment by Field of Study in Algonac
Science & technology (151 | 27.4%), business (74 | 13.4%), education (69 | 12.5%), physical & health sciences (62 | 11.3%), and engineering (50 | 9.1%) are the most common fields of study among 551 individuals in Algonac who have obtained a bachelor's degree or higher.
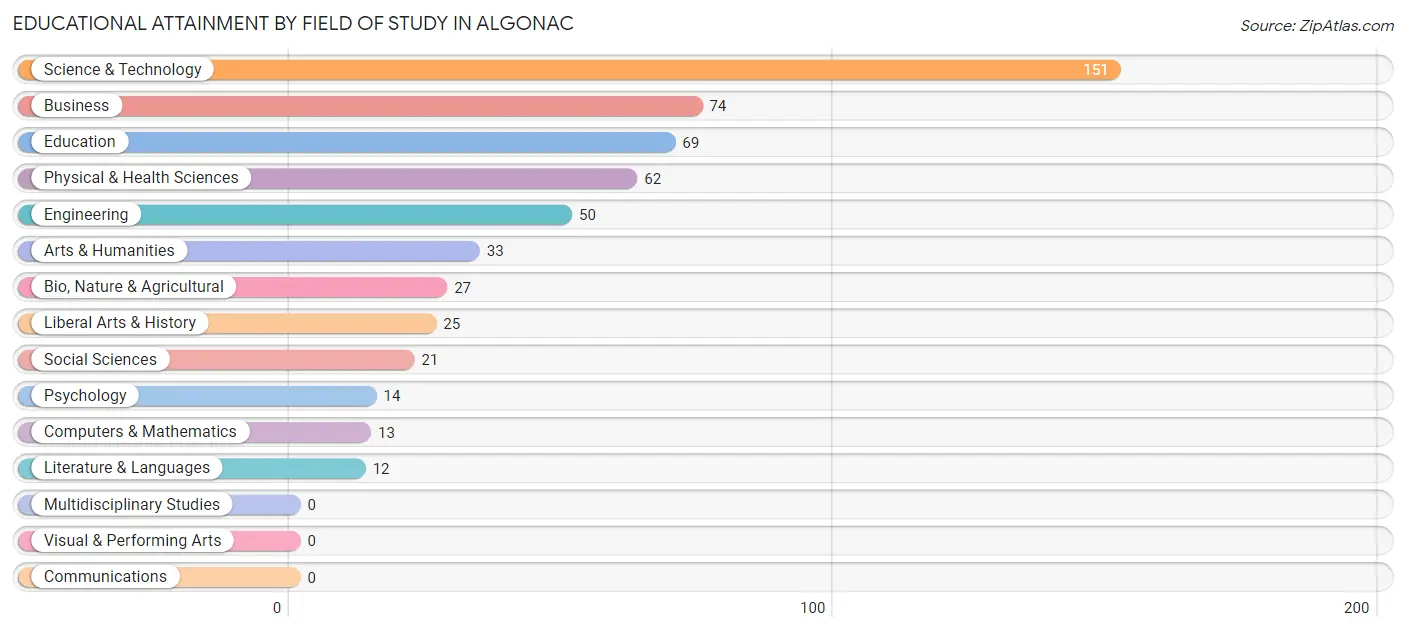
| Field of Study | # Graduates | % Graduates |
| Computers & Mathematics | 13 | 2.4% |
| Bio, Nature & Agricultural | 27 | 4.9% |
| Physical & Health Sciences | 62 | 11.3% |
| Psychology | 14 | 2.5% |
| Social Sciences | 21 | 3.8% |
| Engineering | 50 | 9.1% |
| Multidisciplinary Studies | 0 | 0.0% |
| Science & Technology | 151 | 27.4% |
| Business | 74 | 13.4% |
| Education | 69 | 12.5% |
| Literature & Languages | 12 | 2.2% |
| Liberal Arts & History | 25 | 4.5% |
| Visual & Performing Arts | 0 | 0.0% |
| Communications | 0 | 0.0% |
| Arts & Humanities | 33 | 6.0% |
| Total | 551 | 100.0% |
Transportation & Commute in Algonac
Vehicle Availability by Sex in Algonac
The most prevalent vehicle ownership categories in Algonac are males with 2 vehicles (533, accounting for 54.4%) and females with 2 vehicles (447, making up 60.0%).
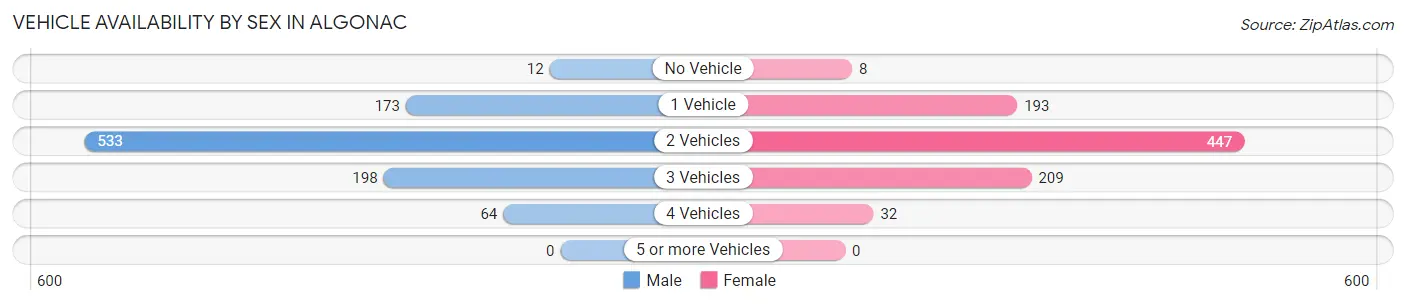
| Vehicles Available | Male | Female |
| No Vehicle | 12 (1.2%) | 8 (0.9%) |
| 1 Vehicle | 173 (17.6%) | 193 (21.7%) |
| 2 Vehicles | 533 (54.4%) | 447 (50.3%) |
| 3 Vehicles | 198 (20.2%) | 209 (23.5%) |
| 4 Vehicles | 64 (6.5%) | 32 (3.6%) |
| 5 or more Vehicles | 0 (0.0%) | 0 (0.0%) |
| Total | 980 (100.0%) | 889 (100.0%) |
Commute Time in Algonac
The most frequently occuring commute durations in Algonac are 60 to 89 minutes (304 commuters, 17.0%), 45 to 59 minutes (293 commuters, 16.4%), and 5 to 9 minutes (217 commuters, 12.1%).
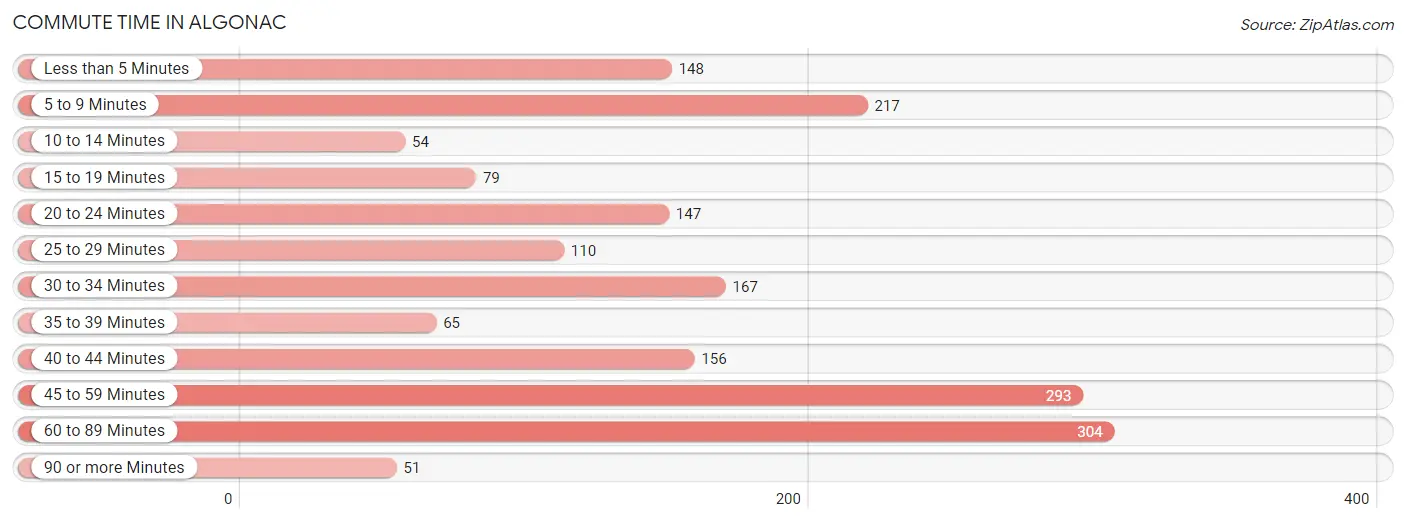
| Commute Time | # Commuters | % Commuters |
| Less than 5 Minutes | 148 | 8.3% |
| 5 to 9 Minutes | 217 | 12.1% |
| 10 to 14 Minutes | 54 | 3.0% |
| 15 to 19 Minutes | 79 | 4.4% |
| 20 to 24 Minutes | 147 | 8.2% |
| 25 to 29 Minutes | 110 | 6.1% |
| 30 to 34 Minutes | 167 | 9.3% |
| 35 to 39 Minutes | 65 | 3.6% |
| 40 to 44 Minutes | 156 | 8.7% |
| 45 to 59 Minutes | 293 | 16.4% |
| 60 to 89 Minutes | 304 | 17.0% |
| 90 or more Minutes | 51 | 2.9% |
Commute Time by Sex in Algonac
The most common commute times in Algonac are 45 to 59 minutes (175 commuters, 18.3%) for males and 60 to 89 minutes (142 commuters, 17.0%) for females.
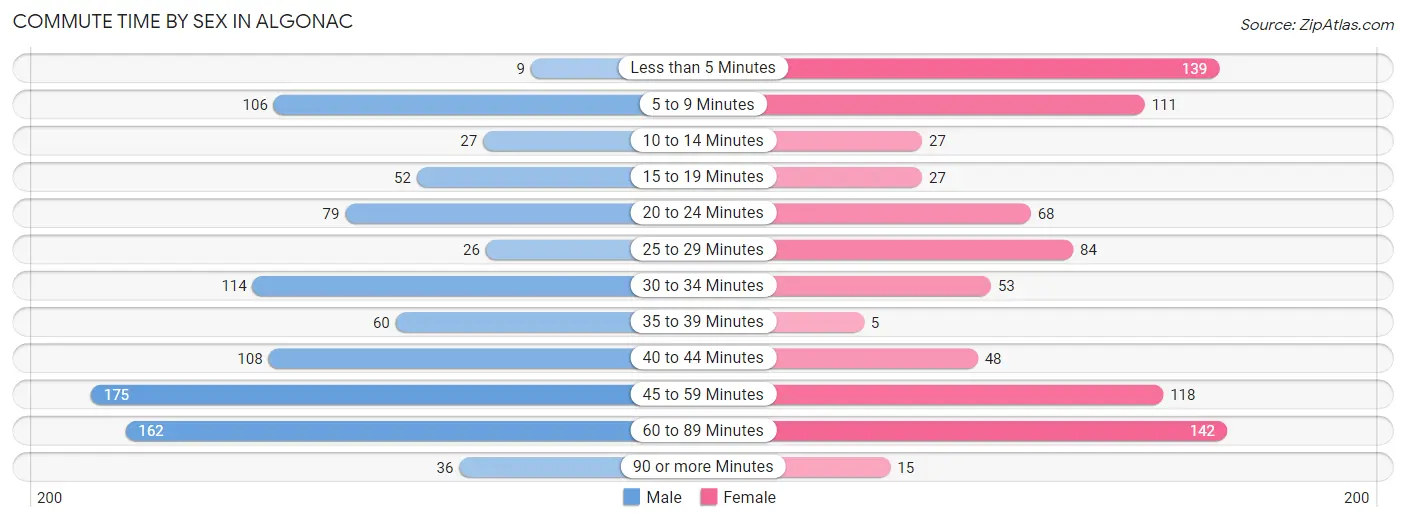
| Commute Time | Male | Female |
| Less than 5 Minutes | 9 (0.9%) | 139 (16.6%) |
| 5 to 9 Minutes | 106 (11.1%) | 111 (13.3%) |
| 10 to 14 Minutes | 27 (2.8%) | 27 (3.2%) |
| 15 to 19 Minutes | 52 (5.4%) | 27 (3.2%) |
| 20 to 24 Minutes | 79 (8.3%) | 68 (8.1%) |
| 25 to 29 Minutes | 26 (2.7%) | 84 (10.0%) |
| 30 to 34 Minutes | 114 (11.9%) | 53 (6.3%) |
| 35 to 39 Minutes | 60 (6.3%) | 5 (0.6%) |
| 40 to 44 Minutes | 108 (11.3%) | 48 (5.7%) |
| 45 to 59 Minutes | 175 (18.3%) | 118 (14.1%) |
| 60 to 89 Minutes | 162 (17.0%) | 142 (17.0%) |
| 90 or more Minutes | 36 (3.8%) | 15 (1.8%) |
Time of Departure to Work by Sex in Algonac
The most frequent times of departure to work in Algonac are 6:30 AM to 6:59 AM (170, 17.8%) for males and 4:00 PM to 11:59 PM (122, 14.6%) for females.
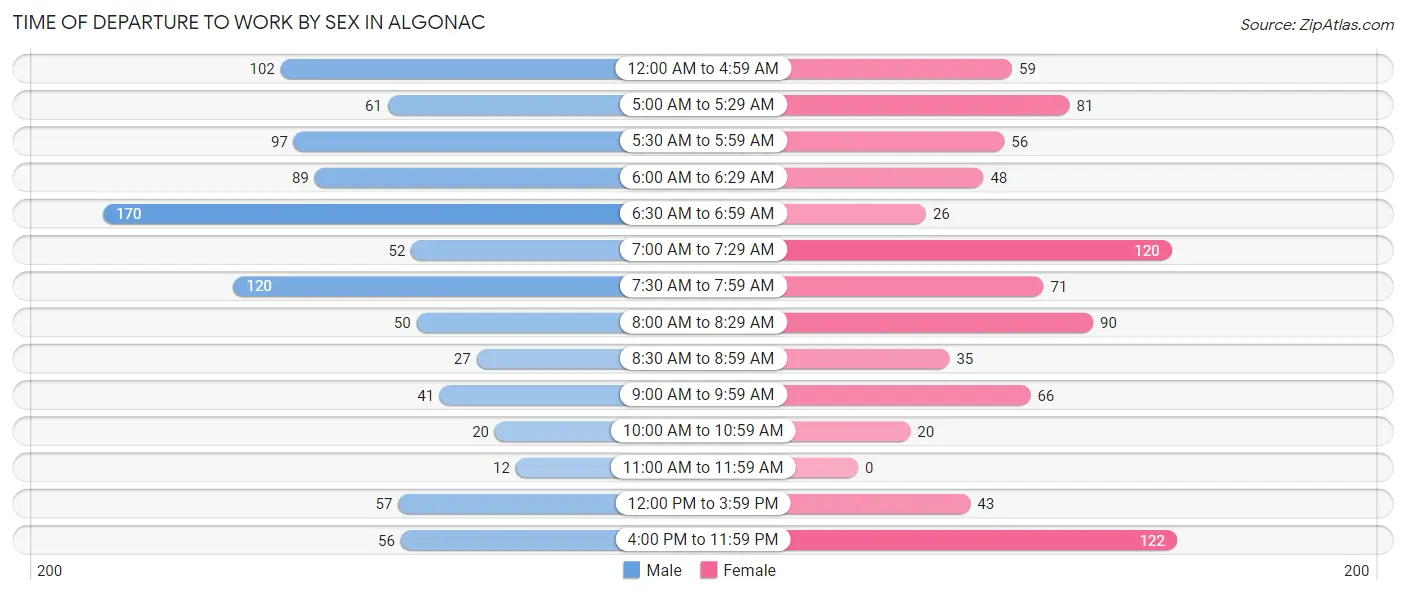
| Time of Departure | Male | Female |
| 12:00 AM to 4:59 AM | 102 (10.7%) | 59 (7.0%) |
| 5:00 AM to 5:29 AM | 61 (6.4%) | 81 (9.7%) |
| 5:30 AM to 5:59 AM | 97 (10.2%) | 56 (6.7%) |
| 6:00 AM to 6:29 AM | 89 (9.3%) | 48 (5.7%) |
| 6:30 AM to 6:59 AM | 170 (17.8%) | 26 (3.1%) |
| 7:00 AM to 7:29 AM | 52 (5.4%) | 120 (14.3%) |
| 7:30 AM to 7:59 AM | 120 (12.6%) | 71 (8.5%) |
| 8:00 AM to 8:29 AM | 50 (5.2%) | 90 (10.7%) |
| 8:30 AM to 8:59 AM | 27 (2.8%) | 35 (4.2%) |
| 9:00 AM to 9:59 AM | 41 (4.3%) | 66 (7.9%) |
| 10:00 AM to 10:59 AM | 20 (2.1%) | 20 (2.4%) |
| 11:00 AM to 11:59 AM | 12 (1.3%) | 0 (0.0%) |
| 12:00 PM to 3:59 PM | 57 (6.0%) | 43 (5.1%) |
| 4:00 PM to 11:59 PM | 56 (5.9%) | 122 (14.6%) |
| Total | 954 (100.0%) | 837 (100.0%) |
Housing Occupancy in Algonac
Occupancy by Ownership in Algonac
Of the total 1,822 dwellings in Algonac, owner-occupied units account for 1,294 (71.0%), while renter-occupied units make up 528 (29.0%).
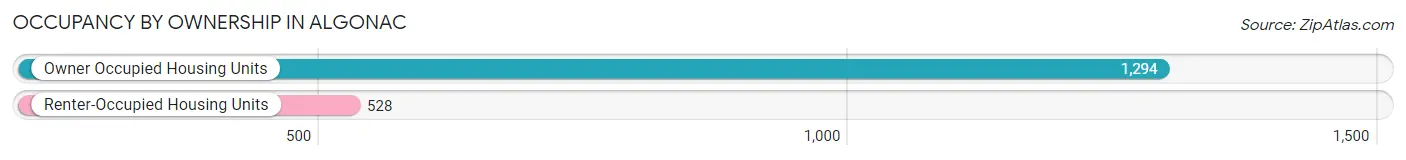
| Occupancy | # Housing Units | % Housing Units |
| Owner Occupied Housing Units | 1,294 | 71.0% |
| Renter-Occupied Housing Units | 528 | 29.0% |
| Total Occupied Housing Units | 1,822 | 100.0% |
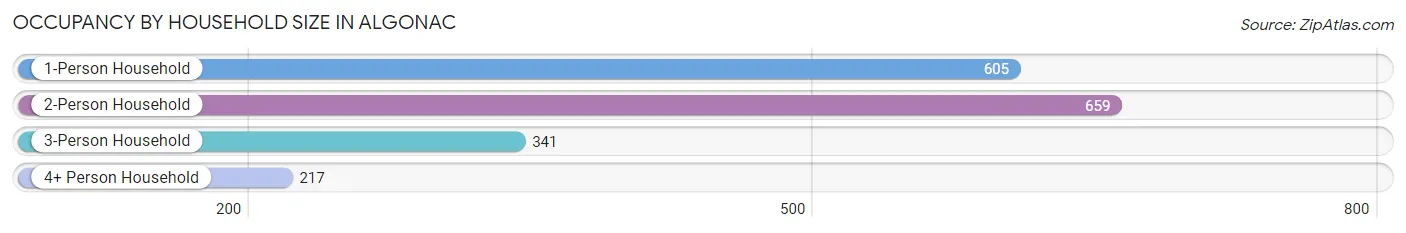
Occupancy by Household Size in Algonac
| Household Size | # Housing Units | % Housing Units |
| 1-Person Household | 605 | 33.2% |
| 2-Person Household | 659 | 36.2% |
| 3-Person Household | 341 | 18.7% |
| 4+ Person Household | 217 | 11.9% |
| Total Housing Units | 1,822 | 100.0% |
Occupancy by Ownership by Household Size in Algonac
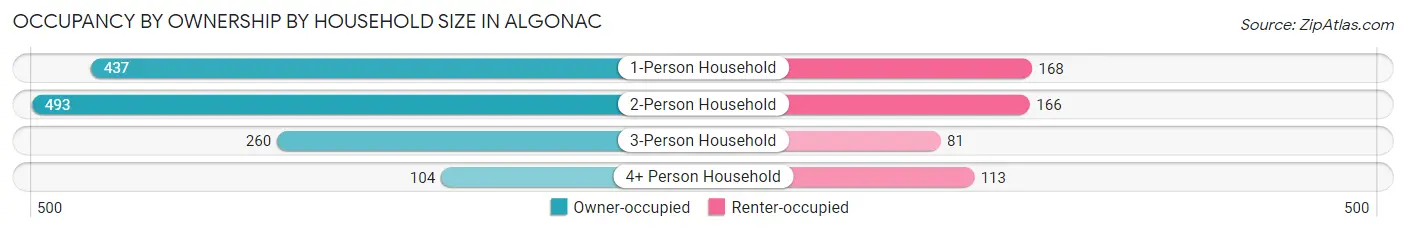
| Household Size | Owner-occupied | Renter-occupied |
| 1-Person Household | 437 (72.2%) | 168 (27.8%) |
| 2-Person Household | 493 (74.8%) | 166 (25.2%) |
| 3-Person Household | 260 (76.2%) | 81 (23.7%) |
| 4+ Person Household | 104 (47.9%) | 113 (52.1%) |
| Total Housing Units | 1,294 (71.0%) | 528 (29.0%) |
Occupancy by Educational Attainment in Algonac
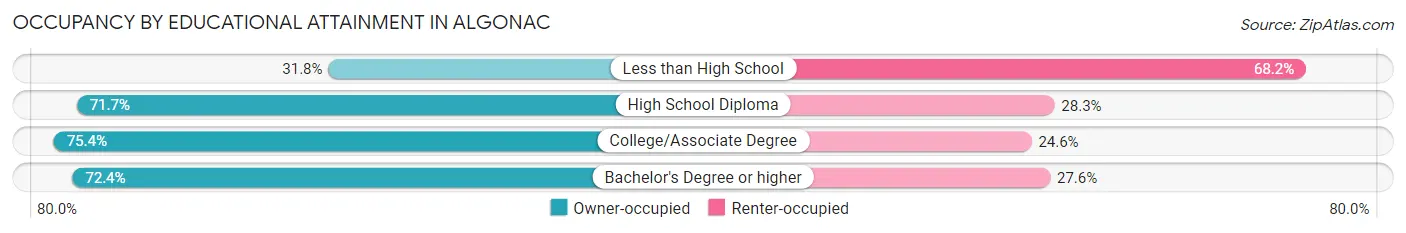
| Household Size | Owner-occupied | Renter-occupied |
| Less than High School | 28 (31.8%) | 60 (68.2%) |
| High School Diploma | 581 (71.7%) | 229 (28.3%) |
| College/Associate Degree | 404 (75.4%) | 132 (24.6%) |
| Bachelor's Degree or higher | 281 (72.4%) | 107 (27.6%) |
Occupancy by Age of Householder in Algonac
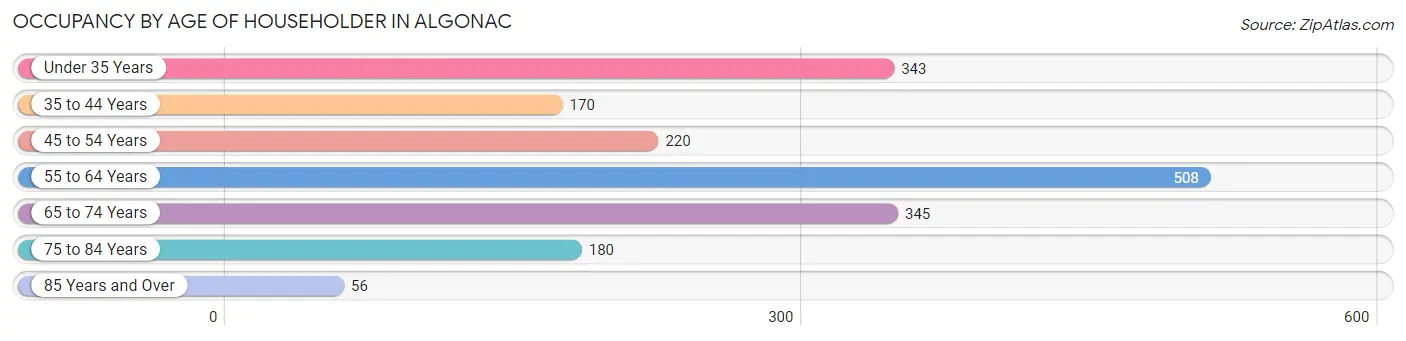
| Age Bracket | # Households | % Households |
| Under 35 Years | 343 | 18.8% |
| 35 to 44 Years | 170 | 9.3% |
| 45 to 54 Years | 220 | 12.1% |
| 55 to 64 Years | 508 | 27.9% |
| 65 to 74 Years | 345 | 18.9% |
| 75 to 84 Years | 180 | 9.9% |
| 85 Years and Over | 56 | 3.1% |
| Total | 1,822 | 100.0% |
Housing Finances in Algonac
Median Income by Occupancy in Algonac
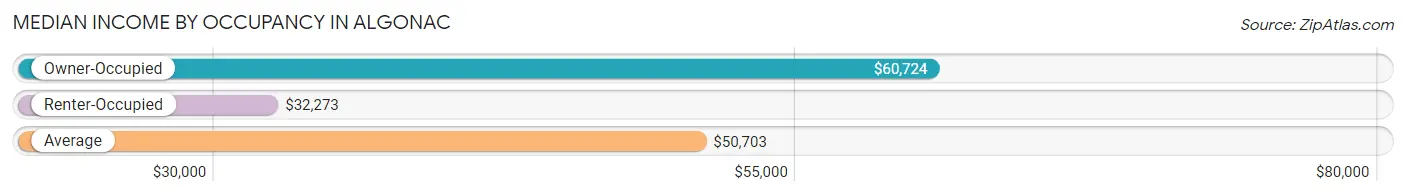
| Occupancy Type | # Households | Median Income |
| Owner-Occupied | 1,294 (71.0%) | $60,724 |
| Renter-Occupied | 528 (29.0%) | $32,273 |
| Average | 1,822 (100.0%) | $50,703 |
Occupancy by Householder Income Bracket in Algonac
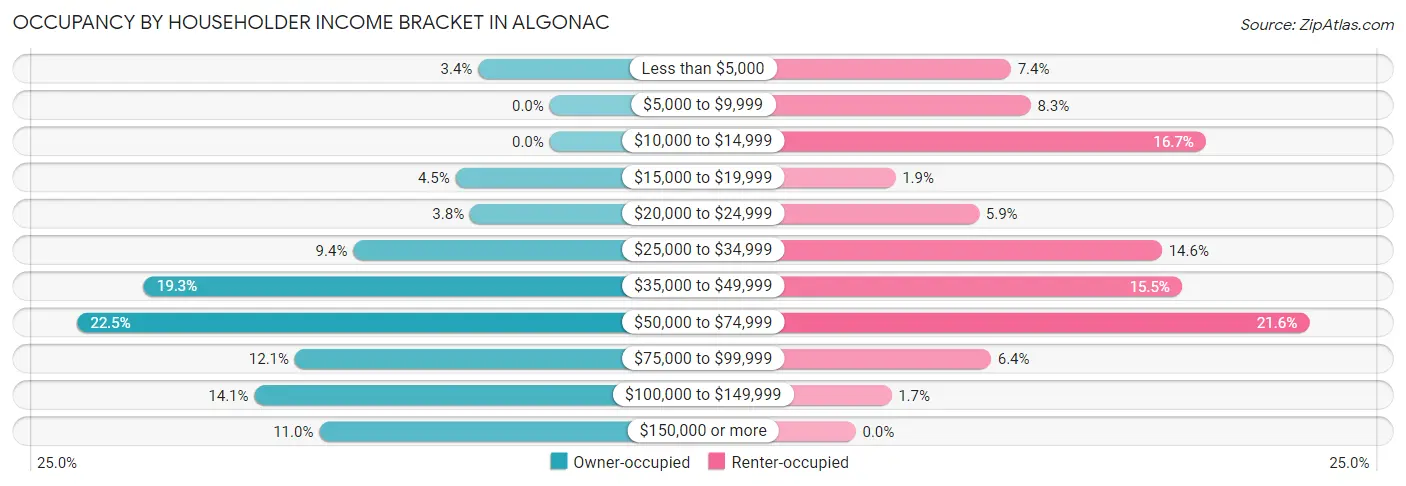
| Income Bracket | Owner-occupied | Renter-occupied |
| Less than $5,000 | 44 (3.4%) | 39 (7.4%) |
| $5,000 to $9,999 | 0 (0.0%) | 44 (8.3%) |
| $10,000 to $14,999 | 0 (0.0%) | 88 (16.7%) |
| $15,000 to $19,999 | 58 (4.5%) | 10 (1.9%) |
| $20,000 to $24,999 | 49 (3.8%) | 31 (5.9%) |
| $25,000 to $34,999 | 121 (9.3%) | 77 (14.6%) |
| $35,000 to $49,999 | 250 (19.3%) | 82 (15.5%) |
| $50,000 to $74,999 | 291 (22.5%) | 114 (21.6%) |
| $75,000 to $99,999 | 157 (12.1%) | 34 (6.4%) |
| $100,000 to $149,999 | 182 (14.1%) | 9 (1.7%) |
| $150,000 or more | 142 (11.0%) | 0 (0.0%) |
| Total | 1,294 (100.0%) | 528 (100.0%) |
Monthly Housing Cost Tiers in Algonac
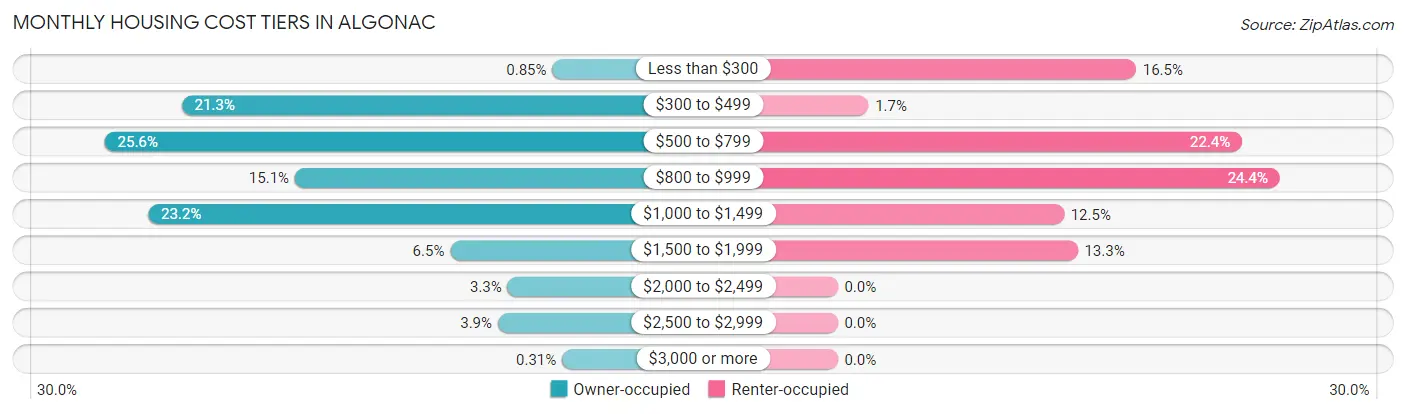
| Monthly Cost | Owner-occupied | Renter-occupied |
| Less than $300 | 11 (0.9%) | 87 (16.5%) |
| $300 to $499 | 276 (21.3%) | 9 (1.7%) |
| $500 to $799 | 331 (25.6%) | 118 (22.4%) |
| $800 to $999 | 195 (15.1%) | 129 (24.4%) |
| $1,000 to $1,499 | 300 (23.2%) | 66 (12.5%) |
| $1,500 to $1,999 | 84 (6.5%) | 70 (13.3%) |
| $2,000 to $2,499 | 43 (3.3%) | 0 (0.0%) |
| $2,500 to $2,999 | 50 (3.9%) | 0 (0.0%) |
| $3,000 or more | 4 (0.3%) | 0 (0.0%) |
| Total | 1,294 (100.0%) | 528 (100.0%) |
Physical Housing Characteristics in Algonac
Housing Structures in Algonac
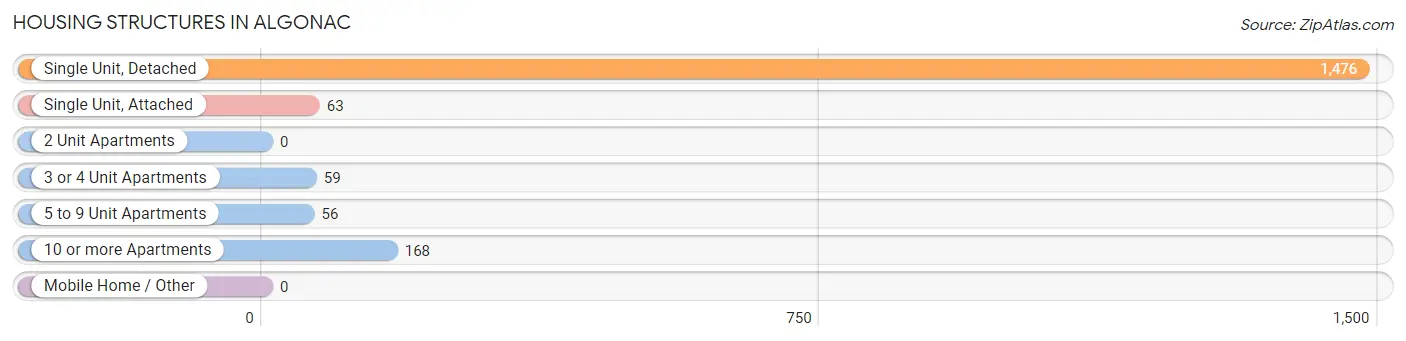
| Structure Type | # Housing Units | % Housing Units |
| Single Unit, Detached | 1,476 | 81.0% |
| Single Unit, Attached | 63 | 3.5% |
| 2 Unit Apartments | 0 | 0.0% |
| 3 or 4 Unit Apartments | 59 | 3.2% |
| 5 to 9 Unit Apartments | 56 | 3.1% |
| 10 or more Apartments | 168 | 9.2% |
| Mobile Home / Other | 0 | 0.0% |
| Total | 1,822 | 100.0% |
Housing Structures by Occupancy in Algonac
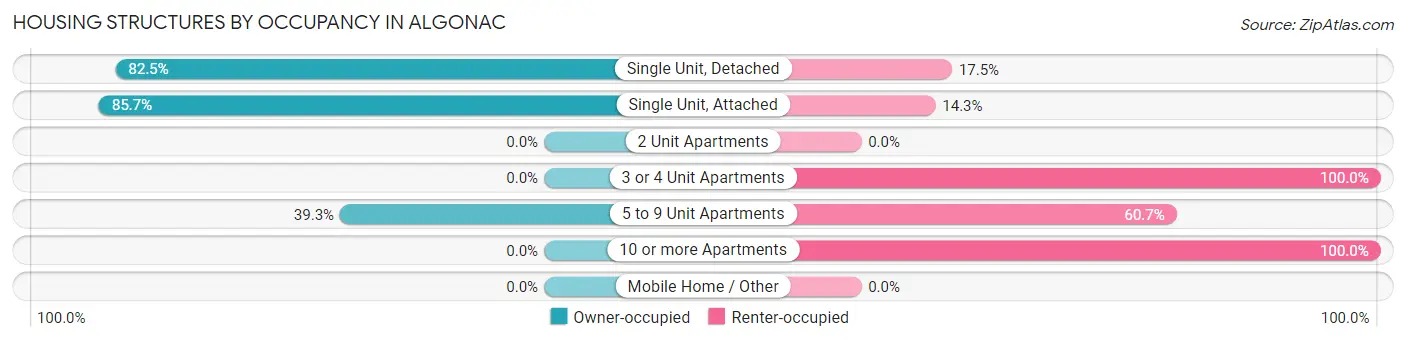
| Structure Type | Owner-occupied | Renter-occupied |
| Single Unit, Detached | 1,218 (82.5%) | 258 (17.5%) |
| Single Unit, Attached | 54 (85.7%) | 9 (14.3%) |
| 2 Unit Apartments | 0 (0.0%) | 0 (0.0%) |
| 3 or 4 Unit Apartments | 0 (0.0%) | 59 (100.0%) |
| 5 to 9 Unit Apartments | 22 (39.3%) | 34 (60.7%) |
| 10 or more Apartments | 0 (0.0%) | 168 (100.0%) |
| Mobile Home / Other | 0 (0.0%) | 0 (0.0%) |
| Total | 1,294 (71.0%) | 528 (29.0%) |
Housing Structures by Number of Rooms in Algonac
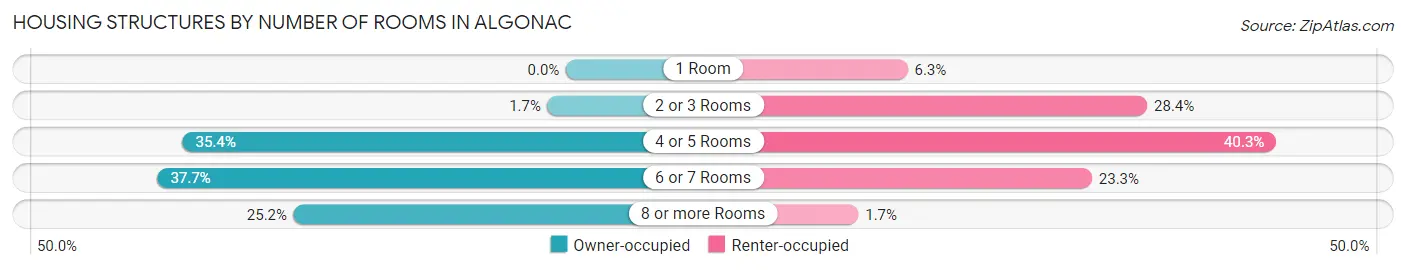
| Number of Rooms | Owner-occupied | Renter-occupied |
| 1 Room | 0 (0.0%) | 33 (6.2%) |
| 2 or 3 Rooms | 22 (1.7%) | 150 (28.4%) |
| 4 or 5 Rooms | 458 (35.4%) | 213 (40.3%) |
| 6 or 7 Rooms | 488 (37.7%) | 123 (23.3%) |
| 8 or more Rooms | 326 (25.2%) | 9 (1.7%) |
| Total | 1,294 (100.0%) | 528 (100.0%) |
Housing Structure by Heating Type in Algonac
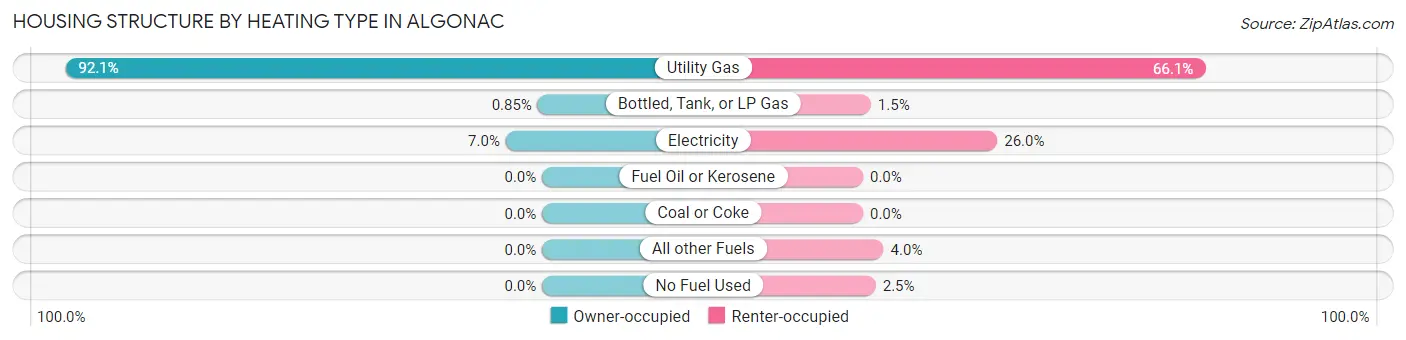
| Heating Type | Owner-occupied | Renter-occupied |
| Utility Gas | 1,192 (92.1%) | 349 (66.1%) |
| Bottled, Tank, or LP Gas | 11 (0.9%) | 8 (1.5%) |
| Electricity | 91 (7.0%) | 137 (26.0%) |
| Fuel Oil or Kerosene | 0 (0.0%) | 0 (0.0%) |
| Coal or Coke | 0 (0.0%) | 0 (0.0%) |
| All other Fuels | 0 (0.0%) | 21 (4.0%) |
| No Fuel Used | 0 (0.0%) | 13 (2.5%) |
| Total | 1,294 (100.0%) | 528 (100.0%) |
Household Vehicle Usage in Algonac
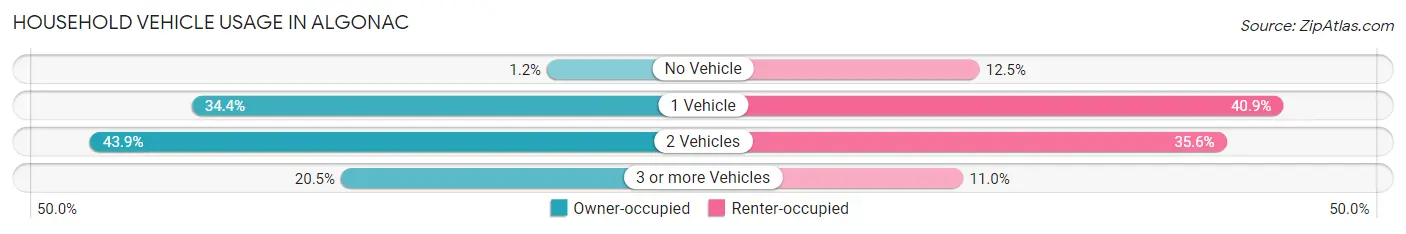
| Vehicles per Household | Owner-occupied | Renter-occupied |
| No Vehicle | 16 (1.2%) | 66 (12.5%) |
| 1 Vehicle | 445 (34.4%) | 216 (40.9%) |
| 2 Vehicles | 568 (43.9%) | 188 (35.6%) |
| 3 or more Vehicles | 265 (20.5%) | 58 (11.0%) |
| Total | 1,294 (100.0%) | 528 (100.0%) |
Real Estate & Mortgages in Algonac
Real Estate and Mortgage Overview in Algonac
| Characteristic | Without Mortgage | With Mortgage |
| Housing Units | 527 | 767 |
| Median Property Value | $159,200 | $148,900 |
| Median Household Income | $60,302 | $59 |
| Monthly Housing Costs | $483 | $4 |
| Real Estate Taxes | $2,287 | $33 |
Property Value by Mortgage Status in Algonac
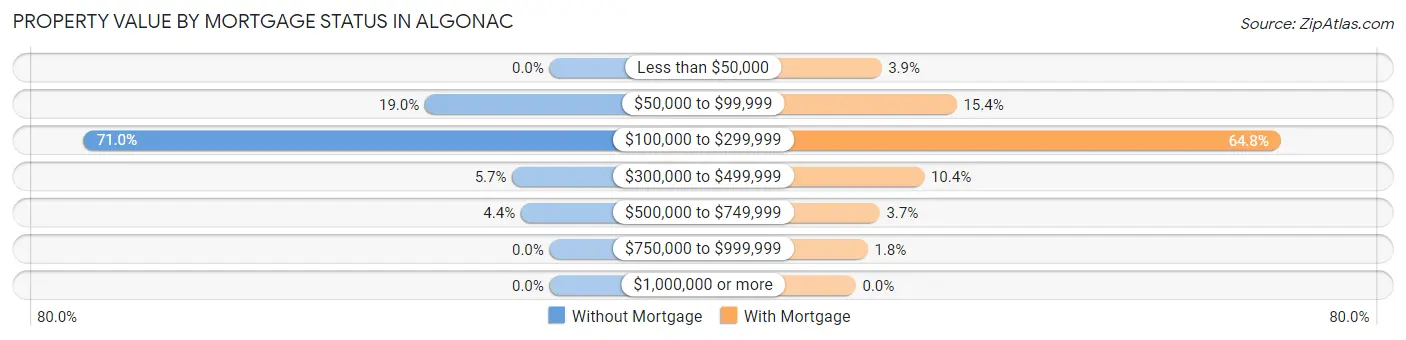
| Property Value | Without Mortgage | With Mortgage |
| Less than $50,000 | 0 (0.0%) | 30 (3.9%) |
| $50,000 to $99,999 | 100 (19.0%) | 118 (15.4%) |
| $100,000 to $299,999 | 374 (71.0%) | 497 (64.8%) |
| $300,000 to $499,999 | 30 (5.7%) | 80 (10.4%) |
| $500,000 to $749,999 | 23 (4.4%) | 28 (3.6%) |
| $750,000 to $999,999 | 0 (0.0%) | 14 (1.8%) |
| $1,000,000 or more | 0 (0.0%) | 0 (0.0%) |
| Total | 527 (100.0%) | 767 (100.0%) |
Household Income by Mortgage Status in Algonac
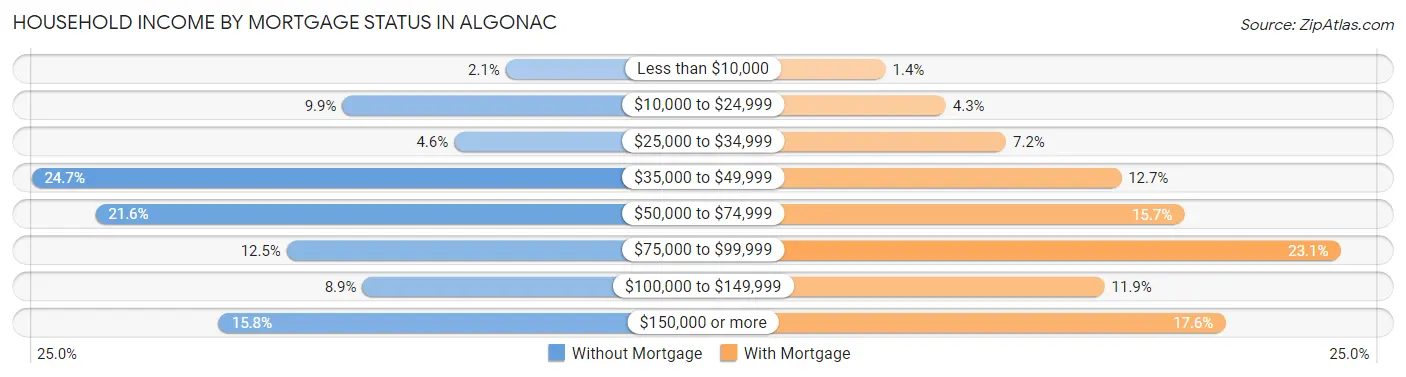
| Household Income | Without Mortgage | With Mortgage |
| Less than $10,000 | 11 (2.1%) | 11 (1.4%) |
| $10,000 to $24,999 | 52 (9.9%) | 33 (4.3%) |
| $25,000 to $34,999 | 24 (4.5%) | 55 (7.2%) |
| $35,000 to $49,999 | 130 (24.7%) | 97 (12.7%) |
| $50,000 to $74,999 | 114 (21.6%) | 120 (15.7%) |
| $75,000 to $99,999 | 66 (12.5%) | 177 (23.1%) |
| $100,000 to $149,999 | 47 (8.9%) | 91 (11.9%) |
| $150,000 or more | 83 (15.8%) | 135 (17.6%) |
| Total | 527 (100.0%) | 767 (100.0%) |
Property Value to Household Income Ratio in Algonac
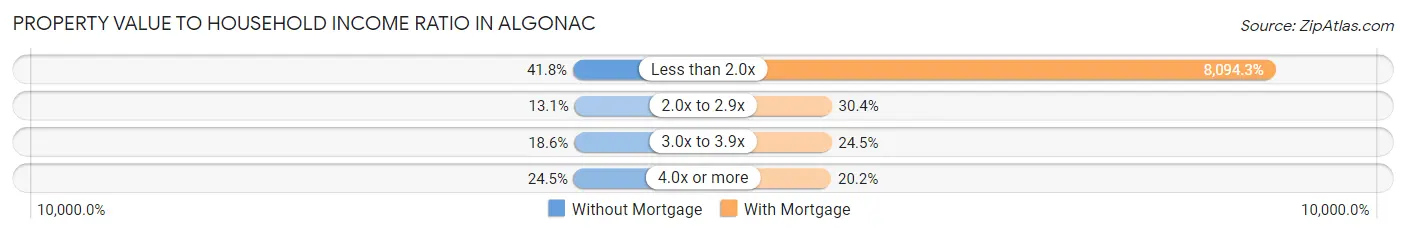
| Value-to-Income Ratio | Without Mortgage | With Mortgage |
| Less than 2.0x | 220 (41.7%) | 62,083 (8,094.3%) |
| 2.0x to 2.9x | 69 (13.1%) | 233 (30.4%) |
| 3.0x to 3.9x | 98 (18.6%) | 188 (24.5%) |
| 4.0x or more | 129 (24.5%) | 155 (20.2%) |
| Total | 527 (100.0%) | 767 (100.0%) |
Real Estate Taxes by Mortgage Status in Algonac
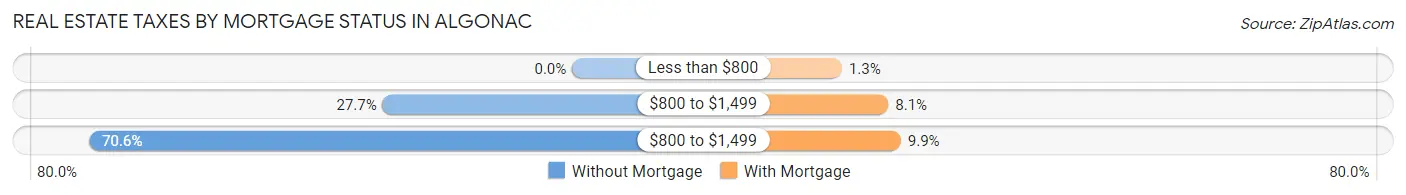
| Property Taxes | Without Mortgage | With Mortgage |
| Less than $800 | 0 (0.0%) | 10 (1.3%) |
| $800 to $1,499 | 146 (27.7%) | 62 (8.1%) |
| $800 to $1,499 | 372 (70.6%) | 76 (9.9%) |
| Total | 527 (100.0%) | 767 (100.0%) |
Health & Disability in Algonac
Health Insurance Coverage by Age in Algonac
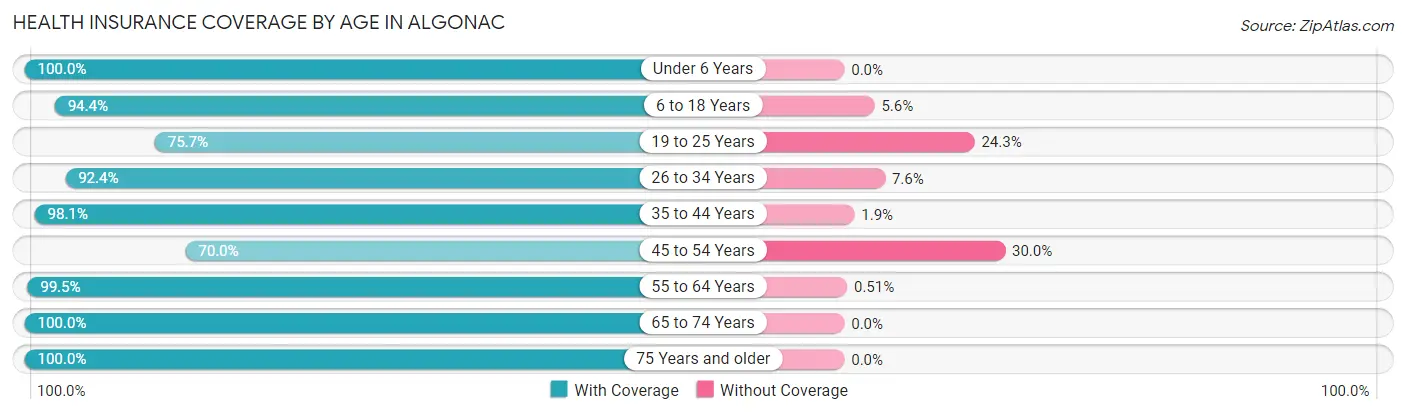
| Age Bracket | With Coverage | Without Coverage |
| Under 6 Years | 300 (100.0%) | 0 (0.0%) |
| 6 to 18 Years | 469 (94.4%) | 28 (5.6%) |
| 19 to 25 Years | 237 (75.7%) | 76 (24.3%) |
| 26 to 34 Years | 451 (92.4%) | 37 (7.6%) |
| 35 to 44 Years | 419 (98.1%) | 8 (1.9%) |
| 45 to 54 Years | 355 (70.0%) | 152 (30.0%) |
| 55 to 64 Years | 780 (99.5%) | 4 (0.5%) |
| 65 to 74 Years | 480 (100.0%) | 0 (0.0%) |
| 75 Years and older | 364 (100.0%) | 0 (0.0%) |
| Total | 3,855 (92.7%) | 305 (7.3%) |
Health Insurance Coverage by Citizenship Status in Algonac
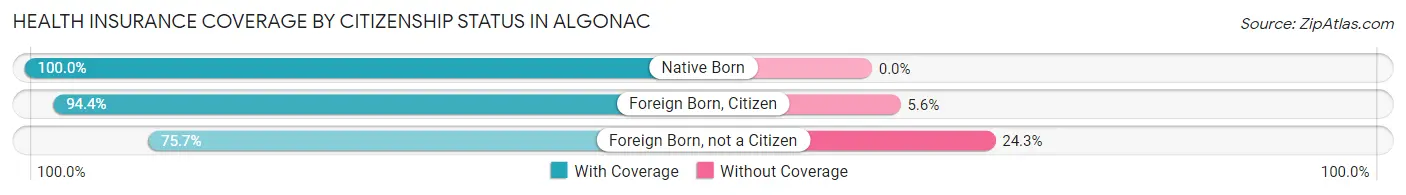
| Citizenship Status | With Coverage | Without Coverage |
| Native Born | 300 (100.0%) | 0 (0.0%) |
| Foreign Born, Citizen | 469 (94.4%) | 28 (5.6%) |
| Foreign Born, not a Citizen | 237 (75.7%) | 76 (24.3%) |
Health Insurance Coverage by Household Income in Algonac
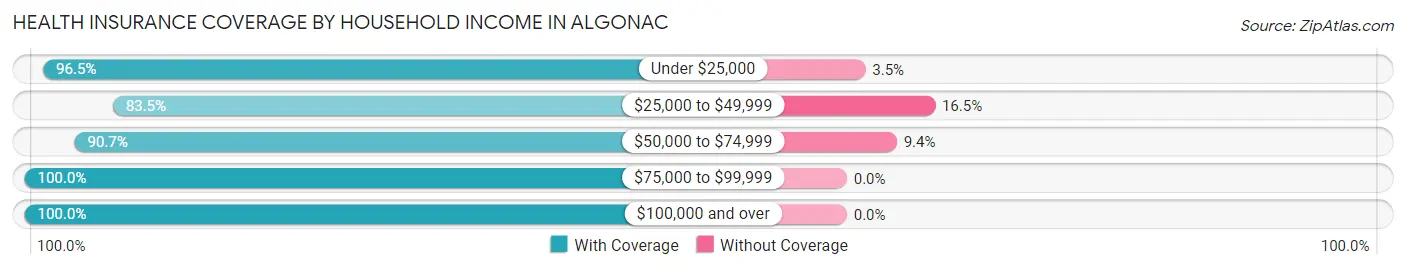
| Household Income | With Coverage | Without Coverage |
| Under $25,000 | 555 (96.5%) | 20 (3.5%) |
| $25,000 to $49,999 | 955 (83.5%) | 189 (16.5%) |
| $50,000 to $74,999 | 892 (90.6%) | 92 (9.3%) |
| $75,000 to $99,999 | 358 (100.0%) | 0 (0.0%) |
| $100,000 and over | 1,085 (100.0%) | 0 (0.0%) |
Public vs Private Health Insurance Coverage by Age in Algonac
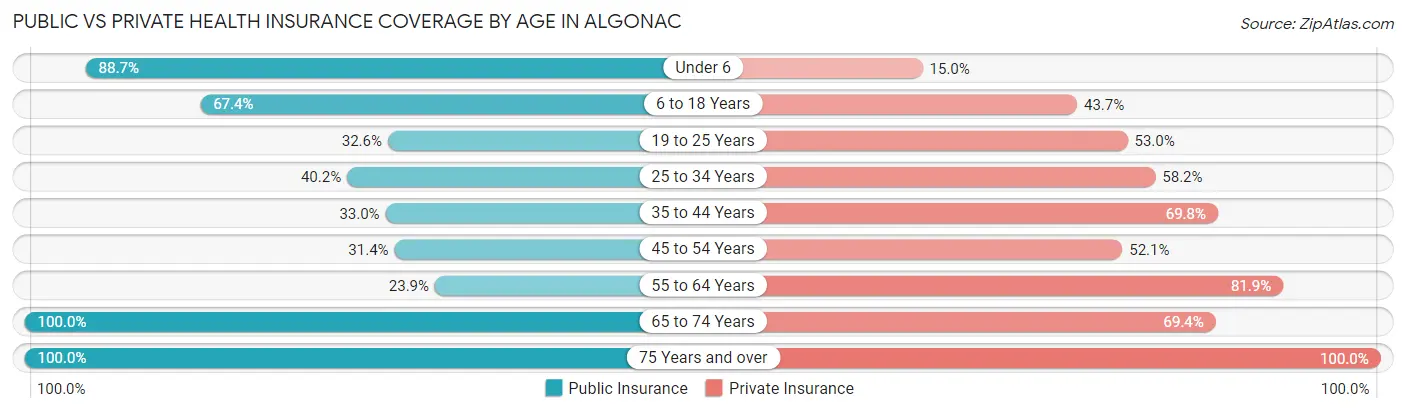
| Age Bracket | Public Insurance | Private Insurance |
| Under 6 | 266 (88.7%) | 45 (15.0%) |
| 6 to 18 Years | 335 (67.4%) | 217 (43.7%) |
| 19 to 25 Years | 102 (32.6%) | 166 (53.0%) |
| 25 to 34 Years | 196 (40.2%) | 284 (58.2%) |
| 35 to 44 Years | 141 (33.0%) | 298 (69.8%) |
| 45 to 54 Years | 159 (31.4%) | 264 (52.1%) |
| 55 to 64 Years | 187 (23.8%) | 642 (81.9%) |
| 65 to 74 Years | 480 (100.0%) | 333 (69.4%) |
| 75 Years and over | 364 (100.0%) | 364 (100.0%) |
| Total | 2,230 (53.6%) | 2,613 (62.8%) |
Disability Status by Sex by Age in Algonac
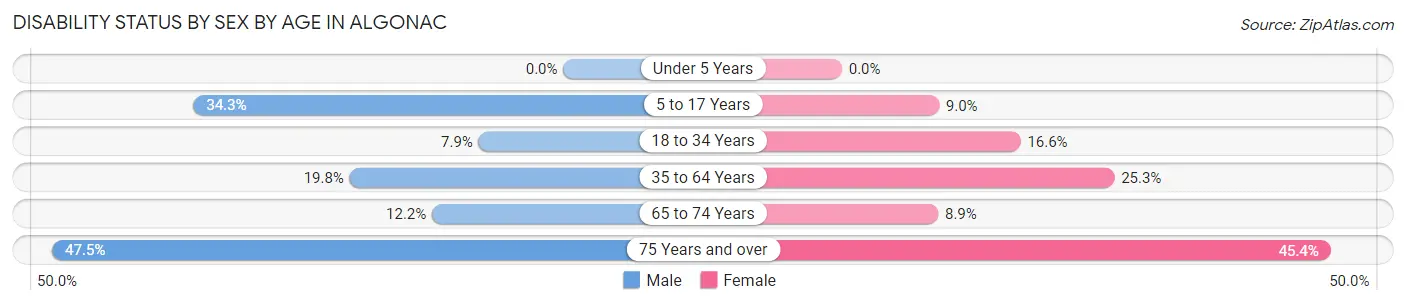
| Age Bracket | Male | Female |
| Under 5 Years | 0 (0.0%) | 0 (0.0%) |
| 5 to 17 Years | 68 (34.3%) | 32 (9.0%) |
| 18 to 34 Years | 32 (7.9%) | 67 (16.6%) |
| 35 to 64 Years | 165 (19.8%) | 224 (25.3%) |
| 65 to 74 Years | 38 (12.2%) | 15 (8.9%) |
| 75 Years and over | 65 (47.4%) | 103 (45.4%) |
Disability Class by Sex by Age in Algonac
Disability Class: Hearing Difficulty
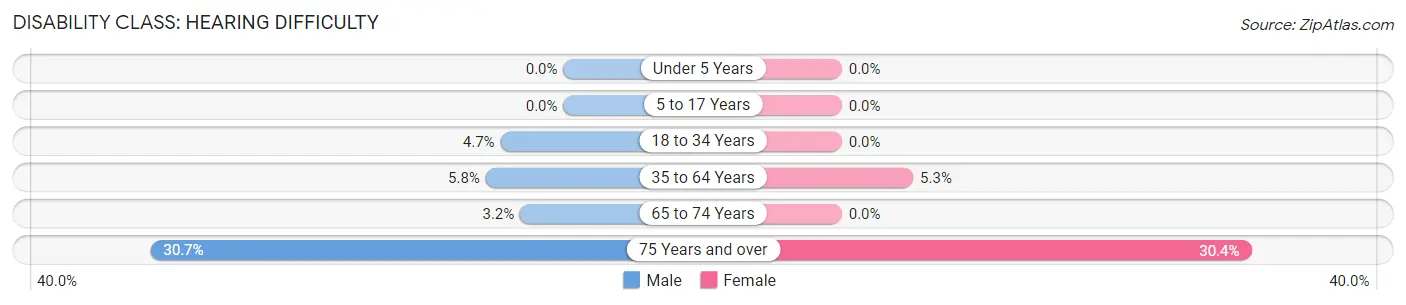
| Age Bracket | Male | Female |
| Under 5 Years | 0 (0.0%) | 0 (0.0%) |
| 5 to 17 Years | 0 (0.0%) | 0 (0.0%) |
| 18 to 34 Years | 19 (4.7%) | 0 (0.0%) |
| 35 to 64 Years | 48 (5.8%) | 47 (5.3%) |
| 65 to 74 Years | 10 (3.2%) | 0 (0.0%) |
| 75 Years and over | 42 (30.7%) | 69 (30.4%) |
Disability Class: Vision Difficulty
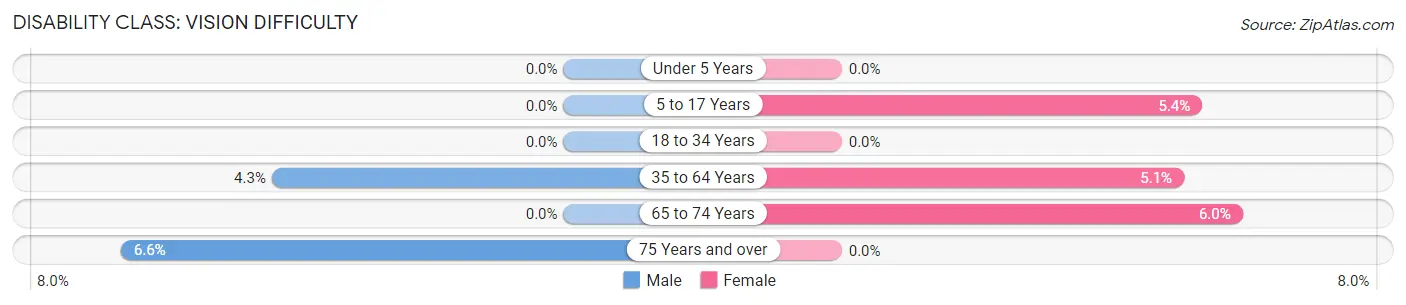
| Age Bracket | Male | Female |
| Under 5 Years | 0 (0.0%) | 0 (0.0%) |
| 5 to 17 Years | 0 (0.0%) | 19 (5.3%) |
| 18 to 34 Years | 0 (0.0%) | 0 (0.0%) |
| 35 to 64 Years | 36 (4.3%) | 45 (5.1%) |
| 65 to 74 Years | 0 (0.0%) | 10 (5.9%) |
| 75 Years and over | 9 (6.6%) | 0 (0.0%) |
Disability Class: Cognitive Difficulty
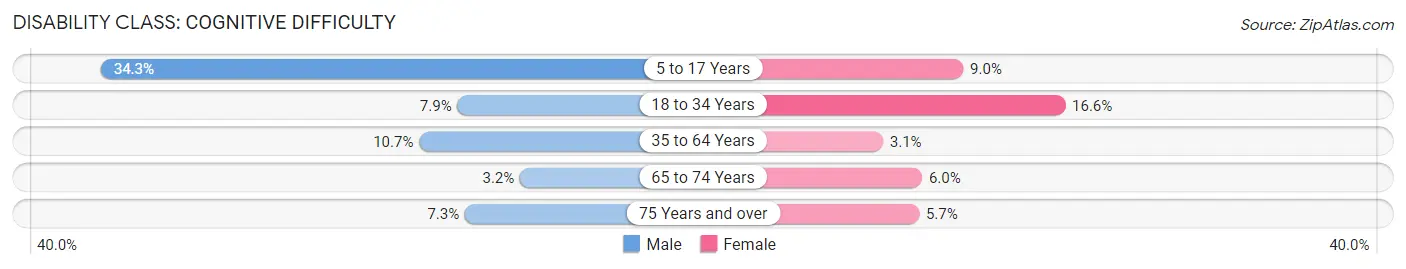
| Age Bracket | Male | Female |
| 5 to 17 Years | 68 (34.3%) | 32 (9.0%) |
| 18 to 34 Years | 32 (7.9%) | 67 (16.6%) |
| 35 to 64 Years | 89 (10.7%) | 27 (3.0%) |
| 65 to 74 Years | 10 (3.2%) | 10 (5.9%) |
| 75 Years and over | 10 (7.3%) | 13 (5.7%) |
Disability Class: Ambulatory Difficulty
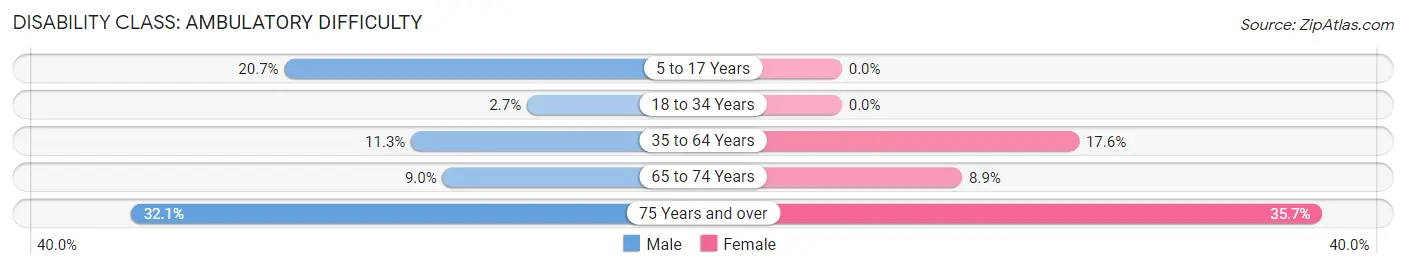
| Age Bracket | Male | Female |
| 5 to 17 Years | 41 (20.7%) | 0 (0.0%) |
| 18 to 34 Years | 11 (2.7%) | 0 (0.0%) |
| 35 to 64 Years | 94 (11.3%) | 156 (17.6%) |
| 65 to 74 Years | 28 (9.0%) | 15 (8.9%) |
| 75 Years and over | 44 (32.1%) | 81 (35.7%) |
Disability Class: Self-Care Difficulty
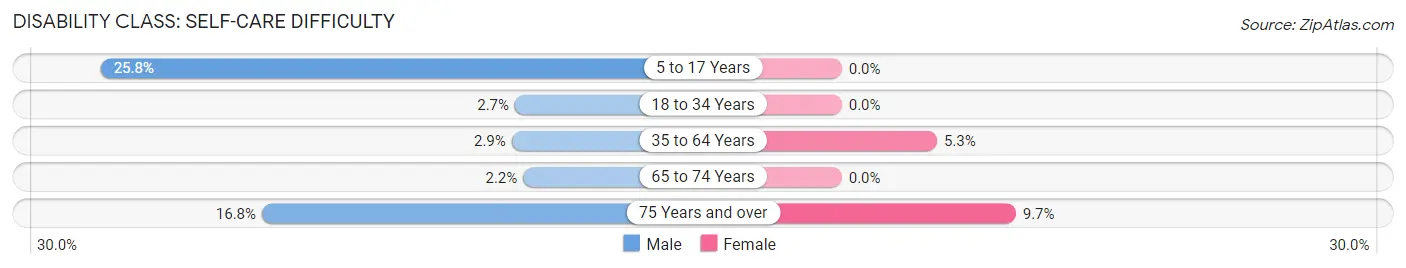
| Age Bracket | Male | Female |
| 5 to 17 Years | 51 (25.8%) | 0 (0.0%) |
| 18 to 34 Years | 11 (2.7%) | 0 (0.0%) |
| 35 to 64 Years | 24 (2.9%) | 47 (5.3%) |
| 65 to 74 Years | 7 (2.2%) | 0 (0.0%) |
| 75 Years and over | 23 (16.8%) | 22 (9.7%) |
Technology Access in Algonac
Computing Device Access in Algonac
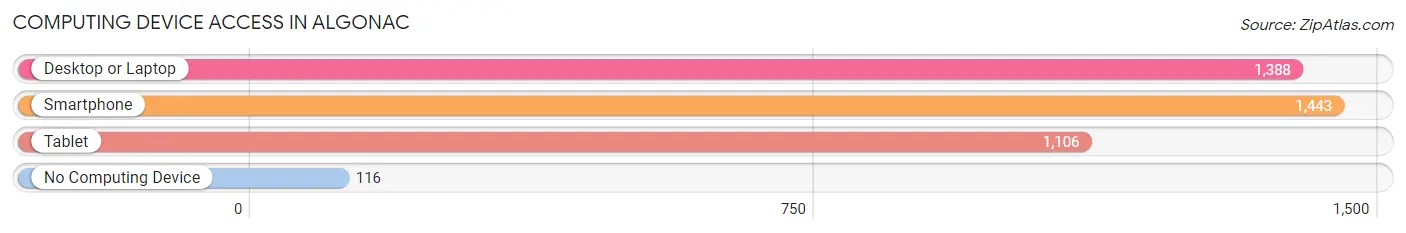
| Device Type | # Households | % Households |
| Desktop or Laptop | 1,388 | 76.2% |
| Smartphone | 1,443 | 79.2% |
| Tablet | 1,106 | 60.7% |
| No Computing Device | 116 | 6.4% |
| Total | 1,822 | 100.0% |
Internet Access in Algonac
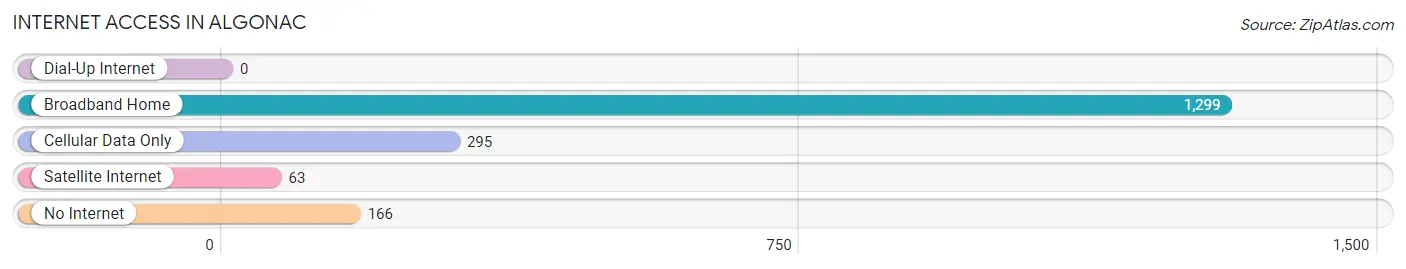
| Internet Type | # Households | % Households |
| Dial-Up Internet | 0 | 0.0% |
| Broadband Home | 1,299 | 71.3% |
| Cellular Data Only | 295 | 16.2% |
| Satellite Internet | 63 | 3.5% |
| No Internet | 166 | 9.1% |
| Total | 1,822 | 100.0% |
Algonac Summary
Algonac, Michigan is a small city located in St. Clair County, Michigan, United States. It is situated on the St. Clair River, which forms the border between Michigan and Ontario, Canada. The city is located approximately 40 miles northeast of Detroit and is part of the Thumb region of Michigan. As of the 2010 census, the city had a population of 4,110.
History
The area that is now Algonac was first settled in the early 1800s by French-Canadian fur traders. The city was originally known as “Clay Banks” due to the large deposits of clay in the area. In 1837, the name was changed to Algonac, which is derived from the Algonquin language and means “place of many fish”.
The city was incorporated in 1871 and was a major port for the lumber industry. The city was also home to several shipbuilding companies, including the Algonac Shipbuilding Company, which built the first steel-hulled vessel on the Great Lakes.
Geography
Algonac is located at 42°37′N 82°37′W (42.619, -82.619). According to the United States Census Bureau, the city has a total area of 2.2 square miles (5.7 km2), of which 1.9 square miles (4.9 km2) is land and 0.3 square miles (0.8 km2) is water.
The city is situated on the St. Clair River, which forms the border between Michigan and Ontario, Canada. The city is located approximately 40 miles northeast of Detroit and is part of the Thumb region of Michigan.
Economy
Algonac’s economy is largely based on tourism and manufacturing. The city is home to several manufacturing companies, including Algonac Manufacturing, which produces automotive parts, and Algonac Tool & Die, which produces industrial tools and dies.
The city is also home to several marinas, which attract tourists from all over the region. The city is also home to several restaurants, bars, and shops.
Demographics
As of the 2010 census, there were 4,110 people, 1,717 households, and 1,093 families residing in the city. The population density was 2,093.3 people per square mile (806.7/km2). There were 1,919 housing units at an average density of 990.2 per square mile (382.2/km2). The racial makeup of the city was 95.2% White, 0.7% African American, 0.4% Native American, 0.7% Asian, 0.1% Pacific Islander, 0.9% from other races, and 2.0% from two or more races. Hispanic or Latino of any race were 3.2% of the population.
There were 1,717 households, out of which 28.2% had children under the age of 18 living with them, 44.2% were married couples living together, 14.2% had a female householder with no husband present, and 36.2% were non-families. 30.3% of all households were made up of individuals, and 12.2% had someone living alone who was 65 years of age or older. The average household size was 2.37 and the average family size was 2.93.
In the city, the population was spread out, with 23.2% under the age of 18, 8.2% from 18 to 24, 28.2% from 25 to 44, 24.2% from 45 to 64, and 16.2% who were 65 years of age or older. The median age was 38 years. For every 100 females, there were 93.2 males. For every 100 females age 18 and over, there were 90.2 males.
The median income for a household in the city was $37,917, and the median income for a family was $45,000. Males had a median income of $36,250 versus $25,000 for females. The per capita income for the city was $19,845. About 8.2% of families and 10.2% of the population were below the poverty line, including 14.2% of those under age 18 and 6.2% of those age 65 or over.
Common Questions
What is Per Capita Income in Algonac?
Per Capita income in Algonac is $28,758.
What is the Median Family Income in Algonac?
Median Family Income in Algonac is $54,828.
What is the Median Household income in Algonac?
Median Household Income in Algonac is $50,703.
What is Income or Wage Gap in Algonac?
Income or Wage Gap in Algonac is 10.3%.
Women in Algonac earn 89.7 cents for every dollar earned by a man.
What is Inequality or Gini Index in Algonac?
Inequality or Gini Index in Algonac is 0.42.
What is the Total Population of Algonac?
Total Population of Algonac is 4,167.
What is the Total Male Population of Algonac?
Total Male Population of Algonac is 1,963.
What is the Total Female Population of Algonac?
Total Female Population of Algonac is 2,204.
What is the Ratio of Males per 100 Females in Algonac?
There are 89.07 Males per 100 Females in Algonac.
What is the Ratio of Females per 100 Males in Algonac?
There are 112.28 Females per 100 Males in Algonac.
What is the Median Population Age in Algonac?
Median Population Age in Algonac is 46.2 Years.
What is the Average Family Size in Algonac
Average Family Size in Algonac is 2.8 People.
What is the Average Household Size in Algonac
Average Household Size in Algonac is 2.3 People.
How Large is the Labor Force in Algonac?
There are 2,030 People in the Labor Forcein in Algonac.
What is the Percentage of People in the Labor Force in Algonac?
58.8% of People are in the Labor Force in Algonac.
What is the Unemployment Rate in Algonac?
Unemployment Rate in Algonac is 6.0%.