Oakley, MI Map & Demographics
Oakley Map
Oakley Overview
$25,475
PER CAPITA INCOME
$50,250
AVG FAMILY INCOME
$47,031
AVG HOUSEHOLD INCOME
26.4%
WAGE / INCOME GAP [ % ]
73.6¢/ $1
WAGE / INCOME GAP [ $ ]
0.34
INEQUALITY / GINI INDEX
270
TOTAL POPULATION
134
MALE POPULATION
136
FEMALE POPULATION
98.53
MALES / 100 FEMALES
101.49
FEMALES / 100 MALES
42.7
MEDIAN AGE
2.7
AVG FAMILY SIZE
2.3
AVG HOUSEHOLD SIZE
116
LABOR FORCE [ PEOPLE ]
56.0%
PERCENT IN LABOR FORCE
2.6%
UNEMPLOYMENT RATE
Oakley Zip Codes
Oakley Area Codes
Income in Oakley
Income Overview in Oakley
Per Capita Income in Oakley is $25,475, while median incomes of families and households are $50,250 and $47,031 respectively.
| Characteristic | Number | Measure |
| Per Capita Income | 270 | $25,475 |
| Median Family Income | 86 | $50,250 |
| Mean Family Income | 86 | $60,885 |
| Median Household Income | 117 | $47,031 |
| Mean Household Income | 117 | $59,630 |
| Income Deficit | 86 | $0 |
| Wage / Income Gap (%) | 270 | 26.37% |
| Wage / Income Gap ($) | 270 | 73.63¢ per $1 |
| Gini / Inequality Index | 270 | 0.34 |
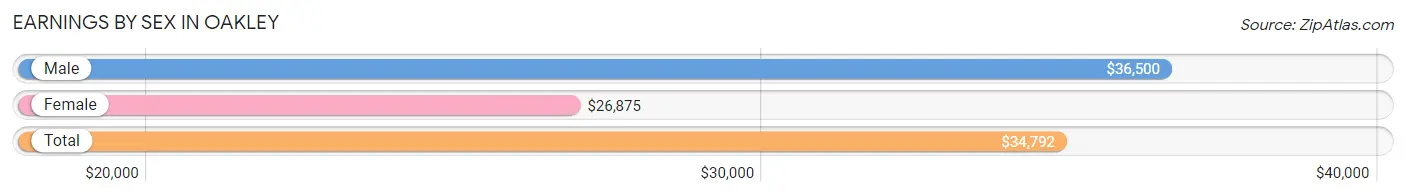
Earnings by Sex in Oakley
Average Earnings in Oakley are $34,792, $36,500 for men and $26,875 for women, a difference of 26.4%.
| Sex | Number | Average Earnings |
| Male | 68 (58.1%) | $36,500 |
| Female | 49 (41.9%) | $26,875 |
| Total | 117 (100.0%) | $34,792 |
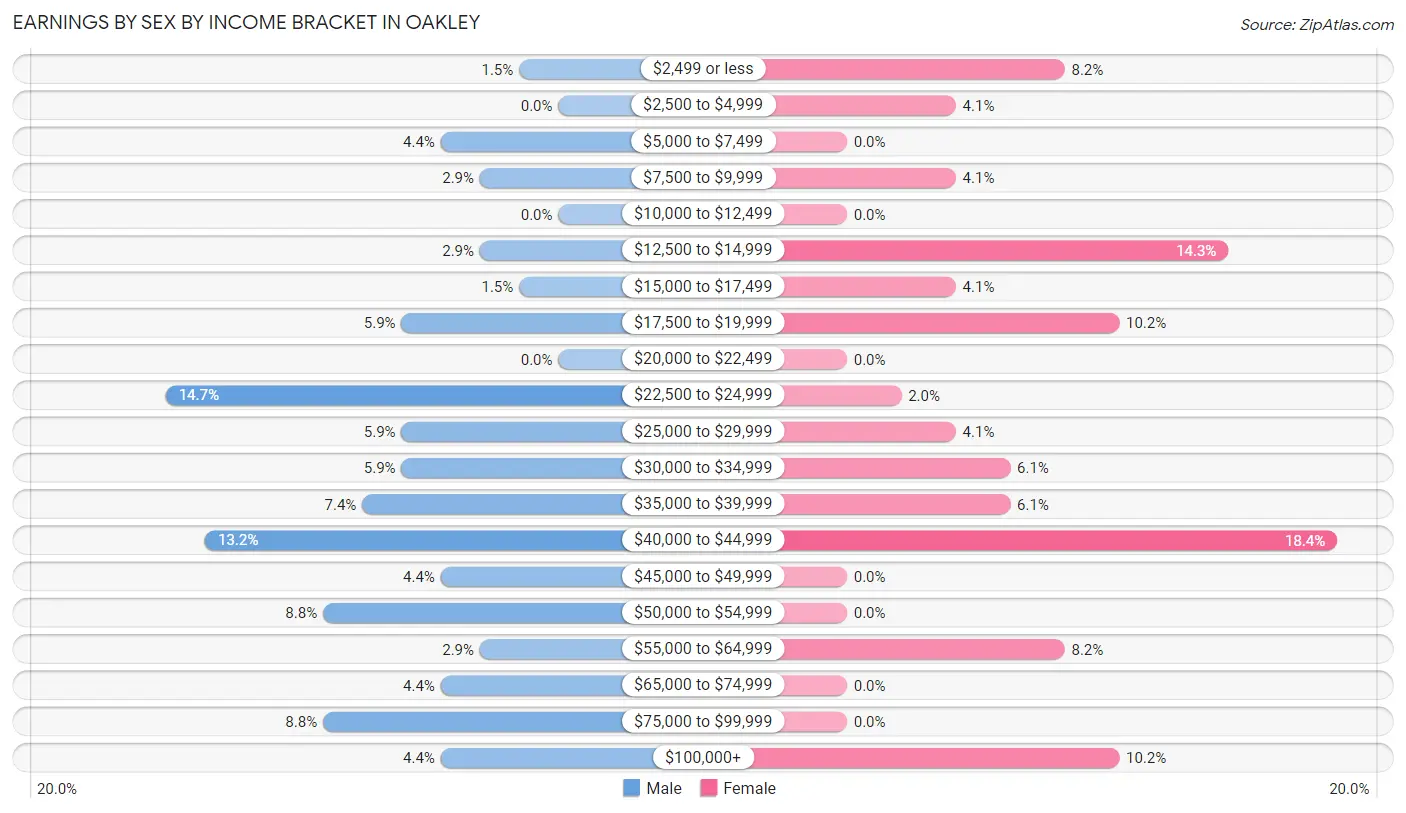
Earnings by Sex by Income Bracket in Oakley
The most common earnings brackets in Oakley are $22,500 to $24,999 for men (10 | 14.7%) and $40,000 to $44,999 for women (9 | 18.4%).
| Income | Male | Female |
| $2,499 or less | 1 (1.5%) | 4 (8.2%) |
| $2,500 to $4,999 | 0 (0.0%) | 2 (4.1%) |
| $5,000 to $7,499 | 3 (4.4%) | 0 (0.0%) |
| $7,500 to $9,999 | 2 (2.9%) | 2 (4.1%) |
| $10,000 to $12,499 | 0 (0.0%) | 0 (0.0%) |
| $12,500 to $14,999 | 2 (2.9%) | 7 (14.3%) |
| $15,000 to $17,499 | 1 (1.5%) | 2 (4.1%) |
| $17,500 to $19,999 | 4 (5.9%) | 5 (10.2%) |
| $20,000 to $22,499 | 0 (0.0%) | 0 (0.0%) |
| $22,500 to $24,999 | 10 (14.7%) | 1 (2.0%) |
| $25,000 to $29,999 | 4 (5.9%) | 2 (4.1%) |
| $30,000 to $34,999 | 4 (5.9%) | 3 (6.1%) |
| $35,000 to $39,999 | 5 (7.3%) | 3 (6.1%) |
| $40,000 to $44,999 | 9 (13.2%) | 9 (18.4%) |
| $45,000 to $49,999 | 3 (4.4%) | 0 (0.0%) |
| $50,000 to $54,999 | 6 (8.8%) | 0 (0.0%) |
| $55,000 to $64,999 | 2 (2.9%) | 4 (8.2%) |
| $65,000 to $74,999 | 3 (4.4%) | 0 (0.0%) |
| $75,000 to $99,999 | 6 (8.8%) | 0 (0.0%) |
| $100,000+ | 3 (4.4%) | 5 (10.2%) |
| Total | 68 (100.0%) | 49 (100.0%) |
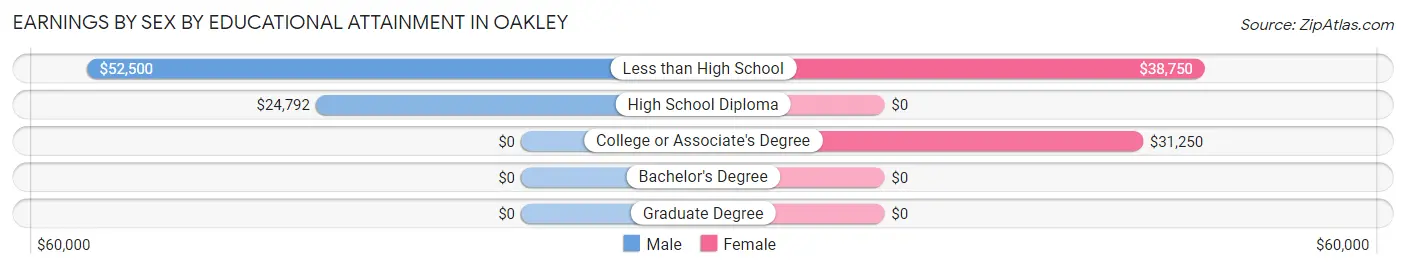
Earnings by Sex by Educational Attainment in Oakley
Average earnings in Oakley are $40,893 for men and $37,500 for women, a difference of 8.3%. Men with an educational attainment of less than high school enjoy the highest average annual earnings of $52,500, while those with high school diploma education earn the least with $24,792. Women with an educational attainment of less than high school earn the most with the average annual earnings of $38,750, while those with college or associate's degree education have the smallest earnings of $31,250.
| Educational Attainment | Male Income | Female Income |
| Less than High School | $52,500 | $38,750 |
| High School Diploma | $24,792 | $0 |
| College or Associate's Degree | - | - |
| Bachelor's Degree | - | - |
| Graduate Degree | - | - |
| Total | $40,893 | $37,500 |
Family Income in Oakley
Family Income Brackets in Oakley
According to the Oakley family income data, there are 21 families falling into the $75,000 to $99,999 income range, which is the most common income bracket and makes up 24.4% of all families.
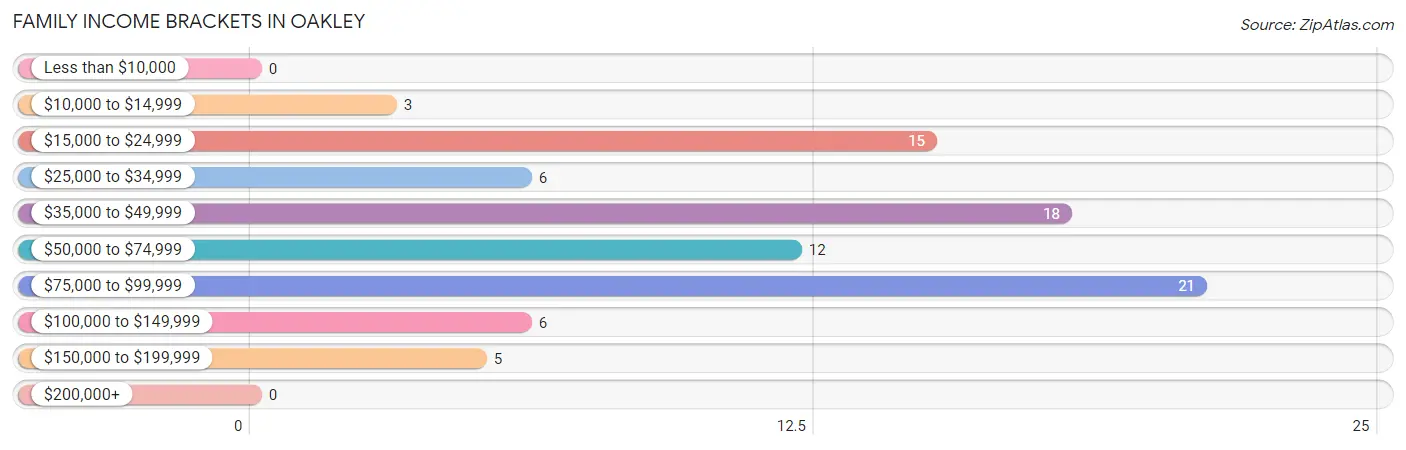
| Income Bracket | # Families | % Families |
| Less than $10,000 | 0 | 0.0% |
| $10,000 to $14,999 | 3 | 3.5% |
| $15,000 to $24,999 | 15 | 17.4% |
| $25,000 to $34,999 | 6 | 7.0% |
| $35,000 to $49,999 | 18 | 20.9% |
| $50,000 to $74,999 | 12 | 14.0% |
| $75,000 to $99,999 | 21 | 24.4% |
| $100,000 to $149,999 | 6 | 7.0% |
| $150,000 to $199,999 | 5 | 5.8% |
| $200,000+ | 0 | 0.0% |
Family Income by Famaliy Size in Oakley
2-person families (47 | 54.6%) account for the highest median family income in Oakley with $51,094 per family, while 2-person families (47 | 54.6%) have the highest median income of $25,547 per family member.
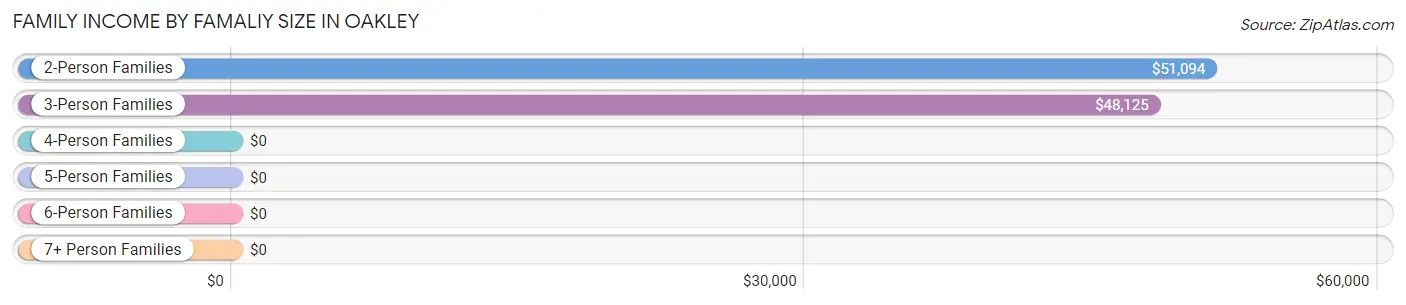
| Income Bracket | # Families | Median Income |
| 2-Person Families | 47 (54.6%) | $51,094 |
| 3-Person Families | 21 (24.4%) | $48,125 |
| 4-Person Families | 14 (16.3%) | $0 |
| 5-Person Families | 0 (0.0%) | $0 |
| 6-Person Families | 0 (0.0%) | $0 |
| 7+ Person Families | 4 (4.6%) | $0 |
| Total | 86 (100.0%) | $50,250 |
Family Income by Number of Earners in Oakley
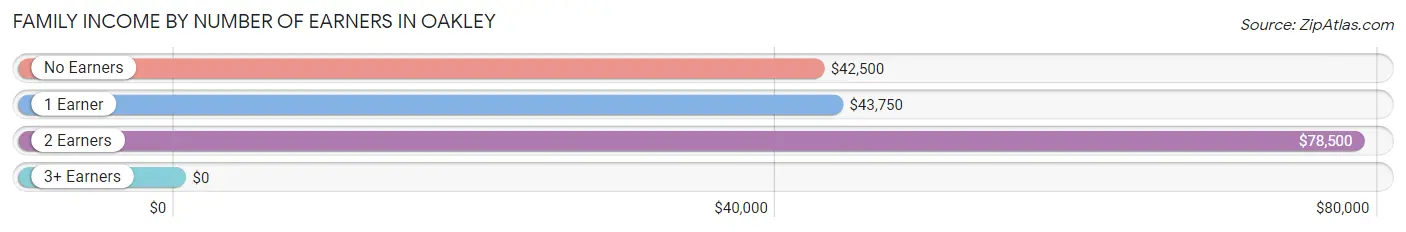
| Number of Earners | # Families | Median Income |
| No Earners | 24 (27.9%) | $42,500 |
| 1 Earner | 33 (38.4%) | $43,750 |
| 2 Earners | 26 (30.2%) | $78,500 |
| 3+ Earners | 3 (3.5%) | $0 |
| Total | 86 (100.0%) | $50,250 |
Household Income in Oakley
Household Income Brackets in Oakley
With 30 households falling in the category, the $35,000 to $49,999 income range is the most frequent in Oakley, accounting for 25.6% of all households.
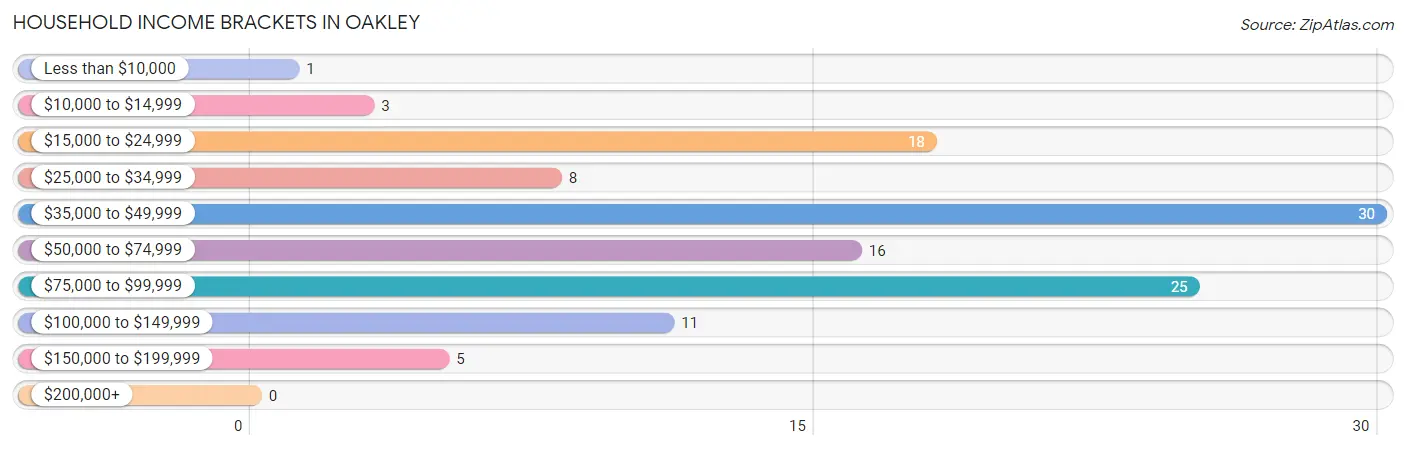
| Income Bracket | # Households | % Households |
| Less than $10,000 | 1 | 0.9% |
| $10,000 to $14,999 | 3 | 2.6% |
| $15,000 to $24,999 | 18 | 15.4% |
| $25,000 to $34,999 | 8 | 6.8% |
| $35,000 to $49,999 | 30 | 25.6% |
| $50,000 to $74,999 | 16 | 13.7% |
| $75,000 to $99,999 | 25 | 21.4% |
| $100,000 to $149,999 | 11 | 9.4% |
| $150,000 to $199,999 | 5 | 4.3% |
| $200,000+ | 0 | 0.0% |
Household Income by Householder Age in Oakley
The median household income in Oakley is $47,031, with the highest median household income of $61,250 found in the 45 to 64 years age bracket for the primary householder. A total of 31 households (26.5%) fall into this category. Meanwhile, the 15 to 24 years age bracket for the primary householder has the lowest median household income of $0, with 2 households (1.7%) in this group.
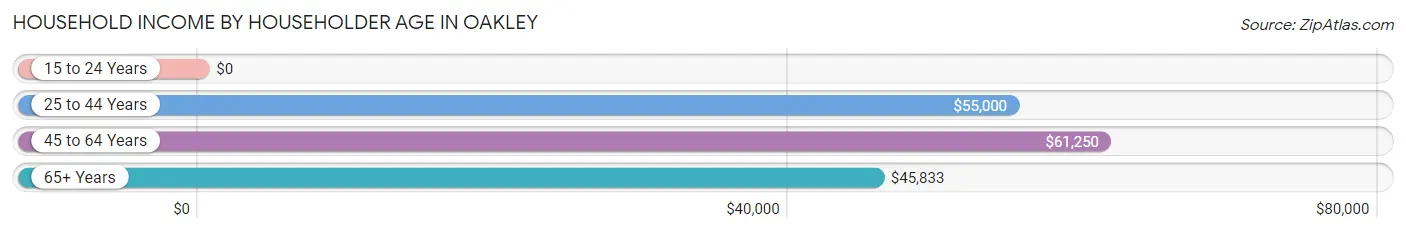
| Income Bracket | # Households | Median Income |
| 15 to 24 Years | 2 (1.7%) | $0 |
| 25 to 44 Years | 34 (29.1%) | $55,000 |
| 45 to 64 Years | 31 (26.5%) | $61,250 |
| 65+ Years | 50 (42.7%) | $45,833 |
| Total | 117 (100.0%) | $47,031 |
Poverty in Oakley
Income Below Poverty by Sex and Age in Oakley
With 12.7% poverty level for males and 30.1% for females among the residents of Oakley, 6 to 11 year old males and 5 year old females are the most vulnerable to poverty, with 4 males (57.1%) and 4 females (100.0%) in their respective age groups living below the poverty level.
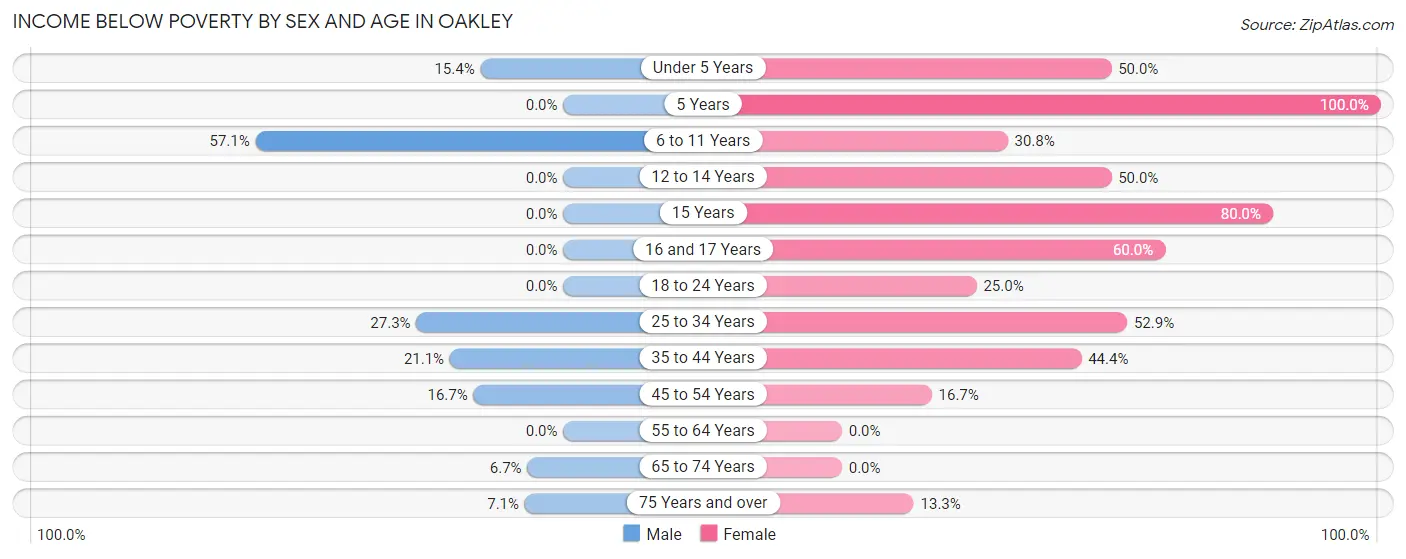
| Age Bracket | Male | Female |
| Under 5 Years | 2 (15.4%) | 4 (50.0%) |
| 5 Years | 0 (0.0%) | 4 (100.0%) |
| 6 to 11 Years | 4 (57.1%) | 4 (30.8%) |
| 12 to 14 Years | 0 (0.0%) | 4 (50.0%) |
| 15 Years | 0 (0.0%) | 4 (80.0%) |
| 16 and 17 Years | 0 (0.0%) | 3 (60.0%) |
| 18 to 24 Years | 0 (0.0%) | 2 (25.0%) |
| 25 to 34 Years | 3 (27.3%) | 9 (52.9%) |
| 35 to 44 Years | 4 (21.0%) | 4 (44.4%) |
| 45 to 54 Years | 1 (16.7%) | 1 (16.7%) |
| 55 to 64 Years | 0 (0.0%) | 0 (0.0%) |
| 65 to 74 Years | 2 (6.7%) | 0 (0.0%) |
| 75 Years and over | 1 (7.1%) | 2 (13.3%) |
| Total | 17 (12.7%) | 41 (30.1%) |
Income Above Poverty by Sex and Age in Oakley
According to the poverty statistics in Oakley, males aged 12 to 14 years and females aged 55 to 64 years are the age groups that are most secure financially, with 100.0% of males and 100.0% of females in these age groups living above the poverty line.
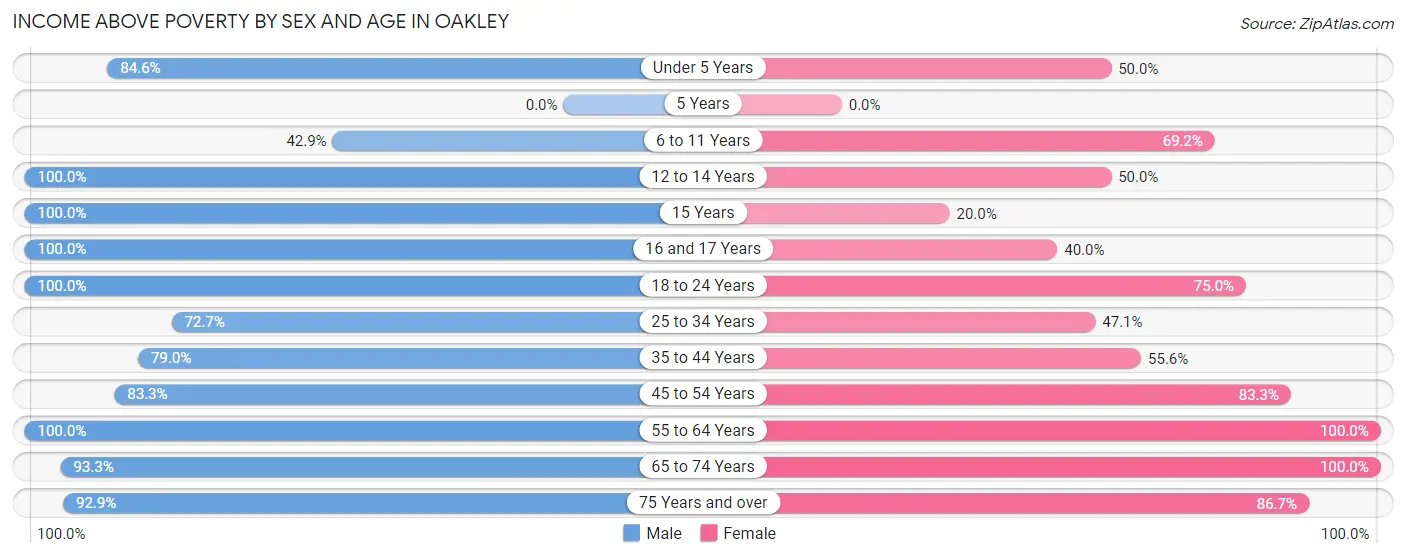
| Age Bracket | Male | Female |
| Under 5 Years | 11 (84.6%) | 4 (50.0%) |
| 5 Years | 0 (0.0%) | 0 (0.0%) |
| 6 to 11 Years | 3 (42.9%) | 9 (69.2%) |
| 12 to 14 Years | 2 (100.0%) | 4 (50.0%) |
| 15 Years | 3 (100.0%) | 1 (20.0%) |
| 16 and 17 Years | 3 (100.0%) | 2 (40.0%) |
| 18 to 24 Years | 9 (100.0%) | 6 (75.0%) |
| 25 to 34 Years | 8 (72.7%) | 8 (47.1%) |
| 35 to 44 Years | 15 (78.9%) | 5 (55.6%) |
| 45 to 54 Years | 5 (83.3%) | 5 (83.3%) |
| 55 to 64 Years | 17 (100.0%) | 26 (100.0%) |
| 65 to 74 Years | 28 (93.3%) | 12 (100.0%) |
| 75 Years and over | 13 (92.9%) | 13 (86.7%) |
| Total | 117 (87.3%) | 95 (69.9%) |
Income Below Poverty Among Married-Couple Families in Oakley
The poverty statistics for married-couple families in Oakley show that 20.0% or 11 of the total 55 families live below the poverty line. Families with 5 or more children have the highest poverty rate of 100.0%, comprising of 4 families. On the other hand, families with no children have the lowest poverty rate of 9.7%, which includes 3 families.
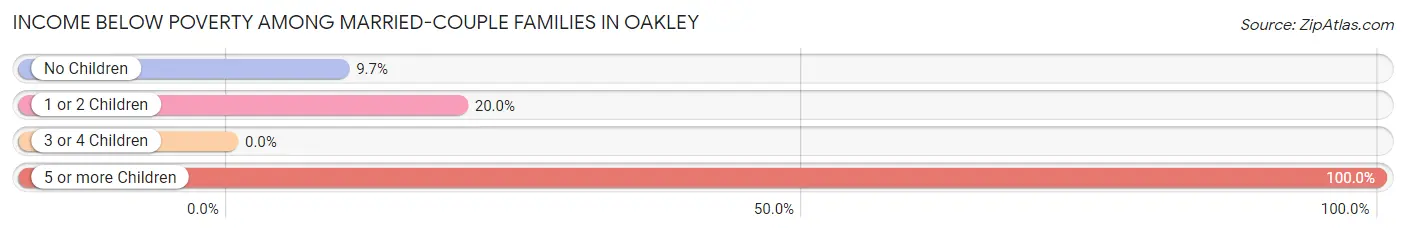
| Children | Above Poverty | Below Poverty |
| No Children | 28 (90.3%) | 3 (9.7%) |
| 1 or 2 Children | 16 (80.0%) | 4 (20.0%) |
| 3 or 4 Children | 0 (0.0%) | 0 (0.0%) |
| 5 or more Children | 0 (0.0%) | 4 (100.0%) |
| Total | 44 (80.0%) | 11 (20.0%) |
Income Below Poverty Among Single-Parent Households in Oakley
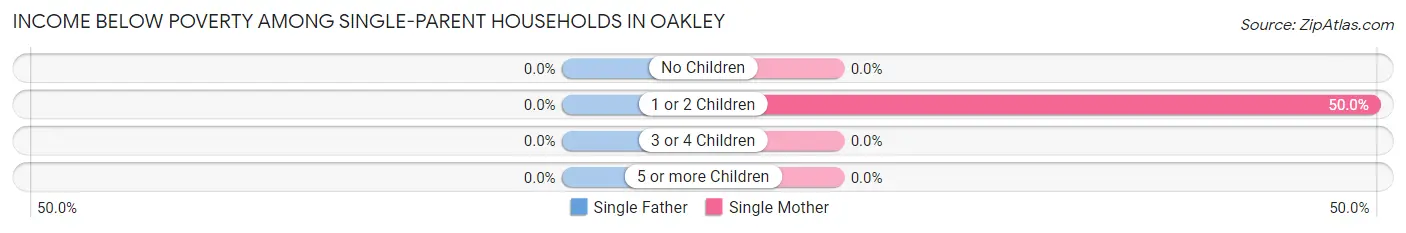
| Children | Single Father | Single Mother |
| No Children | 0 (0.0%) | 0 (0.0%) |
| 1 or 2 Children | 0 (0.0%) | 5 (50.0%) |
| 3 or 4 Children | 0 (0.0%) | 0 (0.0%) |
| 5 or more Children | 0 (0.0%) | 0 (0.0%) |
| Total | 0 (0.0%) | 5 (33.3%) |
Income Below Poverty Among Married-Couple vs Single-Parent Households in Oakley
The poverty data for Oakley shows that 11 of the married-couple family households (20.0%) and 5 of the single-parent households (16.1%) are living below the poverty level. Within the married-couple family households, those with 5 or more children have the highest poverty rate, with 4 households (100.0%) falling below the poverty line. Among the single-parent households, those with 1 or 2 children have the highest poverty rate, with 5 household (29.4%) living below poverty.
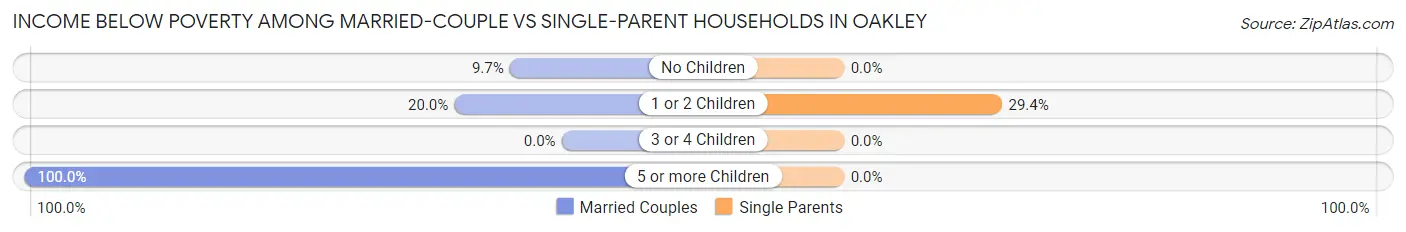
| Children | Married-Couple Families | Single-Parent Households |
| No Children | 3 (9.7%) | 0 (0.0%) |
| 1 or 2 Children | 4 (20.0%) | 5 (29.4%) |
| 3 or 4 Children | 0 (0.0%) | 0 (0.0%) |
| 5 or more Children | 4 (100.0%) | 0 (0.0%) |
| Total | 11 (20.0%) | 5 (16.1%) |
Race in Oakley
The most populous races in Oakley are White / Caucasian (256 | 94.8%), Hispanic or Latino (7 | 2.6%), and Two or more Races (6 | 2.2%).
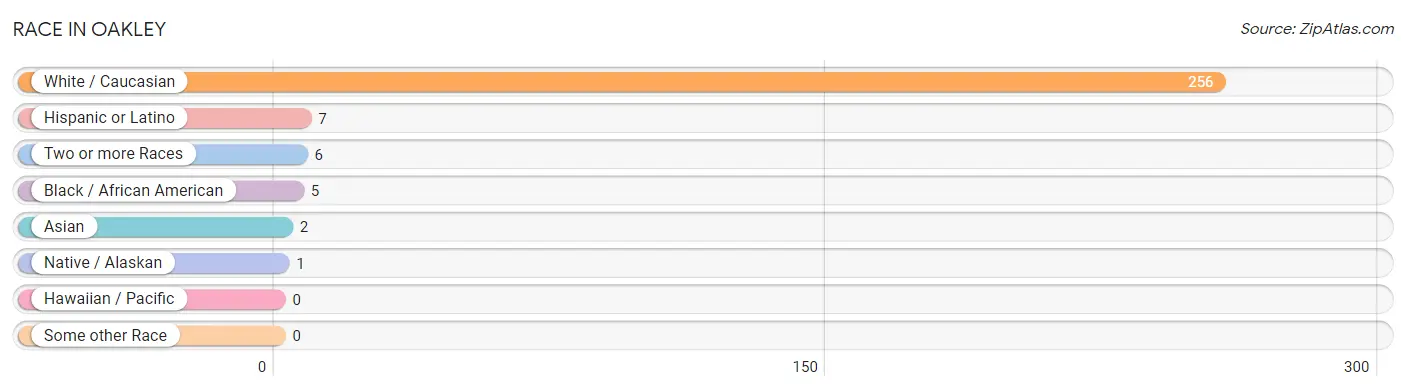
| Race | # Population | % Population |
| Asian | 2 | 0.7% |
| Black / African American | 5 | 1.8% |
| Hawaiian / Pacific | 0 | 0.0% |
| Hispanic or Latino | 7 | 2.6% |
| Native / Alaskan | 1 | 0.4% |
| White / Caucasian | 256 | 94.8% |
| Two or more Races | 6 | 2.2% |
| Some other Race | 0 | 0.0% |
| Total | 270 | 100.0% |
Ancestry in Oakley
The most populous ancestries reported in Oakley are German (82 | 30.4%), Irish (36 | 13.3%), American (29 | 10.7%), French (18 | 6.7%), and English (13 | 4.8%), together accounting for 65.9% of all Oakley residents.
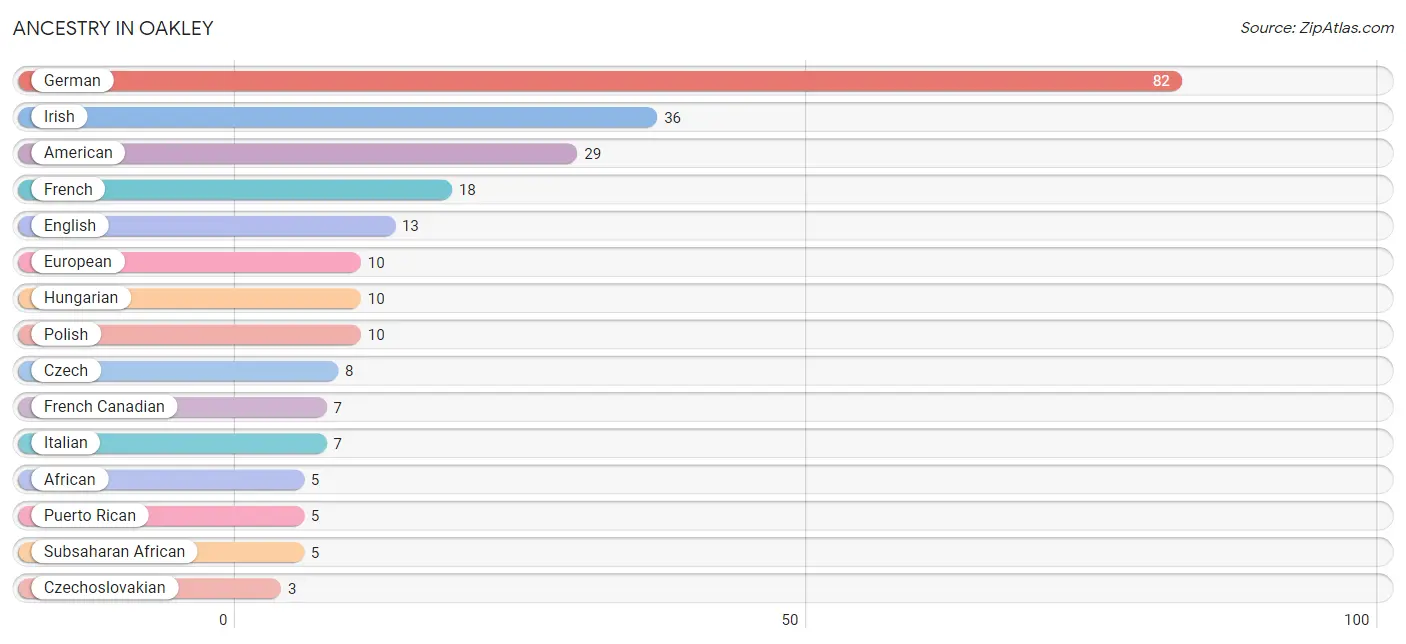
| Ancestry | # Population | % Population |
| African | 5 | 1.8% |
| American | 29 | 10.7% |
| Bhutanese | 2 | 0.7% |
| Choctaw | 1 | 0.4% |
| Czech | 8 | 3.0% |
| Czechoslovakian | 3 | 1.1% |
| Dutch | 3 | 1.1% |
| English | 13 | 4.8% |
| European | 10 | 3.7% |
| Finnish | 2 | 0.7% |
| French | 18 | 6.7% |
| French Canadian | 7 | 2.6% |
| German | 82 | 30.4% |
| Hungarian | 10 | 3.7% |
| Irish | 36 | 13.3% |
| Italian | 7 | 2.6% |
| Mexican | 2 | 0.7% |
| Norwegian | 2 | 0.7% |
| Polish | 10 | 3.7% |
| Puerto Rican | 5 | 1.8% |
| Romanian | 3 | 1.1% |
| Russian | 2 | 0.7% |
| Scotch-Irish | 1 | 0.4% |
| Scottish | 2 | 0.7% |
| Slovak | 2 | 0.7% |
| Subsaharan African | 5 | 1.8% |
| Welsh | 3 | 1.1% | View All 27 Rows |
Immigrants in Oakley

| Immigration Origin | # Population | % Population | View All 0 Rows |
Sex and Age in Oakley
Sex and Age in Oakley
The most populous age groups in Oakley are 55 to 59 Years (16 | 11.9%) for men and 55 to 59 Years (17 | 12.5%) for women.
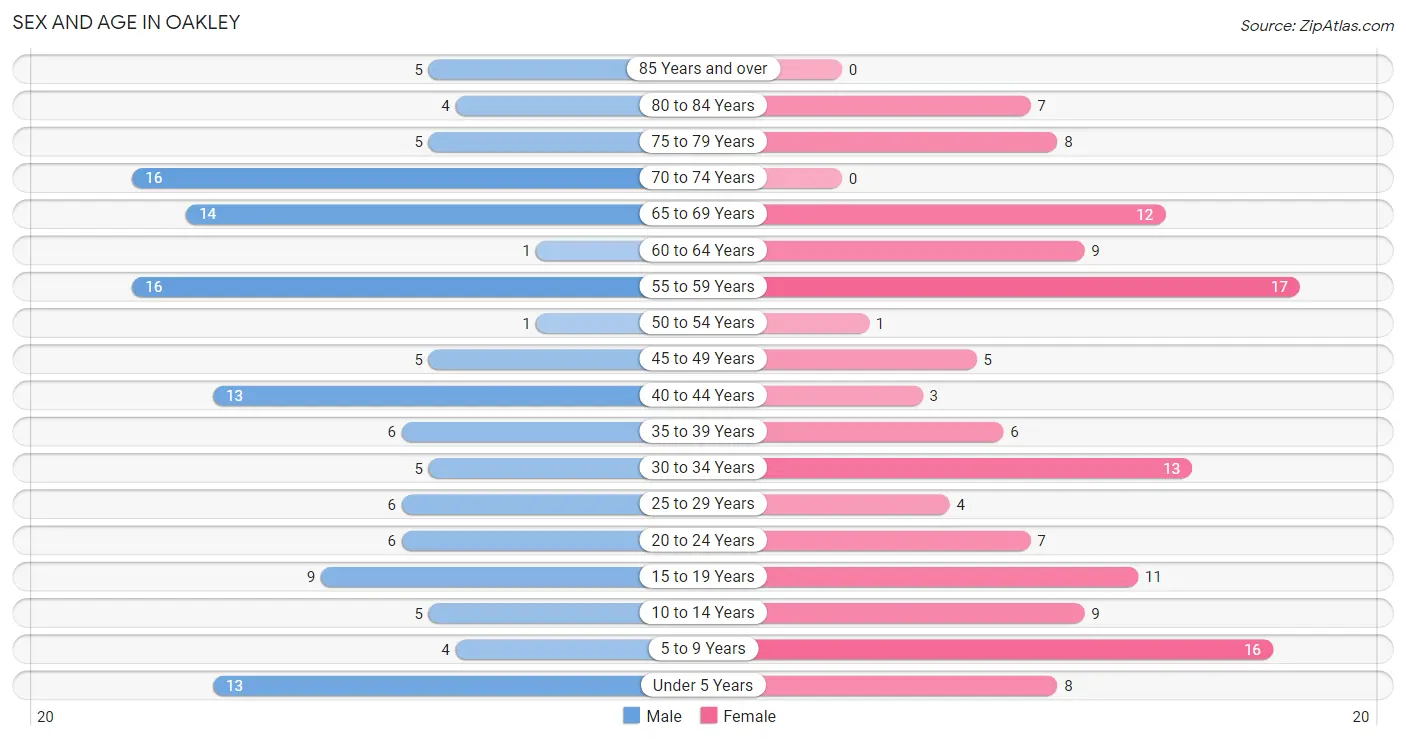
| Age Bracket | Male | Female |
| Under 5 Years | 13 (9.7%) | 8 (5.9%) |
| 5 to 9 Years | 4 (3.0%) | 16 (11.8%) |
| 10 to 14 Years | 5 (3.7%) | 9 (6.6%) |
| 15 to 19 Years | 9 (6.7%) | 11 (8.1%) |
| 20 to 24 Years | 6 (4.5%) | 7 (5.1%) |
| 25 to 29 Years | 6 (4.5%) | 4 (2.9%) |
| 30 to 34 Years | 5 (3.7%) | 13 (9.6%) |
| 35 to 39 Years | 6 (4.5%) | 6 (4.4%) |
| 40 to 44 Years | 13 (9.7%) | 3 (2.2%) |
| 45 to 49 Years | 5 (3.7%) | 5 (3.7%) |
| 50 to 54 Years | 1 (0.7%) | 1 (0.7%) |
| 55 to 59 Years | 16 (11.9%) | 17 (12.5%) |
| 60 to 64 Years | 1 (0.7%) | 9 (6.6%) |
| 65 to 69 Years | 14 (10.4%) | 12 (8.8%) |
| 70 to 74 Years | 16 (11.9%) | 0 (0.0%) |
| 75 to 79 Years | 5 (3.7%) | 8 (5.9%) |
| 80 to 84 Years | 4 (3.0%) | 7 (5.1%) |
| 85 Years and over | 5 (3.7%) | 0 (0.0%) |
| Total | 134 (100.0%) | 136 (100.0%) |
Families and Households in Oakley
Median Family Size in Oakley
The median family size in Oakley is 2.70 persons per family, with married-couple families (55 | 63.9%) accounting for the largest median family size of 2.95 persons per family. On the other hand, single female/mother families (15 | 17.4%) represent the smallest median family size with 2.07 persons per family.
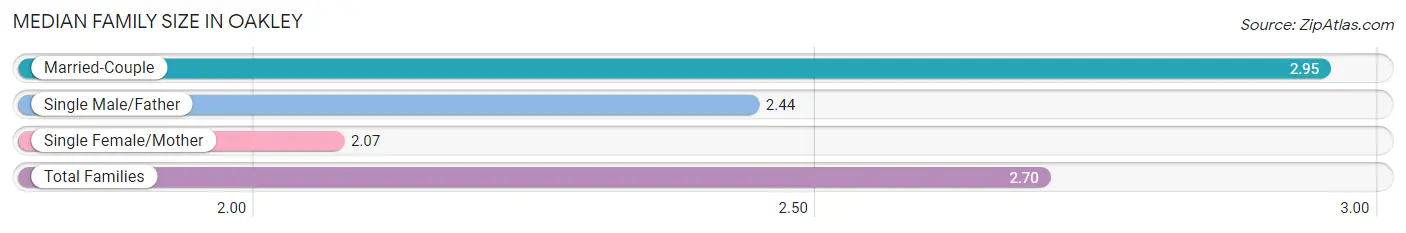
| Family Type | # Families | Family Size |
| Married-Couple | 55 (63.9%) | 2.95 |
| Single Male/Father | 16 (18.6%) | 2.44 |
| Single Female/Mother | 15 (17.4%) | 2.07 |
| Total Families | 86 (100.0%) | 2.70 |
Median Household Size in Oakley
The median household size in Oakley is 2.31 persons per household, with married-couple households (55 | 47.0%) accounting for the largest median household size of 2.95 persons per household. non-family households (31 | 26.5%) represent the smallest median household size with 1.06 persons per household.
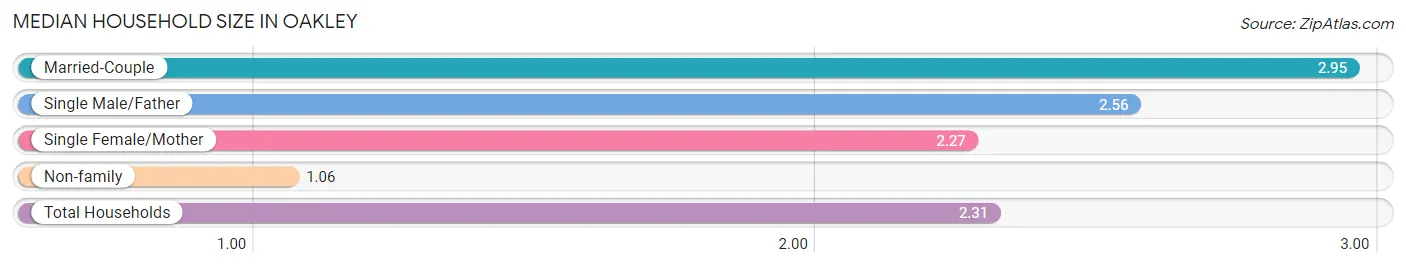
| Household Type | # Households | Household Size |
| Married-Couple | 55 (47.0%) | 2.95 |
| Single Male/Father | 16 (13.7%) | 2.56 |
| Single Female/Mother | 15 (12.8%) | 2.27 |
| Non-family | 31 (26.5%) | 1.06 |
| Total Households | 117 (100.0%) | 2.31 |
Household Size by Marriage Status in Oakley
Out of a total of 117 households in Oakley, 86 (73.5%) are family households, while 31 (26.5%) are nonfamily households. The most numerous type of family households are 2-person households, comprising 46, and the most common type of nonfamily households are 1-person households, comprising 29.
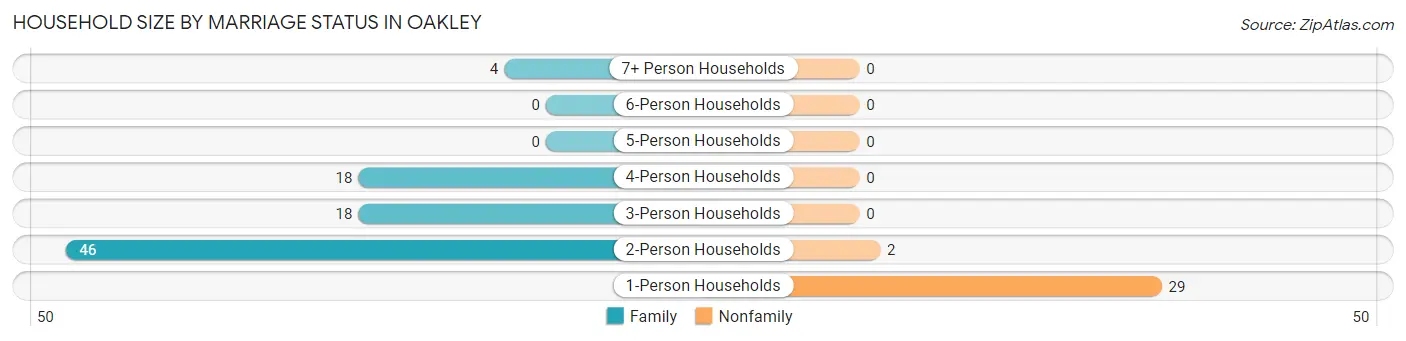
| Household Size | Family Households | Nonfamily Households |
| 1-Person Households | - | 29 (24.8%) |
| 2-Person Households | 46 (39.3%) | 2 (1.7%) |
| 3-Person Households | 18 (15.4%) | 0 (0.0%) |
| 4-Person Households | 18 (15.4%) | 0 (0.0%) |
| 5-Person Households | 0 (0.0%) | 0 (0.0%) |
| 6-Person Households | 0 (0.0%) | 0 (0.0%) |
| 7+ Person Households | 4 (3.4%) | 0 (0.0%) |
| Total | 86 (73.5%) | 31 (26.5%) |
Female Fertility in Oakley
Fertility by Age in Oakley
| Age Bracket | Women with Births | Births / 1,000 Women |
| 15 to 19 years | 0 (0.0%) | 0.0 |
| 20 to 34 years | 0 (0.0%) | 0.0 |
| 35 to 50 years | 0 (0.0%) | 0.0 |
| Total | 0 (0.0%) | 0.0 |
Fertility by Age by Marriage Status in Oakley
| Age Bracket | Married | Unmarried |
| 15 to 19 years | 0 (0.0%) | 0 (0.0%) |
| 20 to 34 years | 0 (0.0%) | 0 (0.0%) |
| 35 to 50 years | 0 (0.0%) | 0 (0.0%) |
| Total | 0 (0.0%) | 0 (0.0%) |
Fertility by Education in Oakley
| Educational Attainment | Women with Births | Births / 1,000 Women |
| Less than High School | 0 (0.0%) | 0.0 |
| High School Diploma | 0 (0.0%) | 0.0 |
| College or Associate's Degree | 0 (0.0%) | 0.0 |
| Bachelor's Degree | 0 (0.0%) | 0.0 |
| Graduate Degree | 0 (0.0%) | 0.0 |
| Total | 0 (0.0%) | 0.0 |
Fertility by Education by Marriage Status in Oakley
| Educational Attainment | Married | Unmarried |
| Less than High School | 0 (0.0%) | 0 (0.0%) |
| High School Diploma | 0 (0.0%) | 0 (0.0%) |
| College or Associate's Degree | 0 (0.0%) | 0 (0.0%) |
| Bachelor's Degree | 0 (0.0%) | 0 (0.0%) |
| Graduate Degree | 0 (0.0%) | 0 (0.0%) |
| Total | 0 (0.0%) | 0 (0.0%) |
Employment Characteristics in Oakley
Employment by Class of Employer in Oakley
Among the 104 employed individuals in Oakley, private company employees (89 | 85.6%), not-for-profit organizations (5 | 4.8%), and self-employed (not incorporated) (4 | 3.8%) make up the most common classes of employment.
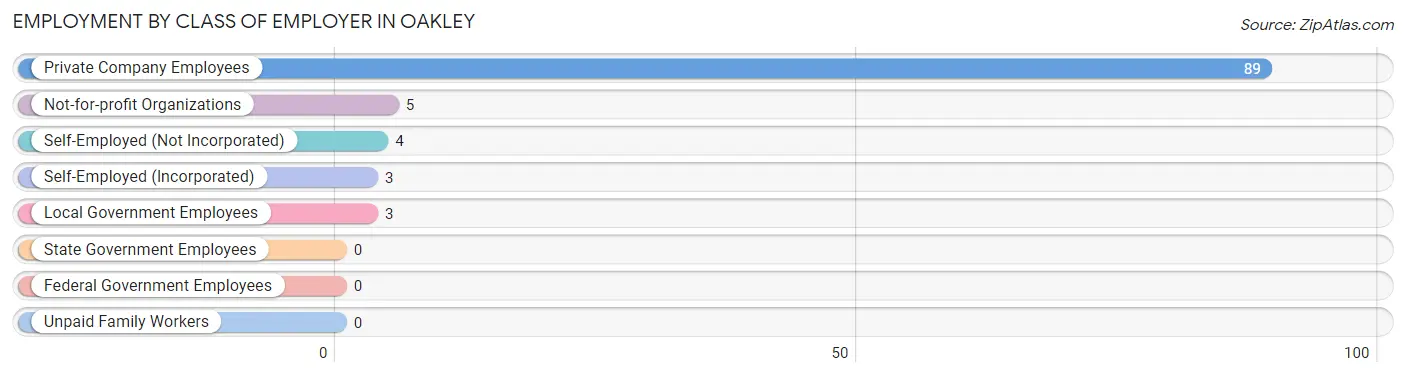
| Employer Class | # Employees | % Employees |
| Private Company Employees | 89 | 85.6% |
| Self-Employed (Incorporated) | 3 | 2.9% |
| Self-Employed (Not Incorporated) | 4 | 3.8% |
| Not-for-profit Organizations | 5 | 4.8% |
| Local Government Employees | 3 | 2.9% |
| State Government Employees | 0 | 0.0% |
| Federal Government Employees | 0 | 0.0% |
| Unpaid Family Workers | 0 | 0.0% |
| Total | 104 | 100.0% |
Employment Status by Age in Oakley
According to the labor force statistics for Oakley, out of the total population over 16 years of age (207), 56.0% or 116 individuals are in the labor force, with 2.6% or 3 of them unemployed. The age group with the highest labor force participation rate is 20 to 24 years, with 100.0% or 13 individuals in the labor force. Within the labor force, the 75 years and over age range has the highest percentage of unemployed individuals, with 33.3% or 1 of them being unemployed.
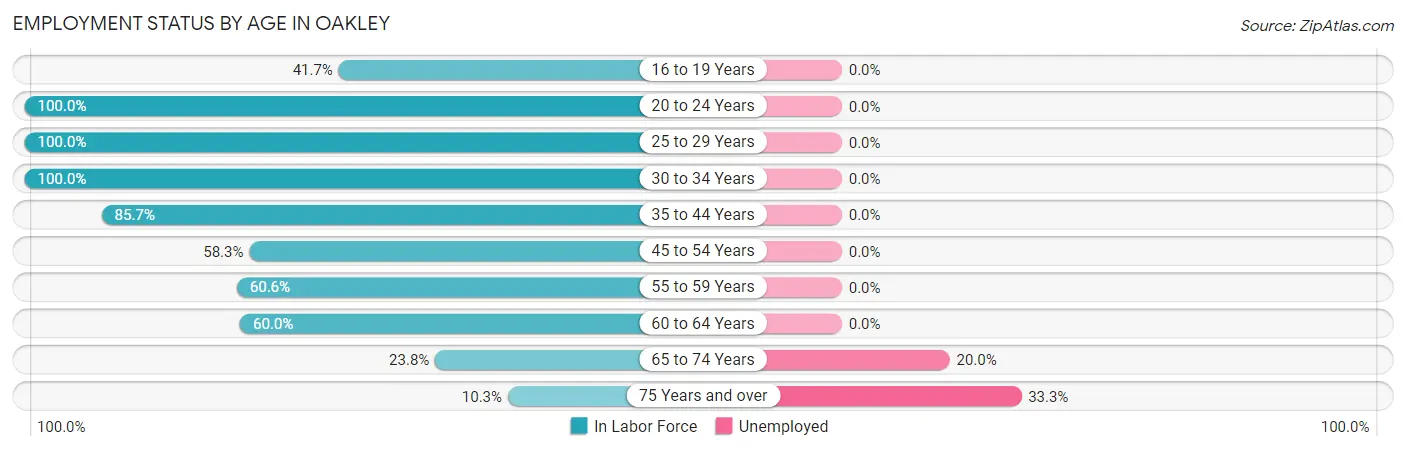
| Age Bracket | In Labor Force | Unemployed |
| 16 to 19 Years | 5 (41.7%) | 0 (0.0%) |
| 20 to 24 Years | 13 (100.0%) | 0 (0.0%) |
| 25 to 29 Years | 10 (100.0%) | 0 (0.0%) |
| 30 to 34 Years | 18 (100.0%) | 0 (0.0%) |
| 35 to 44 Years | 24 (85.7%) | 0 (0.0%) |
| 45 to 54 Years | 7 (58.3%) | 0 (0.0%) |
| 55 to 59 Years | 20 (60.6%) | 0 (0.0%) |
| 60 to 64 Years | 6 (60.0%) | 0 (0.0%) |
| 65 to 74 Years | 10 (23.8%) | 2 (20.0%) |
| 75 Years and over | 3 (10.3%) | 1 (33.3%) |
| Total | 116 (56.0%) | 3 (2.6%) |
Employment Status by Educational Attainment in Oakley
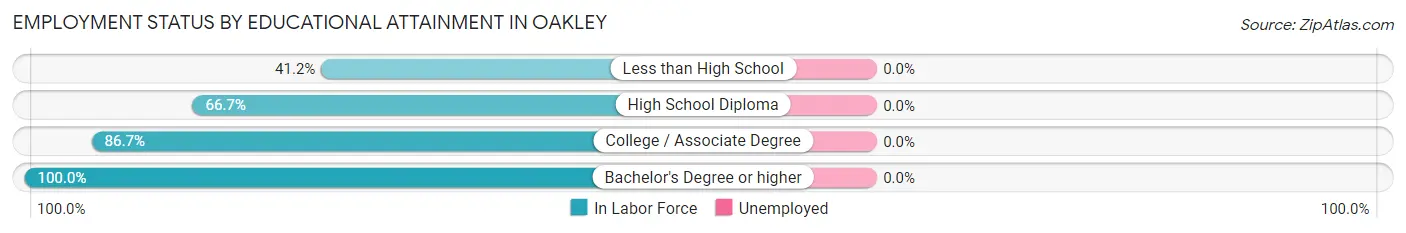
| Educational Attainment | In Labor Force | Unemployed |
| Less than High School | 7 (41.2%) | 0 (0.0%) |
| High School Diploma | 16 (66.7%) | 0 (0.0%) |
| College / Associate Degree | 52 (86.7%) | 0 (0.0%) |
| Bachelor's Degree or higher | 10 (100.0%) | 0 (0.0%) |
| Total | 85 (76.6%) | 0 (0.0%) |
Employment Occupations by Sex in Oakley
Management, Business, Science and Arts Occupations
The most common Management, Business, Science and Arts occupations in Oakley are Business & Financial (4 | 3.5%), Community & Social Service (2 | 1.8%), Education, Arts & Media (2 | 1.8%), Health Diagnosing & Treating (2 | 1.8%), and Health Technologists (2 | 1.8%).
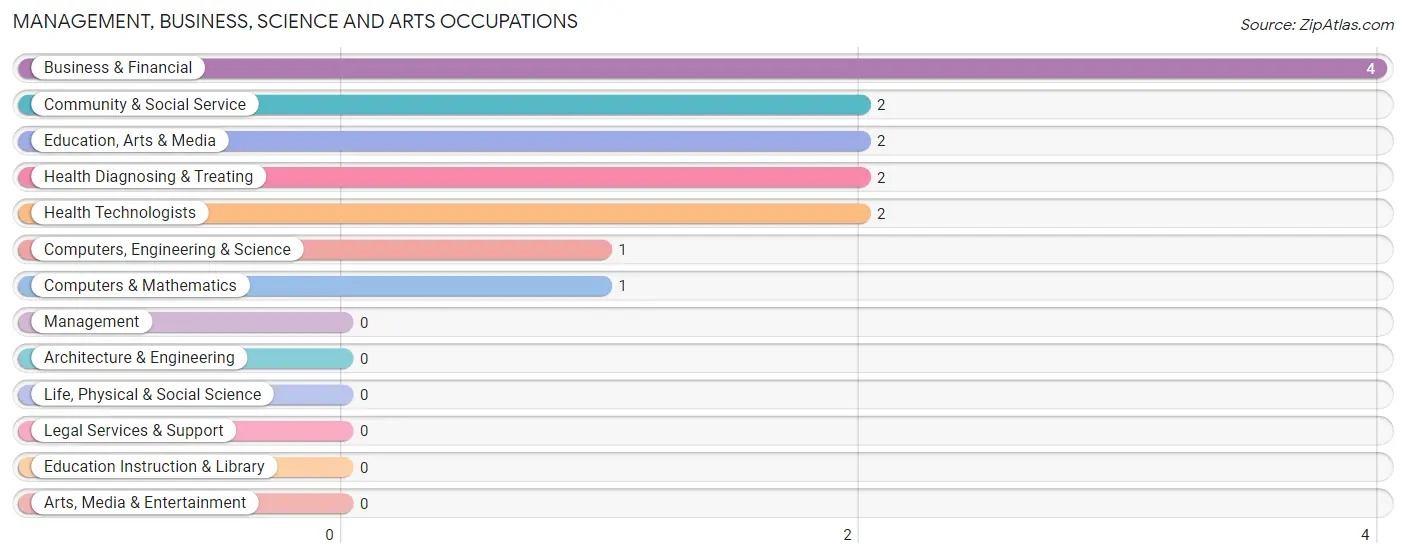
Management, Business, Science and Arts Occupations by Sex
Within the Management, Business, Science and Arts occupations in Oakley, the most male-oriented occupations are Business & Financial (100.0%), Computers, Engineering & Science (100.0%), and Computers & Mathematics (100.0%), while the most female-oriented occupations are Health Diagnosing & Treating (100.0%), Health Technologists (100.0%), and Community & Social Service (50.0%).
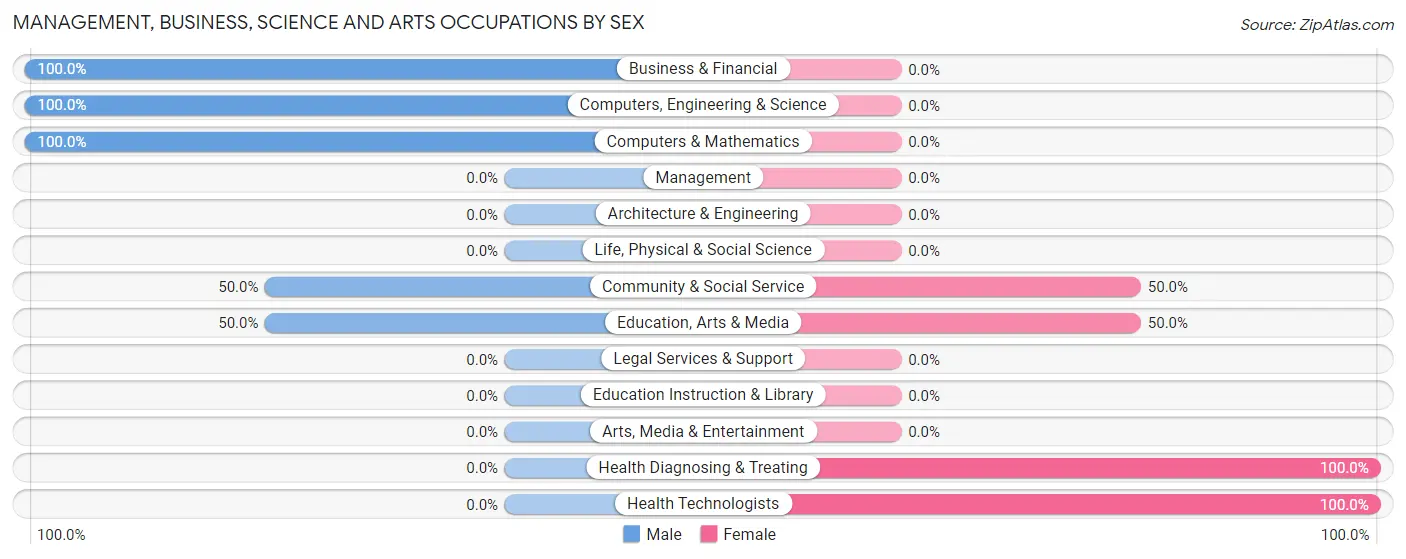
| Occupation | Male | Female |
| Management | 0 (0.0%) | 0 (0.0%) |
| Business & Financial | 4 (100.0%) | 0 (0.0%) |
| Computers, Engineering & Science | 1 (100.0%) | 0 (0.0%) |
| Computers & Mathematics | 1 (100.0%) | 0 (0.0%) |
| Architecture & Engineering | 0 (0.0%) | 0 (0.0%) |
| Life, Physical & Social Science | 0 (0.0%) | 0 (0.0%) |
| Community & Social Service | 1 (50.0%) | 1 (50.0%) |
| Education, Arts & Media | 1 (50.0%) | 1 (50.0%) |
| Legal Services & Support | 0 (0.0%) | 0 (0.0%) |
| Education Instruction & Library | 0 (0.0%) | 0 (0.0%) |
| Arts, Media & Entertainment | 0 (0.0%) | 0 (0.0%) |
| Health Diagnosing & Treating | 0 (0.0%) | 2 (100.0%) |
| Health Technologists | 0 (0.0%) | 2 (100.0%) |
| Total (Category) | 6 (66.7%) | 3 (33.3%) |
| Total (Overall) | 64 (56.6%) | 49 (43.4%) |
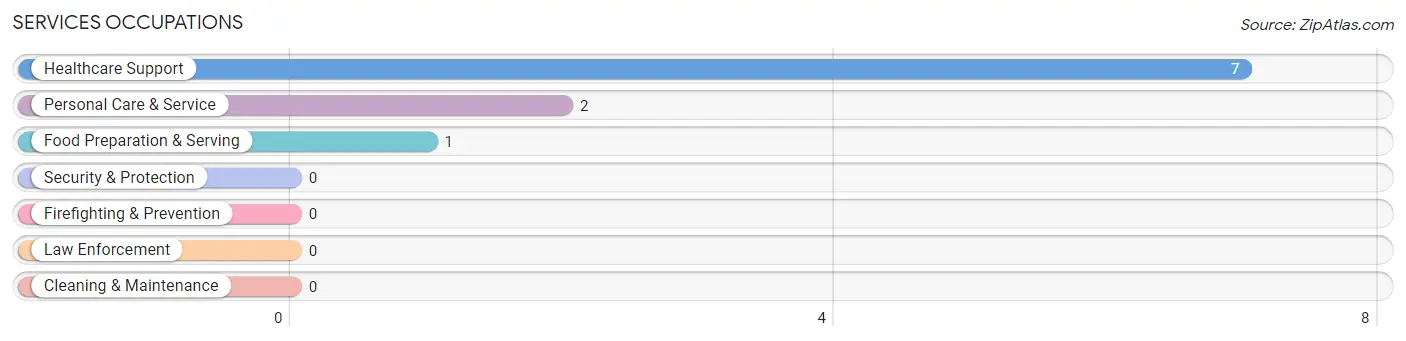
Services Occupations
The most common Services occupations in Oakley are Healthcare Support (7 | 6.2%), Personal Care & Service (2 | 1.8%), and Food Preparation & Serving (1 | 0.9%).
Services Occupations by Sex
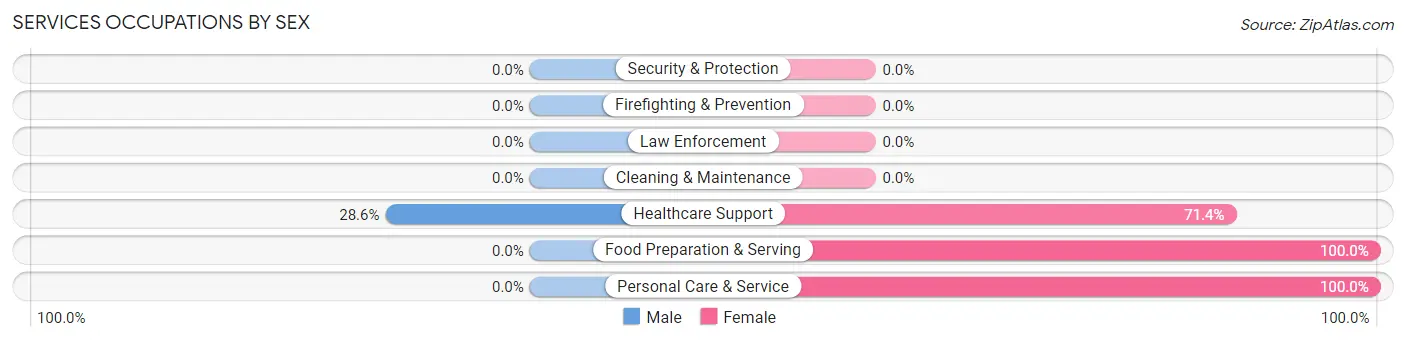
| Occupation | Male | Female |
| Healthcare Support | 2 (28.6%) | 5 (71.4%) |
| Security & Protection | 0 (0.0%) | 0 (0.0%) |
| Firefighting & Prevention | 0 (0.0%) | 0 (0.0%) |
| Law Enforcement | 0 (0.0%) | 0 (0.0%) |
| Food Preparation & Serving | 0 (0.0%) | 1 (100.0%) |
| Cleaning & Maintenance | 0 (0.0%) | 0 (0.0%) |
| Personal Care & Service | 0 (0.0%) | 2 (100.0%) |
| Total (Category) | 2 (20.0%) | 8 (80.0%) |
| Total (Overall) | 64 (56.6%) | 49 (43.4%) |
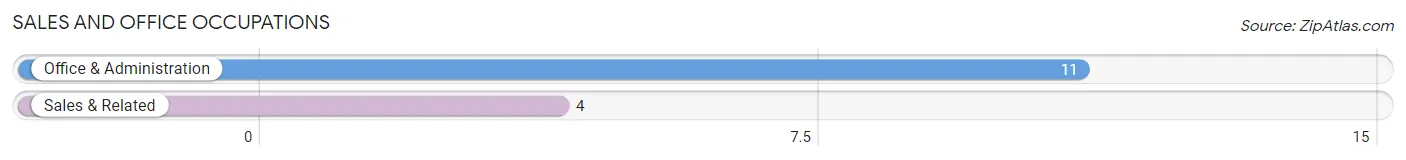
Sales and Office Occupations
The most common Sales and Office occupations in Oakley are Office & Administration (11 | 9.7%), and Sales & Related (4 | 3.5%).
Sales and Office Occupations by Sex
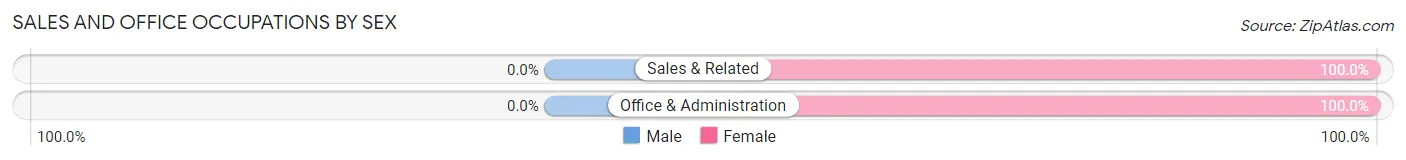
| Occupation | Male | Female |
| Sales & Related | 0 (0.0%) | 4 (100.0%) |
| Office & Administration | 0 (0.0%) | 11 (100.0%) |
| Total (Category) | 0 (0.0%) | 15 (100.0%) |
| Total (Overall) | 64 (56.6%) | 49 (43.4%) |
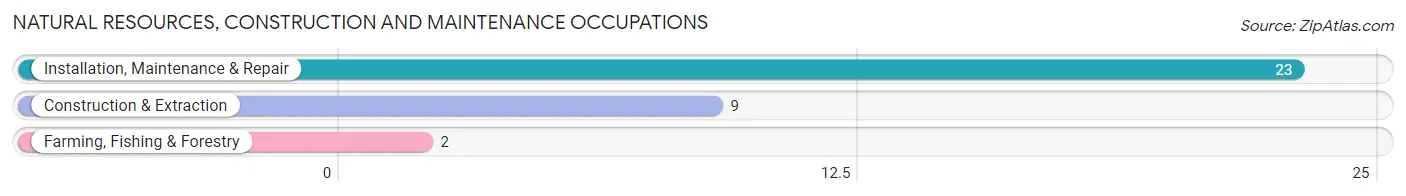
Natural Resources, Construction and Maintenance Occupations
The most common Natural Resources, Construction and Maintenance occupations in Oakley are Installation, Maintenance & Repair (23 | 20.3%), Construction & Extraction (9 | 8.0%), and Farming, Fishing & Forestry (2 | 1.8%).
Natural Resources, Construction and Maintenance Occupations by Sex
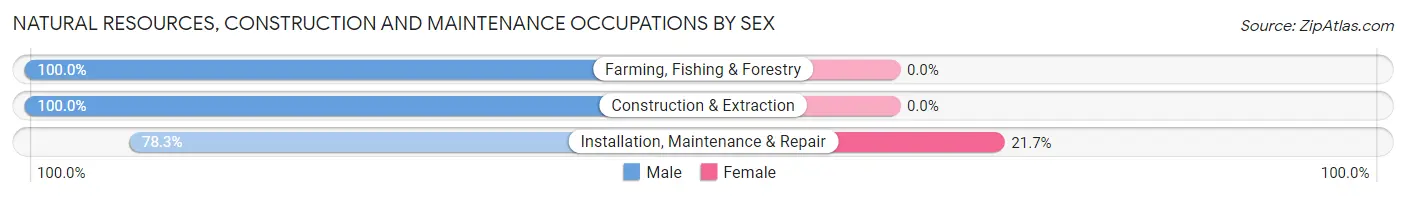
| Occupation | Male | Female |
| Farming, Fishing & Forestry | 2 (100.0%) | 0 (0.0%) |
| Construction & Extraction | 9 (100.0%) | 0 (0.0%) |
| Installation, Maintenance & Repair | 18 (78.3%) | 5 (21.7%) |
| Total (Category) | 29 (85.3%) | 5 (14.7%) |
| Total (Overall) | 64 (56.6%) | 49 (43.4%) |
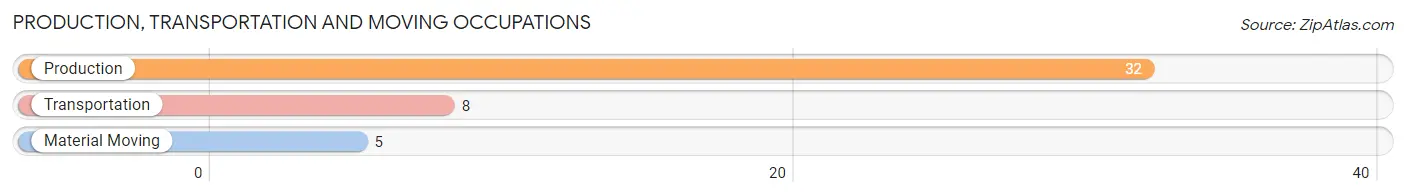
Production, Transportation and Moving Occupations
The most common Production, Transportation and Moving occupations in Oakley are Production (32 | 28.3%), Transportation (8 | 7.1%), and Material Moving (5 | 4.4%).
Production, Transportation and Moving Occupations by Sex
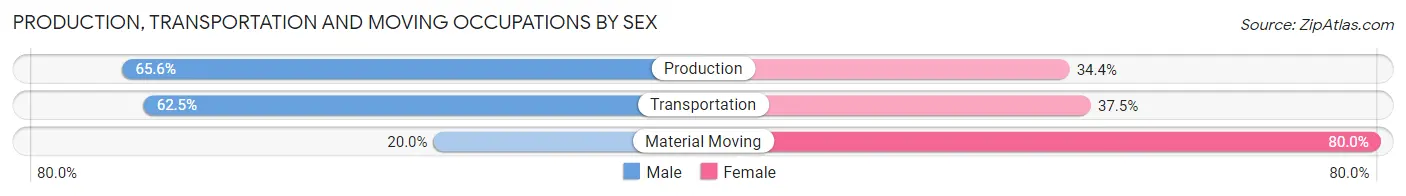
| Occupation | Male | Female |
| Production | 21 (65.6%) | 11 (34.4%) |
| Transportation | 5 (62.5%) | 3 (37.5%) |
| Material Moving | 1 (20.0%) | 4 (80.0%) |
| Total (Category) | 27 (60.0%) | 18 (40.0%) |
| Total (Overall) | 64 (56.6%) | 49 (43.4%) |
Employment Industries by Sex in Oakley
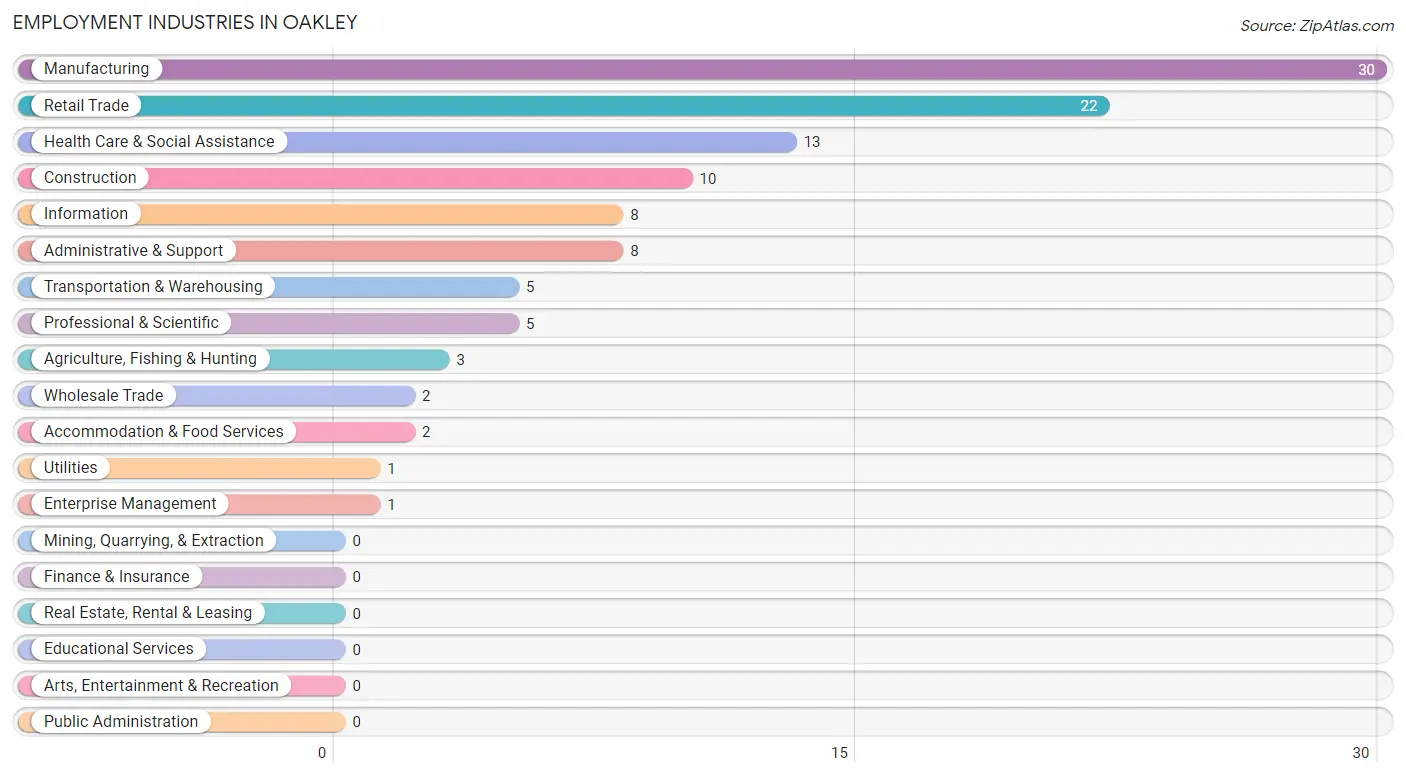
Employment Industries in Oakley
The major employment industries in Oakley include Manufacturing (30 | 26.6%), Retail Trade (22 | 19.5%), Health Care & Social Assistance (13 | 11.5%), Construction (10 | 8.8%), and Information (8 | 7.1%).
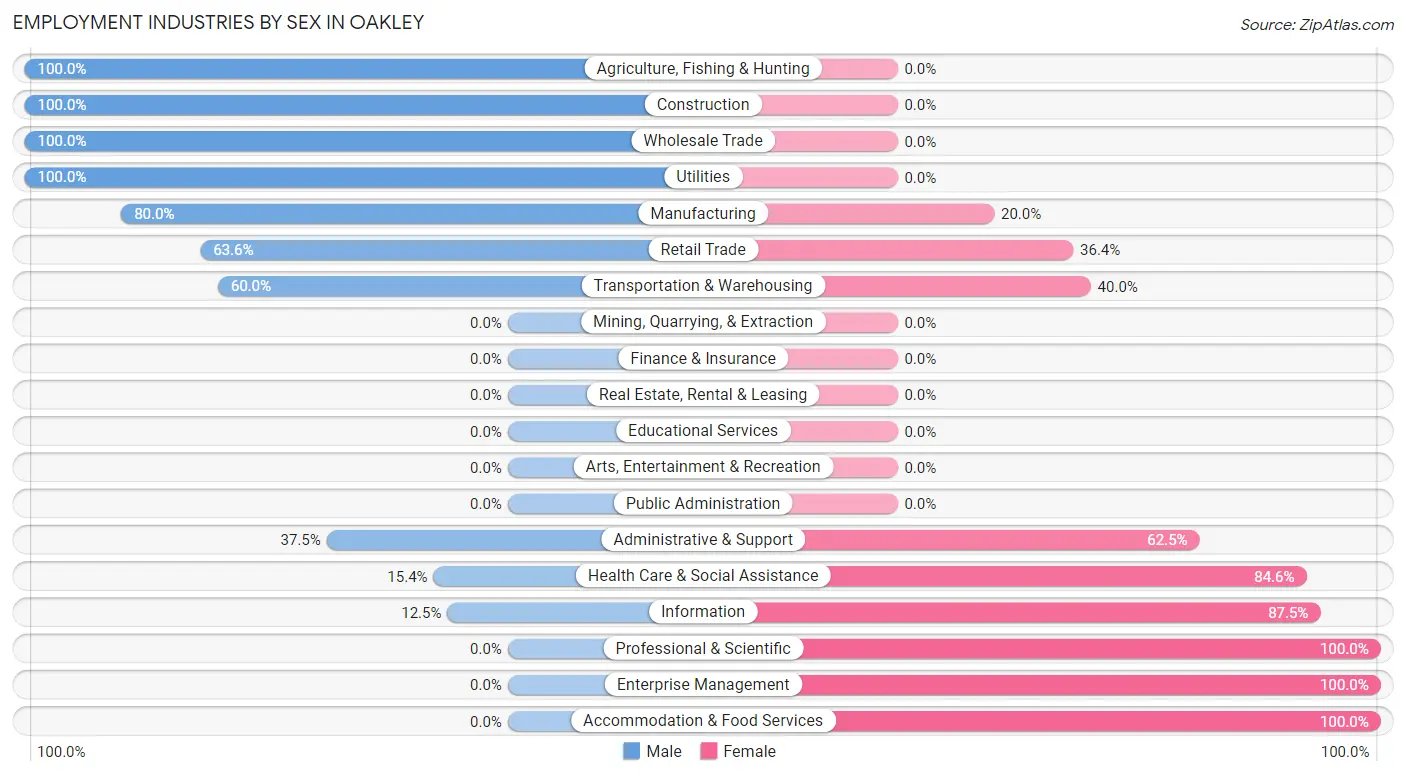
Employment Industries by Sex in Oakley
The Oakley industries that see more men than women are Agriculture, Fishing & Hunting (100.0%), Construction (100.0%), and Wholesale Trade (100.0%), whereas the industries that tend to have a higher number of women are Professional & Scientific (100.0%), Enterprise Management (100.0%), and Accommodation & Food Services (100.0%).
| Industry | Male | Female |
| Agriculture, Fishing & Hunting | 3 (100.0%) | 0 (0.0%) |
| Mining, Quarrying, & Extraction | 0 (0.0%) | 0 (0.0%) |
| Construction | 10 (100.0%) | 0 (0.0%) |
| Manufacturing | 24 (80.0%) | 6 (20.0%) |
| Wholesale Trade | 2 (100.0%) | 0 (0.0%) |
| Retail Trade | 14 (63.6%) | 8 (36.4%) |
| Transportation & Warehousing | 3 (60.0%) | 2 (40.0%) |
| Utilities | 1 (100.0%) | 0 (0.0%) |
| Information | 1 (12.5%) | 7 (87.5%) |
| Finance & Insurance | 0 (0.0%) | 0 (0.0%) |
| Real Estate, Rental & Leasing | 0 (0.0%) | 0 (0.0%) |
| Professional & Scientific | 0 (0.0%) | 5 (100.0%) |
| Enterprise Management | 0 (0.0%) | 1 (100.0%) |
| Administrative & Support | 3 (37.5%) | 5 (62.5%) |
| Educational Services | 0 (0.0%) | 0 (0.0%) |
| Health Care & Social Assistance | 2 (15.4%) | 11 (84.6%) |
| Arts, Entertainment & Recreation | 0 (0.0%) | 0 (0.0%) |
| Accommodation & Food Services | 0 (0.0%) | 2 (100.0%) |
| Public Administration | 0 (0.0%) | 0 (0.0%) |
| Total | 64 (56.6%) | 49 (43.4%) |
Education in Oakley
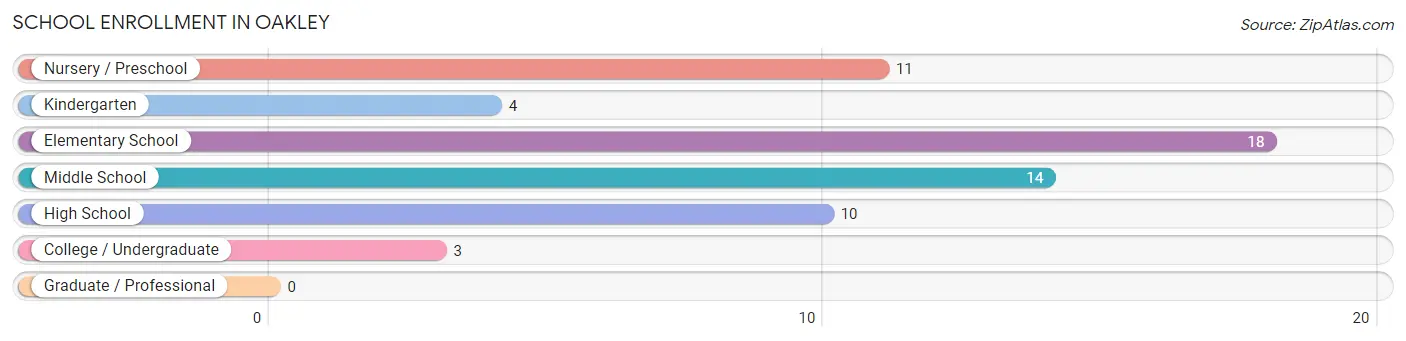
School Enrollment in Oakley
The most common levels of schooling among the 60 students in Oakley are elementary school (18 | 30.0%), middle school (14 | 23.3%), and nursery / preschool (11 | 18.3%).
| School Level | # Students | % Students |
| Nursery / Preschool | 11 | 18.3% |
| Kindergarten | 4 | 6.7% |
| Elementary School | 18 | 30.0% |
| Middle School | 14 | 23.3% |
| High School | 10 | 16.7% |
| College / Undergraduate | 3 | 5.0% |
| Graduate / Professional | 0 | 0.0% |
| Total | 60 | 100.0% |
School Enrollment by Age by Funding Source in Oakley
Out of a total of 60 students who are enrolled in schools in Oakley, 2 (3.3%) attend a private institution, while the remaining 58 (96.7%) are enrolled in public schools. The age group of 35 years and over has the highest likelihood of being enrolled in private schools, with 2 (66.7% in the age bracket) enrolled. Conversely, the age group of 3 to 4 year olds has the lowest likelihood of being enrolled in a private school, with 11 (100.0% in the age bracket) attending a public institution.
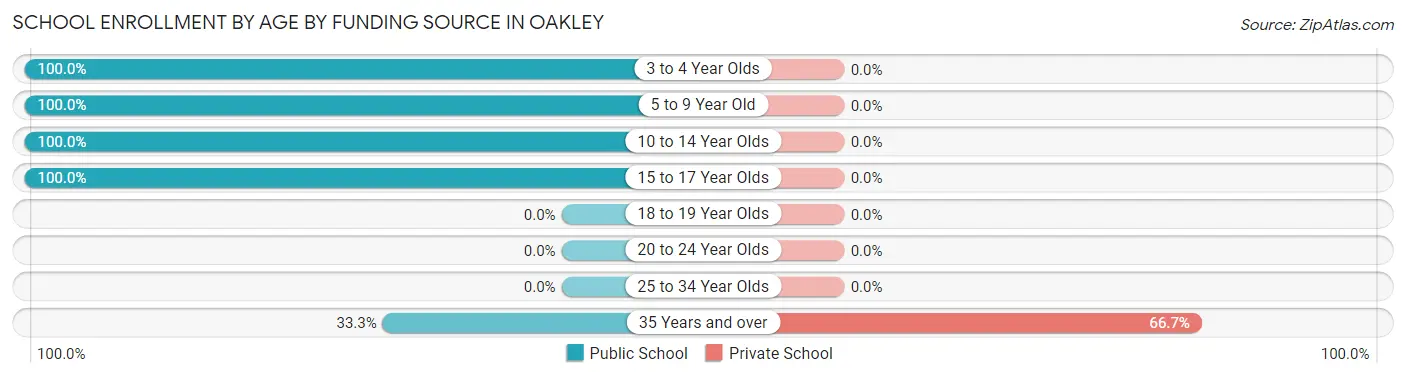
| Age Bracket | Public School | Private School |
| 3 to 4 Year Olds | 11 (100.0%) | 0 (0.0%) |
| 5 to 9 Year Old | 20 (100.0%) | 0 (0.0%) |
| 10 to 14 Year Olds | 10 (100.0%) | 0 (0.0%) |
| 15 to 17 Year Olds | 16 (100.0%) | 0 (0.0%) |
| 18 to 19 Year Olds | 0 (0.0%) | 0 (0.0%) |
| 20 to 24 Year Olds | 0 (0.0%) | 0 (0.0%) |
| 25 to 34 Year Olds | 0 (0.0%) | 0 (0.0%) |
| 35 Years and over | 1 (33.3%) | 2 (66.7%) |
| Total | 58 (96.7%) | 2 (3.3%) |
Educational Attainment by Field of Study in Oakley
Social sciences (6 | 35.3%), education (5 | 29.4%), arts & humanities (2 | 11.8%), physical & health sciences (1 | 5.9%), and business (1 | 5.9%) are the most common fields of study among 17 individuals in Oakley who have obtained a bachelor's degree or higher.
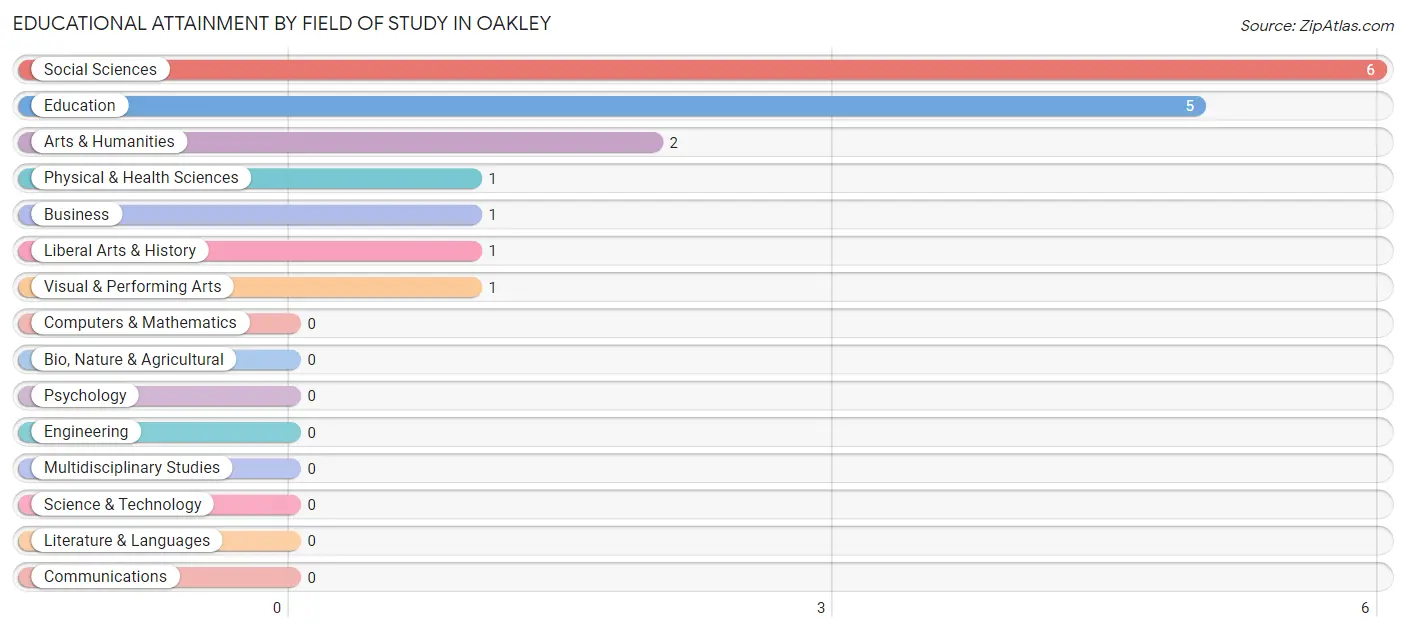
| Field of Study | # Graduates | % Graduates |
| Computers & Mathematics | 0 | 0.0% |
| Bio, Nature & Agricultural | 0 | 0.0% |
| Physical & Health Sciences | 1 | 5.9% |
| Psychology | 0 | 0.0% |
| Social Sciences | 6 | 35.3% |
| Engineering | 0 | 0.0% |
| Multidisciplinary Studies | 0 | 0.0% |
| Science & Technology | 0 | 0.0% |
| Business | 1 | 5.9% |
| Education | 5 | 29.4% |
| Literature & Languages | 0 | 0.0% |
| Liberal Arts & History | 1 | 5.9% |
| Visual & Performing Arts | 1 | 5.9% |
| Communications | 0 | 0.0% |
| Arts & Humanities | 2 | 11.8% |
| Total | 17 | 100.0% |
Transportation & Commute in Oakley
Vehicle Availability by Sex in Oakley
The most prevalent vehicle ownership categories in Oakley are males with 1 vehicle (24, accounting for 40.0%) and females with 1 vehicle (10, making up 54.5%).
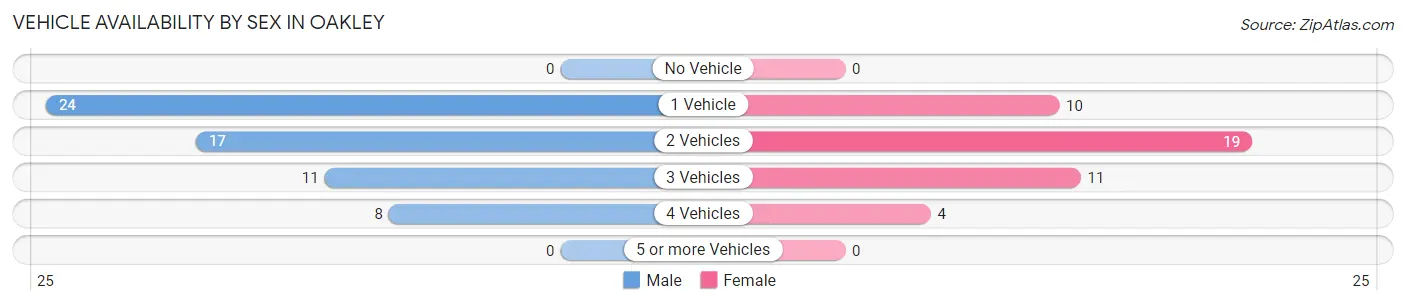
| Vehicles Available | Male | Female |
| No Vehicle | 0 (0.0%) | 0 (0.0%) |
| 1 Vehicle | 24 (40.0%) | 10 (22.7%) |
| 2 Vehicles | 17 (28.3%) | 19 (43.2%) |
| 3 Vehicles | 11 (18.3%) | 11 (25.0%) |
| 4 Vehicles | 8 (13.3%) | 4 (9.1%) |
| 5 or more Vehicles | 0 (0.0%) | 0 (0.0%) |
| Total | 60 (100.0%) | 44 (100.0%) |
Commute Time in Oakley
The most frequently occuring commute durations in Oakley are 20 to 24 minutes (31 commuters, 32.6%), 15 to 19 minutes (12 commuters, 12.6%), and 45 to 59 minutes (10 commuters, 10.5%).
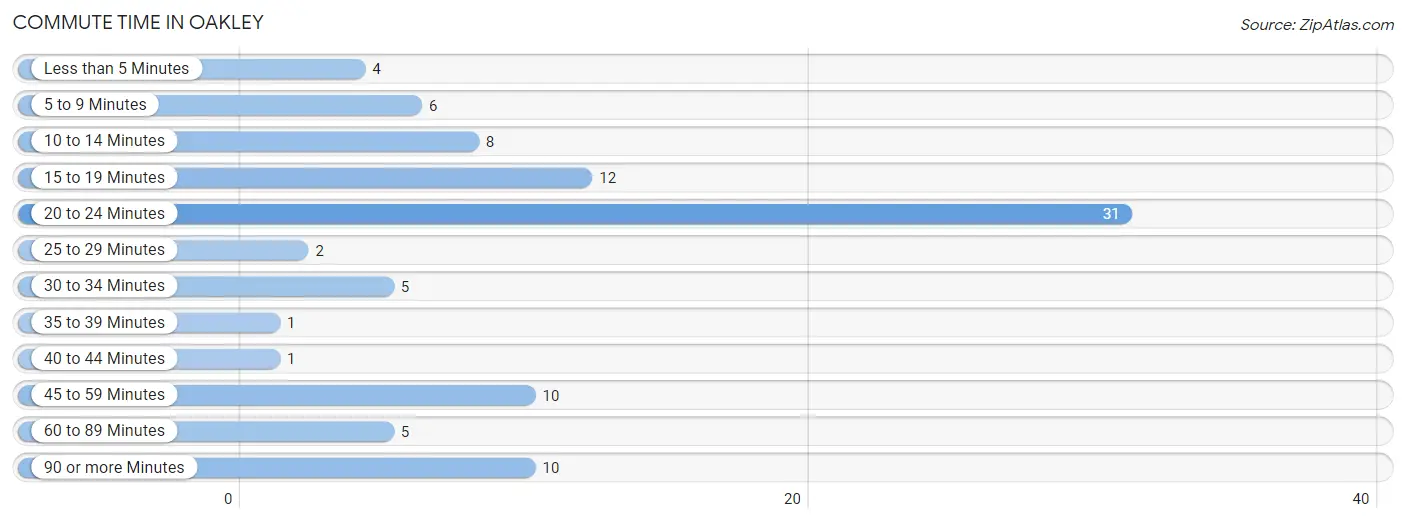
| Commute Time | # Commuters | % Commuters |
| Less than 5 Minutes | 4 | 4.2% |
| 5 to 9 Minutes | 6 | 6.3% |
| 10 to 14 Minutes | 8 | 8.4% |
| 15 to 19 Minutes | 12 | 12.6% |
| 20 to 24 Minutes | 31 | 32.6% |
| 25 to 29 Minutes | 2 | 2.1% |
| 30 to 34 Minutes | 5 | 5.3% |
| 35 to 39 Minutes | 1 | 1.1% |
| 40 to 44 Minutes | 1 | 1.1% |
| 45 to 59 Minutes | 10 | 10.5% |
| 60 to 89 Minutes | 5 | 5.3% |
| 90 or more Minutes | 10 | 10.5% |
Commute Time by Sex in Oakley
The most common commute times in Oakley are 20 to 24 minutes (18 commuters, 32.1%) for males and 20 to 24 minutes (13 commuters, 33.3%) for females.
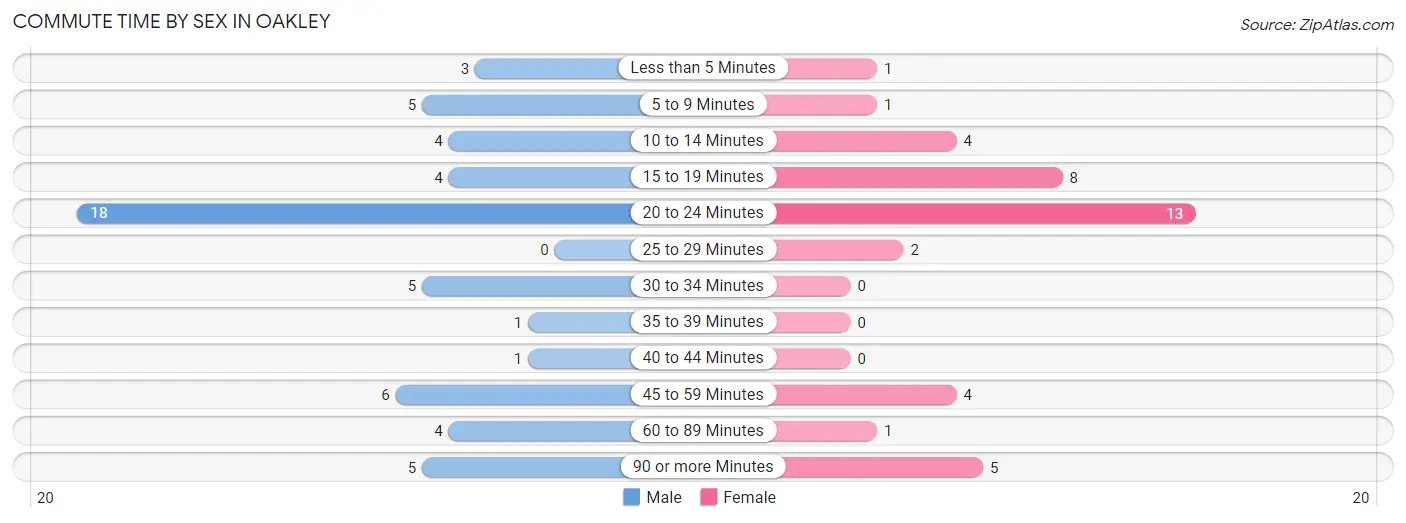
| Commute Time | Male | Female |
| Less than 5 Minutes | 3 (5.4%) | 1 (2.6%) |
| 5 to 9 Minutes | 5 (8.9%) | 1 (2.6%) |
| 10 to 14 Minutes | 4 (7.1%) | 4 (10.3%) |
| 15 to 19 Minutes | 4 (7.1%) | 8 (20.5%) |
| 20 to 24 Minutes | 18 (32.1%) | 13 (33.3%) |
| 25 to 29 Minutes | 0 (0.0%) | 2 (5.1%) |
| 30 to 34 Minutes | 5 (8.9%) | 0 (0.0%) |
| 35 to 39 Minutes | 1 (1.8%) | 0 (0.0%) |
| 40 to 44 Minutes | 1 (1.8%) | 0 (0.0%) |
| 45 to 59 Minutes | 6 (10.7%) | 4 (10.3%) |
| 60 to 89 Minutes | 4 (7.1%) | 1 (2.6%) |
| 90 or more Minutes | 5 (8.9%) | 5 (12.8%) |
Time of Departure to Work by Sex in Oakley
The most frequent times of departure to work in Oakley are 12:00 PM to 3:59 PM (15, 26.8%) for males and 7:00 AM to 7:29 AM (13, 33.3%) for females.
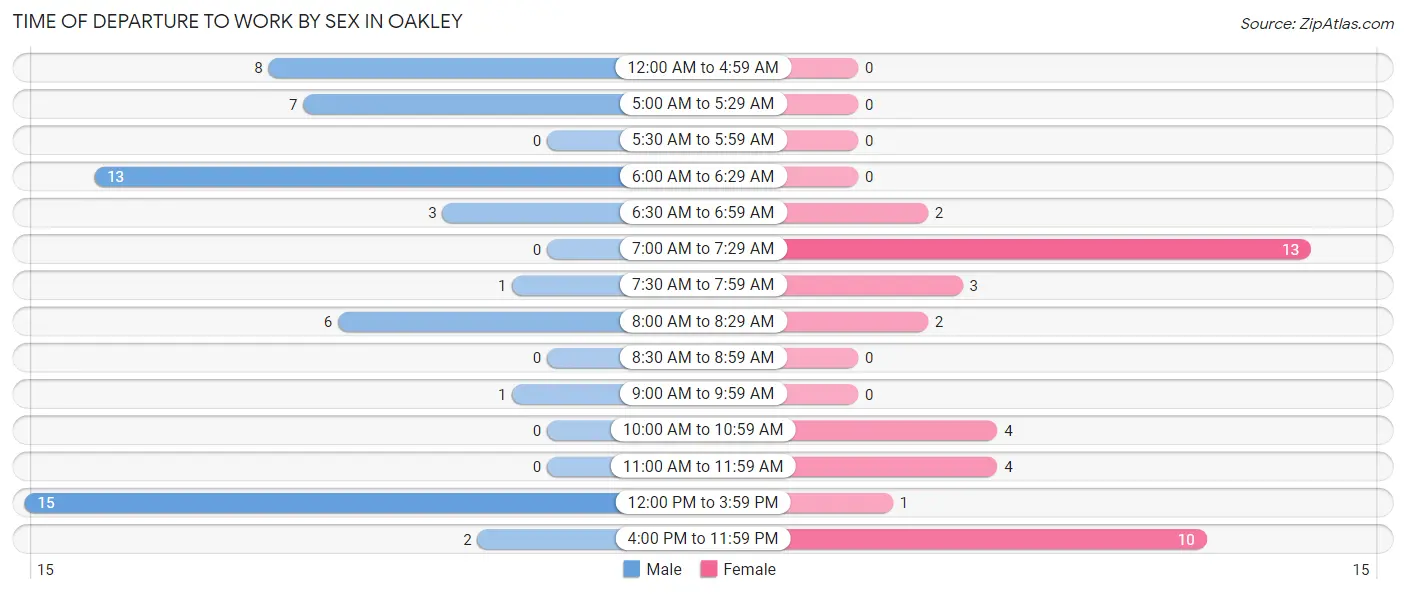
| Time of Departure | Male | Female |
| 12:00 AM to 4:59 AM | 8 (14.3%) | 0 (0.0%) |
| 5:00 AM to 5:29 AM | 7 (12.5%) | 0 (0.0%) |
| 5:30 AM to 5:59 AM | 0 (0.0%) | 0 (0.0%) |
| 6:00 AM to 6:29 AM | 13 (23.2%) | 0 (0.0%) |
| 6:30 AM to 6:59 AM | 3 (5.4%) | 2 (5.1%) |
| 7:00 AM to 7:29 AM | 0 (0.0%) | 13 (33.3%) |
| 7:30 AM to 7:59 AM | 1 (1.8%) | 3 (7.7%) |
| 8:00 AM to 8:29 AM | 6 (10.7%) | 2 (5.1%) |
| 8:30 AM to 8:59 AM | 0 (0.0%) | 0 (0.0%) |
| 9:00 AM to 9:59 AM | 1 (1.8%) | 0 (0.0%) |
| 10:00 AM to 10:59 AM | 0 (0.0%) | 4 (10.3%) |
| 11:00 AM to 11:59 AM | 0 (0.0%) | 4 (10.3%) |
| 12:00 PM to 3:59 PM | 15 (26.8%) | 1 (2.6%) |
| 4:00 PM to 11:59 PM | 2 (3.6%) | 10 (25.6%) |
| Total | 56 (100.0%) | 39 (100.0%) |
Housing Occupancy in Oakley
Occupancy by Ownership in Oakley
Of the total 117 dwellings in Oakley, owner-occupied units account for 95 (81.2%), while renter-occupied units make up 22 (18.8%).
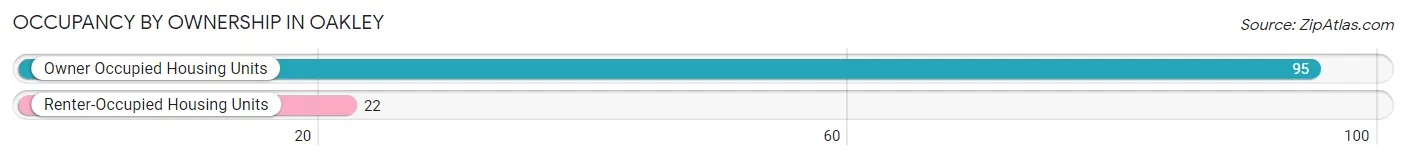
| Occupancy | # Housing Units | % Housing Units |
| Owner Occupied Housing Units | 95 | 81.2% |
| Renter-Occupied Housing Units | 22 | 18.8% |
| Total Occupied Housing Units | 117 | 100.0% |
Occupancy by Household Size in Oakley
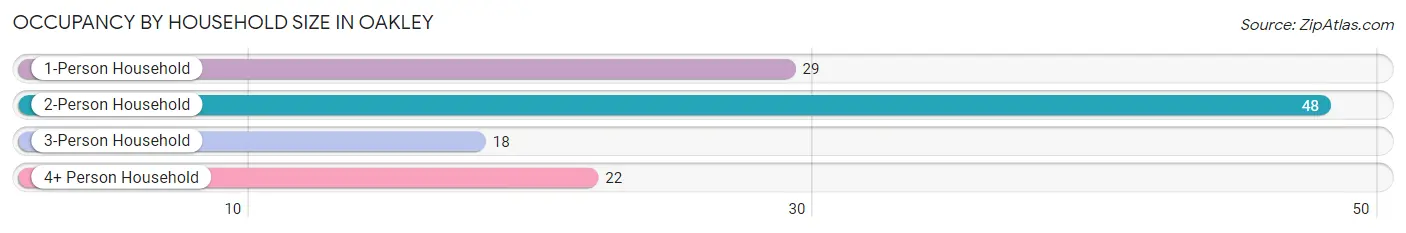
| Household Size | # Housing Units | % Housing Units |
| 1-Person Household | 29 | 24.8% |
| 2-Person Household | 48 | 41.0% |
| 3-Person Household | 18 | 15.4% |
| 4+ Person Household | 22 | 18.8% |
| Total Housing Units | 117 | 100.0% |
Occupancy by Ownership by Household Size in Oakley
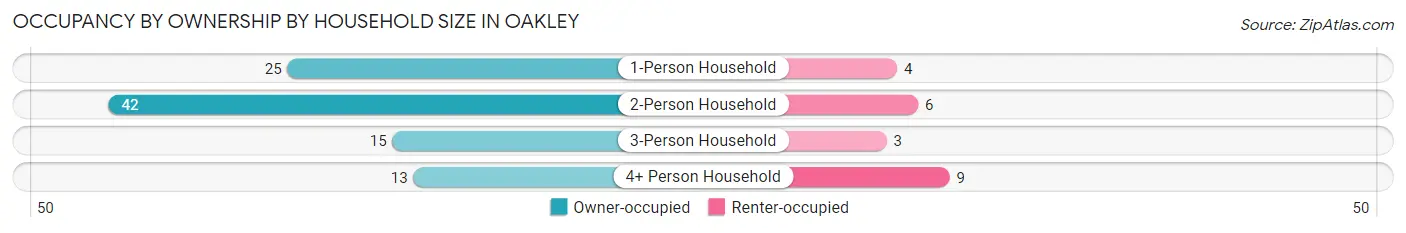
| Household Size | Owner-occupied | Renter-occupied |
| 1-Person Household | 25 (86.2%) | 4 (13.8%) |
| 2-Person Household | 42 (87.5%) | 6 (12.5%) |
| 3-Person Household | 15 (83.3%) | 3 (16.7%) |
| 4+ Person Household | 13 (59.1%) | 9 (40.9%) |
| Total Housing Units | 95 (81.2%) | 22 (18.8%) |
Occupancy by Educational Attainment in Oakley
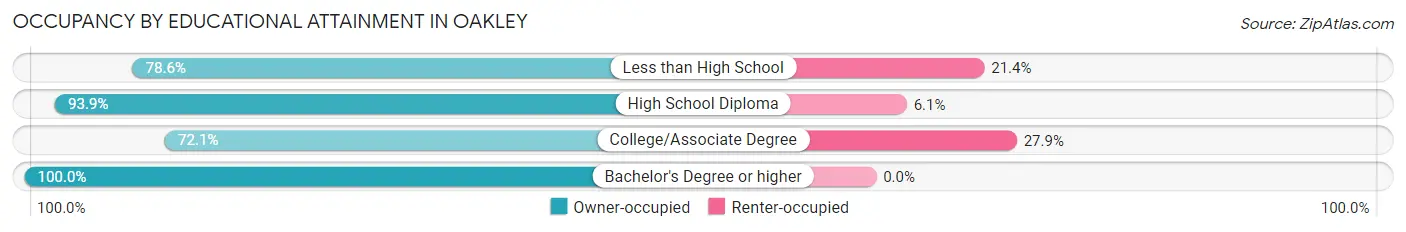
| Household Size | Owner-occupied | Renter-occupied |
| Less than High School | 11 (78.6%) | 3 (21.4%) |
| High School Diploma | 31 (93.9%) | 2 (6.1%) |
| College/Associate Degree | 44 (72.1%) | 17 (27.9%) |
| Bachelor's Degree or higher | 9 (100.0%) | 0 (0.0%) |
Occupancy by Age of Householder in Oakley
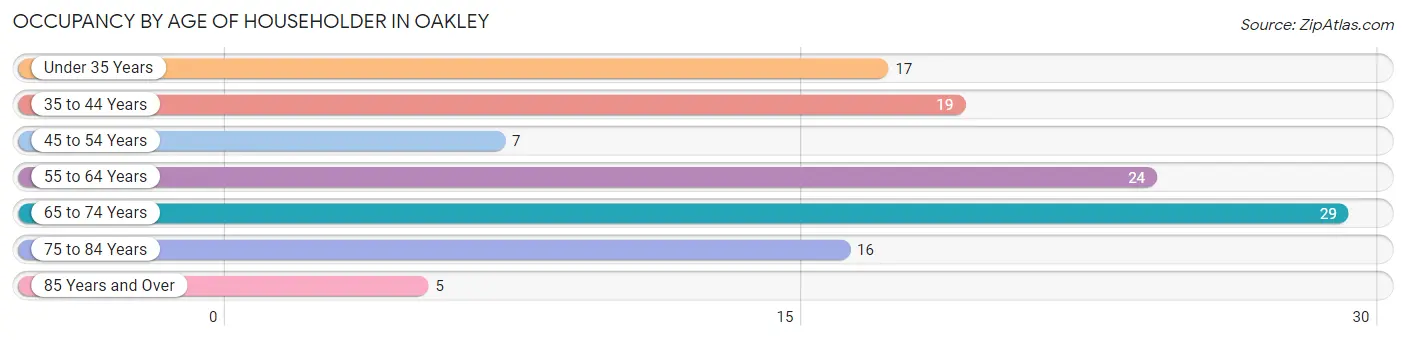
| Age Bracket | # Households | % Households |
| Under 35 Years | 17 | 14.5% |
| 35 to 44 Years | 19 | 16.2% |
| 45 to 54 Years | 7 | 6.0% |
| 55 to 64 Years | 24 | 20.5% |
| 65 to 74 Years | 29 | 24.8% |
| 75 to 84 Years | 16 | 13.7% |
| 85 Years and Over | 5 | 4.3% |
| Total | 117 | 100.0% |
Housing Finances in Oakley
Median Income by Occupancy in Oakley
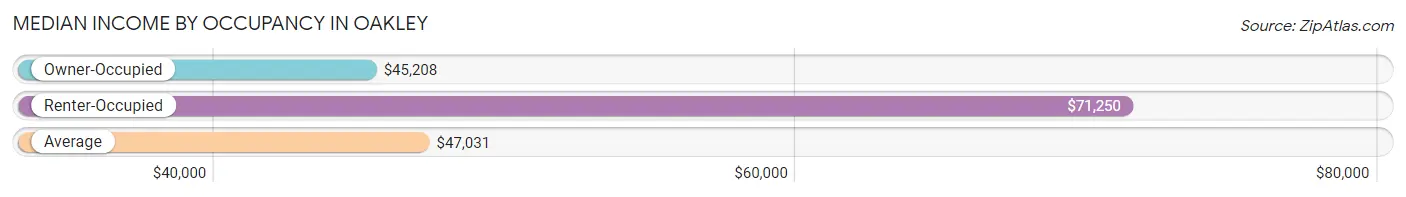
| Occupancy Type | # Households | Median Income |
| Owner-Occupied | 95 (81.2%) | $45,208 |
| Renter-Occupied | 22 (18.8%) | $71,250 |
| Average | 117 (100.0%) | $47,031 |
Occupancy by Householder Income Bracket in Oakley
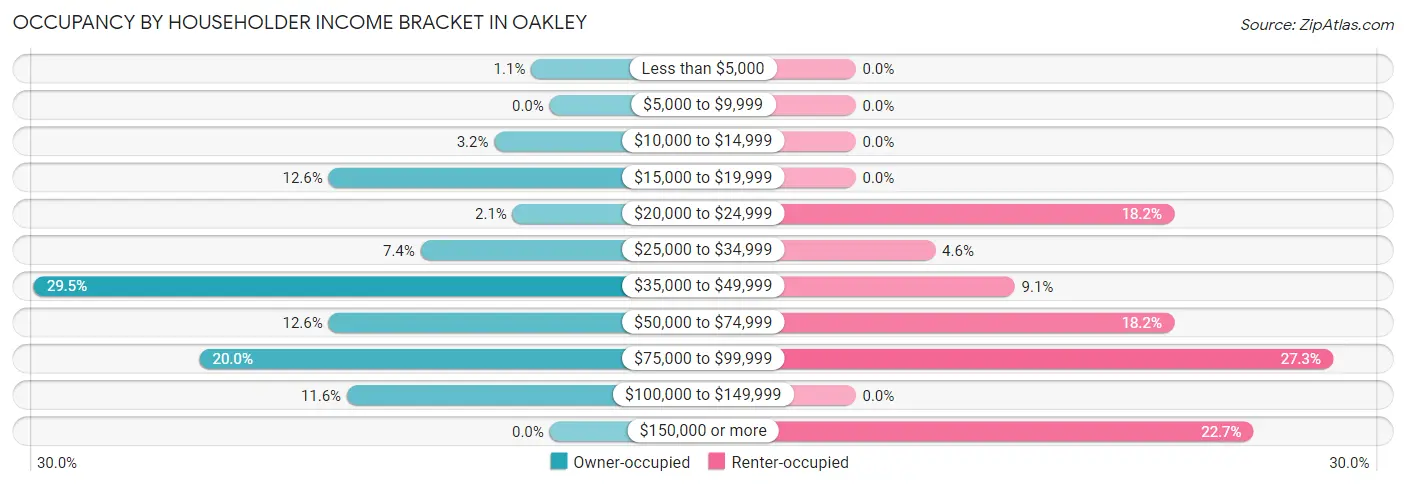
| Income Bracket | Owner-occupied | Renter-occupied |
| Less than $5,000 | 1 (1.1%) | 0 (0.0%) |
| $5,000 to $9,999 | 0 (0.0%) | 0 (0.0%) |
| $10,000 to $14,999 | 3 (3.2%) | 0 (0.0%) |
| $15,000 to $19,999 | 12 (12.6%) | 0 (0.0%) |
| $20,000 to $24,999 | 2 (2.1%) | 4 (18.2%) |
| $25,000 to $34,999 | 7 (7.4%) | 1 (4.5%) |
| $35,000 to $49,999 | 28 (29.5%) | 2 (9.1%) |
| $50,000 to $74,999 | 12 (12.6%) | 4 (18.2%) |
| $75,000 to $99,999 | 19 (20.0%) | 6 (27.3%) |
| $100,000 to $149,999 | 11 (11.6%) | 0 (0.0%) |
| $150,000 or more | 0 (0.0%) | 5 (22.7%) |
| Total | 95 (100.0%) | 22 (100.0%) |
Monthly Housing Cost Tiers in Oakley
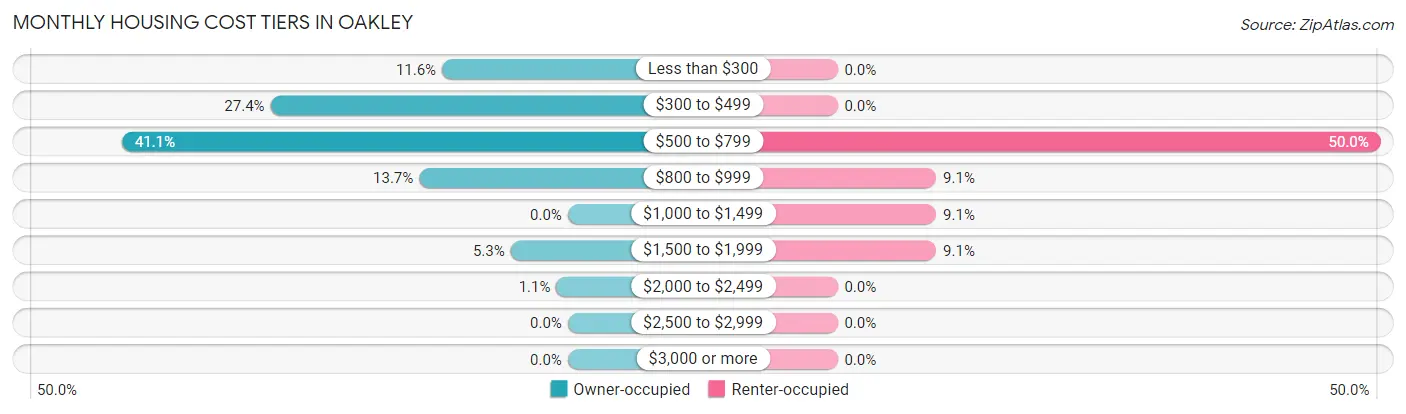
| Monthly Cost | Owner-occupied | Renter-occupied |
| Less than $300 | 11 (11.6%) | 0 (0.0%) |
| $300 to $499 | 26 (27.4%) | 0 (0.0%) |
| $500 to $799 | 39 (41.0%) | 11 (50.0%) |
| $800 to $999 | 13 (13.7%) | 2 (9.1%) |
| $1,000 to $1,499 | 0 (0.0%) | 2 (9.1%) |
| $1,500 to $1,999 | 5 (5.3%) | 2 (9.1%) |
| $2,000 to $2,499 | 1 (1.1%) | 0 (0.0%) |
| $2,500 to $2,999 | 0 (0.0%) | 0 (0.0%) |
| $3,000 or more | 0 (0.0%) | 0 (0.0%) |
| Total | 95 (100.0%) | 22 (100.0%) |
Physical Housing Characteristics in Oakley
Housing Structures in Oakley
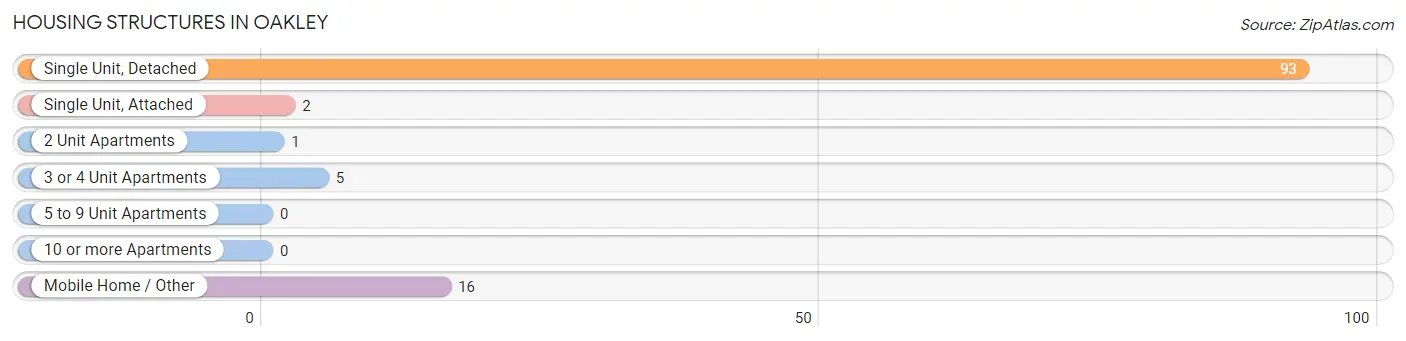
| Structure Type | # Housing Units | % Housing Units |
| Single Unit, Detached | 93 | 79.5% |
| Single Unit, Attached | 2 | 1.7% |
| 2 Unit Apartments | 1 | 0.9% |
| 3 or 4 Unit Apartments | 5 | 4.3% |
| 5 to 9 Unit Apartments | 0 | 0.0% |
| 10 or more Apartments | 0 | 0.0% |
| Mobile Home / Other | 16 | 13.7% |
| Total | 117 | 100.0% |
Housing Structures by Occupancy in Oakley
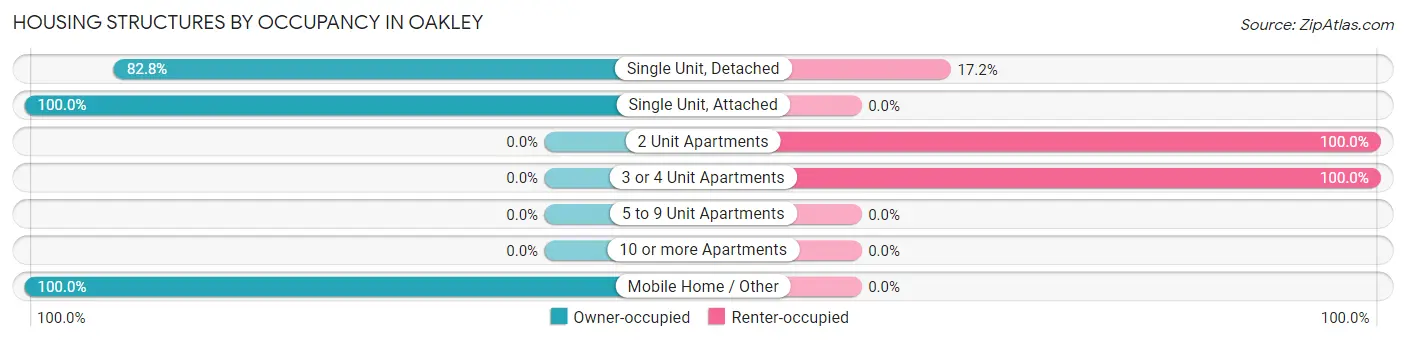
| Structure Type | Owner-occupied | Renter-occupied |
| Single Unit, Detached | 77 (82.8%) | 16 (17.2%) |
| Single Unit, Attached | 2 (100.0%) | 0 (0.0%) |
| 2 Unit Apartments | 0 (0.0%) | 1 (100.0%) |
| 3 or 4 Unit Apartments | 0 (0.0%) | 5 (100.0%) |
| 5 to 9 Unit Apartments | 0 (0.0%) | 0 (0.0%) |
| 10 or more Apartments | 0 (0.0%) | 0 (0.0%) |
| Mobile Home / Other | 16 (100.0%) | 0 (0.0%) |
| Total | 95 (81.2%) | 22 (18.8%) |
Housing Structures by Number of Rooms in Oakley
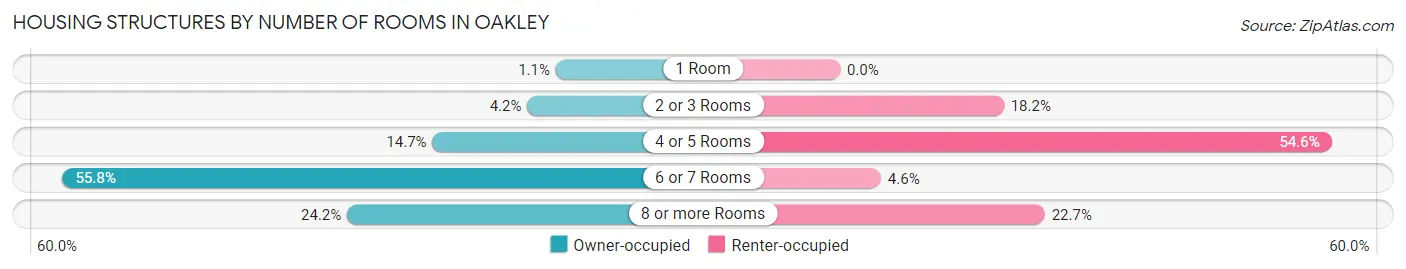
| Number of Rooms | Owner-occupied | Renter-occupied |
| 1 Room | 1 (1.1%) | 0 (0.0%) |
| 2 or 3 Rooms | 4 (4.2%) | 4 (18.2%) |
| 4 or 5 Rooms | 14 (14.7%) | 12 (54.5%) |
| 6 or 7 Rooms | 53 (55.8%) | 1 (4.5%) |
| 8 or more Rooms | 23 (24.2%) | 5 (22.7%) |
| Total | 95 (100.0%) | 22 (100.0%) |
Housing Structure by Heating Type in Oakley
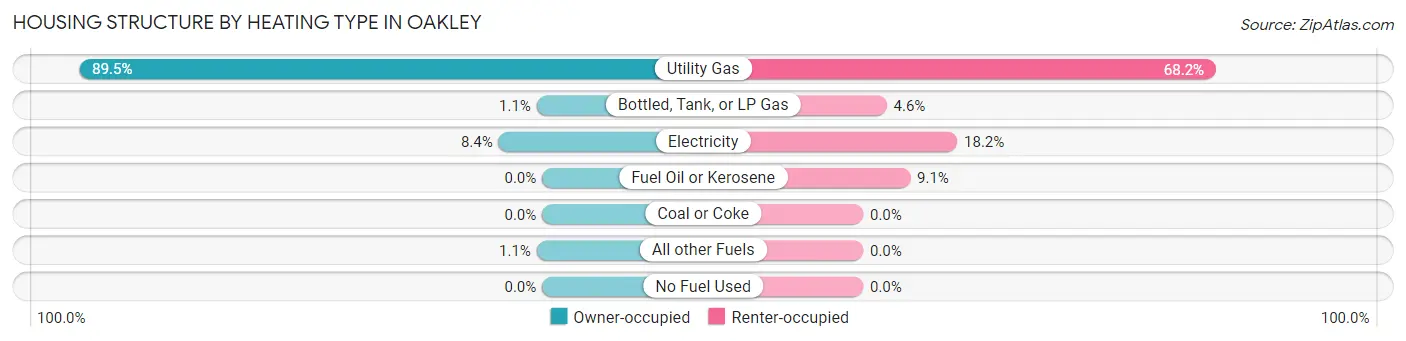
| Heating Type | Owner-occupied | Renter-occupied |
| Utility Gas | 85 (89.5%) | 15 (68.2%) |
| Bottled, Tank, or LP Gas | 1 (1.1%) | 1 (4.5%) |
| Electricity | 8 (8.4%) | 4 (18.2%) |
| Fuel Oil or Kerosene | 0 (0.0%) | 2 (9.1%) |
| Coal or Coke | 0 (0.0%) | 0 (0.0%) |
| All other Fuels | 1 (1.1%) | 0 (0.0%) |
| No Fuel Used | 0 (0.0%) | 0 (0.0%) |
| Total | 95 (100.0%) | 22 (100.0%) |
Household Vehicle Usage in Oakley
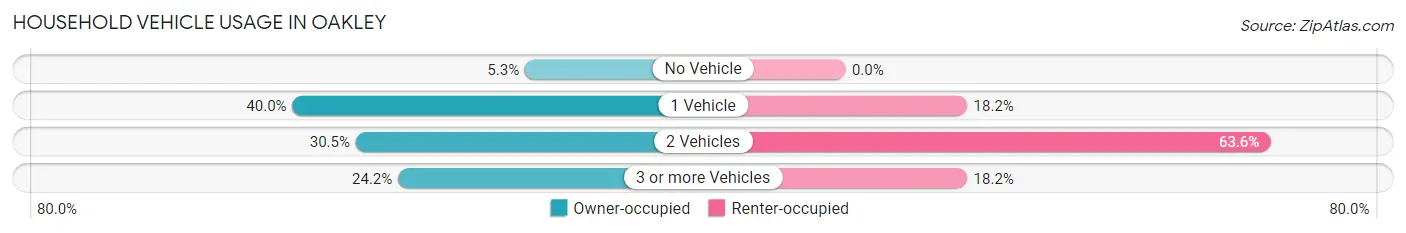
| Vehicles per Household | Owner-occupied | Renter-occupied |
| No Vehicle | 5 (5.3%) | 0 (0.0%) |
| 1 Vehicle | 38 (40.0%) | 4 (18.2%) |
| 2 Vehicles | 29 (30.5%) | 14 (63.6%) |
| 3 or more Vehicles | 23 (24.2%) | 4 (18.2%) |
| Total | 95 (100.0%) | 22 (100.0%) |
Real Estate & Mortgages in Oakley
Real Estate and Mortgage Overview in Oakley
| Characteristic | Without Mortgage | With Mortgage |
| Housing Units | 60 | 35 |
| Median Property Value | $56,000 | $79,200 |
| Median Household Income | $42,500 | $0 |
| Monthly Housing Costs | $465 | $0 |
| Real Estate Taxes | $1,500 | $0 |
Property Value by Mortgage Status in Oakley
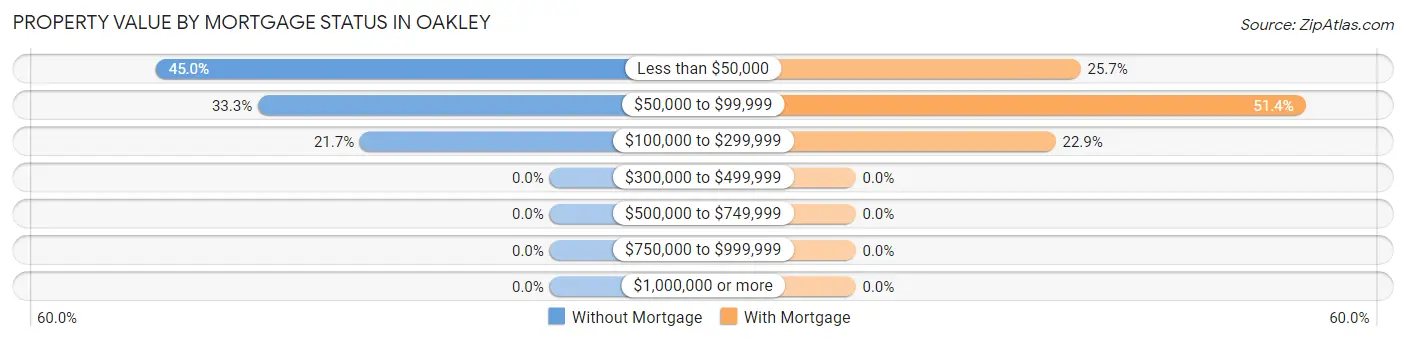
| Property Value | Without Mortgage | With Mortgage |
| Less than $50,000 | 27 (45.0%) | 9 (25.7%) |
| $50,000 to $99,999 | 20 (33.3%) | 18 (51.4%) |
| $100,000 to $299,999 | 13 (21.7%) | 8 (22.9%) |
| $300,000 to $499,999 | 0 (0.0%) | 0 (0.0%) |
| $500,000 to $749,999 | 0 (0.0%) | 0 (0.0%) |
| $750,000 to $999,999 | 0 (0.0%) | 0 (0.0%) |
| $1,000,000 or more | 0 (0.0%) | 0 (0.0%) |
| Total | 60 (100.0%) | 35 (100.0%) |
Household Income by Mortgage Status in Oakley
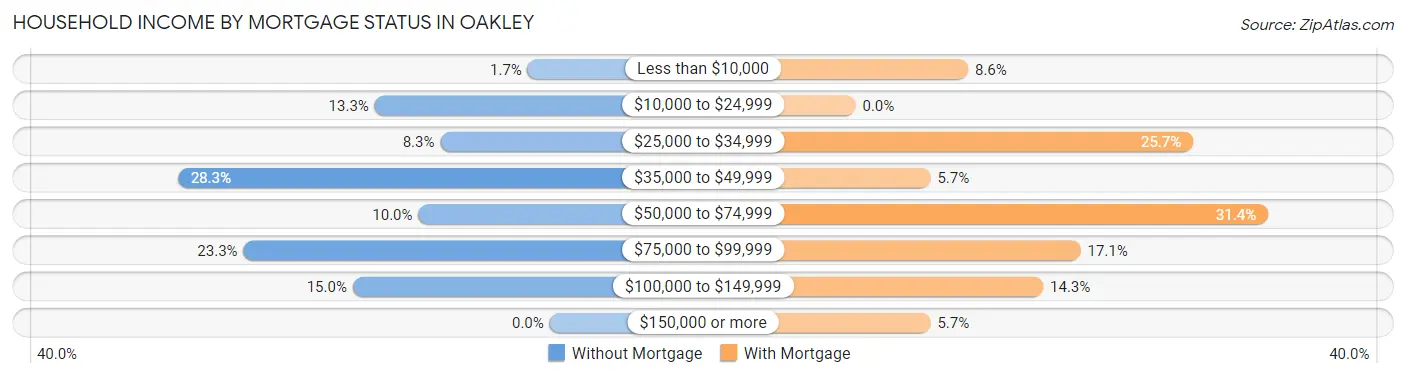
| Household Income | Without Mortgage | With Mortgage |
| Less than $10,000 | 1 (1.7%) | 3 (8.6%) |
| $10,000 to $24,999 | 8 (13.3%) | 0 (0.0%) |
| $25,000 to $34,999 | 5 (8.3%) | 9 (25.7%) |
| $35,000 to $49,999 | 17 (28.3%) | 2 (5.7%) |
| $50,000 to $74,999 | 6 (10.0%) | 11 (31.4%) |
| $75,000 to $99,999 | 14 (23.3%) | 6 (17.1%) |
| $100,000 to $149,999 | 9 (15.0%) | 5 (14.3%) |
| $150,000 or more | 0 (0.0%) | 2 (5.7%) |
| Total | 60 (100.0%) | 35 (100.0%) |
Property Value to Household Income Ratio in Oakley
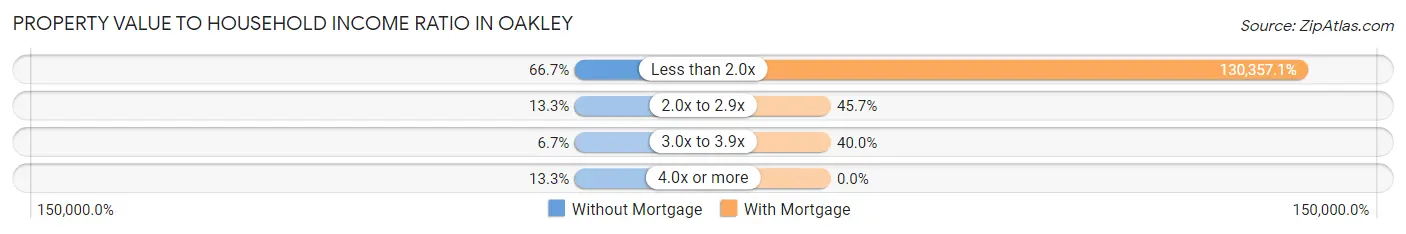
| Value-to-Income Ratio | Without Mortgage | With Mortgage |
| Less than 2.0x | 40 (66.7%) | 45,625 (130,357.1%) |
| 2.0x to 2.9x | 8 (13.3%) | 16 (45.7%) |
| 3.0x to 3.9x | 4 (6.7%) | 14 (40.0%) |
| 4.0x or more | 8 (13.3%) | 0 (0.0%) |
| Total | 60 (100.0%) | 35 (100.0%) |
Real Estate Taxes by Mortgage Status in Oakley
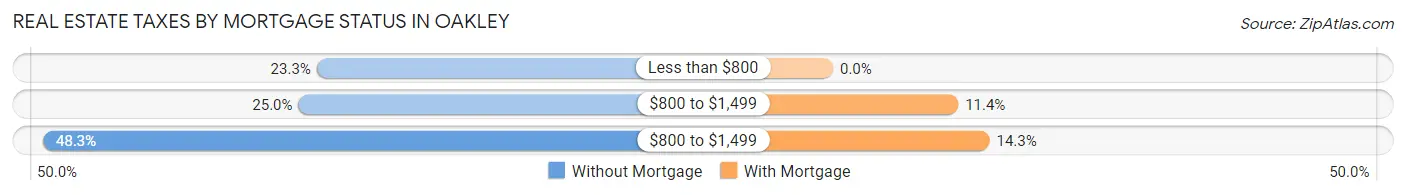
| Property Taxes | Without Mortgage | With Mortgage |
| Less than $800 | 14 (23.3%) | 0 (0.0%) |
| $800 to $1,499 | 15 (25.0%) | 4 (11.4%) |
| $800 to $1,499 | 29 (48.3%) | 5 (14.3%) |
| Total | 60 (100.0%) | 35 (100.0%) |
Health & Disability in Oakley
Health Insurance Coverage by Age in Oakley
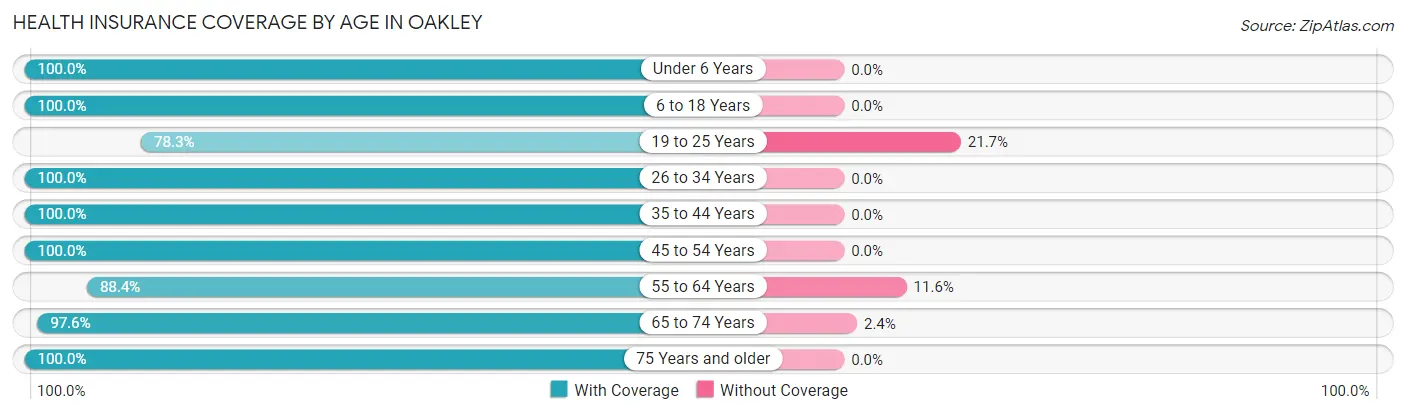
| Age Bracket | With Coverage | Without Coverage |
| Under 6 Years | 25 (100.0%) | 0 (0.0%) |
| 6 to 18 Years | 47 (100.0%) | 0 (0.0%) |
| 19 to 25 Years | 18 (78.3%) | 5 (21.7%) |
| 26 to 34 Years | 21 (100.0%) | 0 (0.0%) |
| 35 to 44 Years | 28 (100.0%) | 0 (0.0%) |
| 45 to 54 Years | 12 (100.0%) | 0 (0.0%) |
| 55 to 64 Years | 38 (88.4%) | 5 (11.6%) |
| 65 to 74 Years | 41 (97.6%) | 1 (2.4%) |
| 75 Years and older | 29 (100.0%) | 0 (0.0%) |
| Total | 259 (95.9%) | 11 (4.1%) |
Health Insurance Coverage by Citizenship Status in Oakley
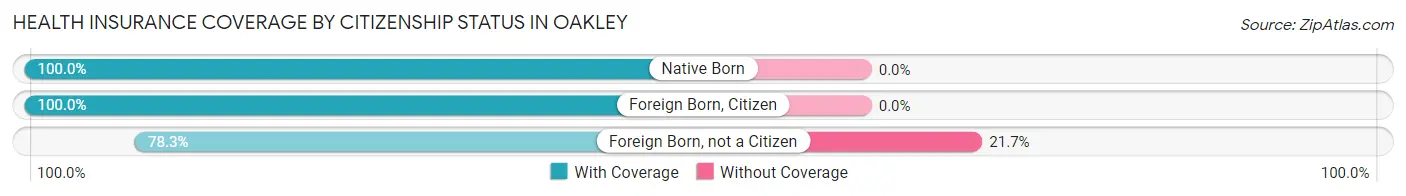
| Citizenship Status | With Coverage | Without Coverage |
| Native Born | 25 (100.0%) | 0 (0.0%) |
| Foreign Born, Citizen | 47 (100.0%) | 0 (0.0%) |
| Foreign Born, not a Citizen | 18 (78.3%) | 5 (21.7%) |
Health Insurance Coverage by Household Income in Oakley
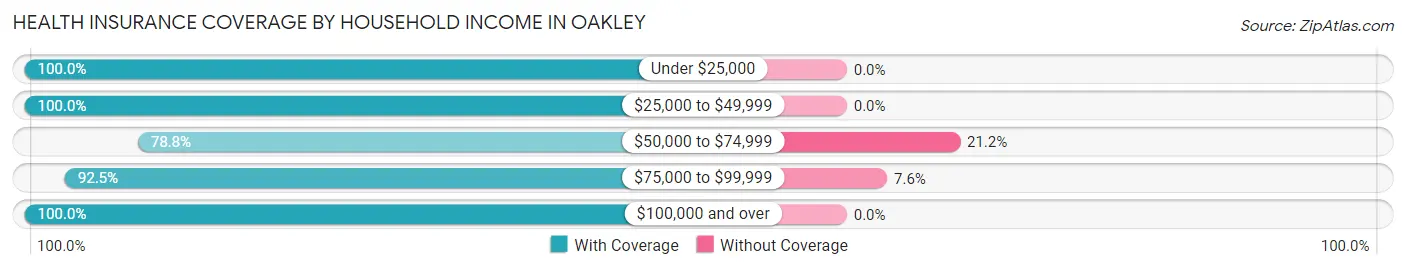
| Household Income | With Coverage | Without Coverage |
| Under $25,000 | 63 (100.0%) | 0 (0.0%) |
| $25,000 to $49,999 | 70 (100.0%) | 0 (0.0%) |
| $50,000 to $74,999 | 26 (78.8%) | 7 (21.2%) |
| $75,000 to $99,999 | 49 (92.4%) | 4 (7.5%) |
| $100,000 and over | 51 (100.0%) | 0 (0.0%) |
Public vs Private Health Insurance Coverage by Age in Oakley
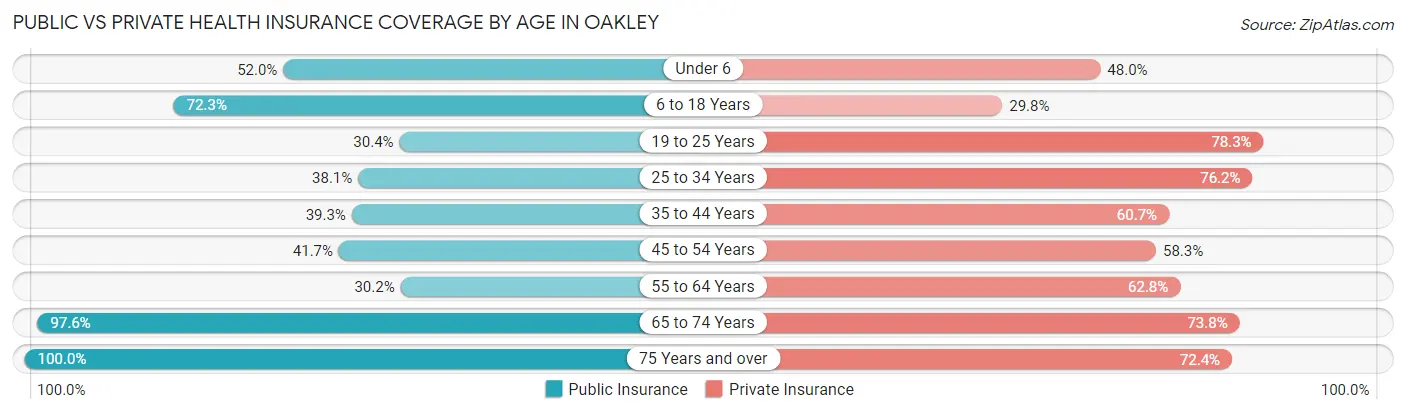
| Age Bracket | Public Insurance | Private Insurance |
| Under 6 | 13 (52.0%) | 12 (48.0%) |
| 6 to 18 Years | 34 (72.3%) | 14 (29.8%) |
| 19 to 25 Years | 7 (30.4%) | 18 (78.3%) |
| 25 to 34 Years | 8 (38.1%) | 16 (76.2%) |
| 35 to 44 Years | 11 (39.3%) | 17 (60.7%) |
| 45 to 54 Years | 5 (41.7%) | 7 (58.3%) |
| 55 to 64 Years | 13 (30.2%) | 27 (62.8%) |
| 65 to 74 Years | 41 (97.6%) | 31 (73.8%) |
| 75 Years and over | 29 (100.0%) | 21 (72.4%) |
| Total | 161 (59.6%) | 163 (60.4%) |
Disability Status by Sex by Age in Oakley
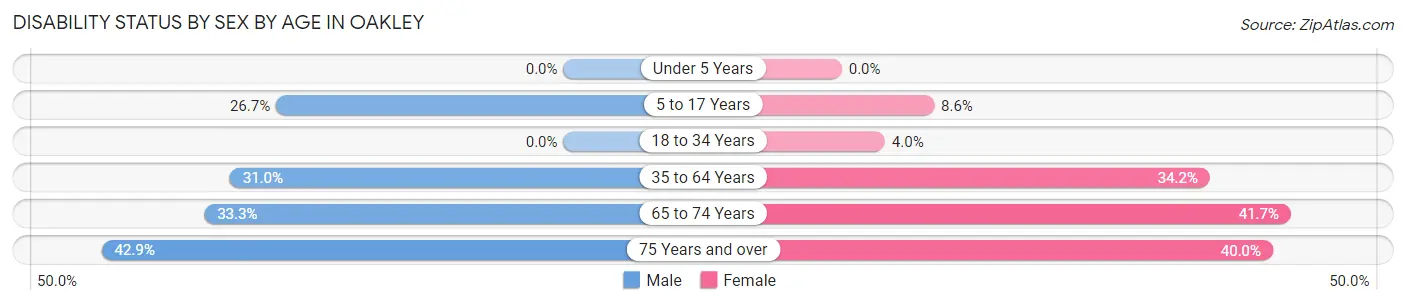
| Age Bracket | Male | Female |
| Under 5 Years | 0 (0.0%) | 0 (0.0%) |
| 5 to 17 Years | 4 (26.7%) | 3 (8.6%) |
| 18 to 34 Years | 0 (0.0%) | 1 (4.0%) |
| 35 to 64 Years | 13 (30.9%) | 14 (34.2%) |
| 65 to 74 Years | 10 (33.3%) | 5 (41.7%) |
| 75 Years and over | 6 (42.9%) | 6 (40.0%) |
Disability Class by Sex by Age in Oakley
Disability Class: Hearing Difficulty
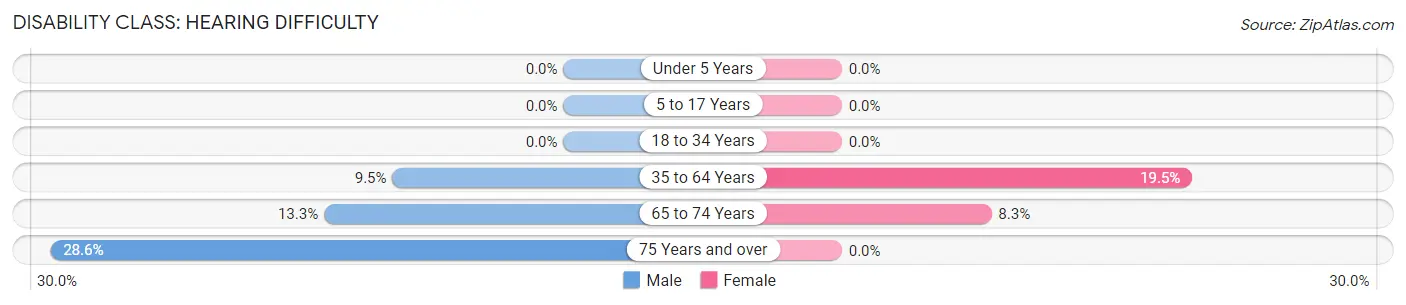
| Age Bracket | Male | Female |
| Under 5 Years | 0 (0.0%) | 0 (0.0%) |
| 5 to 17 Years | 0 (0.0%) | 0 (0.0%) |
| 18 to 34 Years | 0 (0.0%) | 0 (0.0%) |
| 35 to 64 Years | 4 (9.5%) | 8 (19.5%) |
| 65 to 74 Years | 4 (13.3%) | 1 (8.3%) |
| 75 Years and over | 4 (28.6%) | 0 (0.0%) |
Disability Class: Vision Difficulty
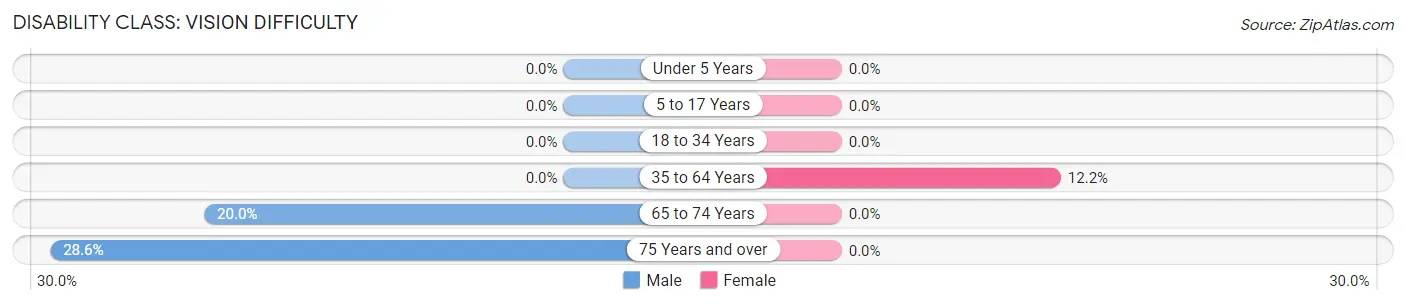
| Age Bracket | Male | Female |
| Under 5 Years | 0 (0.0%) | 0 (0.0%) |
| 5 to 17 Years | 0 (0.0%) | 0 (0.0%) |
| 18 to 34 Years | 0 (0.0%) | 0 (0.0%) |
| 35 to 64 Years | 0 (0.0%) | 5 (12.2%) |
| 65 to 74 Years | 6 (20.0%) | 0 (0.0%) |
| 75 Years and over | 4 (28.6%) | 0 (0.0%) |
Disability Class: Cognitive Difficulty
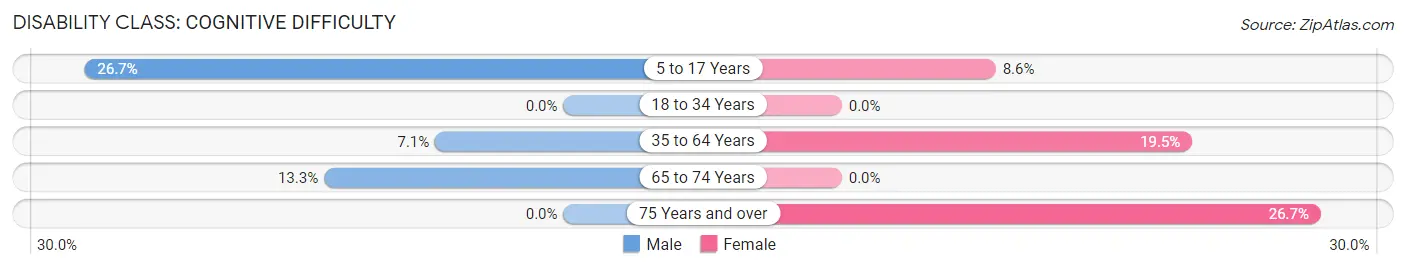
| Age Bracket | Male | Female |
| 5 to 17 Years | 4 (26.7%) | 3 (8.6%) |
| 18 to 34 Years | 0 (0.0%) | 0 (0.0%) |
| 35 to 64 Years | 3 (7.1%) | 8 (19.5%) |
| 65 to 74 Years | 4 (13.3%) | 0 (0.0%) |
| 75 Years and over | 0 (0.0%) | 4 (26.7%) |
Disability Class: Ambulatory Difficulty
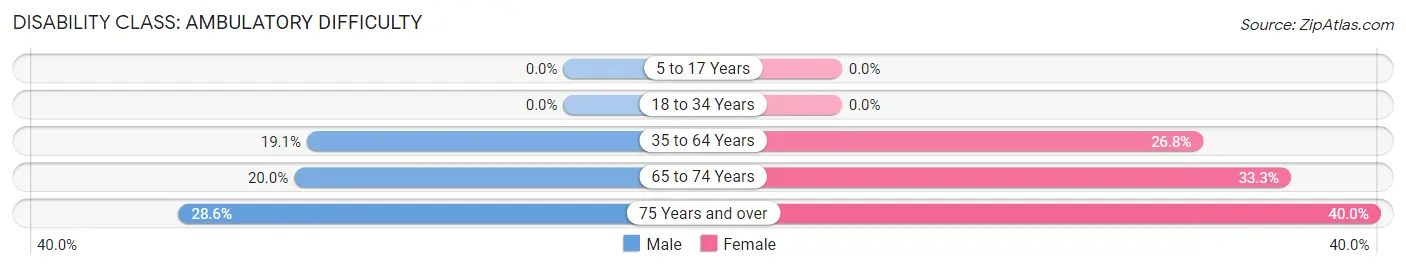
| Age Bracket | Male | Female |
| 5 to 17 Years | 0 (0.0%) | 0 (0.0%) |
| 18 to 34 Years | 0 (0.0%) | 0 (0.0%) |
| 35 to 64 Years | 8 (19.1%) | 11 (26.8%) |
| 65 to 74 Years | 6 (20.0%) | 4 (33.3%) |
| 75 Years and over | 4 (28.6%) | 6 (40.0%) |
Disability Class: Self-Care Difficulty
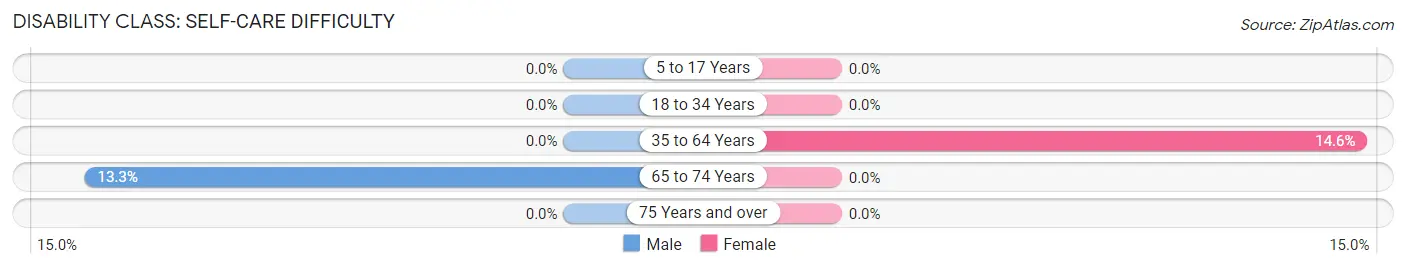
| Age Bracket | Male | Female |
| 5 to 17 Years | 0 (0.0%) | 0 (0.0%) |
| 18 to 34 Years | 0 (0.0%) | 0 (0.0%) |
| 35 to 64 Years | 0 (0.0%) | 6 (14.6%) |
| 65 to 74 Years | 4 (13.3%) | 0 (0.0%) |
| 75 Years and over | 0 (0.0%) | 0 (0.0%) |
Technology Access in Oakley
Computing Device Access in Oakley
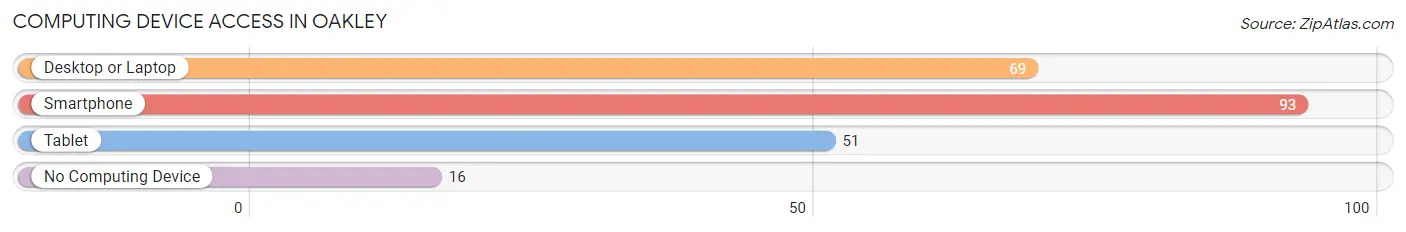
| Device Type | # Households | % Households |
| Desktop or Laptop | 69 | 59.0% |
| Smartphone | 93 | 79.5% |
| Tablet | 51 | 43.6% |
| No Computing Device | 16 | 13.7% |
| Total | 117 | 100.0% |
Internet Access in Oakley
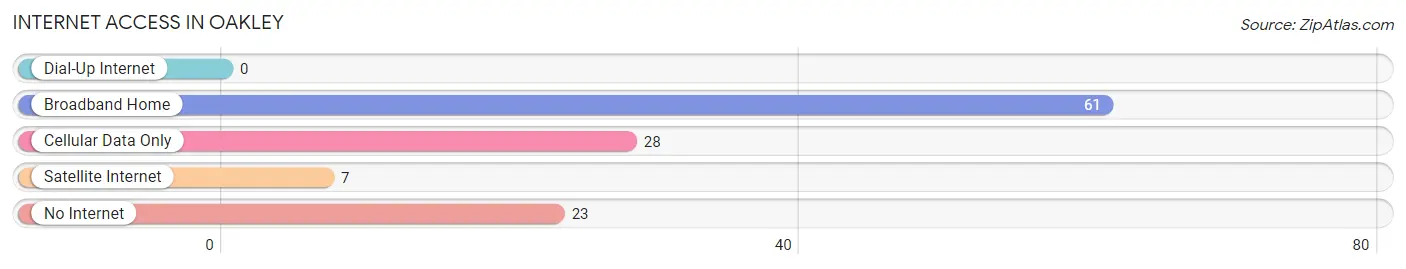
| Internet Type | # Households | % Households |
| Dial-Up Internet | 0 | 0.0% |
| Broadband Home | 61 | 52.1% |
| Cellular Data Only | 28 | 23.9% |
| Satellite Internet | 7 | 6.0% |
| No Internet | 23 | 19.7% |
| Total | 117 | 100.0% |
Oakley Summary
Oakley, Michigan is a small village located in Saginaw County, Michigan. It is situated on the banks of the Cass River, approximately 10 miles north of Saginaw. The village has a population of 1,717 people, according to the 2010 census.
History
Oakley was first settled in 1836 by a group of German immigrants. The village was originally known as “Oakley’s Corners”, named after the first settler, John Oakley. The village was officially incorporated in 1867.
In the late 19th century, Oakley was a thriving agricultural community. The village was home to several mills, including a grist mill, a saw mill, and a woolen mill. The village also had a blacksmith shop, a general store, and a post office.
In the early 20th century, Oakley began to experience a decline in population. This was due to the decline of the agricultural industry in the area, as well as the Great Depression. The population of the village decreased from 1,845 in 1910 to 1,717 in 2010.
Geography
Oakley is located in Saginaw County, Michigan. It is situated on the banks of the Cass River, approximately 10 miles north of Saginaw. The village has a total area of 1.2 square miles, all of which is land.
The village is located in a rural area, with the nearest major city being Saginaw. The village is surrounded by farmland and wooded areas. The nearest major highway is Interstate 75, which is approximately 10 miles away.
Economy
Oakley’s economy is largely based on agriculture. The village is home to several farms, which produce a variety of crops, including corn, soybeans, and wheat. The village also has several small businesses, including a grocery store, a hardware store, and a gas station.
The village is also home to several manufacturing companies, including a plastics manufacturer and a metal fabrication company. The village is also home to a small airport, which is used for private and commercial flights.
Demographics
According to the 2010 census, the population of Oakley is 1,717 people. The village has a median household income of $45,000, and the median age is 43. The village is predominantly white, with 95.3% of the population being white. The village also has a small Hispanic population, with 2.3% of the population being Hispanic.
Conclusion
Oakley, Michigan is a small village located in Saginaw County, Michigan. It is situated on the banks of the Cass River, approximately 10 miles north of Saginaw. The village has a population of 1,717 people, according to the 2010 census. The village’s economy is largely based on agriculture, and it is home to several small businesses and manufacturing companies. The village is predominantly white, with 95.3% of the population being white. The village also has a small Hispanic population, with 2.3% of the population being Hispanic.
Common Questions
What is Per Capita Income in Oakley?
Per Capita income in Oakley is $25,475.
What is the Median Family Income in Oakley?
Median Family Income in Oakley is $50,250.
What is the Median Household income in Oakley?
Median Household Income in Oakley is $47,031.
What is Income or Wage Gap in Oakley?
Income or Wage Gap in Oakley is 26.4%.
Women in Oakley earn 73.6 cents for every dollar earned by a man.
What is Inequality or Gini Index in Oakley?
Inequality or Gini Index in Oakley is 0.34.
What is the Total Population of Oakley?
Total Population of Oakley is 270.
What is the Total Male Population of Oakley?
Total Male Population of Oakley is 134.
What is the Total Female Population of Oakley?
Total Female Population of Oakley is 136.
What is the Ratio of Males per 100 Females in Oakley?
There are 98.53 Males per 100 Females in Oakley.
What is the Ratio of Females per 100 Males in Oakley?
There are 101.49 Females per 100 Males in Oakley.
What is the Median Population Age in Oakley?
Median Population Age in Oakley is 42.7 Years.
What is the Average Family Size in Oakley
Average Family Size in Oakley is 2.7 People.
What is the Average Household Size in Oakley
Average Household Size in Oakley is 2.3 People.
How Large is the Labor Force in Oakley?
There are 116 People in the Labor Forcein in Oakley.
What is the Percentage of People in the Labor Force in Oakley?
56.0% of People are in the Labor Force in Oakley.
What is the Unemployment Rate in Oakley?
Unemployment Rate in Oakley is 2.6%.