Concord, MI Map & Demographics
Concord Map
Concord Overview
$25,731
PER CAPITA INCOME
$65,511
AVG FAMILY INCOME
$59,188
AVG HOUSEHOLD INCOME
25.7%
WAGE / INCOME GAP [ % ]
74.3¢/ $1
WAGE / INCOME GAP [ $ ]
0.37
INEQUALITY / GINI INDEX
1,177
TOTAL POPULATION
603
MALE POPULATION
574
FEMALE POPULATION
105.05
MALES / 100 FEMALES
95.19
FEMALES / 100 MALES
31.5
MEDIAN AGE
3.3
AVG FAMILY SIZE
2.7
AVG HOUSEHOLD SIZE
552
LABOR FORCE [ PEOPLE ]
68.5%
PERCENT IN LABOR FORCE
4.2%
UNEMPLOYMENT RATE
Concord Zip Codes
Concord Area Codes
Income in Concord
Income Overview in Concord
Per Capita Income in Concord is $25,731, while median incomes of families and households are $65,511 and $59,188 respectively.
| Characteristic | Number | Measure |
| Per Capita Income | 1,177 | $25,731 |
| Median Family Income | 297 | $65,511 |
| Mean Family Income | 297 | $77,514 |
| Median Household Income | 438 | $59,188 |
| Mean Household Income | 438 | $68,071 |
| Income Deficit | 297 | $0 |
| Wage / Income Gap (%) | 1,177 | 25.71% |
| Wage / Income Gap ($) | 1,177 | 74.29¢ per $1 |
| Gini / Inequality Index | 1,177 | 0.37 |
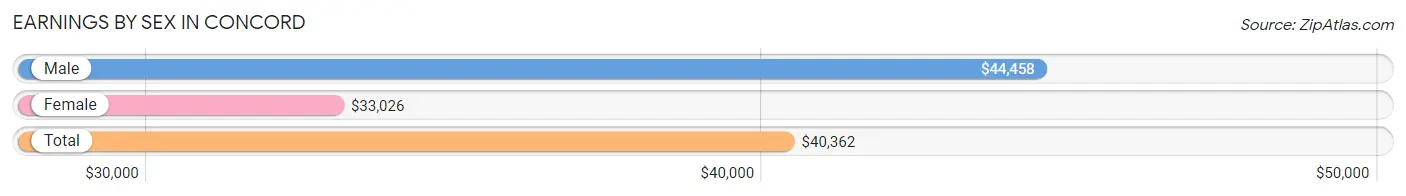
Earnings by Sex in Concord
Average Earnings in Concord are $40,362, $44,458 for men and $33,026 for women, a difference of 25.7%.
| Sex | Number | Average Earnings |
| Male | 309 (55.3%) | $44,458 |
| Female | 250 (44.7%) | $33,026 |
| Total | 559 (100.0%) | $40,362 |
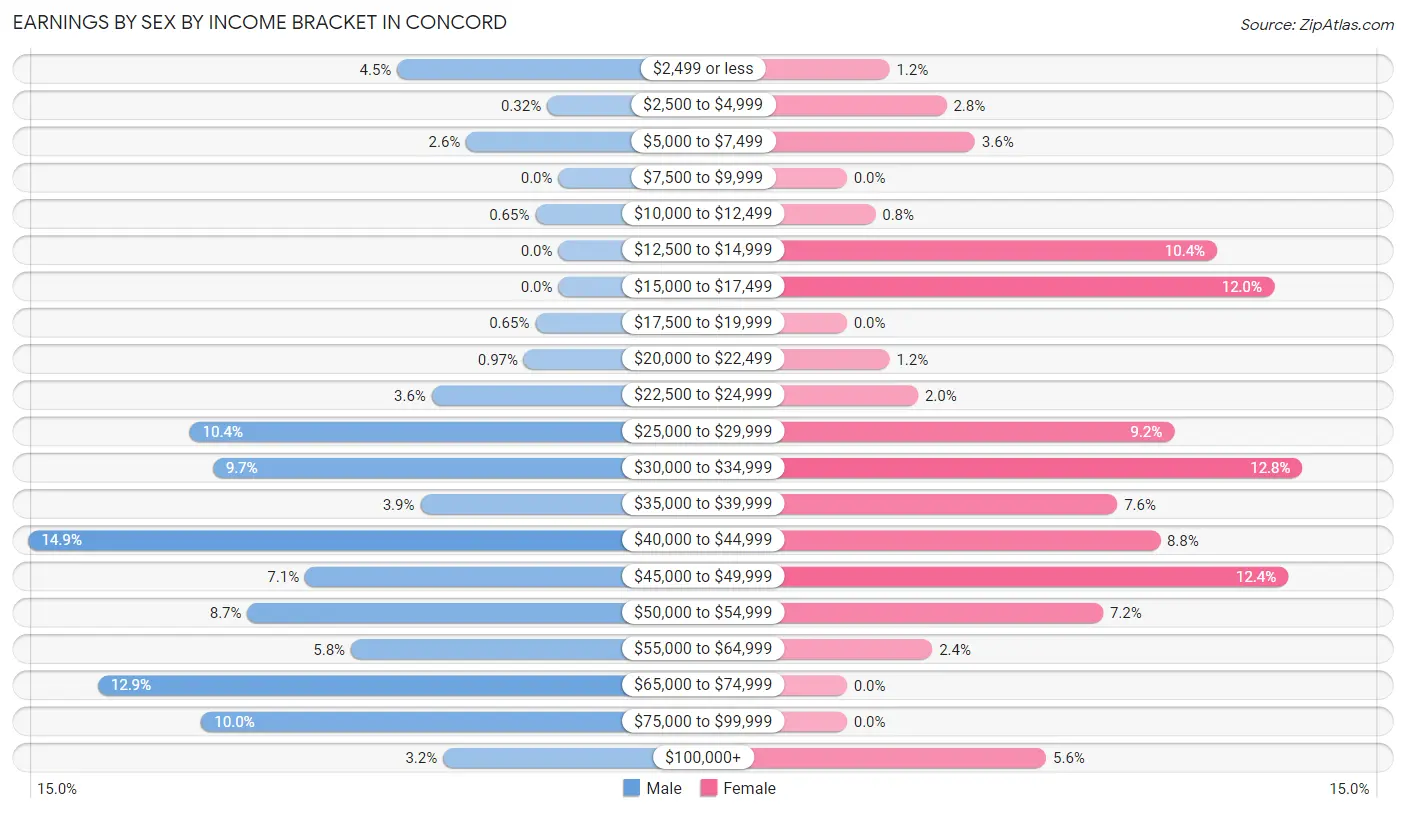
Earnings by Sex by Income Bracket in Concord
The most common earnings brackets in Concord are $40,000 to $44,999 for men (46 | 14.9%) and $30,000 to $34,999 for women (32 | 12.8%).
| Income | Male | Female |
| $2,499 or less | 14 (4.5%) | 3 (1.2%) |
| $2,500 to $4,999 | 1 (0.3%) | 7 (2.8%) |
| $5,000 to $7,499 | 8 (2.6%) | 9 (3.6%) |
| $7,500 to $9,999 | 0 (0.0%) | 0 (0.0%) |
| $10,000 to $12,499 | 2 (0.6%) | 2 (0.8%) |
| $12,500 to $14,999 | 0 (0.0%) | 26 (10.4%) |
| $15,000 to $17,499 | 0 (0.0%) | 30 (12.0%) |
| $17,500 to $19,999 | 2 (0.6%) | 0 (0.0%) |
| $20,000 to $22,499 | 3 (1.0%) | 3 (1.2%) |
| $22,500 to $24,999 | 11 (3.6%) | 5 (2.0%) |
| $25,000 to $29,999 | 32 (10.4%) | 23 (9.2%) |
| $30,000 to $34,999 | 30 (9.7%) | 32 (12.8%) |
| $35,000 to $39,999 | 12 (3.9%) | 19 (7.6%) |
| $40,000 to $44,999 | 46 (14.9%) | 22 (8.8%) |
| $45,000 to $49,999 | 22 (7.1%) | 31 (12.4%) |
| $50,000 to $54,999 | 27 (8.7%) | 18 (7.2%) |
| $55,000 to $64,999 | 18 (5.8%) | 6 (2.4%) |
| $65,000 to $74,999 | 40 (12.9%) | 0 (0.0%) |
| $75,000 to $99,999 | 31 (10.0%) | 0 (0.0%) |
| $100,000+ | 10 (3.2%) | 14 (5.6%) |
| Total | 309 (100.0%) | 250 (100.0%) |
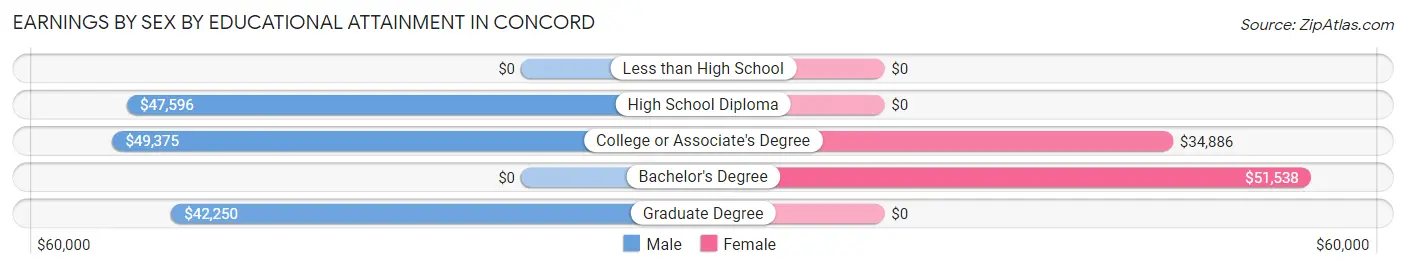
Earnings by Sex by Educational Attainment in Concord
Average earnings in Concord are $47,895 for men and $34,145 for women, a difference of 28.7%. Men with an educational attainment of college or associate's degree enjoy the highest average annual earnings of $49,375, while those with graduate degree education earn the least with $42,250. Women with an educational attainment of bachelor's degree earn the most with the average annual earnings of $51,538, while those with college or associate's degree education have the smallest earnings of $34,886.
| Educational Attainment | Male Income | Female Income |
| Less than High School | - | - |
| High School Diploma | $47,596 | $0 |
| College or Associate's Degree | $49,375 | $34,886 |
| Bachelor's Degree | - | - |
| Graduate Degree | $42,250 | $0 |
| Total | $47,895 | $34,145 |
Family Income in Concord
Family Income Brackets in Concord
According to the Concord family income data, there are 72 families falling into the $50,000 to $74,999 income range, which is the most common income bracket and makes up 24.2% of all families. Conversely, the $10,000 to $14,999 income bracket is the least frequent group with only 3 families (1.0%) belonging to this category.
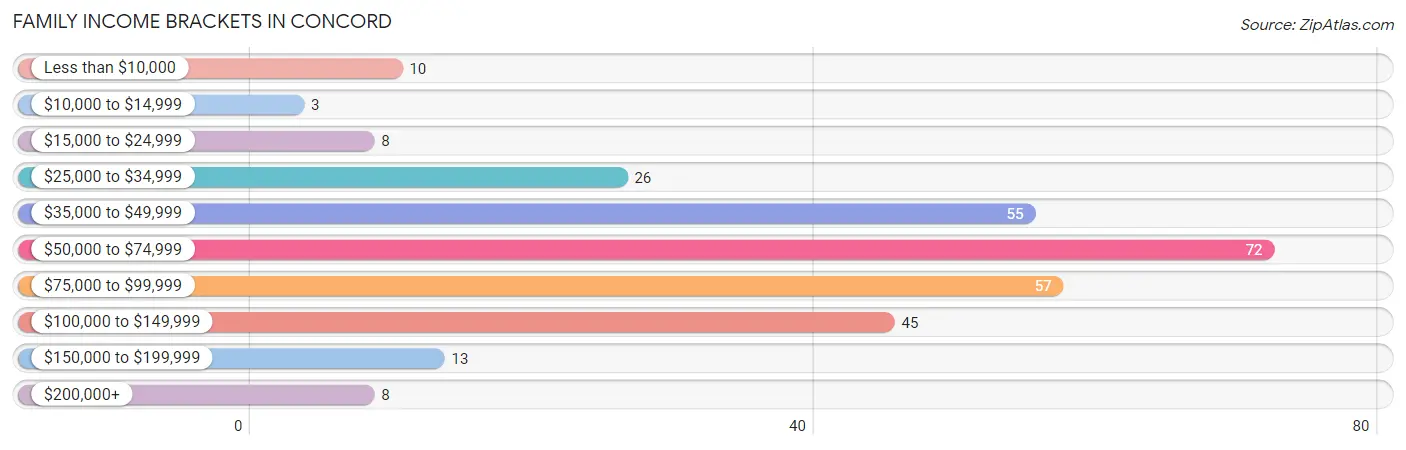
| Income Bracket | # Families | % Families |
| Less than $10,000 | 10 | 3.4% |
| $10,000 to $14,999 | 3 | 1.0% |
| $15,000 to $24,999 | 8 | 2.7% |
| $25,000 to $34,999 | 26 | 8.8% |
| $35,000 to $49,999 | 55 | 18.5% |
| $50,000 to $74,999 | 72 | 24.2% |
| $75,000 to $99,999 | 57 | 19.2% |
| $100,000 to $149,999 | 45 | 15.2% |
| $150,000 to $199,999 | 13 | 4.4% |
| $200,000+ | 8 | 2.7% |
Family Income by Famaliy Size in Concord
3-person families (73 | 24.6%) account for the highest median family income in Concord with $66,161 per family, while 2-person families (113 | 38.1%) have the highest median income of $30,375 per family member.
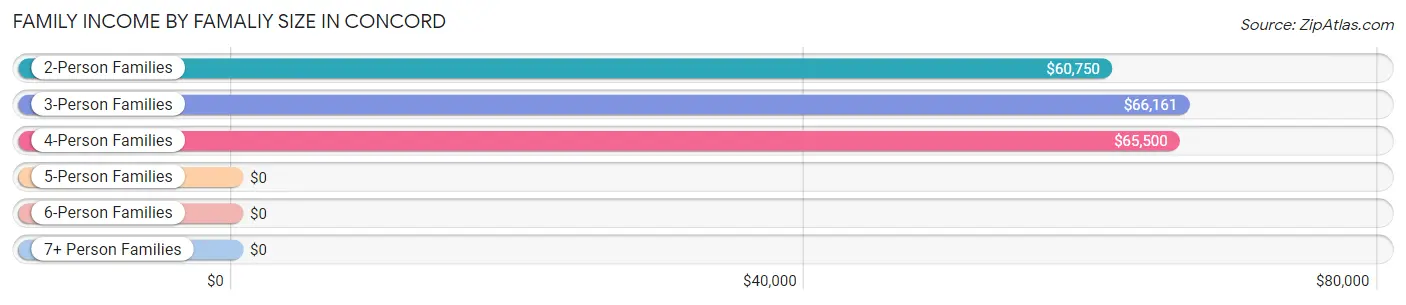
| Income Bracket | # Families | Median Income |
| 2-Person Families | 113 (38.1%) | $60,750 |
| 3-Person Families | 73 (24.6%) | $66,161 |
| 4-Person Families | 50 (16.8%) | $65,500 |
| 5-Person Families | 47 (15.8%) | $0 |
| 6-Person Families | 14 (4.7%) | $0 |
| 7+ Person Families | 0 (0.0%) | $0 |
| Total | 297 (100.0%) | $65,511 |
Family Income by Number of Earners in Concord
The median family income in Concord is $65,511, with families comprising 3+ earners (21) having the highest median family income of $99,028, while families with no earners (27) have the lowest median family income of $38,750, accounting for 7.1% and 9.1% of families, respectively.
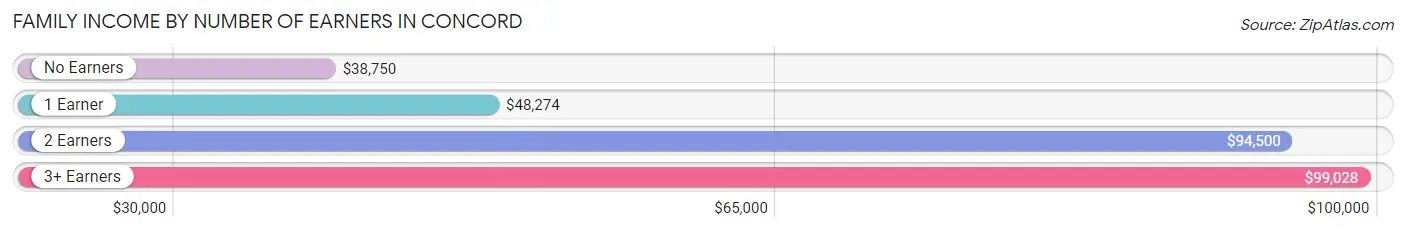
| Number of Earners | # Families | Median Income |
| No Earners | 27 (9.1%) | $38,750 |
| 1 Earner | 129 (43.4%) | $48,274 |
| 2 Earners | 120 (40.4%) | $94,500 |
| 3+ Earners | 21 (7.1%) | $99,028 |
| Total | 297 (100.0%) | $65,511 |
Household Income in Concord
Household Income Brackets in Concord
With 100 households falling in the category, the $50,000 to $74,999 income range is the most frequent in Concord, accounting for 22.8% of all households. In contrast, only 11 households (2.5%) fall into the $200,000+ income bracket, making it the least populous group.
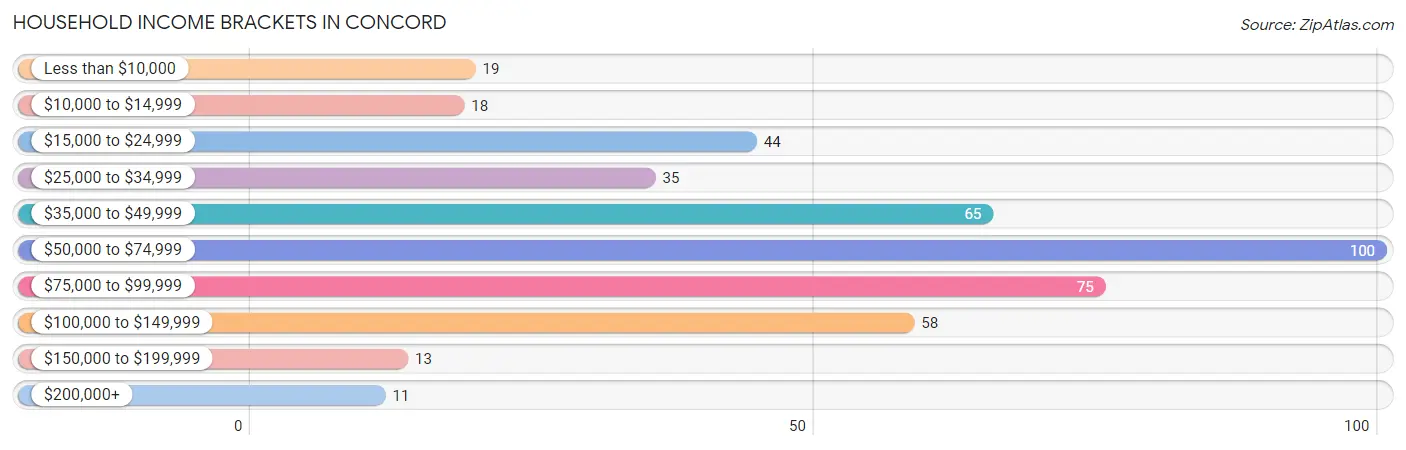
| Income Bracket | # Households | % Households |
| Less than $10,000 | 19 | 4.3% |
| $10,000 to $14,999 | 18 | 4.1% |
| $15,000 to $24,999 | 44 | 10.0% |
| $25,000 to $34,999 | 35 | 8.0% |
| $35,000 to $49,999 | 65 | 14.8% |
| $50,000 to $74,999 | 100 | 22.8% |
| $75,000 to $99,999 | 75 | 17.1% |
| $100,000 to $149,999 | 58 | 13.2% |
| $150,000 to $199,999 | 13 | 3.0% |
| $200,000+ | 11 | 2.5% |
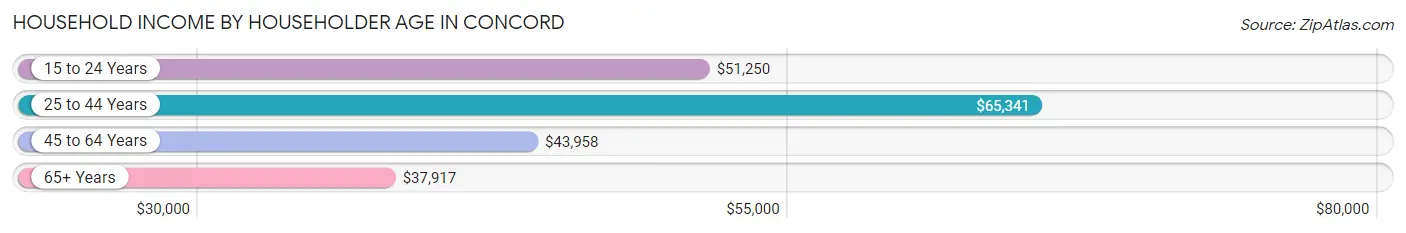
Household Income by Householder Age in Concord
The median household income in Concord is $59,188, with the highest median household income of $65,341 found in the 25 to 44 years age bracket for the primary householder. A total of 187 households (42.7%) fall into this category. Meanwhile, the 65+ years age bracket for the primary householder has the lowest median household income of $37,917, with 88 households (20.1%) in this group.
| Income Bracket | # Households | Median Income |
| 15 to 24 Years | 28 (6.4%) | $51,250 |
| 25 to 44 Years | 187 (42.7%) | $65,341 |
| 45 to 64 Years | 135 (30.8%) | $43,958 |
| 65+ Years | 88 (20.1%) | $37,917 |
| Total | 438 (100.0%) | $59,188 |
Poverty in Concord
Income Below Poverty by Sex and Age in Concord
With 10.4% poverty level for males and 11.8% for females among the residents of Concord, 16 and 17 year old males and 75 year old and over females are the most vulnerable to poverty, with 6 males (46.2%) and 17 females (39.5%) in their respective age groups living below the poverty level.
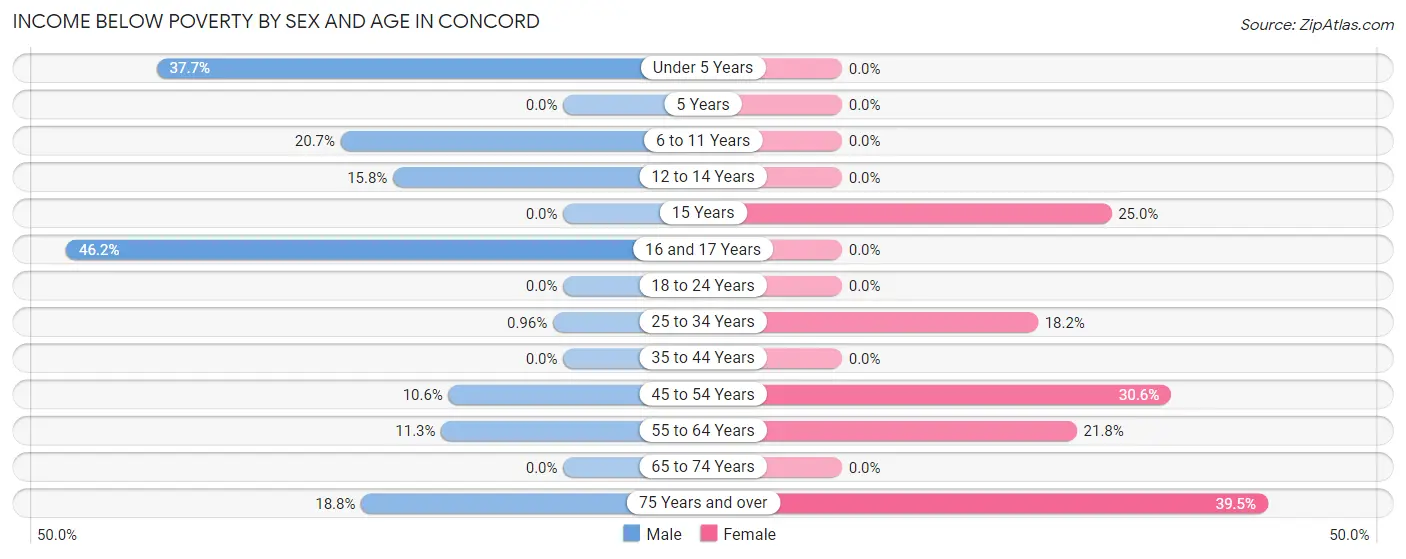
| Age Bracket | Male | Female |
| Under 5 Years | 20 (37.7%) | 0 (0.0%) |
| 5 Years | 0 (0.0%) | 0 (0.0%) |
| 6 to 11 Years | 19 (20.6%) | 0 (0.0%) |
| 12 to 14 Years | 3 (15.8%) | 0 (0.0%) |
| 15 Years | 0 (0.0%) | 3 (25.0%) |
| 16 and 17 Years | 6 (46.2%) | 0 (0.0%) |
| 18 to 24 Years | 0 (0.0%) | 0 (0.0%) |
| 25 to 34 Years | 1 (1.0%) | 20 (18.2%) |
| 35 to 44 Years | 0 (0.0%) | 0 (0.0%) |
| 45 to 54 Years | 5 (10.6%) | 11 (30.6%) |
| 55 to 64 Years | 6 (11.3%) | 17 (21.8%) |
| 65 to 74 Years | 0 (0.0%) | 0 (0.0%) |
| 75 Years and over | 3 (18.8%) | 17 (39.5%) |
| Total | 63 (10.4%) | 68 (11.8%) |
Income Above Poverty by Sex and Age in Concord
According to the poverty statistics in Concord, males aged 5 years and females aged under 5 years are the age groups that are most secure financially, with 100.0% of males and 100.0% of females in these age groups living above the poverty line.
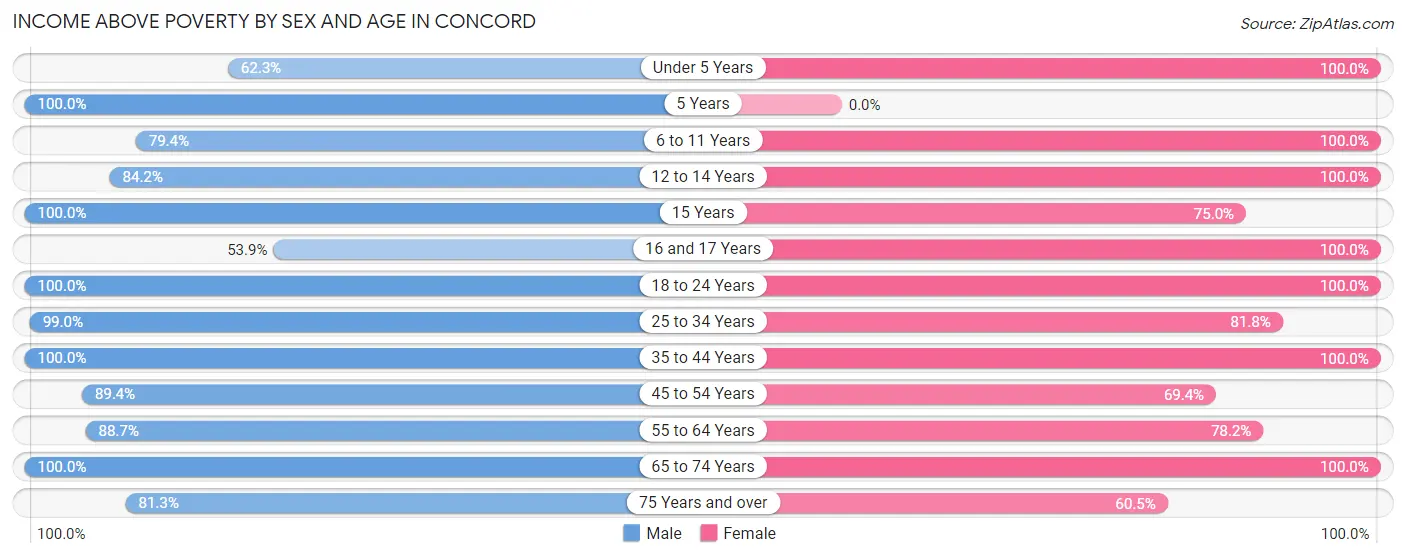
| Age Bracket | Male | Female |
| Under 5 Years | 33 (62.3%) | 61 (100.0%) |
| 5 Years | 9 (100.0%) | 0 (0.0%) |
| 6 to 11 Years | 73 (79.3%) | 86 (100.0%) |
| 12 to 14 Years | 16 (84.2%) | 28 (100.0%) |
| 15 Years | 11 (100.0%) | 9 (75.0%) |
| 16 and 17 Years | 7 (53.8%) | 9 (100.0%) |
| 18 to 24 Years | 57 (100.0%) | 23 (100.0%) |
| 25 to 34 Years | 103 (99.0%) | 90 (81.8%) |
| 35 to 44 Years | 84 (100.0%) | 61 (100.0%) |
| 45 to 54 Years | 42 (89.4%) | 25 (69.4%) |
| 55 to 64 Years | 47 (88.7%) | 61 (78.2%) |
| 65 to 74 Years | 45 (100.0%) | 27 (100.0%) |
| 75 Years and over | 13 (81.2%) | 26 (60.5%) |
| Total | 540 (89.5%) | 506 (88.1%) |
Income Below Poverty Among Married-Couple Families in Concord
The poverty statistics for married-couple families in Concord show that 3.1% or 6 of the total 195 families live below the poverty line. Families with no children have the highest poverty rate of 5.0%, comprising of 4 families. On the other hand, families with 3 or 4 children have the lowest poverty rate of 0.0%, which includes 0 families.
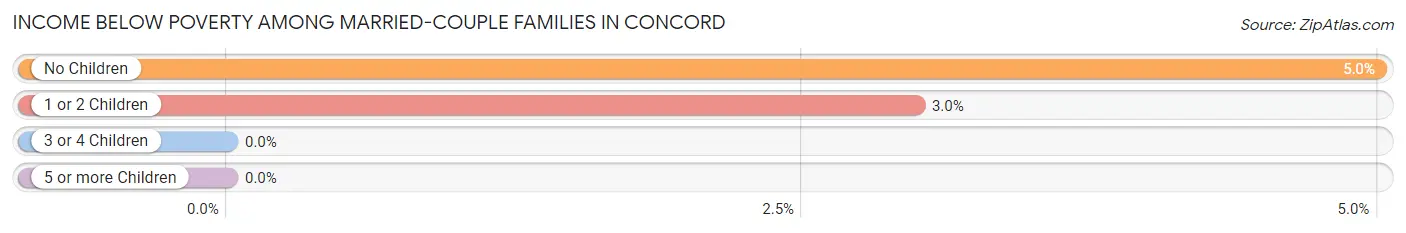
| Children | Above Poverty | Below Poverty |
| No Children | 76 (95.0%) | 4 (5.0%) |
| 1 or 2 Children | 65 (97.0%) | 2 (3.0%) |
| 3 or 4 Children | 48 (100.0%) | 0 (0.0%) |
| 5 or more Children | 0 (0.0%) | 0 (0.0%) |
| Total | 189 (96.9%) | 6 (3.1%) |
Income Below Poverty Among Single-Parent Households in Concord
According to the poverty data in Concord, 23.1% or 6 single-father households and 21.0% or 16 single-mother households are living below the poverty line. Among single-father households, those with 1 or 2 children have the highest poverty rate, with 6 households (35.3%) experiencing poverty. Likewise, among single-mother households, those with 3 or 4 children have the highest poverty rate, with 10 households (100.0%) falling below the poverty line.
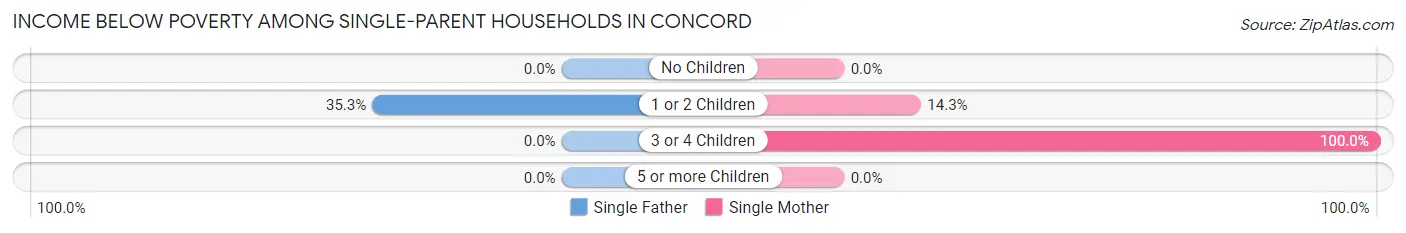
| Children | Single Father | Single Mother |
| No Children | 0 (0.0%) | 0 (0.0%) |
| 1 or 2 Children | 6 (35.3%) | 6 (14.3%) |
| 3 or 4 Children | 0 (0.0%) | 10 (100.0%) |
| 5 or more Children | 0 (0.0%) | 0 (0.0%) |
| Total | 6 (23.1%) | 16 (21.0%) |
Income Below Poverty Among Married-Couple vs Single-Parent Households in Concord
The poverty data for Concord shows that 6 of the married-couple family households (3.1%) and 22 of the single-parent households (21.6%) are living below the poverty level. Within the married-couple family households, those with no children have the highest poverty rate, with 4 households (5.0%) falling below the poverty line. Among the single-parent households, those with 3 or 4 children have the highest poverty rate, with 10 household (90.9%) living below poverty.
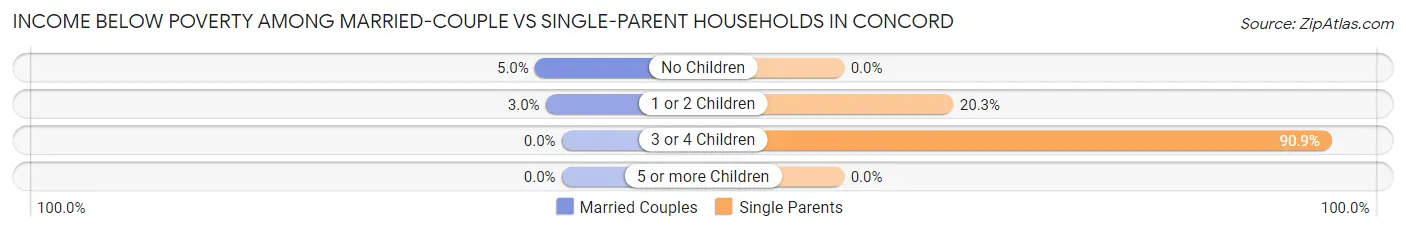
| Children | Married-Couple Families | Single-Parent Households |
| No Children | 4 (5.0%) | 0 (0.0%) |
| 1 or 2 Children | 2 (3.0%) | 12 (20.3%) |
| 3 or 4 Children | 0 (0.0%) | 10 (90.9%) |
| 5 or more Children | 0 (0.0%) | 0 (0.0%) |
| Total | 6 (3.1%) | 22 (21.6%) |
Race in Concord
The most populous races in Concord are White / Caucasian (1,036 | 88.0%), Black / African American (93 | 7.9%), and Hispanic or Latino (41 | 3.5%).
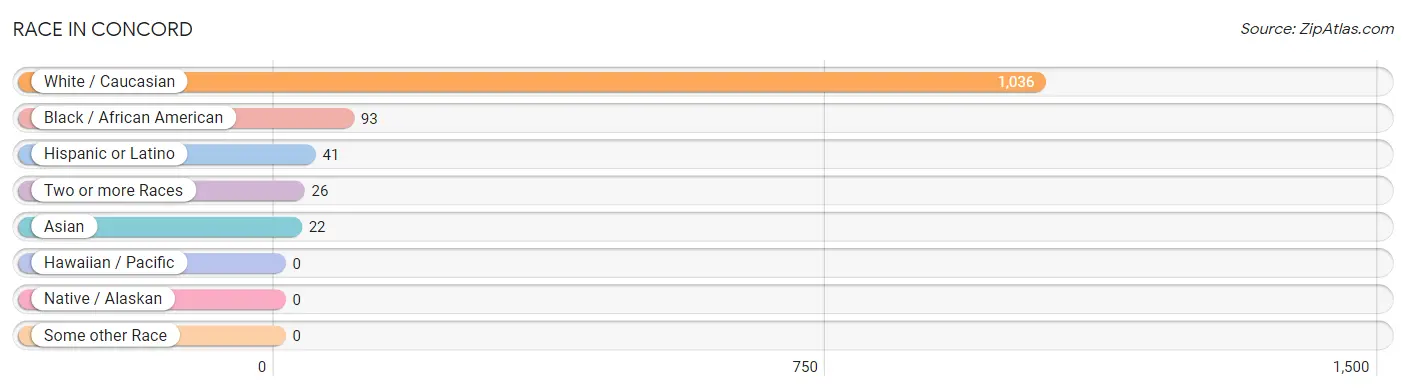
| Race | # Population | % Population |
| Asian | 22 | 1.9% |
| Black / African American | 93 | 7.9% |
| Hawaiian / Pacific | 0 | 0.0% |
| Hispanic or Latino | 41 | 3.5% |
| Native / Alaskan | 0 | 0.0% |
| White / Caucasian | 1,036 | 88.0% |
| Two or more Races | 26 | 2.2% |
| Some other Race | 0 | 0.0% |
| Total | 1,177 | 100.0% |
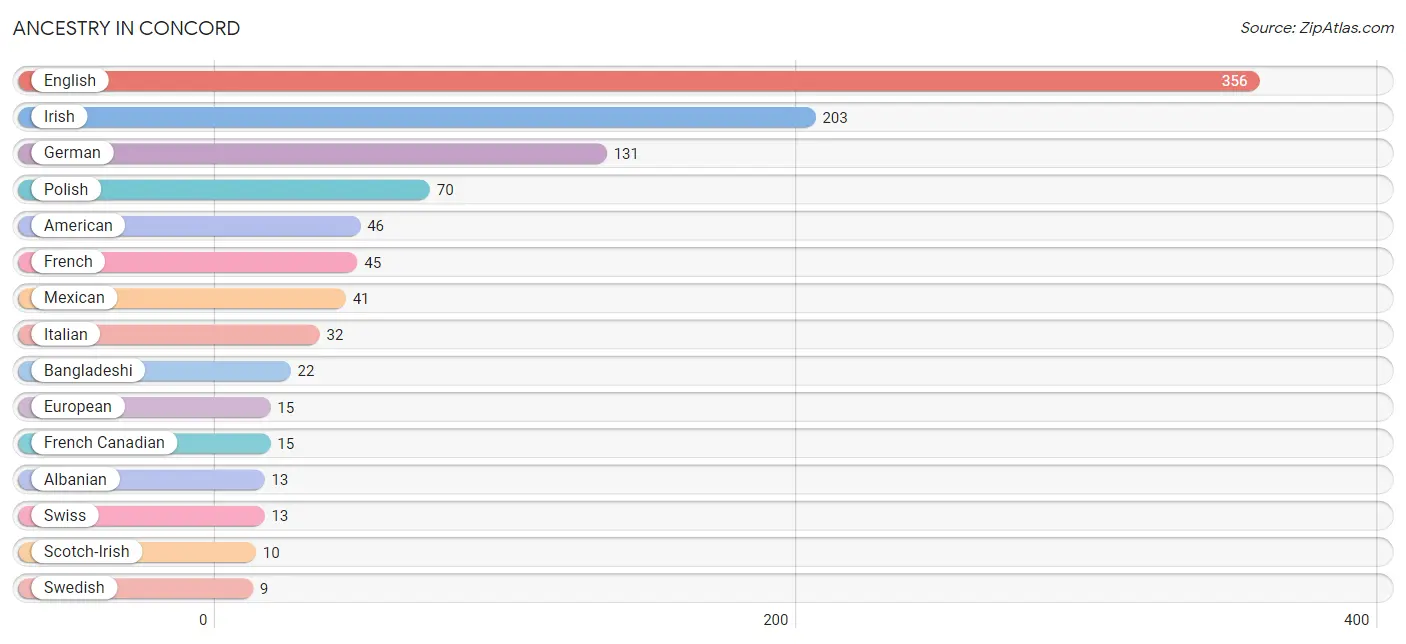
Ancestry in Concord
The most populous ancestries reported in Concord are English (356 | 30.2%), Irish (203 | 17.2%), German (131 | 11.1%), Polish (70 | 5.9%), and American (46 | 3.9%), together accounting for 68.5% of all Concord residents.
| Ancestry | # Population | % Population |
| Albanian | 13 | 1.1% |
| American | 46 | 3.9% |
| Bangladeshi | 22 | 1.9% |
| British | 8 | 0.7% |
| Canadian | 3 | 0.3% |
| Cherokee | 6 | 0.5% |
| Croatian | 3 | 0.3% |
| Dutch | 8 | 0.7% |
| Eastern European | 2 | 0.2% |
| English | 356 | 30.2% |
| European | 15 | 1.3% |
| Finnish | 3 | 0.3% |
| French | 45 | 3.8% |
| French Canadian | 15 | 1.3% |
| German | 131 | 11.1% |
| Indian (Asian) | 7 | 0.6% |
| Irish | 203 | 17.2% |
| Italian | 32 | 2.7% |
| Mexican | 41 | 3.5% |
| Northern European | 3 | 0.3% |
| Norwegian | 3 | 0.3% |
| Polish | 70 | 5.9% |
| Scandinavian | 3 | 0.3% |
| Scotch-Irish | 10 | 0.9% |
| Scottish | 5 | 0.4% |
| Serbian | 8 | 0.7% |
| Swedish | 9 | 0.8% |
| Swiss | 13 | 1.1% |
| Welsh | 3 | 0.3% | View All 29 Rows |
Immigrants in Concord
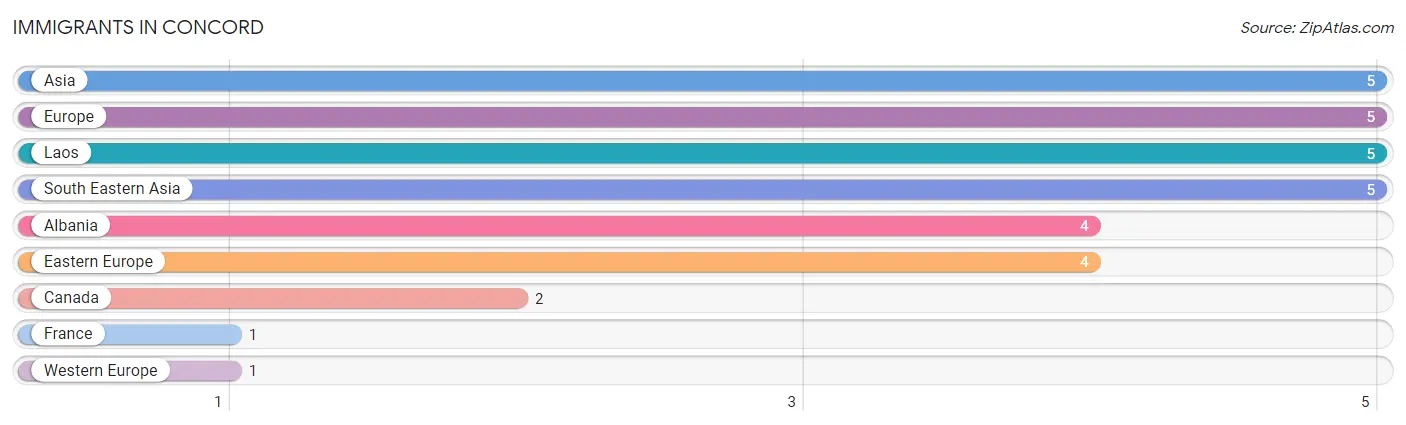
The most numerous immigrant groups reported in Concord came from Asia (5 | 0.4%), Europe (5 | 0.4%), Laos (5 | 0.4%), South Eastern Asia (5 | 0.4%), and Albania (4 | 0.3%), together accounting for 2.0% of all Concord residents.
| Immigration Origin | # Population | % Population |
| Albania | 4 | 0.3% |
| Asia | 5 | 0.4% |
| Canada | 2 | 0.2% |
| Eastern Europe | 4 | 0.3% |
| Europe | 5 | 0.4% |
| France | 1 | 0.1% |
| Laos | 5 | 0.4% |
| South Eastern Asia | 5 | 0.4% |
| Western Europe | 1 | 0.1% | View All 9 Rows |
Sex and Age in Concord
Sex and Age in Concord
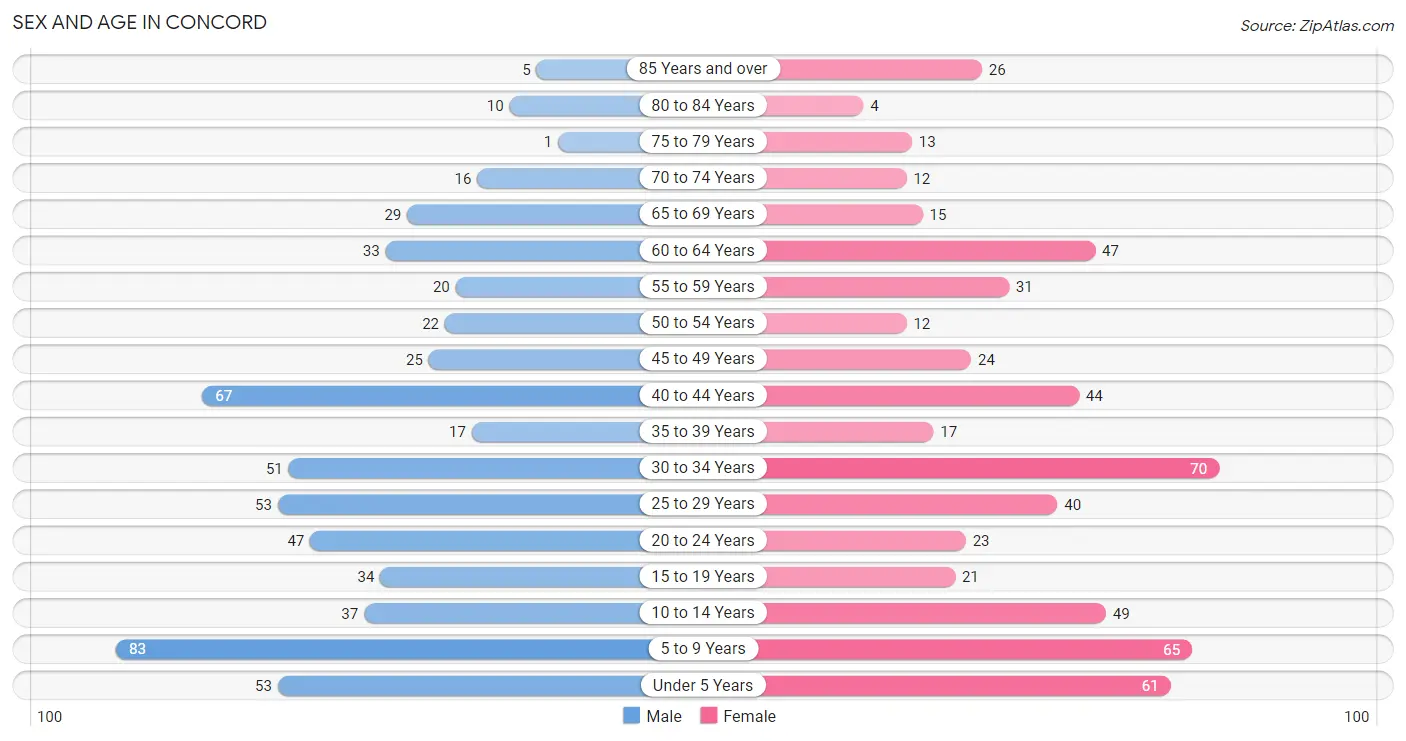
The most populous age groups in Concord are 5 to 9 Years (83 | 13.8%) for men and 30 to 34 Years (70 | 12.2%) for women.
| Age Bracket | Male | Female |
| Under 5 Years | 53 (8.8%) | 61 (10.6%) |
| 5 to 9 Years | 83 (13.8%) | 65 (11.3%) |
| 10 to 14 Years | 37 (6.1%) | 49 (8.5%) |
| 15 to 19 Years | 34 (5.6%) | 21 (3.7%) |
| 20 to 24 Years | 47 (7.8%) | 23 (4.0%) |
| 25 to 29 Years | 53 (8.8%) | 40 (7.0%) |
| 30 to 34 Years | 51 (8.5%) | 70 (12.2%) |
| 35 to 39 Years | 17 (2.8%) | 17 (3.0%) |
| 40 to 44 Years | 67 (11.1%) | 44 (7.7%) |
| 45 to 49 Years | 25 (4.2%) | 24 (4.2%) |
| 50 to 54 Years | 22 (3.6%) | 12 (2.1%) |
| 55 to 59 Years | 20 (3.3%) | 31 (5.4%) |
| 60 to 64 Years | 33 (5.5%) | 47 (8.2%) |
| 65 to 69 Years | 29 (4.8%) | 15 (2.6%) |
| 70 to 74 Years | 16 (2.6%) | 12 (2.1%) |
| 75 to 79 Years | 1 (0.2%) | 13 (2.3%) |
| 80 to 84 Years | 10 (1.7%) | 4 (0.7%) |
| 85 Years and over | 5 (0.8%) | 26 (4.5%) |
| Total | 603 (100.0%) | 574 (100.0%) |
Families and Households in Concord
Median Family Size in Concord
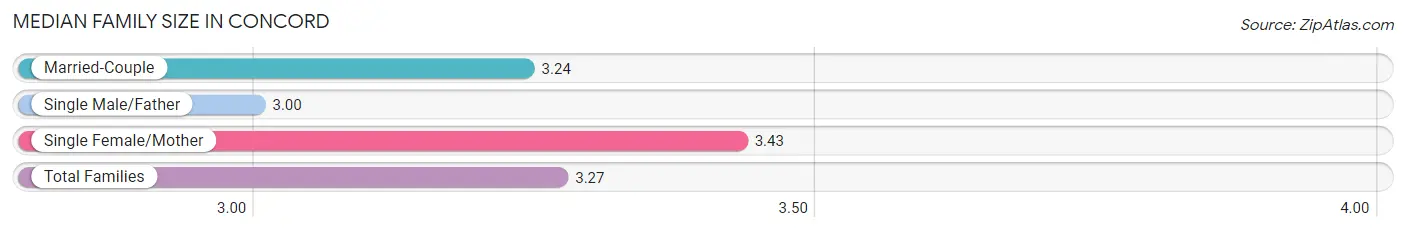
The median family size in Concord is 3.27 persons per family, with single female/mother families (76 | 25.6%) accounting for the largest median family size of 3.43 persons per family. On the other hand, single male/father families (26 | 8.7%) represent the smallest median family size with 3.00 persons per family.
| Family Type | # Families | Family Size |
| Married-Couple | 195 (65.7%) | 3.24 |
| Single Male/Father | 26 (8.7%) | 3.00 |
| Single Female/Mother | 76 (25.6%) | 3.43 |
| Total Families | 297 (100.0%) | 3.27 |
Median Household Size in Concord
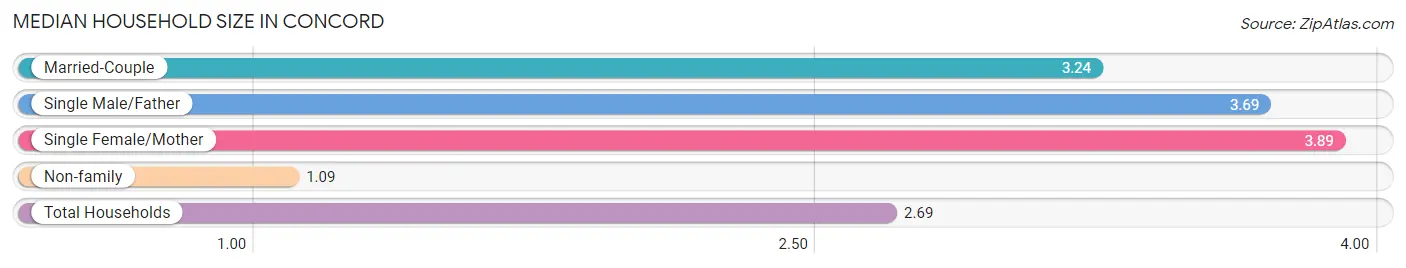
The median household size in Concord is 2.69 persons per household, with single female/mother households (76 | 17.3%) accounting for the largest median household size of 3.89 persons per household. non-family households (141 | 32.2%) represent the smallest median household size with 1.09 persons per household.
| Household Type | # Households | Household Size |
| Married-Couple | 195 (44.5%) | 3.24 |
| Single Male/Father | 26 (5.9%) | 3.69 |
| Single Female/Mother | 76 (17.3%) | 3.89 |
| Non-family | 141 (32.2%) | 1.09 |
| Total Households | 438 (100.0%) | 2.69 |
Household Size by Marriage Status in Concord
Out of a total of 438 households in Concord, 297 (67.8%) are family households, while 141 (32.2%) are nonfamily households. The most numerous type of family households are 2-person households, comprising 110, and the most common type of nonfamily households are 1-person households, comprising 128.
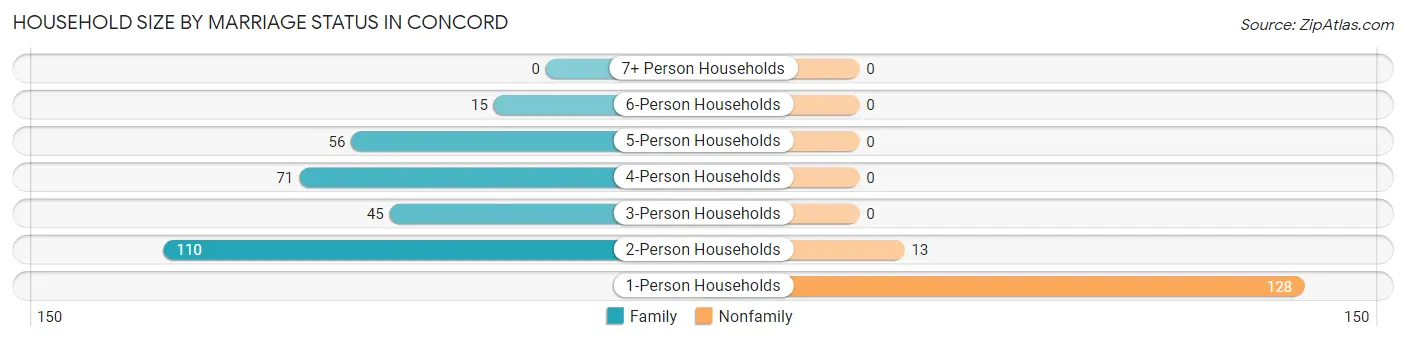
| Household Size | Family Households | Nonfamily Households |
| 1-Person Households | - | 128 (29.2%) |
| 2-Person Households | 110 (25.1%) | 13 (3.0%) |
| 3-Person Households | 45 (10.3%) | 0 (0.0%) |
| 4-Person Households | 71 (16.2%) | 0 (0.0%) |
| 5-Person Households | 56 (12.8%) | 0 (0.0%) |
| 6-Person Households | 15 (3.4%) | 0 (0.0%) |
| 7+ Person Households | 0 (0.0%) | 0 (0.0%) |
| Total | 297 (67.8%) | 141 (32.2%) |
Female Fertility in Concord
Fertility by Age in Concord
Average fertility rate in Concord is 142.0 births per 1,000 women. Women in the age bracket of 20 to 34 years have the highest fertility rate with 256.0 births per 1,000 women. Women in the age bracket of 20 to 34 years acount for 100.0% of all women with births.
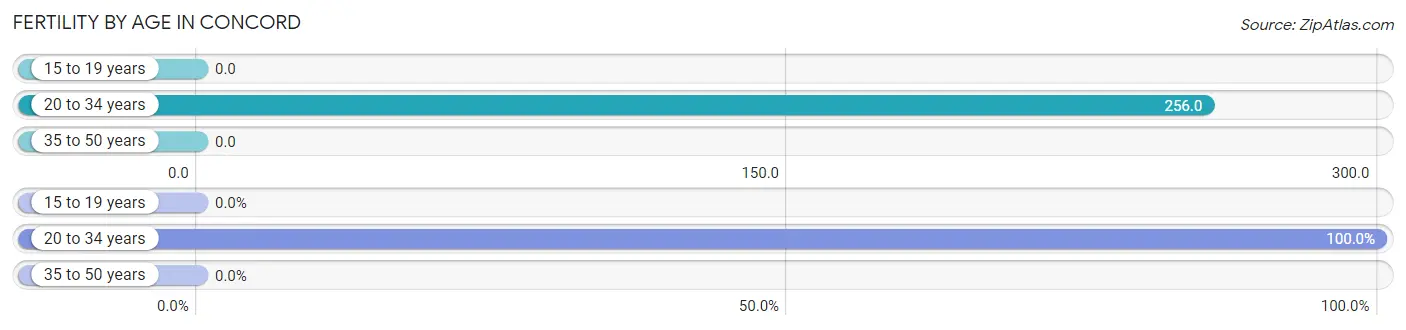
| Age Bracket | Women with Births | Births / 1,000 Women |
| 15 to 19 years | 0 (0.0%) | 0.0 |
| 20 to 34 years | 34 (100.0%) | 256.0 |
| 35 to 50 years | 0 (0.0%) | 0.0 |
| Total | 34 (100.0%) | 142.0 |
Fertility by Age by Marriage Status in Concord
70.6% of women with births (34) in Concord are married. The highest percentage of unmarried women with births falls into 20 to 34 years age bracket with 29.4% of them unmarried at the time of birth, while the lowest percentage of unmarried women with births belong to 20 to 34 years age bracket with 29.4% of them unmarried.
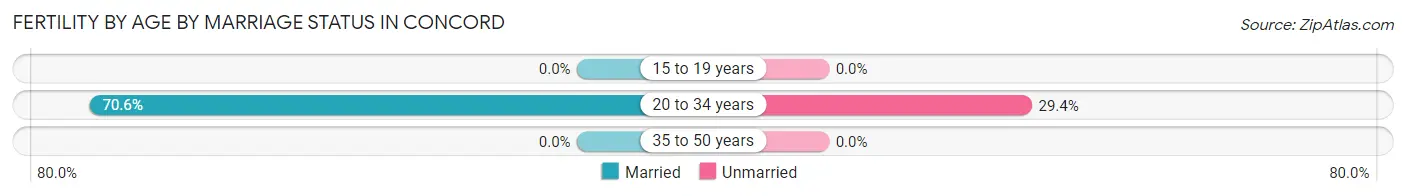
| Age Bracket | Married | Unmarried |
| 15 to 19 years | 0 (0.0%) | 0 (0.0%) |
| 20 to 34 years | 24 (70.6%) | 10 (29.4%) |
| 35 to 50 years | 0 (0.0%) | 0 (0.0%) |
| Total | 24 (70.6%) | 10 (29.4%) |
Fertility by Education in Concord
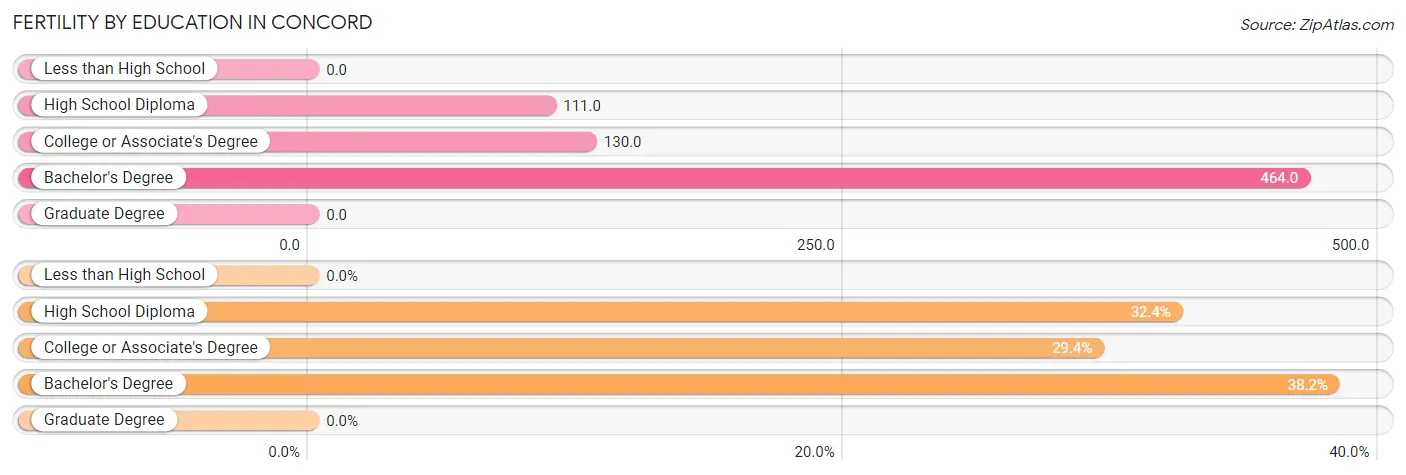
| Educational Attainment | Women with Births | Births / 1,000 Women |
| Less than High School | 0 (0.0%) | 0.0 |
| High School Diploma | 11 (32.4%) | 111.0 |
| College or Associate's Degree | 10 (29.4%) | 130.0 |
| Bachelor's Degree | 13 (38.2%) | 464.0 |
| Graduate Degree | 0 (0.0%) | 0.0 |
| Total | 34 (100.0%) | 142.0 |
Fertility by Education by Marriage Status in Concord
29.4% of women with births in Concord are unmarried. Women with the educational attainment of high school diploma are most likely to be married with 100.0% of them married at childbirth, while women with the educational attainment of college or associate's degree are least likely to be married with 100.0% of them unmarried at childbirth.
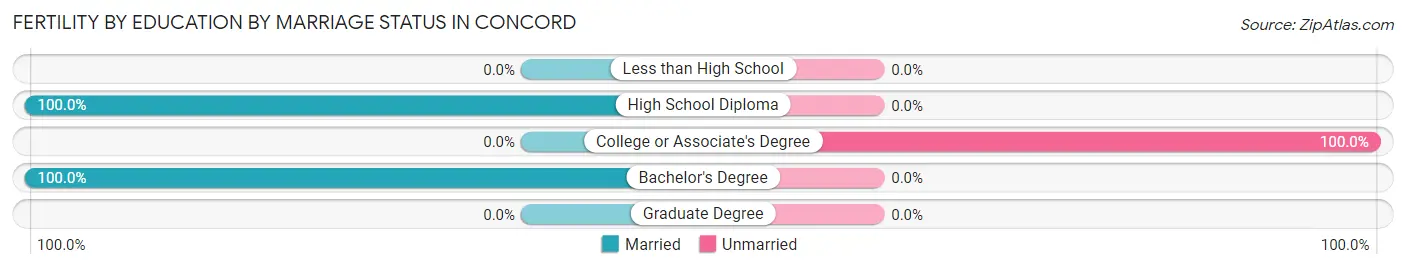
| Educational Attainment | Married | Unmarried |
| Less than High School | 0 (0.0%) | 0 (0.0%) |
| High School Diploma | 11 (100.0%) | 0 (0.0%) |
| College or Associate's Degree | 0 (0.0%) | 10 (100.0%) |
| Bachelor's Degree | 13 (100.0%) | 0 (0.0%) |
| Graduate Degree | 0 (0.0%) | 0 (0.0%) |
| Total | 24 (70.6%) | 10 (29.4%) |
Employment Characteristics in Concord
Employment by Class of Employer in Concord
Among the 518 employed individuals in Concord, private company employees (382 | 73.8%), local government employees (45 | 8.7%), and not-for-profit organizations (34 | 6.6%) make up the most common classes of employment.
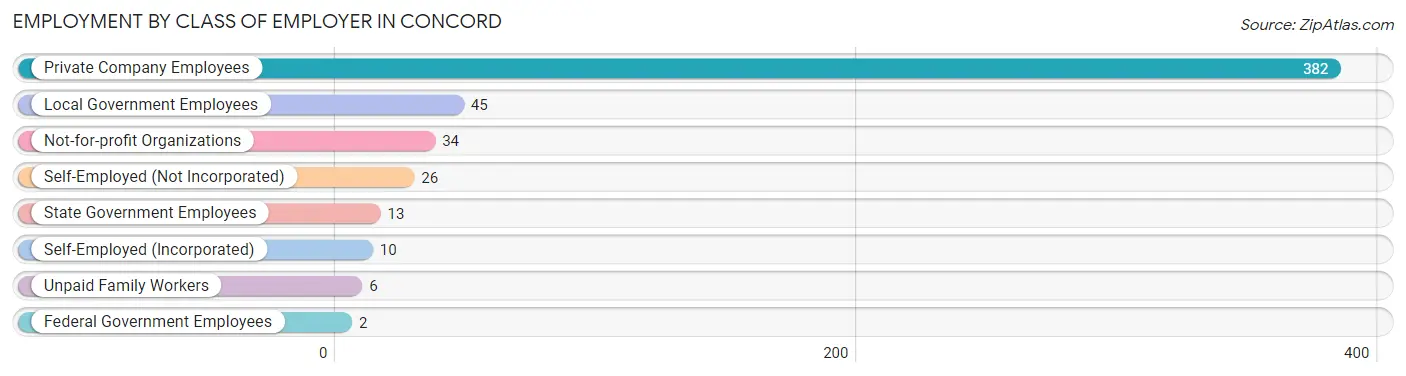
| Employer Class | # Employees | % Employees |
| Private Company Employees | 382 | 73.8% |
| Self-Employed (Incorporated) | 10 | 1.9% |
| Self-Employed (Not Incorporated) | 26 | 5.0% |
| Not-for-profit Organizations | 34 | 6.6% |
| Local Government Employees | 45 | 8.7% |
| State Government Employees | 13 | 2.5% |
| Federal Government Employees | 2 | 0.4% |
| Unpaid Family Workers | 6 | 1.2% |
| Total | 518 | 100.0% |
Employment Status by Age in Concord
According to the labor force statistics for Concord, out of the total population over 16 years of age (806), 68.5% or 552 individuals are in the labor force, with 4.2% or 23 of them unemployed. The age group with the highest labor force participation rate is 25 to 29 years, with 97.8% or 91 individuals in the labor force. Within the labor force, the 16 to 19 years age range has the highest percentage of unemployed individuals, with 21.1% or 4 of them being unemployed.
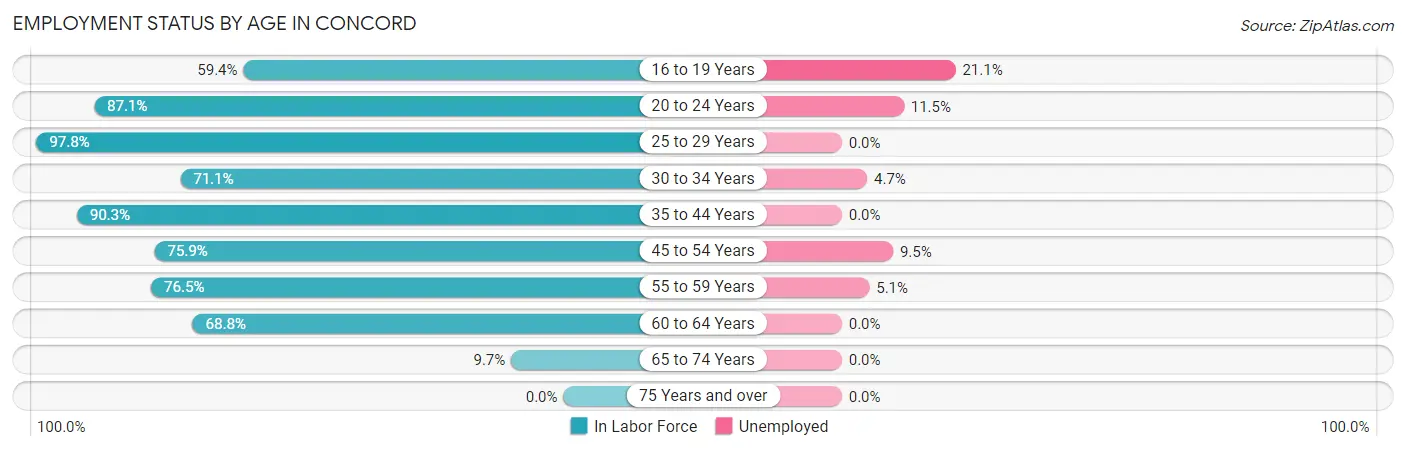
| Age Bracket | In Labor Force | Unemployed |
| 16 to 19 Years | 19 (59.4%) | 4 (21.1%) |
| 20 to 24 Years | 61 (87.1%) | 7 (11.5%) |
| 25 to 29 Years | 91 (97.8%) | 0 (0.0%) |
| 30 to 34 Years | 86 (71.1%) | 4 (4.7%) |
| 35 to 44 Years | 131 (90.3%) | 0 (0.0%) |
| 45 to 54 Years | 63 (75.9%) | 6 (9.5%) |
| 55 to 59 Years | 39 (76.5%) | 2 (5.1%) |
| 60 to 64 Years | 55 (68.8%) | 0 (0.0%) |
| 65 to 74 Years | 7 (9.7%) | 0 (0.0%) |
| 75 Years and over | 0 (0.0%) | 0 (0.0%) |
| Total | 552 (68.5%) | 23 (4.2%) |
Employment Status by Educational Attainment in Concord
According to labor force statistics for Concord, 81.2% of individuals (465) out of the total population between 25 and 64 years of age (573) are in the labor force, with 2.6% or 12 of them being unemployed. The group with the highest labor force participation rate are those with the educational attainment of bachelor's degree or higher, with 90.1% or 82 individuals in the labor force. Within the labor force, individuals with high school diploma education have the highest percentage of unemployment, with 7.7% or 12 of them being unemployed.
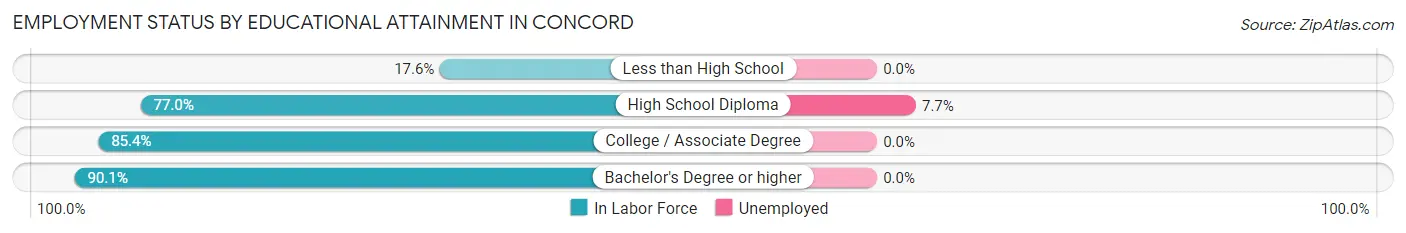
| Educational Attainment | In Labor Force | Unemployed |
| Less than High School | 3 (17.6%) | 0 (0.0%) |
| High School Diploma | 157 (77.0%) | 16 (7.7%) |
| College / Associate Degree | 223 (85.4%) | 0 (0.0%) |
| Bachelor's Degree or higher | 82 (90.1%) | 0 (0.0%) |
| Total | 465 (81.2%) | 15 (2.6%) |
Employment Occupations by Sex in Concord
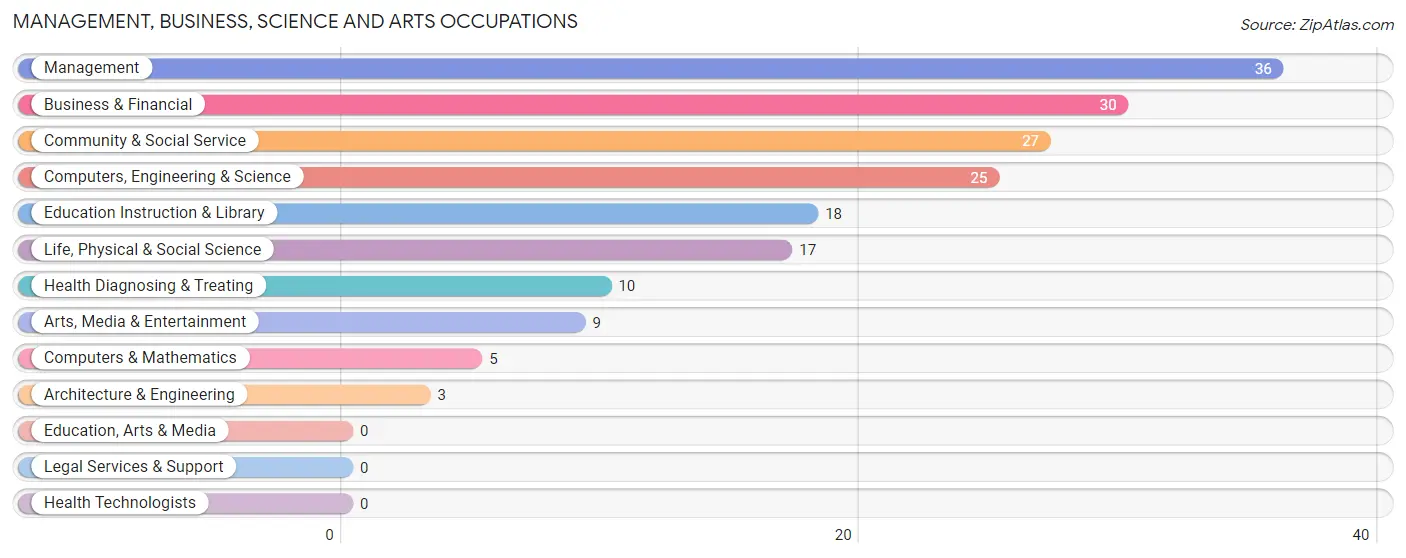
Management, Business, Science and Arts Occupations
The most common Management, Business, Science and Arts occupations in Concord are Management (36 | 6.8%), Business & Financial (30 | 5.7%), Community & Social Service (27 | 5.1%), Computers, Engineering & Science (25 | 4.7%), and Education Instruction & Library (18 | 3.4%).
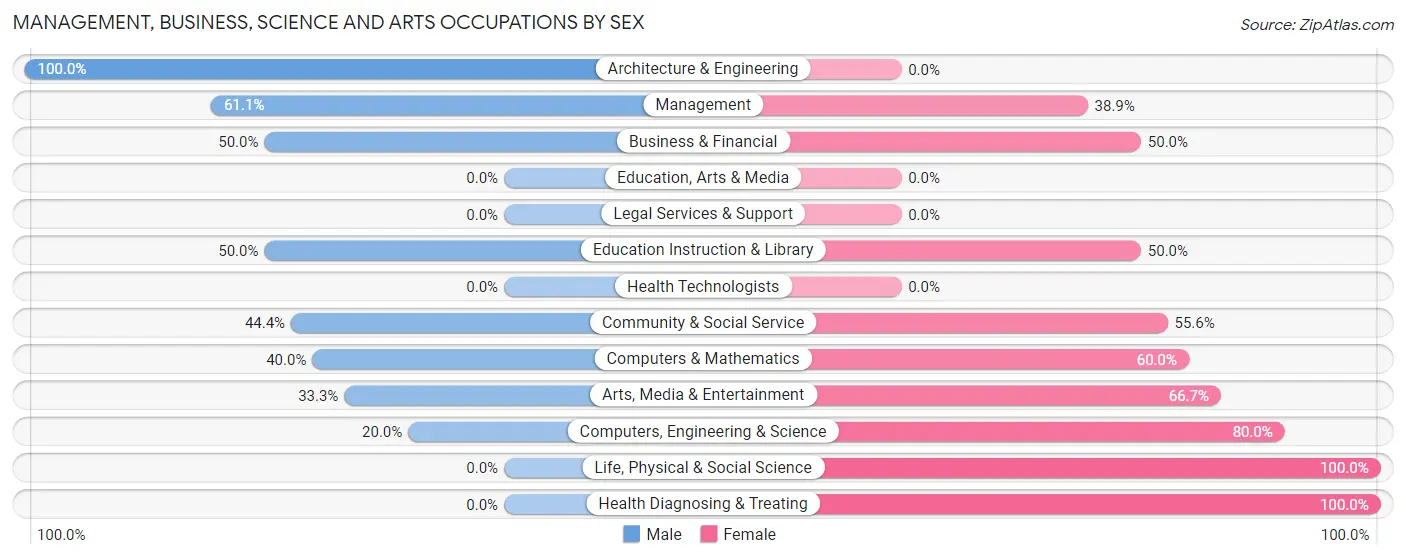
Management, Business, Science and Arts Occupations by Sex
Within the Management, Business, Science and Arts occupations in Concord, the most male-oriented occupations are Architecture & Engineering (100.0%), Management (61.1%), and Business & Financial (50.0%), while the most female-oriented occupations are Life, Physical & Social Science (100.0%), Health Diagnosing & Treating (100.0%), and Computers, Engineering & Science (80.0%).
| Occupation | Male | Female |
| Management | 22 (61.1%) | 14 (38.9%) |
| Business & Financial | 15 (50.0%) | 15 (50.0%) |
| Computers, Engineering & Science | 5 (20.0%) | 20 (80.0%) |
| Computers & Mathematics | 2 (40.0%) | 3 (60.0%) |
| Architecture & Engineering | 3 (100.0%) | 0 (0.0%) |
| Life, Physical & Social Science | 0 (0.0%) | 17 (100.0%) |
| Community & Social Service | 12 (44.4%) | 15 (55.6%) |
| Education, Arts & Media | 0 (0.0%) | 0 (0.0%) |
| Legal Services & Support | 0 (0.0%) | 0 (0.0%) |
| Education Instruction & Library | 9 (50.0%) | 9 (50.0%) |
| Arts, Media & Entertainment | 3 (33.3%) | 6 (66.7%) |
| Health Diagnosing & Treating | 0 (0.0%) | 10 (100.0%) |
| Health Technologists | 0 (0.0%) | 0 (0.0%) |
| Total (Category) | 54 (42.2%) | 74 (57.8%) |
| Total (Overall) | 298 (56.6%) | 229 (43.4%) |
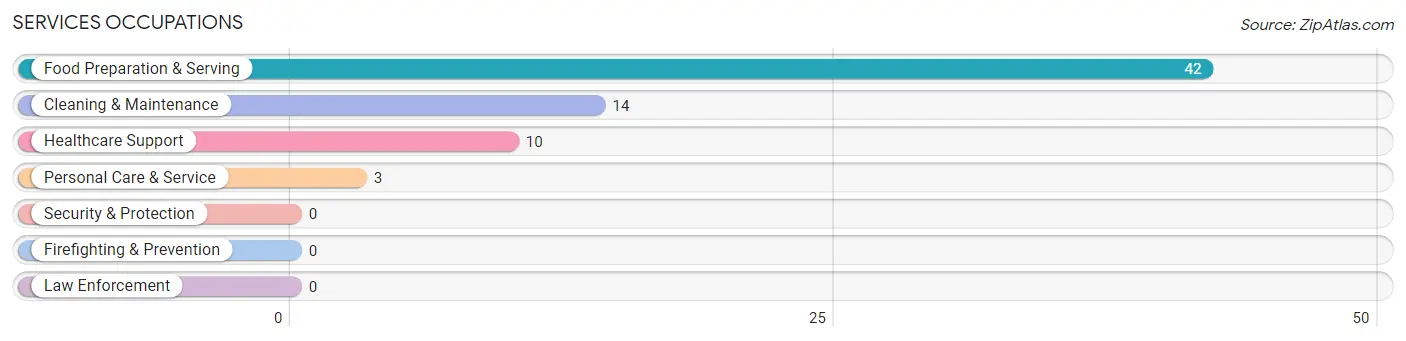
Services Occupations
The most common Services occupations in Concord are Food Preparation & Serving (42 | 8.0%), Cleaning & Maintenance (14 | 2.7%), Healthcare Support (10 | 1.9%), and Personal Care & Service (3 | 0.6%).
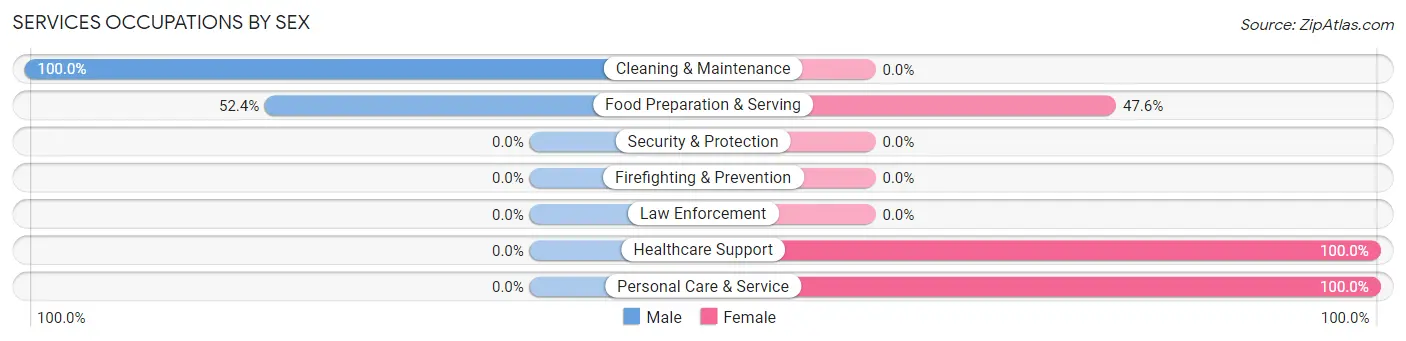
Services Occupations by Sex
Within the Services occupations in Concord, the most male-oriented occupations are Cleaning & Maintenance (100.0%), and Food Preparation & Serving (52.4%), while the most female-oriented occupations are Healthcare Support (100.0%), Personal Care & Service (100.0%), and Food Preparation & Serving (47.6%).
| Occupation | Male | Female |
| Healthcare Support | 0 (0.0%) | 10 (100.0%) |
| Security & Protection | 0 (0.0%) | 0 (0.0%) |
| Firefighting & Prevention | 0 (0.0%) | 0 (0.0%) |
| Law Enforcement | 0 (0.0%) | 0 (0.0%) |
| Food Preparation & Serving | 22 (52.4%) | 20 (47.6%) |
| Cleaning & Maintenance | 14 (100.0%) | 0 (0.0%) |
| Personal Care & Service | 0 (0.0%) | 3 (100.0%) |
| Total (Category) | 36 (52.2%) | 33 (47.8%) |
| Total (Overall) | 298 (56.6%) | 229 (43.4%) |
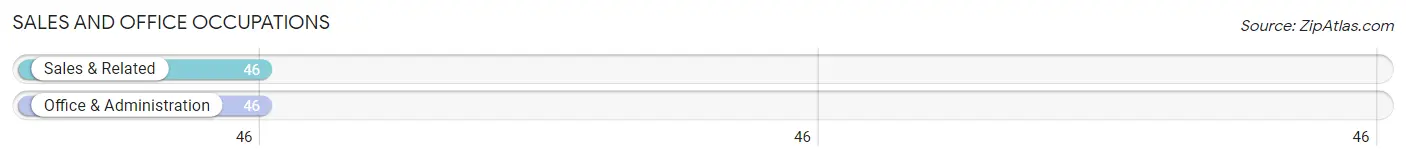
Sales and Office Occupations
The most common Sales and Office occupations in Concord are Sales & Related (46 | 8.7%), and Office & Administration (46 | 8.7%).
Sales and Office Occupations by Sex
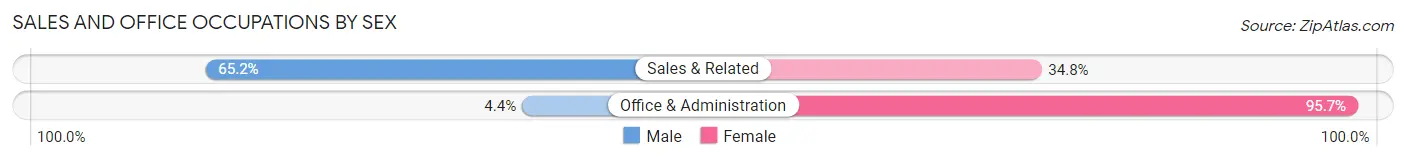
| Occupation | Male | Female |
| Sales & Related | 30 (65.2%) | 16 (34.8%) |
| Office & Administration | 2 (4.3%) | 44 (95.7%) |
| Total (Category) | 32 (34.8%) | 60 (65.2%) |
| Total (Overall) | 298 (56.6%) | 229 (43.4%) |
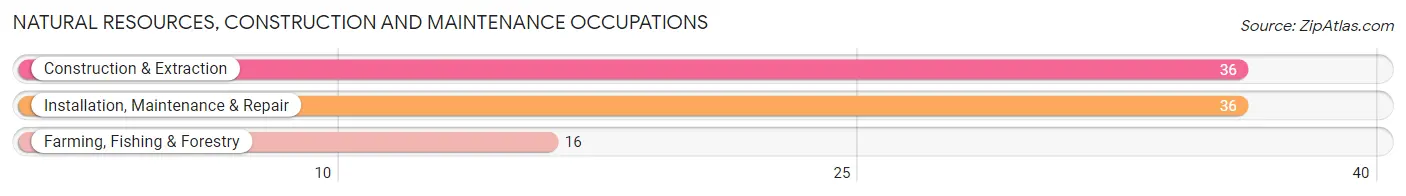
Natural Resources, Construction and Maintenance Occupations
The most common Natural Resources, Construction and Maintenance occupations in Concord are Construction & Extraction (36 | 6.8%), Installation, Maintenance & Repair (36 | 6.8%), and Farming, Fishing & Forestry (16 | 3.0%).
Natural Resources, Construction and Maintenance Occupations by Sex
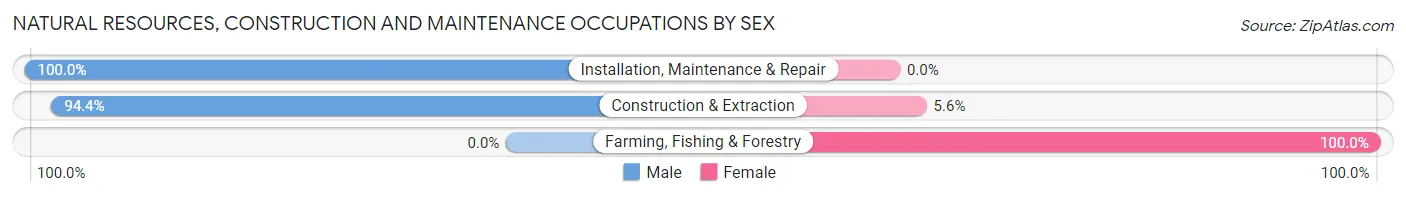
| Occupation | Male | Female |
| Farming, Fishing & Forestry | 0 (0.0%) | 16 (100.0%) |
| Construction & Extraction | 34 (94.4%) | 2 (5.6%) |
| Installation, Maintenance & Repair | 36 (100.0%) | 0 (0.0%) |
| Total (Category) | 70 (79.5%) | 18 (20.4%) |
| Total (Overall) | 298 (56.6%) | 229 (43.4%) |
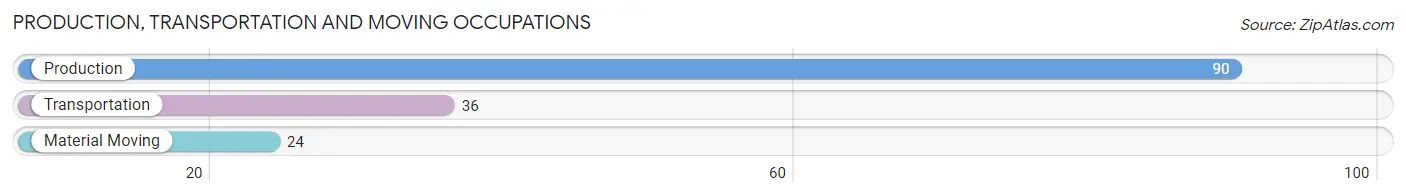
Production, Transportation and Moving Occupations
The most common Production, Transportation and Moving occupations in Concord are Production (90 | 17.1%), Transportation (36 | 6.8%), and Material Moving (24 | 4.5%).
Production, Transportation and Moving Occupations by Sex
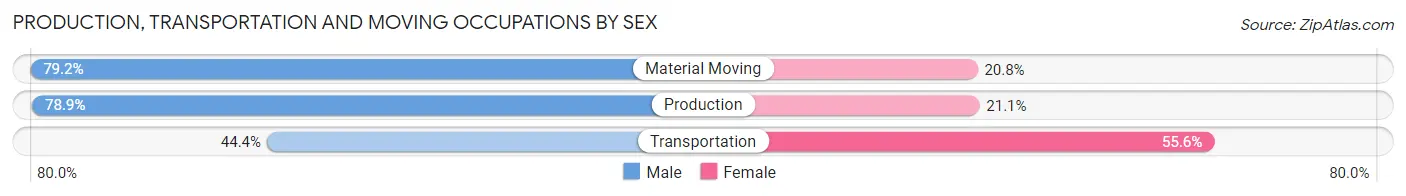
| Occupation | Male | Female |
| Production | 71 (78.9%) | 19 (21.1%) |
| Transportation | 16 (44.4%) | 20 (55.6%) |
| Material Moving | 19 (79.2%) | 5 (20.8%) |
| Total (Category) | 106 (70.7%) | 44 (29.3%) |
| Total (Overall) | 298 (56.6%) | 229 (43.4%) |
Employment Industries by Sex in Concord
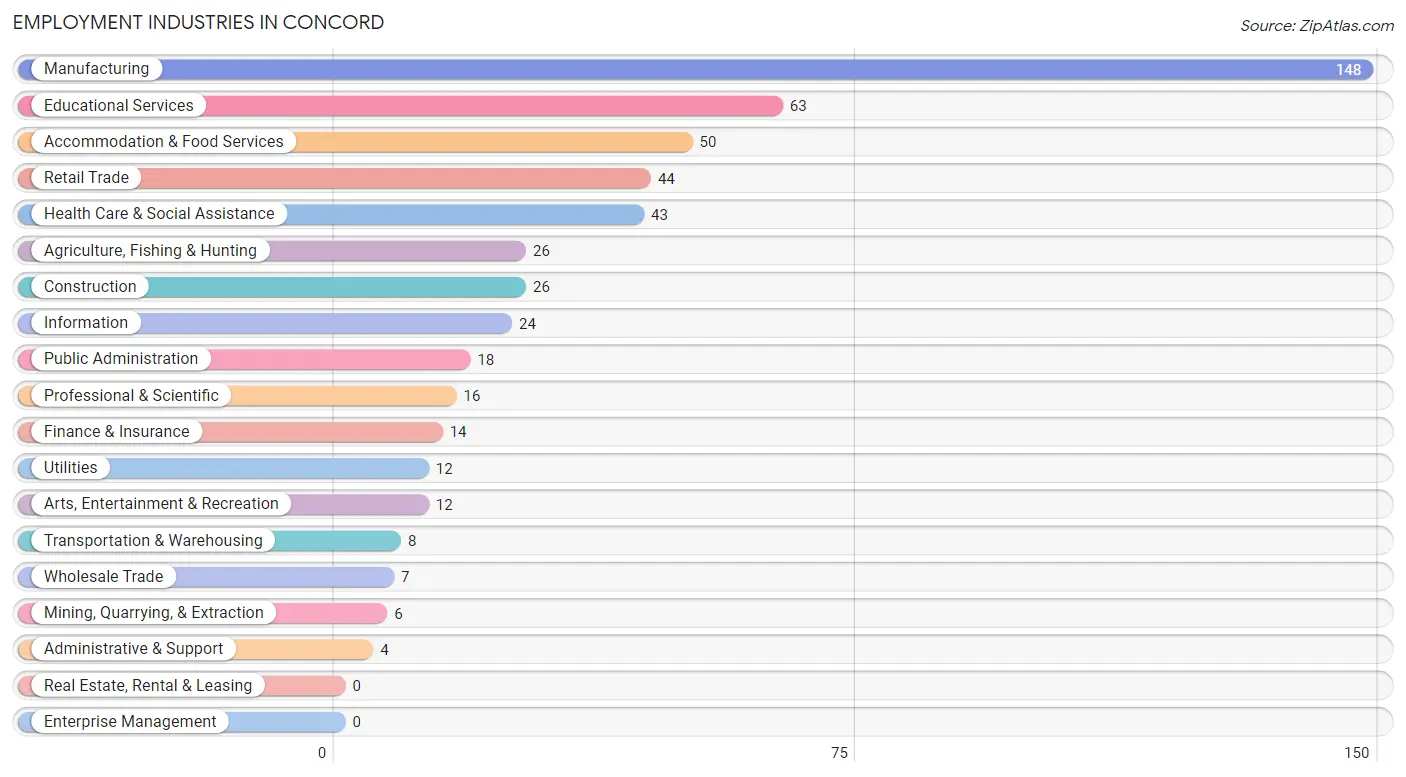
Employment Industries in Concord
The major employment industries in Concord include Manufacturing (148 | 28.1%), Educational Services (63 | 11.9%), Accommodation & Food Services (50 | 9.5%), Retail Trade (44 | 8.4%), and Health Care & Social Assistance (43 | 8.2%).
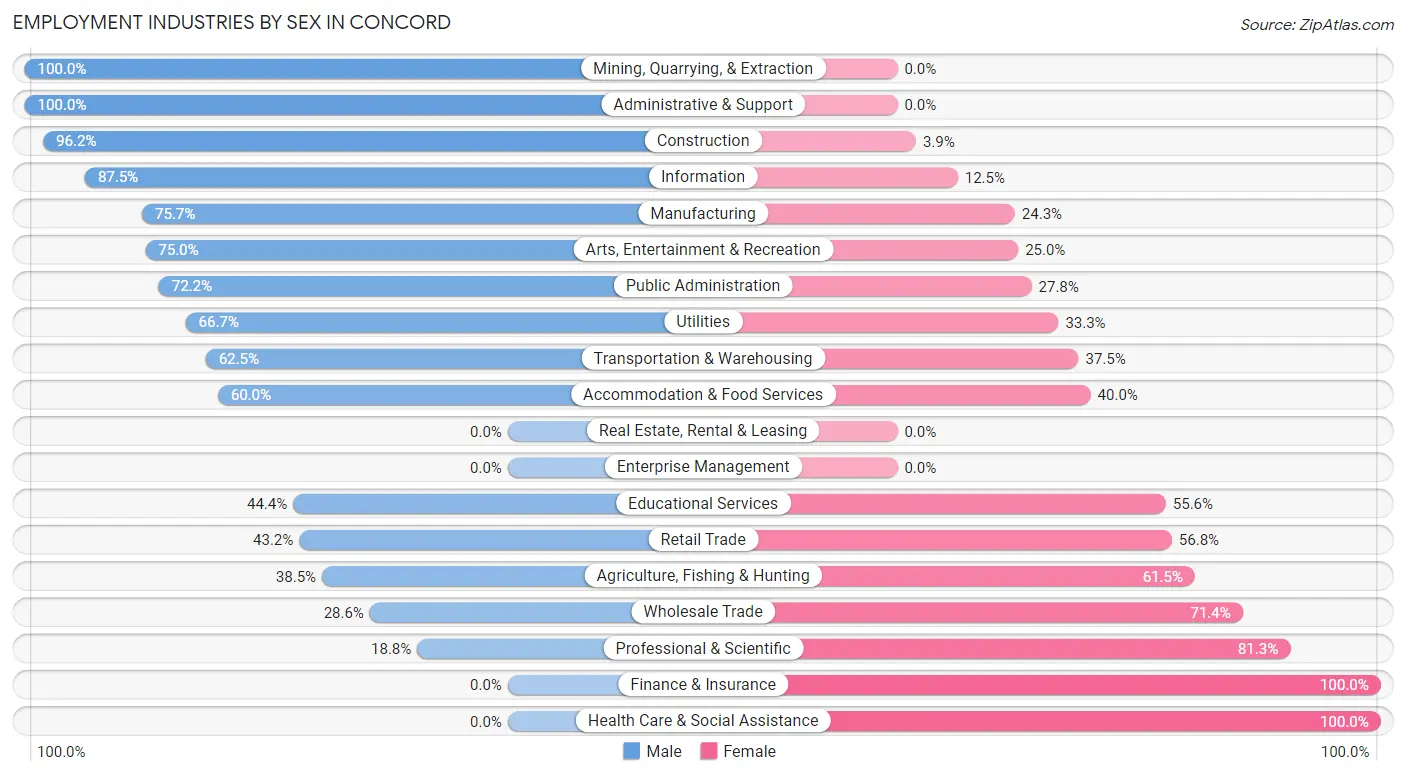
Employment Industries by Sex in Concord
The Concord industries that see more men than women are Mining, Quarrying, & Extraction (100.0%), Administrative & Support (100.0%), and Construction (96.2%), whereas the industries that tend to have a higher number of women are Finance & Insurance (100.0%), Health Care & Social Assistance (100.0%), and Professional & Scientific (81.2%).
| Industry | Male | Female |
| Agriculture, Fishing & Hunting | 10 (38.5%) | 16 (61.5%) |
| Mining, Quarrying, & Extraction | 6 (100.0%) | 0 (0.0%) |
| Construction | 25 (96.2%) | 1 (3.8%) |
| Manufacturing | 112 (75.7%) | 36 (24.3%) |
| Wholesale Trade | 2 (28.6%) | 5 (71.4%) |
| Retail Trade | 19 (43.2%) | 25 (56.8%) |
| Transportation & Warehousing | 5 (62.5%) | 3 (37.5%) |
| Utilities | 8 (66.7%) | 4 (33.3%) |
| Information | 21 (87.5%) | 3 (12.5%) |
| Finance & Insurance | 0 (0.0%) | 14 (100.0%) |
| Real Estate, Rental & Leasing | 0 (0.0%) | 0 (0.0%) |
| Professional & Scientific | 3 (18.8%) | 13 (81.2%) |
| Enterprise Management | 0 (0.0%) | 0 (0.0%) |
| Administrative & Support | 4 (100.0%) | 0 (0.0%) |
| Educational Services | 28 (44.4%) | 35 (55.6%) |
| Health Care & Social Assistance | 0 (0.0%) | 43 (100.0%) |
| Arts, Entertainment & Recreation | 9 (75.0%) | 3 (25.0%) |
| Accommodation & Food Services | 30 (60.0%) | 20 (40.0%) |
| Public Administration | 13 (72.2%) | 5 (27.8%) |
| Total | 298 (56.6%) | 229 (43.4%) |
Education in Concord
School Enrollment in Concord
The most common levels of schooling among the 334 students in Concord are elementary school (117 | 35.0%), high school (59 | 17.7%), and middle school (51 | 15.3%).
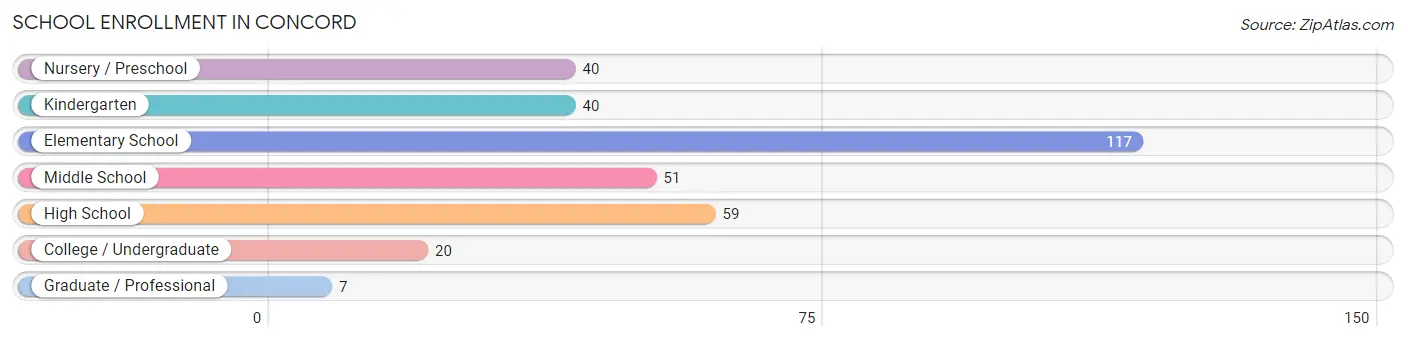
| School Level | # Students | % Students |
| Nursery / Preschool | 40 | 12.0% |
| Kindergarten | 40 | 12.0% |
| Elementary School | 117 | 35.0% |
| Middle School | 51 | 15.3% |
| High School | 59 | 17.7% |
| College / Undergraduate | 20 | 6.0% |
| Graduate / Professional | 7 | 2.1% |
| Total | 334 | 100.0% |
School Enrollment by Age by Funding Source in Concord
Out of a total of 334 students who are enrolled in schools in Concord, 12 (3.6%) attend a private institution, while the remaining 322 (96.4%) are enrolled in public schools. The age group of 25 to 34 year olds has the highest likelihood of being enrolled in private schools, with 3 (16.7% in the age bracket) enrolled. Conversely, the age group of 3 to 4 year olds has the lowest likelihood of being enrolled in a private school, with 33 (100.0% in the age bracket) attending a public institution.
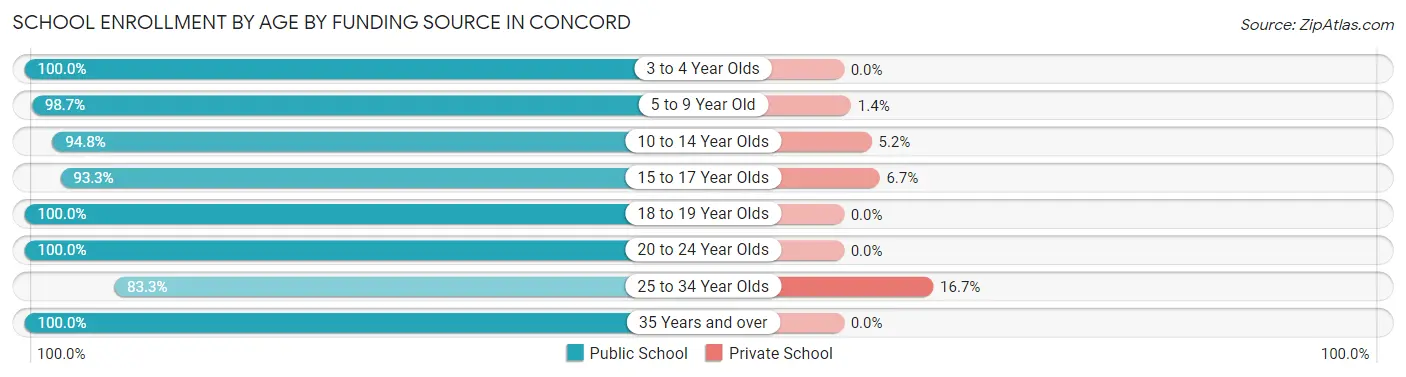
| Age Bracket | Public School | Private School |
| 3 to 4 Year Olds | 33 (100.0%) | 0 (0.0%) |
| 5 to 9 Year Old | 146 (98.7%) | 2 (1.3%) |
| 10 to 14 Year Olds | 73 (94.8%) | 4 (5.2%) |
| 15 to 17 Year Olds | 42 (93.3%) | 3 (6.7%) |
| 18 to 19 Year Olds | 7 (100.0%) | 0 (0.0%) |
| 20 to 24 Year Olds | 2 (100.0%) | 0 (0.0%) |
| 25 to 34 Year Olds | 15 (83.3%) | 3 (16.7%) |
| 35 Years and over | 4 (100.0%) | 0 (0.0%) |
| Total | 322 (96.4%) | 12 (3.6%) |
Educational Attainment by Field of Study in Concord
Education (25 | 19.5%), business (22 | 17.2%), social sciences (18 | 14.1%), science & technology (16 | 12.5%), and liberal arts & history (14 | 10.9%) are the most common fields of study among 128 individuals in Concord who have obtained a bachelor's degree or higher.
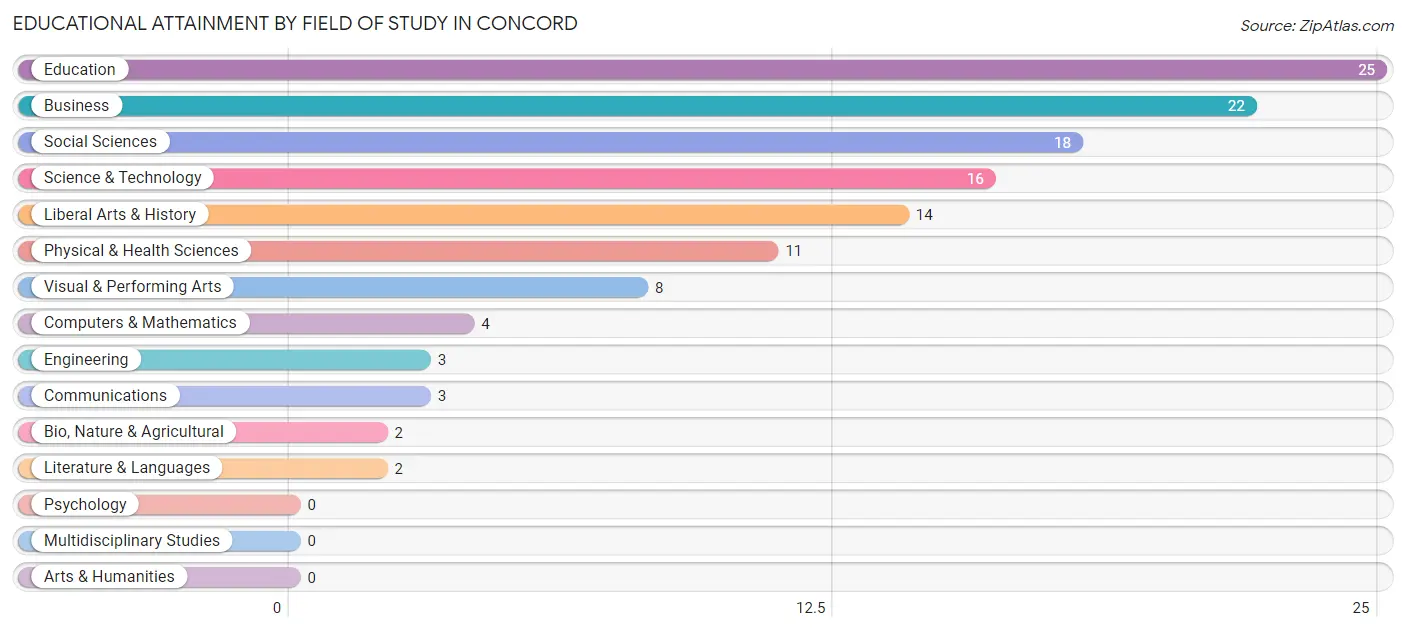
| Field of Study | # Graduates | % Graduates |
| Computers & Mathematics | 4 | 3.1% |
| Bio, Nature & Agricultural | 2 | 1.6% |
| Physical & Health Sciences | 11 | 8.6% |
| Psychology | 0 | 0.0% |
| Social Sciences | 18 | 14.1% |
| Engineering | 3 | 2.3% |
| Multidisciplinary Studies | 0 | 0.0% |
| Science & Technology | 16 | 12.5% |
| Business | 22 | 17.2% |
| Education | 25 | 19.5% |
| Literature & Languages | 2 | 1.6% |
| Liberal Arts & History | 14 | 10.9% |
| Visual & Performing Arts | 8 | 6.2% |
| Communications | 3 | 2.3% |
| Arts & Humanities | 0 | 0.0% |
| Total | 128 | 100.0% |
Transportation & Commute in Concord
Vehicle Availability by Sex in Concord
The most prevalent vehicle ownership categories in Concord are males with 2 vehicles (183, accounting for 61.6%) and females with 2 vehicles (116, making up 82.8%).
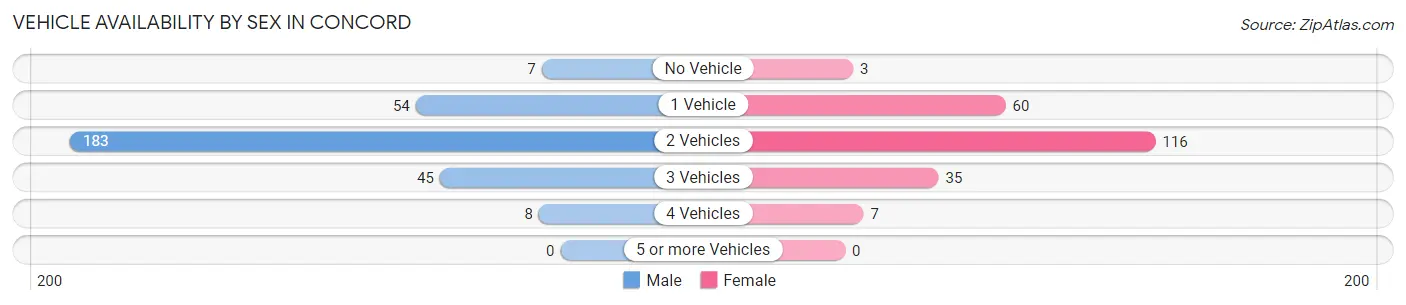
| Vehicles Available | Male | Female |
| No Vehicle | 7 (2.4%) | 3 (1.4%) |
| 1 Vehicle | 54 (18.2%) | 60 (27.2%) |
| 2 Vehicles | 183 (61.6%) | 116 (52.5%) |
| 3 Vehicles | 45 (15.1%) | 35 (15.8%) |
| 4 Vehicles | 8 (2.7%) | 7 (3.2%) |
| 5 or more Vehicles | 0 (0.0%) | 0 (0.0%) |
| Total | 297 (100.0%) | 221 (100.0%) |
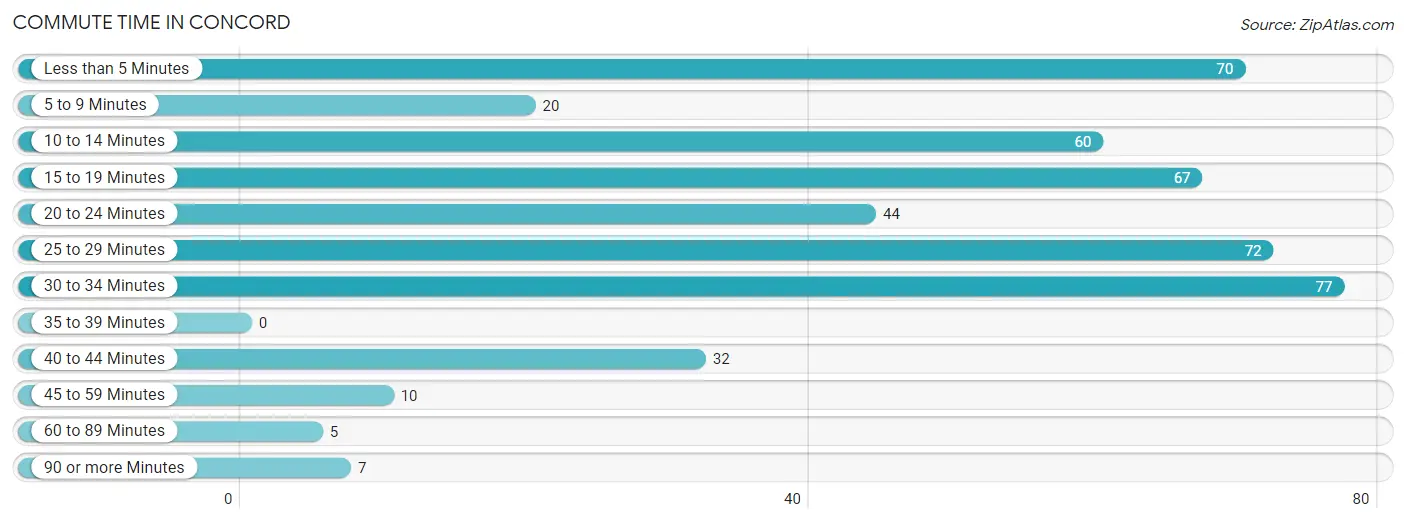
Commute Time in Concord
The most frequently occuring commute durations in Concord are 30 to 34 minutes (77 commuters, 16.6%), 25 to 29 minutes (72 commuters, 15.5%), and less than 5 minutes (70 commuters, 15.1%).
| Commute Time | # Commuters | % Commuters |
| Less than 5 Minutes | 70 | 15.1% |
| 5 to 9 Minutes | 20 | 4.3% |
| 10 to 14 Minutes | 60 | 12.9% |
| 15 to 19 Minutes | 67 | 14.4% |
| 20 to 24 Minutes | 44 | 9.5% |
| 25 to 29 Minutes | 72 | 15.5% |
| 30 to 34 Minutes | 77 | 16.6% |
| 35 to 39 Minutes | 0 | 0.0% |
| 40 to 44 Minutes | 32 | 6.9% |
| 45 to 59 Minutes | 10 | 2.2% |
| 60 to 89 Minutes | 5 | 1.1% |
| 90 or more Minutes | 7 | 1.5% |
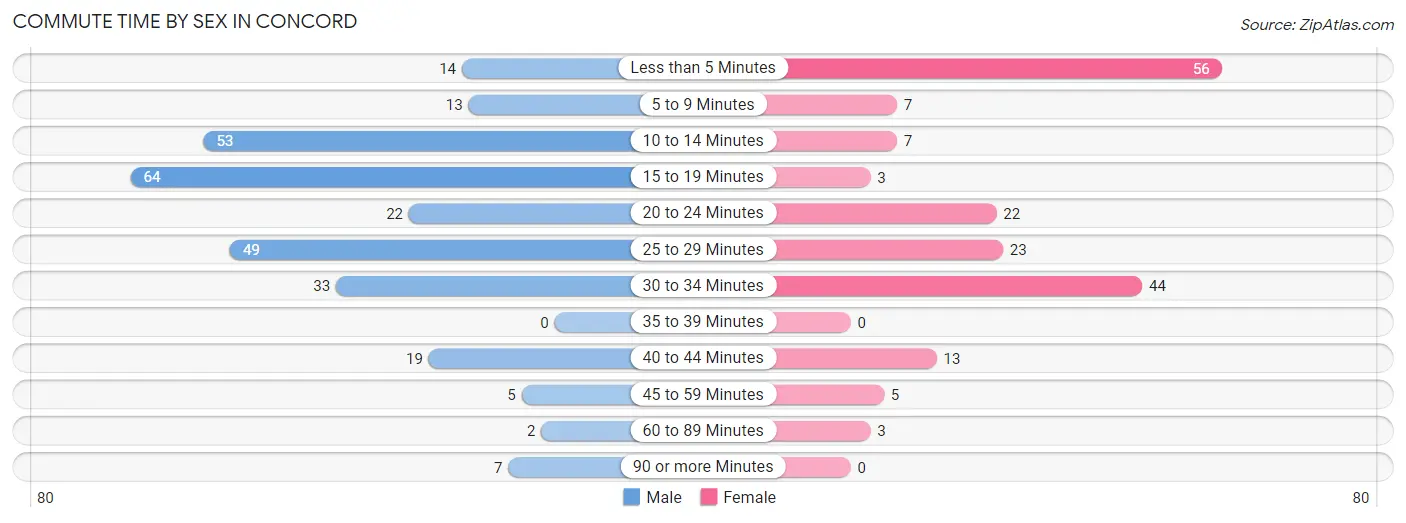
Commute Time by Sex in Concord
The most common commute times in Concord are 15 to 19 minutes (64 commuters, 22.8%) for males and less than 5 minutes (56 commuters, 30.6%) for females.
| Commute Time | Male | Female |
| Less than 5 Minutes | 14 (5.0%) | 56 (30.6%) |
| 5 to 9 Minutes | 13 (4.6%) | 7 (3.8%) |
| 10 to 14 Minutes | 53 (18.9%) | 7 (3.8%) |
| 15 to 19 Minutes | 64 (22.8%) | 3 (1.6%) |
| 20 to 24 Minutes | 22 (7.8%) | 22 (12.0%) |
| 25 to 29 Minutes | 49 (17.4%) | 23 (12.6%) |
| 30 to 34 Minutes | 33 (11.7%) | 44 (24.0%) |
| 35 to 39 Minutes | 0 (0.0%) | 0 (0.0%) |
| 40 to 44 Minutes | 19 (6.8%) | 13 (7.1%) |
| 45 to 59 Minutes | 5 (1.8%) | 5 (2.7%) |
| 60 to 89 Minutes | 2 (0.7%) | 3 (1.6%) |
| 90 or more Minutes | 7 (2.5%) | 0 (0.0%) |
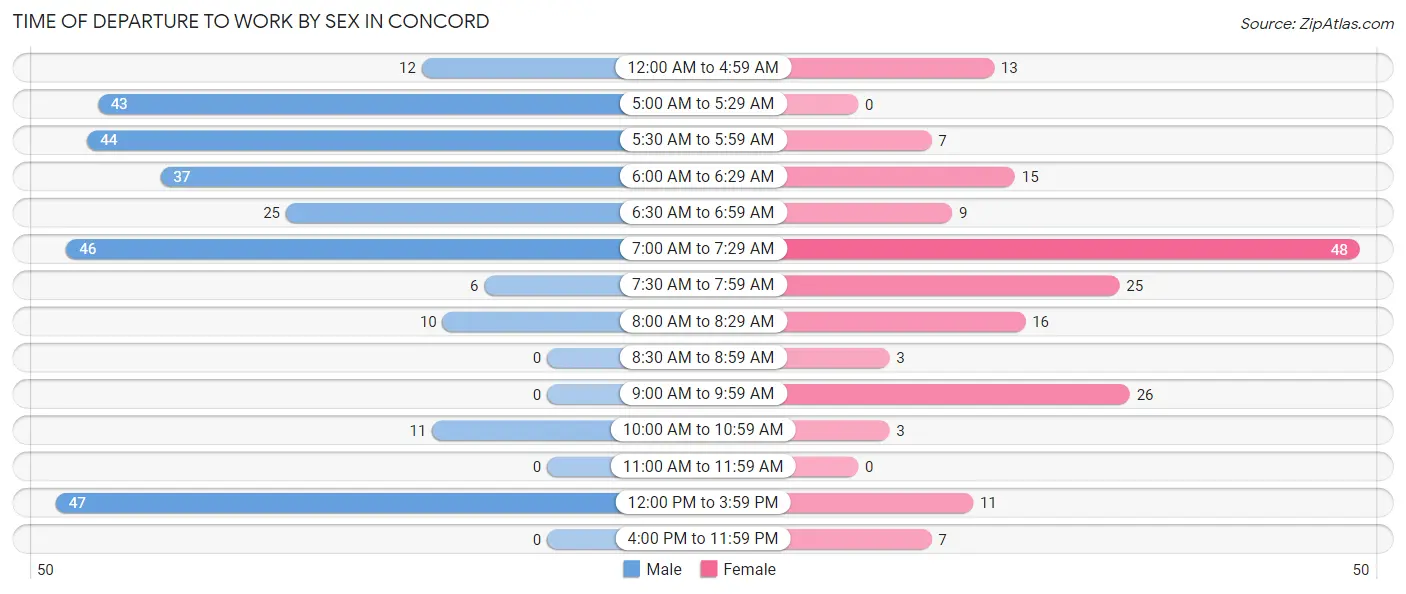
Time of Departure to Work by Sex in Concord
The most frequent times of departure to work in Concord are 12:00 PM to 3:59 PM (47, 16.7%) for males and 7:00 AM to 7:29 AM (48, 26.2%) for females.
| Time of Departure | Male | Female |
| 12:00 AM to 4:59 AM | 12 (4.3%) | 13 (7.1%) |
| 5:00 AM to 5:29 AM | 43 (15.3%) | 0 (0.0%) |
| 5:30 AM to 5:59 AM | 44 (15.7%) | 7 (3.8%) |
| 6:00 AM to 6:29 AM | 37 (13.2%) | 15 (8.2%) |
| 6:30 AM to 6:59 AM | 25 (8.9%) | 9 (4.9%) |
| 7:00 AM to 7:29 AM | 46 (16.4%) | 48 (26.2%) |
| 7:30 AM to 7:59 AM | 6 (2.1%) | 25 (13.7%) |
| 8:00 AM to 8:29 AM | 10 (3.6%) | 16 (8.7%) |
| 8:30 AM to 8:59 AM | 0 (0.0%) | 3 (1.6%) |
| 9:00 AM to 9:59 AM | 0 (0.0%) | 26 (14.2%) |
| 10:00 AM to 10:59 AM | 11 (3.9%) | 3 (1.6%) |
| 11:00 AM to 11:59 AM | 0 (0.0%) | 0 (0.0%) |
| 12:00 PM to 3:59 PM | 47 (16.7%) | 11 (6.0%) |
| 4:00 PM to 11:59 PM | 0 (0.0%) | 7 (3.8%) |
| Total | 281 (100.0%) | 183 (100.0%) |
Housing Occupancy in Concord
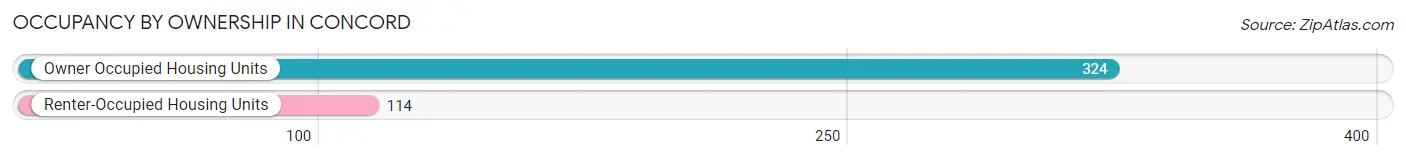
Occupancy by Ownership in Concord
Of the total 438 dwellings in Concord, owner-occupied units account for 324 (74.0%), while renter-occupied units make up 114 (26.0%).
| Occupancy | # Housing Units | % Housing Units |
| Owner Occupied Housing Units | 324 | 74.0% |
| Renter-Occupied Housing Units | 114 | 26.0% |
| Total Occupied Housing Units | 438 | 100.0% |
Occupancy by Household Size in Concord
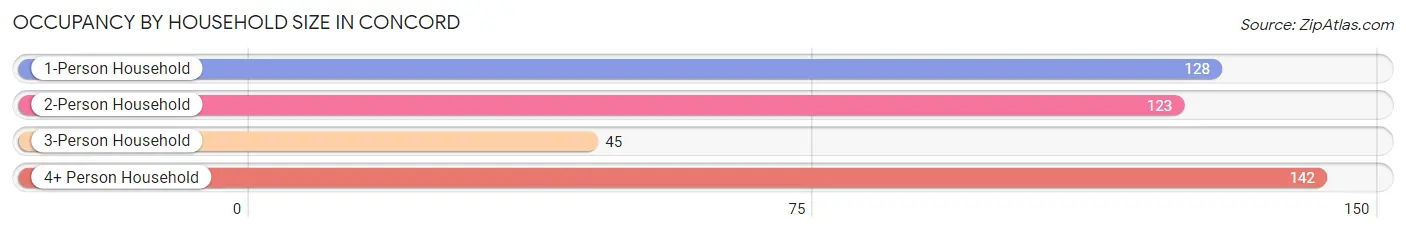
| Household Size | # Housing Units | % Housing Units |
| 1-Person Household | 128 | 29.2% |
| 2-Person Household | 123 | 28.1% |
| 3-Person Household | 45 | 10.3% |
| 4+ Person Household | 142 | 32.4% |
| Total Housing Units | 438 | 100.0% |
Occupancy by Ownership by Household Size in Concord
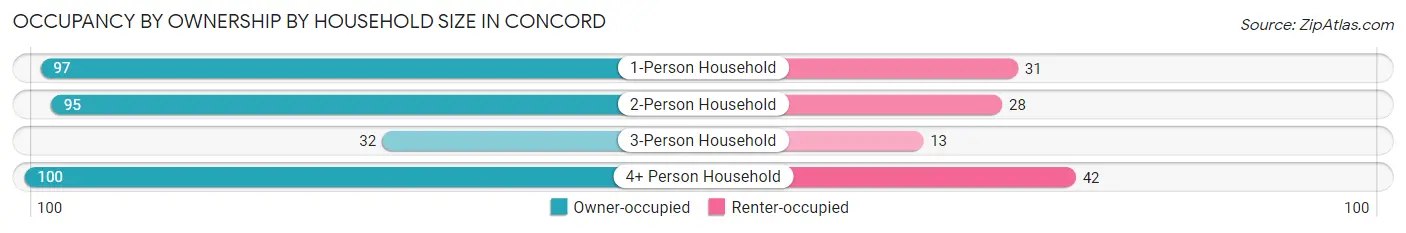
| Household Size | Owner-occupied | Renter-occupied |
| 1-Person Household | 97 (75.8%) | 31 (24.2%) |
| 2-Person Household | 95 (77.2%) | 28 (22.8%) |
| 3-Person Household | 32 (71.1%) | 13 (28.9%) |
| 4+ Person Household | 100 (70.4%) | 42 (29.6%) |
| Total Housing Units | 324 (74.0%) | 114 (26.0%) |
Occupancy by Educational Attainment in Concord
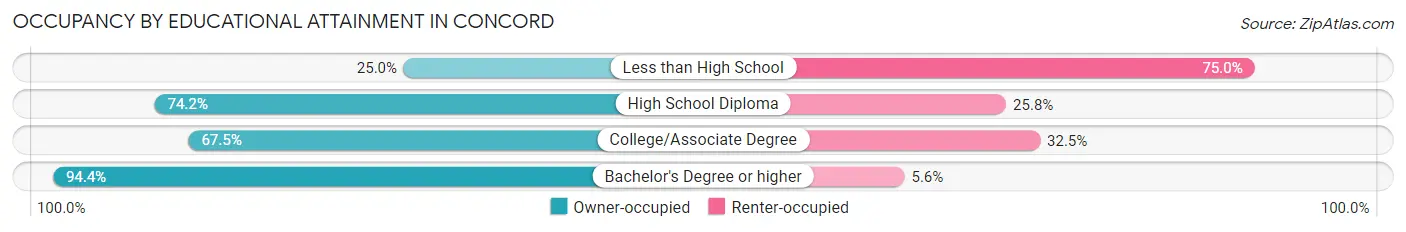
| Household Size | Owner-occupied | Renter-occupied |
| Less than High School | 1 (25.0%) | 3 (75.0%) |
| High School Diploma | 121 (74.2%) | 42 (25.8%) |
| College/Associate Degree | 135 (67.5%) | 65 (32.5%) |
| Bachelor's Degree or higher | 67 (94.4%) | 4 (5.6%) |
Occupancy by Age of Householder in Concord
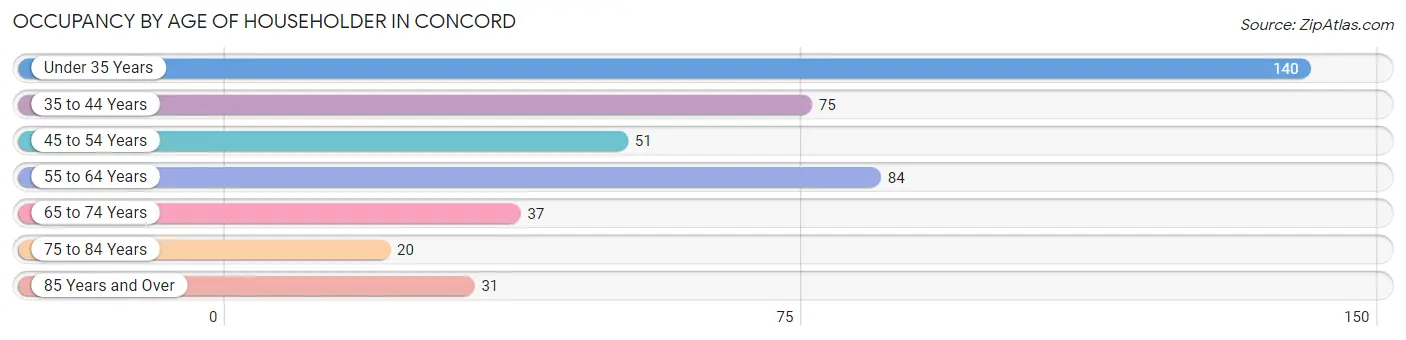
| Age Bracket | # Households | % Households |
| Under 35 Years | 140 | 32.0% |
| 35 to 44 Years | 75 | 17.1% |
| 45 to 54 Years | 51 | 11.6% |
| 55 to 64 Years | 84 | 19.2% |
| 65 to 74 Years | 37 | 8.5% |
| 75 to 84 Years | 20 | 4.6% |
| 85 Years and Over | 31 | 7.1% |
| Total | 438 | 100.0% |
Housing Finances in Concord
Median Income by Occupancy in Concord
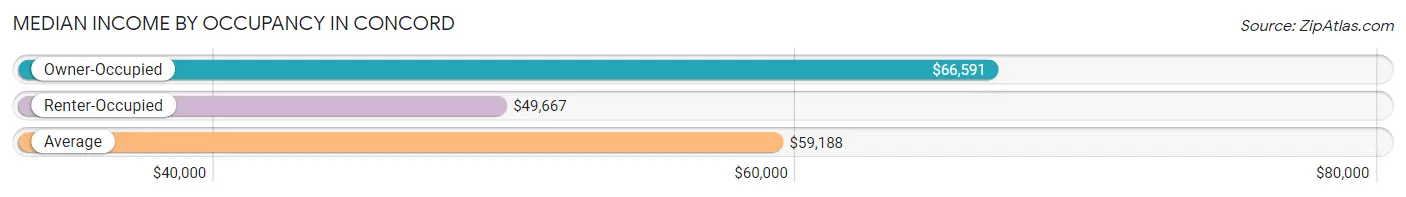
| Occupancy Type | # Households | Median Income |
| Owner-Occupied | 324 (74.0%) | $66,591 |
| Renter-Occupied | 114 (26.0%) | $49,667 |
| Average | 438 (100.0%) | $59,188 |
Occupancy by Householder Income Bracket in Concord
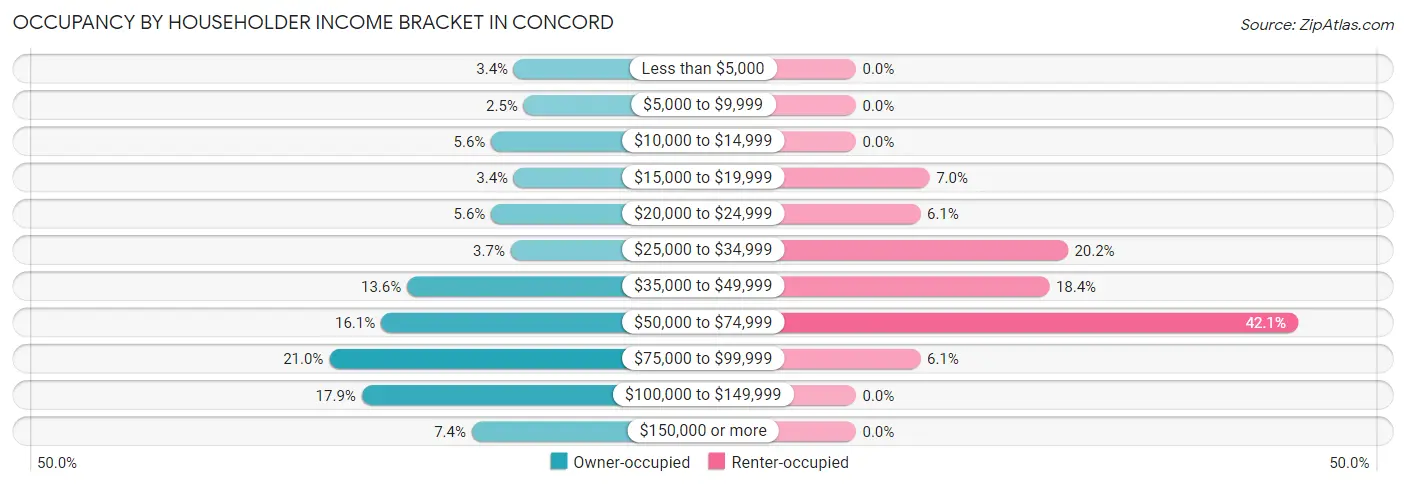
| Income Bracket | Owner-occupied | Renter-occupied |
| Less than $5,000 | 11 (3.4%) | 0 (0.0%) |
| $5,000 to $9,999 | 8 (2.5%) | 0 (0.0%) |
| $10,000 to $14,999 | 18 (5.6%) | 0 (0.0%) |
| $15,000 to $19,999 | 11 (3.4%) | 8 (7.0%) |
| $20,000 to $24,999 | 18 (5.6%) | 7 (6.1%) |
| $25,000 to $34,999 | 12 (3.7%) | 23 (20.2%) |
| $35,000 to $49,999 | 44 (13.6%) | 21 (18.4%) |
| $50,000 to $74,999 | 52 (16.1%) | 48 (42.1%) |
| $75,000 to $99,999 | 68 (21.0%) | 7 (6.1%) |
| $100,000 to $149,999 | 58 (17.9%) | 0 (0.0%) |
| $150,000 or more | 24 (7.4%) | 0 (0.0%) |
| Total | 324 (100.0%) | 114 (100.0%) |
Monthly Housing Cost Tiers in Concord
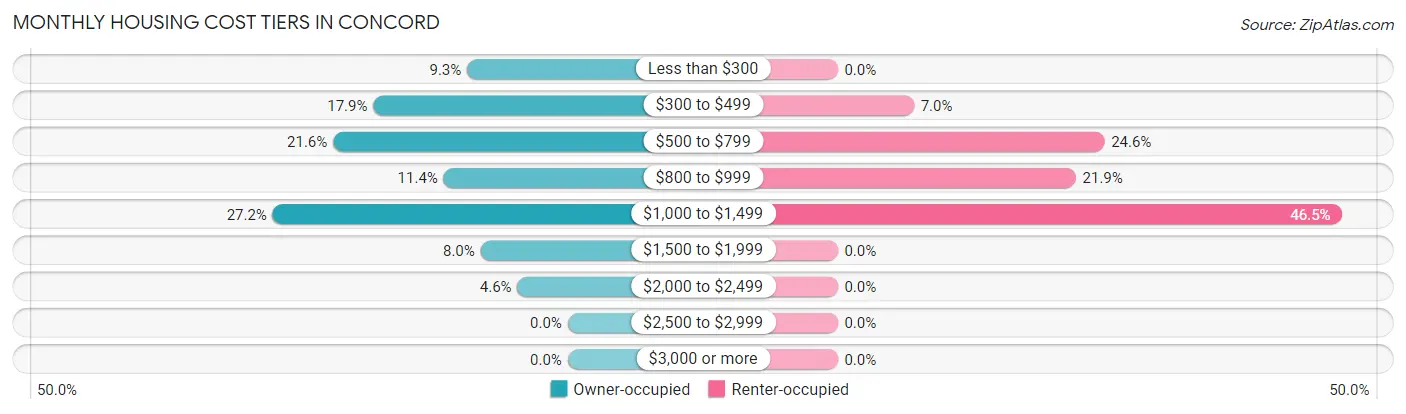
| Monthly Cost | Owner-occupied | Renter-occupied |
| Less than $300 | 30 (9.3%) | 0 (0.0%) |
| $300 to $499 | 58 (17.9%) | 8 (7.0%) |
| $500 to $799 | 70 (21.6%) | 28 (24.6%) |
| $800 to $999 | 37 (11.4%) | 25 (21.9%) |
| $1,000 to $1,499 | 88 (27.2%) | 53 (46.5%) |
| $1,500 to $1,999 | 26 (8.0%) | 0 (0.0%) |
| $2,000 to $2,499 | 15 (4.6%) | 0 (0.0%) |
| $2,500 to $2,999 | 0 (0.0%) | 0 (0.0%) |
| $3,000 or more | 0 (0.0%) | 0 (0.0%) |
| Total | 324 (100.0%) | 114 (100.0%) |
Physical Housing Characteristics in Concord
Housing Structures in Concord
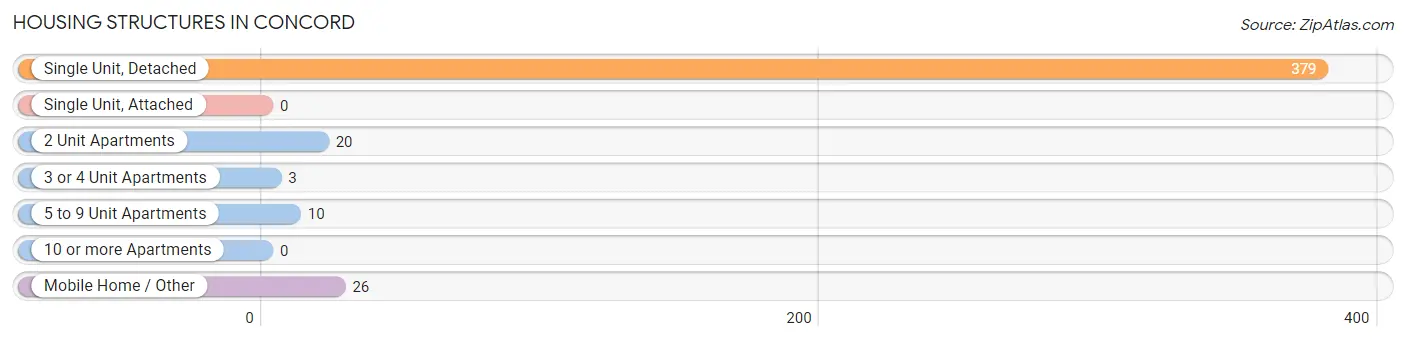
| Structure Type | # Housing Units | % Housing Units |
| Single Unit, Detached | 379 | 86.5% |
| Single Unit, Attached | 0 | 0.0% |
| 2 Unit Apartments | 20 | 4.6% |
| 3 or 4 Unit Apartments | 3 | 0.7% |
| 5 to 9 Unit Apartments | 10 | 2.3% |
| 10 or more Apartments | 0 | 0.0% |
| Mobile Home / Other | 26 | 5.9% |
| Total | 438 | 100.0% |
Housing Structures by Occupancy in Concord
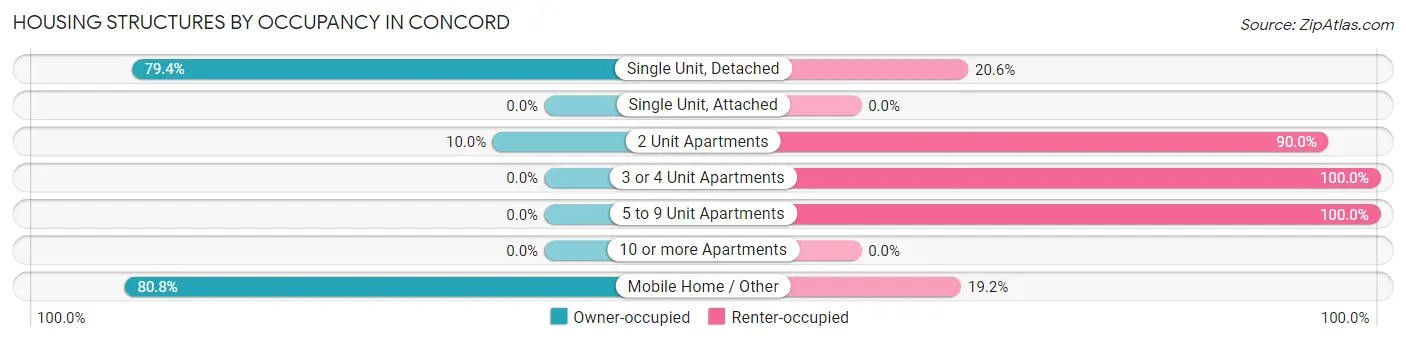
| Structure Type | Owner-occupied | Renter-occupied |
| Single Unit, Detached | 301 (79.4%) | 78 (20.6%) |
| Single Unit, Attached | 0 (0.0%) | 0 (0.0%) |
| 2 Unit Apartments | 2 (10.0%) | 18 (90.0%) |
| 3 or 4 Unit Apartments | 0 (0.0%) | 3 (100.0%) |
| 5 to 9 Unit Apartments | 0 (0.0%) | 10 (100.0%) |
| 10 or more Apartments | 0 (0.0%) | 0 (0.0%) |
| Mobile Home / Other | 21 (80.8%) | 5 (19.2%) |
| Total | 324 (74.0%) | 114 (26.0%) |
Housing Structures by Number of Rooms in Concord
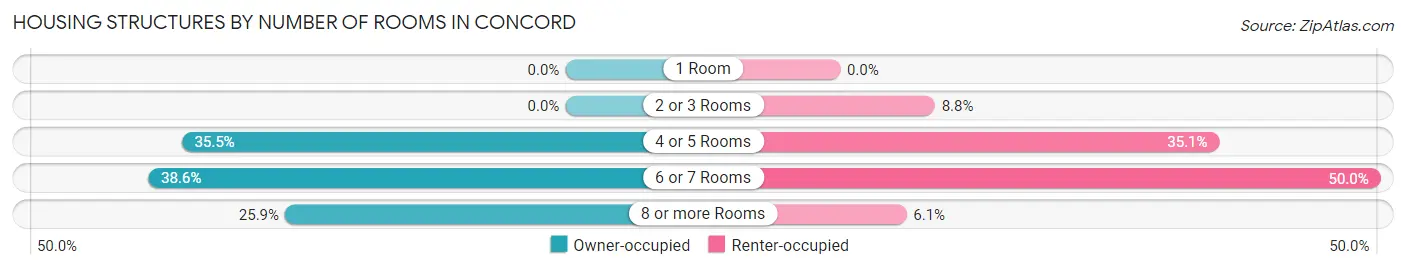
| Number of Rooms | Owner-occupied | Renter-occupied |
| 1 Room | 0 (0.0%) | 0 (0.0%) |
| 2 or 3 Rooms | 0 (0.0%) | 10 (8.8%) |
| 4 or 5 Rooms | 115 (35.5%) | 40 (35.1%) |
| 6 or 7 Rooms | 125 (38.6%) | 57 (50.0%) |
| 8 or more Rooms | 84 (25.9%) | 7 (6.1%) |
| Total | 324 (100.0%) | 114 (100.0%) |
Housing Structure by Heating Type in Concord
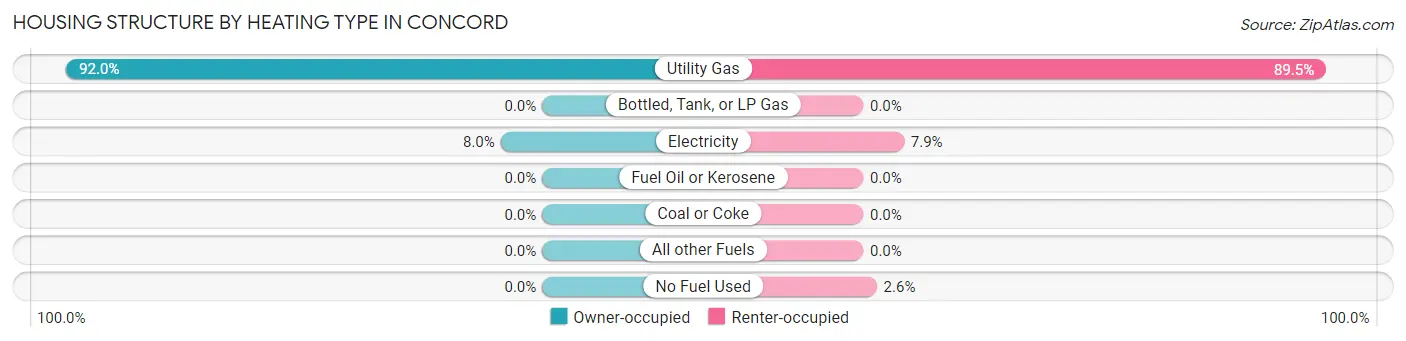
| Heating Type | Owner-occupied | Renter-occupied |
| Utility Gas | 298 (92.0%) | 102 (89.5%) |
| Bottled, Tank, or LP Gas | 0 (0.0%) | 0 (0.0%) |
| Electricity | 26 (8.0%) | 9 (7.9%) |
| Fuel Oil or Kerosene | 0 (0.0%) | 0 (0.0%) |
| Coal or Coke | 0 (0.0%) | 0 (0.0%) |
| All other Fuels | 0 (0.0%) | 0 (0.0%) |
| No Fuel Used | 0 (0.0%) | 3 (2.6%) |
| Total | 324 (100.0%) | 114 (100.0%) |
Household Vehicle Usage in Concord
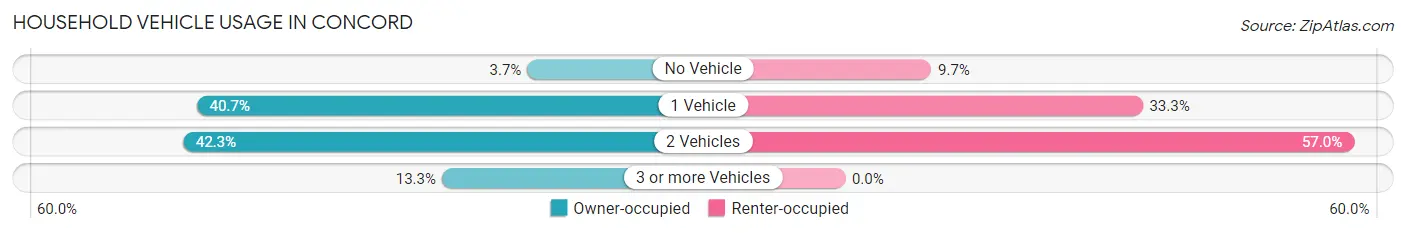
| Vehicles per Household | Owner-occupied | Renter-occupied |
| No Vehicle | 12 (3.7%) | 11 (9.7%) |
| 1 Vehicle | 132 (40.7%) | 38 (33.3%) |
| 2 Vehicles | 137 (42.3%) | 65 (57.0%) |
| 3 or more Vehicles | 43 (13.3%) | 0 (0.0%) |
| Total | 324 (100.0%) | 114 (100.0%) |
Real Estate & Mortgages in Concord
Real Estate and Mortgage Overview in Concord
| Characteristic | Without Mortgage | With Mortgage |
| Housing Units | 146 | 178 |
| Median Property Value | $107,800 | $149,300 |
| Median Household Income | $37,188 | $17 |
| Monthly Housing Costs | $453 | $0 |
| Real Estate Taxes | $1,679 | $3 |
Property Value by Mortgage Status in Concord
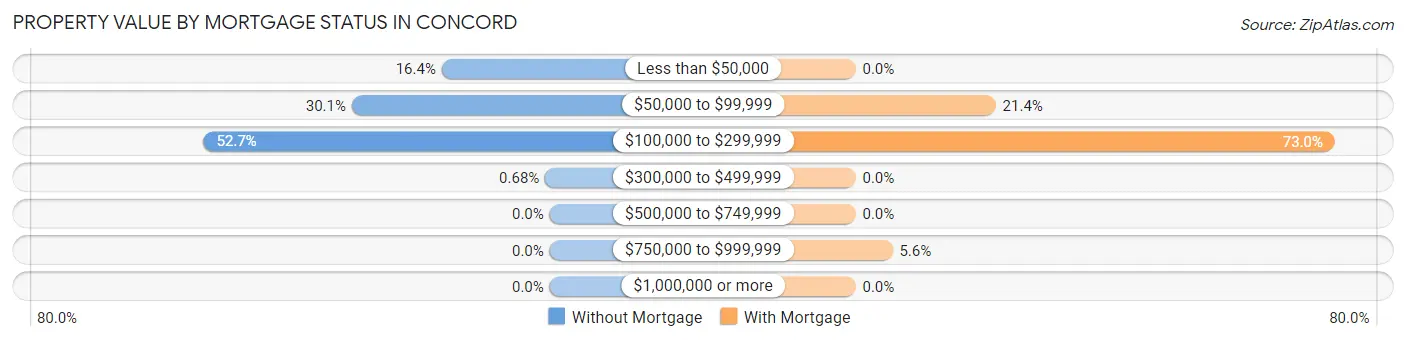
| Property Value | Without Mortgage | With Mortgage |
| Less than $50,000 | 24 (16.4%) | 0 (0.0%) |
| $50,000 to $99,999 | 44 (30.1%) | 38 (21.3%) |
| $100,000 to $299,999 | 77 (52.7%) | 130 (73.0%) |
| $300,000 to $499,999 | 1 (0.7%) | 0 (0.0%) |
| $500,000 to $749,999 | 0 (0.0%) | 0 (0.0%) |
| $750,000 to $999,999 | 0 (0.0%) | 10 (5.6%) |
| $1,000,000 or more | 0 (0.0%) | 0 (0.0%) |
| Total | 146 (100.0%) | 178 (100.0%) |
Household Income by Mortgage Status in Concord
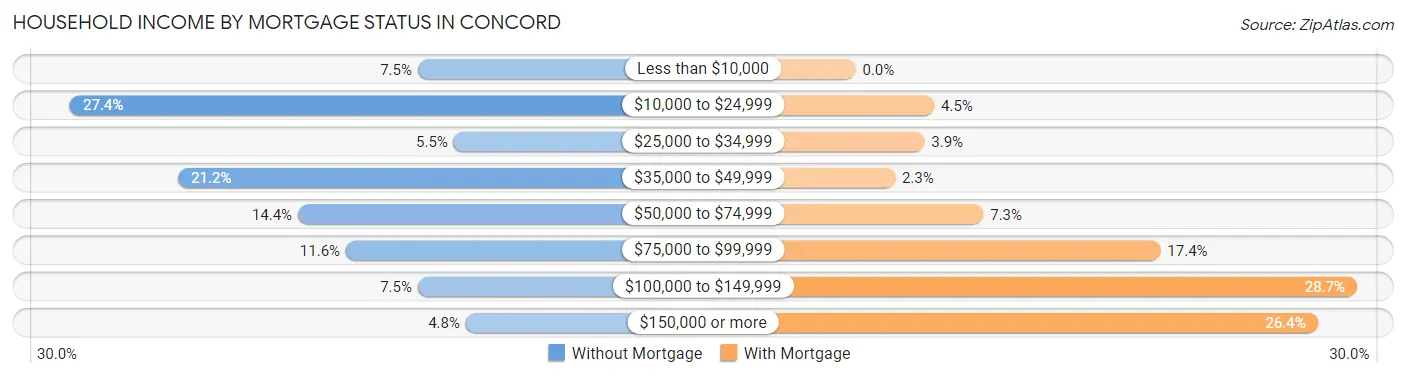
| Household Income | Without Mortgage | With Mortgage |
| Less than $10,000 | 11 (7.5%) | 0 (0.0%) |
| $10,000 to $24,999 | 40 (27.4%) | 8 (4.5%) |
| $25,000 to $34,999 | 8 (5.5%) | 7 (3.9%) |
| $35,000 to $49,999 | 31 (21.2%) | 4 (2.2%) |
| $50,000 to $74,999 | 21 (14.4%) | 13 (7.3%) |
| $75,000 to $99,999 | 17 (11.6%) | 31 (17.4%) |
| $100,000 to $149,999 | 11 (7.5%) | 51 (28.6%) |
| $150,000 or more | 7 (4.8%) | 47 (26.4%) |
| Total | 146 (100.0%) | 178 (100.0%) |
Property Value to Household Income Ratio in Concord
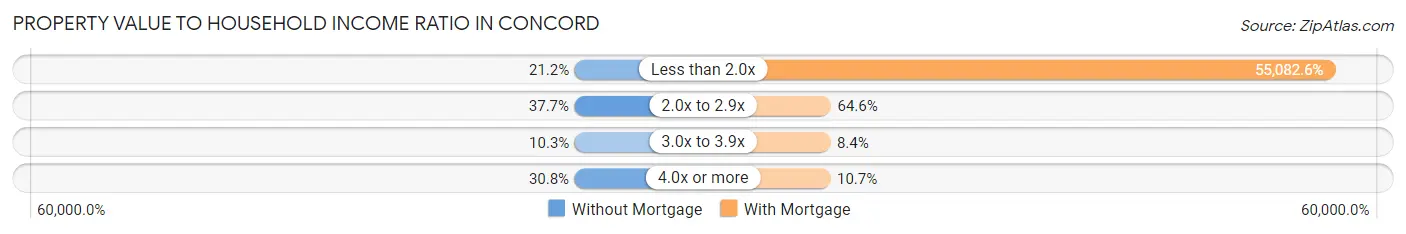
| Value-to-Income Ratio | Without Mortgage | With Mortgage |
| Less than 2.0x | 31 (21.2%) | 98,047 (55,082.6%) |
| 2.0x to 2.9x | 55 (37.7%) | 115 (64.6%) |
| 3.0x to 3.9x | 15 (10.3%) | 15 (8.4%) |
| 4.0x or more | 45 (30.8%) | 19 (10.7%) |
| Total | 146 (100.0%) | 178 (100.0%) |
Real Estate Taxes by Mortgage Status in Concord
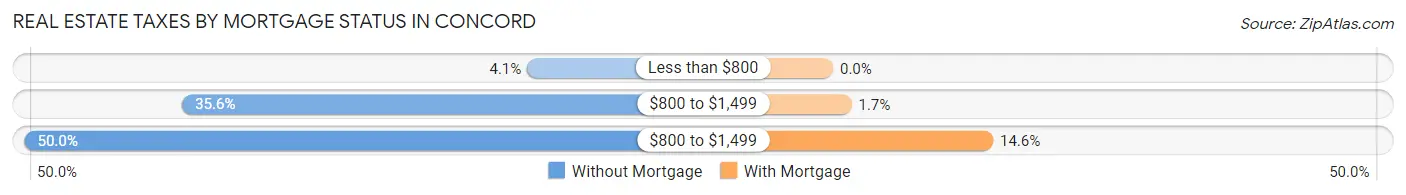
| Property Taxes | Without Mortgage | With Mortgage |
| Less than $800 | 6 (4.1%) | 0 (0.0%) |
| $800 to $1,499 | 52 (35.6%) | 3 (1.7%) |
| $800 to $1,499 | 73 (50.0%) | 26 (14.6%) |
| Total | 146 (100.0%) | 178 (100.0%) |
Health & Disability in Concord
Health Insurance Coverage by Age in Concord
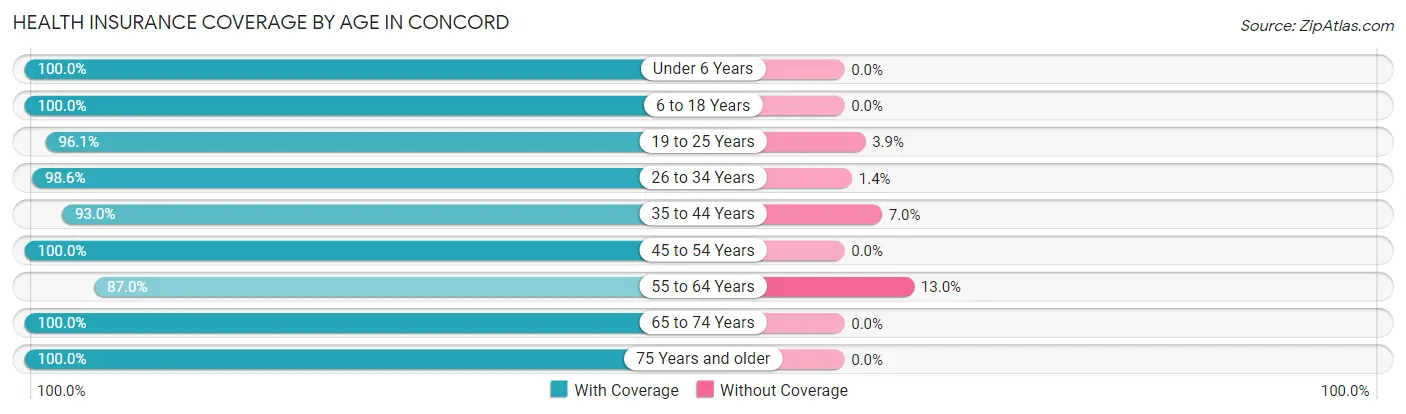
| Age Bracket | With Coverage | Without Coverage |
| Under 6 Years | 123 (100.0%) | 0 (0.0%) |
| 6 to 18 Years | 274 (100.0%) | 0 (0.0%) |
| 19 to 25 Years | 74 (96.1%) | 3 (3.9%) |
| 26 to 34 Years | 210 (98.6%) | 3 (1.4%) |
| 35 to 44 Years | 133 (93.0%) | 10 (7.0%) |
| 45 to 54 Years | 83 (100.0%) | 0 (0.0%) |
| 55 to 64 Years | 114 (87.0%) | 17 (13.0%) |
| 65 to 74 Years | 72 (100.0%) | 0 (0.0%) |
| 75 Years and older | 59 (100.0%) | 0 (0.0%) |
| Total | 1,142 (97.2%) | 33 (2.8%) |
Health Insurance Coverage by Citizenship Status in Concord
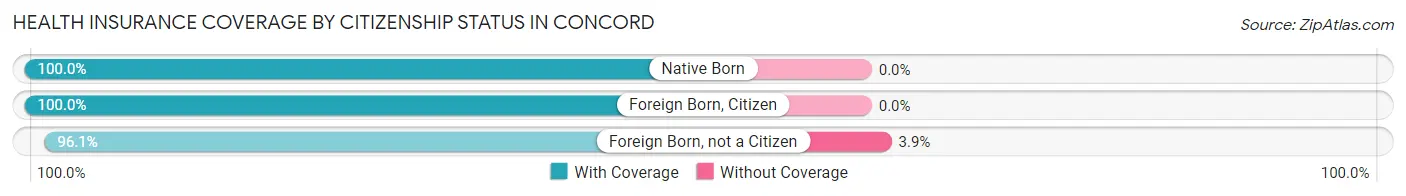
| Citizenship Status | With Coverage | Without Coverage |
| Native Born | 123 (100.0%) | 0 (0.0%) |
| Foreign Born, Citizen | 274 (100.0%) | 0 (0.0%) |
| Foreign Born, not a Citizen | 74 (96.1%) | 3 (3.9%) |
Health Insurance Coverage by Household Income in Concord
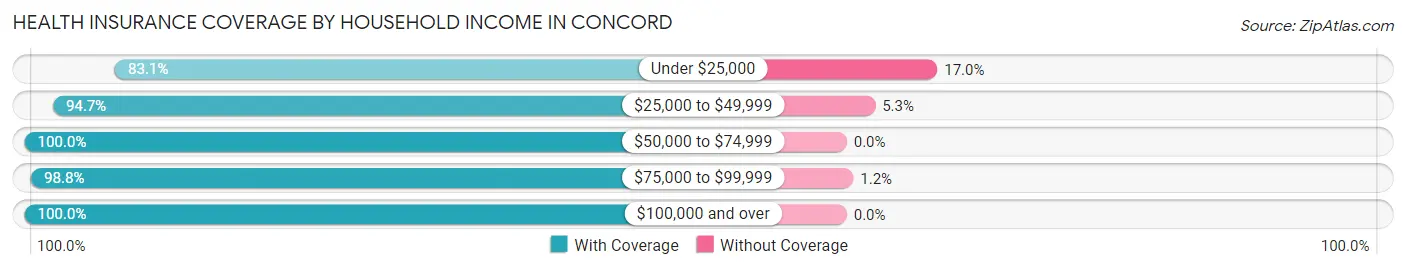
| Household Income | With Coverage | Without Coverage |
| Under $25,000 | 98 (83.1%) | 20 (17.0%) |
| $25,000 to $49,999 | 178 (94.7%) | 10 (5.3%) |
| $50,000 to $74,999 | 312 (100.0%) | 0 (0.0%) |
| $75,000 to $99,999 | 241 (98.8%) | 3 (1.2%) |
| $100,000 and over | 313 (100.0%) | 0 (0.0%) |
Public vs Private Health Insurance Coverage by Age in Concord
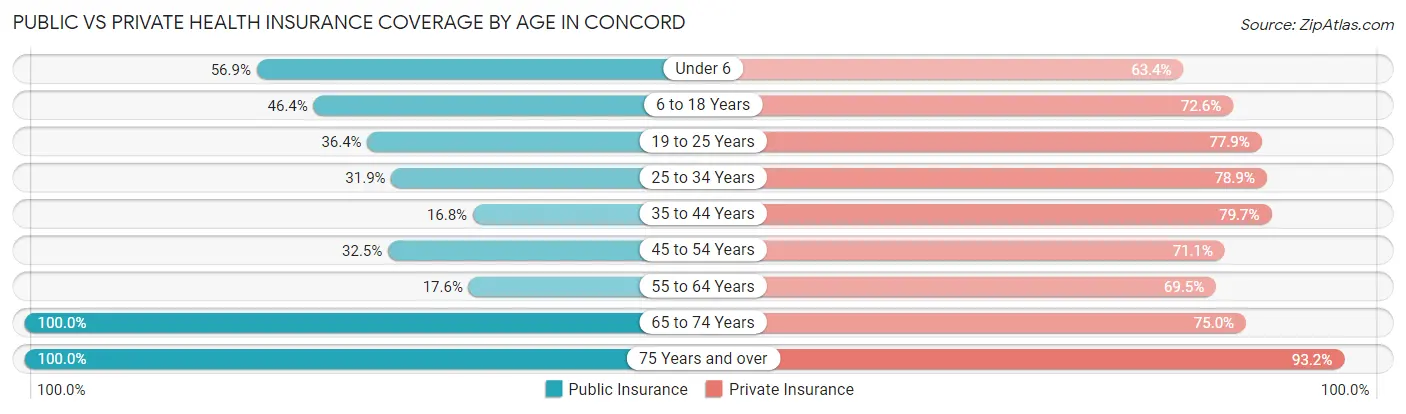
| Age Bracket | Public Insurance | Private Insurance |
| Under 6 | 70 (56.9%) | 78 (63.4%) |
| 6 to 18 Years | 127 (46.4%) | 199 (72.6%) |
| 19 to 25 Years | 28 (36.4%) | 60 (77.9%) |
| 25 to 34 Years | 68 (31.9%) | 168 (78.9%) |
| 35 to 44 Years | 24 (16.8%) | 114 (79.7%) |
| 45 to 54 Years | 27 (32.5%) | 59 (71.1%) |
| 55 to 64 Years | 23 (17.6%) | 91 (69.5%) |
| 65 to 74 Years | 72 (100.0%) | 54 (75.0%) |
| 75 Years and over | 59 (100.0%) | 55 (93.2%) |
| Total | 498 (42.4%) | 878 (74.7%) |
Disability Status by Sex by Age in Concord
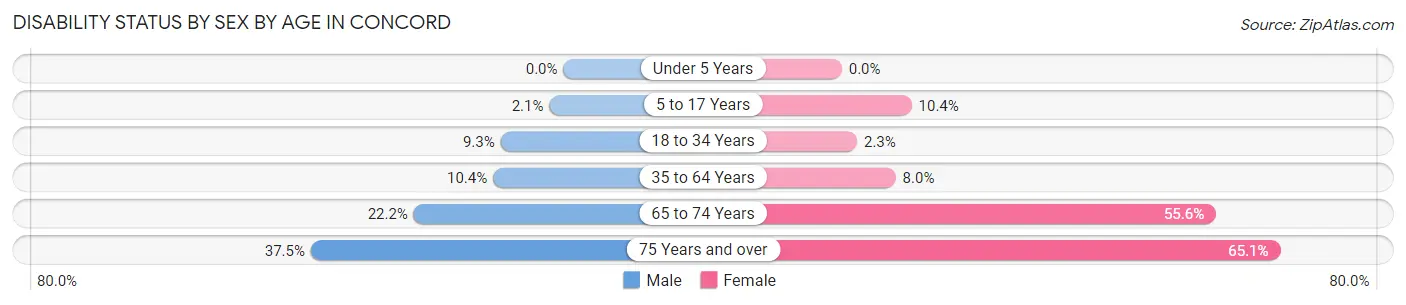
| Age Bracket | Male | Female |
| Under 5 Years | 0 (0.0%) | 0 (0.0%) |
| 5 to 17 Years | 3 (2.1%) | 14 (10.4%) |
| 18 to 34 Years | 15 (9.3%) | 3 (2.3%) |
| 35 to 64 Years | 19 (10.4%) | 14 (8.0%) |
| 65 to 74 Years | 10 (22.2%) | 15 (55.6%) |
| 75 Years and over | 6 (37.5%) | 28 (65.1%) |
Disability Class by Sex by Age in Concord
Disability Class: Hearing Difficulty
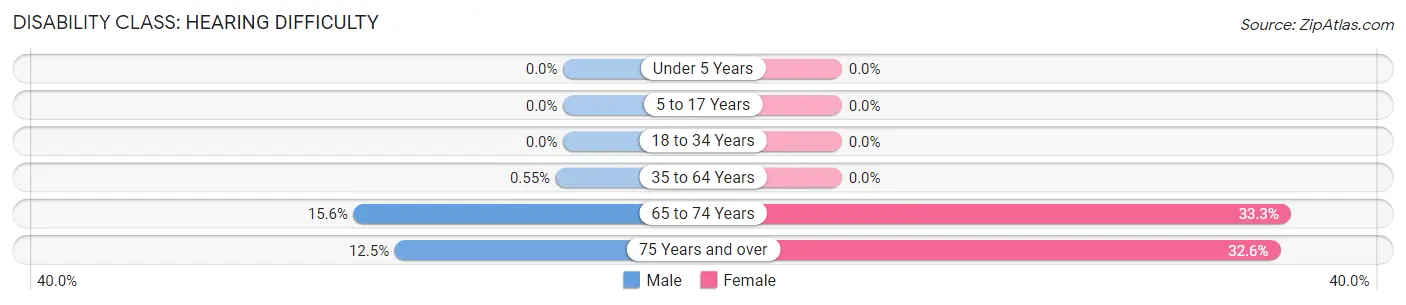
| Age Bracket | Male | Female |
| Under 5 Years | 0 (0.0%) | 0 (0.0%) |
| 5 to 17 Years | 0 (0.0%) | 0 (0.0%) |
| 18 to 34 Years | 0 (0.0%) | 0 (0.0%) |
| 35 to 64 Years | 1 (0.5%) | 0 (0.0%) |
| 65 to 74 Years | 7 (15.6%) | 9 (33.3%) |
| 75 Years and over | 2 (12.5%) | 14 (32.6%) |
Disability Class: Vision Difficulty
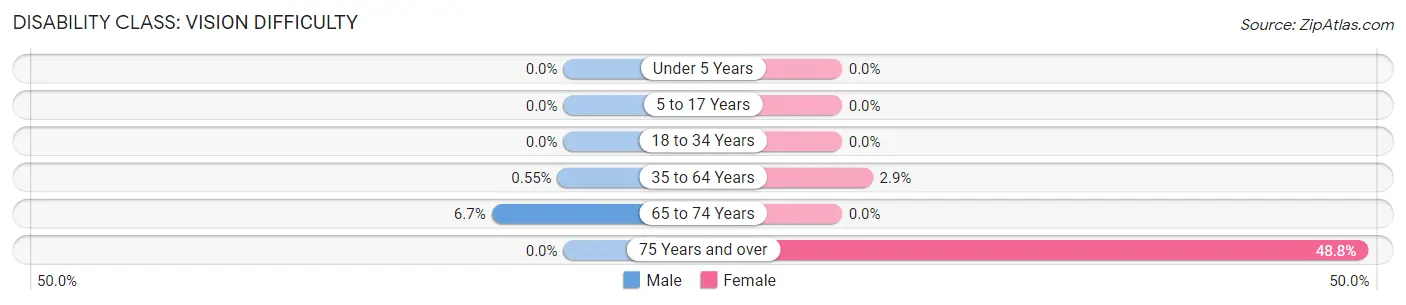
| Age Bracket | Male | Female |
| Under 5 Years | 0 (0.0%) | 0 (0.0%) |
| 5 to 17 Years | 0 (0.0%) | 0 (0.0%) |
| 18 to 34 Years | 0 (0.0%) | 0 (0.0%) |
| 35 to 64 Years | 1 (0.5%) | 5 (2.9%) |
| 65 to 74 Years | 3 (6.7%) | 0 (0.0%) |
| 75 Years and over | 0 (0.0%) | 21 (48.8%) |
Disability Class: Cognitive Difficulty
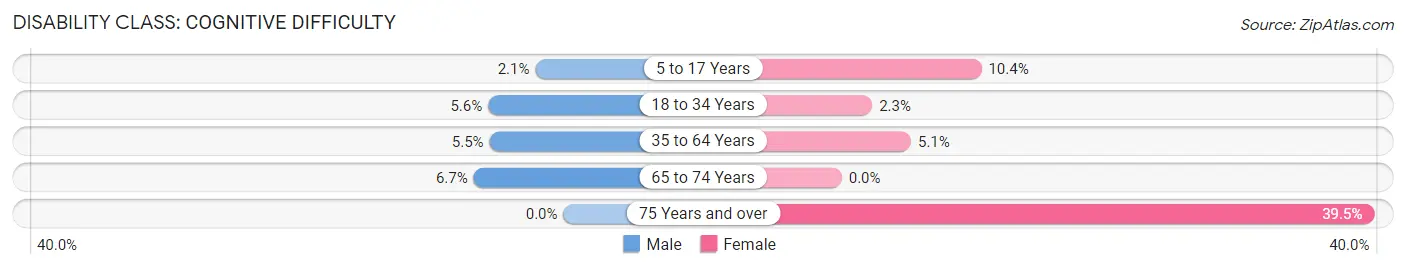
| Age Bracket | Male | Female |
| 5 to 17 Years | 3 (2.1%) | 14 (10.4%) |
| 18 to 34 Years | 9 (5.6%) | 3 (2.3%) |
| 35 to 64 Years | 10 (5.5%) | 9 (5.1%) |
| 65 to 74 Years | 3 (6.7%) | 0 (0.0%) |
| 75 Years and over | 0 (0.0%) | 17 (39.5%) |
Disability Class: Ambulatory Difficulty
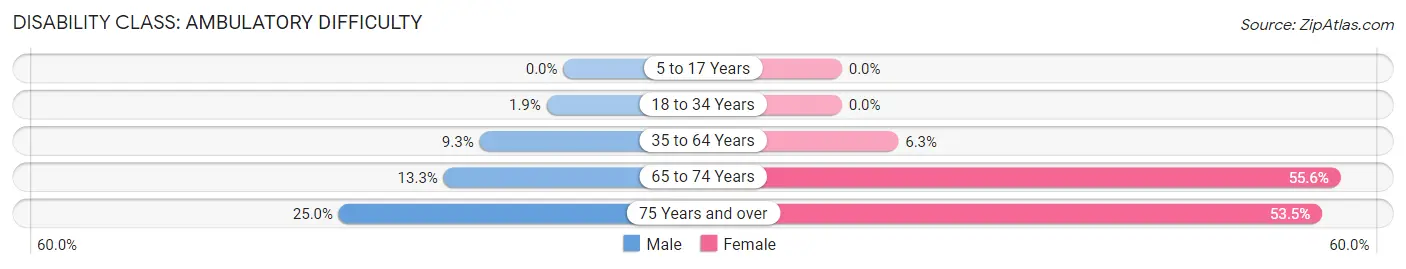
| Age Bracket | Male | Female |
| 5 to 17 Years | 0 (0.0%) | 0 (0.0%) |
| 18 to 34 Years | 3 (1.9%) | 0 (0.0%) |
| 35 to 64 Years | 17 (9.3%) | 11 (6.3%) |
| 65 to 74 Years | 6 (13.3%) | 15 (55.6%) |
| 75 Years and over | 4 (25.0%) | 23 (53.5%) |
Disability Class: Self-Care Difficulty
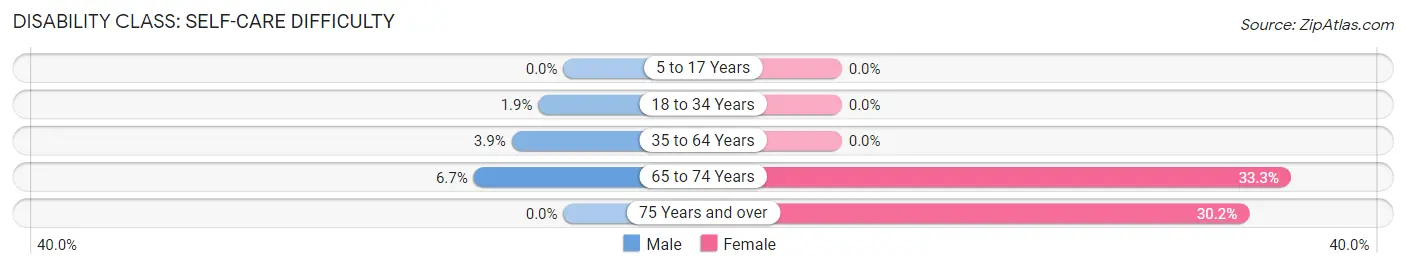
| Age Bracket | Male | Female |
| 5 to 17 Years | 0 (0.0%) | 0 (0.0%) |
| 18 to 34 Years | 3 (1.9%) | 0 (0.0%) |
| 35 to 64 Years | 7 (3.8%) | 0 (0.0%) |
| 65 to 74 Years | 3 (6.7%) | 9 (33.3%) |
| 75 Years and over | 0 (0.0%) | 13 (30.2%) |
Technology Access in Concord
Computing Device Access in Concord
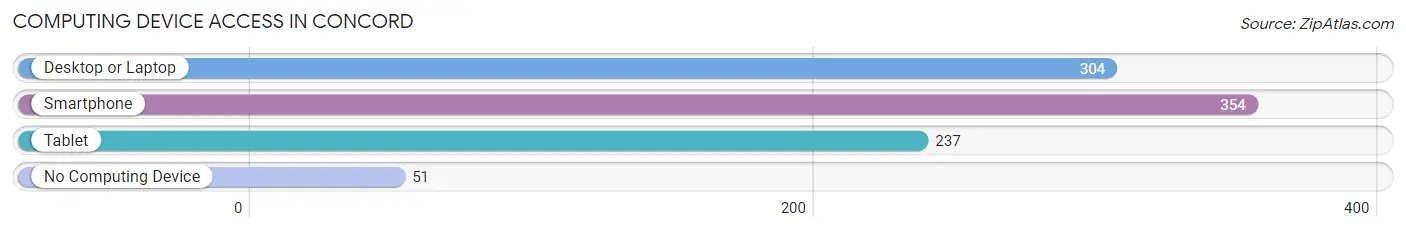
| Device Type | # Households | % Households |
| Desktop or Laptop | 304 | 69.4% |
| Smartphone | 354 | 80.8% |
| Tablet | 237 | 54.1% |
| No Computing Device | 51 | 11.6% |
| Total | 438 | 100.0% |
Internet Access in Concord
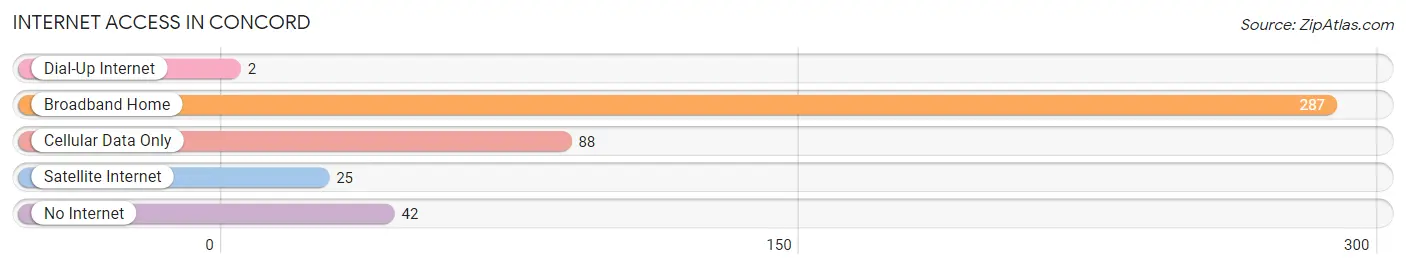
| Internet Type | # Households | % Households |
| Dial-Up Internet | 2 | 0.5% |
| Broadband Home | 287 | 65.5% |
| Cellular Data Only | 88 | 20.1% |
| Satellite Internet | 25 | 5.7% |
| No Internet | 42 | 9.6% |
| Total | 438 | 100.0% |
Concord Summary
Concord, Michigan is a small village located in Jackson County, Michigan. It is situated on the banks of the Grand River, approximately 10 miles east of Jackson. The village has a population of approximately 1,000 people and covers an area of 0.7 square miles.
History
The area that is now Concord was first settled in 1832 by a group of settlers from New York. The village was originally known as “Concordville” and was named after the town of Concord, New York. The village was officially incorporated in 1837 and the first post office was established in 1838.
In the late 19th century, Concord was a thriving agricultural community. The village was home to several mills, including a grist mill, a saw mill, and a woolen mill. The village also had a blacksmith shop, a general store, and a hotel.
In the early 20th century, Concord began to experience a decline in population as many of its residents moved away to larger cities. The village was also affected by the Great Depression and World War II. However, the village was able to survive and by the 1950s, the population had stabilized.
Geography
Concord is located in Jackson County, Michigan. It is situated on the banks of the Grand River, approximately 10 miles east of Jackson. The village has a total area of 0.7 square miles, all of which is land. The terrain is mostly flat with some rolling hills.
The climate in Concord is classified as humid continental, with warm summers and cold winters. The average annual temperature is around 50°F and the average annual precipitation is around 35 inches.
Economy
The economy of Concord is largely based on agriculture. The village is home to several farms, which produce a variety of crops, including corn, soybeans, wheat, and hay. The village also has several small businesses, including a grocery store, a hardware store, and a restaurant.
Demographics
As of the 2010 census, the population of Concord was 1,000. The racial makeup of the village was 97.2% White, 0.7% African American, 0.3% Native American, 0.2% Asian, and 1.6% from other races. The median household income was $41,250 and the median family income was $50,000.
Conclusion
Concord, Michigan is a small village located in Jackson County, Michigan. It is situated on the banks of the Grand River, approximately 10 miles east of Jackson. The village has a population of approximately 1,000 people and covers an area of 0.7 square miles. The economy of Concord is largely based on agriculture and the village is home to several small businesses. The racial makeup of the village is mostly White, with a small percentage of African American, Native American, and Asian residents.
Common Questions
What is Per Capita Income in Concord?
Per Capita income in Concord is $25,731.
What is the Median Family Income in Concord?
Median Family Income in Concord is $65,511.
What is the Median Household income in Concord?
Median Household Income in Concord is $59,188.
What is Income or Wage Gap in Concord?
Income or Wage Gap in Concord is 25.7%.
Women in Concord earn 74.3 cents for every dollar earned by a man.
What is Inequality or Gini Index in Concord?
Inequality or Gini Index in Concord is 0.37.
What is the Total Population of Concord?
Total Population of Concord is 1,177.
What is the Total Male Population of Concord?
Total Male Population of Concord is 603.
What is the Total Female Population of Concord?
Total Female Population of Concord is 574.
What is the Ratio of Males per 100 Females in Concord?
There are 105.05 Males per 100 Females in Concord.
What is the Ratio of Females per 100 Males in Concord?
There are 95.19 Females per 100 Males in Concord.
What is the Median Population Age in Concord?
Median Population Age in Concord is 31.5 Years.
What is the Average Family Size in Concord
Average Family Size in Concord is 3.3 People.
What is the Average Household Size in Concord
Average Household Size in Concord is 2.7 People.
How Large is the Labor Force in Concord?
There are 552 People in the Labor Forcein in Concord.
What is the Percentage of People in the Labor Force in Concord?
68.5% of People are in the Labor Force in Concord.
What is the Unemployment Rate in Concord?
Unemployment Rate in Concord is 4.2%.