St Louis, MI Map & Demographics
St Louis Map
St Louis Overview
$12,451
PER CAPITA INCOME
$57,016
AVG FAMILY INCOME
$47,662
AVG HOUSEHOLD INCOME
14.5%
WAGE / INCOME GAP [ % ]
85.5¢/ $1
WAGE / INCOME GAP [ $ ]
$10,201
FAMILY INCOME DEFICIT
0.41
INEQUALITY / GINI INDEX
6,932
TOTAL POPULATION
5,212
MALE POPULATION
1,720
FEMALE POPULATION
303.02
MALES / 100 FEMALES
33.00
FEMALES / 100 MALES
38.4
MEDIAN AGE
2.9
AVG FAMILY SIZE
2.4
AVG HOUSEHOLD SIZE
1,338
LABOR FORCE [ PEOPLE ]
21.1%
PERCENT IN LABOR FORCE
6.1%
UNEMPLOYMENT RATE
Income in St Louis
Income Overview in St Louis
Per Capita Income in St Louis is $12,451, while median incomes of families and households are $57,016 and $47,662 respectively.
| Characteristic | Number | Measure |
| Per Capita Income | 6,932 | $12,451 |
| Median Family Income | 812 | $57,016 |
| Mean Family Income | 812 | $73,521 |
| Median Household Income | 1,267 | $47,662 |
| Mean Household Income | 1,267 | $59,044 |
| Income Deficit | 812 | $10,201 |
| Wage / Income Gap (%) | 6,932 | 14.48% |
| Wage / Income Gap ($) | 6,932 | 85.52¢ per $1 |
| Gini / Inequality Index | 6,932 | 0.41 |
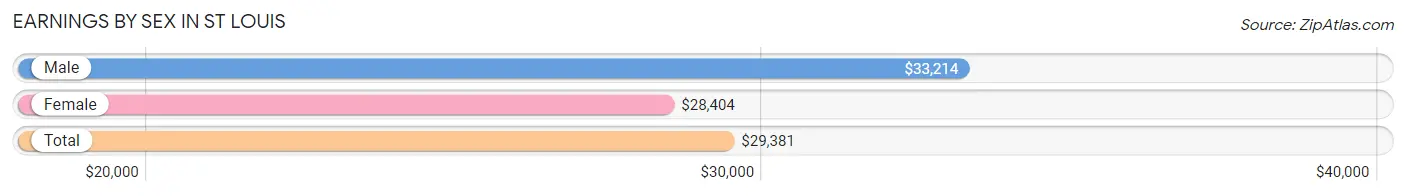
Earnings by Sex in St Louis
Average Earnings in St Louis are $29,381, $33,214 for men and $28,404 for women, a difference of 14.5%.
| Sex | Number | Average Earnings |
| Male | 926 (57.0%) | $33,214 |
| Female | 700 (43.0%) | $28,404 |
| Total | 1,626 (100.0%) | $29,381 |
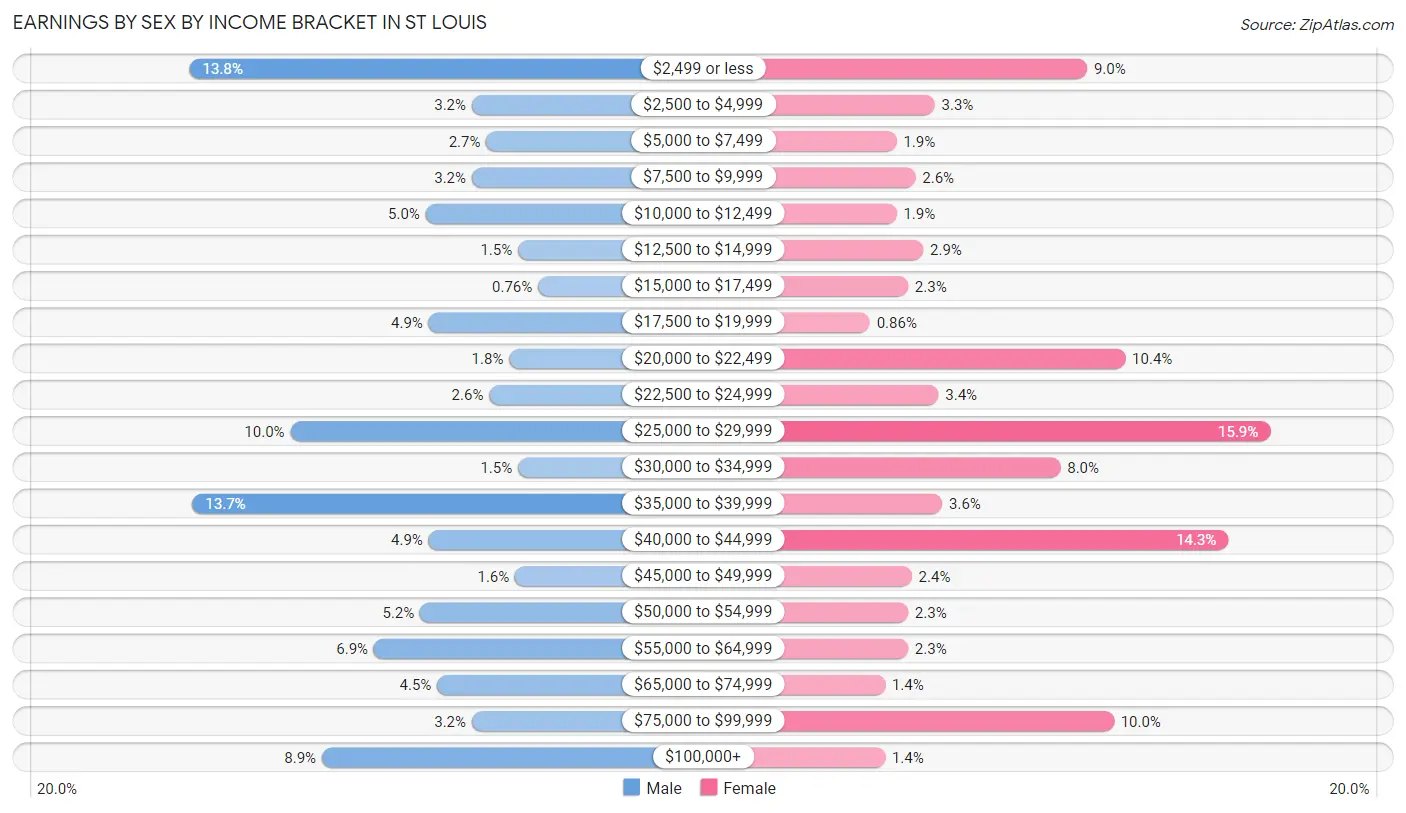
Earnings by Sex by Income Bracket in St Louis
The most common earnings brackets in St Louis are $2,499 or less for men (128 | 13.8%) and $25,000 to $29,999 for women (111 | 15.9%).
| Income | Male | Female |
| $2,499 or less | 128 (13.8%) | 63 (9.0%) |
| $2,500 to $4,999 | 30 (3.2%) | 23 (3.3%) |
| $5,000 to $7,499 | 25 (2.7%) | 13 (1.9%) |
| $7,500 to $9,999 | 30 (3.2%) | 18 (2.6%) |
| $10,000 to $12,499 | 46 (5.0%) | 13 (1.9%) |
| $12,500 to $14,999 | 14 (1.5%) | 20 (2.9%) |
| $15,000 to $17,499 | 7 (0.8%) | 16 (2.3%) |
| $17,500 to $19,999 | 45 (4.9%) | 6 (0.9%) |
| $20,000 to $22,499 | 17 (1.8%) | 73 (10.4%) |
| $22,500 to $24,999 | 24 (2.6%) | 24 (3.4%) |
| $25,000 to $29,999 | 93 (10.0%) | 111 (15.9%) |
| $30,000 to $34,999 | 14 (1.5%) | 56 (8.0%) |
| $35,000 to $39,999 | 127 (13.7%) | 25 (3.6%) |
| $40,000 to $44,999 | 45 (4.9%) | 100 (14.3%) |
| $45,000 to $49,999 | 15 (1.6%) | 17 (2.4%) |
| $50,000 to $54,999 | 48 (5.2%) | 16 (2.3%) |
| $55,000 to $64,999 | 64 (6.9%) | 16 (2.3%) |
| $65,000 to $74,999 | 42 (4.5%) | 10 (1.4%) |
| $75,000 to $99,999 | 30 (3.2%) | 70 (10.0%) |
| $100,000+ | 82 (8.9%) | 10 (1.4%) |
| Total | 926 (100.0%) | 700 (100.0%) |
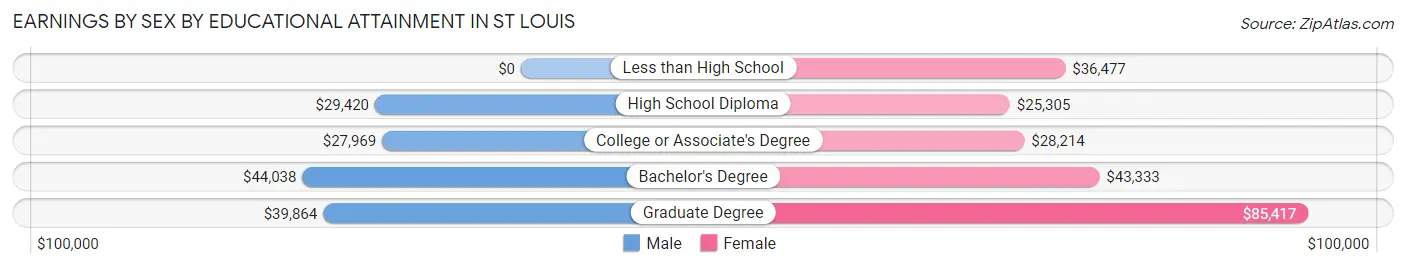
Earnings by Sex by Educational Attainment in St Louis
Average earnings in St Louis are $37,790 for men and $31,944 for women, a difference of 15.5%. Men with an educational attainment of bachelor's degree enjoy the highest average annual earnings of $44,038, while those with college or associate's degree education earn the least with $27,969. Women with an educational attainment of graduate degree earn the most with the average annual earnings of $85,417, while those with high school diploma education have the smallest earnings of $25,305.
| Educational Attainment | Male Income | Female Income |
| Less than High School | - | - |
| High School Diploma | $29,420 | $25,305 |
| College or Associate's Degree | $27,969 | $28,214 |
| Bachelor's Degree | $44,038 | $43,333 |
| Graduate Degree | $39,864 | $85,417 |
| Total | $37,790 | $31,944 |
Family Income in St Louis
Family Income Brackets in St Louis
According to the St Louis family income data, there are 171 families falling into the $35,000 to $49,999 income range, which is the most common income bracket and makes up 21.1% of all families. Conversely, the $10,000 to $14,999 income bracket is the least frequent group with only 21 families (2.6%) belonging to this category.
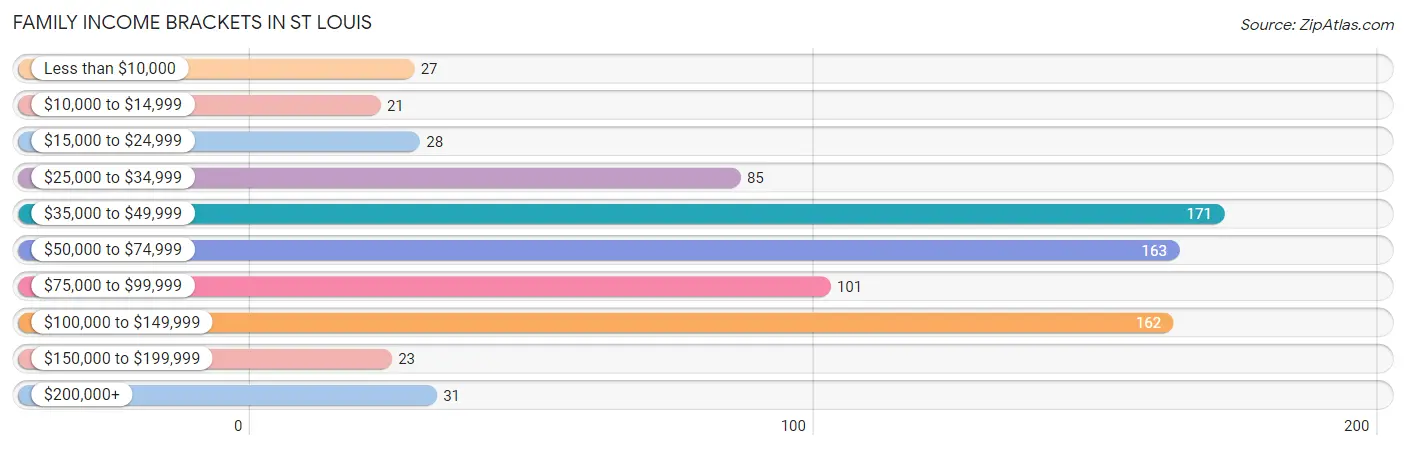
| Income Bracket | # Families | % Families |
| Less than $10,000 | 27 | 3.3% |
| $10,000 to $14,999 | 21 | 2.6% |
| $15,000 to $24,999 | 28 | 3.4% |
| $25,000 to $34,999 | 85 | 10.5% |
| $35,000 to $49,999 | 171 | 21.1% |
| $50,000 to $74,999 | 163 | 20.1% |
| $75,000 to $99,999 | 101 | 12.4% |
| $100,000 to $149,999 | 162 | 20.0% |
| $150,000 to $199,999 | 23 | 2.8% |
| $200,000+ | 31 | 3.8% |
Family Income by Famaliy Size in St Louis
5-person families (52 | 6.4%) account for the highest median family income in St Louis with $99,167 per family, while 2-person families (428 | 52.7%) have the highest median income of $28,478 per family member.
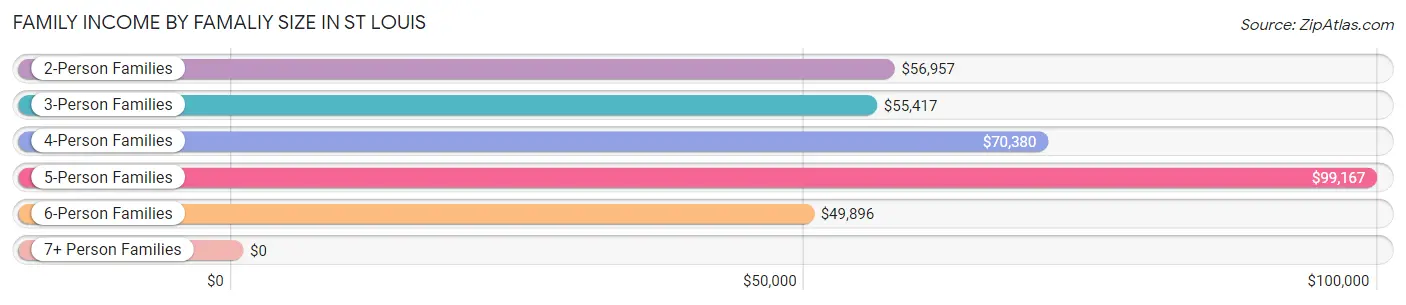
| Income Bracket | # Families | Median Income |
| 2-Person Families | 428 (52.7%) | $56,957 |
| 3-Person Families | 150 (18.5%) | $55,417 |
| 4-Person Families | 99 (12.2%) | $70,380 |
| 5-Person Families | 52 (6.4%) | $99,167 |
| 6-Person Families | 79 (9.7%) | $49,896 |
| 7+ Person Families | 4 (0.5%) | $0 |
| Total | 812 (100.0%) | $57,016 |
Family Income by Number of Earners in St Louis
The median family income in St Louis is $57,016, with families comprising 3+ earners (40) having the highest median family income of $99,022, while families with no earners (108) have the lowest median family income of $35,227, accounting for 4.9% and 13.3% of families, respectively.
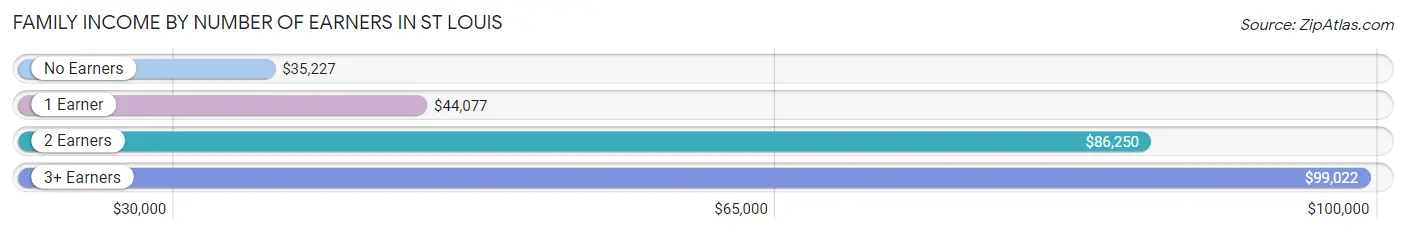
| Number of Earners | # Families | Median Income |
| No Earners | 108 (13.3%) | $35,227 |
| 1 Earner | 377 (46.4%) | $44,077 |
| 2 Earners | 287 (35.3%) | $86,250 |
| 3+ Earners | 40 (4.9%) | $99,022 |
| Total | 812 (100.0%) | $57,016 |
Household Income in St Louis
Household Income Brackets in St Louis
With 239 households falling in the category, the $35,000 to $49,999 income range is the most frequent in St Louis, accounting for 18.9% of all households. In contrast, only 23 households (1.8%) fall into the $150,000 to $199,999 income bracket, making it the least populous group.
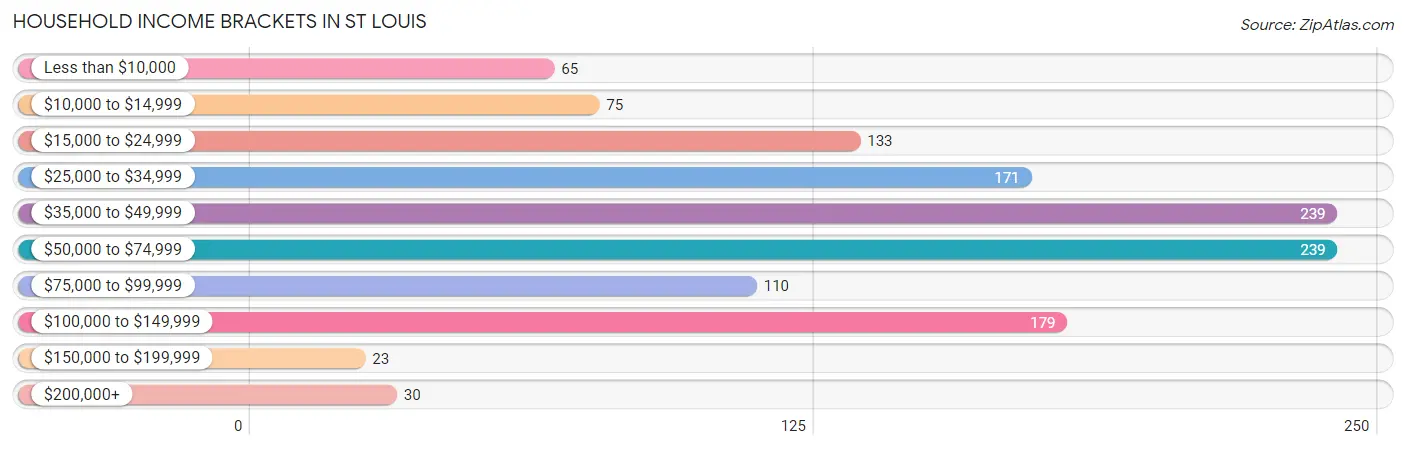
| Income Bracket | # Households | % Households |
| Less than $10,000 | 65 | 5.1% |
| $10,000 to $14,999 | 75 | 5.9% |
| $15,000 to $24,999 | 133 | 10.5% |
| $25,000 to $34,999 | 171 | 13.5% |
| $35,000 to $49,999 | 239 | 18.9% |
| $50,000 to $74,999 | 239 | 18.9% |
| $75,000 to $99,999 | 110 | 8.7% |
| $100,000 to $149,999 | 179 | 14.1% |
| $150,000 to $199,999 | 23 | 1.8% |
| $200,000+ | 30 | 2.4% |
Household Income by Householder Age in St Louis
The median household income in St Louis is $47,662, with the highest median household income of $61,667 found in the 25 to 44 years age bracket for the primary householder. A total of 380 households (30.0%) fall into this category. Meanwhile, the 65+ years age bracket for the primary householder has the lowest median household income of $30,893, with 351 households (27.7%) in this group.
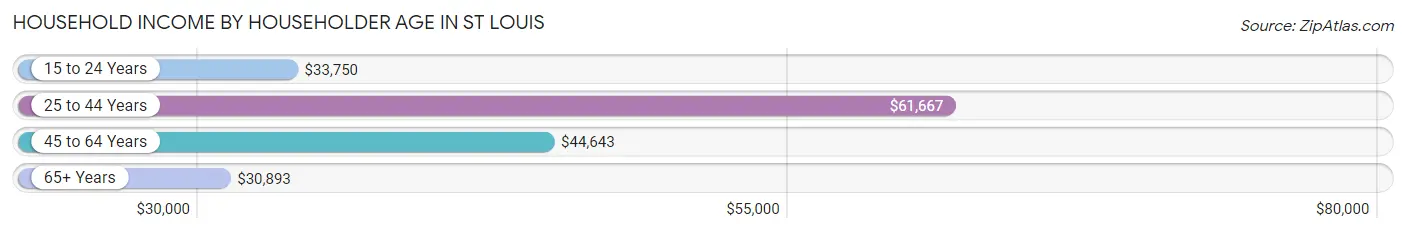
| Income Bracket | # Households | Median Income |
| 15 to 24 Years | 90 (7.1%) | $33,750 |
| 25 to 44 Years | 380 (30.0%) | $61,667 |
| 45 to 64 Years | 446 (35.2%) | $44,643 |
| 65+ Years | 351 (27.7%) | $30,893 |
| Total | 1,267 (100.0%) | $47,662 |
Poverty in St Louis
Income Below Poverty by Sex and Age in St Louis
With 10.4% poverty level for males and 16.0% for females among the residents of St Louis, 15 year old males and 6 to 11 year old females are the most vulnerable to poverty, with 23 males (52.3%) and 27 females (33.3%) in their respective age groups living below the poverty level.
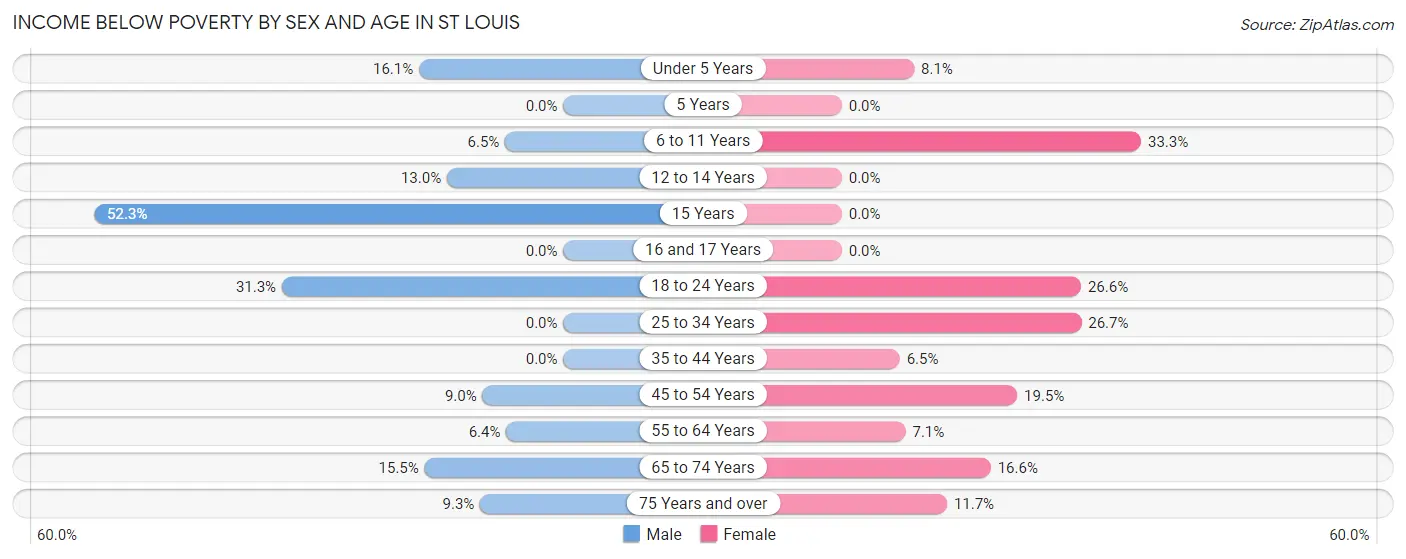
| Age Bracket | Male | Female |
| Under 5 Years | 9 (16.1%) | 12 (8.1%) |
| 5 Years | 0 (0.0%) | 0 (0.0%) |
| 6 to 11 Years | 7 (6.5%) | 27 (33.3%) |
| 12 to 14 Years | 7 (13.0%) | 0 (0.0%) |
| 15 Years | 23 (52.3%) | 0 (0.0%) |
| 16 and 17 Years | 0 (0.0%) | 0 (0.0%) |
| 18 to 24 Years | 42 (31.3%) | 57 (26.6%) |
| 25 to 34 Years | 0 (0.0%) | 64 (26.7%) |
| 35 to 44 Years | 0 (0.0%) | 16 (6.5%) |
| 45 to 54 Years | 18 (9.0%) | 25 (19.5%) |
| 55 to 64 Years | 12 (6.4%) | 11 (7.1%) |
| 65 to 74 Years | 17 (15.4%) | 37 (16.6%) |
| 75 Years and over | 5 (9.3%) | 13 (11.7%) |
| Total | 140 (10.4%) | 262 (16.0%) |
Income Above Poverty by Sex and Age in St Louis
According to the poverty statistics in St Louis, males aged 5 years and females aged 5 years are the age groups that are most secure financially, with 100.0% of males and 100.0% of females in these age groups living above the poverty line.
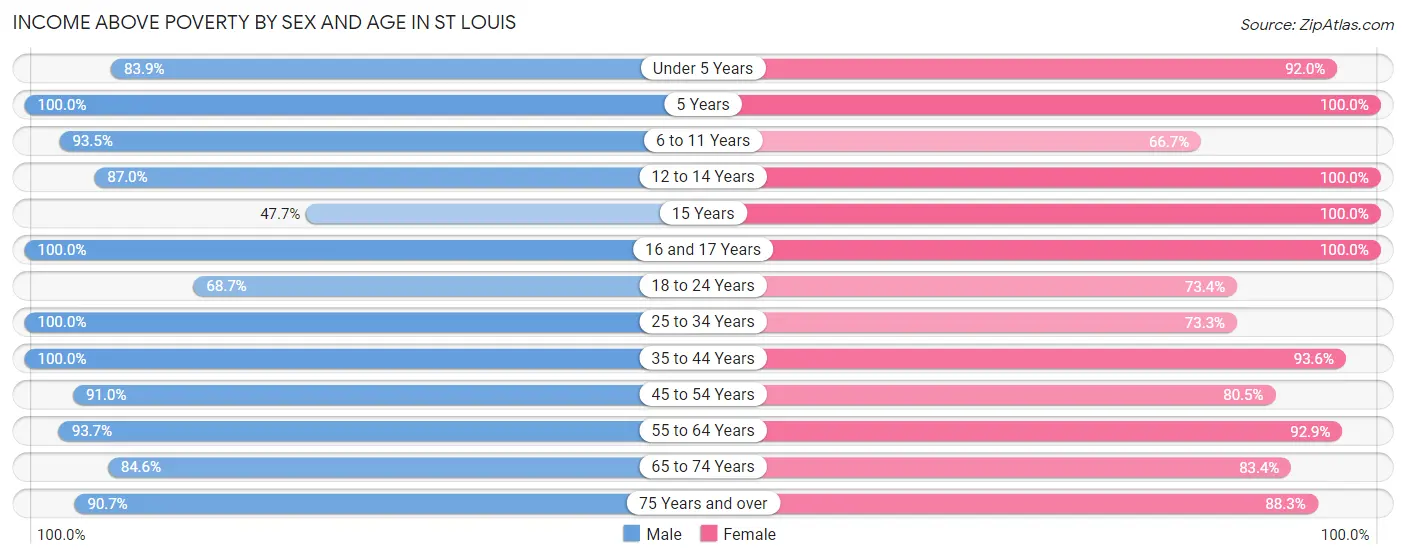
| Age Bracket | Male | Female |
| Under 5 Years | 47 (83.9%) | 137 (91.9%) |
| 5 Years | 23 (100.0%) | 12 (100.0%) |
| 6 to 11 Years | 101 (93.5%) | 54 (66.7%) |
| 12 to 14 Years | 47 (87.0%) | 33 (100.0%) |
| 15 Years | 21 (47.7%) | 10 (100.0%) |
| 16 and 17 Years | 55 (100.0%) | 35 (100.0%) |
| 18 to 24 Years | 92 (68.7%) | 157 (73.4%) |
| 25 to 34 Years | 173 (100.0%) | 176 (73.3%) |
| 35 to 44 Years | 143 (100.0%) | 232 (93.5%) |
| 45 to 54 Years | 182 (91.0%) | 103 (80.5%) |
| 55 to 64 Years | 177 (93.6%) | 144 (92.9%) |
| 65 to 74 Years | 93 (84.6%) | 186 (83.4%) |
| 75 Years and over | 49 (90.7%) | 98 (88.3%) |
| Total | 1,203 (89.6%) | 1,377 (84.0%) |
Income Below Poverty Among Married-Couple Families in St Louis
The poverty statistics for married-couple families in St Louis show that 7.6% or 43 of the total 565 families live below the poverty line. Families with 1 or 2 children have the highest poverty rate of 13.6%, comprising of 19 families. On the other hand, families with 3 or 4 children have the lowest poverty rate of 0.0%, which includes 0 families.
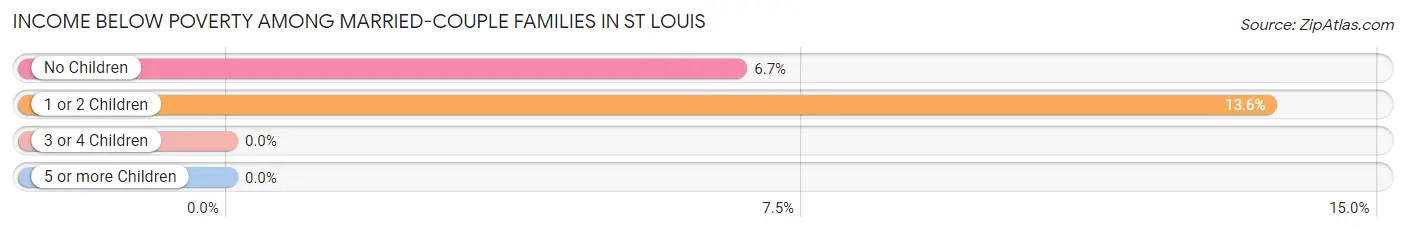
| Children | Above Poverty | Below Poverty |
| No Children | 337 (93.3%) | 24 (6.7%) |
| 1 or 2 Children | 121 (86.4%) | 19 (13.6%) |
| 3 or 4 Children | 60 (100.0%) | 0 (0.0%) |
| 5 or more Children | 4 (100.0%) | 0 (0.0%) |
| Total | 522 (92.4%) | 43 (7.6%) |
Income Below Poverty Among Single-Parent Households in St Louis
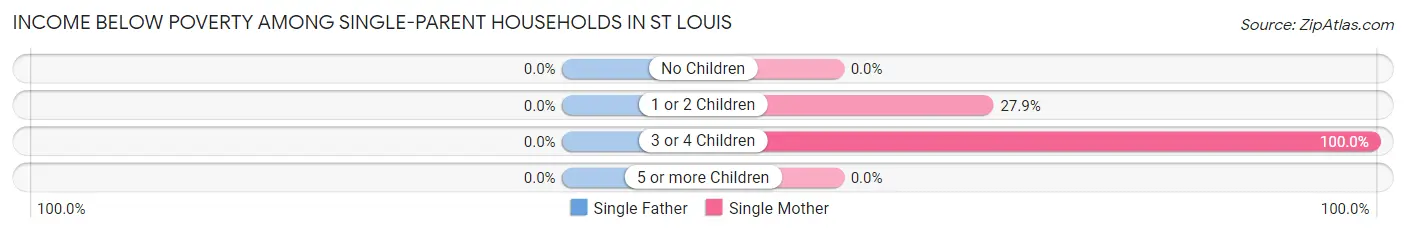
| Children | Single Father | Single Mother |
| No Children | 0 (0.0%) | 0 (0.0%) |
| 1 or 2 Children | 0 (0.0%) | 24 (27.9%) |
| 3 or 4 Children | 0 (0.0%) | 10 (100.0%) |
| 5 or more Children | 0 (0.0%) | 0 (0.0%) |
| Total | 0 (0.0%) | 34 (21.2%) |
Income Below Poverty Among Married-Couple vs Single-Parent Households in St Louis
The poverty data for St Louis shows that 43 of the married-couple family households (7.6%) and 34 of the single-parent households (13.8%) are living below the poverty level. Within the married-couple family households, those with 1 or 2 children have the highest poverty rate, with 19 households (13.6%) falling below the poverty line. Among the single-parent households, those with 3 or 4 children have the highest poverty rate, with 10 household (100.0%) living below poverty.
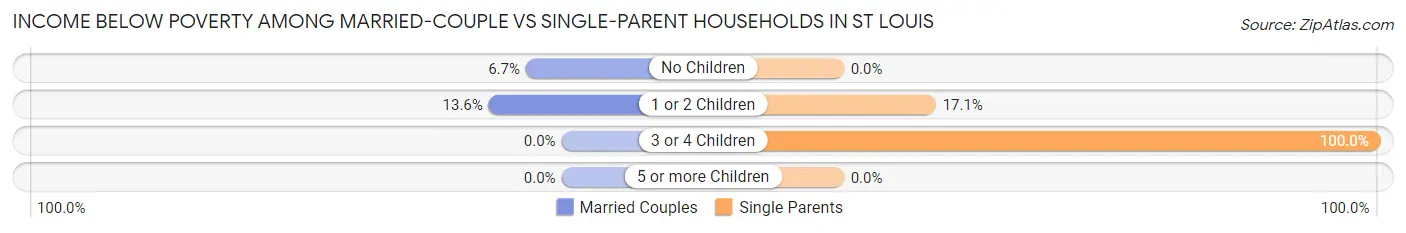
| Children | Married-Couple Families | Single-Parent Households |
| No Children | 24 (6.7%) | 0 (0.0%) |
| 1 or 2 Children | 19 (13.6%) | 24 (17.1%) |
| 3 or 4 Children | 0 (0.0%) | 10 (100.0%) |
| 5 or more Children | 0 (0.0%) | 0 (0.0%) |
| Total | 43 (7.6%) | 34 (13.8%) |
Race in St Louis
The most populous races in St Louis are White / Caucasian (4,522 | 65.2%), Black / African American (1,896 | 27.4%), and Hispanic or Latino (583 | 8.4%).
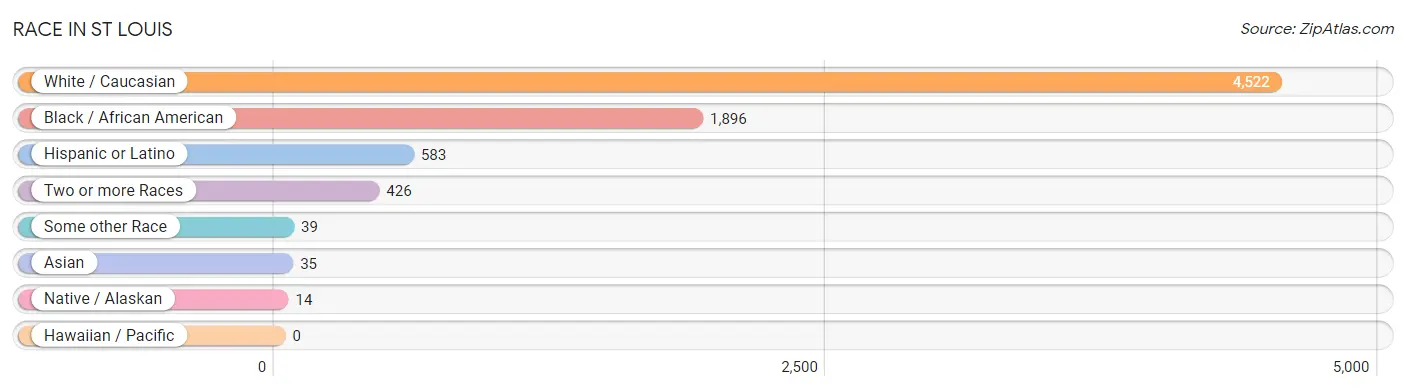
| Race | # Population | % Population |
| Asian | 35 | 0.5% |
| Black / African American | 1,896 | 27.4% |
| Hawaiian / Pacific | 0 | 0.0% |
| Hispanic or Latino | 583 | 8.4% |
| Native / Alaskan | 14 | 0.2% |
| White / Caucasian | 4,522 | 65.2% |
| Two or more Races | 426 | 6.1% |
| Some other Race | 39 | 0.6% |
| Total | 6,932 | 100.0% |
Ancestry in St Louis
The most populous ancestries reported in St Louis are German (834 | 12.0%), English (605 | 8.7%), Irish (436 | 6.3%), Mexican (413 | 6.0%), and American (373 | 5.4%), together accounting for 38.4% of all St Louis residents.
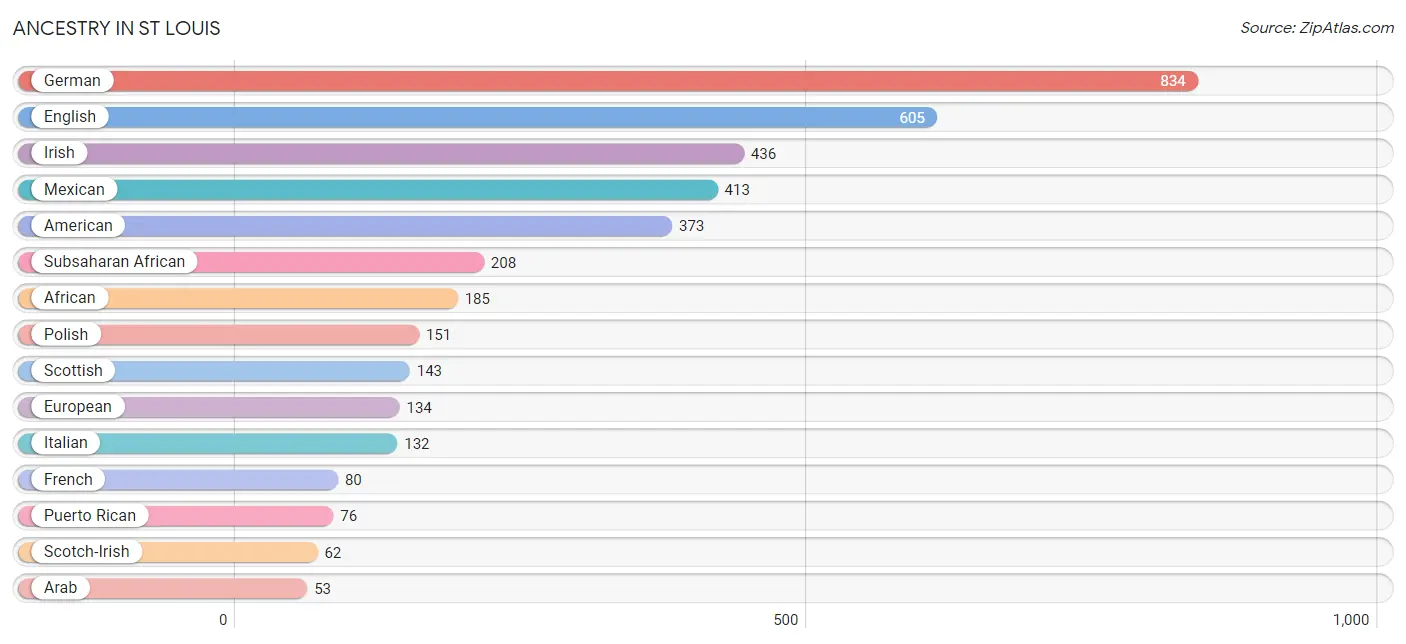
| Ancestry | # Population | % Population |
| African | 185 | 2.7% |
| American | 373 | 5.4% |
| Arab | 53 | 0.8% |
| Bangladeshi | 4 | 0.1% |
| Belgian | 24 | 0.4% |
| Blackfeet | 5 | 0.1% |
| British | 11 | 0.2% |
| Burmese | 5 | 0.1% |
| Canadian | 14 | 0.2% |
| Central American | 4 | 0.1% |
| Cherokee | 26 | 0.4% |
| Cuban | 52 | 0.7% |
| Danish | 6 | 0.1% |
| Dutch | 42 | 0.6% |
| Egyptian | 6 | 0.1% |
| English | 605 | 8.7% |
| European | 134 | 1.9% |
| Finnish | 32 | 0.5% |
| French | 80 | 1.1% |
| French Canadian | 34 | 0.5% |
| German | 834 | 12.0% |
| Greek | 4 | 0.1% |
| Haitian | 12 | 0.2% |
| Honduran | 4 | 0.1% |
| Hungarian | 34 | 0.5% |
| Irish | 436 | 6.3% |
| Italian | 132 | 1.9% |
| Jamaican | 24 | 0.4% |
| Jordanian | 5 | 0.1% |
| Korean | 13 | 0.2% |
| Malaysian | 11 | 0.2% |
| Mexican | 413 | 6.0% |
| Moroccan | 42 | 0.6% |
| Native Hawaiian | 23 | 0.3% |
| Nigerian | 11 | 0.2% |
| Ottawa | 12 | 0.2% |
| Paraguayan | 16 | 0.2% |
| Polish | 151 | 2.2% |
| Portuguese | 22 | 0.3% |
| Puerto Rican | 76 | 1.1% |
| Romanian | 8 | 0.1% |
| Samoan | 4 | 0.1% |
| Scandinavian | 17 | 0.3% |
| Scotch-Irish | 62 | 0.9% |
| Scottish | 143 | 2.1% |
| Serbian | 6 | 0.1% |
| South American | 16 | 0.2% |
| South American Indian | 16 | 0.2% |
| Sri Lankan | 11 | 0.2% |
| Subsaharan African | 208 | 3.0% |
| Sudanese | 6 | 0.1% |
| Swedish | 28 | 0.4% |
| Swiss | 5 | 0.1% |
| Thai | 11 | 0.2% |
| U.S. Virgin Islander | 5 | 0.1% |
| Ukrainian | 6 | 0.1% |
| Welsh | 6 | 0.1% | View All 57 Rows |
Immigrants in St Louis
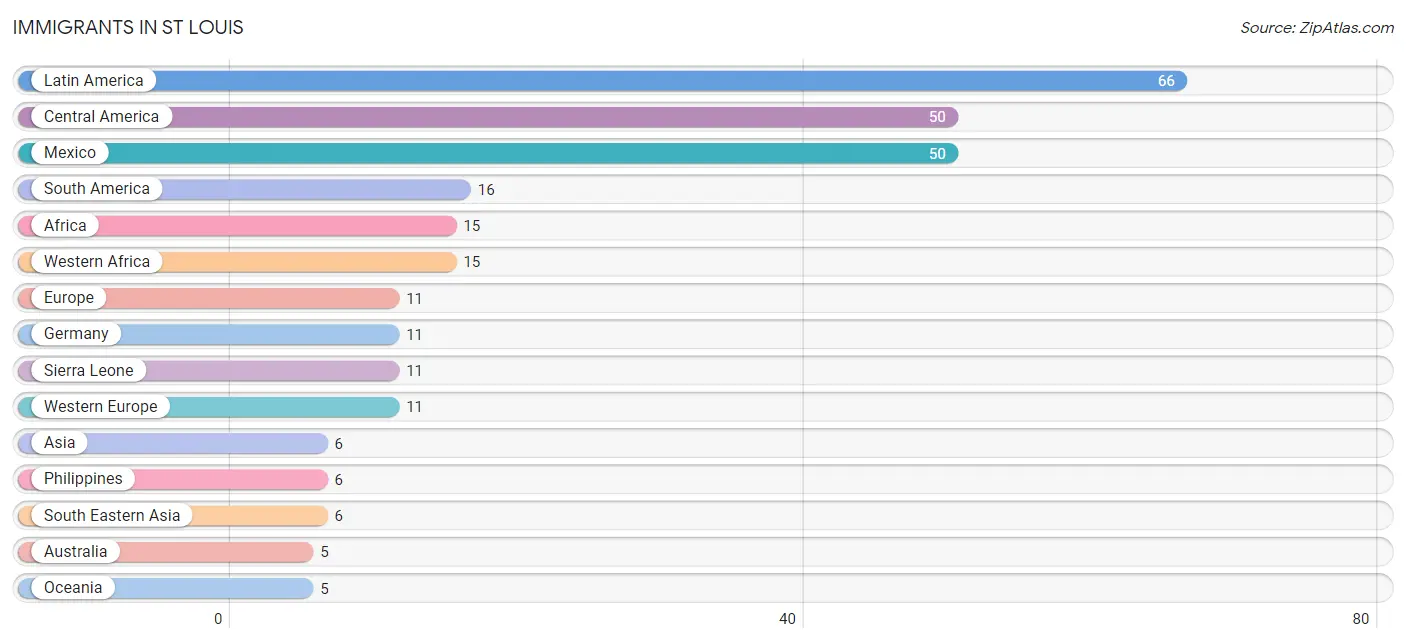
The most numerous immigrant groups reported in St Louis came from Latin America (66 | 0.9%), Central America (50 | 0.7%), Mexico (50 | 0.7%), South America (16 | 0.2%), and Africa (15 | 0.2%), together accounting for 2.8% of all St Louis residents.
| Immigration Origin | # Population | % Population |
| Africa | 15 | 0.2% |
| Asia | 6 | 0.1% |
| Australia | 5 | 0.1% |
| Cabo Verde | 4 | 0.1% |
| Central America | 50 | 0.7% |
| Europe | 11 | 0.2% |
| Germany | 11 | 0.2% |
| Latin America | 66 | 0.9% |
| Mexico | 50 | 0.7% |
| Oceania | 5 | 0.1% |
| Philippines | 6 | 0.1% |
| Sierra Leone | 11 | 0.2% |
| South America | 16 | 0.2% |
| South Eastern Asia | 6 | 0.1% |
| Western Africa | 15 | 0.2% |
| Western Europe | 11 | 0.2% | View All 16 Rows |
Sex and Age in St Louis
Sex and Age in St Louis
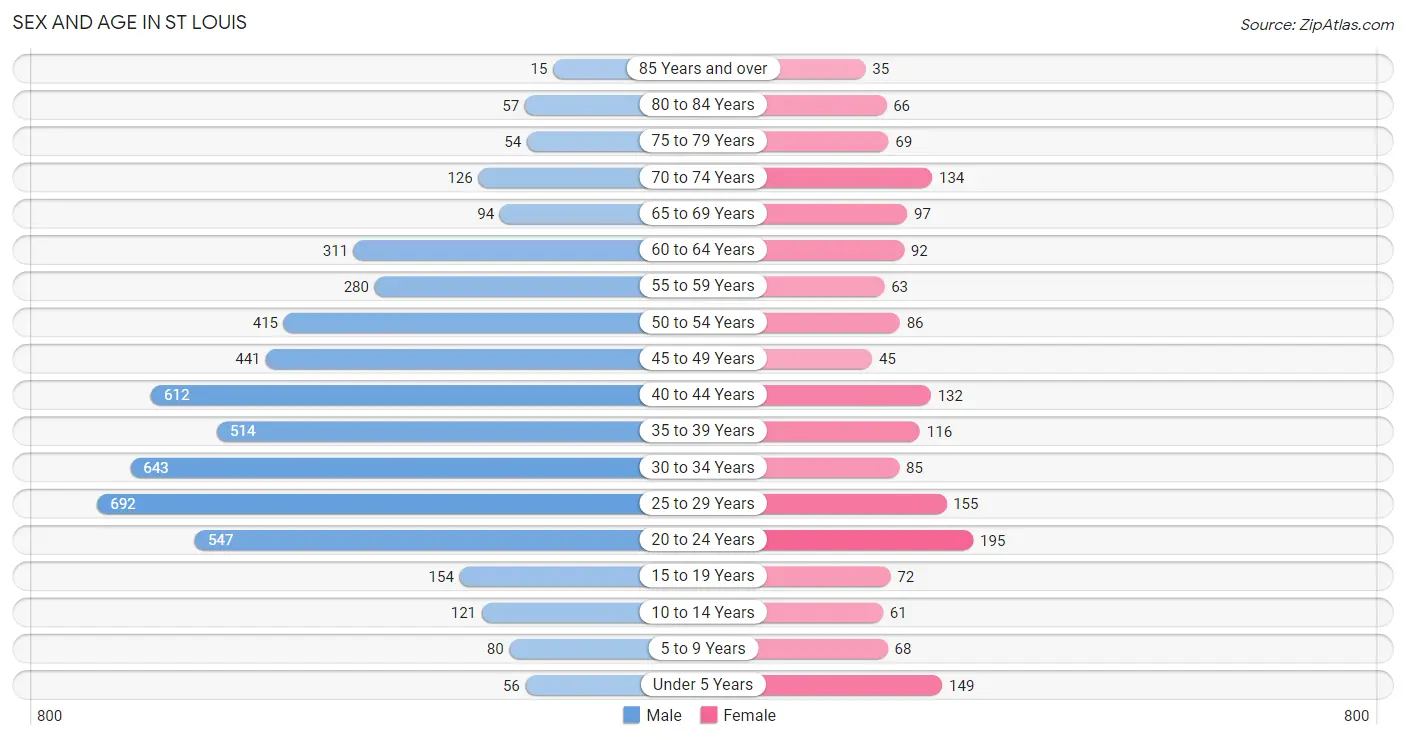
The most populous age groups in St Louis are 25 to 29 Years (692 | 13.3%) for men and 20 to 24 Years (195 | 11.3%) for women.
| Age Bracket | Male | Female |
| Under 5 Years | 56 (1.1%) | 149 (8.7%) |
| 5 to 9 Years | 80 (1.5%) | 68 (4.0%) |
| 10 to 14 Years | 121 (2.3%) | 61 (3.5%) |
| 15 to 19 Years | 154 (2.9%) | 72 (4.2%) |
| 20 to 24 Years | 547 (10.5%) | 195 (11.3%) |
| 25 to 29 Years | 692 (13.3%) | 155 (9.0%) |
| 30 to 34 Years | 643 (12.3%) | 85 (4.9%) |
| 35 to 39 Years | 514 (9.9%) | 116 (6.7%) |
| 40 to 44 Years | 612 (11.7%) | 132 (7.7%) |
| 45 to 49 Years | 441 (8.5%) | 45 (2.6%) |
| 50 to 54 Years | 415 (8.0%) | 86 (5.0%) |
| 55 to 59 Years | 280 (5.4%) | 63 (3.7%) |
| 60 to 64 Years | 311 (6.0%) | 92 (5.3%) |
| 65 to 69 Years | 94 (1.8%) | 97 (5.6%) |
| 70 to 74 Years | 126 (2.4%) | 134 (7.8%) |
| 75 to 79 Years | 54 (1.0%) | 69 (4.0%) |
| 80 to 84 Years | 57 (1.1%) | 66 (3.8%) |
| 85 Years and over | 15 (0.3%) | 35 (2.0%) |
| Total | 5,212 (100.0%) | 1,720 (100.0%) |
Families and Households in St Louis
Median Family Size in St Louis
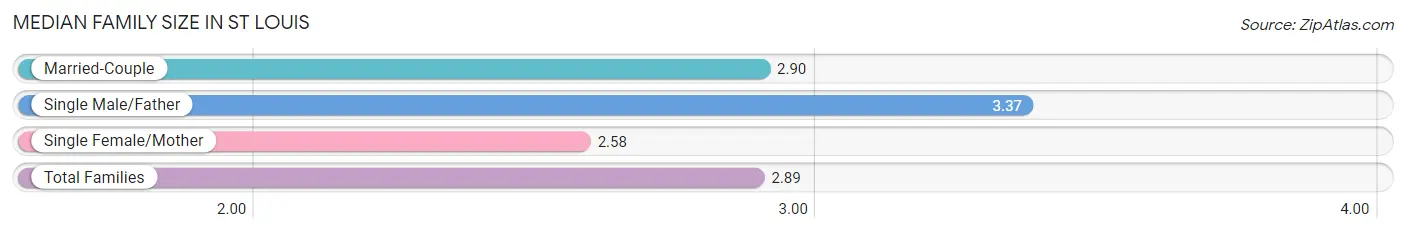
The median family size in St Louis is 2.89 persons per family, with single male/father families (87 | 10.7%) accounting for the largest median family size of 3.37 persons per family. On the other hand, single female/mother families (160 | 19.7%) represent the smallest median family size with 2.58 persons per family.
| Family Type | # Families | Family Size |
| Married-Couple | 565 (69.6%) | 2.90 |
| Single Male/Father | 87 (10.7%) | 3.37 |
| Single Female/Mother | 160 (19.7%) | 2.58 |
| Total Families | 812 (100.0%) | 2.89 |
Median Household Size in St Louis
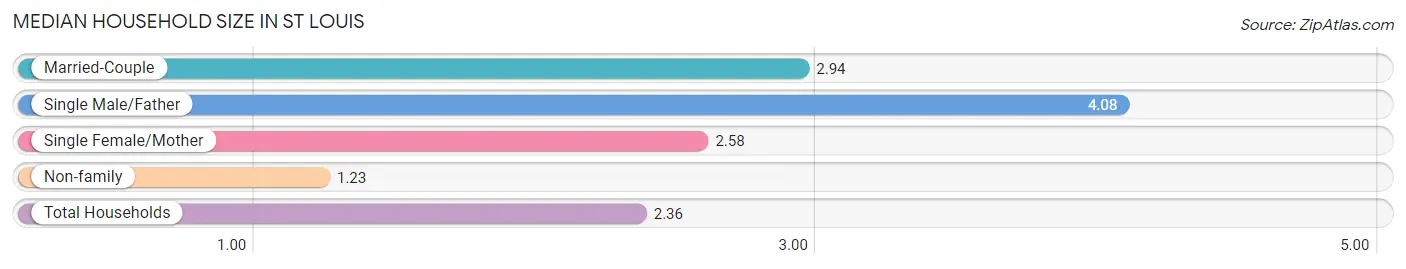
The median household size in St Louis is 2.36 persons per household, with single male/father households (87 | 6.9%) accounting for the largest median household size of 4.08 persons per household. non-family households (455 | 35.9%) represent the smallest median household size with 1.23 persons per household.
| Household Type | # Households | Household Size |
| Married-Couple | 565 (44.6%) | 2.94 |
| Single Male/Father | 87 (6.9%) | 4.08 |
| Single Female/Mother | 160 (12.6%) | 2.58 |
| Non-family | 455 (35.9%) | 1.23 |
| Total Households | 1,267 (100.0%) | 2.36 |
Household Size by Marriage Status in St Louis
Out of a total of 1,267 households in St Louis, 812 (64.1%) are family households, while 455 (35.9%) are nonfamily households. The most numerous type of family households are 2-person households, comprising 428, and the most common type of nonfamily households are 1-person households, comprising 395.
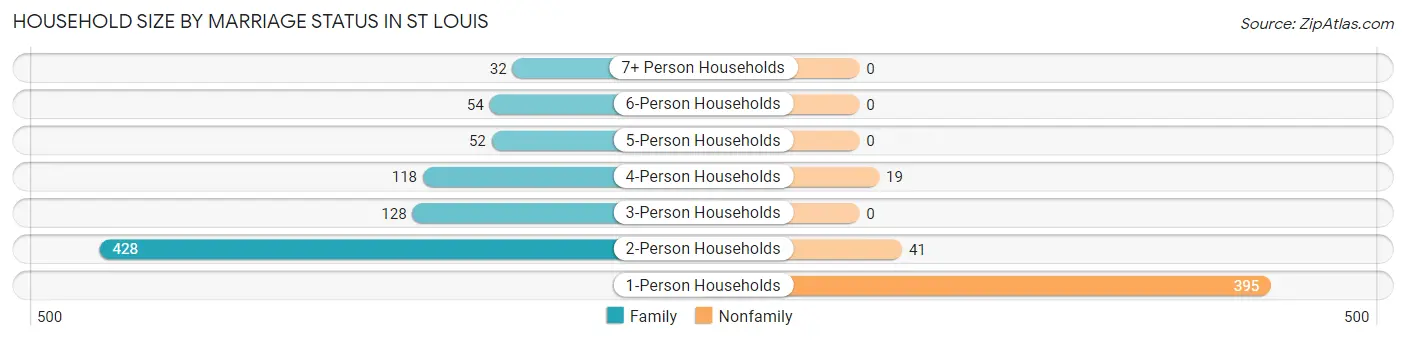
| Household Size | Family Households | Nonfamily Households |
| 1-Person Households | - | 395 (31.2%) |
| 2-Person Households | 428 (33.8%) | 41 (3.2%) |
| 3-Person Households | 128 (10.1%) | 0 (0.0%) |
| 4-Person Households | 118 (9.3%) | 19 (1.5%) |
| 5-Person Households | 52 (4.1%) | 0 (0.0%) |
| 6-Person Households | 54 (4.3%) | 0 (0.0%) |
| 7+ Person Households | 32 (2.5%) | 0 (0.0%) |
| Total | 812 (64.1%) | 455 (35.9%) |
Female Fertility in St Louis
Fertility by Age in St Louis
Average fertility rate in St Louis is 70.0 births per 1,000 women. Women in the age bracket of 20 to 34 years have the highest fertility rate with 133.0 births per 1,000 women. Women in the age bracket of 20 to 34 years acount for 100.0% of all women with births.
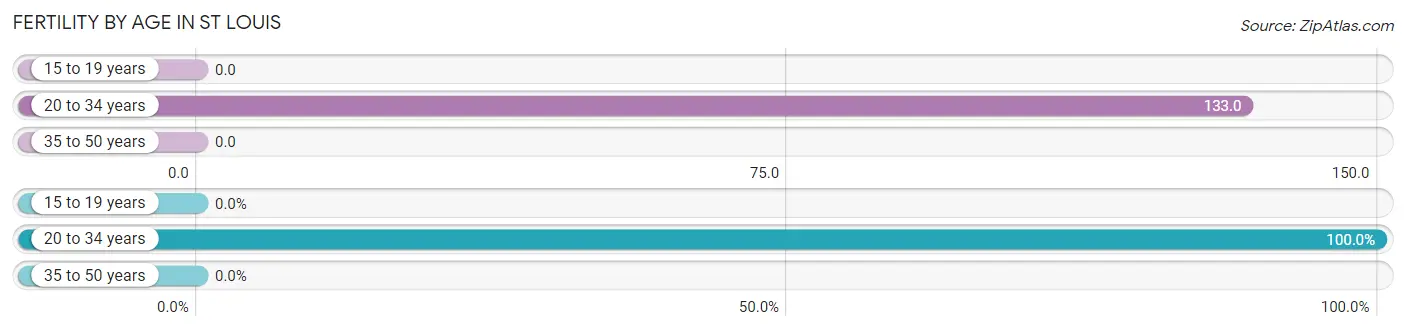
| Age Bracket | Women with Births | Births / 1,000 Women |
| 15 to 19 years | 0 (0.0%) | 0.0 |
| 20 to 34 years | 58 (100.0%) | 133.0 |
| 35 to 50 years | 0 (0.0%) | 0.0 |
| Total | 58 (100.0%) | 70.0 |
Fertility by Age by Marriage Status in St Louis
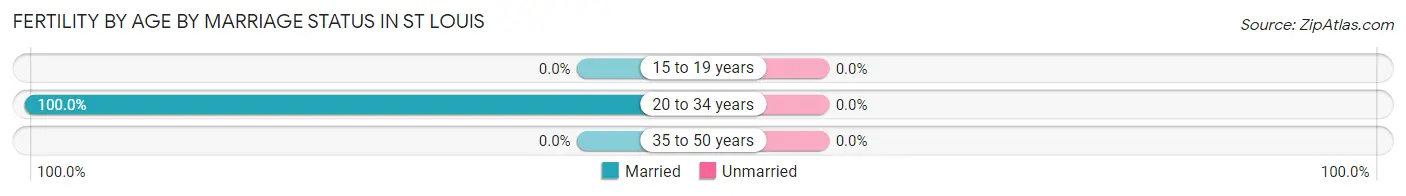
| Age Bracket | Married | Unmarried |
| 15 to 19 years | 0 (0.0%) | 0 (0.0%) |
| 20 to 34 years | 58 (100.0%) | 0 (0.0%) |
| 35 to 50 years | 0 (0.0%) | 0 (0.0%) |
| Total | 58 (100.0%) | 0 (0.0%) |
Fertility by Education in St Louis
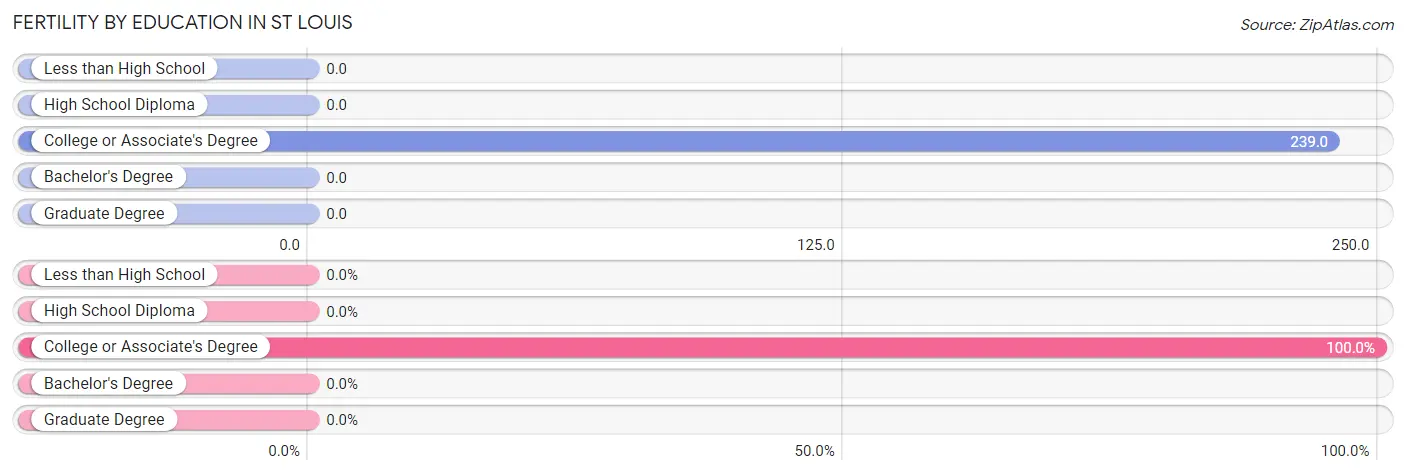
| Educational Attainment | Women with Births | Births / 1,000 Women |
| Less than High School | 0 (0.0%) | 0.0 |
| High School Diploma | 0 (0.0%) | 0.0 |
| College or Associate's Degree | 58 (100.0%) | 239.0 |
| Bachelor's Degree | 0 (0.0%) | 0.0 |
| Graduate Degree | 0 (0.0%) | 0.0 |
| Total | 58 (100.0%) | 70.0 |
Fertility by Education by Marriage Status in St Louis
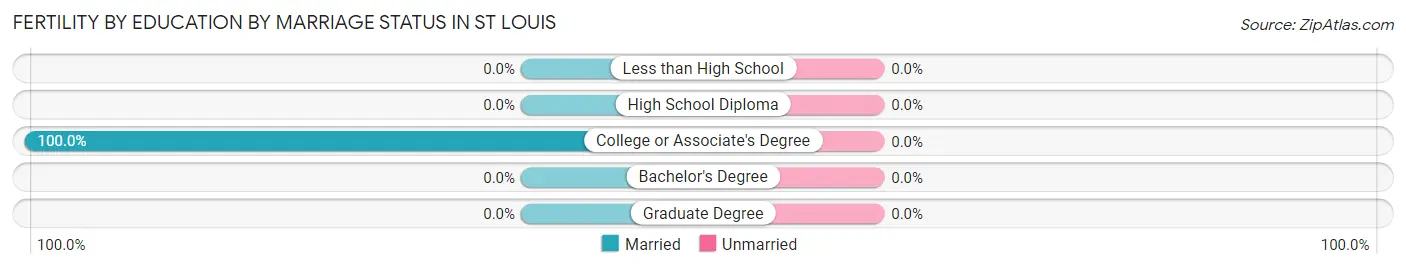
| Educational Attainment | Married | Unmarried |
| Less than High School | 0 (0.0%) | 0 (0.0%) |
| High School Diploma | 0 (0.0%) | 0 (0.0%) |
| College or Associate's Degree | 58 (100.0%) | 0 (0.0%) |
| Bachelor's Degree | 0 (0.0%) | 0 (0.0%) |
| Graduate Degree | 0 (0.0%) | 0 (0.0%) |
| Total | 58 (100.0%) | 0 (0.0%) |
Employment Characteristics in St Louis
Employment by Class of Employer in St Louis
Among the 1,194 employed individuals in St Louis, private company employees (892 | 74.7%), not-for-profit organizations (121 | 10.1%), and local government employees (103 | 8.6%) make up the most common classes of employment.
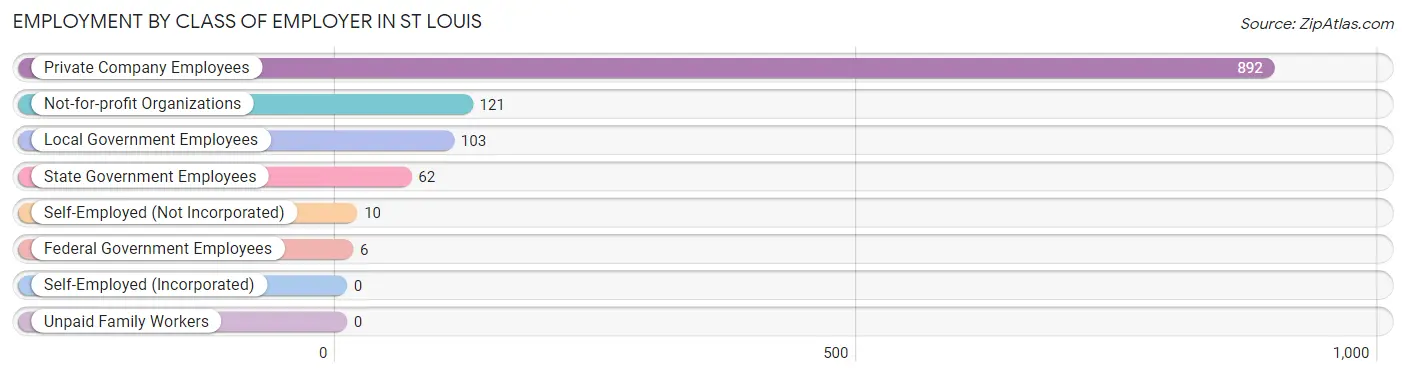
| Employer Class | # Employees | % Employees |
| Private Company Employees | 892 | 74.7% |
| Self-Employed (Incorporated) | 0 | 0.0% |
| Self-Employed (Not Incorporated) | 10 | 0.8% |
| Not-for-profit Organizations | 121 | 10.1% |
| Local Government Employees | 103 | 8.6% |
| State Government Employees | 62 | 5.2% |
| Federal Government Employees | 6 | 0.5% |
| Unpaid Family Workers | 0 | 0.0% |
| Total | 1,194 | 100.0% |
Employment Status by Age in St Louis
According to the labor force statistics for St Louis, out of the total population over 16 years of age (6,343), 21.1% or 1,338 individuals are in the labor force, with 6.1% or 82 of them unemployed. The age group with the highest labor force participation rate is 20 to 24 years, with 31.8% or 236 individuals in the labor force. Within the labor force, the 65 to 74 years age range has the highest percentage of unemployed individuals, with 39.5% or 15 of them being unemployed.
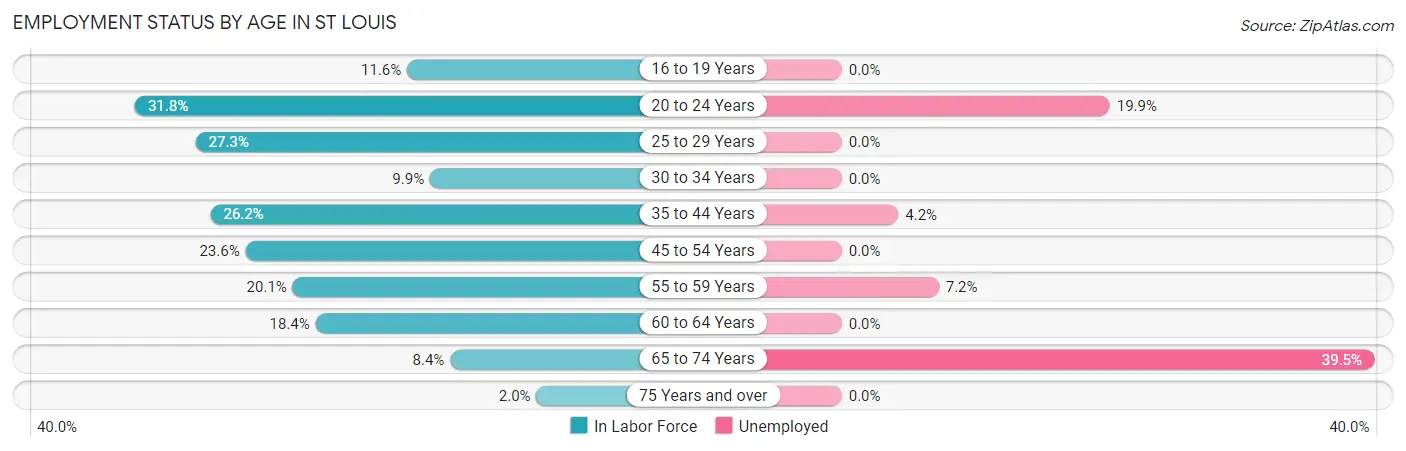
| Age Bracket | In Labor Force | Unemployed |
| 16 to 19 Years | 20 (11.6%) | 0 (0.0%) |
| 20 to 24 Years | 236 (31.8%) | 47 (19.9%) |
| 25 to 29 Years | 231 (27.3%) | 0 (0.0%) |
| 30 to 34 Years | 72 (9.9%) | 0 (0.0%) |
| 35 to 44 Years | 360 (26.2%) | 15 (4.2%) |
| 45 to 54 Years | 233 (23.6%) | 0 (0.0%) |
| 55 to 59 Years | 69 (20.1%) | 5 (7.2%) |
| 60 to 64 Years | 74 (18.4%) | 0 (0.0%) |
| 65 to 74 Years | 38 (8.4%) | 15 (39.5%) |
| 75 Years and over | 6 (2.0%) | 0 (0.0%) |
| Total | 1,338 (21.1%) | 82 (6.1%) |
Employment Status by Educational Attainment in St Louis
According to labor force statistics for St Louis, 22.2% of individuals (1,039) out of the total population between 25 and 64 years of age (4,682) are in the labor force, with 1.9% or 20 of them being unemployed. The group with the highest labor force participation rate are those with the educational attainment of bachelor's degree or higher, with 85.0% or 364 individuals in the labor force. Within the labor force, individuals with high school diploma education have the highest percentage of unemployment, with 5.8% or 20 of them being unemployed.
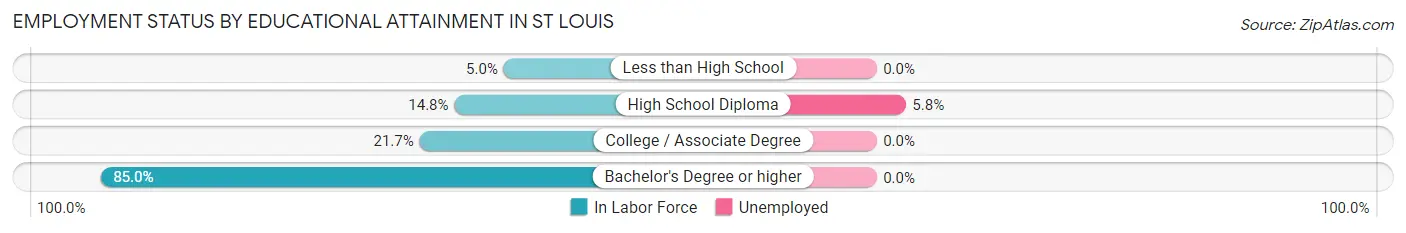
| Educational Attainment | In Labor Force | Unemployed |
| Less than High School | 27 (5.0%) | 0 (0.0%) |
| High School Diploma | 341 (14.8%) | 134 (5.8%) |
| College / Associate Degree | 306 (21.7%) | 0 (0.0%) |
| Bachelor's Degree or higher | 364 (85.0%) | 0 (0.0%) |
| Total | 1,039 (22.2%) | 89 (1.9%) |
Employment Occupations by Sex in St Louis
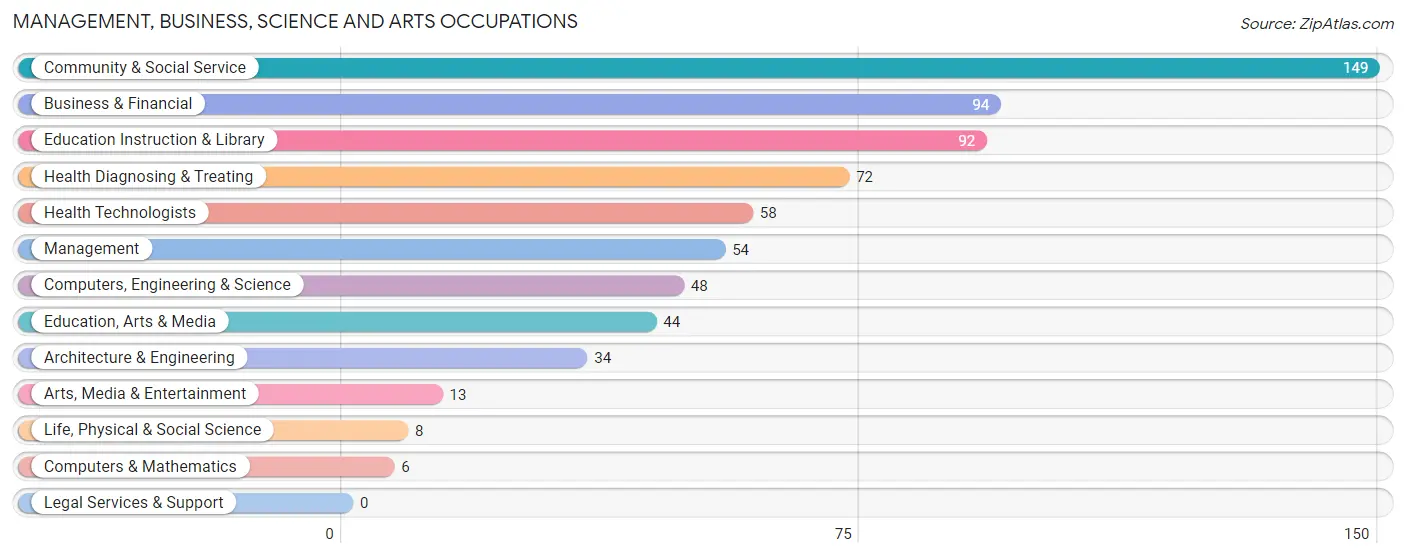
Management, Business, Science and Arts Occupations
The most common Management, Business, Science and Arts occupations in St Louis are Community & Social Service (149 | 11.8%), Business & Financial (94 | 7.5%), Education Instruction & Library (92 | 7.3%), Health Diagnosing & Treating (72 | 5.7%), and Health Technologists (58 | 4.6%).
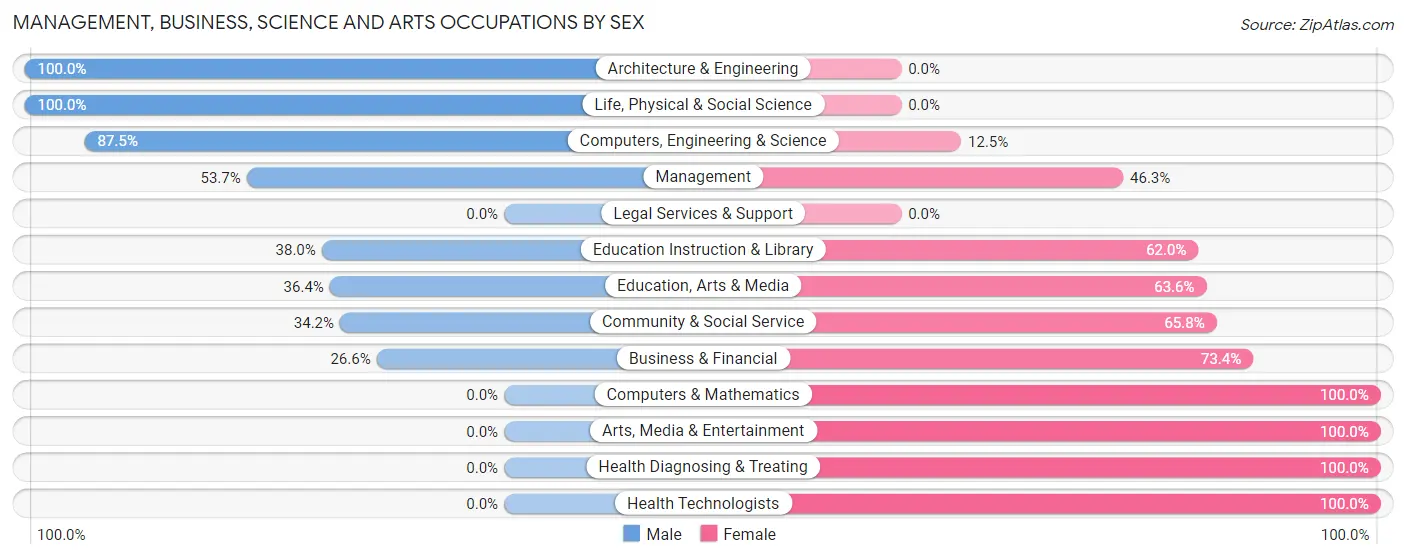
Management, Business, Science and Arts Occupations by Sex
Within the Management, Business, Science and Arts occupations in St Louis, the most male-oriented occupations are Architecture & Engineering (100.0%), Life, Physical & Social Science (100.0%), and Computers, Engineering & Science (87.5%), while the most female-oriented occupations are Computers & Mathematics (100.0%), Arts, Media & Entertainment (100.0%), and Health Diagnosing & Treating (100.0%).
| Occupation | Male | Female |
| Management | 29 (53.7%) | 25 (46.3%) |
| Business & Financial | 25 (26.6%) | 69 (73.4%) |
| Computers, Engineering & Science | 42 (87.5%) | 6 (12.5%) |
| Computers & Mathematics | 0 (0.0%) | 6 (100.0%) |
| Architecture & Engineering | 34 (100.0%) | 0 (0.0%) |
| Life, Physical & Social Science | 8 (100.0%) | 0 (0.0%) |
| Community & Social Service | 51 (34.2%) | 98 (65.8%) |
| Education, Arts & Media | 16 (36.4%) | 28 (63.6%) |
| Legal Services & Support | 0 (0.0%) | 0 (0.0%) |
| Education Instruction & Library | 35 (38.0%) | 57 (62.0%) |
| Arts, Media & Entertainment | 0 (0.0%) | 13 (100.0%) |
| Health Diagnosing & Treating | 0 (0.0%) | 72 (100.0%) |
| Health Technologists | 0 (0.0%) | 58 (100.0%) |
| Total (Category) | 147 (35.2%) | 270 (64.7%) |
| Total (Overall) | 670 (53.3%) | 587 (46.7%) |
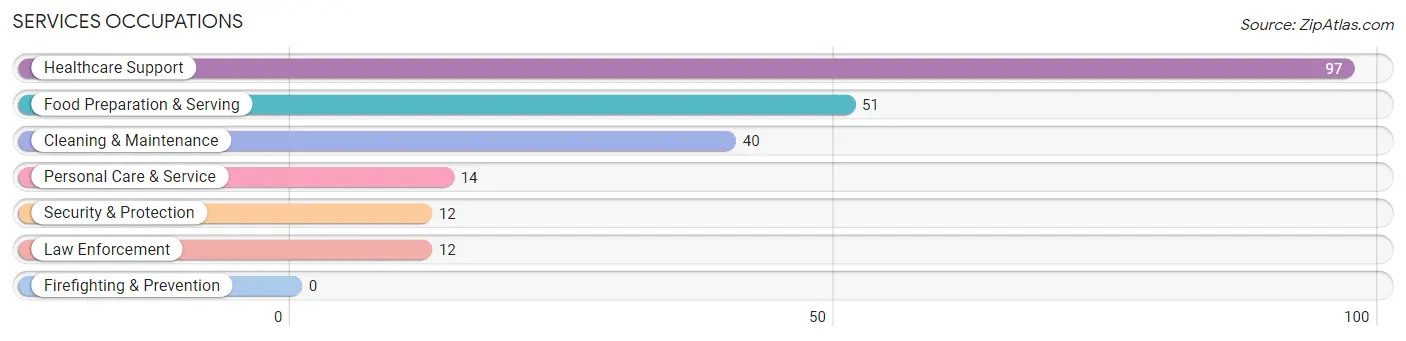
Services Occupations
The most common Services occupations in St Louis are Healthcare Support (97 | 7.7%), Food Preparation & Serving (51 | 4.1%), Cleaning & Maintenance (40 | 3.2%), Personal Care & Service (14 | 1.1%), and Security & Protection (12 | 0.9%).
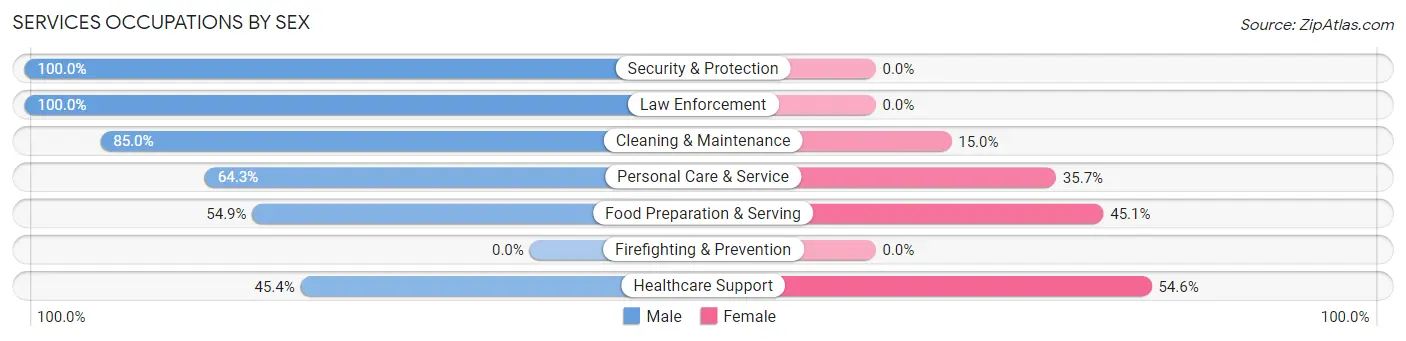
Services Occupations by Sex
Within the Services occupations in St Louis, the most male-oriented occupations are Security & Protection (100.0%), Law Enforcement (100.0%), and Cleaning & Maintenance (85.0%), while the most female-oriented occupations are Healthcare Support (54.6%), Food Preparation & Serving (45.1%), and Personal Care & Service (35.7%).
| Occupation | Male | Female |
| Healthcare Support | 44 (45.4%) | 53 (54.6%) |
| Security & Protection | 12 (100.0%) | 0 (0.0%) |
| Firefighting & Prevention | 0 (0.0%) | 0 (0.0%) |
| Law Enforcement | 12 (100.0%) | 0 (0.0%) |
| Food Preparation & Serving | 28 (54.9%) | 23 (45.1%) |
| Cleaning & Maintenance | 34 (85.0%) | 6 (15.0%) |
| Personal Care & Service | 9 (64.3%) | 5 (35.7%) |
| Total (Category) | 127 (59.4%) | 87 (40.6%) |
| Total (Overall) | 670 (53.3%) | 587 (46.7%) |
Sales and Office Occupations
The most common Sales and Office occupations in St Louis are Sales & Related (123 | 9.8%), and Office & Administration (107 | 8.5%).

Sales and Office Occupations by Sex
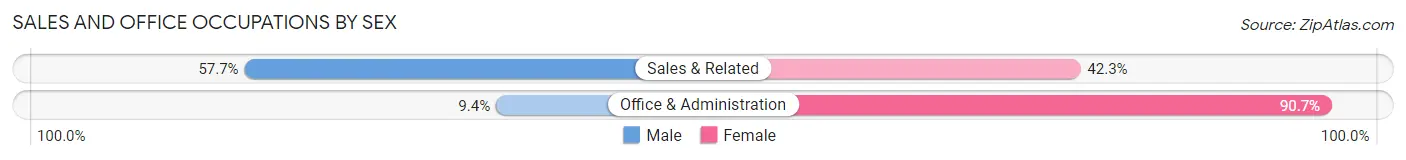
| Occupation | Male | Female |
| Sales & Related | 71 (57.7%) | 52 (42.3%) |
| Office & Administration | 10 (9.3%) | 97 (90.6%) |
| Total (Category) | 81 (35.2%) | 149 (64.8%) |
| Total (Overall) | 670 (53.3%) | 587 (46.7%) |
Natural Resources, Construction and Maintenance Occupations
The most common Natural Resources, Construction and Maintenance occupations in St Louis are Installation, Maintenance & Repair (52 | 4.1%), Farming, Fishing & Forestry (18 | 1.4%), and Construction & Extraction (10 | 0.8%).

Natural Resources, Construction and Maintenance Occupations by Sex
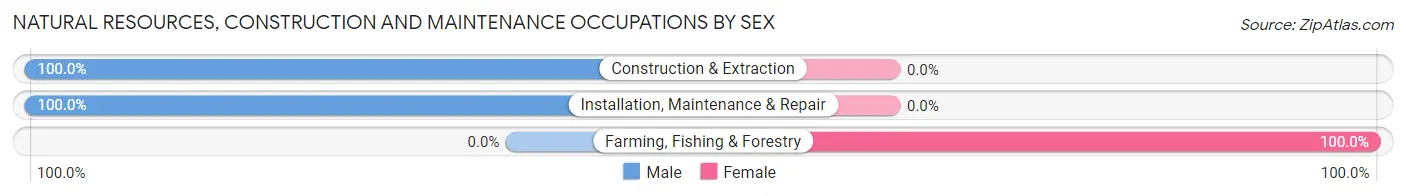
| Occupation | Male | Female |
| Farming, Fishing & Forestry | 0 (0.0%) | 18 (100.0%) |
| Construction & Extraction | 10 (100.0%) | 0 (0.0%) |
| Installation, Maintenance & Repair | 52 (100.0%) | 0 (0.0%) |
| Total (Category) | 62 (77.5%) | 18 (22.5%) |
| Total (Overall) | 670 (53.3%) | 587 (46.7%) |
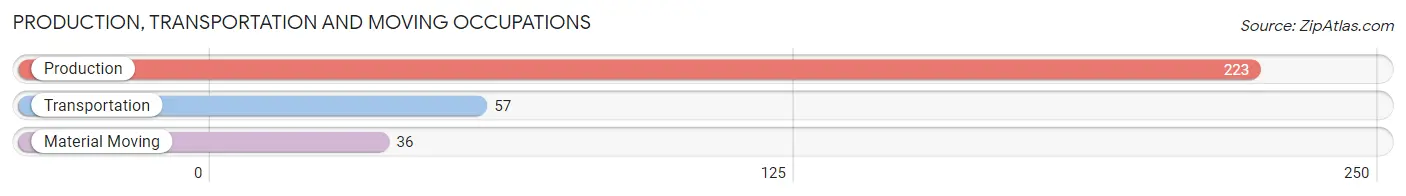
Production, Transportation and Moving Occupations
The most common Production, Transportation and Moving occupations in St Louis are Production (223 | 17.7%), Transportation (57 | 4.5%), and Material Moving (36 | 2.9%).
Production, Transportation and Moving Occupations by Sex
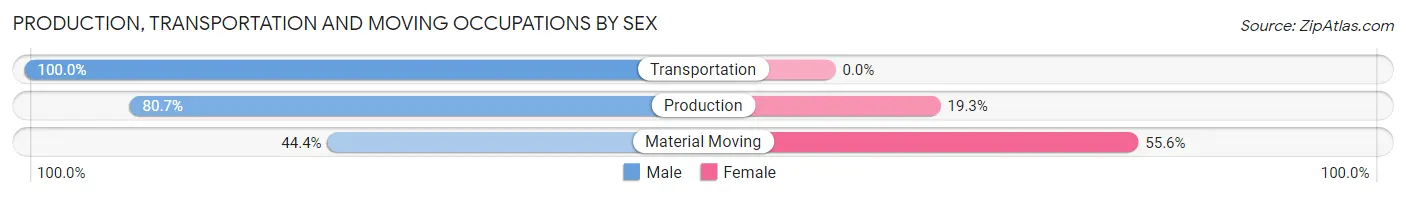
| Occupation | Male | Female |
| Production | 180 (80.7%) | 43 (19.3%) |
| Transportation | 57 (100.0%) | 0 (0.0%) |
| Material Moving | 16 (44.4%) | 20 (55.6%) |
| Total (Category) | 253 (80.1%) | 63 (19.9%) |
| Total (Overall) | 670 (53.3%) | 587 (46.7%) |
Employment Industries by Sex in St Louis
Employment Industries in St Louis
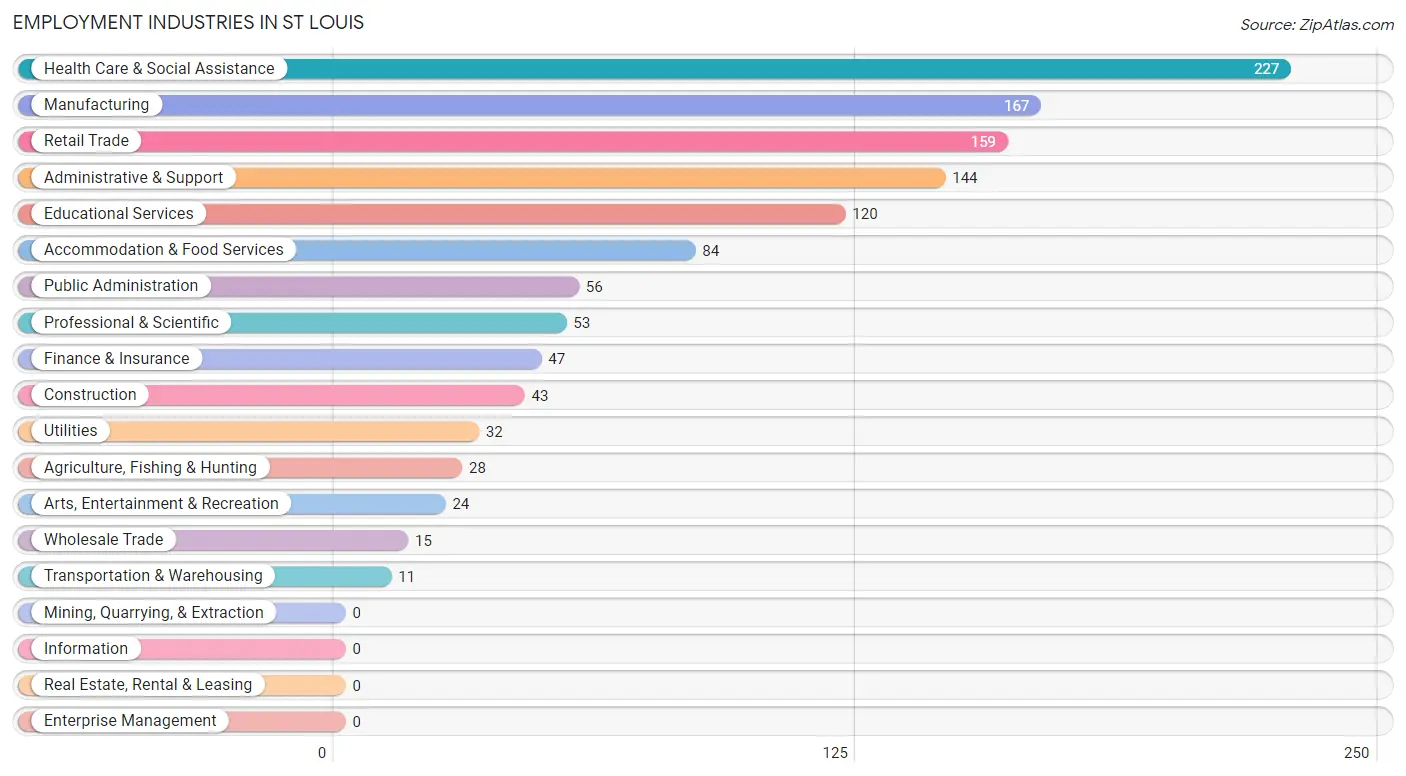
The major employment industries in St Louis include Health Care & Social Assistance (227 | 18.1%), Manufacturing (167 | 13.3%), Retail Trade (159 | 12.7%), Administrative & Support (144 | 11.5%), and Educational Services (120 | 9.6%).
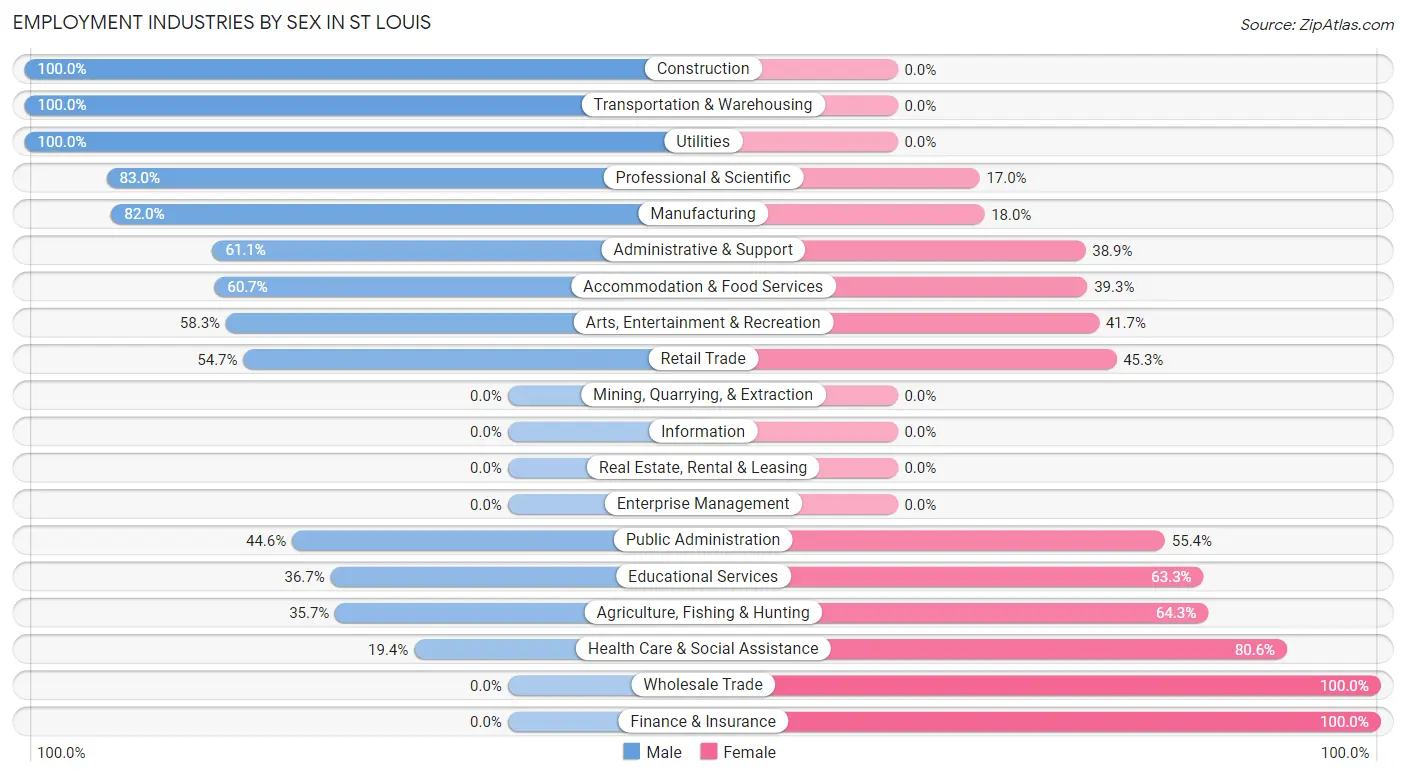
Employment Industries by Sex in St Louis
The St Louis industries that see more men than women are Construction (100.0%), Transportation & Warehousing (100.0%), and Utilities (100.0%), whereas the industries that tend to have a higher number of women are Wholesale Trade (100.0%), Finance & Insurance (100.0%), and Health Care & Social Assistance (80.6%).
| Industry | Male | Female |
| Agriculture, Fishing & Hunting | 10 (35.7%) | 18 (64.3%) |
| Mining, Quarrying, & Extraction | 0 (0.0%) | 0 (0.0%) |
| Construction | 43 (100.0%) | 0 (0.0%) |
| Manufacturing | 137 (82.0%) | 30 (18.0%) |
| Wholesale Trade | 0 (0.0%) | 15 (100.0%) |
| Retail Trade | 87 (54.7%) | 72 (45.3%) |
| Transportation & Warehousing | 11 (100.0%) | 0 (0.0%) |
| Utilities | 32 (100.0%) | 0 (0.0%) |
| Information | 0 (0.0%) | 0 (0.0%) |
| Finance & Insurance | 0 (0.0%) | 47 (100.0%) |
| Real Estate, Rental & Leasing | 0 (0.0%) | 0 (0.0%) |
| Professional & Scientific | 44 (83.0%) | 9 (17.0%) |
| Enterprise Management | 0 (0.0%) | 0 (0.0%) |
| Administrative & Support | 88 (61.1%) | 56 (38.9%) |
| Educational Services | 44 (36.7%) | 76 (63.3%) |
| Health Care & Social Assistance | 44 (19.4%) | 183 (80.6%) |
| Arts, Entertainment & Recreation | 14 (58.3%) | 10 (41.7%) |
| Accommodation & Food Services | 51 (60.7%) | 33 (39.3%) |
| Public Administration | 25 (44.6%) | 31 (55.4%) |
| Total | 670 (53.3%) | 587 (46.7%) |
Education in St Louis
School Enrollment in St Louis
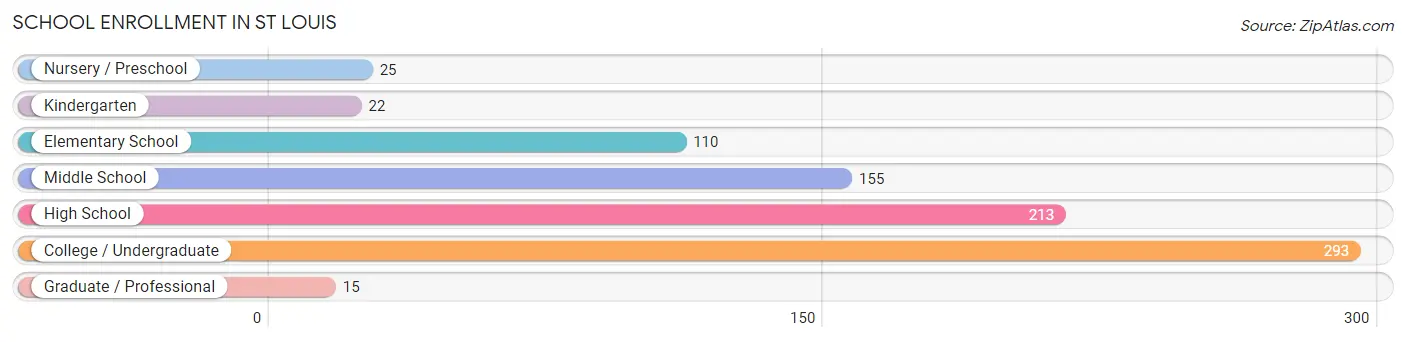
The most common levels of schooling among the 833 students in St Louis are college / undergraduate (293 | 35.2%), high school (213 | 25.6%), and middle school (155 | 18.6%).
| School Level | # Students | % Students |
| Nursery / Preschool | 25 | 3.0% |
| Kindergarten | 22 | 2.6% |
| Elementary School | 110 | 13.2% |
| Middle School | 155 | 18.6% |
| High School | 213 | 25.6% |
| College / Undergraduate | 293 | 35.2% |
| Graduate / Professional | 15 | 1.8% |
| Total | 833 | 100.0% |
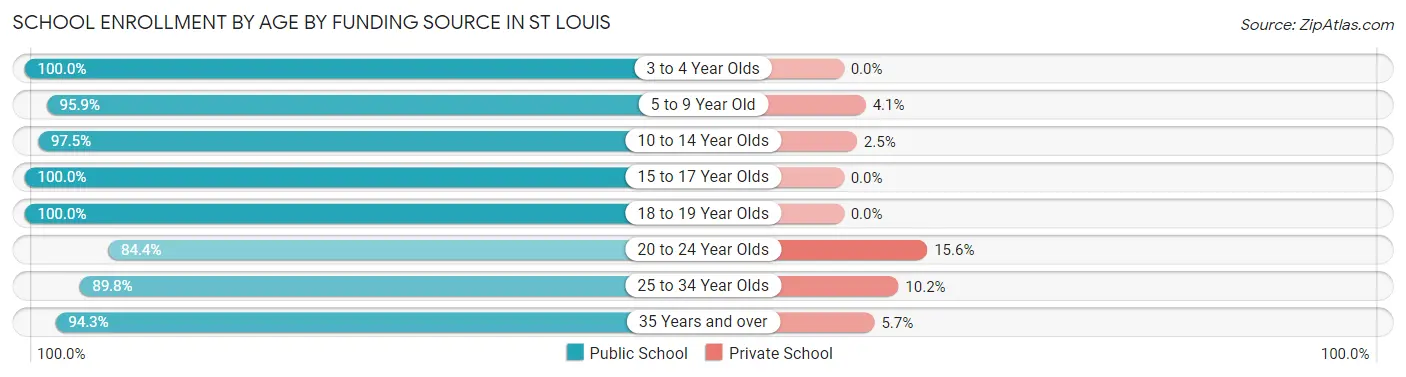
School Enrollment by Age by Funding Source in St Louis
Out of a total of 833 students who are enrolled in schools in St Louis, 44 (5.3%) attend a private institution, while the remaining 789 (94.7%) are enrolled in public schools. The age group of 20 to 24 year olds has the highest likelihood of being enrolled in private schools, with 14 (15.6% in the age bracket) enrolled. Conversely, the age group of 3 to 4 year olds has the lowest likelihood of being enrolled in a private school, with 4 (100.0% in the age bracket) attending a public institution.
| Age Bracket | Public School | Private School |
| 3 to 4 Year Olds | 4 (100.0%) | 0 (0.0%) |
| 5 to 9 Year Old | 140 (95.9%) | 6 (4.1%) |
| 10 to 14 Year Olds | 158 (97.5%) | 4 (2.5%) |
| 15 to 17 Year Olds | 144 (100.0%) | 0 (0.0%) |
| 18 to 19 Year Olds | 22 (100.0%) | 0 (0.0%) |
| 20 to 24 Year Olds | 76 (84.4%) | 14 (15.6%) |
| 25 to 34 Year Olds | 97 (89.8%) | 11 (10.2%) |
| 35 Years and over | 148 (94.3%) | 9 (5.7%) |
| Total | 789 (94.7%) | 44 (5.3%) |
Educational Attainment by Field of Study in St Louis
Education (148 | 28.7%), business (95 | 18.4%), liberal arts & history (53 | 10.3%), engineering (41 | 8.0%), and science & technology (40 | 7.7%) are the most common fields of study among 516 individuals in St Louis who have obtained a bachelor's degree or higher.
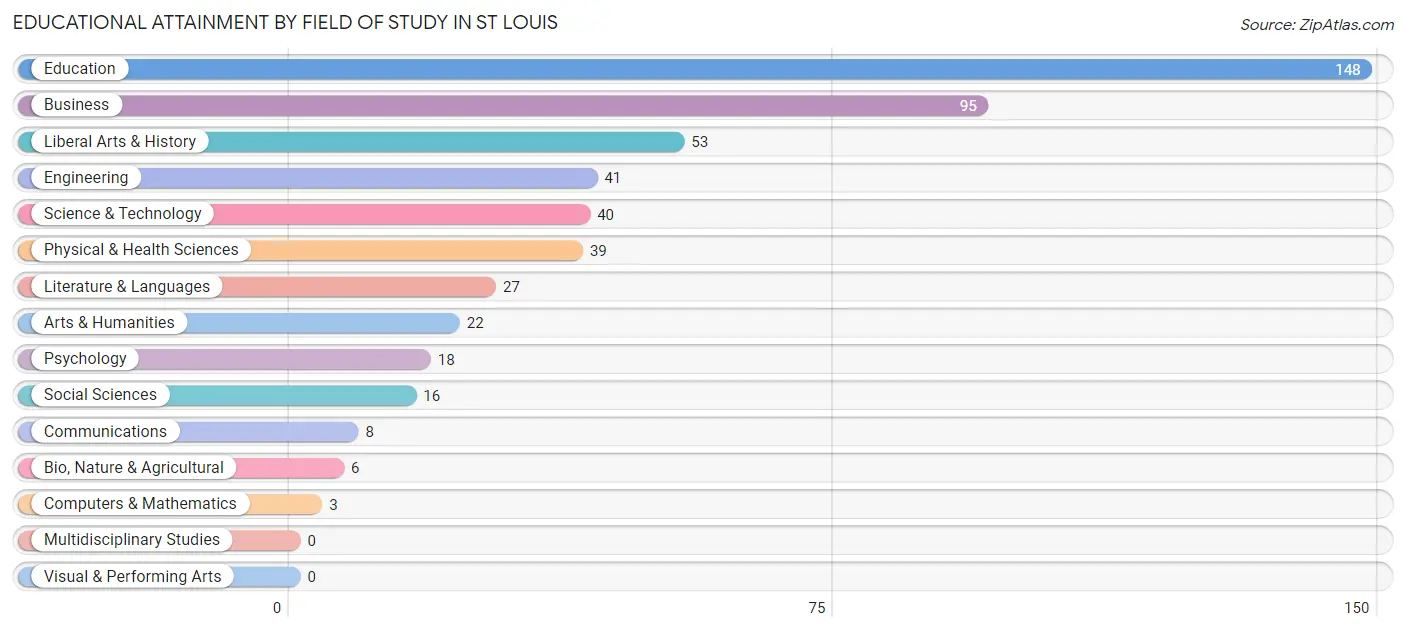
| Field of Study | # Graduates | % Graduates |
| Computers & Mathematics | 3 | 0.6% |
| Bio, Nature & Agricultural | 6 | 1.2% |
| Physical & Health Sciences | 39 | 7.6% |
| Psychology | 18 | 3.5% |
| Social Sciences | 16 | 3.1% |
| Engineering | 41 | 8.0% |
| Multidisciplinary Studies | 0 | 0.0% |
| Science & Technology | 40 | 7.7% |
| Business | 95 | 18.4% |
| Education | 148 | 28.7% |
| Literature & Languages | 27 | 5.2% |
| Liberal Arts & History | 53 | 10.3% |
| Visual & Performing Arts | 0 | 0.0% |
| Communications | 8 | 1.5% |
| Arts & Humanities | 22 | 4.3% |
| Total | 516 | 100.0% |
Transportation & Commute in St Louis
Vehicle Availability by Sex in St Louis
The most prevalent vehicle ownership categories in St Louis are males with 2 vehicles (263, accounting for 43.0%) and females with 2 vehicles (282, making up 45.2%).
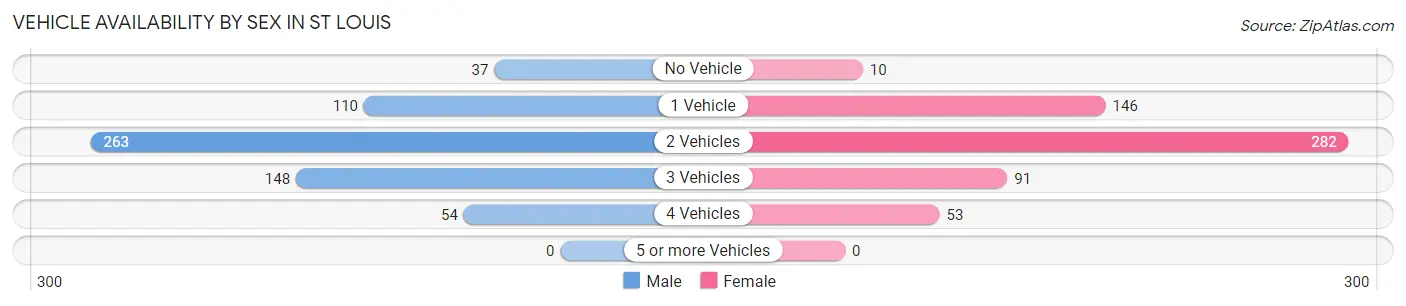
| Vehicles Available | Male | Female |
| No Vehicle | 37 (6.0%) | 10 (1.7%) |
| 1 Vehicle | 110 (18.0%) | 146 (25.1%) |
| 2 Vehicles | 263 (43.0%) | 282 (48.4%) |
| 3 Vehicles | 148 (24.2%) | 91 (15.6%) |
| 4 Vehicles | 54 (8.8%) | 53 (9.1%) |
| 5 or more Vehicles | 0 (0.0%) | 0 (0.0%) |
| Total | 612 (100.0%) | 582 (100.0%) |
Commute Time in St Louis
The most frequently occuring commute durations in St Louis are 10 to 14 minutes (316 commuters, 28.4%), 5 to 9 minutes (181 commuters, 16.3%), and less than 5 minutes (148 commuters, 13.3%).
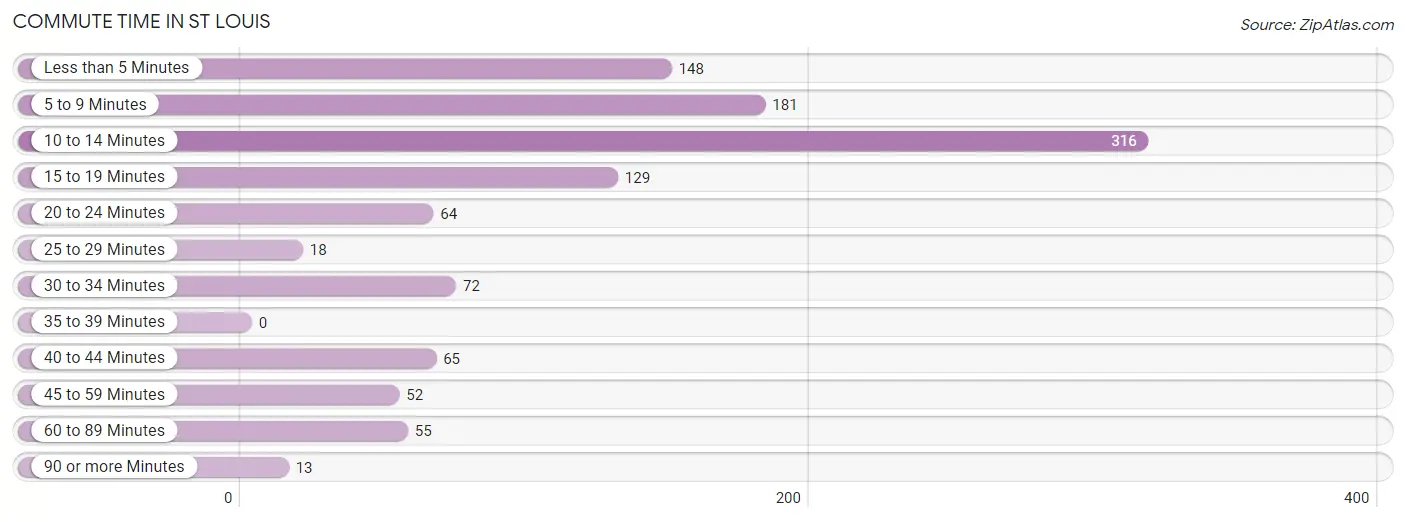
| Commute Time | # Commuters | % Commuters |
| Less than 5 Minutes | 148 | 13.3% |
| 5 to 9 Minutes | 181 | 16.3% |
| 10 to 14 Minutes | 316 | 28.4% |
| 15 to 19 Minutes | 129 | 11.6% |
| 20 to 24 Minutes | 64 | 5.8% |
| 25 to 29 Minutes | 18 | 1.6% |
| 30 to 34 Minutes | 72 | 6.5% |
| 35 to 39 Minutes | 0 | 0.0% |
| 40 to 44 Minutes | 65 | 5.8% |
| 45 to 59 Minutes | 52 | 4.7% |
| 60 to 89 Minutes | 55 | 4.9% |
| 90 or more Minutes | 13 | 1.2% |
Commute Time by Sex in St Louis
The most common commute times in St Louis are 15 to 19 minutes (109 commuters, 18.6%) for males and 10 to 14 minutes (250 commuters, 47.4%) for females.
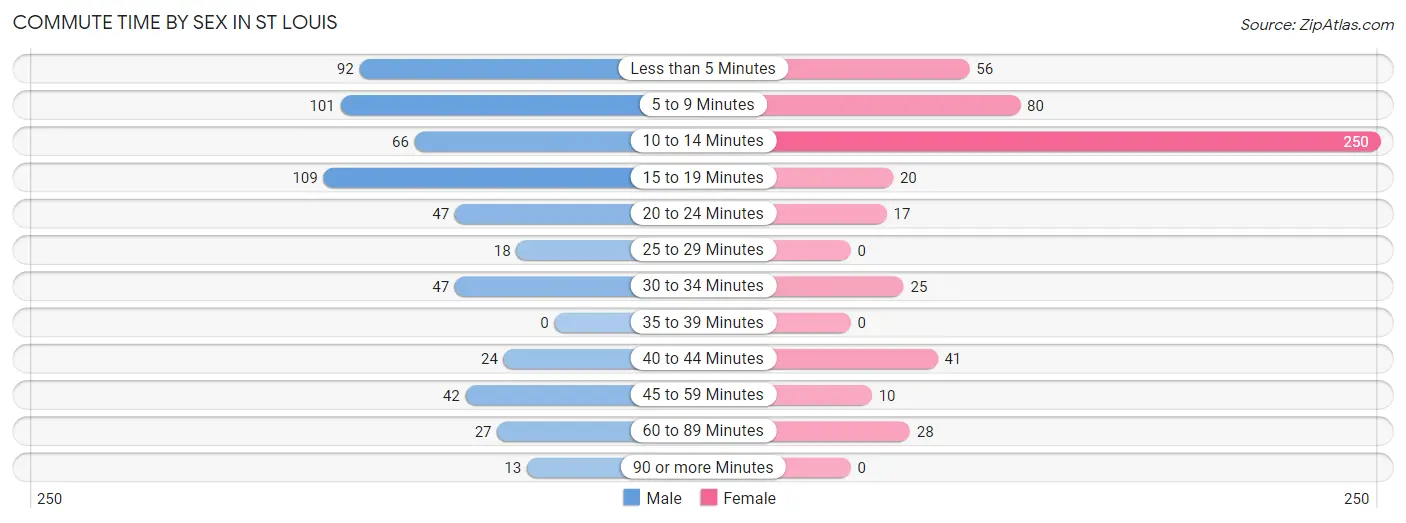
| Commute Time | Male | Female |
| Less than 5 Minutes | 92 (15.7%) | 56 (10.6%) |
| 5 to 9 Minutes | 101 (17.2%) | 80 (15.2%) |
| 10 to 14 Minutes | 66 (11.3%) | 250 (47.4%) |
| 15 to 19 Minutes | 109 (18.6%) | 20 (3.8%) |
| 20 to 24 Minutes | 47 (8.0%) | 17 (3.2%) |
| 25 to 29 Minutes | 18 (3.1%) | 0 (0.0%) |
| 30 to 34 Minutes | 47 (8.0%) | 25 (4.7%) |
| 35 to 39 Minutes | 0 (0.0%) | 0 (0.0%) |
| 40 to 44 Minutes | 24 (4.1%) | 41 (7.8%) |
| 45 to 59 Minutes | 42 (7.2%) | 10 (1.9%) |
| 60 to 89 Minutes | 27 (4.6%) | 28 (5.3%) |
| 90 or more Minutes | 13 (2.2%) | 0 (0.0%) |
Time of Departure to Work by Sex in St Louis
The most frequent times of departure to work in St Louis are 7:30 AM to 7:59 AM (90, 15.4%) for males and 7:30 AM to 7:59 AM (134, 25.4%) for females.
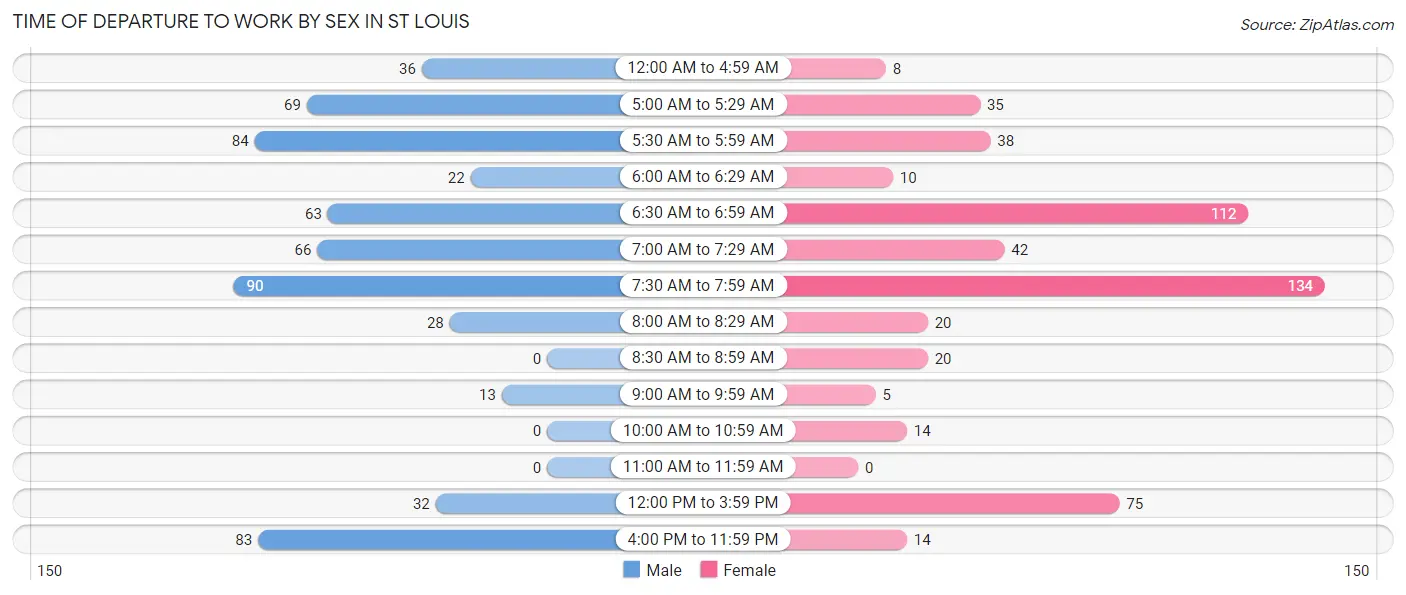
| Time of Departure | Male | Female |
| 12:00 AM to 4:59 AM | 36 (6.1%) | 8 (1.5%) |
| 5:00 AM to 5:29 AM | 69 (11.8%) | 35 (6.6%) |
| 5:30 AM to 5:59 AM | 84 (14.3%) | 38 (7.2%) |
| 6:00 AM to 6:29 AM | 22 (3.7%) | 10 (1.9%) |
| 6:30 AM to 6:59 AM | 63 (10.7%) | 112 (21.2%) |
| 7:00 AM to 7:29 AM | 66 (11.3%) | 42 (8.0%) |
| 7:30 AM to 7:59 AM | 90 (15.4%) | 134 (25.4%) |
| 8:00 AM to 8:29 AM | 28 (4.8%) | 20 (3.8%) |
| 8:30 AM to 8:59 AM | 0 (0.0%) | 20 (3.8%) |
| 9:00 AM to 9:59 AM | 13 (2.2%) | 5 (0.9%) |
| 10:00 AM to 10:59 AM | 0 (0.0%) | 14 (2.7%) |
| 11:00 AM to 11:59 AM | 0 (0.0%) | 0 (0.0%) |
| 12:00 PM to 3:59 PM | 32 (5.5%) | 75 (14.2%) |
| 4:00 PM to 11:59 PM | 83 (14.2%) | 14 (2.7%) |
| Total | 586 (100.0%) | 527 (100.0%) |
Housing Occupancy in St Louis
Occupancy by Ownership in St Louis
Of the total 1,267 dwellings in St Louis, owner-occupied units account for 905 (71.4%), while renter-occupied units make up 362 (28.6%).
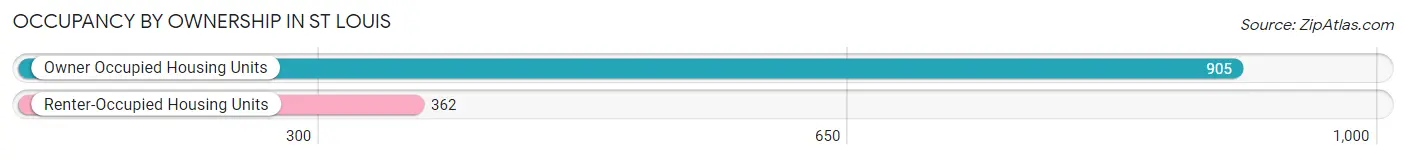
| Occupancy | # Housing Units | % Housing Units |
| Owner Occupied Housing Units | 905 | 71.4% |
| Renter-Occupied Housing Units | 362 | 28.6% |
| Total Occupied Housing Units | 1,267 | 100.0% |
Occupancy by Household Size in St Louis
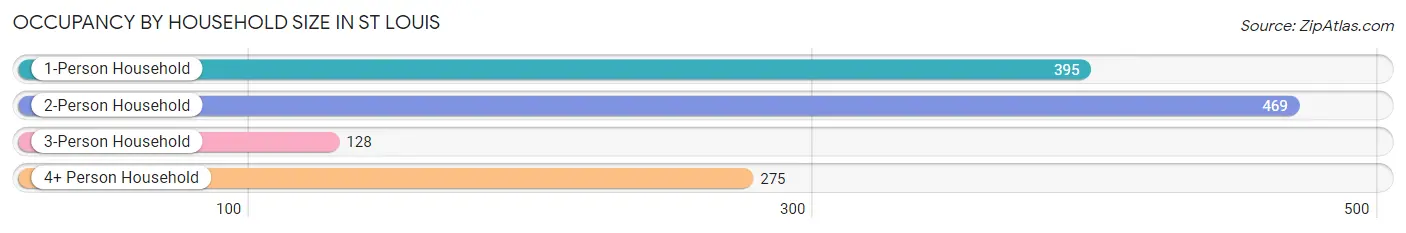
| Household Size | # Housing Units | % Housing Units |
| 1-Person Household | 395 | 31.2% |
| 2-Person Household | 469 | 37.0% |
| 3-Person Household | 128 | 10.1% |
| 4+ Person Household | 275 | 21.7% |
| Total Housing Units | 1,267 | 100.0% |
Occupancy by Ownership by Household Size in St Louis
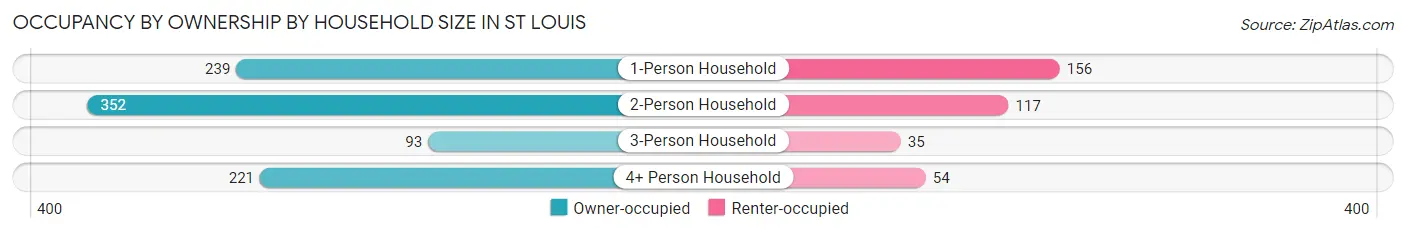
| Household Size | Owner-occupied | Renter-occupied |
| 1-Person Household | 239 (60.5%) | 156 (39.5%) |
| 2-Person Household | 352 (75.0%) | 117 (24.9%) |
| 3-Person Household | 93 (72.7%) | 35 (27.3%) |
| 4+ Person Household | 221 (80.4%) | 54 (19.6%) |
| Total Housing Units | 905 (71.4%) | 362 (28.6%) |
Occupancy by Educational Attainment in St Louis
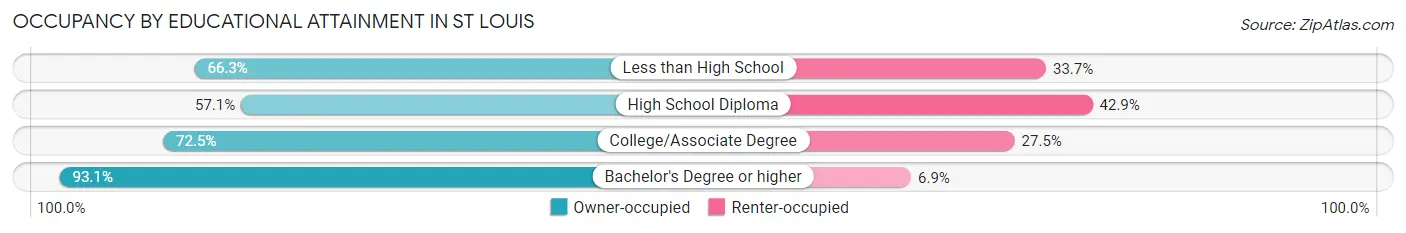
| Household Size | Owner-occupied | Renter-occupied |
| Less than High School | 63 (66.3%) | 32 (33.7%) |
| High School Diploma | 282 (57.1%) | 212 (42.9%) |
| College/Associate Degree | 251 (72.5%) | 95 (27.5%) |
| Bachelor's Degree or higher | 309 (93.1%) | 23 (6.9%) |
Occupancy by Age of Householder in St Louis
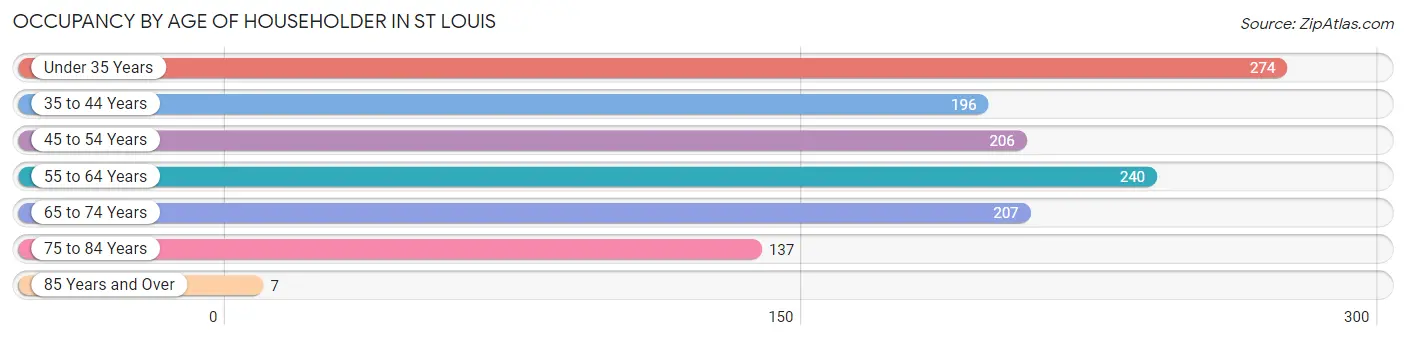
| Age Bracket | # Households | % Households |
| Under 35 Years | 274 | 21.6% |
| 35 to 44 Years | 196 | 15.5% |
| 45 to 54 Years | 206 | 16.3% |
| 55 to 64 Years | 240 | 18.9% |
| 65 to 74 Years | 207 | 16.3% |
| 75 to 84 Years | 137 | 10.8% |
| 85 Years and Over | 7 | 0.5% |
| Total | 1,267 | 100.0% |
Housing Finances in St Louis
Median Income by Occupancy in St Louis
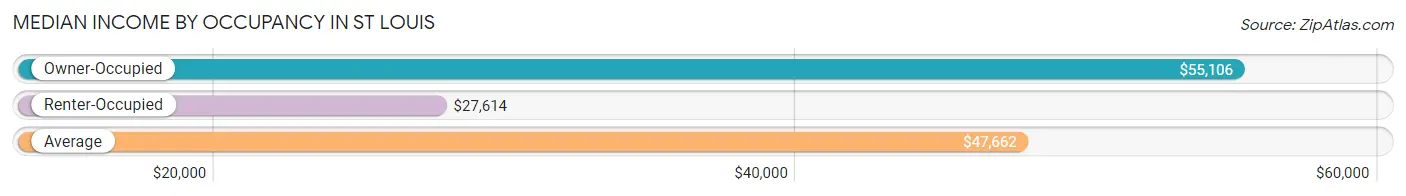
| Occupancy Type | # Households | Median Income |
| Owner-Occupied | 905 (71.4%) | $55,106 |
| Renter-Occupied | 362 (28.6%) | $27,614 |
| Average | 1,267 (100.0%) | $47,662 |
Occupancy by Householder Income Bracket in St Louis
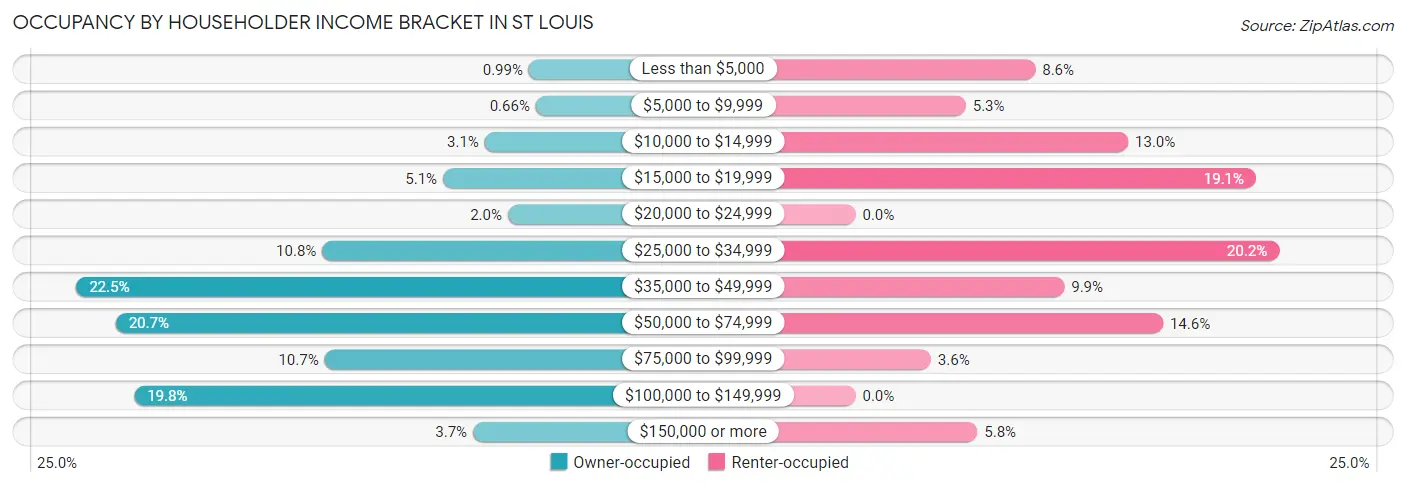
| Income Bracket | Owner-occupied | Renter-occupied |
| Less than $5,000 | 9 (1.0%) | 31 (8.6%) |
| $5,000 to $9,999 | 6 (0.7%) | 19 (5.2%) |
| $10,000 to $14,999 | 28 (3.1%) | 47 (13.0%) |
| $15,000 to $19,999 | 46 (5.1%) | 69 (19.1%) |
| $20,000 to $24,999 | 18 (2.0%) | 0 (0.0%) |
| $25,000 to $34,999 | 98 (10.8%) | 73 (20.2%) |
| $35,000 to $49,999 | 204 (22.5%) | 36 (9.9%) |
| $50,000 to $74,999 | 187 (20.7%) | 53 (14.6%) |
| $75,000 to $99,999 | 97 (10.7%) | 13 (3.6%) |
| $100,000 to $149,999 | 179 (19.8%) | 0 (0.0%) |
| $150,000 or more | 33 (3.6%) | 21 (5.8%) |
| Total | 905 (100.0%) | 362 (100.0%) |
Monthly Housing Cost Tiers in St Louis
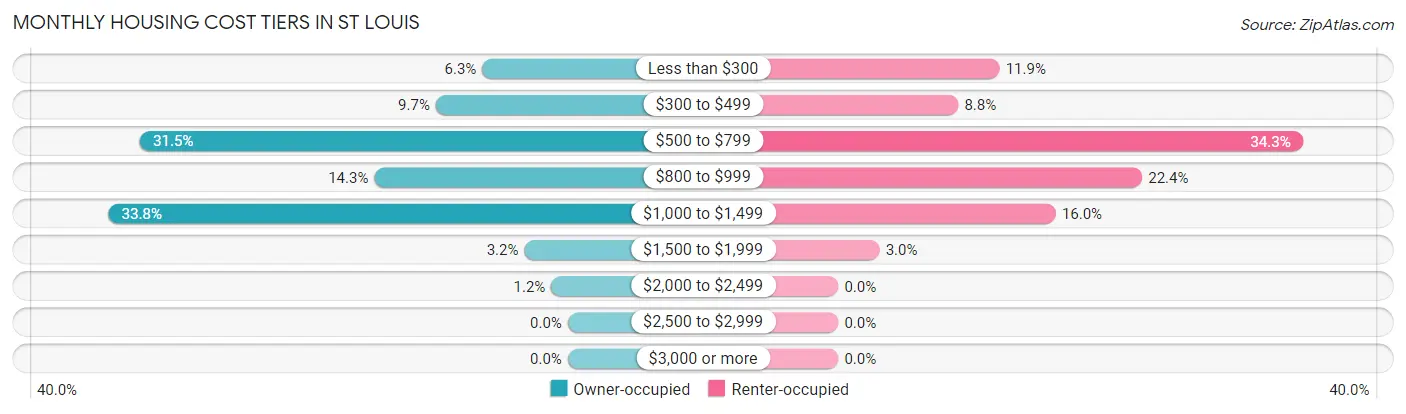
| Monthly Cost | Owner-occupied | Renter-occupied |
| Less than $300 | 57 (6.3%) | 43 (11.9%) |
| $300 to $499 | 88 (9.7%) | 32 (8.8%) |
| $500 to $799 | 285 (31.5%) | 124 (34.3%) |
| $800 to $999 | 129 (14.2%) | 81 (22.4%) |
| $1,000 to $1,499 | 306 (33.8%) | 58 (16.0%) |
| $1,500 to $1,999 | 29 (3.2%) | 11 (3.0%) |
| $2,000 to $2,499 | 11 (1.2%) | 0 (0.0%) |
| $2,500 to $2,999 | 0 (0.0%) | 0 (0.0%) |
| $3,000 or more | 0 (0.0%) | 0 (0.0%) |
| Total | 905 (100.0%) | 362 (100.0%) |
Physical Housing Characteristics in St Louis
Housing Structures in St Louis
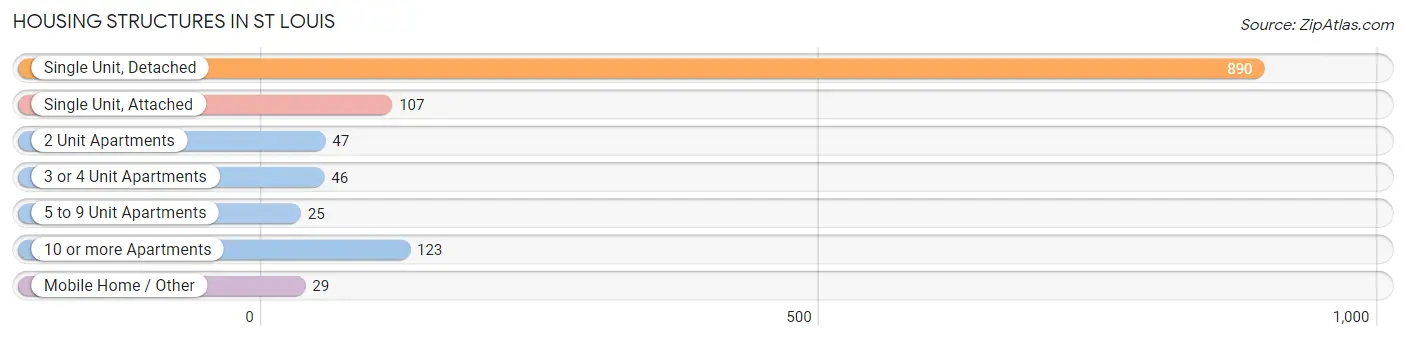
| Structure Type | # Housing Units | % Housing Units |
| Single Unit, Detached | 890 | 70.2% |
| Single Unit, Attached | 107 | 8.5% |
| 2 Unit Apartments | 47 | 3.7% |
| 3 or 4 Unit Apartments | 46 | 3.6% |
| 5 to 9 Unit Apartments | 25 | 2.0% |
| 10 or more Apartments | 123 | 9.7% |
| Mobile Home / Other | 29 | 2.3% |
| Total | 1,267 | 100.0% |
Housing Structures by Occupancy in St Louis
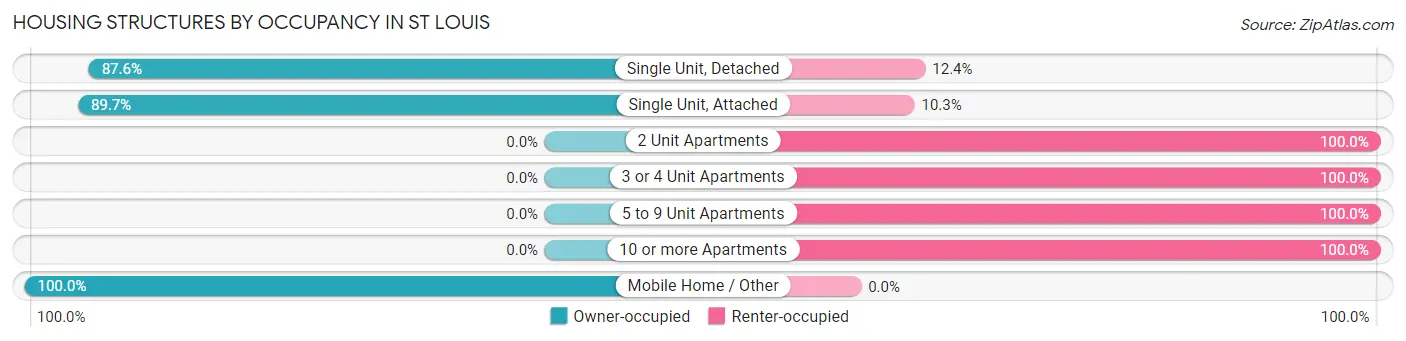
| Structure Type | Owner-occupied | Renter-occupied |
| Single Unit, Detached | 780 (87.6%) | 110 (12.4%) |
| Single Unit, Attached | 96 (89.7%) | 11 (10.3%) |
| 2 Unit Apartments | 0 (0.0%) | 47 (100.0%) |
| 3 or 4 Unit Apartments | 0 (0.0%) | 46 (100.0%) |
| 5 to 9 Unit Apartments | 0 (0.0%) | 25 (100.0%) |
| 10 or more Apartments | 0 (0.0%) | 123 (100.0%) |
| Mobile Home / Other | 29 (100.0%) | 0 (0.0%) |
| Total | 905 (71.4%) | 362 (28.6%) |
Housing Structures by Number of Rooms in St Louis
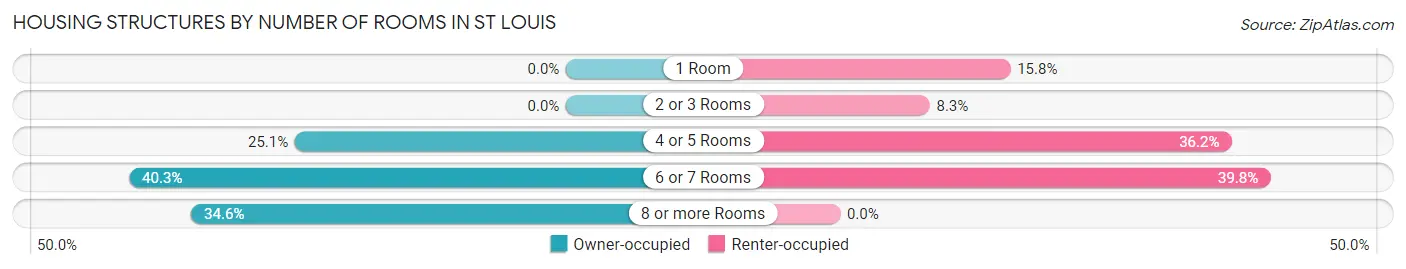
| Number of Rooms | Owner-occupied | Renter-occupied |
| 1 Room | 0 (0.0%) | 57 (15.8%) |
| 2 or 3 Rooms | 0 (0.0%) | 30 (8.3%) |
| 4 or 5 Rooms | 227 (25.1%) | 131 (36.2%) |
| 6 or 7 Rooms | 365 (40.3%) | 144 (39.8%) |
| 8 or more Rooms | 313 (34.6%) | 0 (0.0%) |
| Total | 905 (100.0%) | 362 (100.0%) |
Housing Structure by Heating Type in St Louis
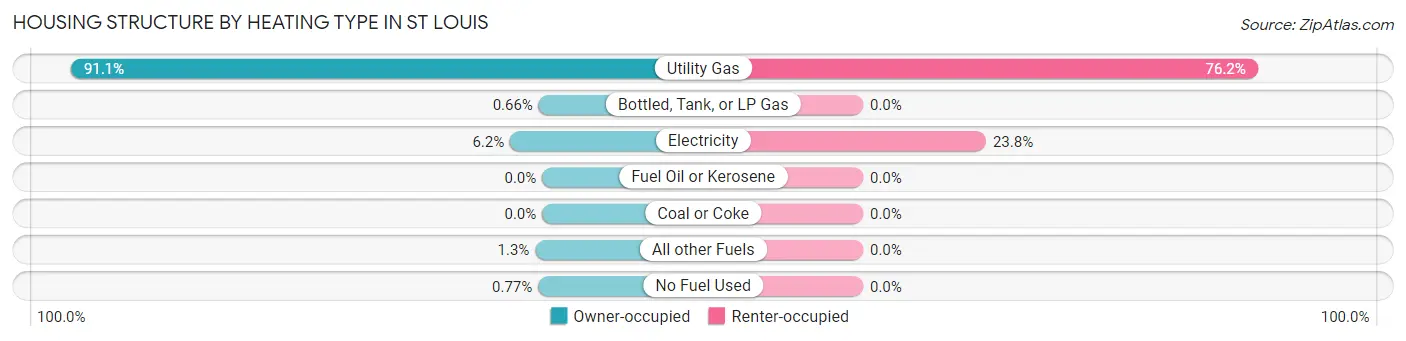
| Heating Type | Owner-occupied | Renter-occupied |
| Utility Gas | 824 (91.0%) | 276 (76.2%) |
| Bottled, Tank, or LP Gas | 6 (0.7%) | 0 (0.0%) |
| Electricity | 56 (6.2%) | 86 (23.8%) |
| Fuel Oil or Kerosene | 0 (0.0%) | 0 (0.0%) |
| Coal or Coke | 0 (0.0%) | 0 (0.0%) |
| All other Fuels | 12 (1.3%) | 0 (0.0%) |
| No Fuel Used | 7 (0.8%) | 0 (0.0%) |
| Total | 905 (100.0%) | 362 (100.0%) |
Household Vehicle Usage in St Louis
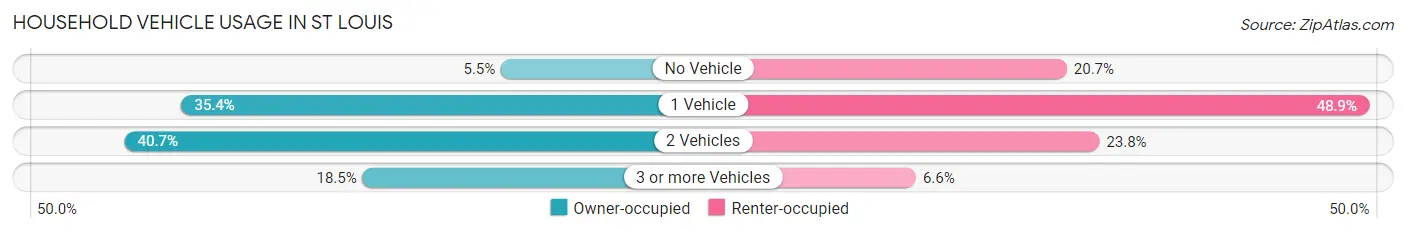
| Vehicles per Household | Owner-occupied | Renter-occupied |
| No Vehicle | 50 (5.5%) | 75 (20.7%) |
| 1 Vehicle | 320 (35.4%) | 177 (48.9%) |
| 2 Vehicles | 368 (40.7%) | 86 (23.8%) |
| 3 or more Vehicles | 167 (18.4%) | 24 (6.6%) |
| Total | 905 (100.0%) | 362 (100.0%) |
Real Estate & Mortgages in St Louis
Real Estate and Mortgage Overview in St Louis
| Characteristic | Without Mortgage | With Mortgage |
| Housing Units | 380 | 525 |
| Median Property Value | $117,700 | $102,800 |
| Median Household Income | $41,333 | $33 |
| Monthly Housing Costs | $579 | $0 |
| Real Estate Taxes | $2,174 | $0 |
Property Value by Mortgage Status in St Louis
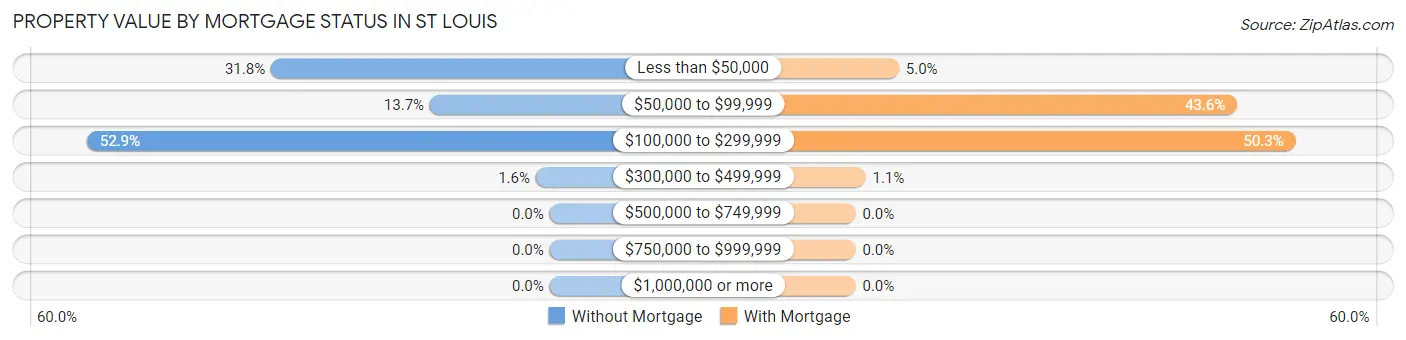
| Property Value | Without Mortgage | With Mortgage |
| Less than $50,000 | 121 (31.8%) | 26 (5.0%) |
| $50,000 to $99,999 | 52 (13.7%) | 229 (43.6%) |
| $100,000 to $299,999 | 201 (52.9%) | 264 (50.3%) |
| $300,000 to $499,999 | 6 (1.6%) | 6 (1.1%) |
| $500,000 to $749,999 | 0 (0.0%) | 0 (0.0%) |
| $750,000 to $999,999 | 0 (0.0%) | 0 (0.0%) |
| $1,000,000 or more | 0 (0.0%) | 0 (0.0%) |
| Total | 380 (100.0%) | 525 (100.0%) |
Household Income by Mortgage Status in St Louis
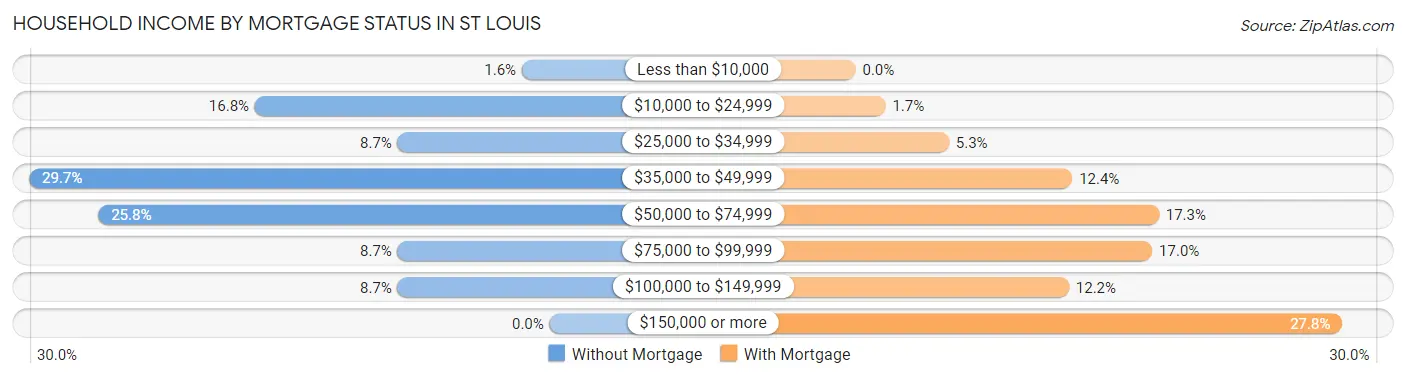
| Household Income | Without Mortgage | With Mortgage |
| Less than $10,000 | 6 (1.6%) | 0 (0.0%) |
| $10,000 to $24,999 | 64 (16.8%) | 9 (1.7%) |
| $25,000 to $34,999 | 33 (8.7%) | 28 (5.3%) |
| $35,000 to $49,999 | 113 (29.7%) | 65 (12.4%) |
| $50,000 to $74,999 | 98 (25.8%) | 91 (17.3%) |
| $75,000 to $99,999 | 33 (8.7%) | 89 (17.0%) |
| $100,000 to $149,999 | 33 (8.7%) | 64 (12.2%) |
| $150,000 or more | 0 (0.0%) | 146 (27.8%) |
| Total | 380 (100.0%) | 525 (100.0%) |
Property Value to Household Income Ratio in St Louis
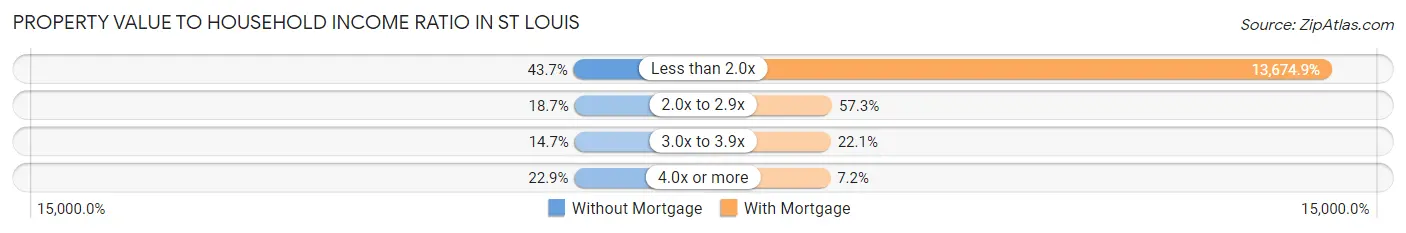
| Value-to-Income Ratio | Without Mortgage | With Mortgage |
| Less than 2.0x | 166 (43.7%) | 71,793 (13,674.9%) |
| 2.0x to 2.9x | 71 (18.7%) | 301 (57.3%) |
| 3.0x to 3.9x | 56 (14.7%) | 116 (22.1%) |
| 4.0x or more | 87 (22.9%) | 38 (7.2%) |
| Total | 380 (100.0%) | 525 (100.0%) |
Real Estate Taxes by Mortgage Status in St Louis
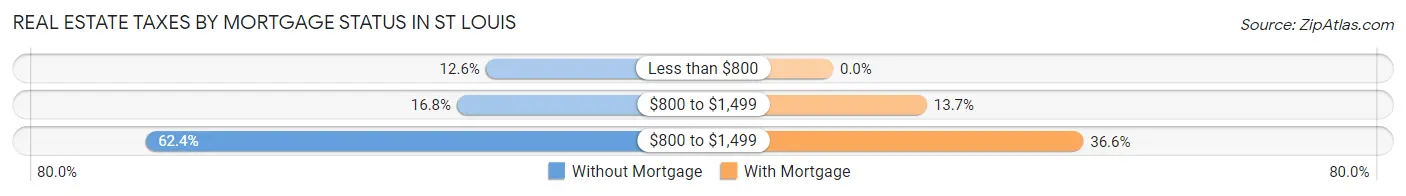
| Property Taxes | Without Mortgage | With Mortgage |
| Less than $800 | 48 (12.6%) | 0 (0.0%) |
| $800 to $1,499 | 64 (16.8%) | 72 (13.7%) |
| $800 to $1,499 | 237 (62.4%) | 192 (36.6%) |
| Total | 380 (100.0%) | 525 (100.0%) |
Health & Disability in St Louis
Health Insurance Coverage by Age in St Louis
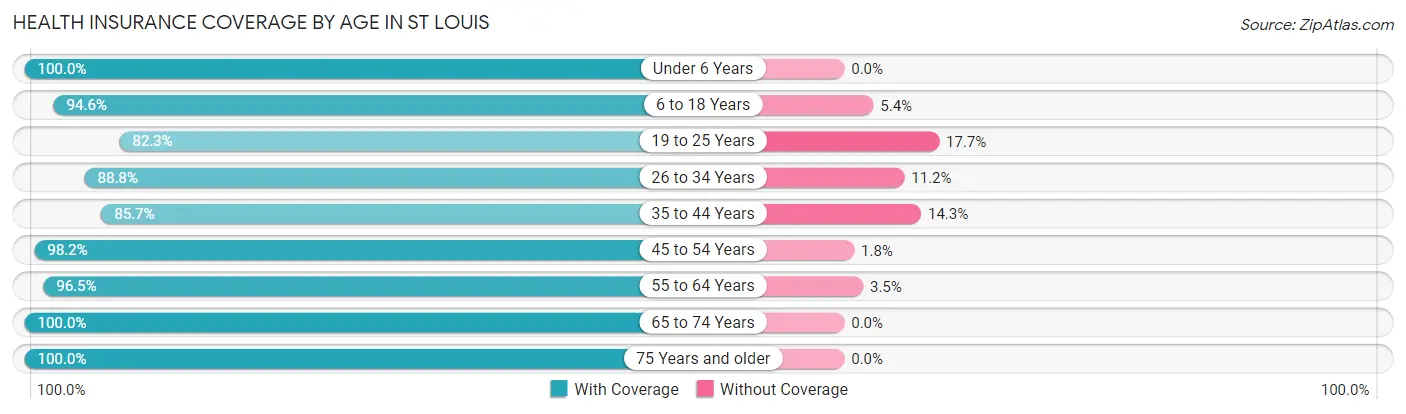
| Age Bracket | With Coverage | Without Coverage |
| Under 6 Years | 240 (100.0%) | 0 (0.0%) |
| 6 to 18 Years | 454 (94.6%) | 26 (5.4%) |
| 19 to 25 Years | 284 (82.3%) | 61 (17.7%) |
| 26 to 34 Years | 333 (88.8%) | 42 (11.2%) |
| 35 to 44 Years | 335 (85.7%) | 56 (14.3%) |
| 45 to 54 Years | 322 (98.2%) | 6 (1.8%) |
| 55 to 64 Years | 332 (96.5%) | 12 (3.5%) |
| 65 to 74 Years | 333 (100.0%) | 0 (0.0%) |
| 75 Years and older | 165 (100.0%) | 0 (0.0%) |
| Total | 2,798 (93.2%) | 203 (6.8%) |
Health Insurance Coverage by Citizenship Status in St Louis
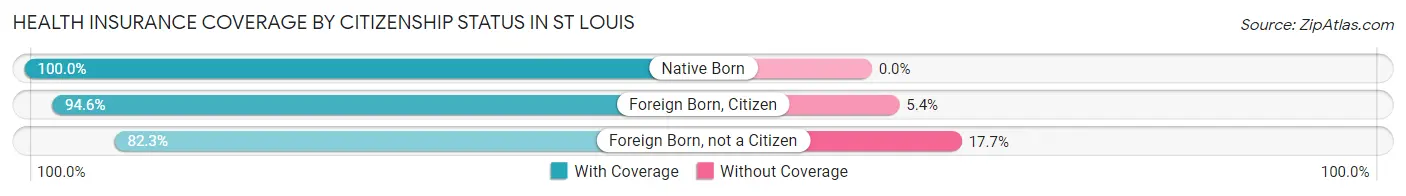
| Citizenship Status | With Coverage | Without Coverage |
| Native Born | 240 (100.0%) | 0 (0.0%) |
| Foreign Born, Citizen | 454 (94.6%) | 26 (5.4%) |
| Foreign Born, not a Citizen | 284 (82.3%) | 61 (17.7%) |
Health Insurance Coverage by Household Income in St Louis
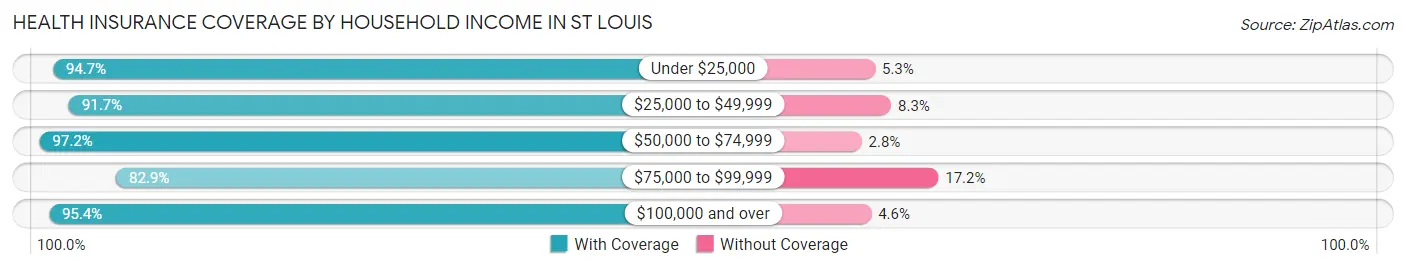
| Household Income | With Coverage | Without Coverage |
| Under $25,000 | 322 (94.7%) | 18 (5.3%) |
| $25,000 to $49,999 | 762 (91.7%) | 69 (8.3%) |
| $50,000 to $74,999 | 804 (97.2%) | 23 (2.8%) |
| $75,000 to $99,999 | 314 (82.9%) | 65 (17.2%) |
| $100,000 and over | 585 (95.4%) | 28 (4.6%) |
Public vs Private Health Insurance Coverage by Age in St Louis
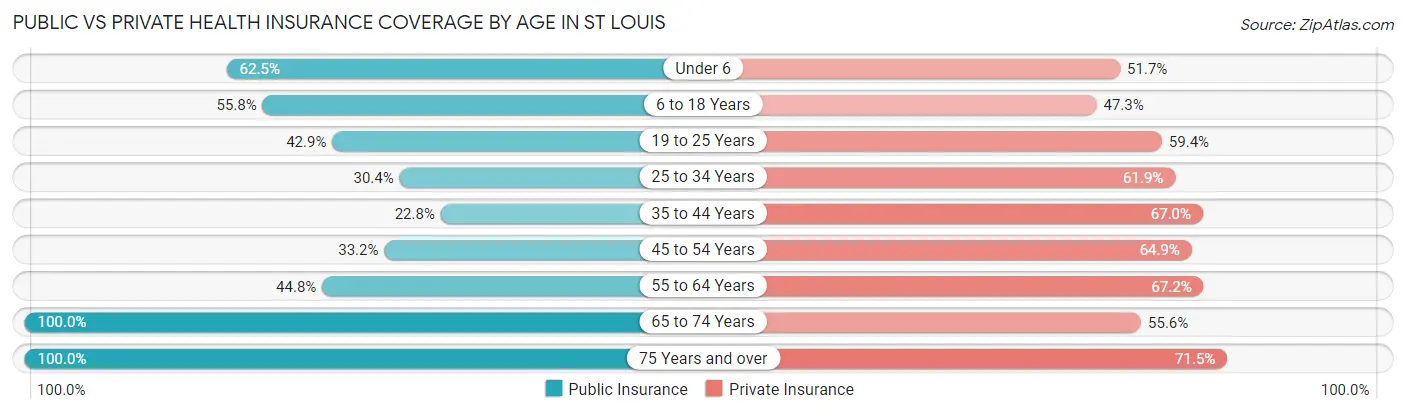
| Age Bracket | Public Insurance | Private Insurance |
| Under 6 | 150 (62.5%) | 124 (51.7%) |
| 6 to 18 Years | 268 (55.8%) | 227 (47.3%) |
| 19 to 25 Years | 148 (42.9%) | 205 (59.4%) |
| 25 to 34 Years | 114 (30.4%) | 232 (61.9%) |
| 35 to 44 Years | 89 (22.8%) | 262 (67.0%) |
| 45 to 54 Years | 109 (33.2%) | 213 (64.9%) |
| 55 to 64 Years | 154 (44.8%) | 231 (67.1%) |
| 65 to 74 Years | 333 (100.0%) | 185 (55.6%) |
| 75 Years and over | 165 (100.0%) | 118 (71.5%) |
| Total | 1,530 (51.0%) | 1,797 (59.9%) |
Disability Status by Sex by Age in St Louis
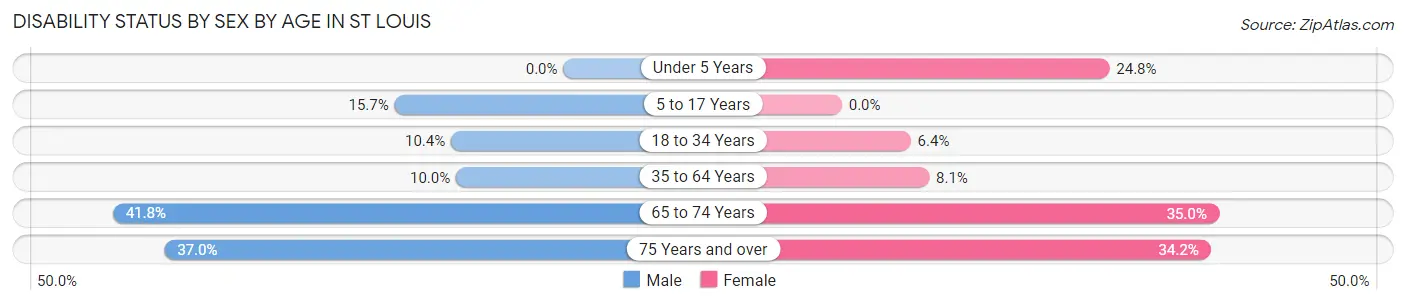
| Age Bracket | Male | Female |
| Under 5 Years | 0 (0.0%) | 37 (24.8%) |
| 5 to 17 Years | 47 (15.7%) | 0 (0.0%) |
| 18 to 34 Years | 32 (10.4%) | 29 (6.4%) |
| 35 to 64 Years | 53 (10.0%) | 43 (8.1%) |
| 65 to 74 Years | 46 (41.8%) | 78 (35.0%) |
| 75 Years and over | 20 (37.0%) | 38 (34.2%) |
Disability Class by Sex by Age in St Louis
Disability Class: Hearing Difficulty
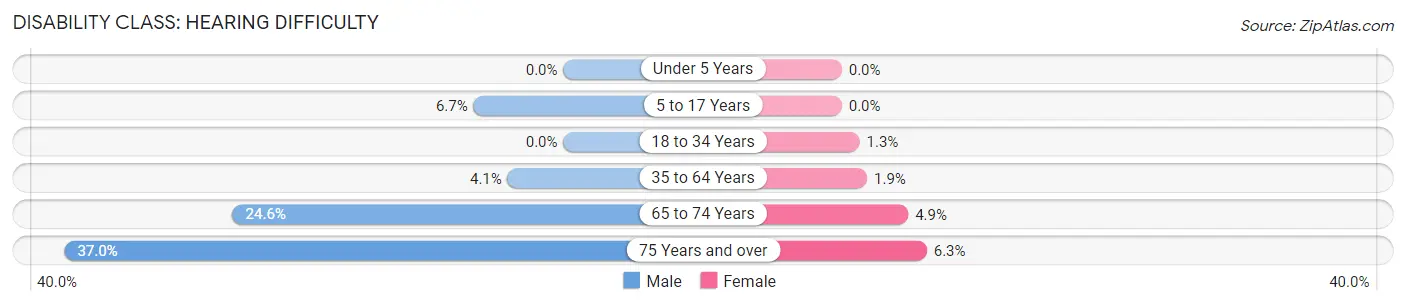
| Age Bracket | Male | Female |
| Under 5 Years | 0 (0.0%) | 0 (0.0%) |
| 5 to 17 Years | 20 (6.7%) | 0 (0.0%) |
| 18 to 34 Years | 0 (0.0%) | 6 (1.3%) |
| 35 to 64 Years | 22 (4.1%) | 10 (1.9%) |
| 65 to 74 Years | 27 (24.5%) | 11 (4.9%) |
| 75 Years and over | 20 (37.0%) | 7 (6.3%) |
Disability Class: Vision Difficulty
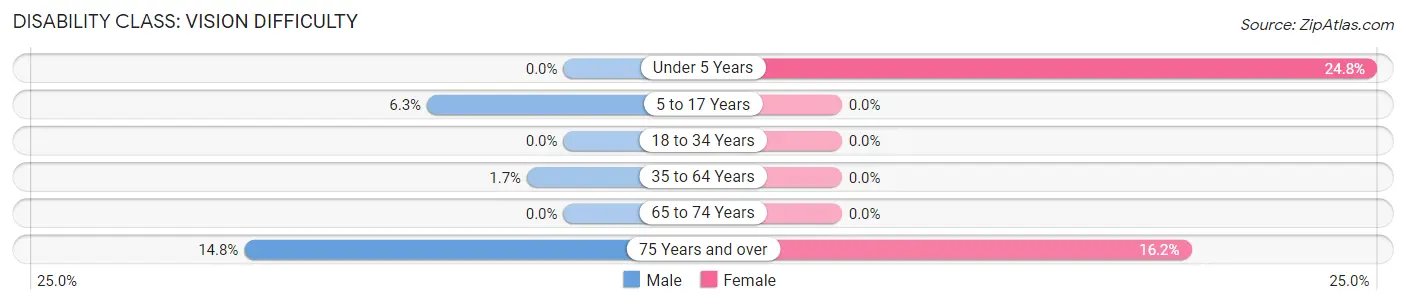
| Age Bracket | Male | Female |
| Under 5 Years | 0 (0.0%) | 37 (24.8%) |
| 5 to 17 Years | 19 (6.3%) | 0 (0.0%) |
| 18 to 34 Years | 0 (0.0%) | 0 (0.0%) |
| 35 to 64 Years | 9 (1.7%) | 0 (0.0%) |
| 65 to 74 Years | 0 (0.0%) | 0 (0.0%) |
| 75 Years and over | 8 (14.8%) | 18 (16.2%) |
Disability Class: Cognitive Difficulty
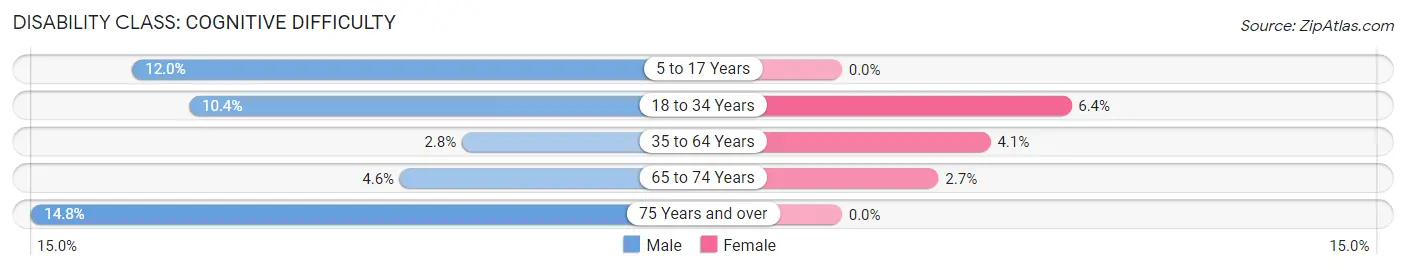
| Age Bracket | Male | Female |
| 5 to 17 Years | 36 (12.0%) | 0 (0.0%) |
| 18 to 34 Years | 32 (10.4%) | 29 (6.4%) |
| 35 to 64 Years | 15 (2.8%) | 22 (4.1%) |
| 65 to 74 Years | 5 (4.5%) | 6 (2.7%) |
| 75 Years and over | 8 (14.8%) | 0 (0.0%) |
Disability Class: Ambulatory Difficulty
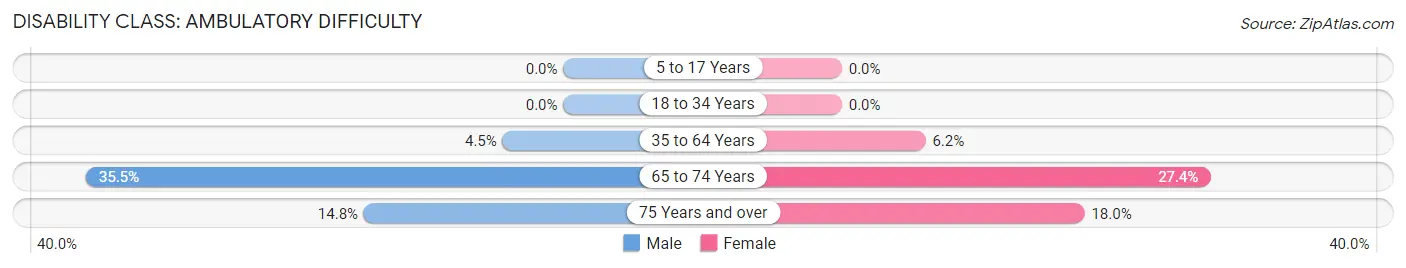
| Age Bracket | Male | Female |
| 5 to 17 Years | 0 (0.0%) | 0 (0.0%) |
| 18 to 34 Years | 0 (0.0%) | 0 (0.0%) |
| 35 to 64 Years | 24 (4.5%) | 33 (6.2%) |
| 65 to 74 Years | 39 (35.4%) | 61 (27.4%) |
| 75 Years and over | 8 (14.8%) | 20 (18.0%) |
Disability Class: Self-Care Difficulty
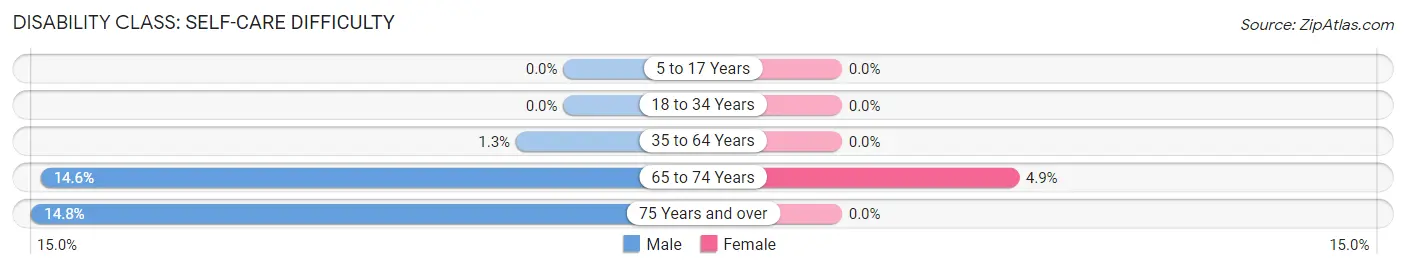
| Age Bracket | Male | Female |
| 5 to 17 Years | 0 (0.0%) | 0 (0.0%) |
| 18 to 34 Years | 0 (0.0%) | 0 (0.0%) |
| 35 to 64 Years | 7 (1.3%) | 0 (0.0%) |
| 65 to 74 Years | 16 (14.5%) | 11 (4.9%) |
| 75 Years and over | 8 (14.8%) | 0 (0.0%) |
Technology Access in St Louis
Computing Device Access in St Louis
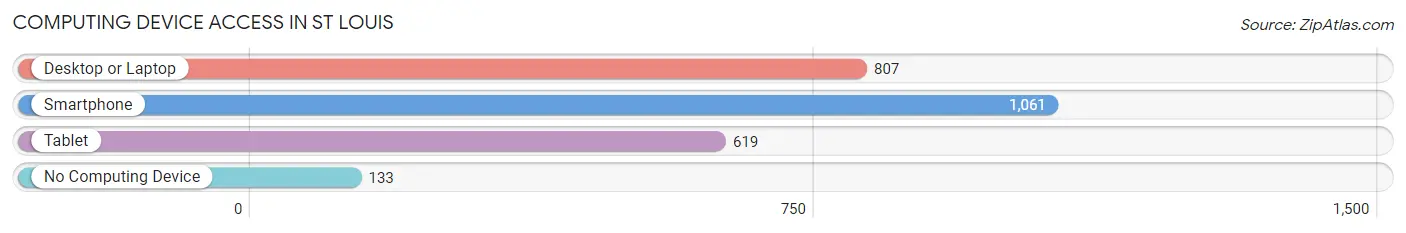
| Device Type | # Households | % Households |
| Desktop or Laptop | 807 | 63.7% |
| Smartphone | 1,061 | 83.7% |
| Tablet | 619 | 48.9% |
| No Computing Device | 133 | 10.5% |
| Total | 1,267 | 100.0% |
Internet Access in St Louis
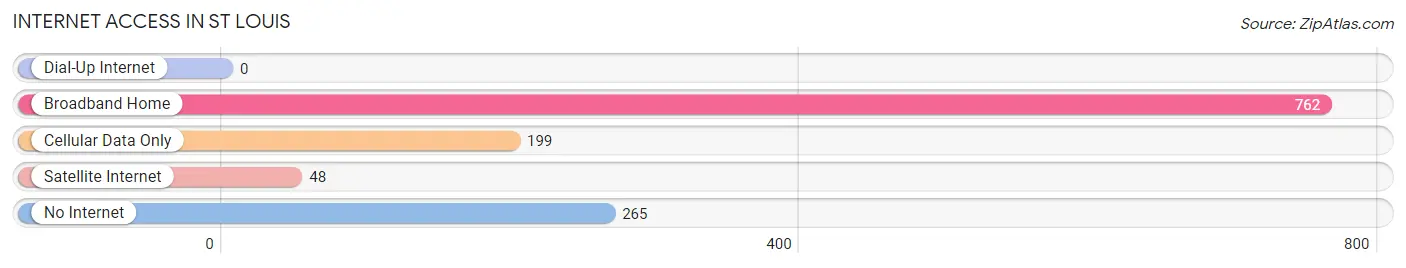
| Internet Type | # Households | % Households |
| Dial-Up Internet | 0 | 0.0% |
| Broadband Home | 762 | 60.1% |
| Cellular Data Only | 199 | 15.7% |
| Satellite Internet | 48 | 3.8% |
| No Internet | 265 | 20.9% |
| Total | 1,267 | 100.0% |
St Louis Summary
St. Louis, Michigan is a small city located in Gratiot County in the state of Michigan. It is situated on the banks of the Pine River, approximately 30 miles northeast of Lansing, the state capital. The city has a population of approximately 3,000 people and is the county seat of Gratiot County.
History
St. Louis was founded in 1845 by a group of settlers from New York. The city was named after Louis Gratiot, a French-Canadian fur trader who had explored the area in the early 1800s. The city was incorporated in 1859 and quickly became a hub of commerce and industry. The city was home to several factories, including a woolen mill, a sawmill, a grist mill, and a paper mill.
In the late 1800s, St. Louis was a major stop on the Grand Trunk Railroad, which connected the city to Detroit and Chicago. This allowed the city to become a major shipping center for the region. The city also became a popular tourist destination, with several hotels and resorts being built in the area.
Geography
St. Louis is located in the central part of Michigan, approximately 30 miles northeast of Lansing. The city is situated on the banks of the Pine River, which flows through the city and into the Saginaw Bay. The city is surrounded by rolling hills and farmland, with the Pine River Valley to the east and the Shiawassee River Valley to the west.
The city has a total area of 2.3 square miles, with 0.2 square miles of water. The city has a humid continental climate, with cold winters and hot, humid summers.
Economy
St. Louis is a small city with a diverse economy. The city is home to several manufacturing companies, including a paper mill, a sawmill, and a grist mill. The city is also home to several retail stores, restaurants, and other businesses.
The city is also home to several educational institutions, including a community college and a technical school. The city is also home to several medical facilities, including a hospital and several clinics.
Demographics
As of the 2010 census, St. Louis had a population of 3,000 people. The racial makeup of the city was 95.3% White, 0.7% African American, 0.3% Native American, 0.7% Asian, 0.3% from other races, and 2.0% from two or more races. Hispanic or Latino of any race were 1.3% of the population.
The median income for a household in the city was $37,500, and the median income for a family was $45,000. The per capita income for the city was $19,000. About 11.7% of families and 14.3% of the population were below the poverty line, including 18.2% of those under age 18 and 8.3% of those age 65 or over.
Common Questions
What is Per Capita Income in St Louis?
Per Capita income in St Louis is $12,451.
What is the Median Family Income in St Louis?
Median Family Income in St Louis is $57,016.
What is the Median Household income in St Louis?
Median Household Income in St Louis is $47,662.
What is Income or Wage Gap in St Louis?
Income or Wage Gap in St Louis is 14.5%.
Women in St Louis earn 85.5 cents for every dollar earned by a man.
What is Family Income Deficit in St Louis?
Family Income Deficit in St Louis is $10,201.
Families that are below poverty line in St Louis earn $10,201 less on average than the poverty threshold level.
What is Inequality or Gini Index in St Louis?
Inequality or Gini Index in St Louis is 0.41.
What is the Total Population of St Louis?
Total Population of St Louis is 6,932.
What is the Total Male Population of St Louis?
Total Male Population of St Louis is 5,212.
What is the Total Female Population of St Louis?
Total Female Population of St Louis is 1,720.
What is the Ratio of Males per 100 Females in St Louis?
There are 303.02 Males per 100 Females in St Louis.
What is the Ratio of Females per 100 Males in St Louis?
There are 33.00 Females per 100 Males in St Louis.
What is the Median Population Age in St Louis?
Median Population Age in St Louis is 38.4 Years.
What is the Average Family Size in St Louis
Average Family Size in St Louis is 2.9 People.
What is the Average Household Size in St Louis
Average Household Size in St Louis is 2.4 People.
How Large is the Labor Force in St Louis?
There are 1,338 People in the Labor Forcein in St Louis.
What is the Percentage of People in the Labor Force in St Louis?
21.1% of People are in the Labor Force in St Louis.
What is the Unemployment Rate in St Louis?
Unemployment Rate in St Louis is 6.1%.