Fennville, MI Map & Demographics
Fennville Map
Fennville Overview
$28,697
PER CAPITA INCOME
$60,714
AVG FAMILY INCOME
$55,625
AVG HOUSEHOLD INCOME
48.4%
WAGE / INCOME GAP [ % ]
51.6¢/ $1
WAGE / INCOME GAP [ $ ]
0.54
INEQUALITY / GINI INDEX
1,876
TOTAL POPULATION
901
MALE POPULATION
975
FEMALE POPULATION
92.41
MALES / 100 FEMALES
108.21
FEMALES / 100 MALES
27.7
MEDIAN AGE
3.2
AVG FAMILY SIZE
2.9
AVG HOUSEHOLD SIZE
885
LABOR FORCE [ PEOPLE ]
62.2%
PERCENT IN LABOR FORCE
4.7%
UNEMPLOYMENT RATE
Fennville Zip Codes
Fennville Area Codes
Income in Fennville
Income Overview in Fennville
Per Capita Income in Fennville is $28,697, while median incomes of families and households are $60,714 and $55,625 respectively.
| Characteristic | Number | Measure |
| Per Capita Income | 1,876 | $28,697 |
| Median Family Income | 492 | $60,714 |
| Mean Family Income | 492 | $71,251 |
| Median Household Income | 645 | $55,625 |
| Mean Household Income | 645 | $87,483 |
| Income Deficit | 492 | $0 |
| Wage / Income Gap (%) | 1,876 | 48.40% |
| Wage / Income Gap ($) | 1,876 | 51.60¢ per $1 |
| Gini / Inequality Index | 1,876 | 0.54 |
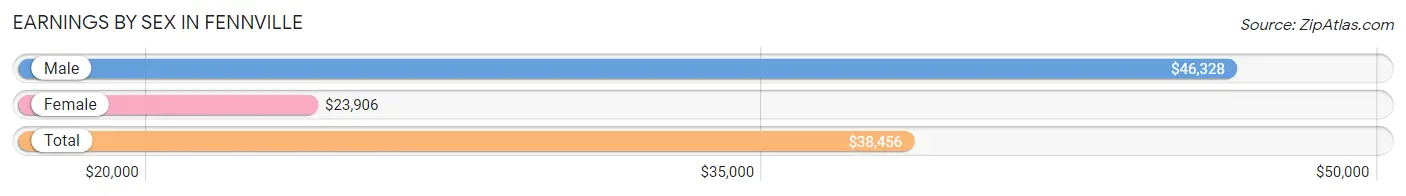
Earnings by Sex in Fennville
Average Earnings in Fennville are $38,456, $46,328 for men and $23,906 for women, a difference of 48.4%.
| Sex | Number | Average Earnings |
| Male | 542 (59.1%) | $46,328 |
| Female | 375 (40.9%) | $23,906 |
| Total | 917 (100.0%) | $38,456 |
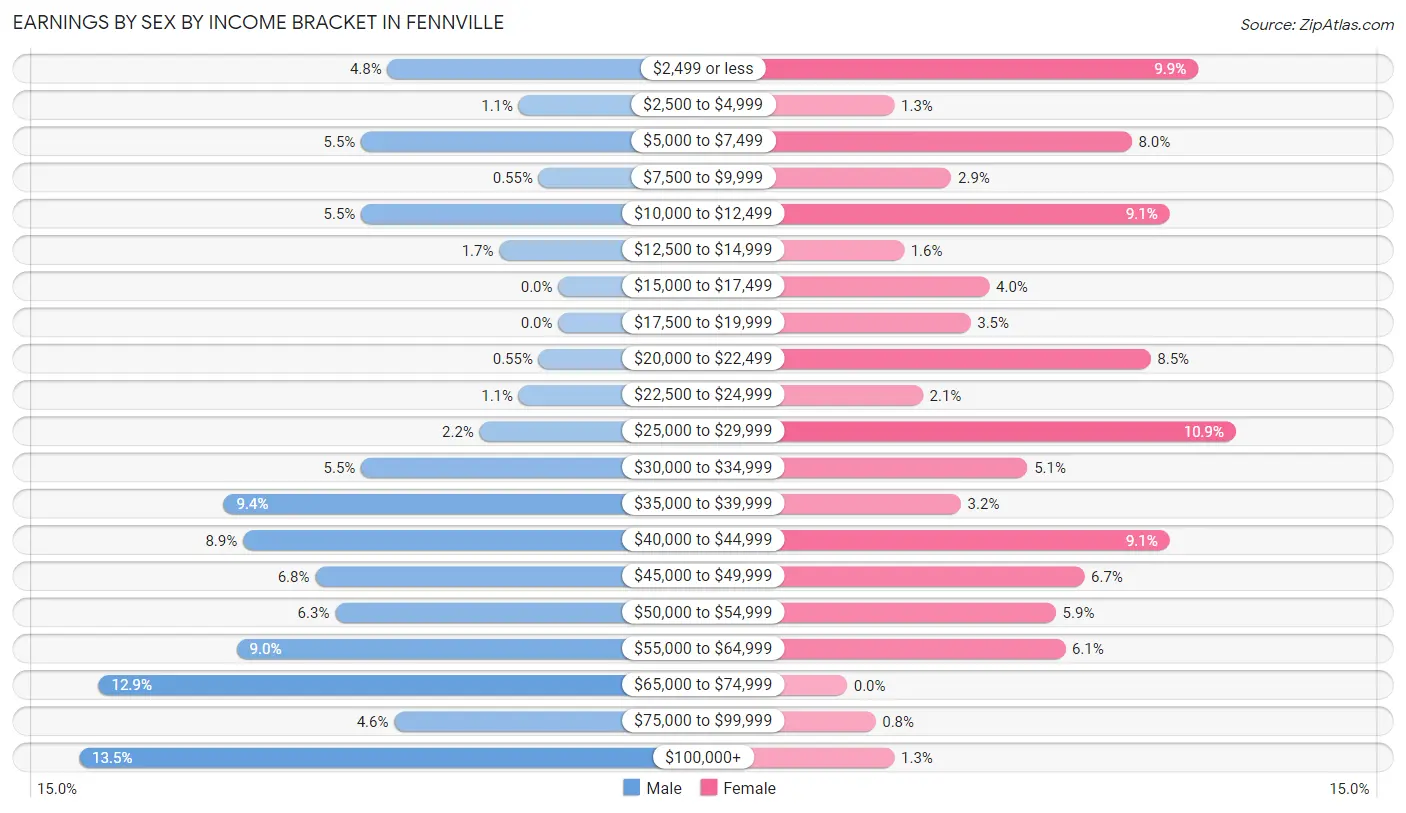
Earnings by Sex by Income Bracket in Fennville
The most common earnings brackets in Fennville are $100,000+ for men (73 | 13.5%) and $25,000 to $29,999 for women (41 | 10.9%).
| Income | Male | Female |
| $2,499 or less | 26 (4.8%) | 37 (9.9%) |
| $2,500 to $4,999 | 6 (1.1%) | 5 (1.3%) |
| $5,000 to $7,499 | 30 (5.5%) | 30 (8.0%) |
| $7,500 to $9,999 | 3 (0.5%) | 11 (2.9%) |
| $10,000 to $12,499 | 30 (5.5%) | 34 (9.1%) |
| $12,500 to $14,999 | 9 (1.7%) | 6 (1.6%) |
| $15,000 to $17,499 | 0 (0.0%) | 15 (4.0%) |
| $17,500 to $19,999 | 0 (0.0%) | 13 (3.5%) |
| $20,000 to $22,499 | 3 (0.5%) | 32 (8.5%) |
| $22,500 to $24,999 | 6 (1.1%) | 8 (2.1%) |
| $25,000 to $29,999 | 12 (2.2%) | 41 (10.9%) |
| $30,000 to $34,999 | 30 (5.5%) | 19 (5.1%) |
| $35,000 to $39,999 | 51 (9.4%) | 12 (3.2%) |
| $40,000 to $44,999 | 48 (8.9%) | 34 (9.1%) |
| $45,000 to $49,999 | 37 (6.8%) | 25 (6.7%) |
| $50,000 to $54,999 | 34 (6.3%) | 22 (5.9%) |
| $55,000 to $64,999 | 49 (9.0%) | 23 (6.1%) |
| $65,000 to $74,999 | 70 (12.9%) | 0 (0.0%) |
| $75,000 to $99,999 | 25 (4.6%) | 3 (0.8%) |
| $100,000+ | 73 (13.5%) | 5 (1.3%) |
| Total | 542 (100.0%) | 375 (100.0%) |
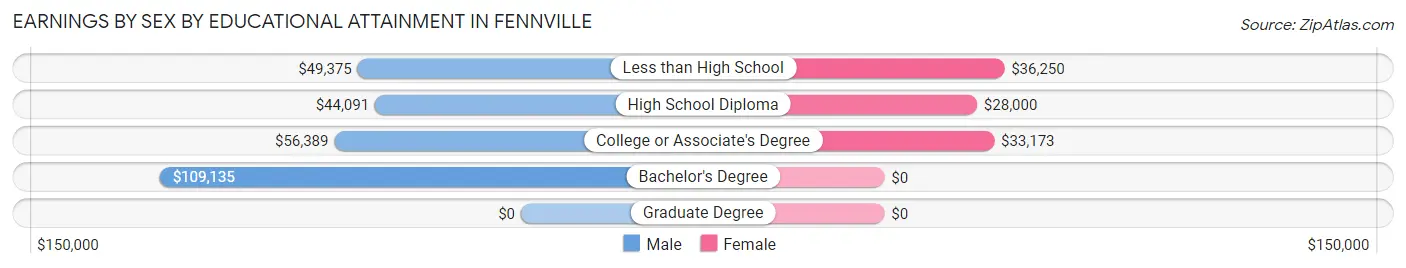
Earnings by Sex by Educational Attainment in Fennville
Average earnings in Fennville are $54,279 for men and $30,000 for women, a difference of 44.7%. Men with an educational attainment of bachelor's degree enjoy the highest average annual earnings of $109,135, while those with high school diploma education earn the least with $44,091. Women with an educational attainment of less than high school earn the most with the average annual earnings of $36,250, while those with high school diploma education have the smallest earnings of $28,000.
| Educational Attainment | Male Income | Female Income |
| Less than High School | $49,375 | $36,250 |
| High School Diploma | $44,091 | $28,000 |
| College or Associate's Degree | $56,389 | $33,173 |
| Bachelor's Degree | $109,135 | $0 |
| Graduate Degree | - | - |
| Total | $54,279 | $30,000 |
Family Income in Fennville
Family Income Brackets in Fennville
According to the Fennville family income data, there are 109 families falling into the $100,000 to $149,999 income range, which is the most common income bracket and makes up 22.2% of all families.
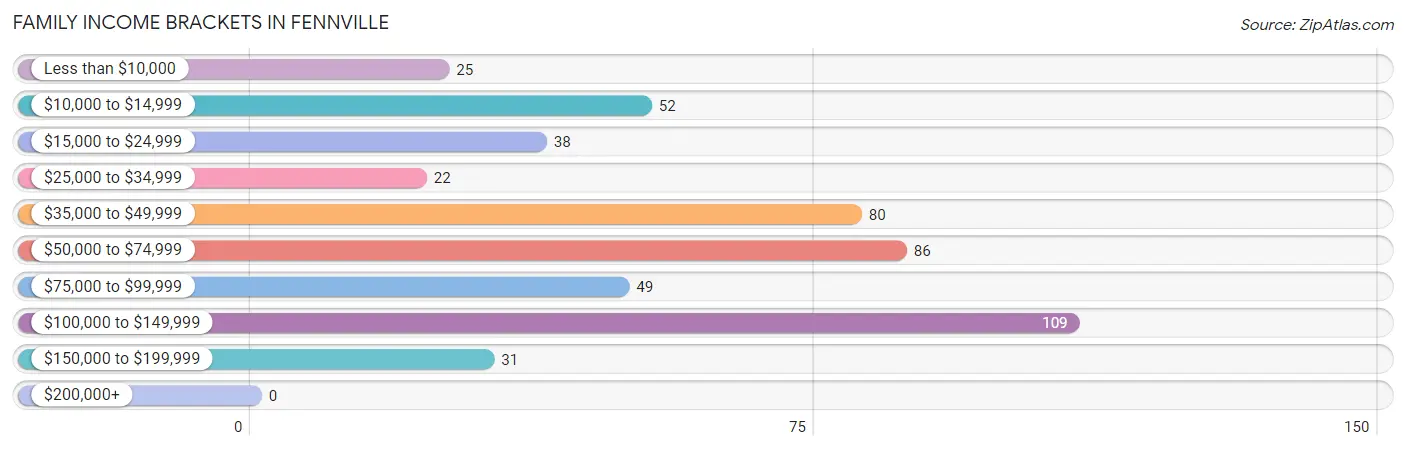
| Income Bracket | # Families | % Families |
| Less than $10,000 | 25 | 5.1% |
| $10,000 to $14,999 | 52 | 10.6% |
| $15,000 to $24,999 | 38 | 7.7% |
| $25,000 to $34,999 | 22 | 4.5% |
| $35,000 to $49,999 | 80 | 16.3% |
| $50,000 to $74,999 | 86 | 17.5% |
| $75,000 to $99,999 | 49 | 10.0% |
| $100,000 to $149,999 | 109 | 22.2% |
| $150,000 to $199,999 | 31 | 6.3% |
| $200,000+ | 0 | 0.0% |
Family Income by Famaliy Size in Fennville
4-person families (76 | 15.4%) account for the highest median family income in Fennville with $74,038 per family, while 2-person families (187 | 38.0%) have the highest median income of $20,027 per family member.
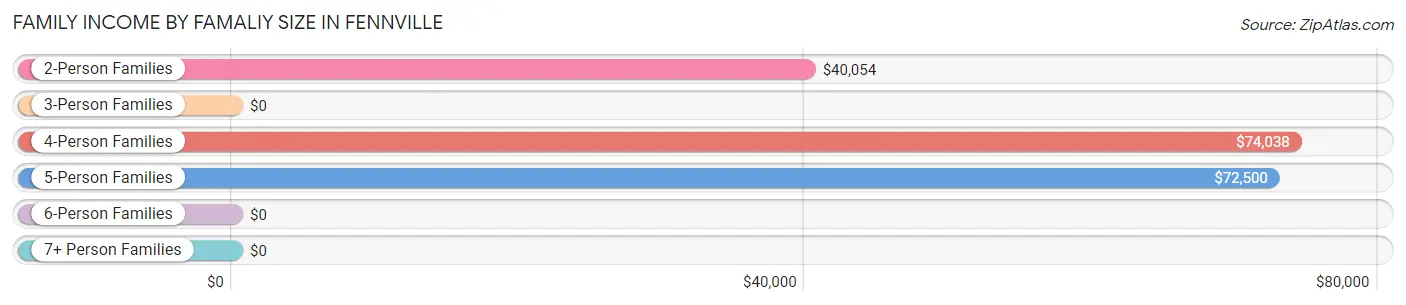
| Income Bracket | # Families | Median Income |
| 2-Person Families | 187 (38.0%) | $40,054 |
| 3-Person Families | 158 (32.1%) | $0 |
| 4-Person Families | 76 (15.4%) | $74,038 |
| 5-Person Families | 28 (5.7%) | $72,500 |
| 6-Person Families | 38 (7.7%) | $0 |
| 7+ Person Families | 5 (1.0%) | $0 |
| Total | 492 (100.0%) | $60,714 |
Family Income by Number of Earners in Fennville
The median family income in Fennville is $60,714, with families comprising 3+ earners (47) having the highest median family income of $146,875, while families with no earners (71) have the lowest median family income of $19,107, accounting for 9.6% and 14.4% of families, respectively.
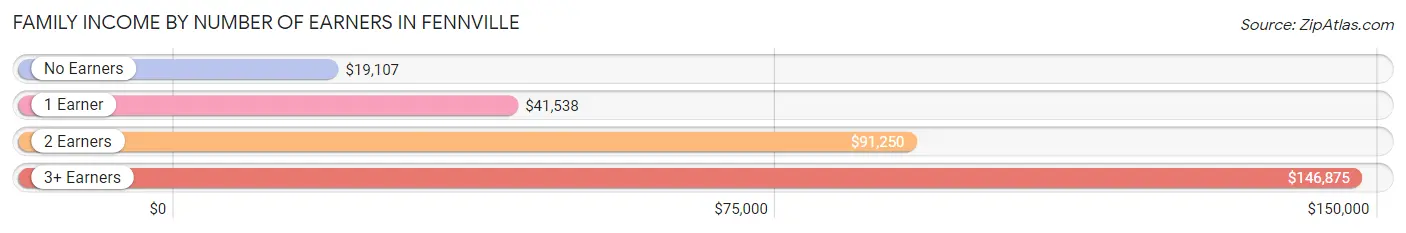
| Number of Earners | # Families | Median Income |
| No Earners | 71 (14.4%) | $19,107 |
| 1 Earner | 182 (37.0%) | $41,538 |
| 2 Earners | 192 (39.0%) | $91,250 |
| 3+ Earners | 47 (9.6%) | $146,875 |
| Total | 492 (100.0%) | $60,714 |
Household Income in Fennville
Household Income Brackets in Fennville
With 119 households falling in the category, the $100,000 to $149,999 income range is the most frequent in Fennville, accounting for 18.4% of all households. In contrast, only 12 households (1.9%) fall into the $200,000+ income bracket, making it the least populous group.
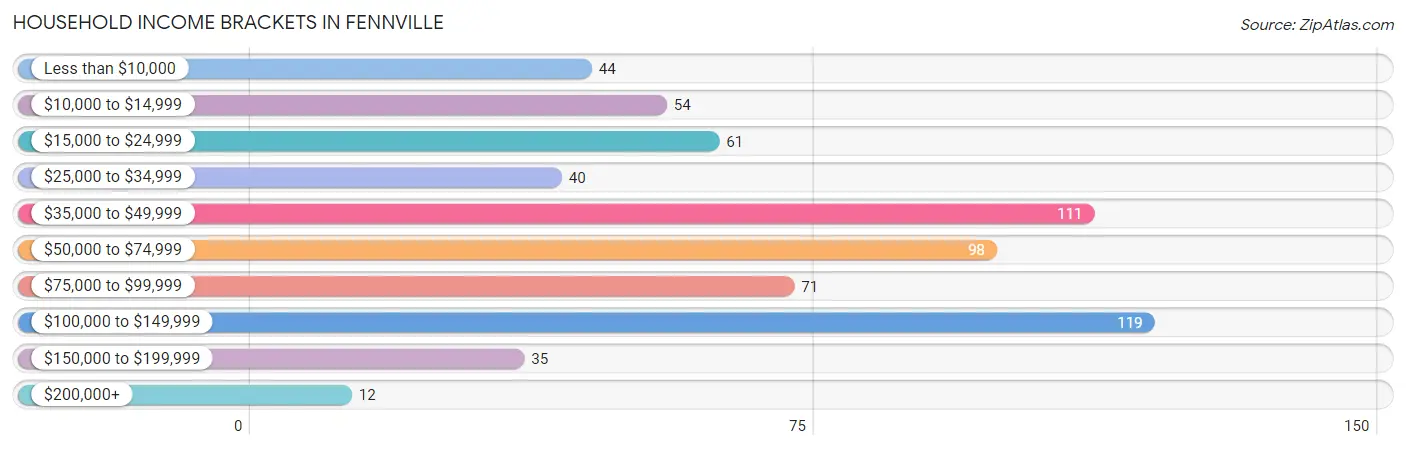
| Income Bracket | # Households | % Households |
| Less than $10,000 | 44 | 6.8% |
| $10,000 to $14,999 | 54 | 8.4% |
| $15,000 to $24,999 | 61 | 9.5% |
| $25,000 to $34,999 | 40 | 6.2% |
| $35,000 to $49,999 | 111 | 17.2% |
| $50,000 to $74,999 | 98 | 15.2% |
| $75,000 to $99,999 | 71 | 11.0% |
| $100,000 to $149,999 | 119 | 18.4% |
| $150,000 to $199,999 | 35 | 5.4% |
| $200,000+ | 12 | 1.9% |
Household Income by Householder Age in Fennville
The median household income in Fennville is $55,625, with the highest median household income of $71,250 found in the 45 to 64 years age bracket for the primary householder. A total of 233 households (36.1%) fall into this category. Meanwhile, the 15 to 24 years age bracket for the primary householder has the lowest median household income of $0, with 39 households (6.0%) in this group.
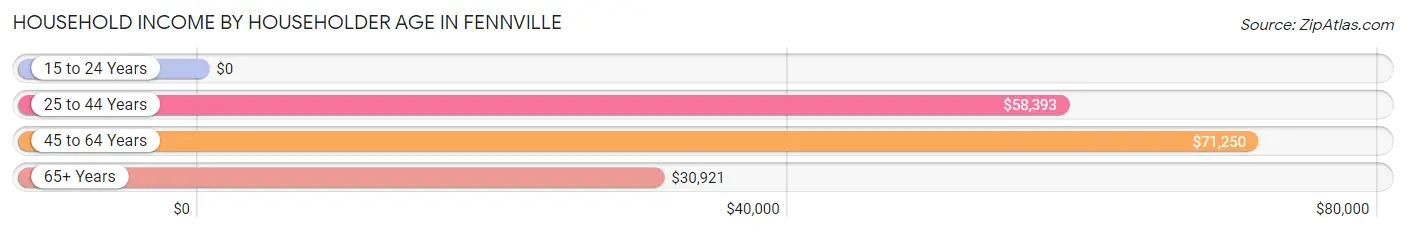
| Income Bracket | # Households | Median Income |
| 15 to 24 Years | 39 (6.0%) | $0 |
| 25 to 44 Years | 267 (41.4%) | $58,393 |
| 45 to 64 Years | 233 (36.1%) | $71,250 |
| 65+ Years | 106 (16.4%) | $30,921 |
| Total | 645 (100.0%) | $55,625 |
Poverty in Fennville
Income Below Poverty by Sex and Age in Fennville
With 16.8% poverty level for males and 29.2% for females among the residents of Fennville, 5 year old males and 35 to 44 year old females are the most vulnerable to poverty, with 11 males (78.6%) and 61 females (51.3%) in their respective age groups living below the poverty level.
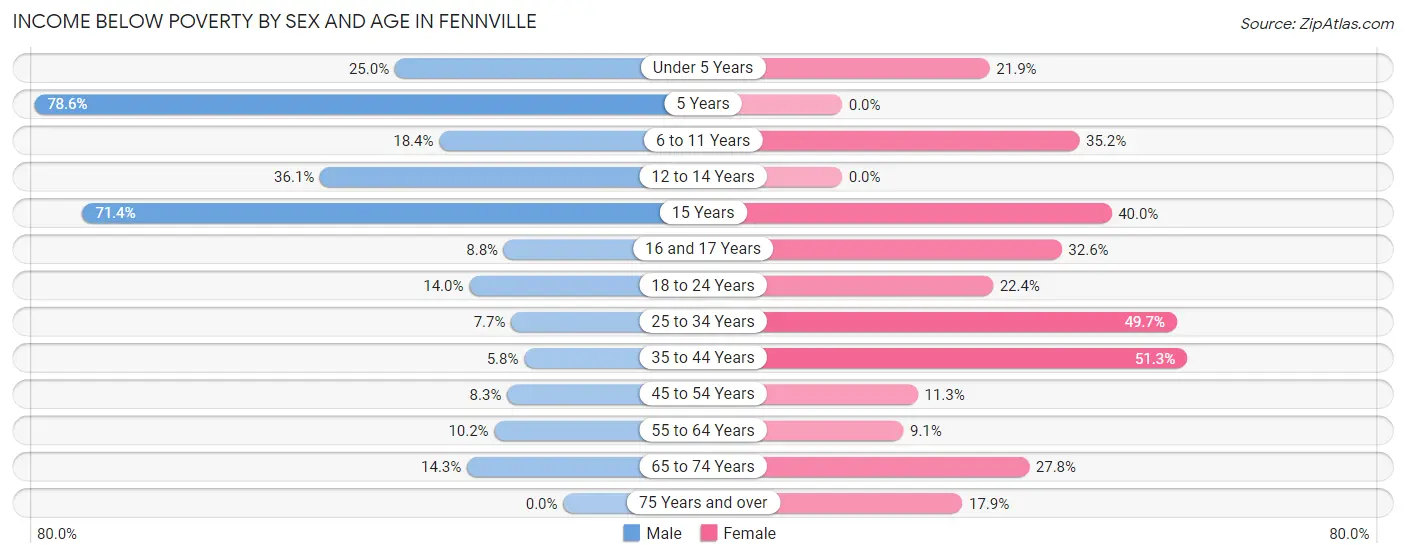
| Age Bracket | Male | Female |
| Under 5 Years | 13 (25.0%) | 16 (21.9%) |
| 5 Years | 11 (78.6%) | 0 (0.0%) |
| 6 to 11 Years | 14 (18.4%) | 31 (35.2%) |
| 12 to 14 Years | 13 (36.1%) | 0 (0.0%) |
| 15 Years | 35 (71.4%) | 4 (40.0%) |
| 16 and 17 Years | 3 (8.8%) | 15 (32.6%) |
| 18 to 24 Years | 19 (14.0%) | 26 (22.4%) |
| 25 to 34 Years | 17 (7.7%) | 92 (49.7%) |
| 35 to 44 Years | 4 (5.8%) | 61 (51.3%) |
| 45 to 54 Years | 6 (8.3%) | 9 (11.3%) |
| 55 to 64 Years | 9 (10.2%) | 11 (9.1%) |
| 65 to 74 Years | 7 (14.3%) | 15 (27.8%) |
| 75 Years and over | 0 (0.0%) | 5 (17.9%) |
| Total | 151 (16.8%) | 285 (29.2%) |
Income Above Poverty by Sex and Age in Fennville
According to the poverty statistics in Fennville, males aged 75 years and over and females aged 5 years are the age groups that are most secure financially, with 100.0% of males and 100.0% of females in these age groups living above the poverty line.
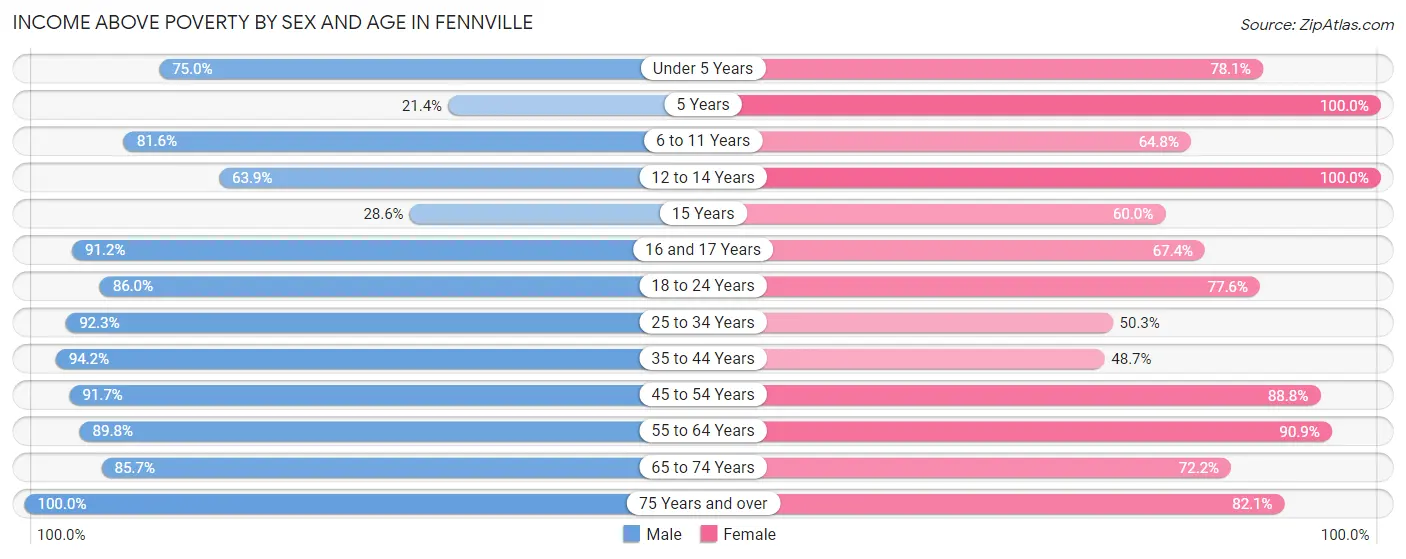
| Age Bracket | Male | Female |
| Under 5 Years | 39 (75.0%) | 57 (78.1%) |
| 5 Years | 3 (21.4%) | 13 (100.0%) |
| 6 to 11 Years | 62 (81.6%) | 57 (64.8%) |
| 12 to 14 Years | 23 (63.9%) | 42 (100.0%) |
| 15 Years | 14 (28.6%) | 6 (60.0%) |
| 16 and 17 Years | 31 (91.2%) | 31 (67.4%) |
| 18 to 24 Years | 117 (86.0%) | 90 (77.6%) |
| 25 to 34 Years | 203 (92.3%) | 93 (50.3%) |
| 35 to 44 Years | 65 (94.2%) | 58 (48.7%) |
| 45 to 54 Years | 66 (91.7%) | 71 (88.7%) |
| 55 to 64 Years | 79 (89.8%) | 110 (90.9%) |
| 65 to 74 Years | 42 (85.7%) | 39 (72.2%) |
| 75 Years and over | 6 (100.0%) | 23 (82.1%) |
| Total | 750 (83.2%) | 690 (70.8%) |
Income Below Poverty Among Married-Couple Families in Fennville
The poverty statistics for married-couple families in Fennville show that 3.9% or 10 of the total 258 families live below the poverty line. Families with no children have the highest poverty rate of 5.2%, comprising of 7 families. On the other hand, families with 1 or 2 children have the lowest poverty rate of 2.1%, which includes 2 families.
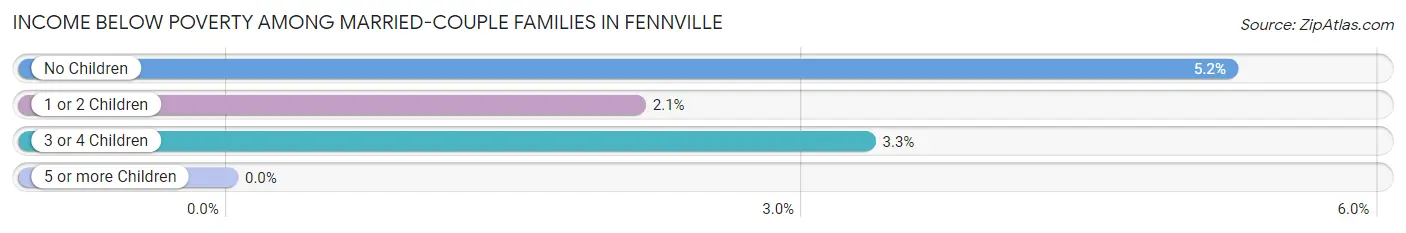
| Children | Above Poverty | Below Poverty |
| No Children | 127 (94.8%) | 7 (5.2%) |
| 1 or 2 Children | 92 (97.9%) | 2 (2.1%) |
| 3 or 4 Children | 29 (96.7%) | 1 (3.3%) |
| 5 or more Children | 0 (0.0%) | 0 (0.0%) |
| Total | 248 (96.1%) | 10 (3.9%) |
Income Below Poverty Among Single-Parent Households in Fennville
According to the poverty data in Fennville, 5.3% or 4 single-father households and 51.3% or 81 single-mother households are living below the poverty line. Among single-father households, those with 1 or 2 children have the highest poverty rate, with 4 households (8.3%) experiencing poverty. Likewise, among single-mother households, those with 3 or 4 children have the highest poverty rate, with 23 households (100.0%) falling below the poverty line.
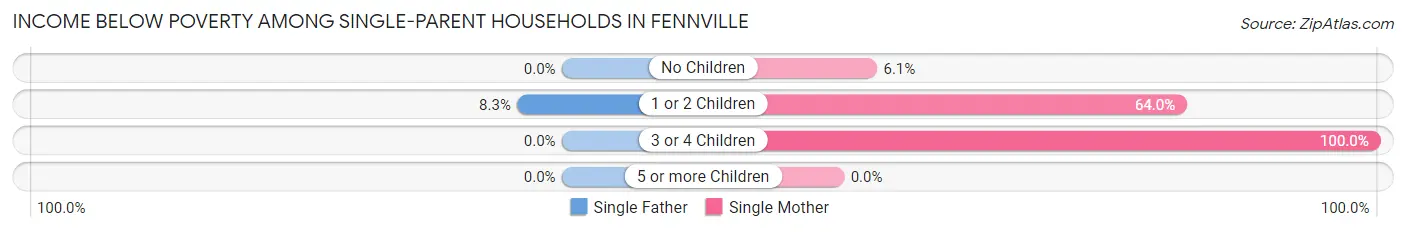
| Children | Single Father | Single Mother |
| No Children | 0 (0.0%) | 3 (6.1%) |
| 1 or 2 Children | 4 (8.3%) | 55 (63.9%) |
| 3 or 4 Children | 0 (0.0%) | 23 (100.0%) |
| 5 or more Children | 0 (0.0%) | 0 (0.0%) |
| Total | 4 (5.3%) | 81 (51.3%) |
Income Below Poverty Among Married-Couple vs Single-Parent Households in Fennville
The poverty data for Fennville shows that 10 of the married-couple family households (3.9%) and 85 of the single-parent households (36.3%) are living below the poverty level. Within the married-couple family households, those with no children have the highest poverty rate, with 7 households (5.2%) falling below the poverty line. Among the single-parent households, those with 3 or 4 children have the highest poverty rate, with 23 household (100.0%) living below poverty.
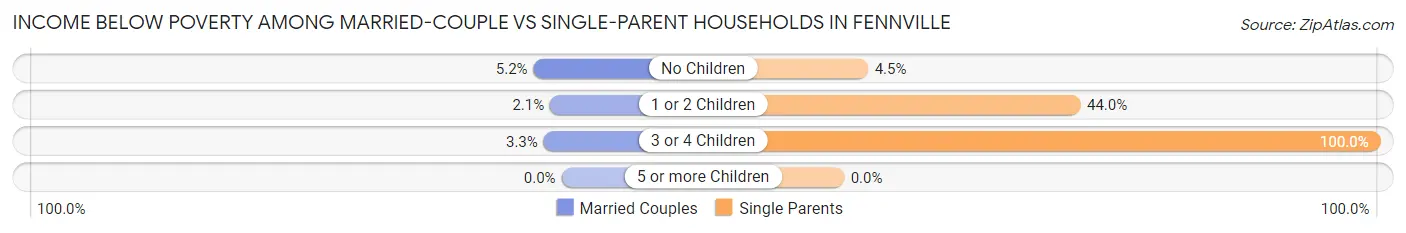
| Children | Married-Couple Families | Single-Parent Households |
| No Children | 7 (5.2%) | 3 (4.5%) |
| 1 or 2 Children | 2 (2.1%) | 59 (44.0%) |
| 3 or 4 Children | 1 (3.3%) | 23 (100.0%) |
| 5 or more Children | 0 (0.0%) | 0 (0.0%) |
| Total | 10 (3.9%) | 85 (36.3%) |
Race in Fennville
The most populous races in Fennville are White / Caucasian (1,387 | 73.9%), Hispanic or Latino (791 | 42.2%), and Two or more Races (367 | 19.6%).
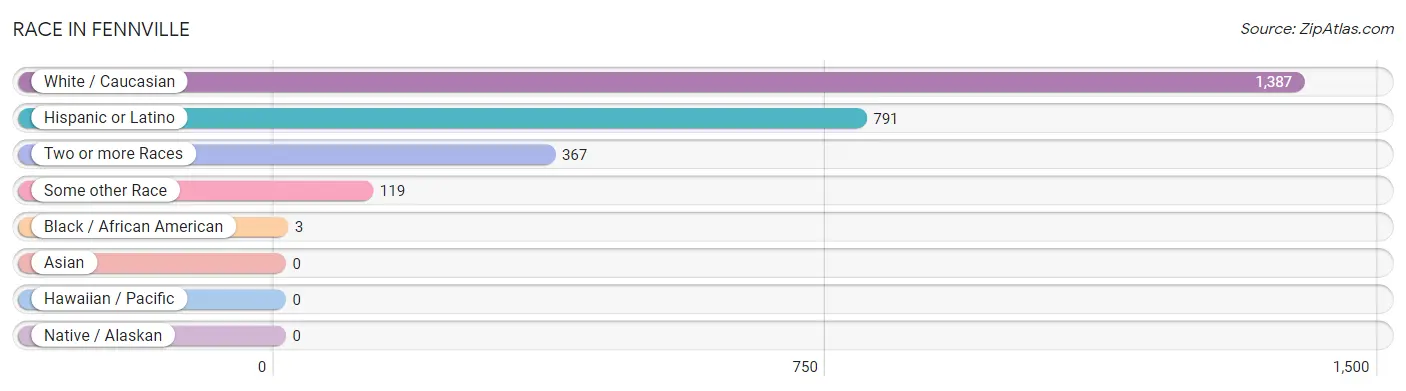
| Race | # Population | % Population |
| Asian | 0 | 0.0% |
| Black / African American | 3 | 0.2% |
| Hawaiian / Pacific | 0 | 0.0% |
| Hispanic or Latino | 791 | 42.2% |
| Native / Alaskan | 0 | 0.0% |
| White / Caucasian | 1,387 | 73.9% |
| Two or more Races | 367 | 19.6% |
| Some other Race | 119 | 6.3% |
| Total | 1,876 | 100.0% |
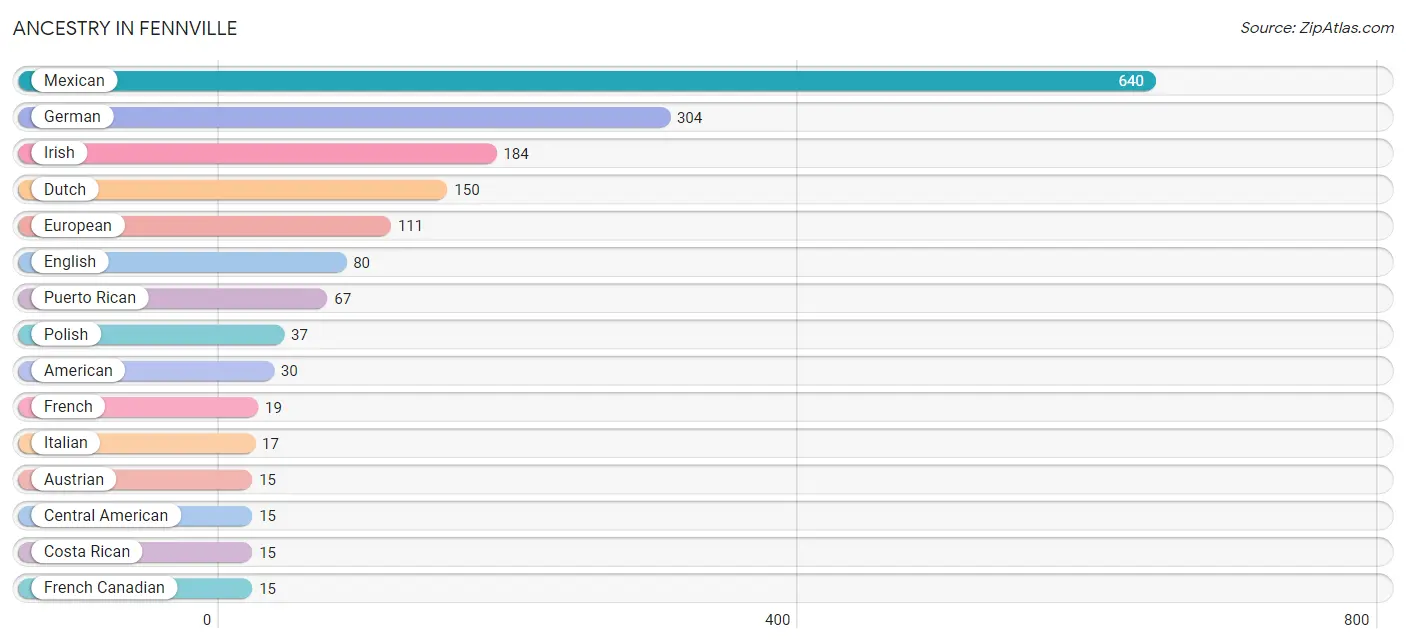
Ancestry in Fennville
The most populous ancestries reported in Fennville are Mexican (640 | 34.1%), German (304 | 16.2%), Irish (184 | 9.8%), Dutch (150 | 8.0%), and European (111 | 5.9%), together accounting for 74.0% of all Fennville residents.
| Ancestry | # Population | % Population |
| American | 30 | 1.6% |
| Austrian | 15 | 0.8% |
| Central American | 15 | 0.8% |
| Chippewa | 4 | 0.2% |
| Costa Rican | 15 | 0.8% |
| Cuban | 8 | 0.4% |
| Czech | 3 | 0.2% |
| Danish | 5 | 0.3% |
| Dutch | 150 | 8.0% |
| English | 80 | 4.3% |
| European | 111 | 5.9% |
| French | 19 | 1.0% |
| French Canadian | 15 | 0.8% |
| German | 304 | 16.2% |
| Hungarian | 14 | 0.7% |
| Irish | 184 | 9.8% |
| Italian | 17 | 0.9% |
| Korean | 10 | 0.5% |
| Malaysian | 2 | 0.1% |
| Mexican | 640 | 34.1% |
| Polish | 37 | 2.0% |
| Puerto Rican | 67 | 3.6% |
| Russian | 13 | 0.7% |
| Scotch-Irish | 3 | 0.2% |
| Scottish | 12 | 0.6% |
| Spaniard | 8 | 0.4% |
| Spanish | 14 | 0.7% |
| Swedish | 6 | 0.3% |
| Welsh | 3 | 0.2% | View All 29 Rows |
Immigrants in Fennville
The most numerous immigrant groups reported in Fennville came from Central America (148 | 7.9%), Latin America (148 | 7.9%), Mexico (133 | 7.1%), Costa Rica (15 | 0.8%), and Austria (3 | 0.2%), together accounting for 23.8% of all Fennville residents.
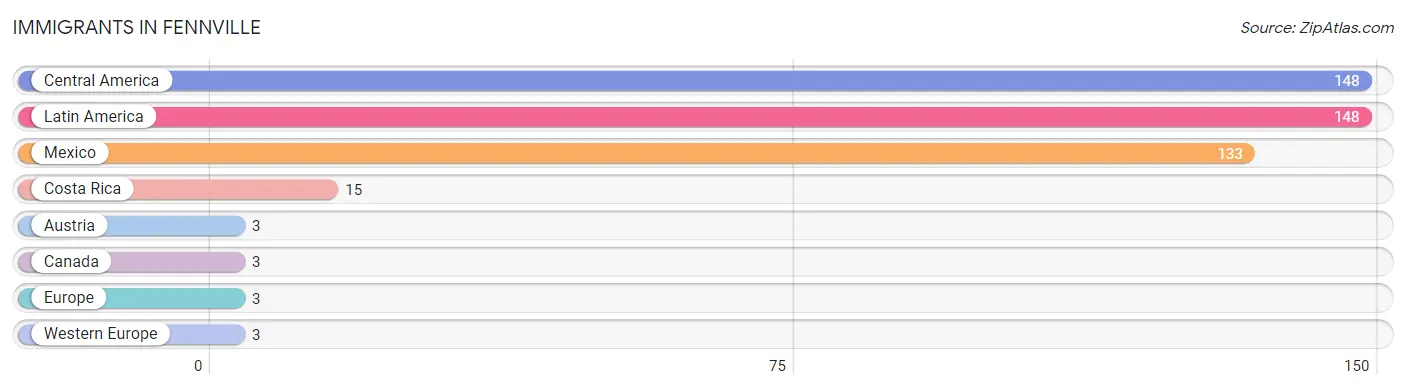
| Immigration Origin | # Population | % Population |
| Austria | 3 | 0.2% |
| Canada | 3 | 0.2% |
| Central America | 148 | 7.9% |
| Costa Rica | 15 | 0.8% |
| Europe | 3 | 0.2% |
| Latin America | 148 | 7.9% |
| Mexico | 133 | 7.1% |
| Western Europe | 3 | 0.2% | View All 8 Rows |
Sex and Age in Fennville
Sex and Age in Fennville
The most populous age groups in Fennville are 25 to 29 Years (153 | 17.0%) for men and 30 to 34 Years (109 | 11.2%) for women.
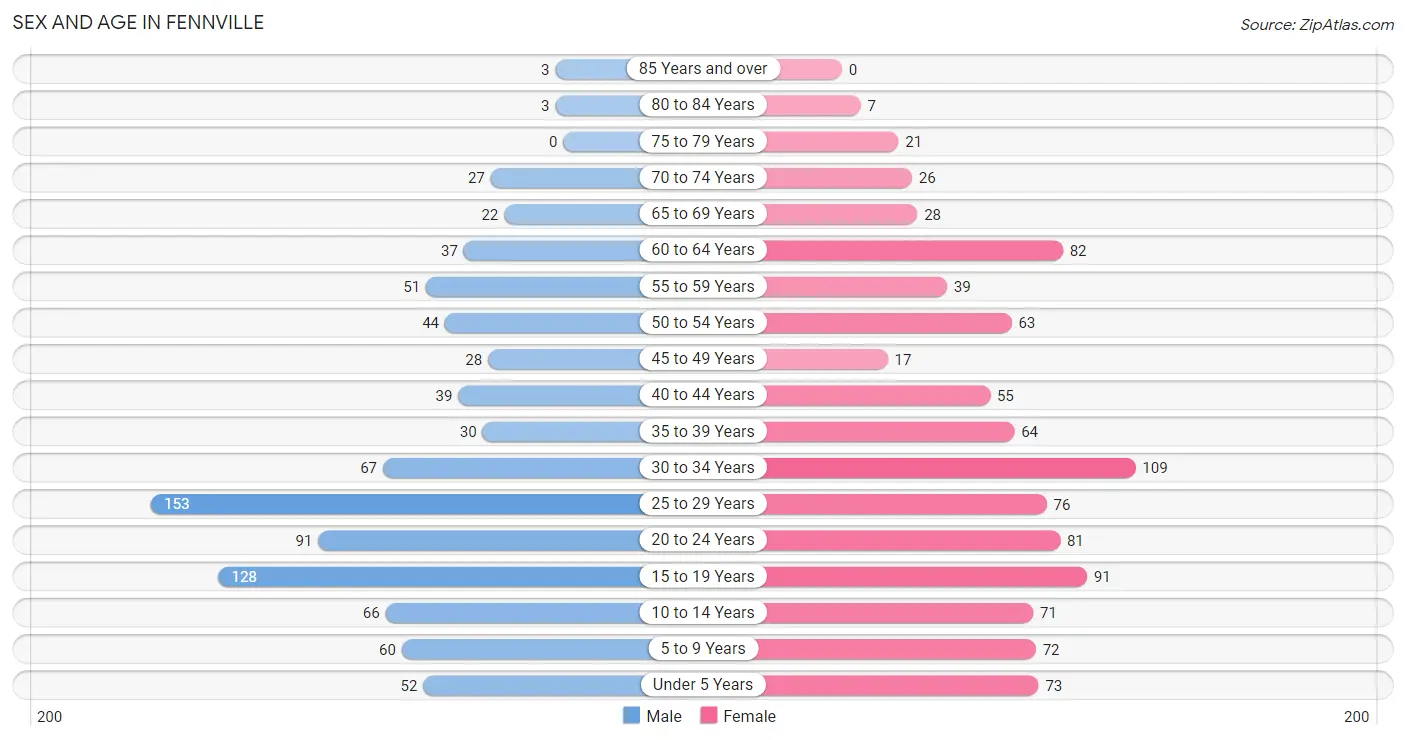
| Age Bracket | Male | Female |
| Under 5 Years | 52 (5.8%) | 73 (7.5%) |
| 5 to 9 Years | 60 (6.7%) | 72 (7.4%) |
| 10 to 14 Years | 66 (7.3%) | 71 (7.3%) |
| 15 to 19 Years | 128 (14.2%) | 91 (9.3%) |
| 20 to 24 Years | 91 (10.1%) | 81 (8.3%) |
| 25 to 29 Years | 153 (17.0%) | 76 (7.8%) |
| 30 to 34 Years | 67 (7.4%) | 109 (11.2%) |
| 35 to 39 Years | 30 (3.3%) | 64 (6.6%) |
| 40 to 44 Years | 39 (4.3%) | 55 (5.6%) |
| 45 to 49 Years | 28 (3.1%) | 17 (1.7%) |
| 50 to 54 Years | 44 (4.9%) | 63 (6.5%) |
| 55 to 59 Years | 51 (5.7%) | 39 (4.0%) |
| 60 to 64 Years | 37 (4.1%) | 82 (8.4%) |
| 65 to 69 Years | 22 (2.4%) | 28 (2.9%) |
| 70 to 74 Years | 27 (3.0%) | 26 (2.7%) |
| 75 to 79 Years | 0 (0.0%) | 21 (2.1%) |
| 80 to 84 Years | 3 (0.3%) | 7 (0.7%) |
| 85 Years and over | 3 (0.3%) | 0 (0.0%) |
| Total | 901 (100.0%) | 975 (100.0%) |
Families and Households in Fennville
Median Family Size in Fennville
The median family size in Fennville is 3.18 persons per family, with single male/father families (76 | 15.4%) accounting for the largest median family size of 3.39 persons per family. On the other hand, single female/mother families (158 | 32.1%) represent the smallest median family size with 3.11 persons per family.
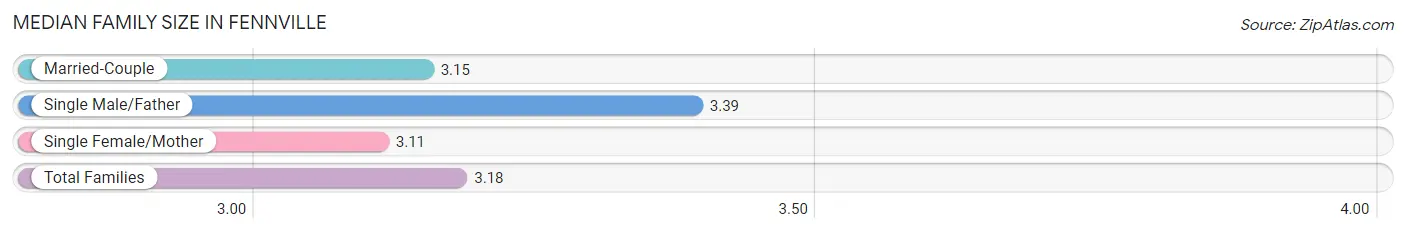
| Family Type | # Families | Family Size |
| Married-Couple | 258 (52.4%) | 3.15 |
| Single Male/Father | 76 (15.4%) | 3.39 |
| Single Female/Mother | 158 (32.1%) | 3.11 |
| Total Families | 492 (100.0%) | 3.18 |
Median Household Size in Fennville
The median household size in Fennville is 2.91 persons per household, with single female/mother households (158 | 24.5%) accounting for the largest median household size of 3.75 persons per household. non-family households (153 | 23.7%) represent the smallest median household size with 1.20 persons per household.
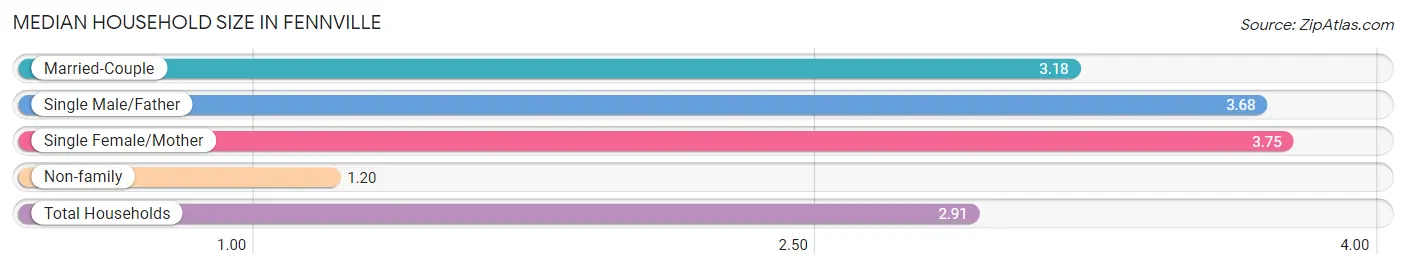
| Household Type | # Households | Household Size |
| Married-Couple | 258 (40.0%) | 3.18 |
| Single Male/Father | 76 (11.8%) | 3.68 |
| Single Female/Mother | 158 (24.5%) | 3.75 |
| Non-family | 153 (23.7%) | 1.20 |
| Total Households | 645 (100.0%) | 2.91 |
Household Size by Marriage Status in Fennville
Out of a total of 645 households in Fennville, 492 (76.3%) are family households, while 153 (23.7%) are nonfamily households. The most numerous type of family households are 2-person households, comprising 175, and the most common type of nonfamily households are 1-person households, comprising 121.
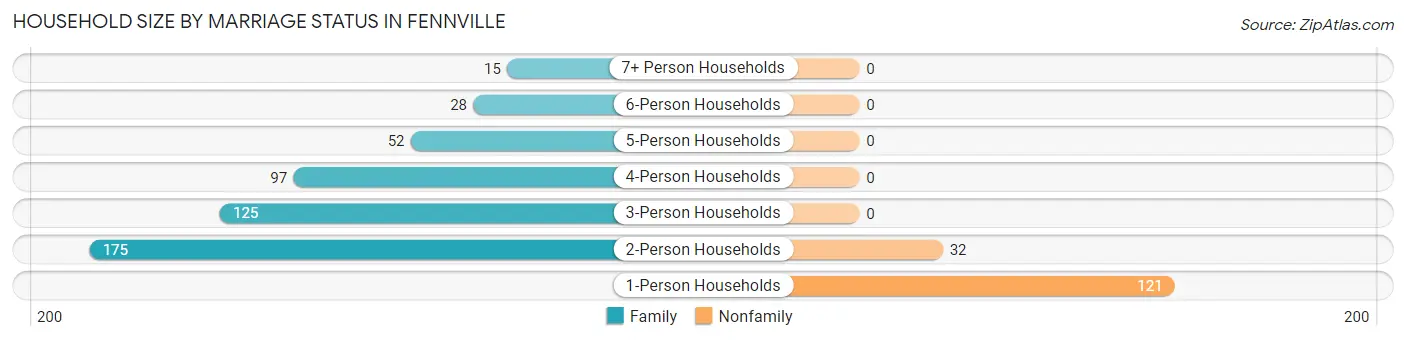
| Household Size | Family Households | Nonfamily Households |
| 1-Person Households | - | 121 (18.8%) |
| 2-Person Households | 175 (27.1%) | 32 (5.0%) |
| 3-Person Households | 125 (19.4%) | 0 (0.0%) |
| 4-Person Households | 97 (15.0%) | 0 (0.0%) |
| 5-Person Households | 52 (8.1%) | 0 (0.0%) |
| 6-Person Households | 28 (4.3%) | 0 (0.0%) |
| 7+ Person Households | 15 (2.3%) | 0 (0.0%) |
| Total | 492 (76.3%) | 153 (23.7%) |
Female Fertility in Fennville
Fertility by Age in Fennville
Average fertility rate in Fennville is 62.0 births per 1,000 women. Women in the age bracket of 20 to 34 years have the highest fertility rate with 117.0 births per 1,000 women. Women in the age bracket of 20 to 34 years acount for 100.0% of all women with births.
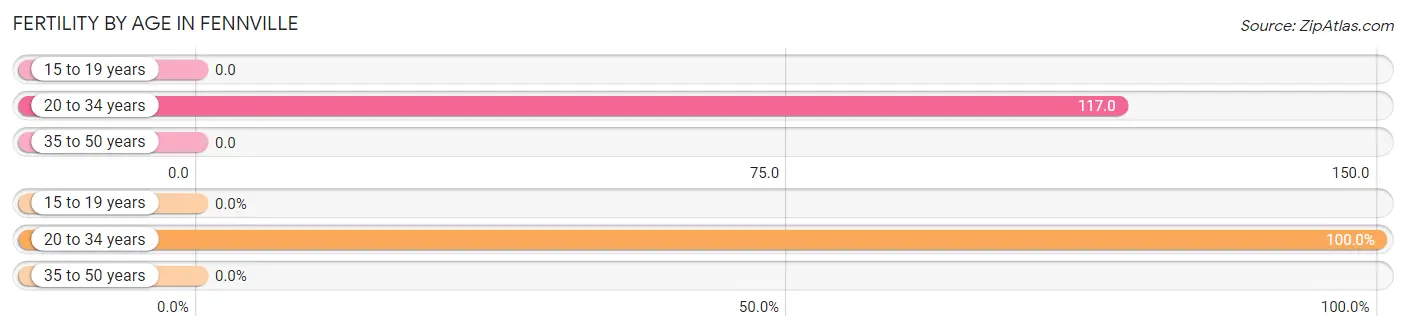
| Age Bracket | Women with Births | Births / 1,000 Women |
| 15 to 19 years | 0 (0.0%) | 0.0 |
| 20 to 34 years | 31 (100.0%) | 117.0 |
| 35 to 50 years | 0 (0.0%) | 0.0 |
| Total | 31 (100.0%) | 62.0 |
Fertility by Age by Marriage Status in Fennville
9.7% of women with births (31) in Fennville are married. The highest percentage of unmarried women with births falls into 20 to 34 years age bracket with 90.3% of them unmarried at the time of birth, while the lowest percentage of unmarried women with births belong to 20 to 34 years age bracket with 90.3% of them unmarried.
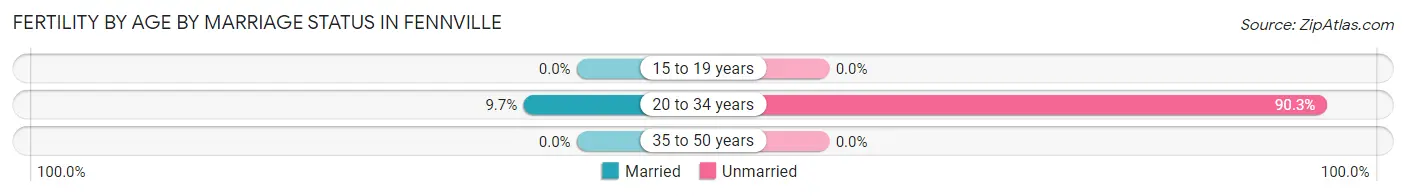
| Age Bracket | Married | Unmarried |
| 15 to 19 years | 0 (0.0%) | 0 (0.0%) |
| 20 to 34 years | 3 (9.7%) | 28 (90.3%) |
| 35 to 50 years | 0 (0.0%) | 0 (0.0%) |
| Total | 3 (9.7%) | 28 (90.3%) |
Fertility by Education in Fennville
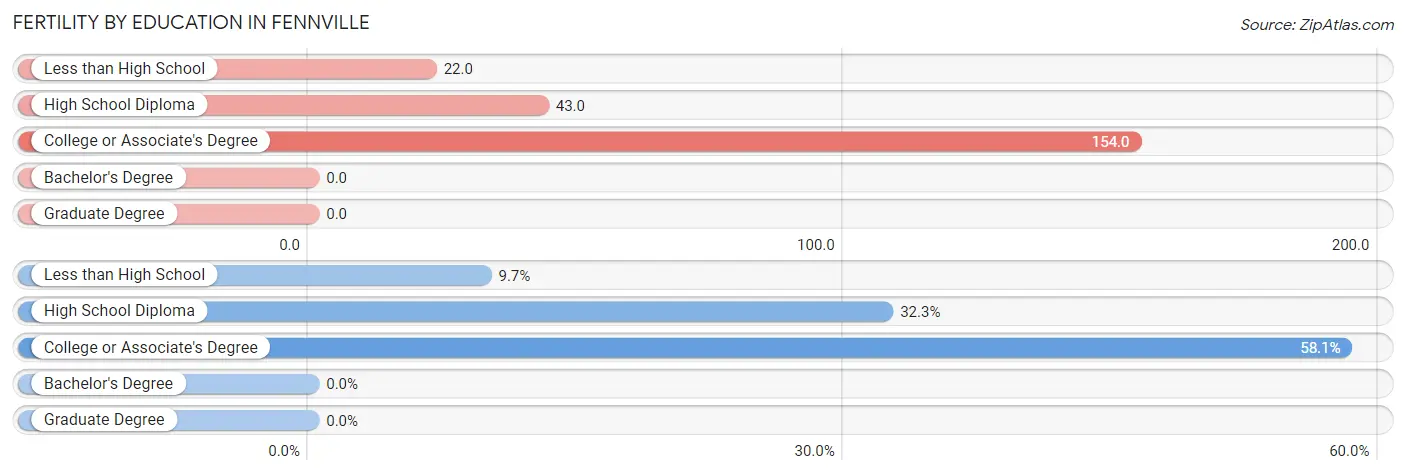
| Educational Attainment | Women with Births | Births / 1,000 Women |
| Less than High School | 3 (9.7%) | 22.0 |
| High School Diploma | 10 (32.3%) | 43.0 |
| College or Associate's Degree | 18 (58.1%) | 154.0 |
| Bachelor's Degree | 0 (0.0%) | 0.0 |
| Graduate Degree | 0 (0.0%) | 0.0 |
| Total | 31 (100.0%) | 62.0 |
Fertility by Education by Marriage Status in Fennville
90.3% of women with births in Fennville are unmarried. Women with the educational attainment of less than high school are most likely to be married with 100.0% of them married at childbirth, while women with the educational attainment of high school diploma are least likely to be married with 100.0% of them unmarried at childbirth.
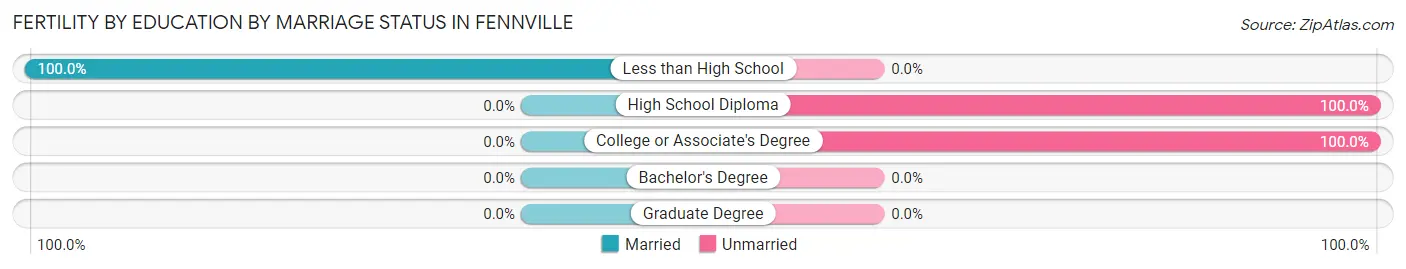
| Educational Attainment | Married | Unmarried |
| Less than High School | 3 (100.0%) | 0 (0.0%) |
| High School Diploma | 0 (0.0%) | 10 (100.0%) |
| College or Associate's Degree | 0 (0.0%) | 18 (100.0%) |
| Bachelor's Degree | 0 (0.0%) | 0 (0.0%) |
| Graduate Degree | 0 (0.0%) | 0 (0.0%) |
| Total | 3 (9.7%) | 28 (90.3%) |
Employment Characteristics in Fennville
Employment by Class of Employer in Fennville
Among the 819 employed individuals in Fennville, private company employees (711 | 86.8%), local government employees (44 | 5.4%), and not-for-profit organizations (34 | 4.2%) make up the most common classes of employment.
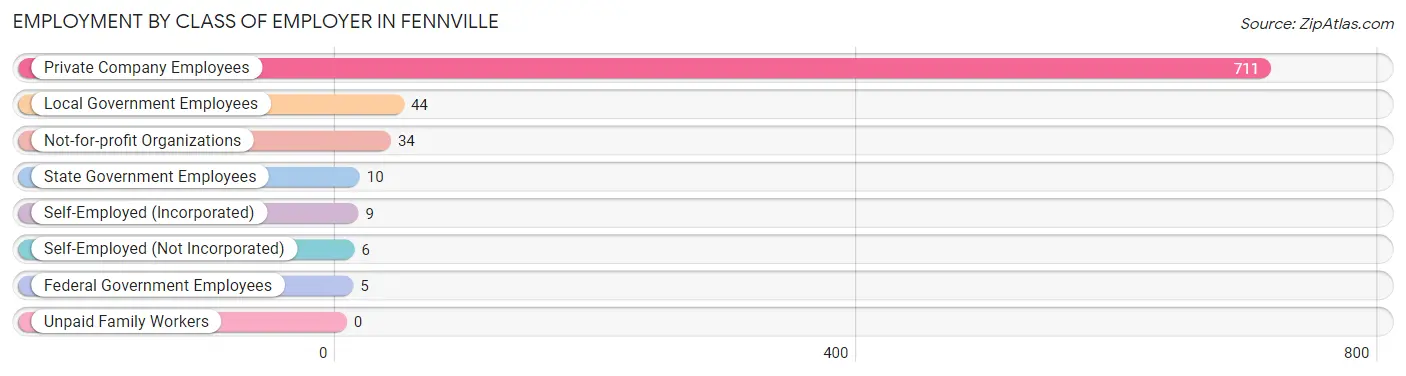
| Employer Class | # Employees | % Employees |
| Private Company Employees | 711 | 86.8% |
| Self-Employed (Incorporated) | 9 | 1.1% |
| Self-Employed (Not Incorporated) | 6 | 0.7% |
| Not-for-profit Organizations | 34 | 4.2% |
| Local Government Employees | 44 | 5.4% |
| State Government Employees | 10 | 1.2% |
| Federal Government Employees | 5 | 0.6% |
| Unpaid Family Workers | 0 | 0.0% |
| Total | 819 | 100.0% |
Employment Status by Age in Fennville
According to the labor force statistics for Fennville, out of the total population over 16 years of age (1,423), 62.2% or 885 individuals are in the labor force, with 4.7% or 42 of them unemployed. The age group with the highest labor force participation rate is 25 to 29 years, with 98.7% or 226 individuals in the labor force. Within the labor force, the 16 to 19 years age range has the highest percentage of unemployed individuals, with 19.4% or 6 of them being unemployed.
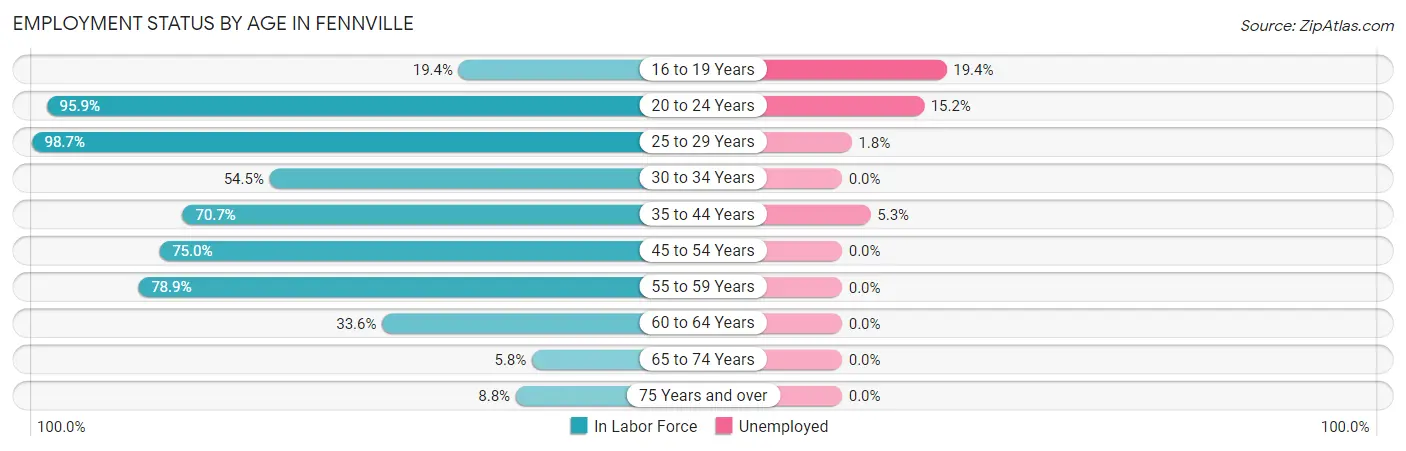
| Age Bracket | In Labor Force | Unemployed |
| 16 to 19 Years | 31 (19.4%) | 6 (19.4%) |
| 20 to 24 Years | 165 (95.9%) | 25 (15.2%) |
| 25 to 29 Years | 226 (98.7%) | 4 (1.8%) |
| 30 to 34 Years | 96 (54.5%) | 0 (0.0%) |
| 35 to 44 Years | 133 (70.7%) | 7 (5.3%) |
| 45 to 54 Years | 114 (75.0%) | 0 (0.0%) |
| 55 to 59 Years | 71 (78.9%) | 0 (0.0%) |
| 60 to 64 Years | 40 (33.6%) | 0 (0.0%) |
| 65 to 74 Years | 6 (5.8%) | 0 (0.0%) |
| 75 Years and over | 3 (8.8%) | 0 (0.0%) |
| Total | 885 (62.2%) | 42 (4.7%) |
Employment Status by Educational Attainment in Fennville
According to labor force statistics for Fennville, 71.3% of individuals (680) out of the total population between 25 and 64 years of age (954) are in the labor force, with 1.6% or 11 of them being unemployed. The group with the highest labor force participation rate are those with the educational attainment of bachelor's degree or higher, with 94.5% or 52 individuals in the labor force. Within the labor force, individuals with less than high school education have the highest percentage of unemployment, with 5.6% or 7 of them being unemployed.
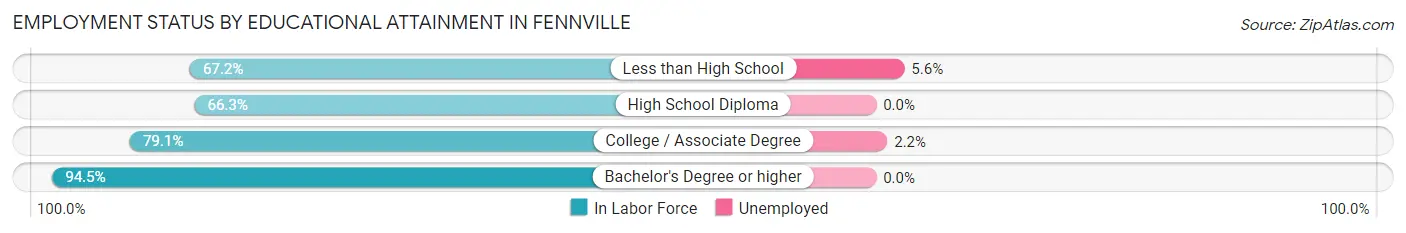
| Educational Attainment | In Labor Force | Unemployed |
| Less than High School | 125 (67.2%) | 10 (5.6%) |
| High School Diploma | 317 (66.3%) | 0 (0.0%) |
| College / Associate Degree | 186 (79.1%) | 5 (2.2%) |
| Bachelor's Degree or higher | 52 (94.5%) | 0 (0.0%) |
| Total | 680 (71.3%) | 15 (1.6%) |
Employment Occupations by Sex in Fennville
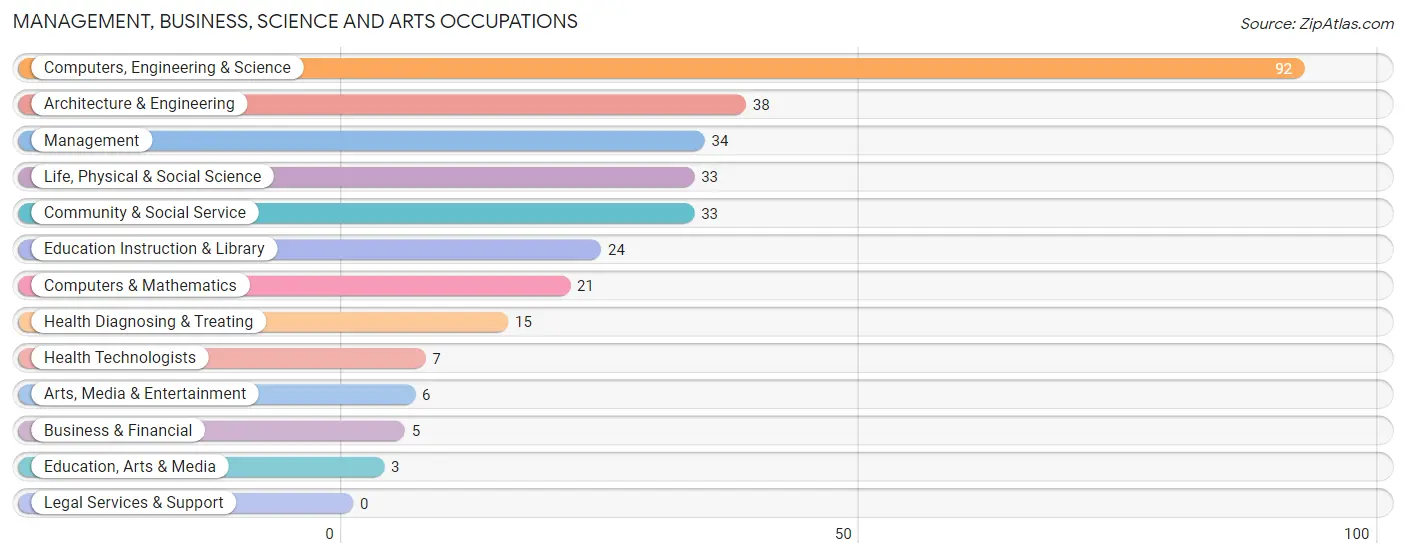
Management, Business, Science and Arts Occupations
The most common Management, Business, Science and Arts occupations in Fennville are Computers, Engineering & Science (92 | 10.9%), Architecture & Engineering (38 | 4.5%), Management (34 | 4.0%), Life, Physical & Social Science (33 | 3.9%), and Community & Social Service (33 | 3.9%).
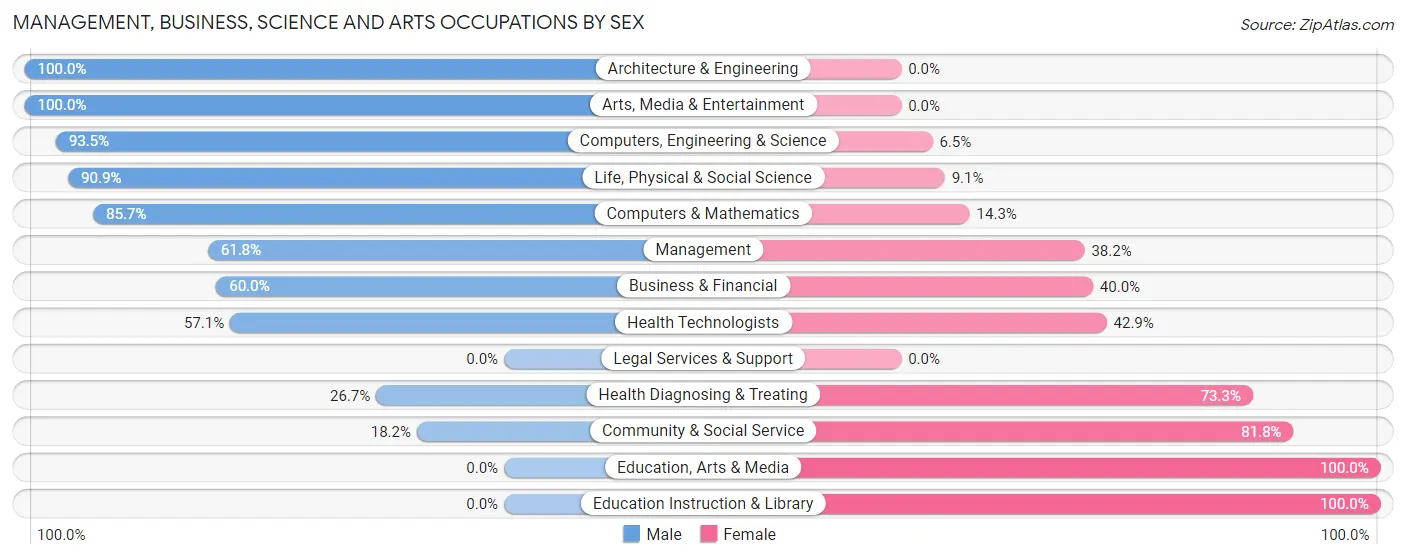
Management, Business, Science and Arts Occupations by Sex
Within the Management, Business, Science and Arts occupations in Fennville, the most male-oriented occupations are Architecture & Engineering (100.0%), Arts, Media & Entertainment (100.0%), and Computers, Engineering & Science (93.5%), while the most female-oriented occupations are Education, Arts & Media (100.0%), Education Instruction & Library (100.0%), and Community & Social Service (81.8%).
| Occupation | Male | Female |
| Management | 21 (61.8%) | 13 (38.2%) |
| Business & Financial | 3 (60.0%) | 2 (40.0%) |
| Computers, Engineering & Science | 86 (93.5%) | 6 (6.5%) |
| Computers & Mathematics | 18 (85.7%) | 3 (14.3%) |
| Architecture & Engineering | 38 (100.0%) | 0 (0.0%) |
| Life, Physical & Social Science | 30 (90.9%) | 3 (9.1%) |
| Community & Social Service | 6 (18.2%) | 27 (81.8%) |
| Education, Arts & Media | 0 (0.0%) | 3 (100.0%) |
| Legal Services & Support | 0 (0.0%) | 0 (0.0%) |
| Education Instruction & Library | 0 (0.0%) | 24 (100.0%) |
| Arts, Media & Entertainment | 6 (100.0%) | 0 (0.0%) |
| Health Diagnosing & Treating | 4 (26.7%) | 11 (73.3%) |
| Health Technologists | 4 (57.1%) | 3 (42.9%) |
| Total (Category) | 120 (67.0%) | 59 (33.0%) |
| Total (Overall) | 490 (58.1%) | 353 (41.9%) |
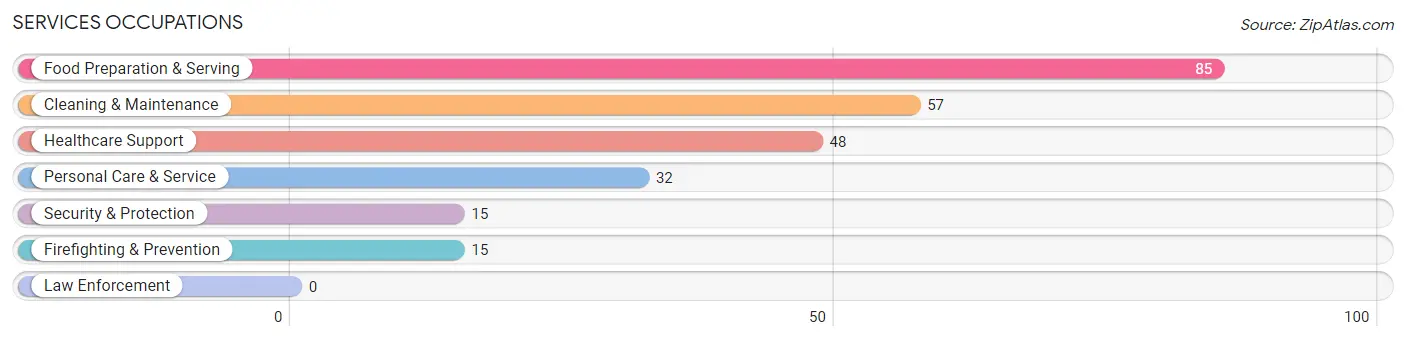
Services Occupations
The most common Services occupations in Fennville are Food Preparation & Serving (85 | 10.1%), Cleaning & Maintenance (57 | 6.8%), Healthcare Support (48 | 5.7%), Personal Care & Service (32 | 3.8%), and Security & Protection (15 | 1.8%).
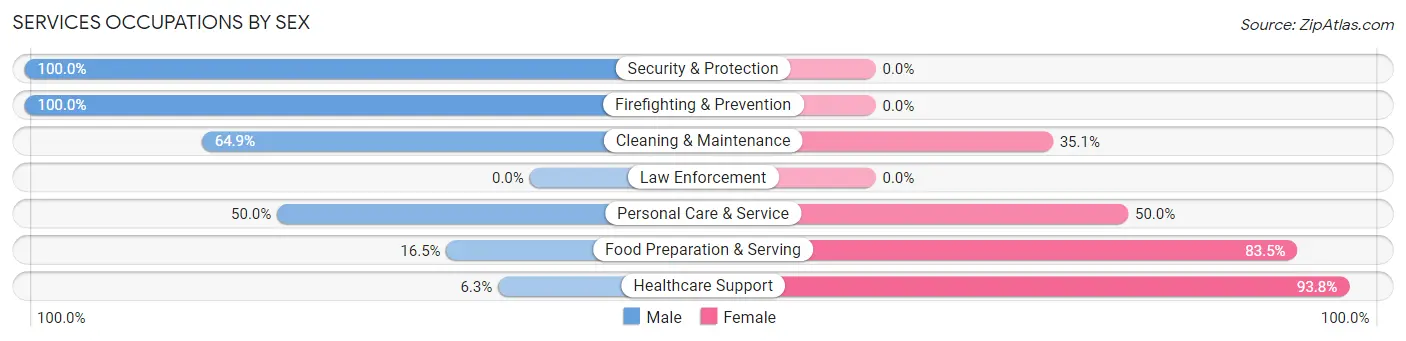
Services Occupations by Sex
Within the Services occupations in Fennville, the most male-oriented occupations are Security & Protection (100.0%), Firefighting & Prevention (100.0%), and Cleaning & Maintenance (64.9%), while the most female-oriented occupations are Healthcare Support (93.8%), Food Preparation & Serving (83.5%), and Personal Care & Service (50.0%).
| Occupation | Male | Female |
| Healthcare Support | 3 (6.2%) | 45 (93.8%) |
| Security & Protection | 15 (100.0%) | 0 (0.0%) |
| Firefighting & Prevention | 15 (100.0%) | 0 (0.0%) |
| Law Enforcement | 0 (0.0%) | 0 (0.0%) |
| Food Preparation & Serving | 14 (16.5%) | 71 (83.5%) |
| Cleaning & Maintenance | 37 (64.9%) | 20 (35.1%) |
| Personal Care & Service | 16 (50.0%) | 16 (50.0%) |
| Total (Category) | 85 (35.9%) | 152 (64.1%) |
| Total (Overall) | 490 (58.1%) | 353 (41.9%) |
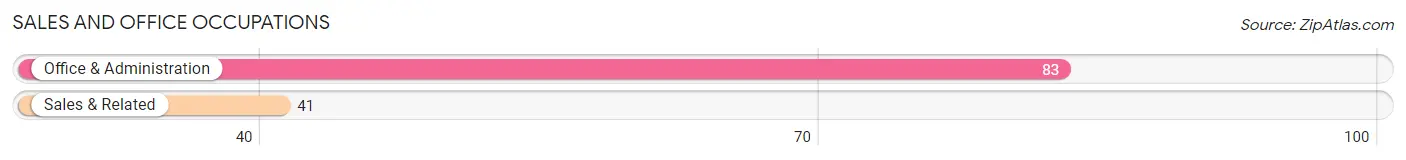
Sales and Office Occupations
The most common Sales and Office occupations in Fennville are Office & Administration (83 | 9.9%), and Sales & Related (41 | 4.9%).
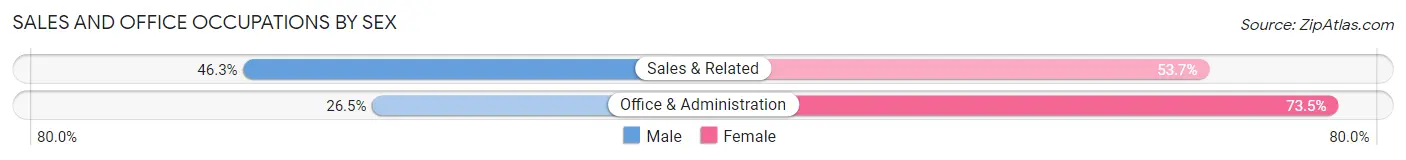
Sales and Office Occupations by Sex
| Occupation | Male | Female |
| Sales & Related | 19 (46.3%) | 22 (53.7%) |
| Office & Administration | 22 (26.5%) | 61 (73.5%) |
| Total (Category) | 41 (33.1%) | 83 (66.9%) |
| Total (Overall) | 490 (58.1%) | 353 (41.9%) |
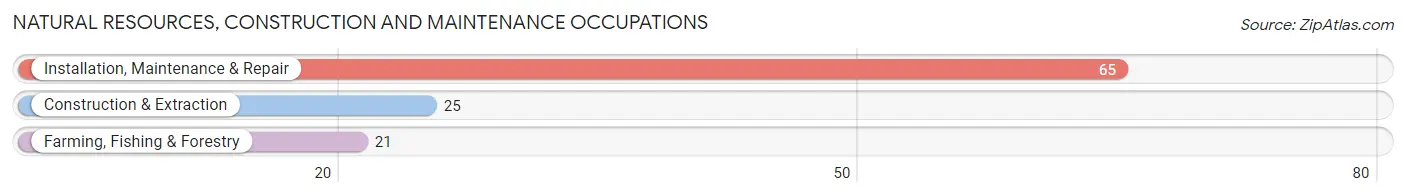
Natural Resources, Construction and Maintenance Occupations
The most common Natural Resources, Construction and Maintenance occupations in Fennville are Installation, Maintenance & Repair (65 | 7.7%), Construction & Extraction (25 | 3.0%), and Farming, Fishing & Forestry (21 | 2.5%).
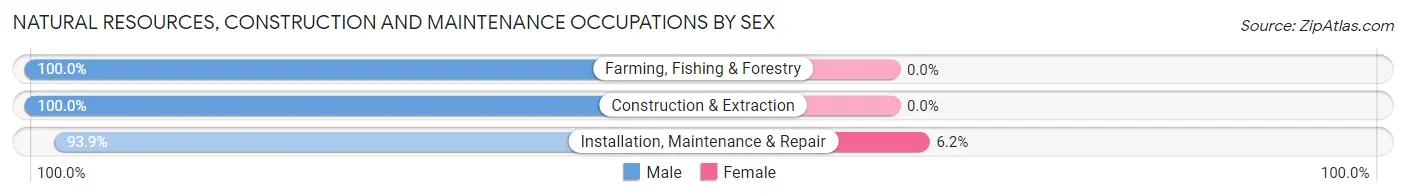
Natural Resources, Construction and Maintenance Occupations by Sex
| Occupation | Male | Female |
| Farming, Fishing & Forestry | 21 (100.0%) | 0 (0.0%) |
| Construction & Extraction | 25 (100.0%) | 0 (0.0%) |
| Installation, Maintenance & Repair | 61 (93.9%) | 4 (6.1%) |
| Total (Category) | 107 (96.4%) | 4 (3.6%) |
| Total (Overall) | 490 (58.1%) | 353 (41.9%) |
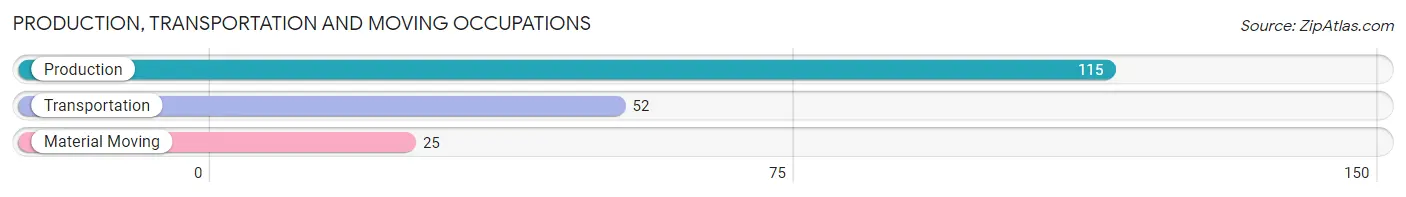
Production, Transportation and Moving Occupations
The most common Production, Transportation and Moving occupations in Fennville are Production (115 | 13.6%), Transportation (52 | 6.2%), and Material Moving (25 | 3.0%).
Production, Transportation and Moving Occupations by Sex
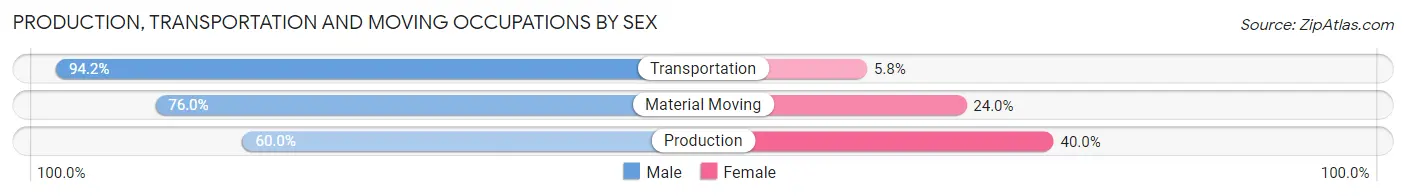
| Occupation | Male | Female |
| Production | 69 (60.0%) | 46 (40.0%) |
| Transportation | 49 (94.2%) | 3 (5.8%) |
| Material Moving | 19 (76.0%) | 6 (24.0%) |
| Total (Category) | 137 (71.4%) | 55 (28.6%) |
| Total (Overall) | 490 (58.1%) | 353 (41.9%) |
Employment Industries by Sex in Fennville
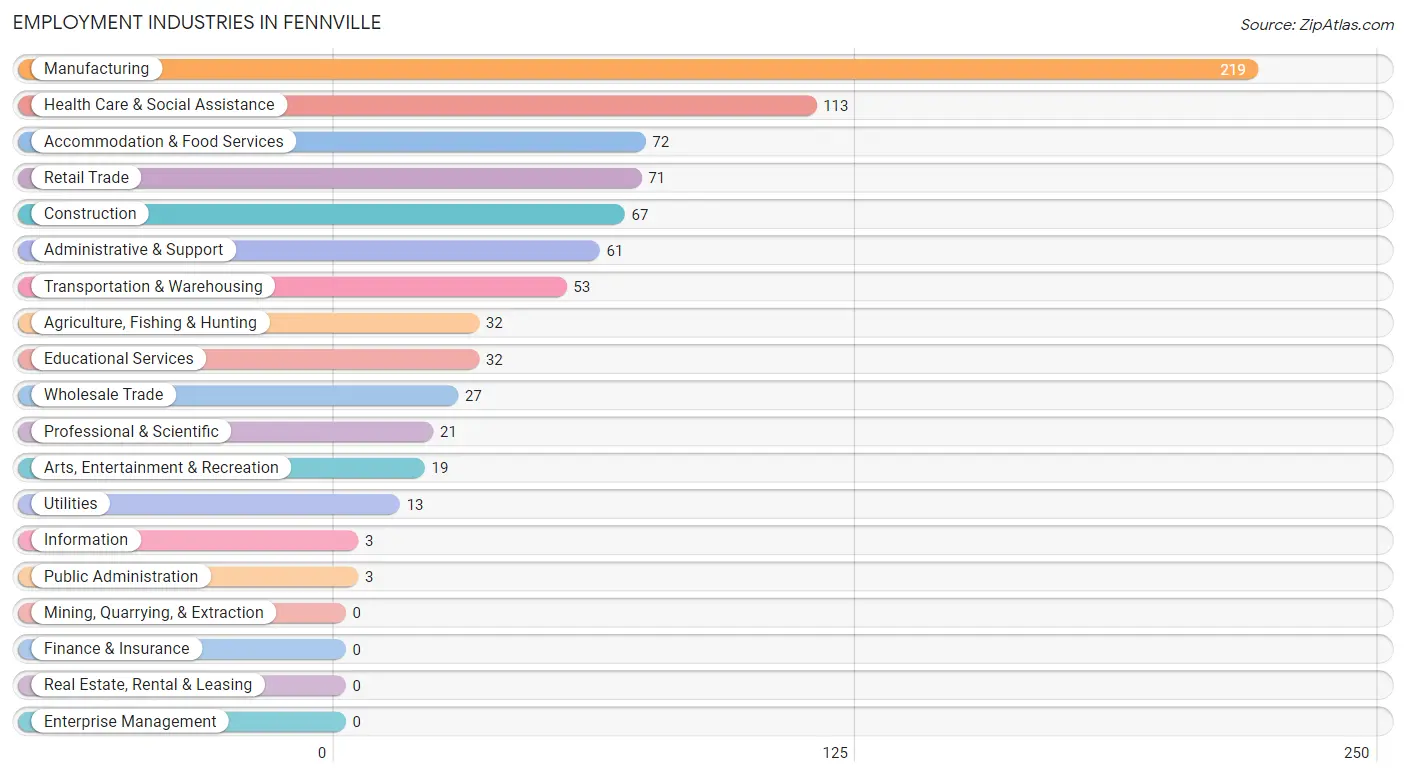
Employment Industries in Fennville
The major employment industries in Fennville include Manufacturing (219 | 26.0%), Health Care & Social Assistance (113 | 13.4%), Accommodation & Food Services (72 | 8.5%), Retail Trade (71 | 8.4%), and Construction (67 | 8.0%).
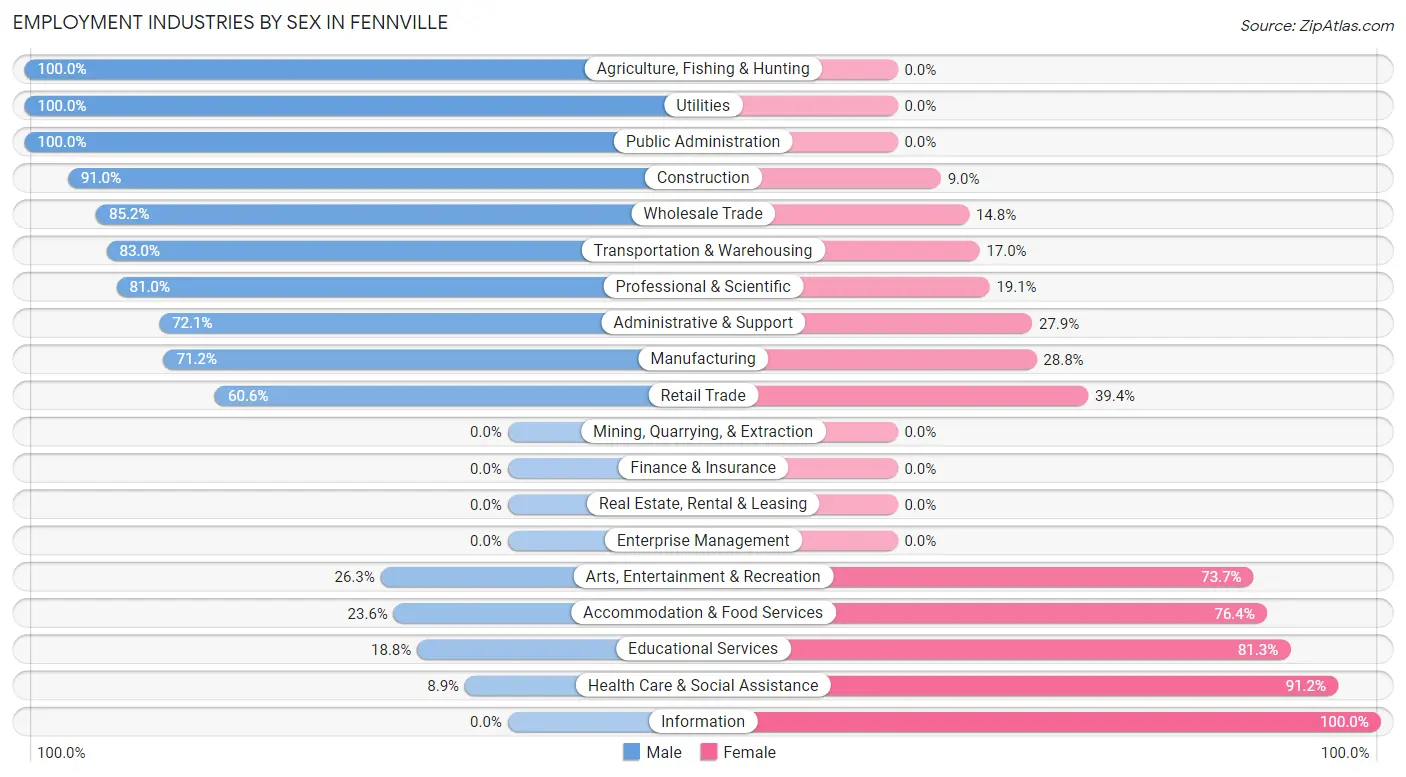
Employment Industries by Sex in Fennville
The Fennville industries that see more men than women are Agriculture, Fishing & Hunting (100.0%), Utilities (100.0%), and Public Administration (100.0%), whereas the industries that tend to have a higher number of women are Information (100.0%), Health Care & Social Assistance (91.1%), and Educational Services (81.2%).
| Industry | Male | Female |
| Agriculture, Fishing & Hunting | 32 (100.0%) | 0 (0.0%) |
| Mining, Quarrying, & Extraction | 0 (0.0%) | 0 (0.0%) |
| Construction | 61 (91.0%) | 6 (9.0%) |
| Manufacturing | 156 (71.2%) | 63 (28.8%) |
| Wholesale Trade | 23 (85.2%) | 4 (14.8%) |
| Retail Trade | 43 (60.6%) | 28 (39.4%) |
| Transportation & Warehousing | 44 (83.0%) | 9 (17.0%) |
| Utilities | 13 (100.0%) | 0 (0.0%) |
| Information | 0 (0.0%) | 3 (100.0%) |
| Finance & Insurance | 0 (0.0%) | 0 (0.0%) |
| Real Estate, Rental & Leasing | 0 (0.0%) | 0 (0.0%) |
| Professional & Scientific | 17 (80.9%) | 4 (19.1%) |
| Enterprise Management | 0 (0.0%) | 0 (0.0%) |
| Administrative & Support | 44 (72.1%) | 17 (27.9%) |
| Educational Services | 6 (18.8%) | 26 (81.2%) |
| Health Care & Social Assistance | 10 (8.8%) | 103 (91.1%) |
| Arts, Entertainment & Recreation | 5 (26.3%) | 14 (73.7%) |
| Accommodation & Food Services | 17 (23.6%) | 55 (76.4%) |
| Public Administration | 3 (100.0%) | 0 (0.0%) |
| Total | 490 (58.1%) | 353 (41.9%) |
Education in Fennville
School Enrollment in Fennville
The most common levels of schooling among the 575 students in Fennville are high school (193 | 33.6%), middle school (102 | 17.7%), and elementary school (99 | 17.2%).
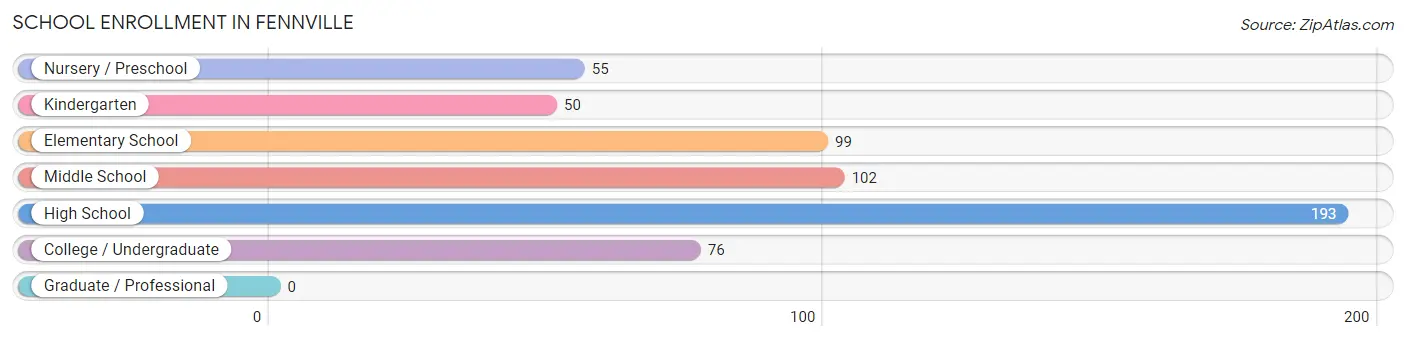
| School Level | # Students | % Students |
| Nursery / Preschool | 55 | 9.6% |
| Kindergarten | 50 | 8.7% |
| Elementary School | 99 | 17.2% |
| Middle School | 102 | 17.7% |
| High School | 193 | 33.6% |
| College / Undergraduate | 76 | 13.2% |
| Graduate / Professional | 0 | 0.0% |
| Total | 575 | 100.0% |
School Enrollment by Age by Funding Source in Fennville
Out of a total of 575 students who are enrolled in schools in Fennville, 37 (6.4%) attend a private institution, while the remaining 538 (93.6%) are enrolled in public schools. The age group of 35 years and over has the highest likelihood of being enrolled in private schools, with 12 (57.1% in the age bracket) enrolled. Conversely, the age group of 15 to 17 year olds has the lowest likelihood of being enrolled in a private school, with 139 (100.0% in the age bracket) attending a public institution.
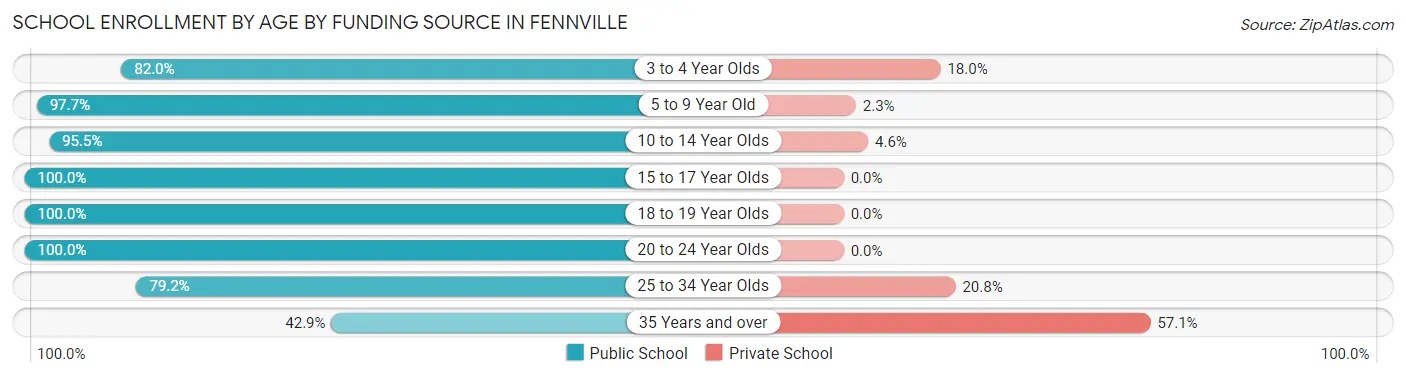
| Age Bracket | Public School | Private School |
| 3 to 4 Year Olds | 50 (82.0%) | 11 (18.0%) |
| 5 to 9 Year Old | 129 (97.7%) | 3 (2.3%) |
| 10 to 14 Year Olds | 126 (95.5%) | 6 (4.5%) |
| 15 to 17 Year Olds | 139 (100.0%) | 0 (0.0%) |
| 18 to 19 Year Olds | 40 (100.0%) | 0 (0.0%) |
| 20 to 24 Year Olds | 26 (100.0%) | 0 (0.0%) |
| 25 to 34 Year Olds | 19 (79.2%) | 5 (20.8%) |
| 35 Years and over | 9 (42.9%) | 12 (57.1%) |
| Total | 538 (93.6%) | 37 (6.4%) |
Educational Attainment by Field of Study in Fennville
Business (16 | 18.0%), education (14 | 15.7%), physical & health sciences (13 | 14.6%), arts & humanities (9 | 10.1%), and science & technology (8 | 9.0%) are the most common fields of study among 89 individuals in Fennville who have obtained a bachelor's degree or higher.
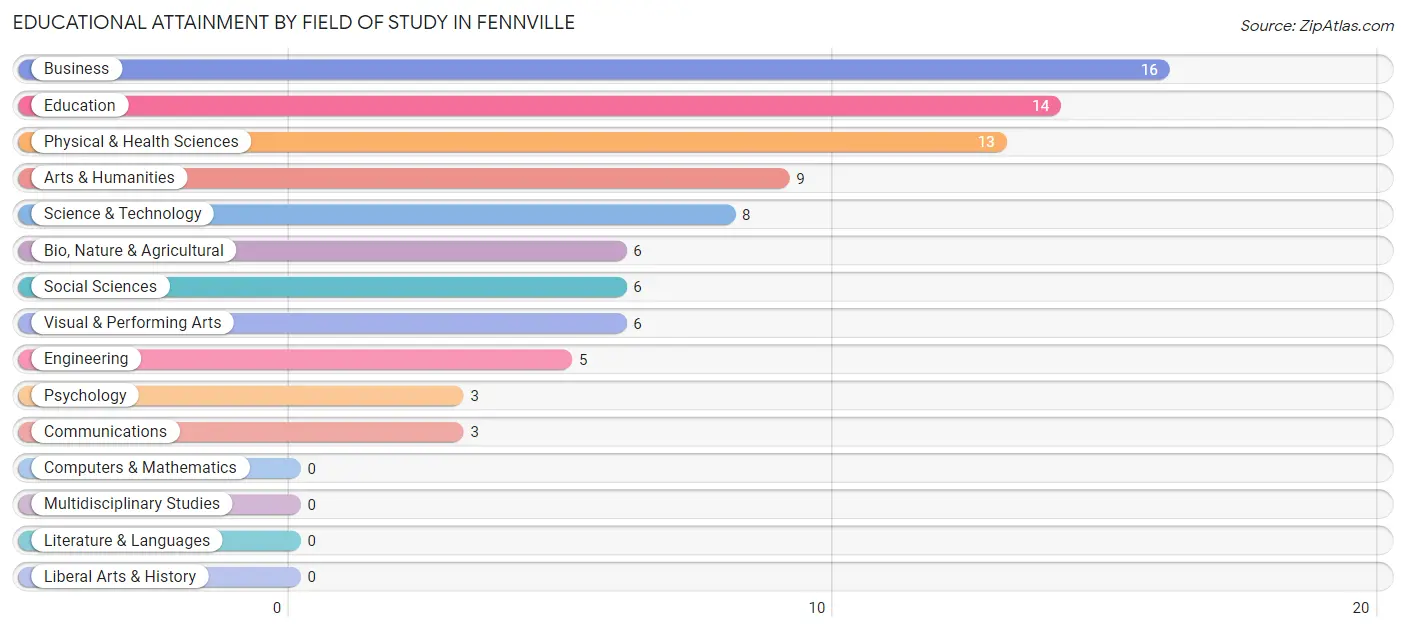
| Field of Study | # Graduates | % Graduates |
| Computers & Mathematics | 0 | 0.0% |
| Bio, Nature & Agricultural | 6 | 6.7% |
| Physical & Health Sciences | 13 | 14.6% |
| Psychology | 3 | 3.4% |
| Social Sciences | 6 | 6.7% |
| Engineering | 5 | 5.6% |
| Multidisciplinary Studies | 0 | 0.0% |
| Science & Technology | 8 | 9.0% |
| Business | 16 | 18.0% |
| Education | 14 | 15.7% |
| Literature & Languages | 0 | 0.0% |
| Liberal Arts & History | 0 | 0.0% |
| Visual & Performing Arts | 6 | 6.7% |
| Communications | 3 | 3.4% |
| Arts & Humanities | 9 | 10.1% |
| Total | 89 | 100.0% |
Transportation & Commute in Fennville
Vehicle Availability by Sex in Fennville
The most prevalent vehicle ownership categories in Fennville are males with 2 vehicles (244, accounting for 50.3%) and females with 2 vehicles (161, making up 73.1%).
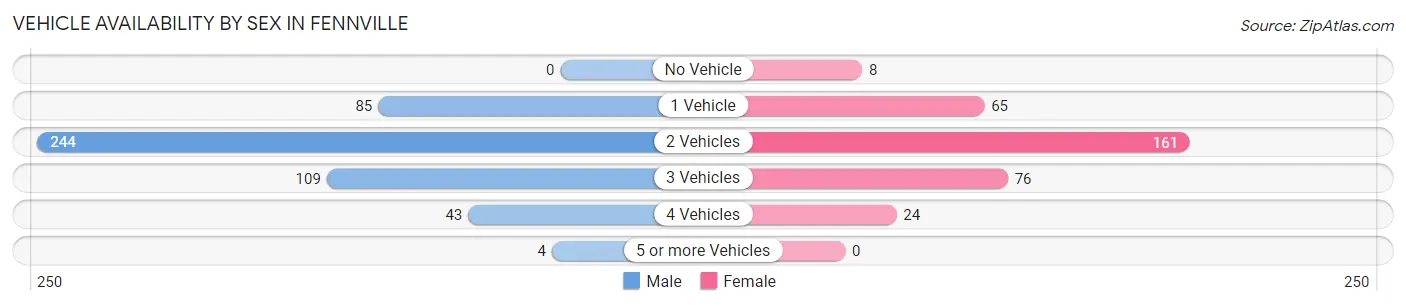
| Vehicles Available | Male | Female |
| No Vehicle | 0 (0.0%) | 8 (2.4%) |
| 1 Vehicle | 85 (17.5%) | 65 (19.5%) |
| 2 Vehicles | 244 (50.3%) | 161 (48.2%) |
| 3 Vehicles | 109 (22.5%) | 76 (22.8%) |
| 4 Vehicles | 43 (8.9%) | 24 (7.2%) |
| 5 or more Vehicles | 4 (0.8%) | 0 (0.0%) |
| Total | 485 (100.0%) | 334 (100.0%) |
Commute Time in Fennville
The most frequently occuring commute durations in Fennville are 20 to 24 minutes (275 commuters, 34.2%), 30 to 34 minutes (135 commuters, 16.8%), and 25 to 29 minutes (90 commuters, 11.2%).
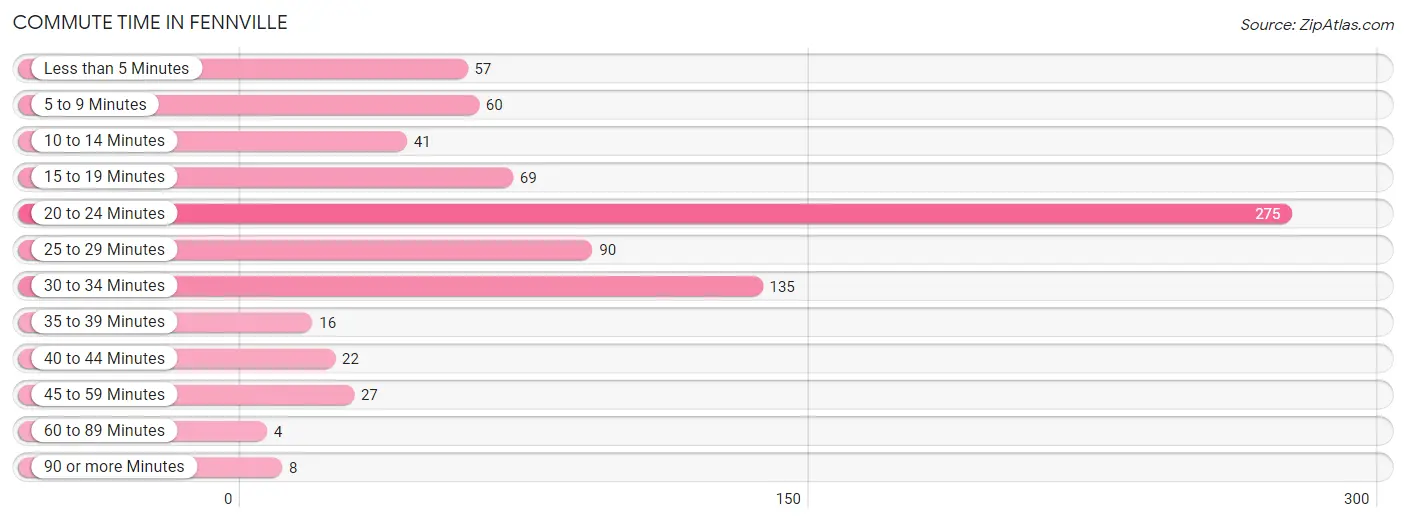
| Commute Time | # Commuters | % Commuters |
| Less than 5 Minutes | 57 | 7.1% |
| 5 to 9 Minutes | 60 | 7.5% |
| 10 to 14 Minutes | 41 | 5.1% |
| 15 to 19 Minutes | 69 | 8.6% |
| 20 to 24 Minutes | 275 | 34.2% |
| 25 to 29 Minutes | 90 | 11.2% |
| 30 to 34 Minutes | 135 | 16.8% |
| 35 to 39 Minutes | 16 | 2.0% |
| 40 to 44 Minutes | 22 | 2.7% |
| 45 to 59 Minutes | 27 | 3.4% |
| 60 to 89 Minutes | 4 | 0.5% |
| 90 or more Minutes | 8 | 1.0% |
Commute Time by Sex in Fennville
The most common commute times in Fennville are 20 to 24 minutes (165 commuters, 35.1%) for males and 20 to 24 minutes (110 commuters, 32.9%) for females.
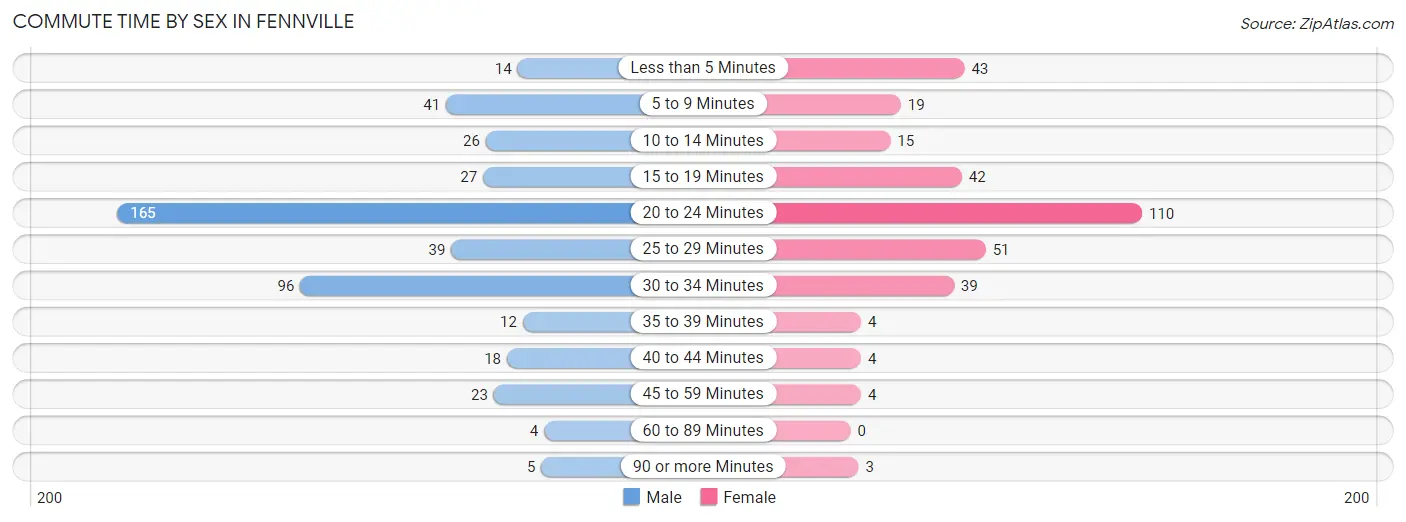
| Commute Time | Male | Female |
| Less than 5 Minutes | 14 (3.0%) | 43 (12.9%) |
| 5 to 9 Minutes | 41 (8.7%) | 19 (5.7%) |
| 10 to 14 Minutes | 26 (5.5%) | 15 (4.5%) |
| 15 to 19 Minutes | 27 (5.7%) | 42 (12.6%) |
| 20 to 24 Minutes | 165 (35.1%) | 110 (32.9%) |
| 25 to 29 Minutes | 39 (8.3%) | 51 (15.3%) |
| 30 to 34 Minutes | 96 (20.4%) | 39 (11.7%) |
| 35 to 39 Minutes | 12 (2.5%) | 4 (1.2%) |
| 40 to 44 Minutes | 18 (3.8%) | 4 (1.2%) |
| 45 to 59 Minutes | 23 (4.9%) | 4 (1.2%) |
| 60 to 89 Minutes | 4 (0.9%) | 0 (0.0%) |
| 90 or more Minutes | 5 (1.1%) | 3 (0.9%) |
Time of Departure to Work by Sex in Fennville
The most frequent times of departure to work in Fennville are 6:00 AM to 6:29 AM (202, 43.0%) for males and 7:30 AM to 7:59 AM (76, 22.8%) for females.
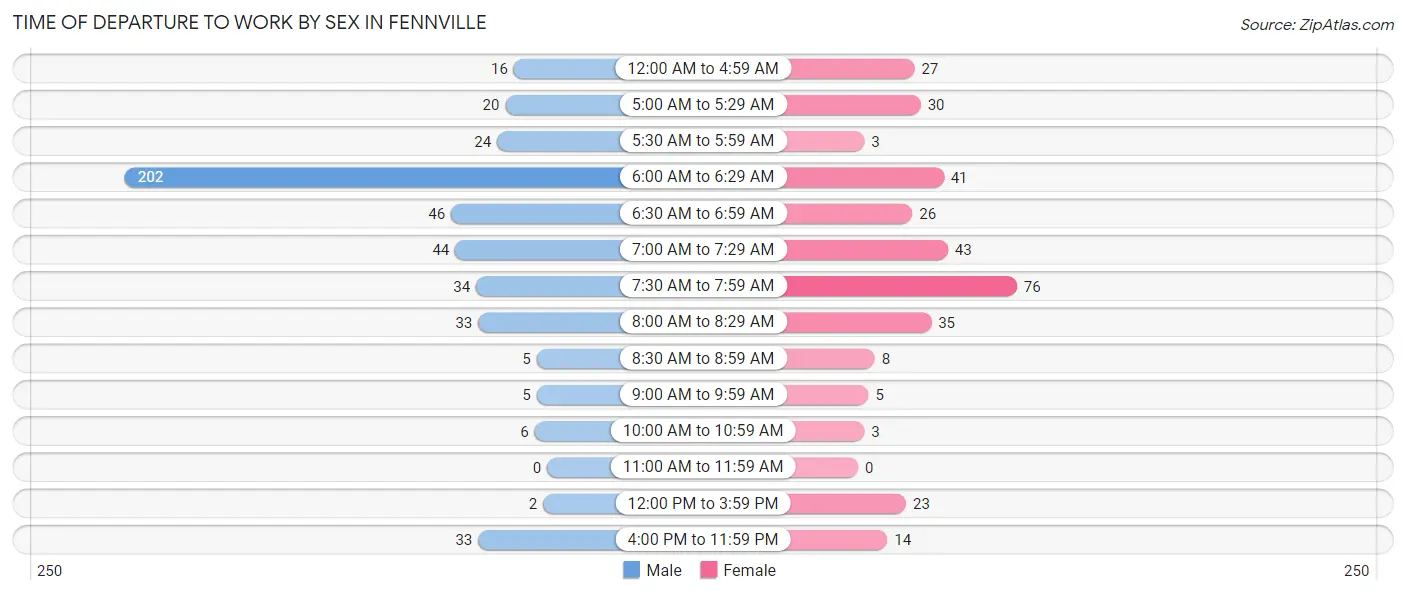
| Time of Departure | Male | Female |
| 12:00 AM to 4:59 AM | 16 (3.4%) | 27 (8.1%) |
| 5:00 AM to 5:29 AM | 20 (4.3%) | 30 (9.0%) |
| 5:30 AM to 5:59 AM | 24 (5.1%) | 3 (0.9%) |
| 6:00 AM to 6:29 AM | 202 (43.0%) | 41 (12.3%) |
| 6:30 AM to 6:59 AM | 46 (9.8%) | 26 (7.8%) |
| 7:00 AM to 7:29 AM | 44 (9.4%) | 43 (12.9%) |
| 7:30 AM to 7:59 AM | 34 (7.2%) | 76 (22.8%) |
| 8:00 AM to 8:29 AM | 33 (7.0%) | 35 (10.5%) |
| 8:30 AM to 8:59 AM | 5 (1.1%) | 8 (2.4%) |
| 9:00 AM to 9:59 AM | 5 (1.1%) | 5 (1.5%) |
| 10:00 AM to 10:59 AM | 6 (1.3%) | 3 (0.9%) |
| 11:00 AM to 11:59 AM | 0 (0.0%) | 0 (0.0%) |
| 12:00 PM to 3:59 PM | 2 (0.4%) | 23 (6.9%) |
| 4:00 PM to 11:59 PM | 33 (7.0%) | 14 (4.2%) |
| Total | 470 (100.0%) | 334 (100.0%) |
Housing Occupancy in Fennville
Occupancy by Ownership in Fennville
Of the total 645 dwellings in Fennville, owner-occupied units account for 384 (59.5%), while renter-occupied units make up 261 (40.5%).
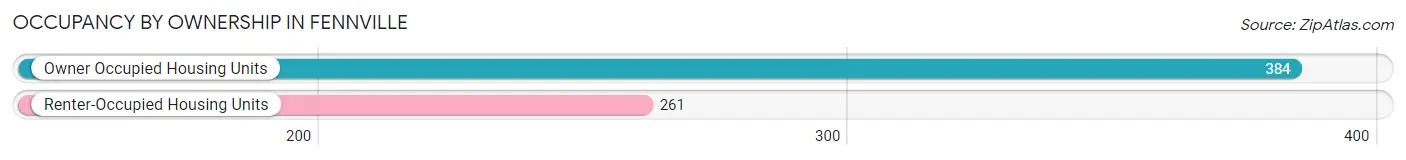
| Occupancy | # Housing Units | % Housing Units |
| Owner Occupied Housing Units | 384 | 59.5% |
| Renter-Occupied Housing Units | 261 | 40.5% |
| Total Occupied Housing Units | 645 | 100.0% |
Occupancy by Household Size in Fennville
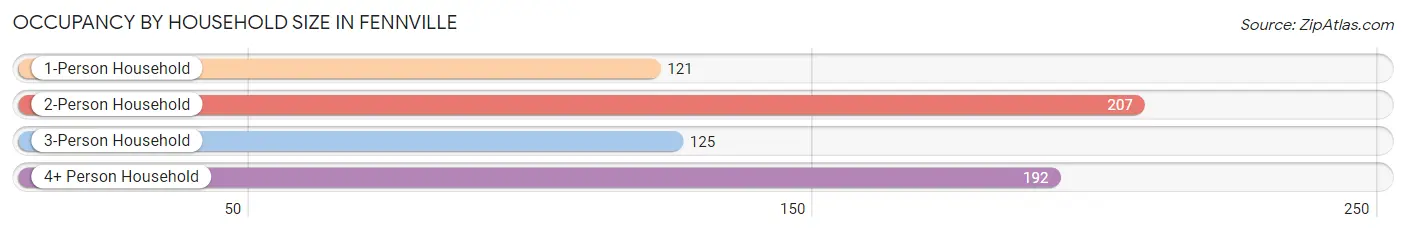
| Household Size | # Housing Units | % Housing Units |
| 1-Person Household | 121 | 18.8% |
| 2-Person Household | 207 | 32.1% |
| 3-Person Household | 125 | 19.4% |
| 4+ Person Household | 192 | 29.8% |
| Total Housing Units | 645 | 100.0% |
Occupancy by Ownership by Household Size in Fennville
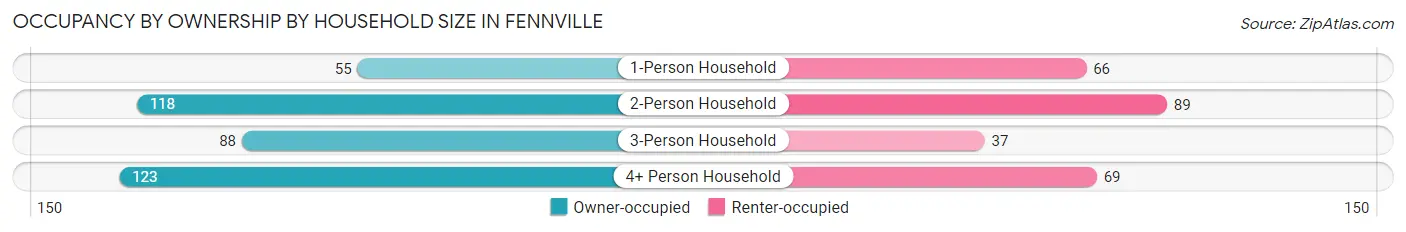
| Household Size | Owner-occupied | Renter-occupied |
| 1-Person Household | 55 (45.5%) | 66 (54.5%) |
| 2-Person Household | 118 (57.0%) | 89 (43.0%) |
| 3-Person Household | 88 (70.4%) | 37 (29.6%) |
| 4+ Person Household | 123 (64.1%) | 69 (35.9%) |
| Total Housing Units | 384 (59.5%) | 261 (40.5%) |
Occupancy by Educational Attainment in Fennville
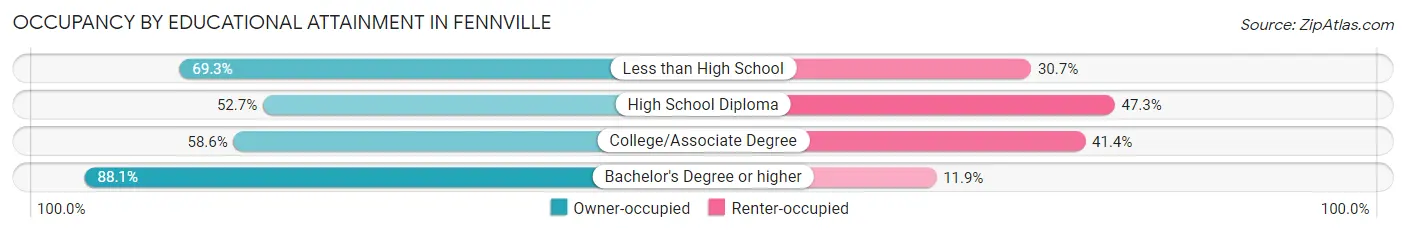
| Household Size | Owner-occupied | Renter-occupied |
| Less than High School | 70 (69.3%) | 31 (30.7%) |
| High School Diploma | 154 (52.7%) | 138 (47.3%) |
| College/Associate Degree | 123 (58.6%) | 87 (41.4%) |
| Bachelor's Degree or higher | 37 (88.1%) | 5 (11.9%) |
Occupancy by Age of Householder in Fennville
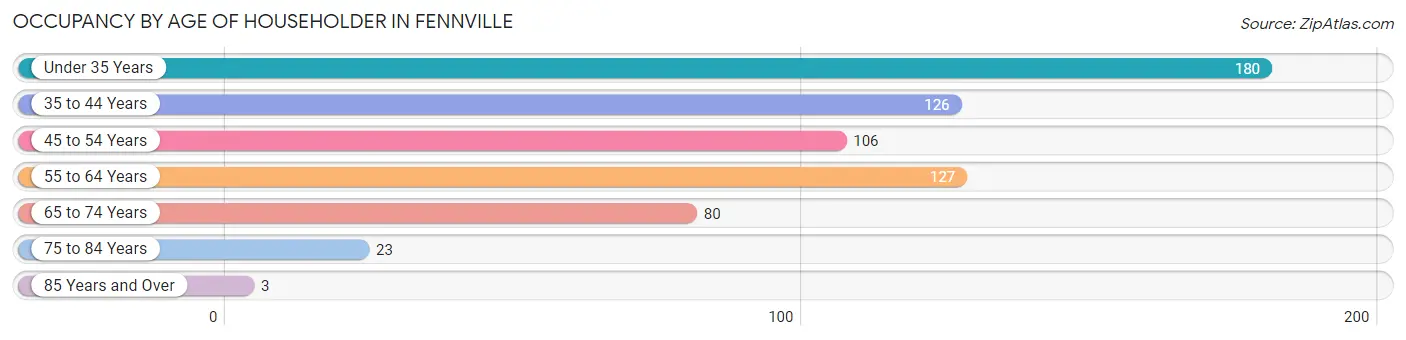
| Age Bracket | # Households | % Households |
| Under 35 Years | 180 | 27.9% |
| 35 to 44 Years | 126 | 19.5% |
| 45 to 54 Years | 106 | 16.4% |
| 55 to 64 Years | 127 | 19.7% |
| 65 to 74 Years | 80 | 12.4% |
| 75 to 84 Years | 23 | 3.6% |
| 85 Years and Over | 3 | 0.5% |
| Total | 645 | 100.0% |
Housing Finances in Fennville
Median Income by Occupancy in Fennville
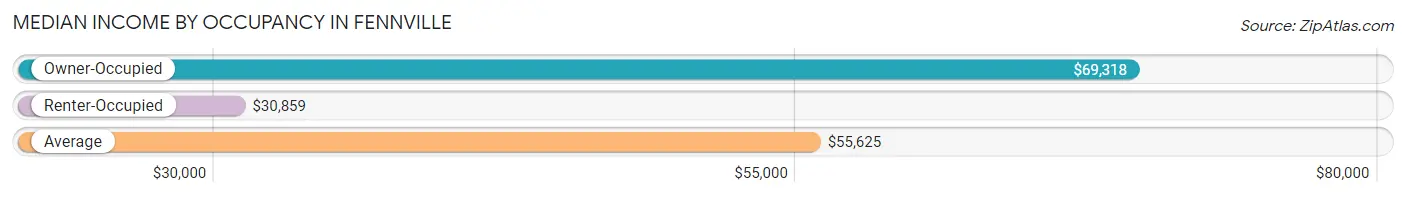
| Occupancy Type | # Households | Median Income |
| Owner-Occupied | 384 (59.5%) | $69,318 |
| Renter-Occupied | 261 (40.5%) | $30,859 |
| Average | 645 (100.0%) | $55,625 |
Occupancy by Householder Income Bracket in Fennville
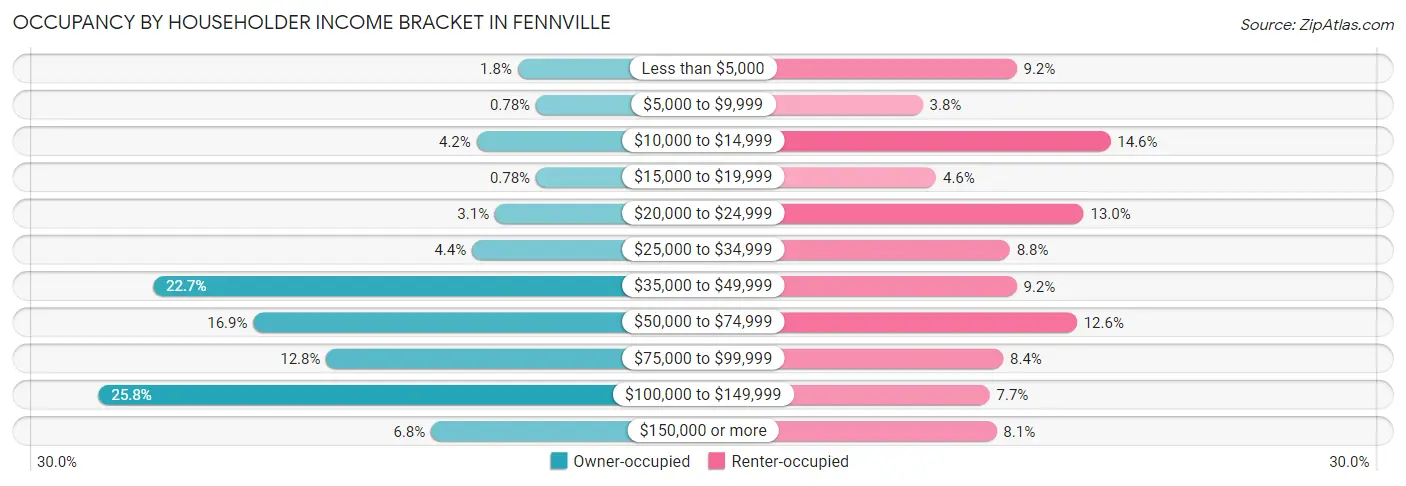
| Income Bracket | Owner-occupied | Renter-occupied |
| Less than $5,000 | 7 (1.8%) | 24 (9.2%) |
| $5,000 to $9,999 | 3 (0.8%) | 10 (3.8%) |
| $10,000 to $14,999 | 16 (4.2%) | 38 (14.6%) |
| $15,000 to $19,999 | 3 (0.8%) | 12 (4.6%) |
| $20,000 to $24,999 | 12 (3.1%) | 34 (13.0%) |
| $25,000 to $34,999 | 17 (4.4%) | 23 (8.8%) |
| $35,000 to $49,999 | 87 (22.7%) | 24 (9.2%) |
| $50,000 to $74,999 | 65 (16.9%) | 33 (12.6%) |
| $75,000 to $99,999 | 49 (12.8%) | 22 (8.4%) |
| $100,000 to $149,999 | 99 (25.8%) | 20 (7.7%) |
| $150,000 or more | 26 (6.8%) | 21 (8.1%) |
| Total | 384 (100.0%) | 261 (100.0%) |
Monthly Housing Cost Tiers in Fennville
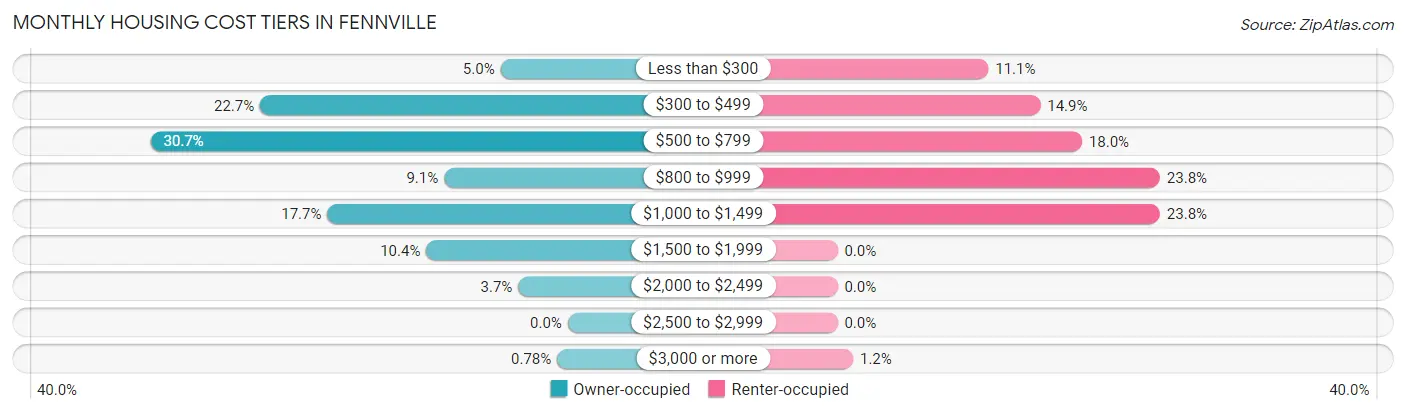
| Monthly Cost | Owner-occupied | Renter-occupied |
| Less than $300 | 19 (5.0%) | 29 (11.1%) |
| $300 to $499 | 87 (22.7%) | 39 (14.9%) |
| $500 to $799 | 118 (30.7%) | 47 (18.0%) |
| $800 to $999 | 35 (9.1%) | 62 (23.7%) |
| $1,000 to $1,499 | 68 (17.7%) | 62 (23.7%) |
| $1,500 to $1,999 | 40 (10.4%) | 0 (0.0%) |
| $2,000 to $2,499 | 14 (3.6%) | 0 (0.0%) |
| $2,500 to $2,999 | 0 (0.0%) | 0 (0.0%) |
| $3,000 or more | 3 (0.8%) | 3 (1.1%) |
| Total | 384 (100.0%) | 261 (100.0%) |
Physical Housing Characteristics in Fennville
Housing Structures in Fennville
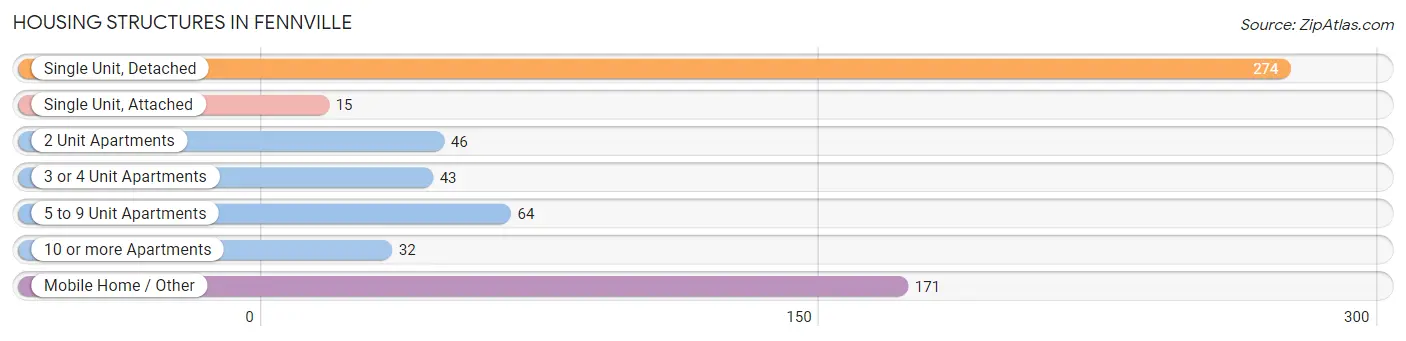
| Structure Type | # Housing Units | % Housing Units |
| Single Unit, Detached | 274 | 42.5% |
| Single Unit, Attached | 15 | 2.3% |
| 2 Unit Apartments | 46 | 7.1% |
| 3 or 4 Unit Apartments | 43 | 6.7% |
| 5 to 9 Unit Apartments | 64 | 9.9% |
| 10 or more Apartments | 32 | 5.0% |
| Mobile Home / Other | 171 | 26.5% |
| Total | 645 | 100.0% |
Housing Structures by Occupancy in Fennville
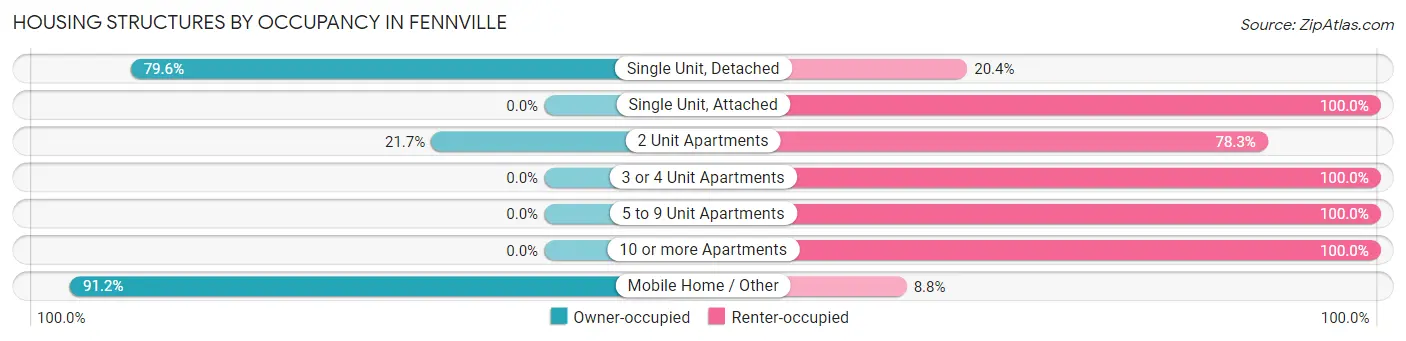
| Structure Type | Owner-occupied | Renter-occupied |
| Single Unit, Detached | 218 (79.6%) | 56 (20.4%) |
| Single Unit, Attached | 0 (0.0%) | 15 (100.0%) |
| 2 Unit Apartments | 10 (21.7%) | 36 (78.3%) |
| 3 or 4 Unit Apartments | 0 (0.0%) | 43 (100.0%) |
| 5 to 9 Unit Apartments | 0 (0.0%) | 64 (100.0%) |
| 10 or more Apartments | 0 (0.0%) | 32 (100.0%) |
| Mobile Home / Other | 156 (91.2%) | 15 (8.8%) |
| Total | 384 (59.5%) | 261 (40.5%) |
Housing Structures by Number of Rooms in Fennville
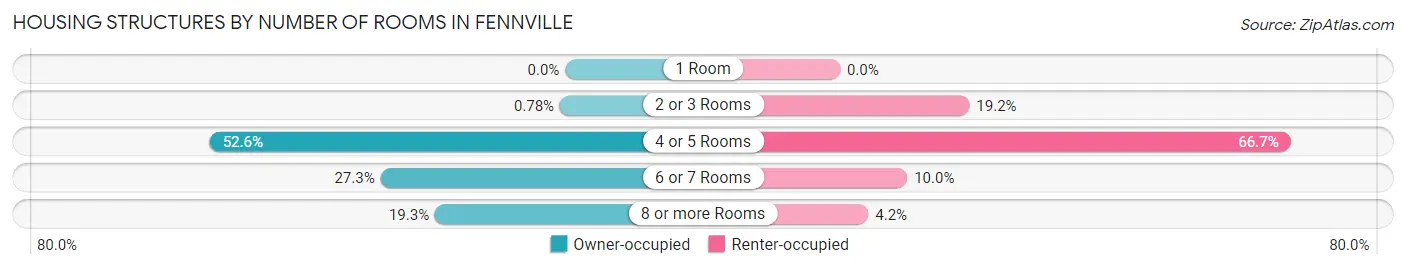
| Number of Rooms | Owner-occupied | Renter-occupied |
| 1 Room | 0 (0.0%) | 0 (0.0%) |
| 2 or 3 Rooms | 3 (0.8%) | 50 (19.2%) |
| 4 or 5 Rooms | 202 (52.6%) | 174 (66.7%) |
| 6 or 7 Rooms | 105 (27.3%) | 26 (10.0%) |
| 8 or more Rooms | 74 (19.3%) | 11 (4.2%) |
| Total | 384 (100.0%) | 261 (100.0%) |
Housing Structure by Heating Type in Fennville
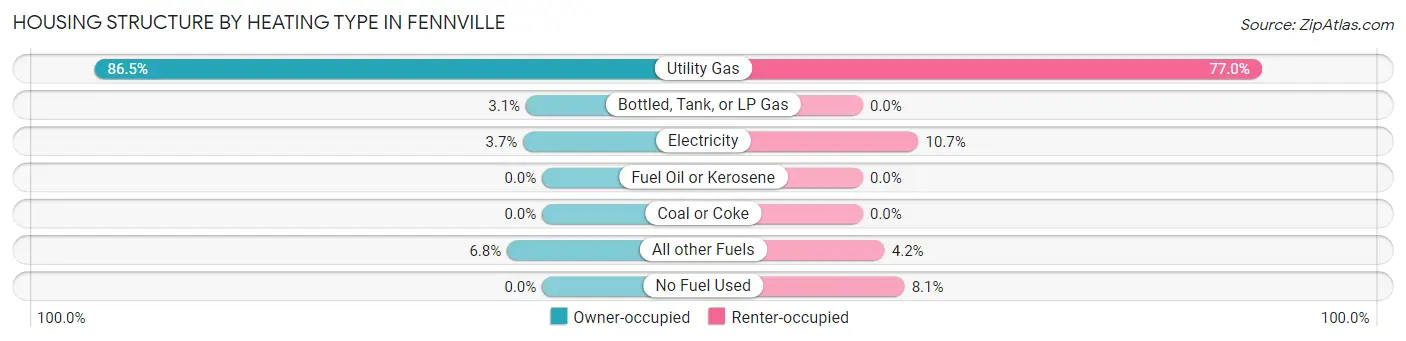
| Heating Type | Owner-occupied | Renter-occupied |
| Utility Gas | 332 (86.5%) | 201 (77.0%) |
| Bottled, Tank, or LP Gas | 12 (3.1%) | 0 (0.0%) |
| Electricity | 14 (3.6%) | 28 (10.7%) |
| Fuel Oil or Kerosene | 0 (0.0%) | 0 (0.0%) |
| Coal or Coke | 0 (0.0%) | 0 (0.0%) |
| All other Fuels | 26 (6.8%) | 11 (4.2%) |
| No Fuel Used | 0 (0.0%) | 21 (8.1%) |
| Total | 384 (100.0%) | 261 (100.0%) |
Household Vehicle Usage in Fennville
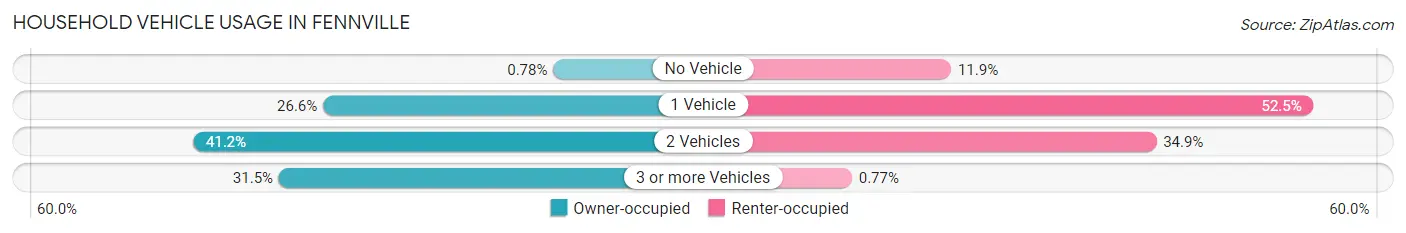
| Vehicles per Household | Owner-occupied | Renter-occupied |
| No Vehicle | 3 (0.8%) | 31 (11.9%) |
| 1 Vehicle | 102 (26.6%) | 137 (52.5%) |
| 2 Vehicles | 158 (41.1%) | 91 (34.9%) |
| 3 or more Vehicles | 121 (31.5%) | 2 (0.8%) |
| Total | 384 (100.0%) | 261 (100.0%) |
Real Estate & Mortgages in Fennville
Real Estate and Mortgage Overview in Fennville
| Characteristic | Without Mortgage | With Mortgage |
| Housing Units | 179 | 205 |
| Median Property Value | $84,000 | $140,500 |
| Median Household Income | $46,094 | $26 |
| Monthly Housing Costs | $443 | $0 |
| Real Estate Taxes | $1,763 | $82 |
Property Value by Mortgage Status in Fennville
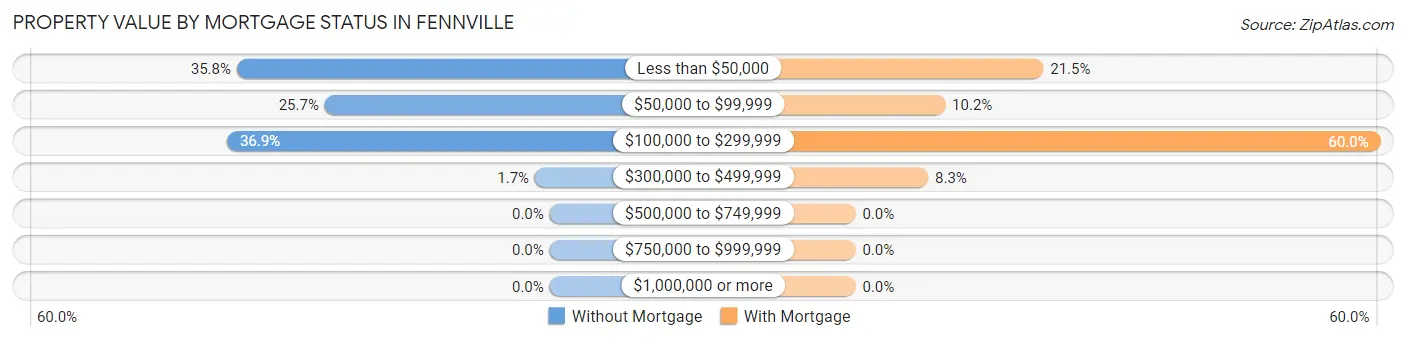
| Property Value | Without Mortgage | With Mortgage |
| Less than $50,000 | 64 (35.7%) | 44 (21.5%) |
| $50,000 to $99,999 | 46 (25.7%) | 21 (10.2%) |
| $100,000 to $299,999 | 66 (36.9%) | 123 (60.0%) |
| $300,000 to $499,999 | 3 (1.7%) | 17 (8.3%) |
| $500,000 to $749,999 | 0 (0.0%) | 0 (0.0%) |
| $750,000 to $999,999 | 0 (0.0%) | 0 (0.0%) |
| $1,000,000 or more | 0 (0.0%) | 0 (0.0%) |
| Total | 179 (100.0%) | 205 (100.0%) |
Household Income by Mortgage Status in Fennville
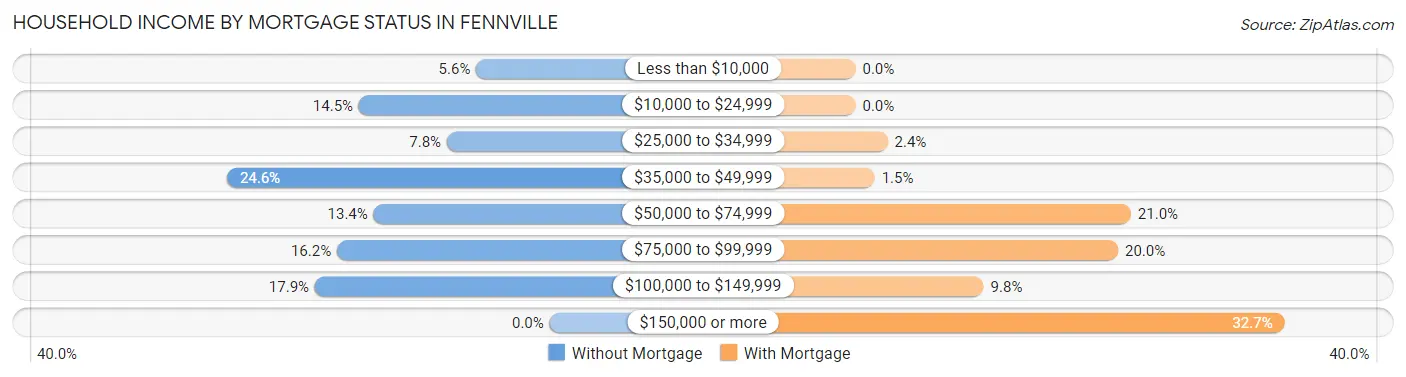
| Household Income | Without Mortgage | With Mortgage |
| Less than $10,000 | 10 (5.6%) | 0 (0.0%) |
| $10,000 to $24,999 | 26 (14.5%) | 0 (0.0%) |
| $25,000 to $34,999 | 14 (7.8%) | 5 (2.4%) |
| $35,000 to $49,999 | 44 (24.6%) | 3 (1.5%) |
| $50,000 to $74,999 | 24 (13.4%) | 43 (21.0%) |
| $75,000 to $99,999 | 29 (16.2%) | 41 (20.0%) |
| $100,000 to $149,999 | 32 (17.9%) | 20 (9.8%) |
| $150,000 or more | 0 (0.0%) | 67 (32.7%) |
| Total | 179 (100.0%) | 205 (100.0%) |
Property Value to Household Income Ratio in Fennville
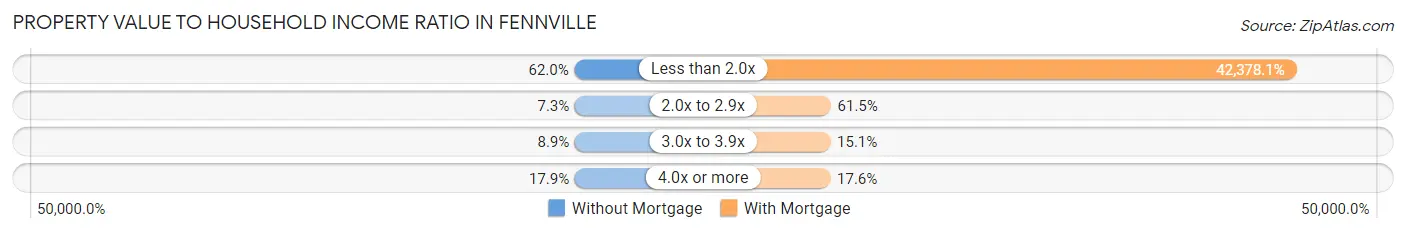
| Value-to-Income Ratio | Without Mortgage | With Mortgage |
| Less than 2.0x | 111 (62.0%) | 86,875 (42,378.1%) |
| 2.0x to 2.9x | 13 (7.3%) | 126 (61.5%) |
| 3.0x to 3.9x | 16 (8.9%) | 31 (15.1%) |
| 4.0x or more | 32 (17.9%) | 36 (17.6%) |
| Total | 179 (100.0%) | 205 (100.0%) |
Real Estate Taxes by Mortgage Status in Fennville
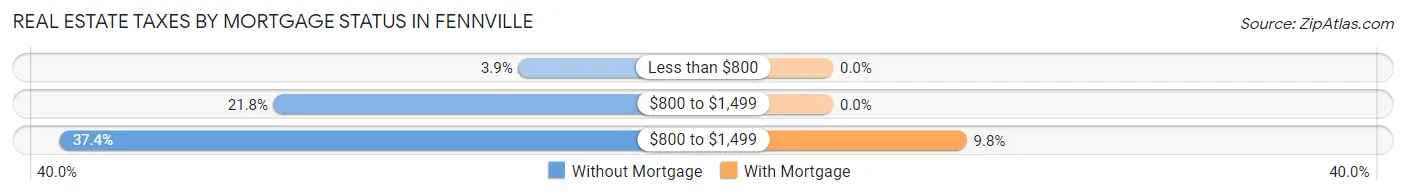
| Property Taxes | Without Mortgage | With Mortgage |
| Less than $800 | 7 (3.9%) | 0 (0.0%) |
| $800 to $1,499 | 39 (21.8%) | 0 (0.0%) |
| $800 to $1,499 | 67 (37.4%) | 20 (9.8%) |
| Total | 179 (100.0%) | 205 (100.0%) |
Health & Disability in Fennville
Health Insurance Coverage by Age in Fennville
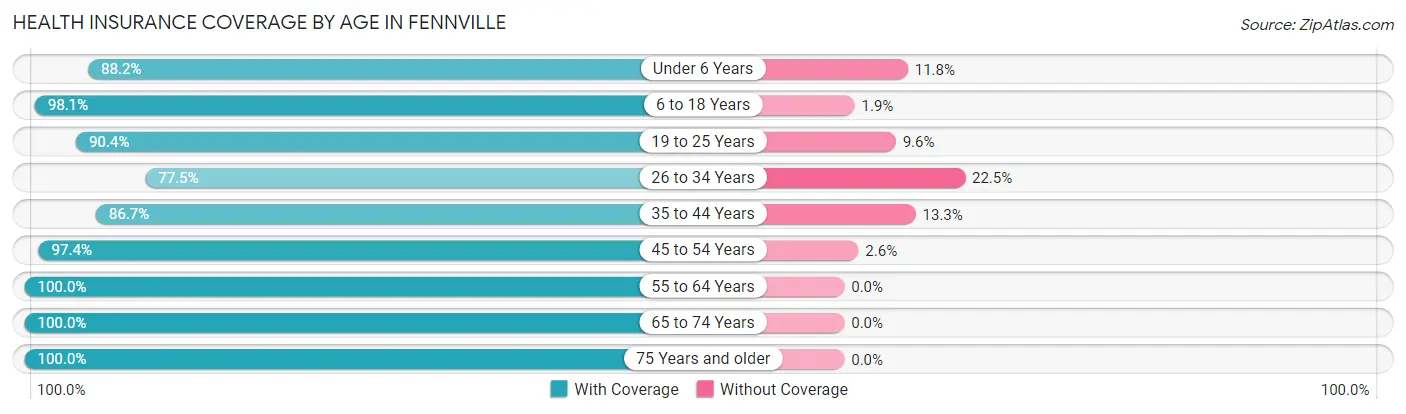
| Age Bracket | With Coverage | Without Coverage |
| Under 6 Years | 134 (88.2%) | 18 (11.8%) |
| 6 to 18 Years | 408 (98.1%) | 8 (1.9%) |
| 19 to 25 Years | 245 (90.4%) | 26 (9.6%) |
| 26 to 34 Years | 272 (77.5%) | 79 (22.5%) |
| 35 to 44 Years | 163 (86.7%) | 25 (13.3%) |
| 45 to 54 Years | 148 (97.4%) | 4 (2.6%) |
| 55 to 64 Years | 209 (100.0%) | 0 (0.0%) |
| 65 to 74 Years | 103 (100.0%) | 0 (0.0%) |
| 75 Years and older | 34 (100.0%) | 0 (0.0%) |
| Total | 1,716 (91.5%) | 160 (8.5%) |
Health Insurance Coverage by Citizenship Status in Fennville
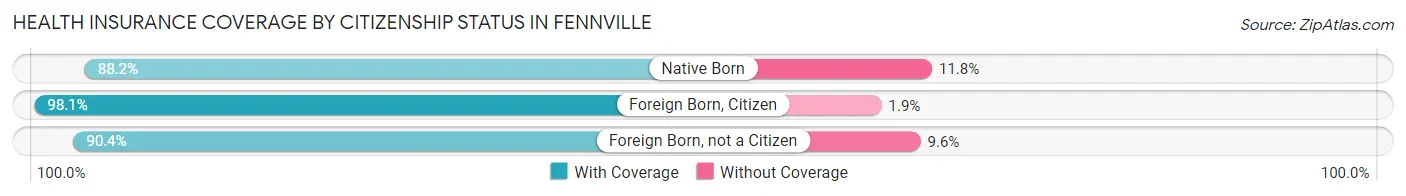
| Citizenship Status | With Coverage | Without Coverage |
| Native Born | 134 (88.2%) | 18 (11.8%) |
| Foreign Born, Citizen | 408 (98.1%) | 8 (1.9%) |
| Foreign Born, not a Citizen | 245 (90.4%) | 26 (9.6%) |
Health Insurance Coverage by Household Income in Fennville
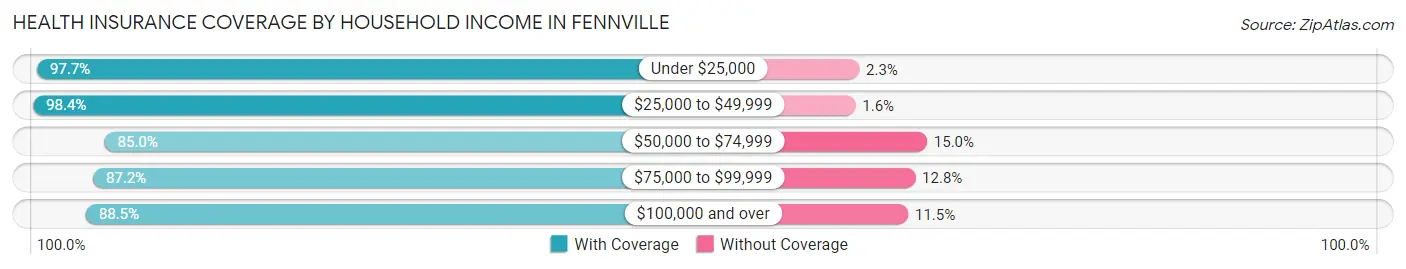
| Household Income | With Coverage | Without Coverage |
| Under $25,000 | 338 (97.7%) | 8 (2.3%) |
| $25,000 to $49,999 | 367 (98.4%) | 6 (1.6%) |
| $50,000 to $74,999 | 255 (85.0%) | 45 (15.0%) |
| $75,000 to $99,999 | 177 (87.2%) | 26 (12.8%) |
| $100,000 and over | 579 (88.5%) | 75 (11.5%) |
Public vs Private Health Insurance Coverage by Age in Fennville
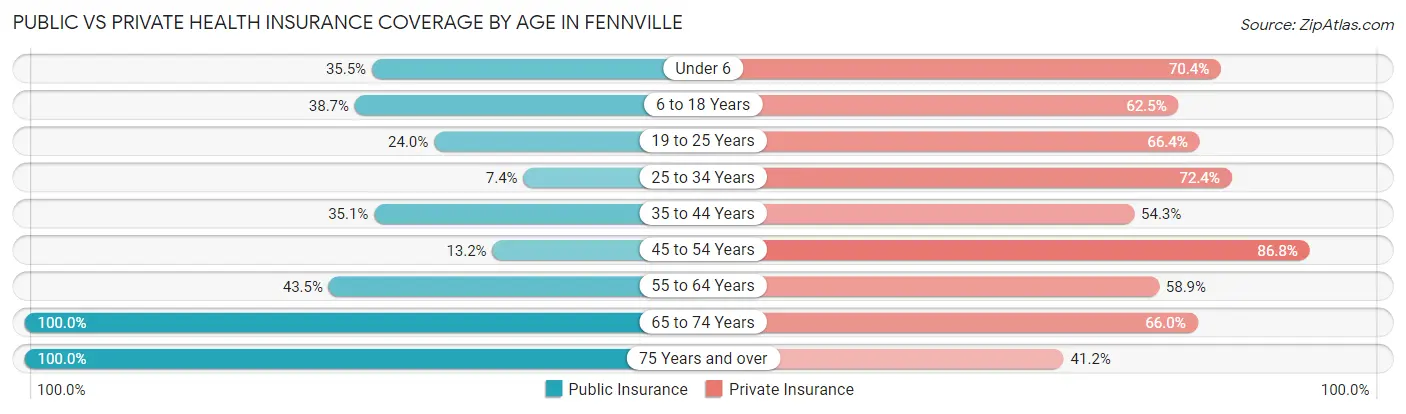
| Age Bracket | Public Insurance | Private Insurance |
| Under 6 | 54 (35.5%) | 107 (70.4%) |
| 6 to 18 Years | 161 (38.7%) | 260 (62.5%) |
| 19 to 25 Years | 65 (24.0%) | 180 (66.4%) |
| 25 to 34 Years | 26 (7.4%) | 254 (72.4%) |
| 35 to 44 Years | 66 (35.1%) | 102 (54.3%) |
| 45 to 54 Years | 20 (13.2%) | 132 (86.8%) |
| 55 to 64 Years | 91 (43.5%) | 123 (58.9%) |
| 65 to 74 Years | 103 (100.0%) | 68 (66.0%) |
| 75 Years and over | 34 (100.0%) | 14 (41.2%) |
| Total | 620 (33.1%) | 1,240 (66.1%) |
Disability Status by Sex by Age in Fennville
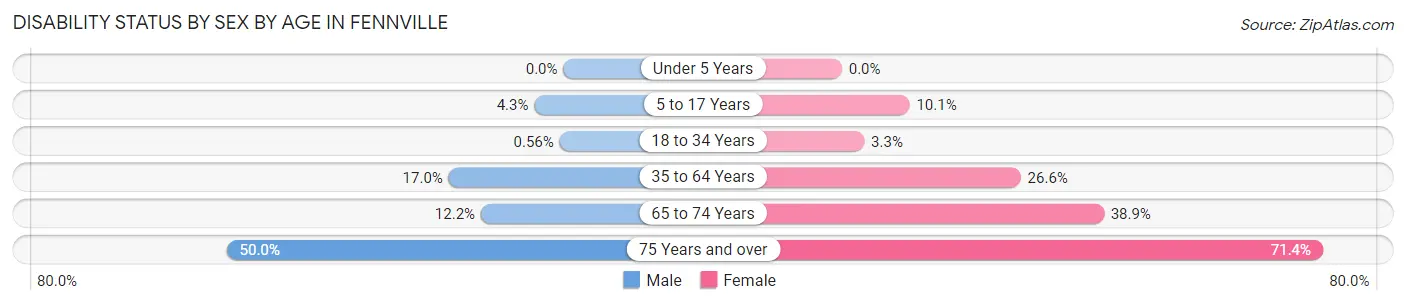
| Age Bracket | Male | Female |
| Under 5 Years | 0 (0.0%) | 0 (0.0%) |
| 5 to 17 Years | 9 (4.3%) | 20 (10.1%) |
| 18 to 34 Years | 2 (0.6%) | 10 (3.3%) |
| 35 to 64 Years | 39 (17.0%) | 85 (26.6%) |
| 65 to 74 Years | 6 (12.2%) | 21 (38.9%) |
| 75 Years and over | 3 (50.0%) | 20 (71.4%) |
Disability Class by Sex by Age in Fennville
Disability Class: Hearing Difficulty
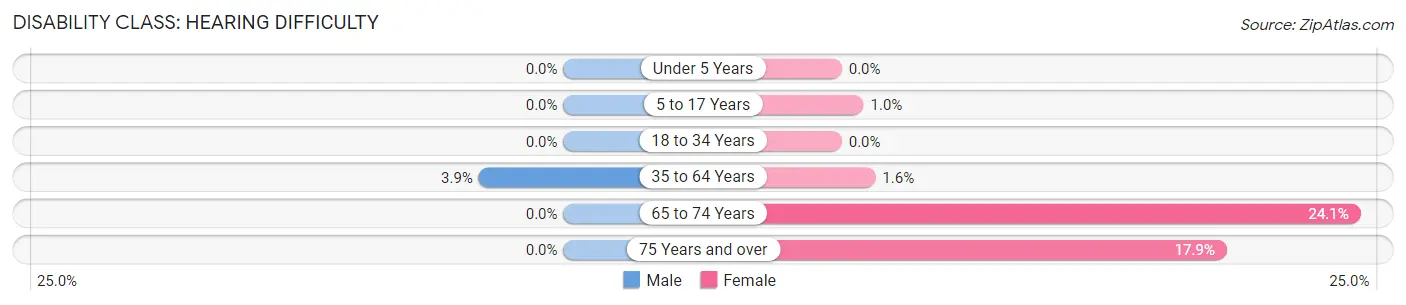
| Age Bracket | Male | Female |
| Under 5 Years | 0 (0.0%) | 0 (0.0%) |
| 5 to 17 Years | 0 (0.0%) | 2 (1.0%) |
| 18 to 34 Years | 0 (0.0%) | 0 (0.0%) |
| 35 to 64 Years | 9 (3.9%) | 5 (1.6%) |
| 65 to 74 Years | 0 (0.0%) | 13 (24.1%) |
| 75 Years and over | 0 (0.0%) | 5 (17.9%) |
Disability Class: Vision Difficulty
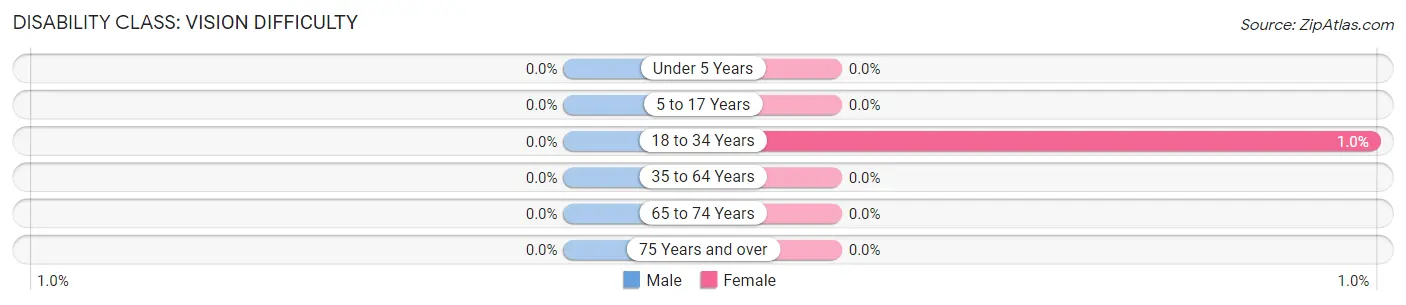
| Age Bracket | Male | Female |
| Under 5 Years | 0 (0.0%) | 0 (0.0%) |
| 5 to 17 Years | 0 (0.0%) | 0 (0.0%) |
| 18 to 34 Years | 0 (0.0%) | 3 (1.0%) |
| 35 to 64 Years | 0 (0.0%) | 0 (0.0%) |
| 65 to 74 Years | 0 (0.0%) | 0 (0.0%) |
| 75 Years and over | 0 (0.0%) | 0 (0.0%) |
Disability Class: Cognitive Difficulty
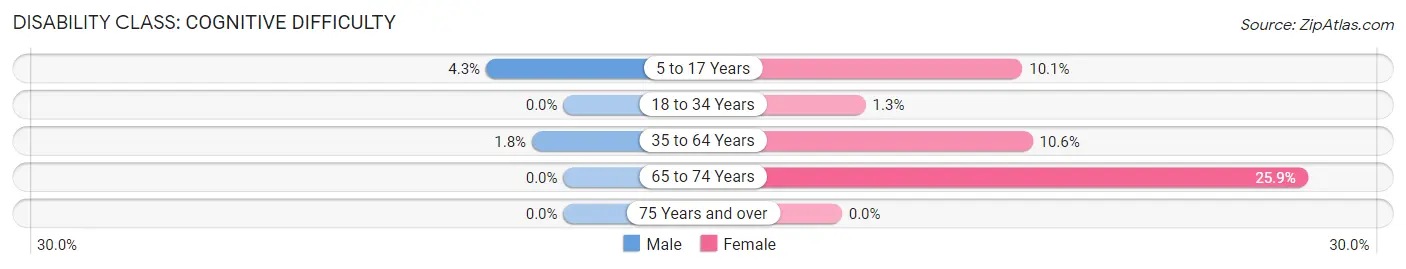
| Age Bracket | Male | Female |
| 5 to 17 Years | 9 (4.3%) | 20 (10.1%) |
| 18 to 34 Years | 0 (0.0%) | 4 (1.3%) |
| 35 to 64 Years | 4 (1.8%) | 34 (10.6%) |
| 65 to 74 Years | 0 (0.0%) | 14 (25.9%) |
| 75 Years and over | 0 (0.0%) | 0 (0.0%) |
Disability Class: Ambulatory Difficulty
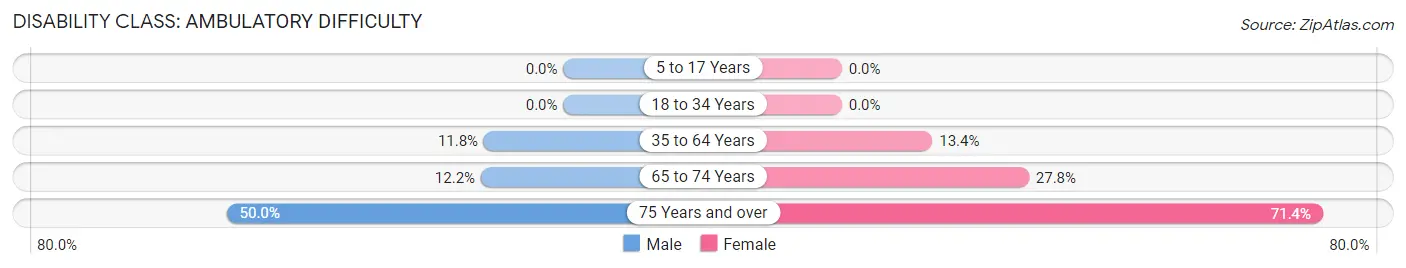
| Age Bracket | Male | Female |
| 5 to 17 Years | 0 (0.0%) | 0 (0.0%) |
| 18 to 34 Years | 0 (0.0%) | 0 (0.0%) |
| 35 to 64 Years | 27 (11.8%) | 43 (13.4%) |
| 65 to 74 Years | 6 (12.2%) | 15 (27.8%) |
| 75 Years and over | 3 (50.0%) | 20 (71.4%) |
Disability Class: Self-Care Difficulty
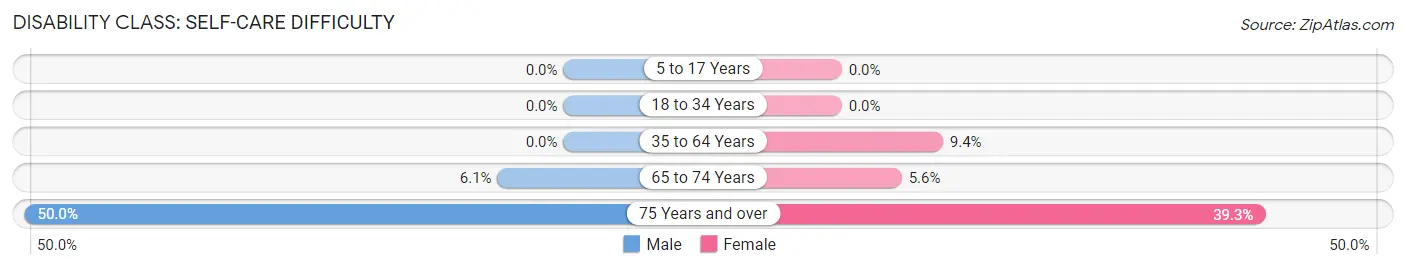
| Age Bracket | Male | Female |
| 5 to 17 Years | 0 (0.0%) | 0 (0.0%) |
| 18 to 34 Years | 0 (0.0%) | 0 (0.0%) |
| 35 to 64 Years | 0 (0.0%) | 30 (9.4%) |
| 65 to 74 Years | 3 (6.1%) | 3 (5.6%) |
| 75 Years and over | 3 (50.0%) | 11 (39.3%) |
Technology Access in Fennville
Computing Device Access in Fennville
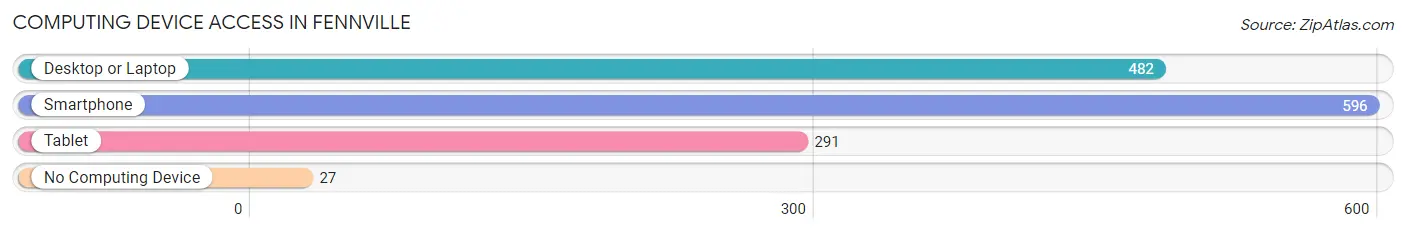
| Device Type | # Households | % Households |
| Desktop or Laptop | 482 | 74.7% |
| Smartphone | 596 | 92.4% |
| Tablet | 291 | 45.1% |
| No Computing Device | 27 | 4.2% |
| Total | 645 | 100.0% |
Internet Access in Fennville
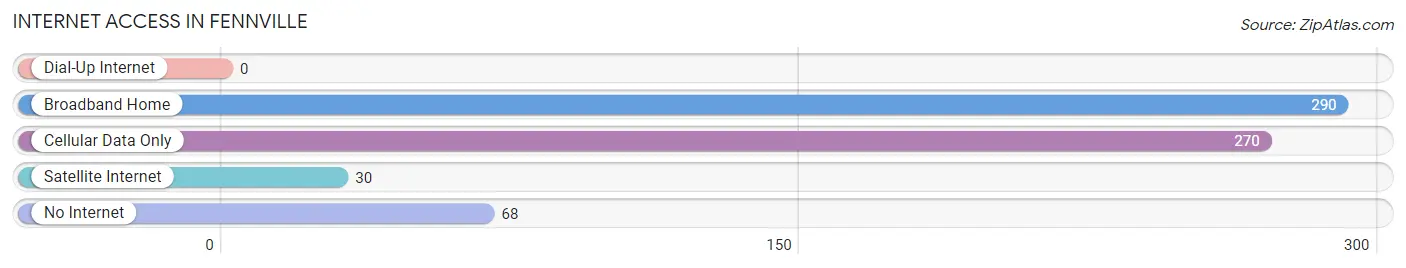
| Internet Type | # Households | % Households |
| Dial-Up Internet | 0 | 0.0% |
| Broadband Home | 290 | 45.0% |
| Cellular Data Only | 270 | 41.9% |
| Satellite Internet | 30 | 4.6% |
| No Internet | 68 | 10.5% |
| Total | 645 | 100.0% |
Fennville Summary
Fennville is a small city located in Allegan County, Michigan. It is situated on the eastern shore of Lake Michigan, about 25 miles south of Grand Rapids. The city has a population of 1,845 people, according to the 2010 census.
History
Fennville was founded in 1837 by William Fenn, a settler from New York. The city was originally known as Fenn’s Village, but the name was changed to Fennville in 1845. The city was incorporated in 1867.
Fennville was an important stop on the Grand Rapids and Indiana Railroad, which ran through the city from 1867 to 1971. The railroad was a major factor in the city’s growth and development.
In the late 19th century, Fennville was a major producer of hops, a key ingredient in beer. The city was also home to several factories, including a furniture factory, a canning factory, and a brickyard.
Geography
Fennville is located in southwestern Michigan, about 25 miles south of Grand Rapids. The city is situated on the eastern shore of Lake Michigan, and is bordered by the cities of Saugatuck and Douglas to the north, and the townships of Manlius and Ganges to the south.
The city has a total area of 1.3 square miles, all of which is land. The terrain is mostly flat, with some rolling hills. The city is located in the Kalamazoo River watershed.
Economy
Fennville’s economy is largely based on agriculture and tourism. The city is home to several wineries and breweries, as well as several fruit farms. The city is also home to several small businesses, including restaurants, shops, and art galleries.
Demographics
According to the 2010 census, Fennville has a population of 1,845 people. The racial makeup of the city is 87.3% White, 8.2% African American, 0.7% Native American, 0.4% Asian, 0.1% Pacific Islander, and 2.3% from other races.
The median household income in Fennville is $37,917, and the median family income is $45,938. The per capita income is $20,845. About 11.3% of the population is below the poverty line.
Conclusion
Fennville is a small city located in Allegan County, Michigan. It was founded in 1837 and has a population of 1,845 people, according to the 2010 census. The city’s economy is largely based on agriculture and tourism, and it is home to several wineries and breweries, as well as several small businesses. The racial makeup of the city is 87.3% White, 8.2% African American, 0.7% Native American, 0.4% Asian, 0.1% Pacific Islander, and 2.3% from other races. The median household income in Fennville is $37,917, and the median family income is $45,938. About 11.3% of the population is below the poverty line.
Common Questions
What is Per Capita Income in Fennville?
Per Capita income in Fennville is $28,697.
What is the Median Family Income in Fennville?
Median Family Income in Fennville is $60,714.
What is the Median Household income in Fennville?
Median Household Income in Fennville is $55,625.
What is Income or Wage Gap in Fennville?
Income or Wage Gap in Fennville is 48.4%.
Women in Fennville earn 51.6 cents for every dollar earned by a man.
What is Inequality or Gini Index in Fennville?
Inequality or Gini Index in Fennville is 0.54.
What is the Total Population of Fennville?
Total Population of Fennville is 1,876.
What is the Total Male Population of Fennville?
Total Male Population of Fennville is 901.
What is the Total Female Population of Fennville?
Total Female Population of Fennville is 975.
What is the Ratio of Males per 100 Females in Fennville?
There are 92.41 Males per 100 Females in Fennville.
What is the Ratio of Females per 100 Males in Fennville?
There are 108.21 Females per 100 Males in Fennville.
What is the Median Population Age in Fennville?
Median Population Age in Fennville is 27.7 Years.
What is the Average Family Size in Fennville
Average Family Size in Fennville is 3.2 People.
What is the Average Household Size in Fennville
Average Household Size in Fennville is 2.9 People.
How Large is the Labor Force in Fennville?
There are 885 People in the Labor Forcein in Fennville.
What is the Percentage of People in the Labor Force in Fennville?
62.2% of People are in the Labor Force in Fennville.
What is the Unemployment Rate in Fennville?
Unemployment Rate in Fennville is 4.7%.