Grayling, MI Map & Demographics
Grayling Map
Grayling Overview
$21,605
PER CAPITA INCOME
$48,125
AVG FAMILY INCOME
$30,417
AVG HOUSEHOLD INCOME
3.4%
WAGE / INCOME GAP [ % ]
96.6¢/ $1
WAGE / INCOME GAP [ $ ]
0.44
INEQUALITY / GINI INDEX
1,758
TOTAL POPULATION
828
MALE POPULATION
930
FEMALE POPULATION
89.03
MALES / 100 FEMALES
112.32
FEMALES / 100 MALES
48.8
MEDIAN AGE
2.9
AVG FAMILY SIZE
2.1
AVG HOUSEHOLD SIZE
593
LABOR FORCE [ PEOPLE ]
41.5%
PERCENT IN LABOR FORCE
7.0%
UNEMPLOYMENT RATE
Grayling Zip Codes
Grayling Area Codes
Income in Grayling
Income Overview in Grayling
Per Capita Income in Grayling is $21,605, while median incomes of families and households are $48,125 and $30,417 respectively.
| Characteristic | Number | Measure |
| Per Capita Income | 1,758 | $21,605 |
| Median Family Income | 384 | $48,125 |
| Mean Family Income | 384 | $58,646 |
| Median Household Income | 761 | $30,417 |
| Mean Household Income | 761 | $44,041 |
| Income Deficit | 384 | $0 |
| Wage / Income Gap (%) | 1,758 | 3.42% |
| Wage / Income Gap ($) | 1,758 | 96.58¢ per $1 |
| Gini / Inequality Index | 1,758 | 0.44 |
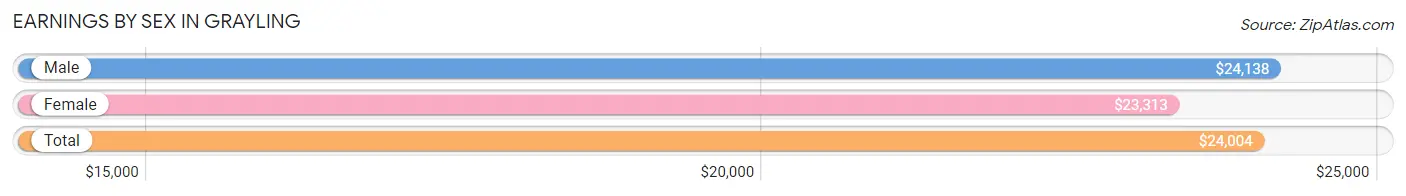
Earnings by Sex in Grayling
Average Earnings in Grayling are $24,004, $24,138 for men and $23,313 for women, a difference of 3.4%.
| Sex | Number | Average Earnings |
| Male | 381 (54.6%) | $24,138 |
| Female | 317 (45.4%) | $23,313 |
| Total | 698 (100.0%) | $24,004 |
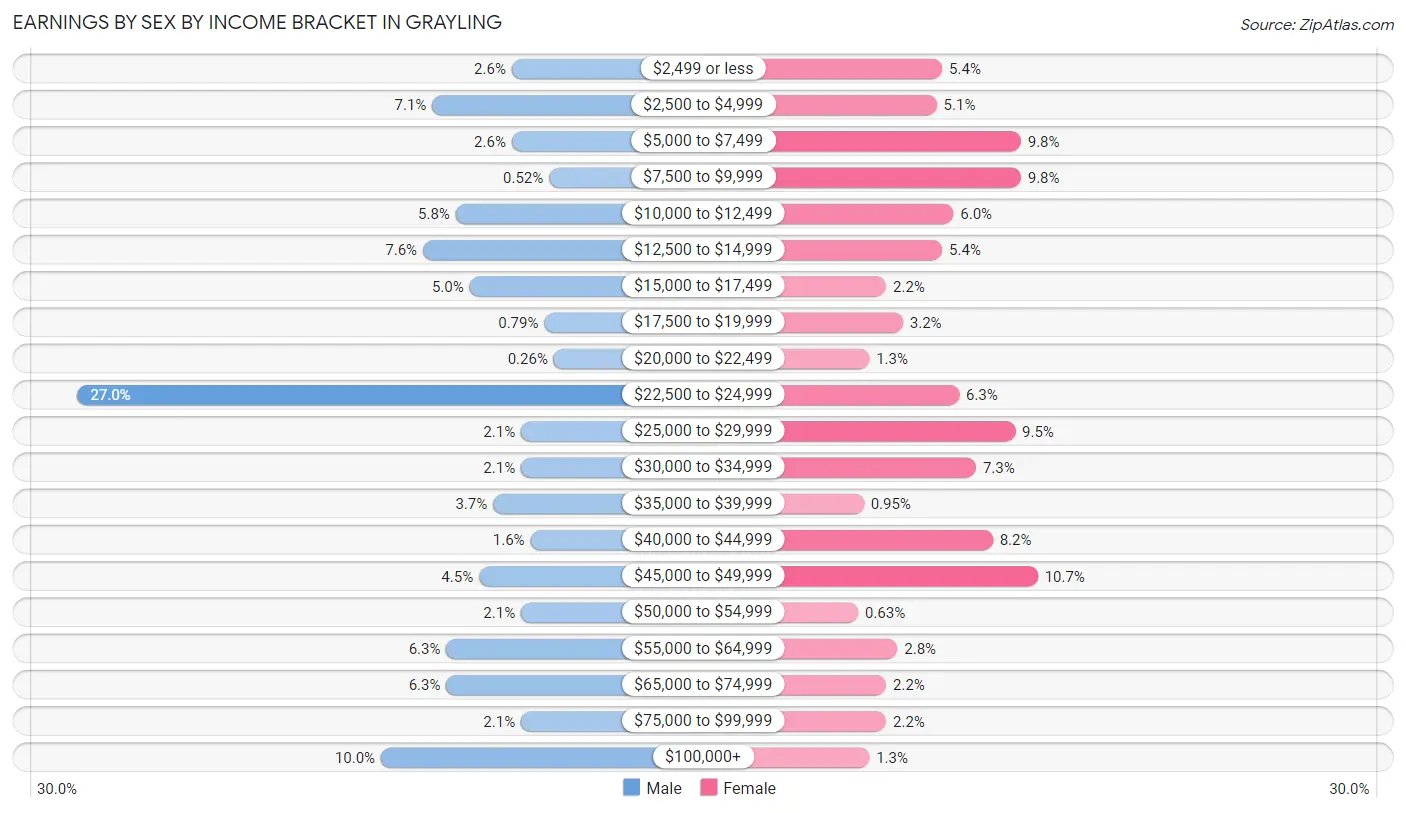
Earnings by Sex by Income Bracket in Grayling
The most common earnings brackets in Grayling are $22,500 to $24,999 for men (103 | 27.0%) and $45,000 to $49,999 for women (34 | 10.7%).
| Income | Male | Female |
| $2,499 or less | 10 (2.6%) | 17 (5.4%) |
| $2,500 to $4,999 | 27 (7.1%) | 16 (5.1%) |
| $5,000 to $7,499 | 10 (2.6%) | 31 (9.8%) |
| $7,500 to $9,999 | 2 (0.5%) | 31 (9.8%) |
| $10,000 to $12,499 | 22 (5.8%) | 19 (6.0%) |
| $12,500 to $14,999 | 29 (7.6%) | 17 (5.4%) |
| $15,000 to $17,499 | 19 (5.0%) | 7 (2.2%) |
| $17,500 to $19,999 | 3 (0.8%) | 10 (3.2%) |
| $20,000 to $22,499 | 1 (0.3%) | 4 (1.3%) |
| $22,500 to $24,999 | 103 (27.0%) | 20 (6.3%) |
| $25,000 to $29,999 | 8 (2.1%) | 30 (9.5%) |
| $30,000 to $34,999 | 8 (2.1%) | 23 (7.3%) |
| $35,000 to $39,999 | 14 (3.7%) | 3 (0.9%) |
| $40,000 to $44,999 | 6 (1.6%) | 26 (8.2%) |
| $45,000 to $49,999 | 17 (4.5%) | 34 (10.7%) |
| $50,000 to $54,999 | 8 (2.1%) | 2 (0.6%) |
| $55,000 to $64,999 | 24 (6.3%) | 9 (2.8%) |
| $65,000 to $74,999 | 24 (6.3%) | 7 (2.2%) |
| $75,000 to $99,999 | 8 (2.1%) | 7 (2.2%) |
| $100,000+ | 38 (10.0%) | 4 (1.3%) |
| Total | 381 (100.0%) | 317 (100.0%) |
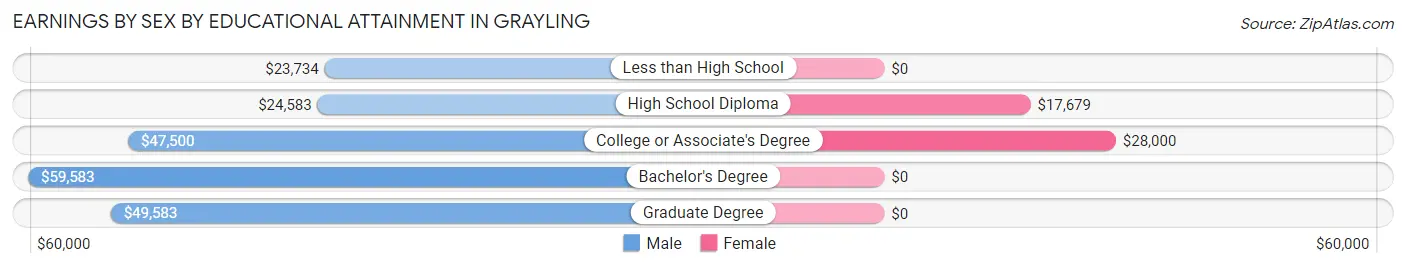
Earnings by Sex by Educational Attainment in Grayling
Average earnings in Grayling are $24,760 for men and $24,609 for women, a difference of 0.6%. Men with an educational attainment of bachelor's degree enjoy the highest average annual earnings of $59,583, while those with less than high school education earn the least with $23,734. Women with an educational attainment of college or associate's degree earn the most with the average annual earnings of $28,000, while those with high school diploma education have the smallest earnings of $17,679.
| Educational Attainment | Male Income | Female Income |
| Less than High School | $23,734 | $0 |
| High School Diploma | $24,583 | $17,679 |
| College or Associate's Degree | $47,500 | $28,000 |
| Bachelor's Degree | $59,583 | $0 |
| Graduate Degree | $49,583 | $0 |
| Total | $24,760 | $24,609 |
Family Income in Grayling
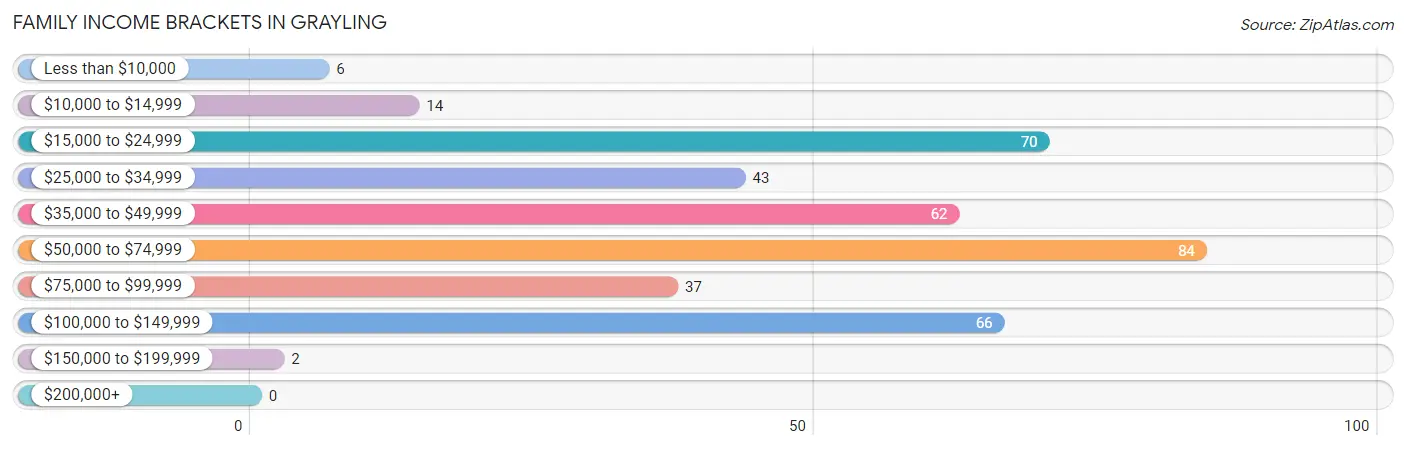
Family Income Brackets in Grayling
According to the Grayling family income data, there are 84 families falling into the $50,000 to $74,999 income range, which is the most common income bracket and makes up 21.9% of all families.
| Income Bracket | # Families | % Families |
| Less than $10,000 | 6 | 1.6% |
| $10,000 to $14,999 | 14 | 3.6% |
| $15,000 to $24,999 | 70 | 18.2% |
| $25,000 to $34,999 | 43 | 11.2% |
| $35,000 to $49,999 | 62 | 16.1% |
| $50,000 to $74,999 | 84 | 21.9% |
| $75,000 to $99,999 | 37 | 9.6% |
| $100,000 to $149,999 | 66 | 17.2% |
| $150,000 to $199,999 | 2 | 0.5% |
| $200,000+ | 0 | 0.0% |
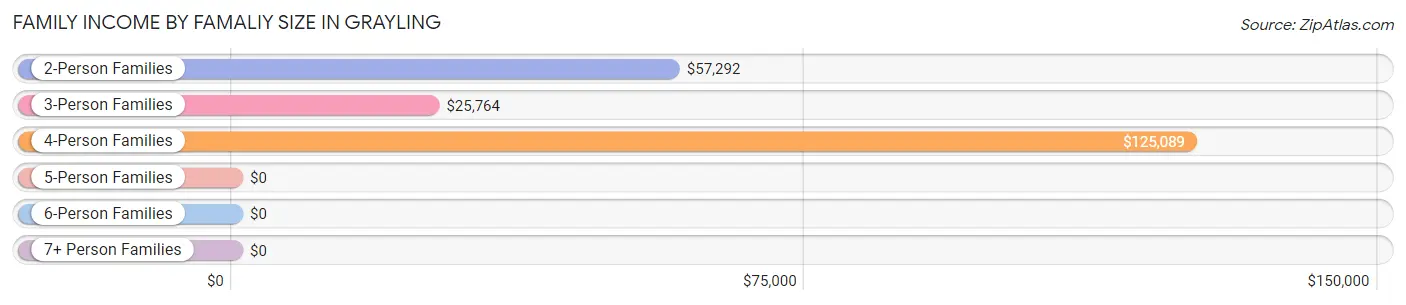
Family Income by Famaliy Size in Grayling
4-person families (31 | 8.1%) account for the highest median family income in Grayling with $125,089 per family, while 4-person families (31 | 8.1%) have the highest median income of $31,272 per family member.
| Income Bracket | # Families | Median Income |
| 2-Person Families | 235 (61.2%) | $57,292 |
| 3-Person Families | 81 (21.1%) | $25,764 |
| 4-Person Families | 31 (8.1%) | $125,089 |
| 5-Person Families | 10 (2.6%) | $0 |
| 6-Person Families | 20 (5.2%) | $0 |
| 7+ Person Families | 7 (1.8%) | $0 |
| Total | 384 (100.0%) | $48,125 |
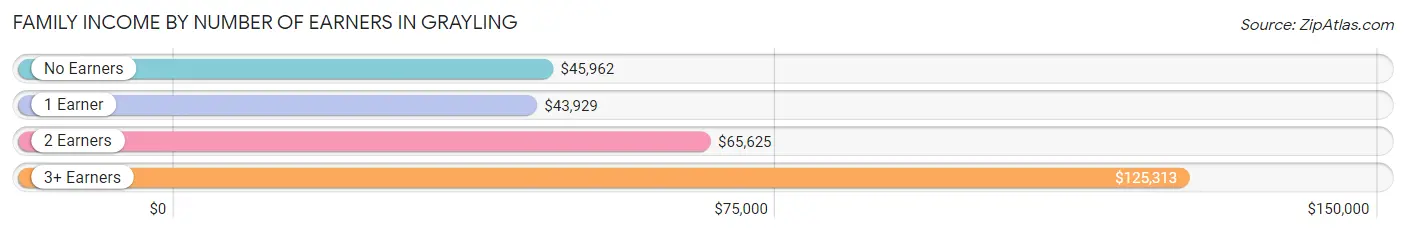
Family Income by Number of Earners in Grayling
The median family income in Grayling is $48,125, with families comprising 3+ earners (29) having the highest median family income of $125,313, while families with 1 earner (200) have the lowest median family income of $43,929, accounting for 7.5% and 52.1% of families, respectively.
| Number of Earners | # Families | Median Income |
| No Earners | 80 (20.8%) | $45,962 |
| 1 Earner | 200 (52.1%) | $43,929 |
| 2 Earners | 75 (19.5%) | $65,625 |
| 3+ Earners | 29 (7.5%) | $125,313 |
| Total | 384 (100.0%) | $48,125 |
Household Income in Grayling
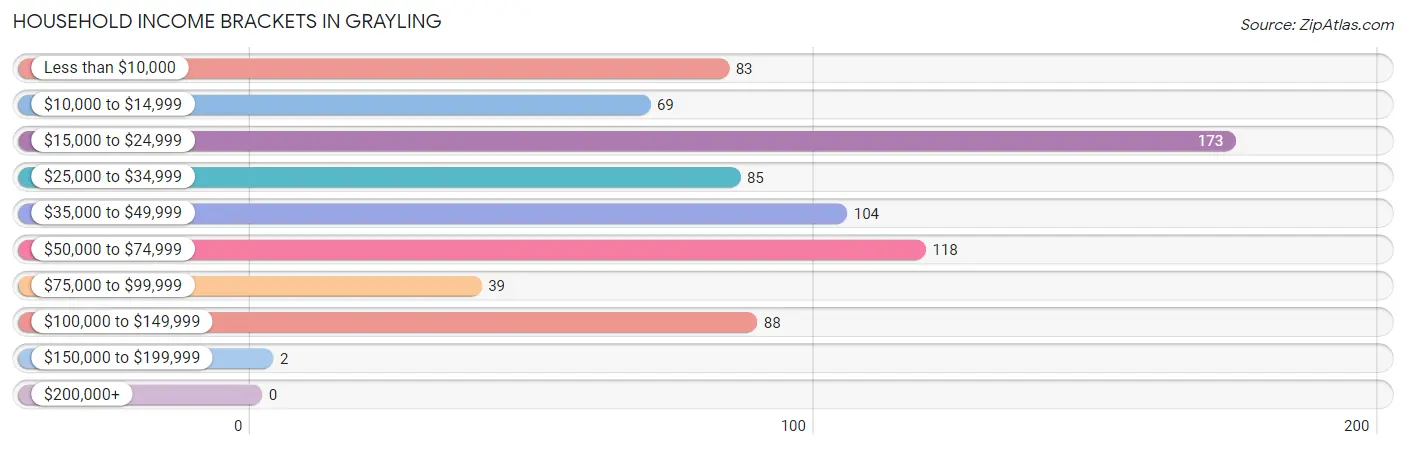
Household Income Brackets in Grayling
With 173 households falling in the category, the $15,000 to $24,999 income range is the most frequent in Grayling, accounting for 22.7% of all households.
| Income Bracket | # Households | % Households |
| Less than $10,000 | 83 | 10.9% |
| $10,000 to $14,999 | 69 | 9.1% |
| $15,000 to $24,999 | 173 | 22.7% |
| $25,000 to $34,999 | 85 | 11.2% |
| $35,000 to $49,999 | 104 | 13.7% |
| $50,000 to $74,999 | 118 | 15.5% |
| $75,000 to $99,999 | 39 | 5.1% |
| $100,000 to $149,999 | 88 | 11.6% |
| $150,000 to $199,999 | 2 | 0.3% |
| $200,000+ | 0 | 0.0% |
Household Income by Householder Age in Grayling
The median household income in Grayling is $30,417, with the highest median household income of $41,250 found in the 25 to 44 years age bracket for the primary householder. A total of 200 households (26.3%) fall into this category. Meanwhile, the 65+ years age bracket for the primary householder has the lowest median household income of $24,688, with 253 households (33.3%) in this group.
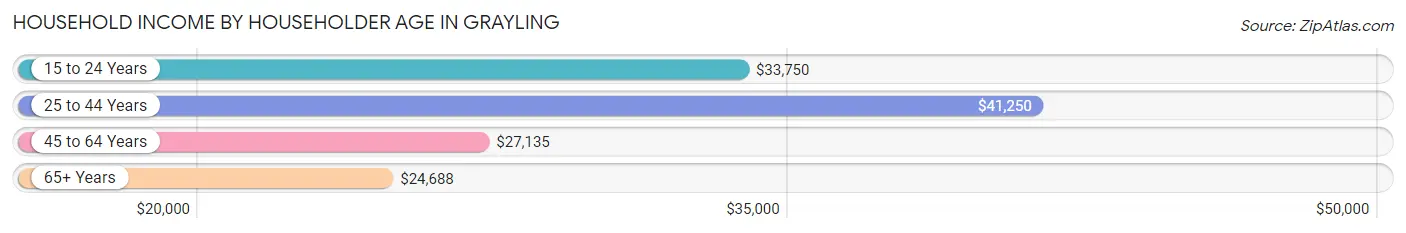
| Income Bracket | # Households | Median Income |
| 15 to 24 Years | 23 (3.0%) | $33,750 |
| 25 to 44 Years | 200 (26.3%) | $41,250 |
| 45 to 64 Years | 285 (37.4%) | $27,135 |
| 65+ Years | 253 (33.3%) | $24,688 |
| Total | 761 (100.0%) | $30,417 |
Poverty in Grayling
Income Below Poverty by Sex and Age in Grayling
With 21.8% poverty level for males and 34.1% for females among the residents of Grayling, 18 to 24 year old males and 15 year old females are the most vulnerable to poverty, with 30 males (81.1%) and 11 females (100.0%) in their respective age groups living below the poverty level.
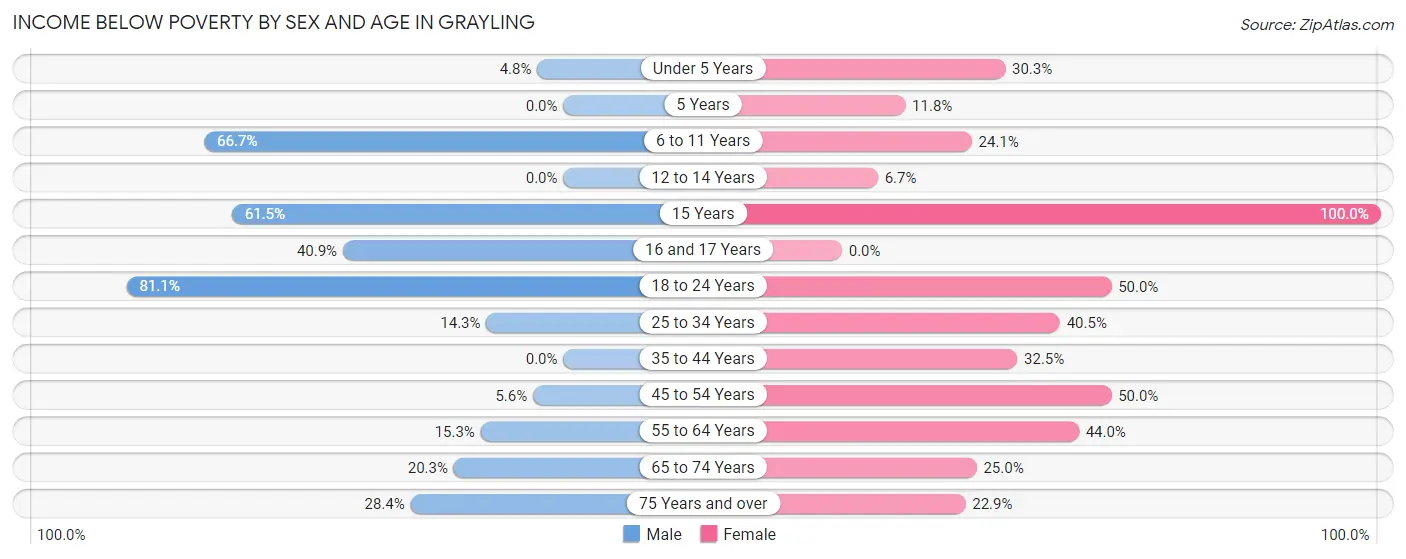
| Age Bracket | Male | Female |
| Under 5 Years | 3 (4.8%) | 10 (30.3%) |
| 5 Years | 0 (0.0%) | 2 (11.8%) |
| 6 to 11 Years | 36 (66.7%) | 20 (24.1%) |
| 12 to 14 Years | 0 (0.0%) | 2 (6.7%) |
| 15 Years | 8 (61.5%) | 11 (100.0%) |
| 16 and 17 Years | 9 (40.9%) | 0 (0.0%) |
| 18 to 24 Years | 30 (81.1%) | 28 (50.0%) |
| 25 to 34 Years | 17 (14.3%) | 36 (40.5%) |
| 35 to 44 Years | 0 (0.0%) | 41 (32.5%) |
| 45 to 54 Years | 4 (5.6%) | 42 (50.0%) |
| 55 to 64 Years | 29 (15.3%) | 51 (44.0%) |
| 65 to 74 Years | 12 (20.3%) | 28 (25.0%) |
| 75 Years and over | 19 (28.4%) | 22 (22.9%) |
| Total | 167 (21.8%) | 293 (34.1%) |
Income Above Poverty by Sex and Age in Grayling
According to the poverty statistics in Grayling, males aged 5 years and females aged 16 and 17 years are the age groups that are most secure financially, with 100.0% of males and 100.0% of females in these age groups living above the poverty line.
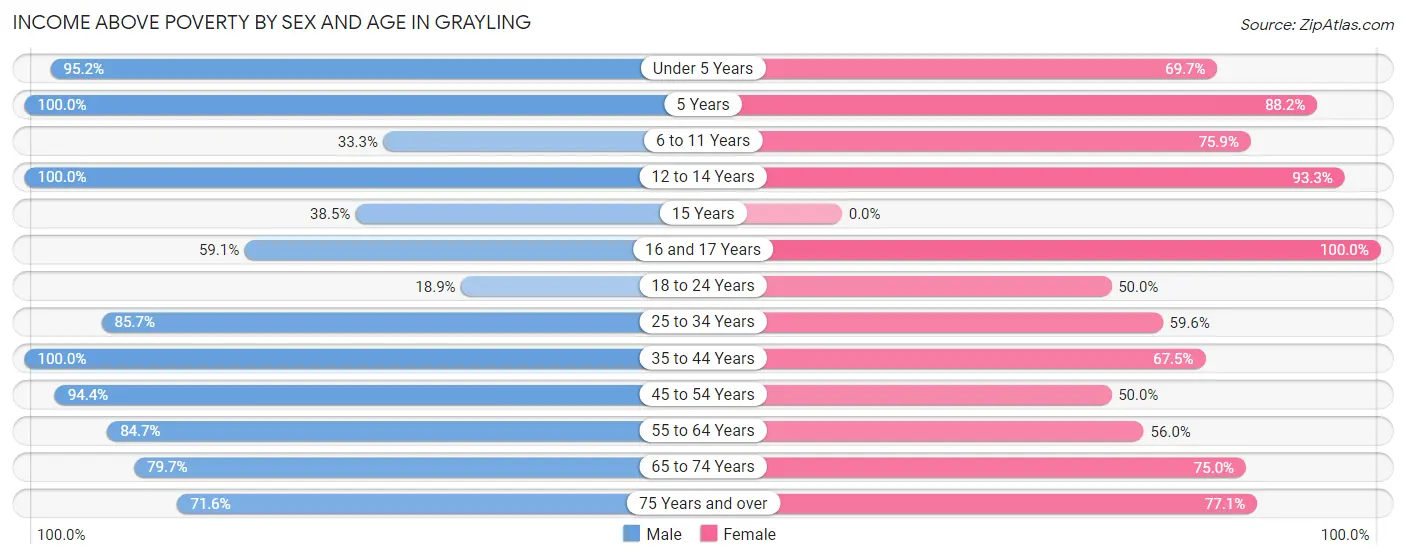
| Age Bracket | Male | Female |
| Under 5 Years | 59 (95.2%) | 23 (69.7%) |
| 5 Years | 6 (100.0%) | 15 (88.2%) |
| 6 to 11 Years | 18 (33.3%) | 63 (75.9%) |
| 12 to 14 Years | 12 (100.0%) | 28 (93.3%) |
| 15 Years | 5 (38.5%) | 0 (0.0%) |
| 16 and 17 Years | 13 (59.1%) | 6 (100.0%) |
| 18 to 24 Years | 7 (18.9%) | 28 (50.0%) |
| 25 to 34 Years | 102 (85.7%) | 53 (59.6%) |
| 35 to 44 Years | 54 (100.0%) | 85 (67.5%) |
| 45 to 54 Years | 67 (94.4%) | 42 (50.0%) |
| 55 to 64 Years | 160 (84.7%) | 65 (56.0%) |
| 65 to 74 Years | 47 (79.7%) | 84 (75.0%) |
| 75 Years and over | 48 (71.6%) | 74 (77.1%) |
| Total | 598 (78.2%) | 566 (65.9%) |
Income Below Poverty Among Married-Couple Families in Grayling
The poverty statistics for married-couple families in Grayling show that 2.0% or 4 of the total 199 families live below the poverty line. Families with 1 or 2 children have the highest poverty rate of 4.8%, comprising of 2 families. On the other hand, families with 3 or 4 children have the lowest poverty rate of 0.0%, which includes 0 families.
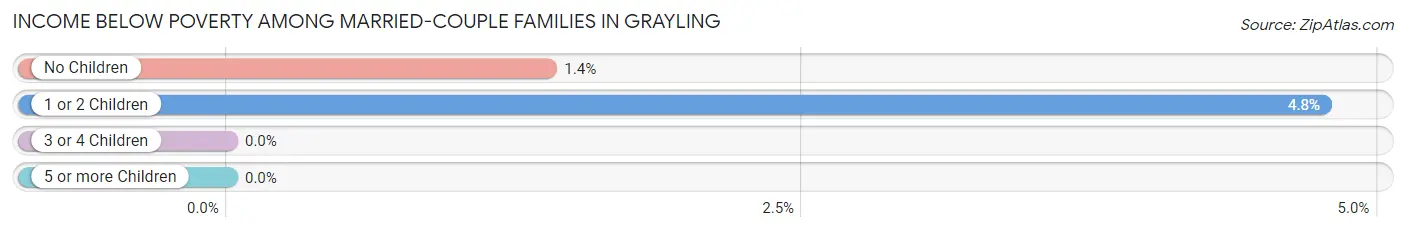
| Children | Above Poverty | Below Poverty |
| No Children | 142 (98.6%) | 2 (1.4%) |
| 1 or 2 Children | 40 (95.2%) | 2 (4.8%) |
| 3 or 4 Children | 10 (100.0%) | 0 (0.0%) |
| 5 or more Children | 3 (100.0%) | 0 (0.0%) |
| Total | 195 (98.0%) | 4 (2.0%) |
Income Below Poverty Among Single-Parent Households in Grayling
According to the poverty data in Grayling, 16.7% or 9 single-father households and 42.7% or 56 single-mother households are living below the poverty line. Among single-father households, those with 1 or 2 children have the highest poverty rate, with 9 households (20.0%) experiencing poverty. Likewise, among single-mother households, those with 3 or 4 children have the highest poverty rate, with 14 households (70.0%) falling below the poverty line.
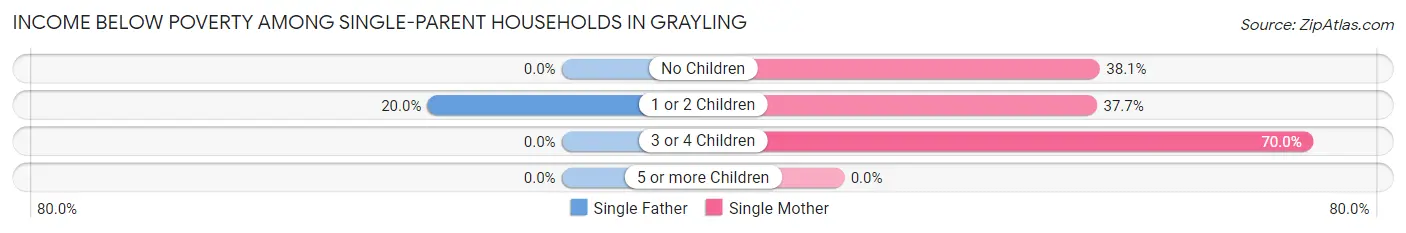
| Children | Single Father | Single Mother |
| No Children | 0 (0.0%) | 16 (38.1%) |
| 1 or 2 Children | 9 (20.0%) | 26 (37.7%) |
| 3 or 4 Children | 0 (0.0%) | 14 (70.0%) |
| 5 or more Children | 0 (0.0%) | 0 (0.0%) |
| Total | 9 (16.7%) | 56 (42.7%) |
Income Below Poverty Among Married-Couple vs Single-Parent Households in Grayling
The poverty data for Grayling shows that 4 of the married-couple family households (2.0%) and 65 of the single-parent households (35.1%) are living below the poverty level. Within the married-couple family households, those with 1 or 2 children have the highest poverty rate, with 2 households (4.8%) falling below the poverty line. Among the single-parent households, those with 3 or 4 children have the highest poverty rate, with 14 household (70.0%) living below poverty.
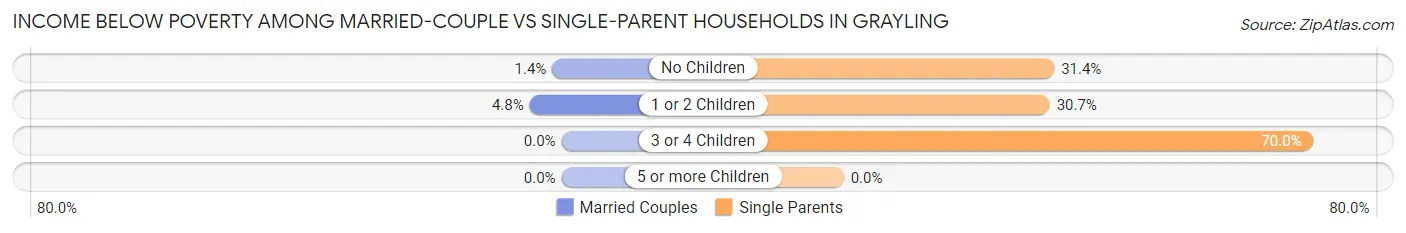
| Children | Married-Couple Families | Single-Parent Households |
| No Children | 2 (1.4%) | 16 (31.4%) |
| 1 or 2 Children | 2 (4.8%) | 35 (30.7%) |
| 3 or 4 Children | 0 (0.0%) | 14 (70.0%) |
| 5 or more Children | 0 (0.0%) | 0 (0.0%) |
| Total | 4 (2.0%) | 65 (35.1%) |
Race in Grayling
The most populous races in Grayling are White / Caucasian (1,627 | 92.5%), Hispanic or Latino (138 | 7.9%), and Two or more Races (55 | 3.1%).
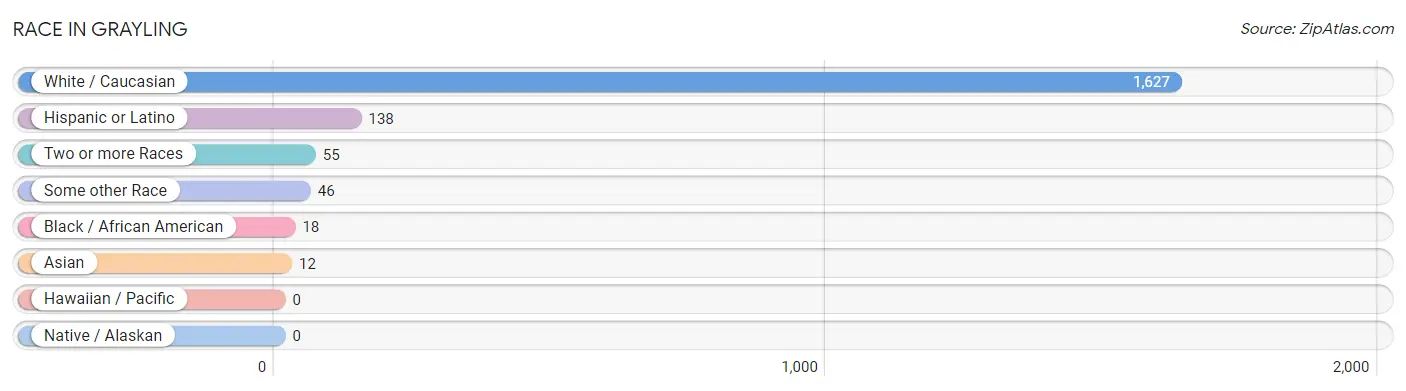
| Race | # Population | % Population |
| Asian | 12 | 0.7% |
| Black / African American | 18 | 1.0% |
| Hawaiian / Pacific | 0 | 0.0% |
| Hispanic or Latino | 138 | 7.9% |
| Native / Alaskan | 0 | 0.0% |
| White / Caucasian | 1,627 | 92.5% |
| Two or more Races | 55 | 3.1% |
| Some other Race | 46 | 2.6% |
| Total | 1,758 | 100.0% |
Ancestry in Grayling
The most populous ancestries reported in Grayling are German (374 | 21.3%), Irish (331 | 18.8%), English (192 | 10.9%), Polish (122 | 6.9%), and American (89 | 5.1%), together accounting for 63.0% of all Grayling residents.
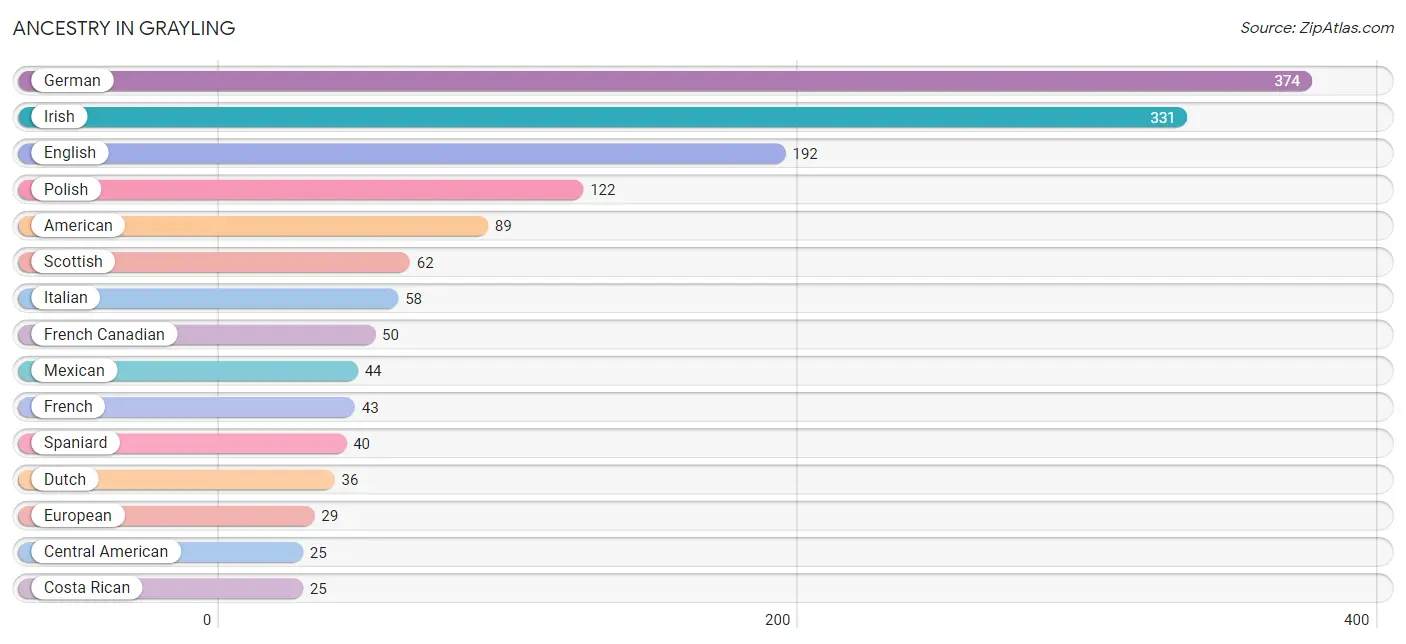
| Ancestry | # Population | % Population |
| American | 89 | 5.1% |
| Arab | 7 | 0.4% |
| Austrian | 3 | 0.2% |
| British | 9 | 0.5% |
| Canadian | 1 | 0.1% |
| Central American | 25 | 1.4% |
| Costa Rican | 25 | 1.4% |
| Danish | 6 | 0.3% |
| Dutch | 36 | 2.1% |
| English | 192 | 10.9% |
| European | 29 | 1.7% |
| Finnish | 2 | 0.1% |
| French | 43 | 2.5% |
| French Canadian | 50 | 2.8% |
| German | 374 | 21.3% |
| Hungarian | 5 | 0.3% |
| Icelander | 7 | 0.4% |
| Irish | 331 | 18.8% |
| Italian | 58 | 3.3% |
| Mexican | 44 | 2.5% |
| Norwegian | 23 | 1.3% |
| Pennsylvania German | 3 | 0.2% |
| Polish | 122 | 6.9% |
| Puerto Rican | 18 | 1.0% |
| Russian | 3 | 0.2% |
| Scandinavian | 24 | 1.4% |
| Scotch-Irish | 1 | 0.1% |
| Scottish | 62 | 3.5% |
| Slovak | 6 | 0.3% |
| Spaniard | 40 | 2.3% |
| Swedish | 22 | 1.3% |
| Swiss | 2 | 0.1% |
| Syrian | 5 | 0.3% |
| Thai | 21 | 1.2% |
| Welsh | 15 | 0.9% | View All 35 Rows |
Immigrants in Grayling
The most numerous immigrant groups reported in Grayling came from Latin America (23 | 1.3%), Europe (14 | 0.8%), Guyana (12 | 0.7%), South America (12 | 0.7%), and Central America (11 | 0.6%), together accounting for 4.1% of all Grayling residents.
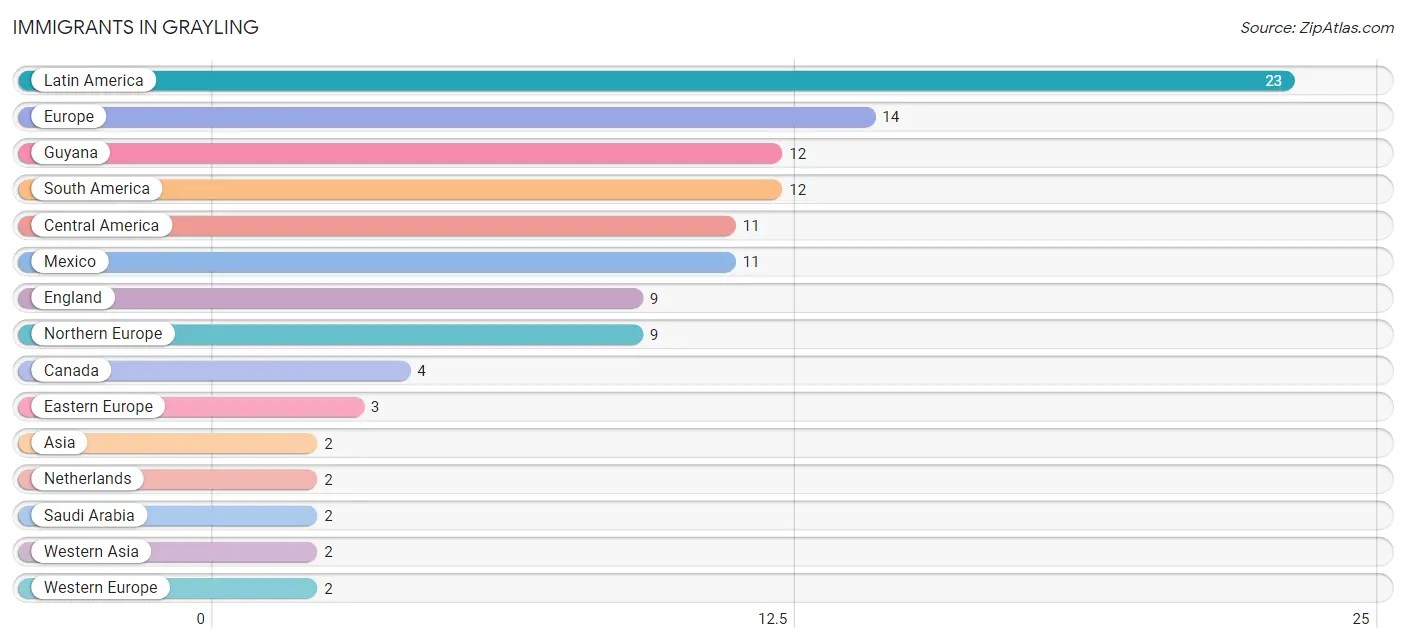
| Immigration Origin | # Population | % Population |
| Asia | 2 | 0.1% |
| Canada | 4 | 0.2% |
| Central America | 11 | 0.6% |
| Eastern Europe | 3 | 0.2% |
| England | 9 | 0.5% |
| Europe | 14 | 0.8% |
| Guyana | 12 | 0.7% |
| Latin America | 23 | 1.3% |
| Mexico | 11 | 0.6% |
| Netherlands | 2 | 0.1% |
| Northern Europe | 9 | 0.5% |
| Saudi Arabia | 2 | 0.1% |
| South America | 12 | 0.7% |
| Western Asia | 2 | 0.1% |
| Western Europe | 2 | 0.1% | View All 15 Rows |
Sex and Age in Grayling
Sex and Age in Grayling
The most populous age groups in Grayling are 60 to 64 Years (151 | 18.2%) for men and 65 to 69 Years (82 | 8.8%) for women.
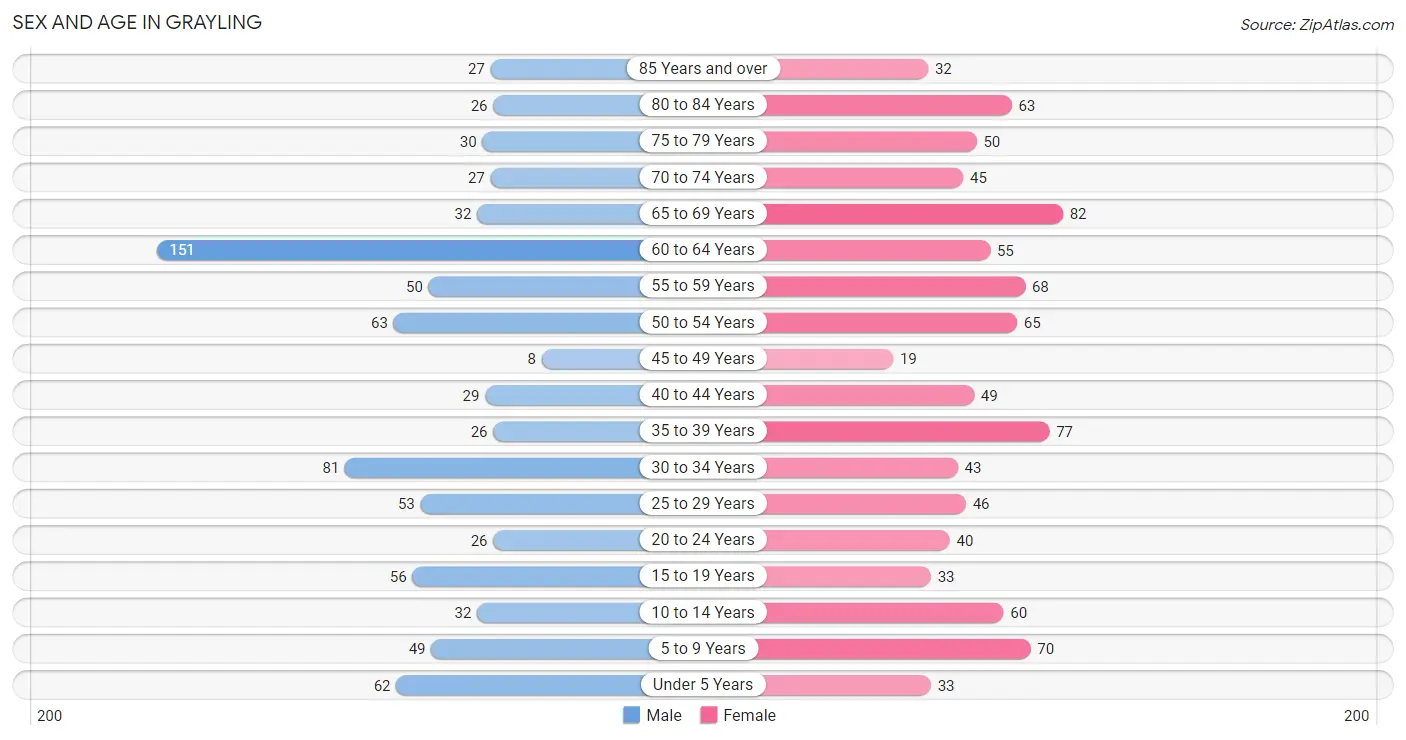
| Age Bracket | Male | Female |
| Under 5 Years | 62 (7.5%) | 33 (3.5%) |
| 5 to 9 Years | 49 (5.9%) | 70 (7.5%) |
| 10 to 14 Years | 32 (3.9%) | 60 (6.5%) |
| 15 to 19 Years | 56 (6.8%) | 33 (3.5%) |
| 20 to 24 Years | 26 (3.1%) | 40 (4.3%) |
| 25 to 29 Years | 53 (6.4%) | 46 (5.0%) |
| 30 to 34 Years | 81 (9.8%) | 43 (4.6%) |
| 35 to 39 Years | 26 (3.1%) | 77 (8.3%) |
| 40 to 44 Years | 29 (3.5%) | 49 (5.3%) |
| 45 to 49 Years | 8 (1.0%) | 19 (2.0%) |
| 50 to 54 Years | 63 (7.6%) | 65 (7.0%) |
| 55 to 59 Years | 50 (6.0%) | 68 (7.3%) |
| 60 to 64 Years | 151 (18.2%) | 55 (5.9%) |
| 65 to 69 Years | 32 (3.9%) | 82 (8.8%) |
| 70 to 74 Years | 27 (3.3%) | 45 (4.8%) |
| 75 to 79 Years | 30 (3.6%) | 50 (5.4%) |
| 80 to 84 Years | 26 (3.1%) | 63 (6.8%) |
| 85 Years and over | 27 (3.3%) | 32 (3.4%) |
| Total | 828 (100.0%) | 930 (100.0%) |
Families and Households in Grayling
Median Family Size in Grayling
The median family size in Grayling is 2.94 persons per family, with single female/mother families (131 | 34.1%) accounting for the largest median family size of 3.02 persons per family. On the other hand, single male/father families (54 | 14.1%) represent the smallest median family size with 2.69 persons per family.
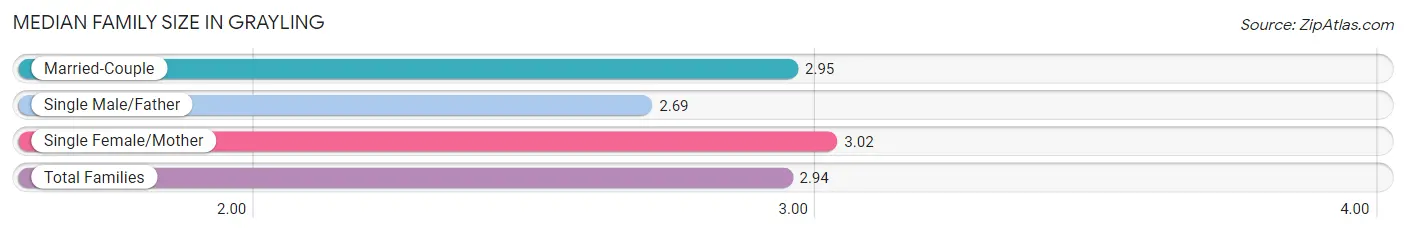
| Family Type | # Families | Family Size |
| Married-Couple | 199 (51.8%) | 2.95 |
| Single Male/Father | 54 (14.1%) | 2.69 |
| Single Female/Mother | 131 (34.1%) | 3.02 |
| Total Families | 384 (100.0%) | 2.94 |
Median Household Size in Grayling
The median household size in Grayling is 2.13 persons per household, with single male/father households (54 | 7.1%) accounting for the largest median household size of 3.46 persons per household. non-family households (377 | 49.5%) represent the smallest median household size with 1.14 persons per household.
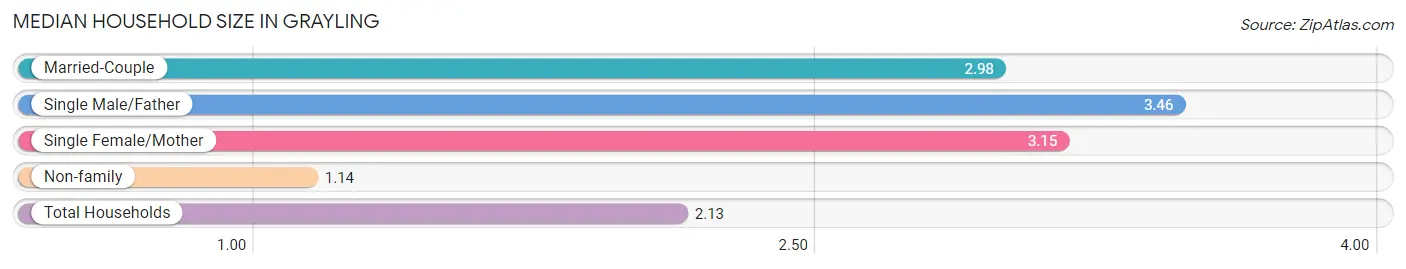
| Household Type | # Households | Household Size |
| Married-Couple | 199 (26.2%) | 2.98 |
| Single Male/Father | 54 (7.1%) | 3.46 |
| Single Female/Mother | 131 (17.2%) | 3.15 |
| Non-family | 377 (49.5%) | 1.14 |
| Total Households | 761 (100.0%) | 2.13 |
Household Size by Marriage Status in Grayling
Out of a total of 761 households in Grayling, 384 (50.5%) are family households, while 377 (49.5%) are nonfamily households. The most numerous type of family households are 2-person households, comprising 215, and the most common type of nonfamily households are 1-person households, comprising 331.
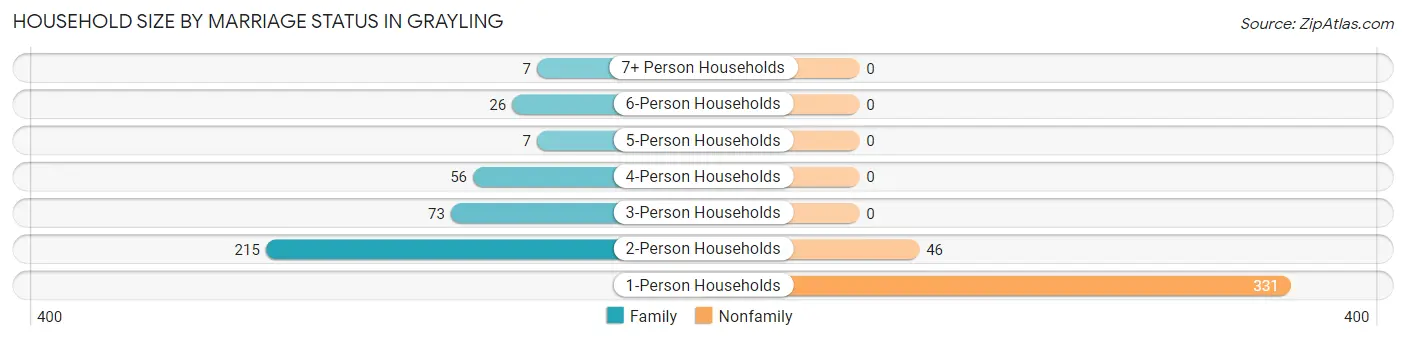
| Household Size | Family Households | Nonfamily Households |
| 1-Person Households | - | 331 (43.5%) |
| 2-Person Households | 215 (28.2%) | 46 (6.0%) |
| 3-Person Households | 73 (9.6%) | 0 (0.0%) |
| 4-Person Households | 56 (7.4%) | 0 (0.0%) |
| 5-Person Households | 7 (0.9%) | 0 (0.0%) |
| 6-Person Households | 26 (3.4%) | 0 (0.0%) |
| 7+ Person Households | 7 (0.9%) | 0 (0.0%) |
| Total | 384 (50.5%) | 377 (49.5%) |
Female Fertility in Grayling
Fertility by Age in Grayling
Average fertility rate in Grayling is 59.0 births per 1,000 women. Women in the age bracket of 20 to 34 years have the highest fertility rate with 147.0 births per 1,000 women. Women in the age bracket of 20 to 34 years acount for 100.0% of all women with births.
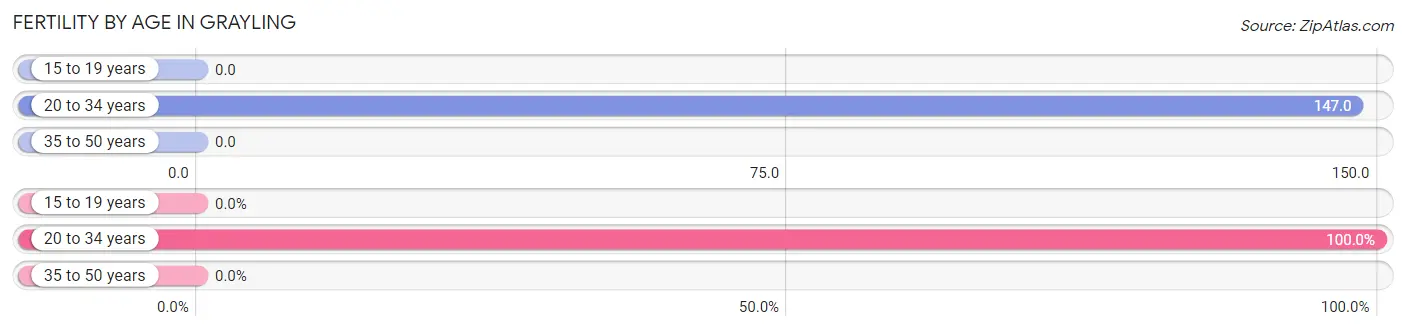
| Age Bracket | Women with Births | Births / 1,000 Women |
| 15 to 19 years | 0 (0.0%) | 0.0 |
| 20 to 34 years | 19 (100.0%) | 147.0 |
| 35 to 50 years | 0 (0.0%) | 0.0 |
| Total | 19 (100.0%) | 59.0 |
Fertility by Age by Marriage Status in Grayling
36.8% of women with births (19) in Grayling are married. The highest percentage of unmarried women with births falls into 20 to 34 years age bracket with 63.2% of them unmarried at the time of birth, while the lowest percentage of unmarried women with births belong to 20 to 34 years age bracket with 63.2% of them unmarried.
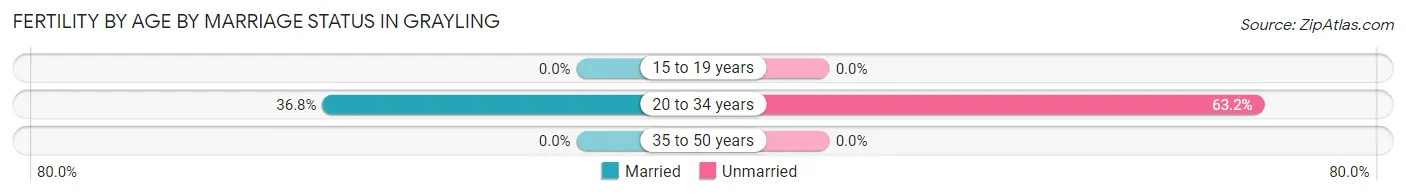
| Age Bracket | Married | Unmarried |
| 15 to 19 years | 0 (0.0%) | 0 (0.0%) |
| 20 to 34 years | 7 (36.8%) | 12 (63.2%) |
| 35 to 50 years | 0 (0.0%) | 0 (0.0%) |
| Total | 7 (36.8%) | 12 (63.2%) |
Fertility by Education in Grayling
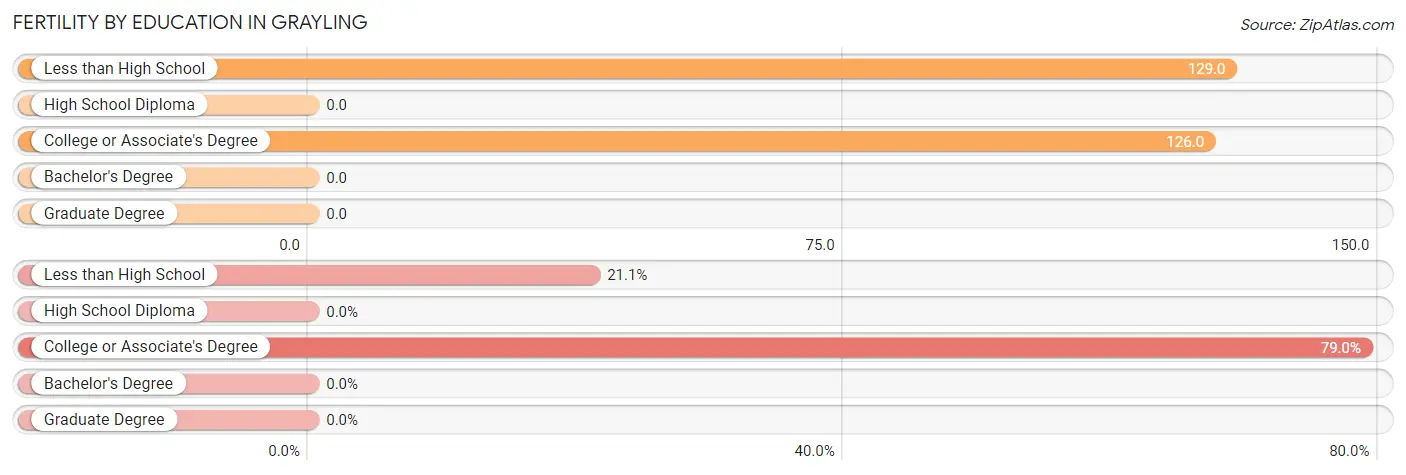
| Educational Attainment | Women with Births | Births / 1,000 Women |
| Less than High School | 4 (21.0%) | 129.0 |
| High School Diploma | 0 (0.0%) | 0.0 |
| College or Associate's Degree | 15 (78.9%) | 126.0 |
| Bachelor's Degree | 0 (0.0%) | 0.0 |
| Graduate Degree | 0 (0.0%) | 0.0 |
| Total | 19 (100.0%) | 59.0 |
Fertility by Education by Marriage Status in Grayling
63.2% of women with births in Grayling are unmarried. Women with the educational attainment of less than high school are most likely to be married with 100.0% of them married at childbirth, while women with the educational attainment of college or associate's degree are least likely to be married with 80.0% of them unmarried at childbirth.
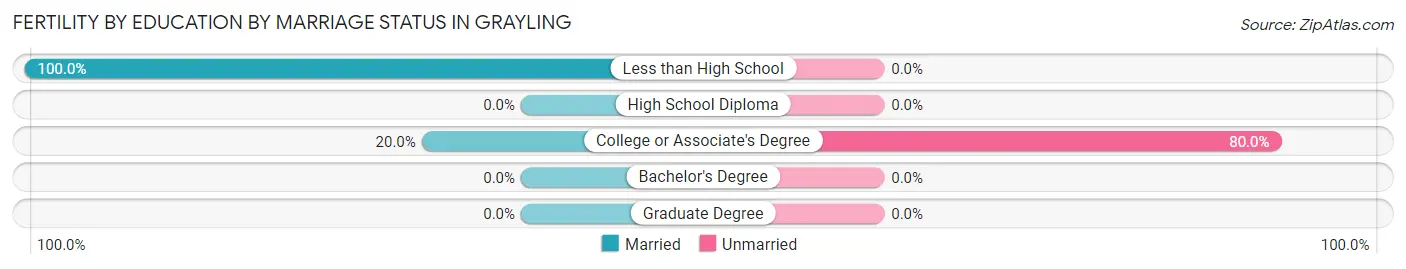
| Educational Attainment | Married | Unmarried |
| Less than High School | 4 (100.0%) | 0 (0.0%) |
| High School Diploma | 0 (0.0%) | 0 (0.0%) |
| College or Associate's Degree | 3 (20.0%) | 12 (80.0%) |
| Bachelor's Degree | 0 (0.0%) | 0 (0.0%) |
| Graduate Degree | 0 (0.0%) | 0 (0.0%) |
| Total | 7 (36.8%) | 12 (63.2%) |
Employment Characteristics in Grayling
Employment by Class of Employer in Grayling
Among the 549 employed individuals in Grayling, private company employees (348 | 63.4%), federal government employees (57 | 10.4%), and not-for-profit organizations (44 | 8.0%) make up the most common classes of employment.
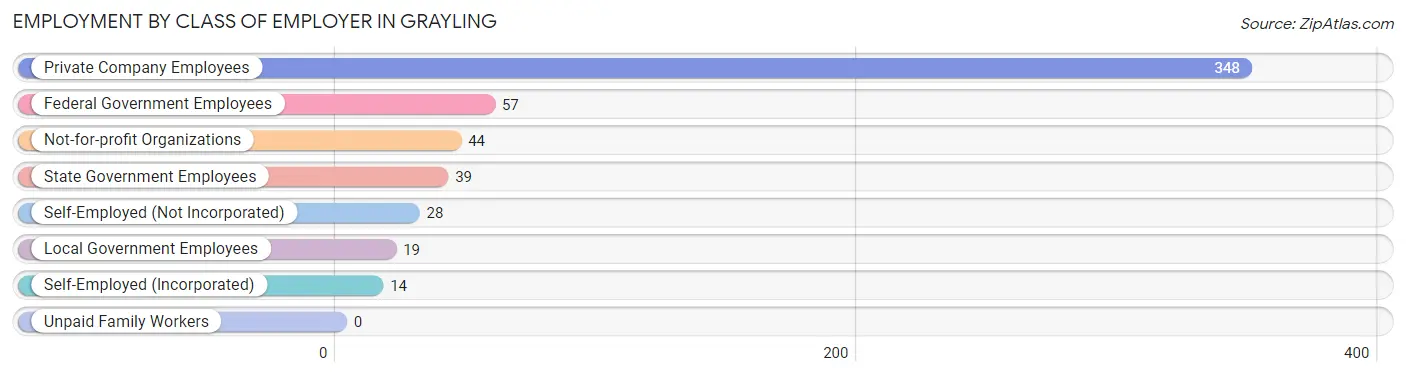
| Employer Class | # Employees | % Employees |
| Private Company Employees | 348 | 63.4% |
| Self-Employed (Incorporated) | 14 | 2.5% |
| Self-Employed (Not Incorporated) | 28 | 5.1% |
| Not-for-profit Organizations | 44 | 8.0% |
| Local Government Employees | 19 | 3.5% |
| State Government Employees | 39 | 7.1% |
| Federal Government Employees | 57 | 10.4% |
| Unpaid Family Workers | 0 | 0.0% |
| Total | 549 | 100.0% |
Employment Status by Age in Grayling
According to the labor force statistics for Grayling, out of the total population over 16 years of age (1,428), 41.5% or 593 individuals are in the labor force, with 7.0% or 42 of them unemployed. The age group with the highest labor force participation rate is 16 to 19 years, with 86.2% or 56 individuals in the labor force. Within the labor force, the 30 to 34 years age range has the highest percentage of unemployed individuals, with 23.1% or 16 of them being unemployed.
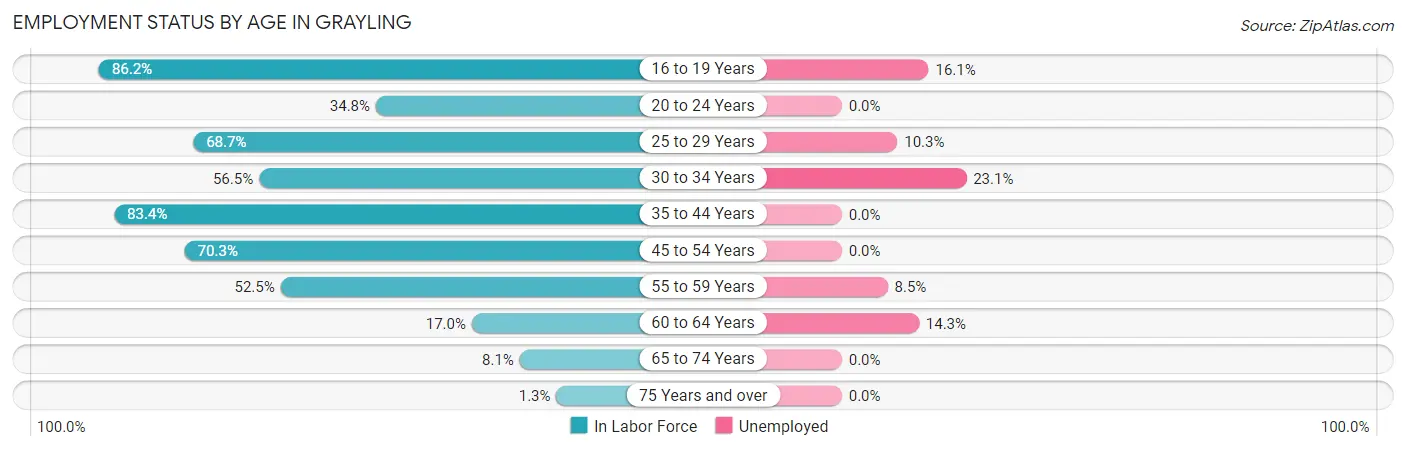
| Age Bracket | In Labor Force | Unemployed |
| 16 to 19 Years | 56 (86.2%) | 9 (16.1%) |
| 20 to 24 Years | 23 (34.8%) | 0 (0.0%) |
| 25 to 29 Years | 68 (68.7%) | 7 (10.3%) |
| 30 to 34 Years | 70 (56.5%) | 16 (23.1%) |
| 35 to 44 Years | 151 (83.4%) | 0 (0.0%) |
| 45 to 54 Years | 109 (70.3%) | 0 (0.0%) |
| 55 to 59 Years | 62 (52.5%) | 5 (8.5%) |
| 60 to 64 Years | 35 (17.0%) | 5 (14.3%) |
| 65 to 74 Years | 15 (8.1%) | 0 (0.0%) |
| 75 Years and over | 3 (1.3%) | 0 (0.0%) |
| Total | 593 (41.5%) | 42 (7.0%) |
Employment Status by Educational Attainment in Grayling
According to labor force statistics for Grayling, 56.1% of individuals (495) out of the total population between 25 and 64 years of age (883) are in the labor force, with 6.5% or 32 of them being unemployed. The group with the highest labor force participation rate are those with the educational attainment of bachelor's degree or higher, with 69.1% or 76 individuals in the labor force. Within the labor force, individuals with high school diploma education have the highest percentage of unemployment, with 12.3% or 22 of them being unemployed.
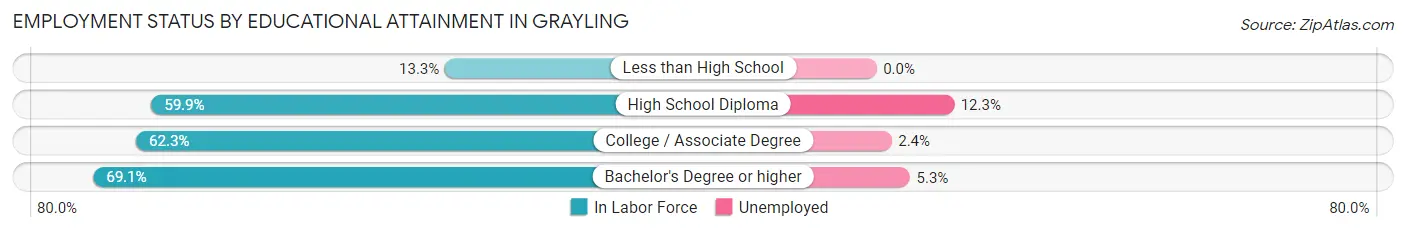
| Educational Attainment | In Labor Force | Unemployed |
| Less than High School | 15 (13.3%) | 0 (0.0%) |
| High School Diploma | 179 (59.9%) | 37 (12.3%) |
| College / Associate Degree | 225 (62.3%) | 9 (2.4%) |
| Bachelor's Degree or higher | 76 (69.1%) | 6 (5.3%) |
| Total | 495 (56.1%) | 57 (6.5%) |
Employment Occupations by Sex in Grayling
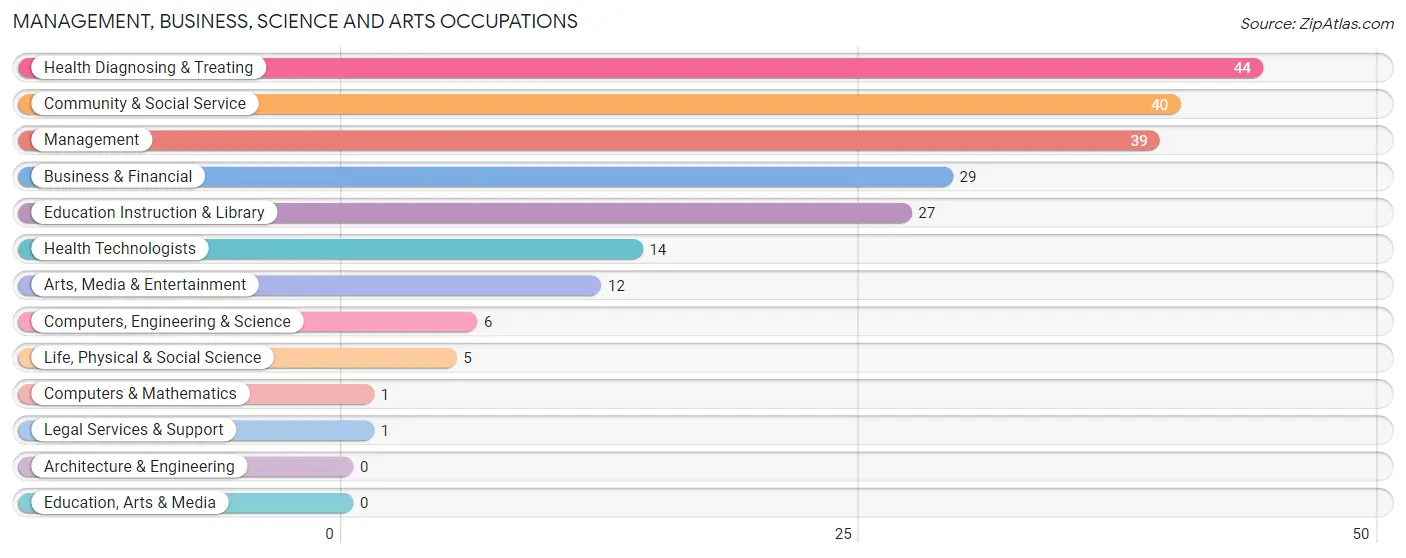
Management, Business, Science and Arts Occupations
The most common Management, Business, Science and Arts occupations in Grayling are Health Diagnosing & Treating (44 | 8.3%), Community & Social Service (40 | 7.5%), Management (39 | 7.3%), Business & Financial (29 | 5.4%), and Education Instruction & Library (27 | 5.1%).
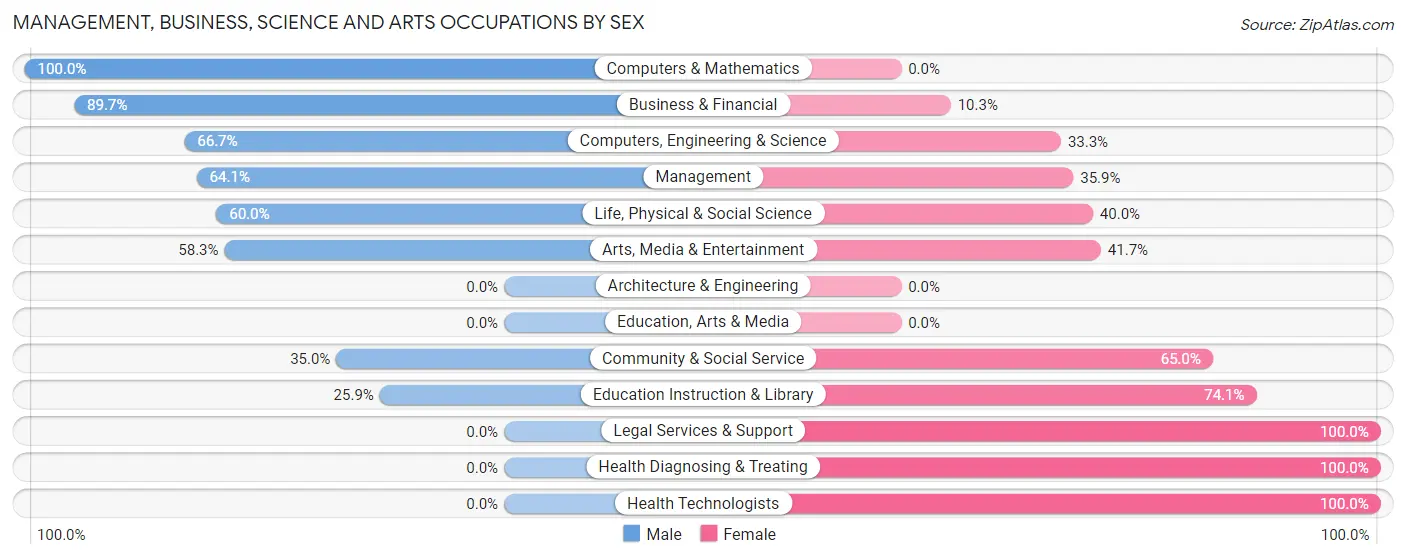
Management, Business, Science and Arts Occupations by Sex
Within the Management, Business, Science and Arts occupations in Grayling, the most male-oriented occupations are Computers & Mathematics (100.0%), Business & Financial (89.7%), and Computers, Engineering & Science (66.7%), while the most female-oriented occupations are Legal Services & Support (100.0%), Health Diagnosing & Treating (100.0%), and Health Technologists (100.0%).
| Occupation | Male | Female |
| Management | 25 (64.1%) | 14 (35.9%) |
| Business & Financial | 26 (89.7%) | 3 (10.3%) |
| Computers, Engineering & Science | 4 (66.7%) | 2 (33.3%) |
| Computers & Mathematics | 1 (100.0%) | 0 (0.0%) |
| Architecture & Engineering | 0 (0.0%) | 0 (0.0%) |
| Life, Physical & Social Science | 3 (60.0%) | 2 (40.0%) |
| Community & Social Service | 14 (35.0%) | 26 (65.0%) |
| Education, Arts & Media | 0 (0.0%) | 0 (0.0%) |
| Legal Services & Support | 0 (0.0%) | 1 (100.0%) |
| Education Instruction & Library | 7 (25.9%) | 20 (74.1%) |
| Arts, Media & Entertainment | 7 (58.3%) | 5 (41.7%) |
| Health Diagnosing & Treating | 0 (0.0%) | 44 (100.0%) |
| Health Technologists | 0 (0.0%) | 14 (100.0%) |
| Total (Category) | 69 (43.7%) | 89 (56.3%) |
| Total (Overall) | 263 (49.4%) | 269 (50.6%) |
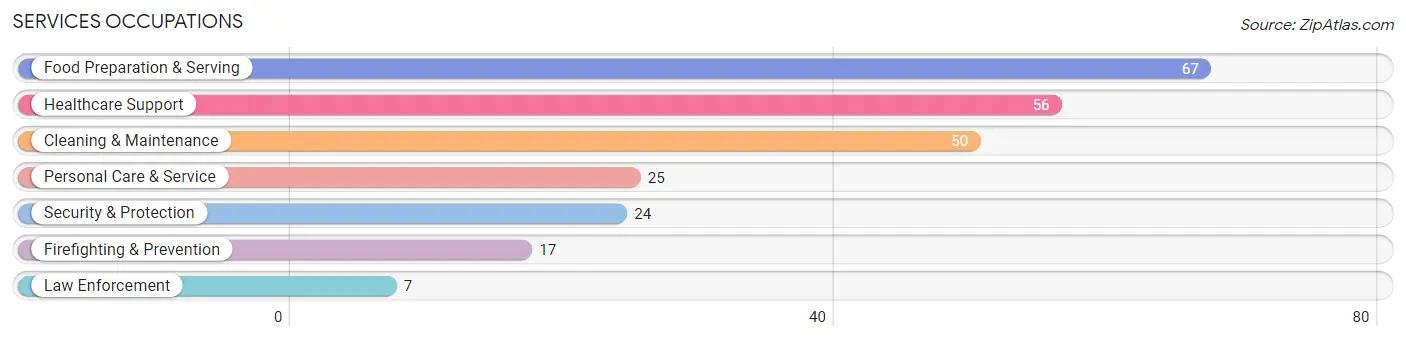
Services Occupations
The most common Services occupations in Grayling are Food Preparation & Serving (67 | 12.6%), Healthcare Support (56 | 10.5%), Cleaning & Maintenance (50 | 9.4%), Personal Care & Service (25 | 4.7%), and Security & Protection (24 | 4.5%).
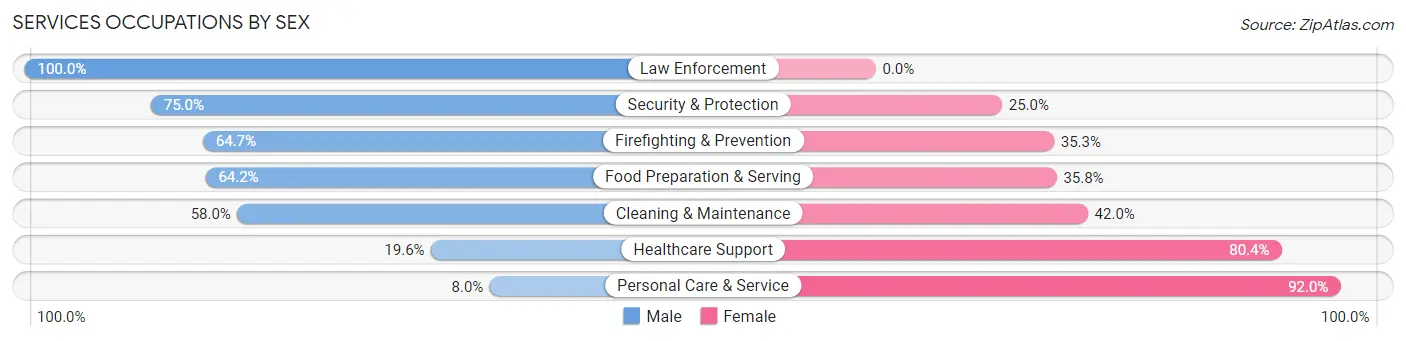
Services Occupations by Sex
Within the Services occupations in Grayling, the most male-oriented occupations are Law Enforcement (100.0%), Security & Protection (75.0%), and Firefighting & Prevention (64.7%), while the most female-oriented occupations are Personal Care & Service (92.0%), Healthcare Support (80.4%), and Cleaning & Maintenance (42.0%).
| Occupation | Male | Female |
| Healthcare Support | 11 (19.6%) | 45 (80.4%) |
| Security & Protection | 18 (75.0%) | 6 (25.0%) |
| Firefighting & Prevention | 11 (64.7%) | 6 (35.3%) |
| Law Enforcement | 7 (100.0%) | 0 (0.0%) |
| Food Preparation & Serving | 43 (64.2%) | 24 (35.8%) |
| Cleaning & Maintenance | 29 (58.0%) | 21 (42.0%) |
| Personal Care & Service | 2 (8.0%) | 23 (92.0%) |
| Total (Category) | 103 (46.4%) | 119 (53.6%) |
| Total (Overall) | 263 (49.4%) | 269 (50.6%) |
Sales and Office Occupations
The most common Sales and Office occupations in Grayling are Sales & Related (60 | 11.3%), and Office & Administration (12 | 2.3%).
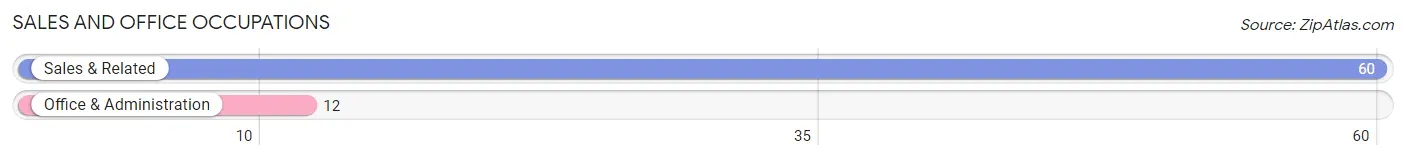
Sales and Office Occupations by Sex
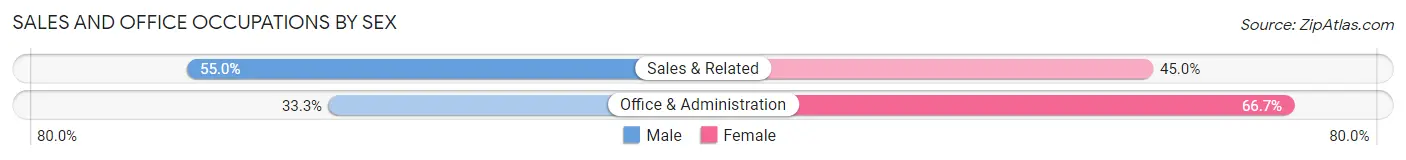
| Occupation | Male | Female |
| Sales & Related | 33 (55.0%) | 27 (45.0%) |
| Office & Administration | 4 (33.3%) | 8 (66.7%) |
| Total (Category) | 37 (51.4%) | 35 (48.6%) |
| Total (Overall) | 263 (49.4%) | 269 (50.6%) |
Natural Resources, Construction and Maintenance Occupations
The most common Natural Resources, Construction and Maintenance occupations in Grayling are Construction & Extraction (10 | 1.9%), Installation, Maintenance & Repair (7 | 1.3%), and Farming, Fishing & Forestry (2 | 0.4%).
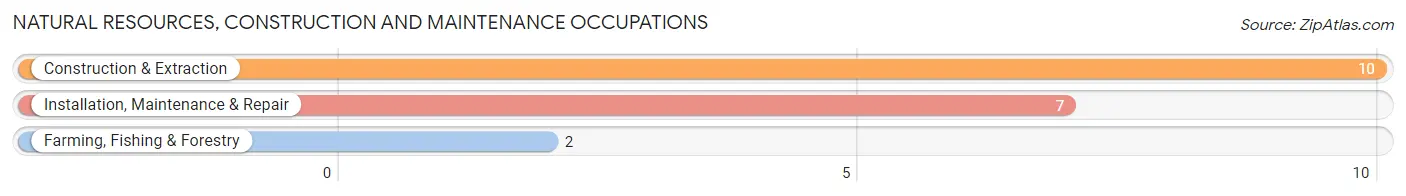
Natural Resources, Construction and Maintenance Occupations by Sex
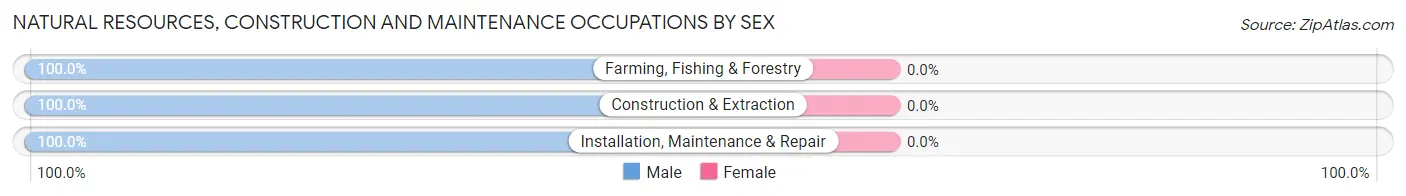
| Occupation | Male | Female |
| Farming, Fishing & Forestry | 2 (100.0%) | 0 (0.0%) |
| Construction & Extraction | 10 (100.0%) | 0 (0.0%) |
| Installation, Maintenance & Repair | 7 (100.0%) | 0 (0.0%) |
| Total (Category) | 19 (100.0%) | 0 (0.0%) |
| Total (Overall) | 263 (49.4%) | 269 (50.6%) |
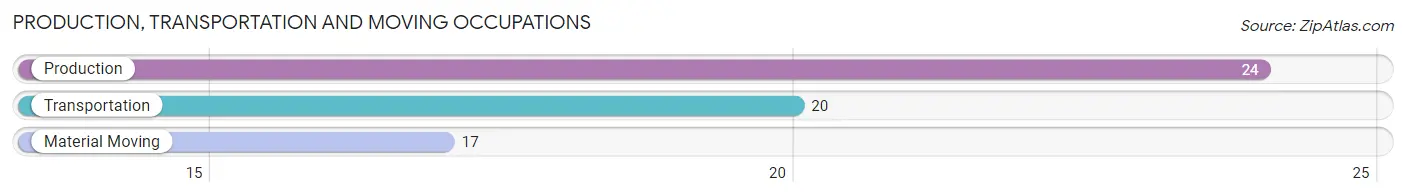
Production, Transportation and Moving Occupations
The most common Production, Transportation and Moving occupations in Grayling are Production (24 | 4.5%), Transportation (20 | 3.8%), and Material Moving (17 | 3.2%).
Production, Transportation and Moving Occupations by Sex
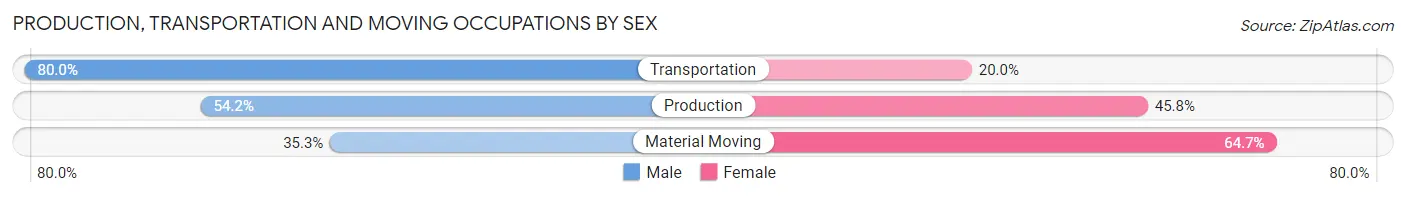
| Occupation | Male | Female |
| Production | 13 (54.2%) | 11 (45.8%) |
| Transportation | 16 (80.0%) | 4 (20.0%) |
| Material Moving | 6 (35.3%) | 11 (64.7%) |
| Total (Category) | 35 (57.4%) | 26 (42.6%) |
| Total (Overall) | 263 (49.4%) | 269 (50.6%) |
Employment Industries by Sex in Grayling
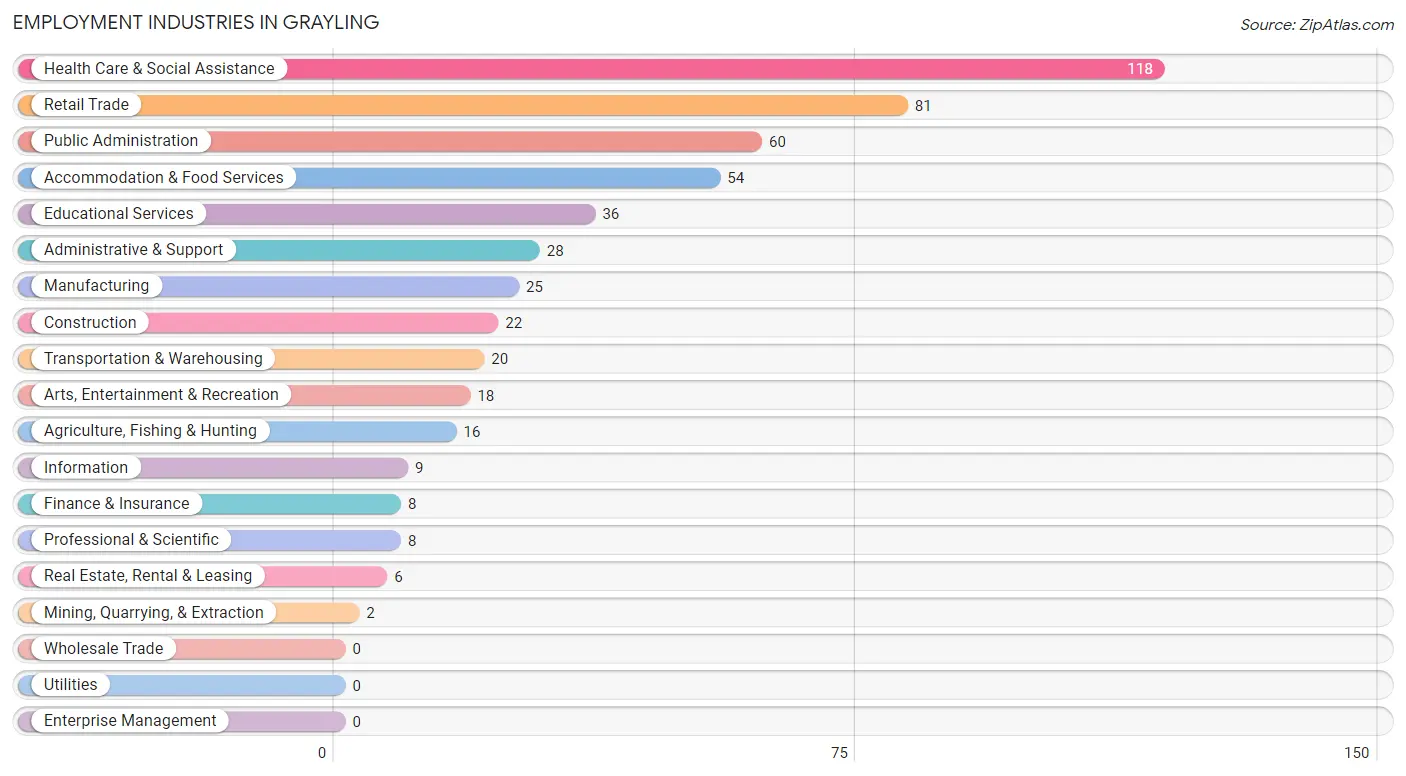
Employment Industries in Grayling
The major employment industries in Grayling include Health Care & Social Assistance (118 | 22.2%), Retail Trade (81 | 15.2%), Public Administration (60 | 11.3%), Accommodation & Food Services (54 | 10.2%), and Educational Services (36 | 6.8%).
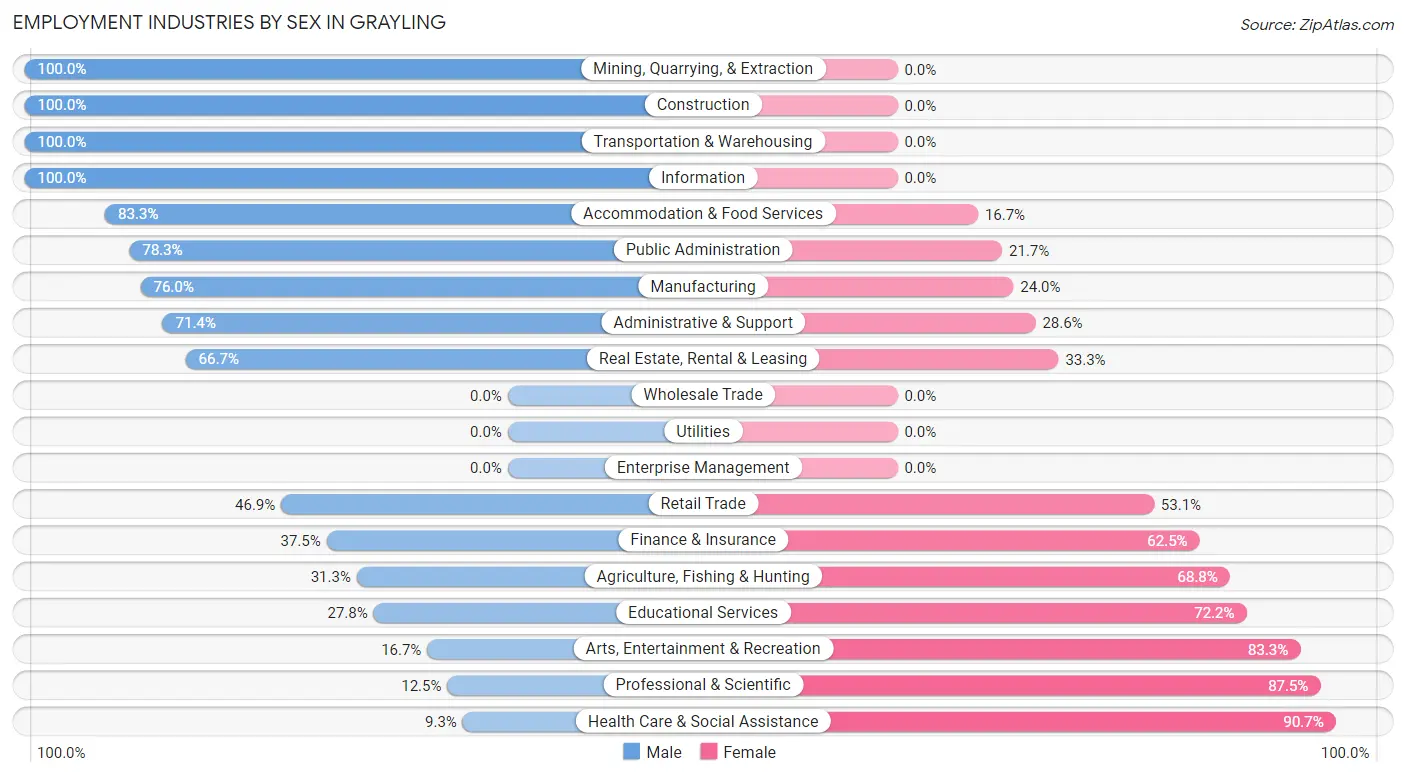
Employment Industries by Sex in Grayling
The Grayling industries that see more men than women are Mining, Quarrying, & Extraction (100.0%), Construction (100.0%), and Transportation & Warehousing (100.0%), whereas the industries that tend to have a higher number of women are Health Care & Social Assistance (90.7%), Professional & Scientific (87.5%), and Arts, Entertainment & Recreation (83.3%).
| Industry | Male | Female |
| Agriculture, Fishing & Hunting | 5 (31.2%) | 11 (68.8%) |
| Mining, Quarrying, & Extraction | 2 (100.0%) | 0 (0.0%) |
| Construction | 22 (100.0%) | 0 (0.0%) |
| Manufacturing | 19 (76.0%) | 6 (24.0%) |
| Wholesale Trade | 0 (0.0%) | 0 (0.0%) |
| Retail Trade | 38 (46.9%) | 43 (53.1%) |
| Transportation & Warehousing | 20 (100.0%) | 0 (0.0%) |
| Utilities | 0 (0.0%) | 0 (0.0%) |
| Information | 9 (100.0%) | 0 (0.0%) |
| Finance & Insurance | 3 (37.5%) | 5 (62.5%) |
| Real Estate, Rental & Leasing | 4 (66.7%) | 2 (33.3%) |
| Professional & Scientific | 1 (12.5%) | 7 (87.5%) |
| Enterprise Management | 0 (0.0%) | 0 (0.0%) |
| Administrative & Support | 20 (71.4%) | 8 (28.6%) |
| Educational Services | 10 (27.8%) | 26 (72.2%) |
| Health Care & Social Assistance | 11 (9.3%) | 107 (90.7%) |
| Arts, Entertainment & Recreation | 3 (16.7%) | 15 (83.3%) |
| Accommodation & Food Services | 45 (83.3%) | 9 (16.7%) |
| Public Administration | 47 (78.3%) | 13 (21.7%) |
| Total | 263 (49.4%) | 269 (50.6%) |
Education in Grayling
School Enrollment in Grayling
The most common levels of schooling among the 299 students in Grayling are high school (84 | 28.1%), elementary school (81 | 27.1%), and middle school (63 | 21.1%).
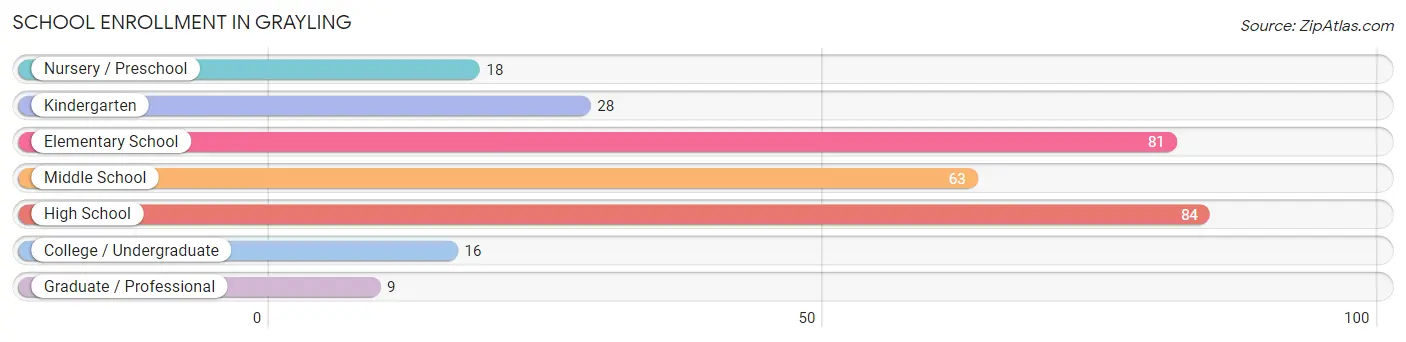
| School Level | # Students | % Students |
| Nursery / Preschool | 18 | 6.0% |
| Kindergarten | 28 | 9.4% |
| Elementary School | 81 | 27.1% |
| Middle School | 63 | 21.1% |
| High School | 84 | 28.1% |
| College / Undergraduate | 16 | 5.3% |
| Graduate / Professional | 9 | 3.0% |
| Total | 299 | 100.0% |
School Enrollment by Age by Funding Source in Grayling
Out of a total of 299 students who are enrolled in schools in Grayling, 9 (3.0%) attend a private institution, while the remaining 290 (97.0%) are enrolled in public schools. The age group of 5 to 9 year old has the highest likelihood of being enrolled in private schools, with 6 (5.3% in the age bracket) enrolled. Conversely, the age group of 3 to 4 year olds has the lowest likelihood of being enrolled in a private school, with 10 (100.0% in the age bracket) attending a public institution.
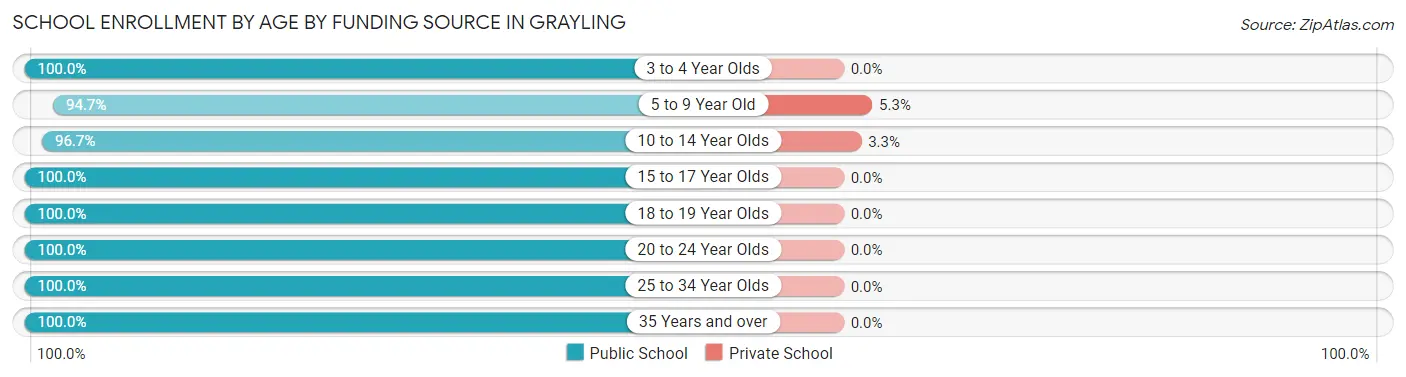
| Age Bracket | Public School | Private School |
| 3 to 4 Year Olds | 10 (100.0%) | 0 (0.0%) |
| 5 to 9 Year Old | 107 (94.7%) | 6 (5.3%) |
| 10 to 14 Year Olds | 89 (96.7%) | 3 (3.3%) |
| 15 to 17 Year Olds | 52 (100.0%) | 0 (0.0%) |
| 18 to 19 Year Olds | 3 (100.0%) | 0 (0.0%) |
| 20 to 24 Year Olds | 5 (100.0%) | 0 (0.0%) |
| 25 to 34 Year Olds | 10 (100.0%) | 0 (0.0%) |
| 35 Years and over | 14 (100.0%) | 0 (0.0%) |
| Total | 290 (97.0%) | 9 (3.0%) |
Educational Attainment by Field of Study in Grayling
Education (51 | 24.9%), physical & health sciences (49 | 23.9%), science & technology (24 | 11.7%), business (17 | 8.3%), and liberal arts & history (14 | 6.8%) are the most common fields of study among 205 individuals in Grayling who have obtained a bachelor's degree or higher.
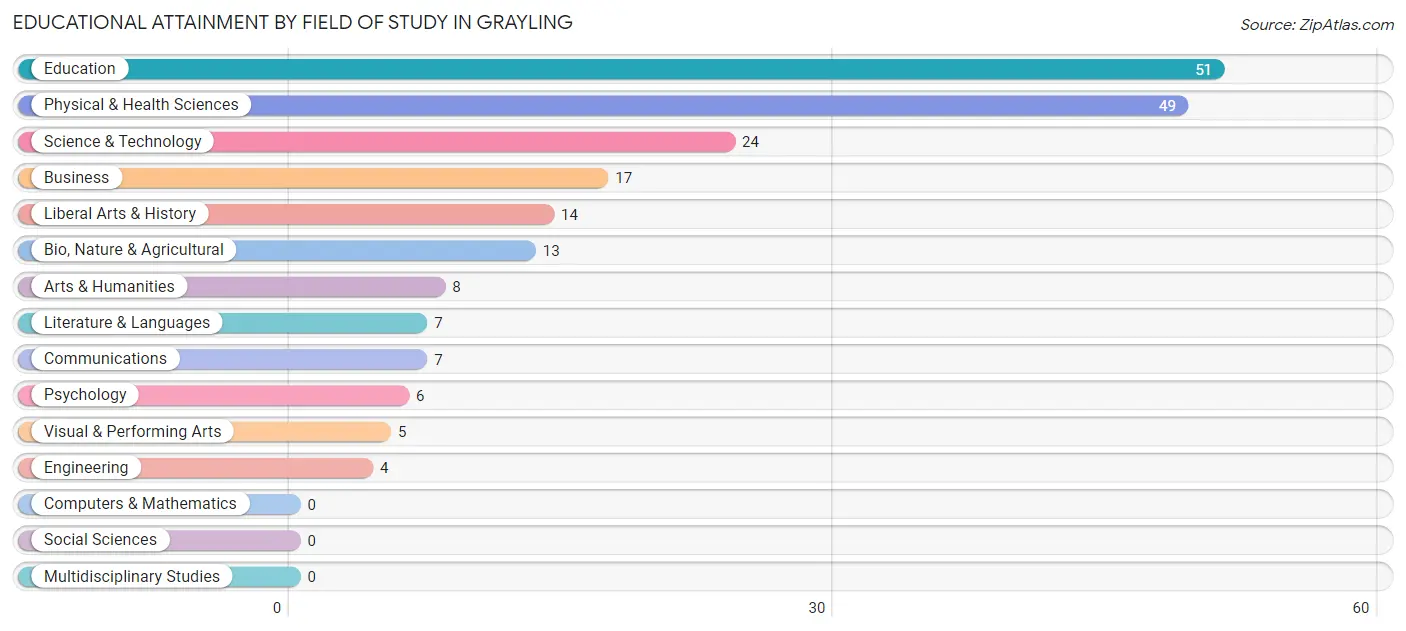
| Field of Study | # Graduates | % Graduates |
| Computers & Mathematics | 0 | 0.0% |
| Bio, Nature & Agricultural | 13 | 6.3% |
| Physical & Health Sciences | 49 | 23.9% |
| Psychology | 6 | 2.9% |
| Social Sciences | 0 | 0.0% |
| Engineering | 4 | 1.9% |
| Multidisciplinary Studies | 0 | 0.0% |
| Science & Technology | 24 | 11.7% |
| Business | 17 | 8.3% |
| Education | 51 | 24.9% |
| Literature & Languages | 7 | 3.4% |
| Liberal Arts & History | 14 | 6.8% |
| Visual & Performing Arts | 5 | 2.4% |
| Communications | 7 | 3.4% |
| Arts & Humanities | 8 | 3.9% |
| Total | 205 | 100.0% |
Transportation & Commute in Grayling
Vehicle Availability by Sex in Grayling
The most prevalent vehicle ownership categories in Grayling are males with 2 vehicles (133, accounting for 47.0%) and females with 2 vehicles (84, making up 50.0%).
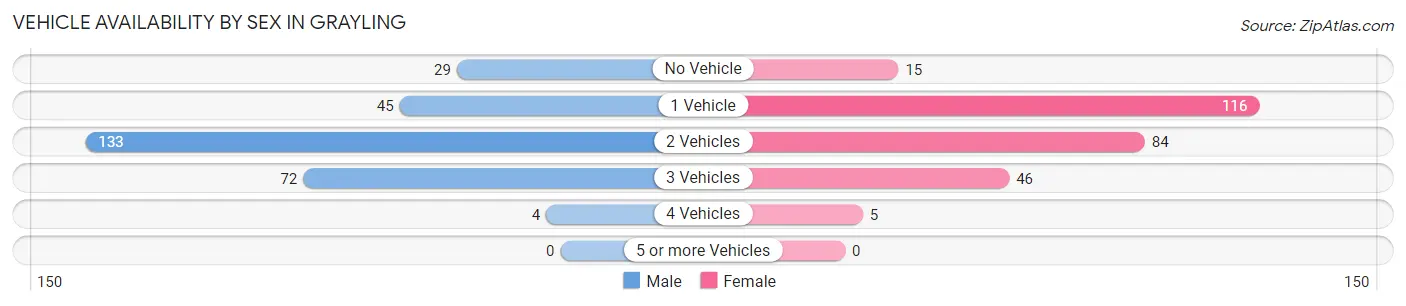
| Vehicles Available | Male | Female |
| No Vehicle | 29 (10.2%) | 15 (5.6%) |
| 1 Vehicle | 45 (15.9%) | 116 (43.6%) |
| 2 Vehicles | 133 (47.0%) | 84 (31.6%) |
| 3 Vehicles | 72 (25.4%) | 46 (17.3%) |
| 4 Vehicles | 4 (1.4%) | 5 (1.9%) |
| 5 or more Vehicles | 0 (0.0%) | 0 (0.0%) |
| Total | 283 (100.0%) | 266 (100.0%) |
Commute Time in Grayling
The most frequently occuring commute durations in Grayling are 5 to 9 minutes (160 commuters, 30.9%), less than 5 minutes (113 commuters, 21.8%), and 10 to 14 minutes (59 commuters, 11.4%).
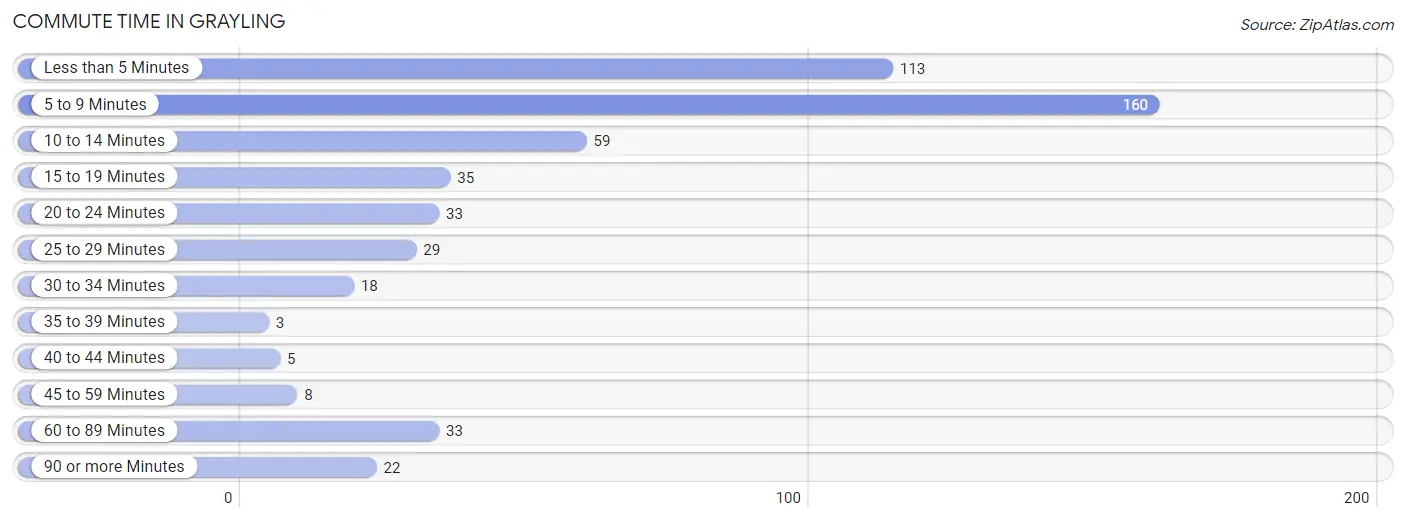
| Commute Time | # Commuters | % Commuters |
| Less than 5 Minutes | 113 | 21.8% |
| 5 to 9 Minutes | 160 | 30.9% |
| 10 to 14 Minutes | 59 | 11.4% |
| 15 to 19 Minutes | 35 | 6.8% |
| 20 to 24 Minutes | 33 | 6.4% |
| 25 to 29 Minutes | 29 | 5.6% |
| 30 to 34 Minutes | 18 | 3.5% |
| 35 to 39 Minutes | 3 | 0.6% |
| 40 to 44 Minutes | 5 | 1.0% |
| 45 to 59 Minutes | 8 | 1.5% |
| 60 to 89 Minutes | 33 | 6.4% |
| 90 or more Minutes | 22 | 4.3% |
Commute Time by Sex in Grayling
The most common commute times in Grayling are 5 to 9 minutes (94 commuters, 34.6%) for males and 5 to 9 minutes (66 commuters, 26.8%) for females.
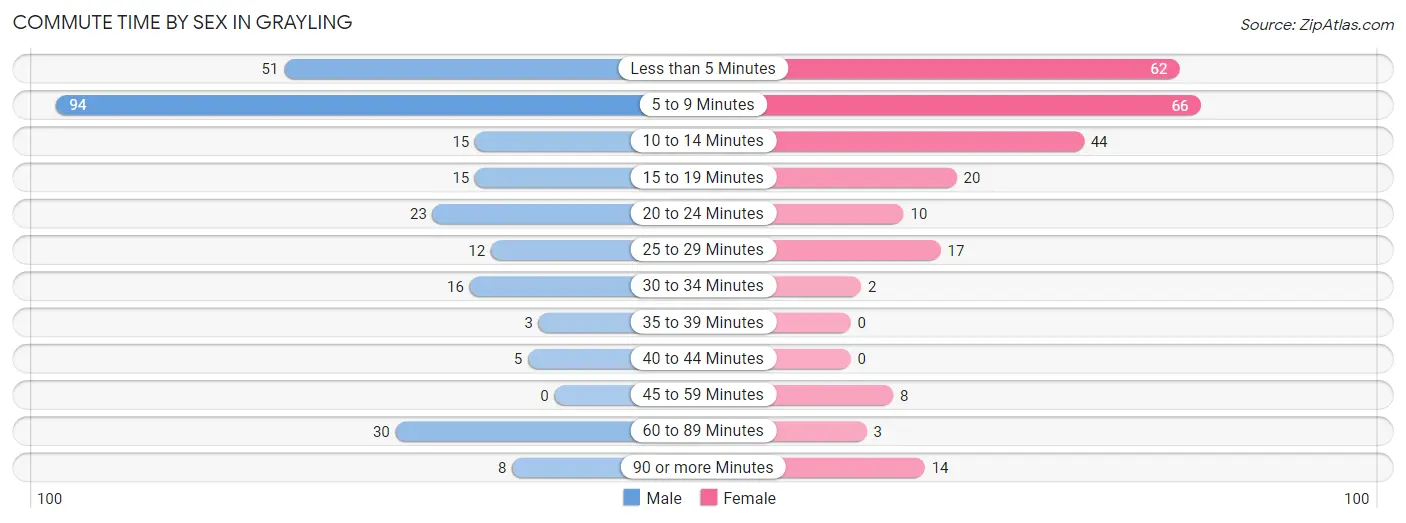
| Commute Time | Male | Female |
| Less than 5 Minutes | 51 (18.8%) | 62 (25.2%) |
| 5 to 9 Minutes | 94 (34.6%) | 66 (26.8%) |
| 10 to 14 Minutes | 15 (5.5%) | 44 (17.9%) |
| 15 to 19 Minutes | 15 (5.5%) | 20 (8.1%) |
| 20 to 24 Minutes | 23 (8.5%) | 10 (4.1%) |
| 25 to 29 Minutes | 12 (4.4%) | 17 (6.9%) |
| 30 to 34 Minutes | 16 (5.9%) | 2 (0.8%) |
| 35 to 39 Minutes | 3 (1.1%) | 0 (0.0%) |
| 40 to 44 Minutes | 5 (1.8%) | 0 (0.0%) |
| 45 to 59 Minutes | 0 (0.0%) | 8 (3.3%) |
| 60 to 89 Minutes | 30 (11.0%) | 3 (1.2%) |
| 90 or more Minutes | 8 (2.9%) | 14 (5.7%) |
Time of Departure to Work by Sex in Grayling
The most frequent times of departure to work in Grayling are 8:00 AM to 8:29 AM (45, 16.5%) for males and 7:30 AM to 7:59 AM (59, 24.0%) for females.
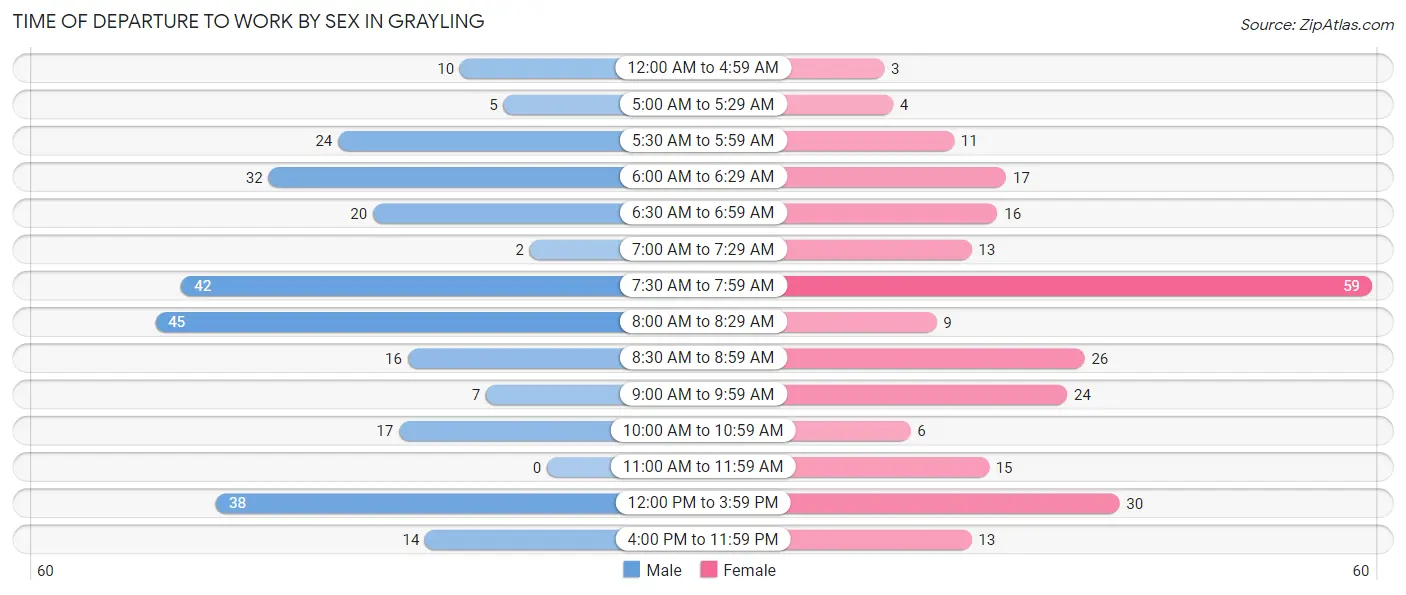
| Time of Departure | Male | Female |
| 12:00 AM to 4:59 AM | 10 (3.7%) | 3 (1.2%) |
| 5:00 AM to 5:29 AM | 5 (1.8%) | 4 (1.6%) |
| 5:30 AM to 5:59 AM | 24 (8.8%) | 11 (4.5%) |
| 6:00 AM to 6:29 AM | 32 (11.8%) | 17 (6.9%) |
| 6:30 AM to 6:59 AM | 20 (7.3%) | 16 (6.5%) |
| 7:00 AM to 7:29 AM | 2 (0.7%) | 13 (5.3%) |
| 7:30 AM to 7:59 AM | 42 (15.4%) | 59 (24.0%) |
| 8:00 AM to 8:29 AM | 45 (16.5%) | 9 (3.7%) |
| 8:30 AM to 8:59 AM | 16 (5.9%) | 26 (10.6%) |
| 9:00 AM to 9:59 AM | 7 (2.6%) | 24 (9.8%) |
| 10:00 AM to 10:59 AM | 17 (6.2%) | 6 (2.4%) |
| 11:00 AM to 11:59 AM | 0 (0.0%) | 15 (6.1%) |
| 12:00 PM to 3:59 PM | 38 (14.0%) | 30 (12.2%) |
| 4:00 PM to 11:59 PM | 14 (5.1%) | 13 (5.3%) |
| Total | 272 (100.0%) | 246 (100.0%) |
Housing Occupancy in Grayling
Occupancy by Ownership in Grayling
Of the total 761 dwellings in Grayling, owner-occupied units account for 398 (52.3%), while renter-occupied units make up 363 (47.7%).
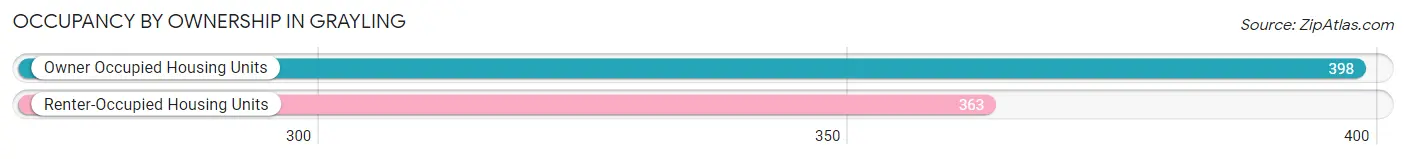
| Occupancy | # Housing Units | % Housing Units |
| Owner Occupied Housing Units | 398 | 52.3% |
| Renter-Occupied Housing Units | 363 | 47.7% |
| Total Occupied Housing Units | 761 | 100.0% |
Occupancy by Household Size in Grayling
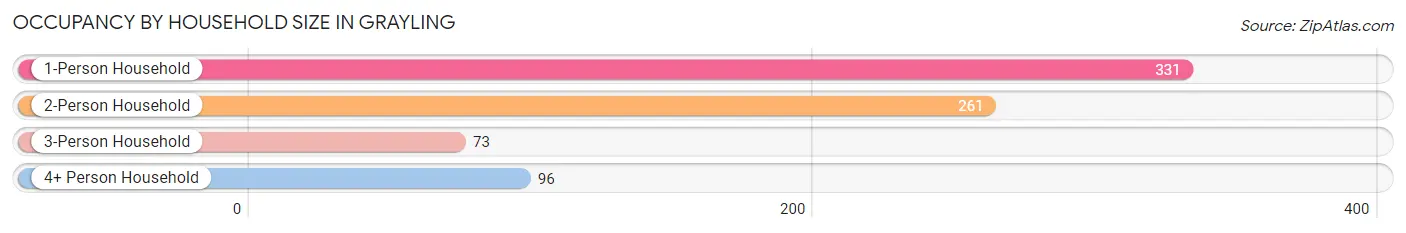
| Household Size | # Housing Units | % Housing Units |
| 1-Person Household | 331 | 43.5% |
| 2-Person Household | 261 | 34.3% |
| 3-Person Household | 73 | 9.6% |
| 4+ Person Household | 96 | 12.6% |
| Total Housing Units | 761 | 100.0% |
Occupancy by Ownership by Household Size in Grayling
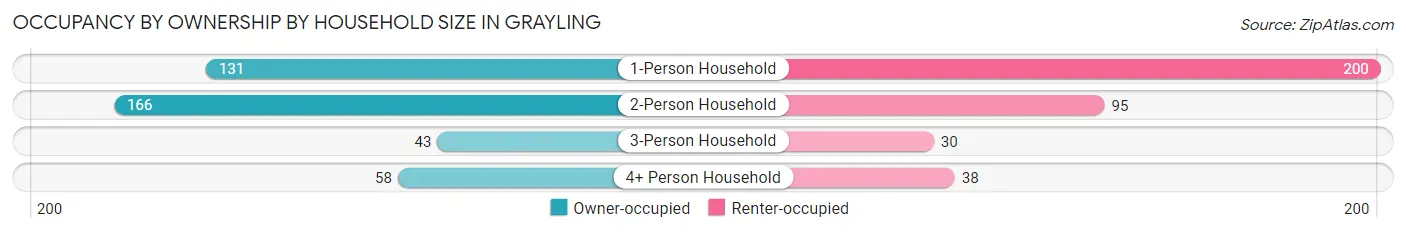
| Household Size | Owner-occupied | Renter-occupied |
| 1-Person Household | 131 (39.6%) | 200 (60.4%) |
| 2-Person Household | 166 (63.6%) | 95 (36.4%) |
| 3-Person Household | 43 (58.9%) | 30 (41.1%) |
| 4+ Person Household | 58 (60.4%) | 38 (39.6%) |
| Total Housing Units | 398 (52.3%) | 363 (47.7%) |
Occupancy by Educational Attainment in Grayling
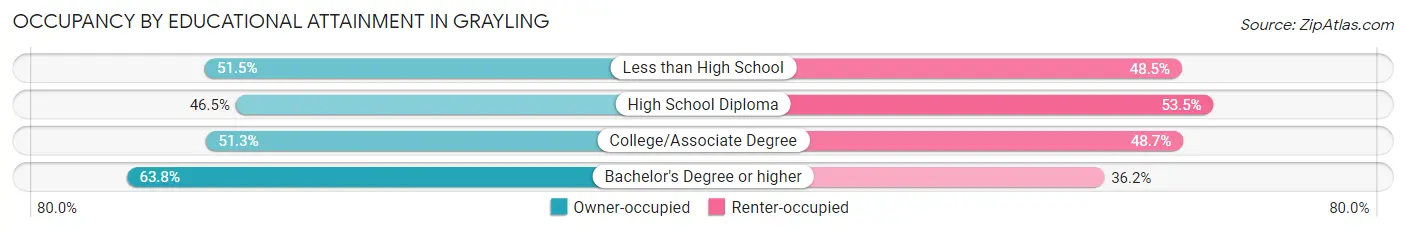
| Household Size | Owner-occupied | Renter-occupied |
| Less than High School | 34 (51.5%) | 32 (48.5%) |
| High School Diploma | 100 (46.5%) | 115 (53.5%) |
| College/Associate Degree | 174 (51.3%) | 165 (48.7%) |
| Bachelor's Degree or higher | 90 (63.8%) | 51 (36.2%) |
Occupancy by Age of Householder in Grayling
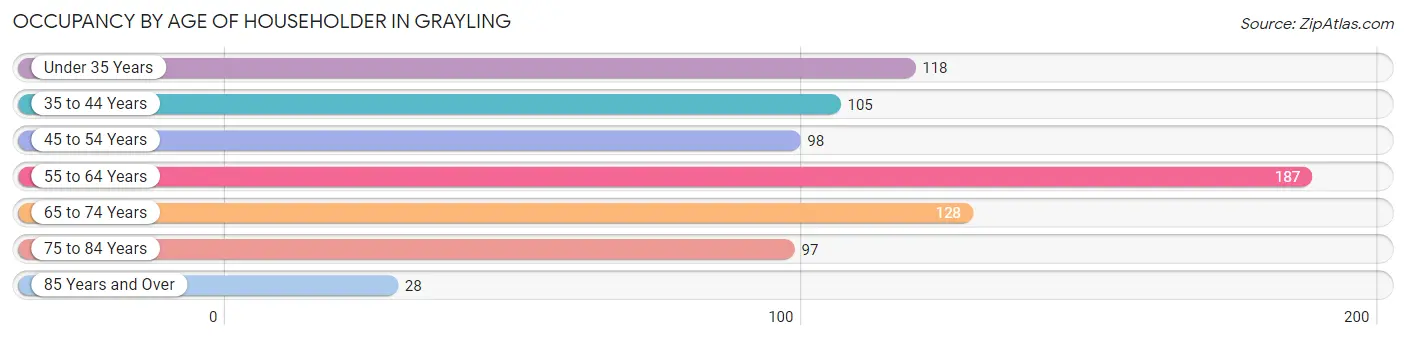
| Age Bracket | # Households | % Households |
| Under 35 Years | 118 | 15.5% |
| 35 to 44 Years | 105 | 13.8% |
| 45 to 54 Years | 98 | 12.9% |
| 55 to 64 Years | 187 | 24.6% |
| 65 to 74 Years | 128 | 16.8% |
| 75 to 84 Years | 97 | 12.8% |
| 85 Years and Over | 28 | 3.7% |
| Total | 761 | 100.0% |
Housing Finances in Grayling
Median Income by Occupancy in Grayling
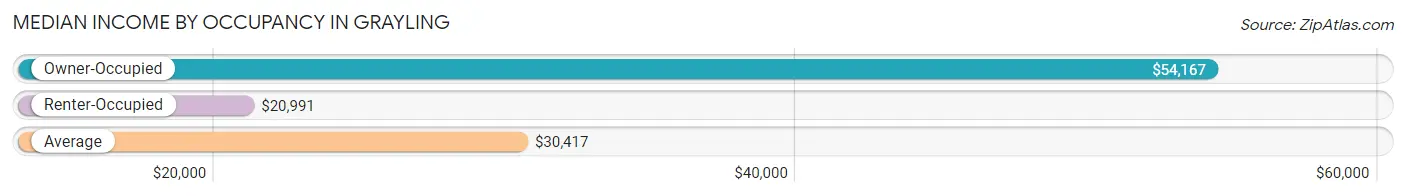
| Occupancy Type | # Households | Median Income |
| Owner-Occupied | 398 (52.3%) | $54,167 |
| Renter-Occupied | 363 (47.7%) | $20,991 |
| Average | 761 (100.0%) | $30,417 |
Occupancy by Householder Income Bracket in Grayling
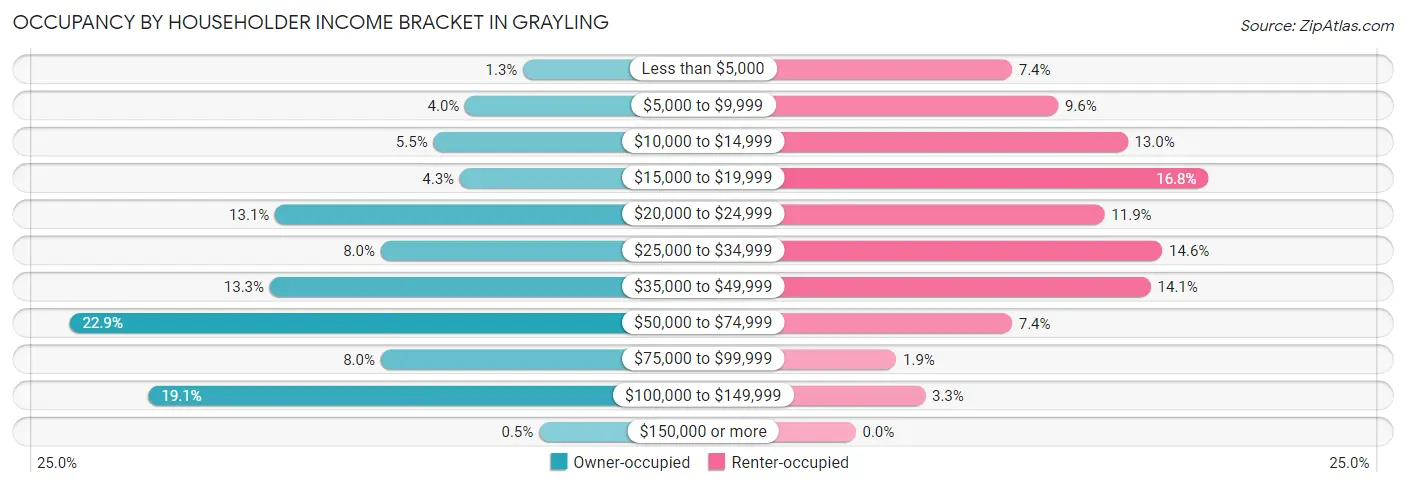
| Income Bracket | Owner-occupied | Renter-occupied |
| Less than $5,000 | 5 (1.3%) | 27 (7.4%) |
| $5,000 to $9,999 | 16 (4.0%) | 35 (9.6%) |
| $10,000 to $14,999 | 22 (5.5%) | 47 (13.0%) |
| $15,000 to $19,999 | 17 (4.3%) | 61 (16.8%) |
| $20,000 to $24,999 | 52 (13.1%) | 43 (11.8%) |
| $25,000 to $34,999 | 32 (8.0%) | 53 (14.6%) |
| $35,000 to $49,999 | 53 (13.3%) | 51 (14.1%) |
| $50,000 to $74,999 | 91 (22.9%) | 27 (7.4%) |
| $75,000 to $99,999 | 32 (8.0%) | 7 (1.9%) |
| $100,000 to $149,999 | 76 (19.1%) | 12 (3.3%) |
| $150,000 or more | 2 (0.5%) | 0 (0.0%) |
| Total | 398 (100.0%) | 363 (100.0%) |
Monthly Housing Cost Tiers in Grayling
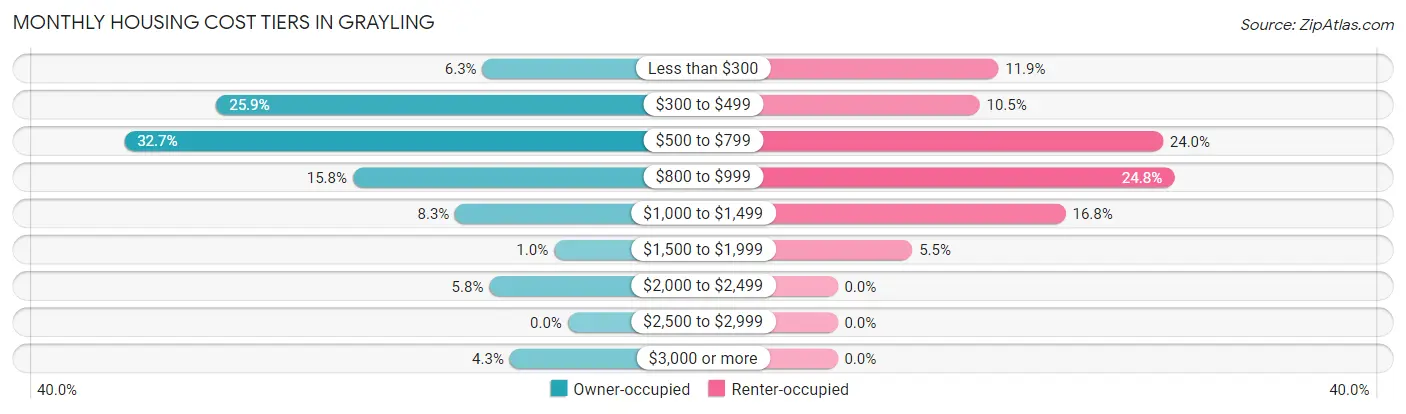
| Monthly Cost | Owner-occupied | Renter-occupied |
| Less than $300 | 25 (6.3%) | 43 (11.8%) |
| $300 to $499 | 103 (25.9%) | 38 (10.5%) |
| $500 to $799 | 130 (32.7%) | 87 (24.0%) |
| $800 to $999 | 63 (15.8%) | 90 (24.8%) |
| $1,000 to $1,499 | 33 (8.3%) | 61 (16.8%) |
| $1,500 to $1,999 | 4 (1.0%) | 20 (5.5%) |
| $2,000 to $2,499 | 23 (5.8%) | 0 (0.0%) |
| $2,500 to $2,999 | 0 (0.0%) | 0 (0.0%) |
| $3,000 or more | 17 (4.3%) | 0 (0.0%) |
| Total | 398 (100.0%) | 363 (100.0%) |
Physical Housing Characteristics in Grayling
Housing Structures in Grayling
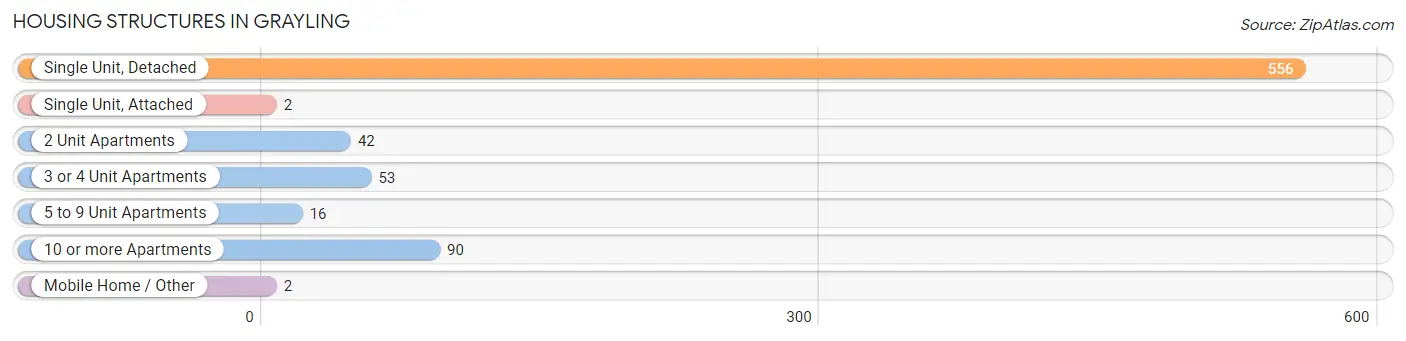
| Structure Type | # Housing Units | % Housing Units |
| Single Unit, Detached | 556 | 73.1% |
| Single Unit, Attached | 2 | 0.3% |
| 2 Unit Apartments | 42 | 5.5% |
| 3 or 4 Unit Apartments | 53 | 7.0% |
| 5 to 9 Unit Apartments | 16 | 2.1% |
| 10 or more Apartments | 90 | 11.8% |
| Mobile Home / Other | 2 | 0.3% |
| Total | 761 | 100.0% |
Housing Structures by Occupancy in Grayling
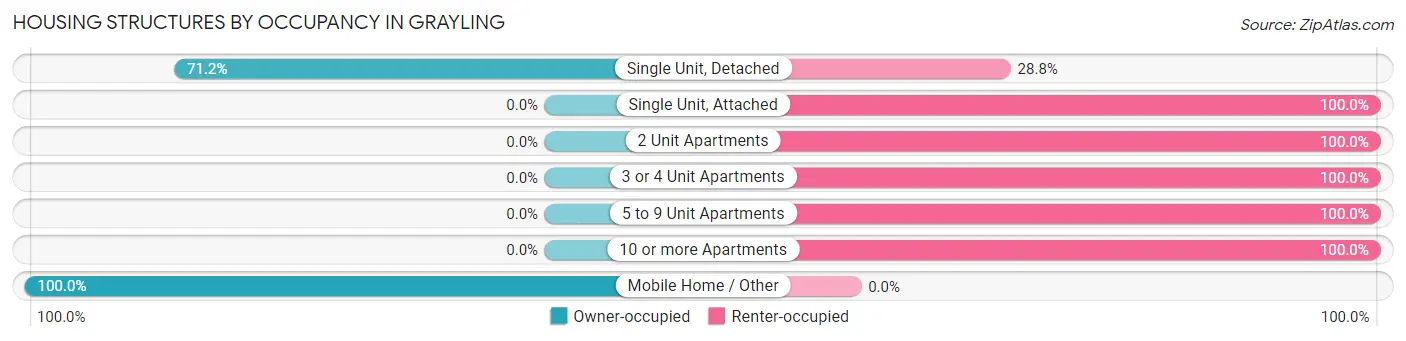
| Structure Type | Owner-occupied | Renter-occupied |
| Single Unit, Detached | 396 (71.2%) | 160 (28.8%) |
| Single Unit, Attached | 0 (0.0%) | 2 (100.0%) |
| 2 Unit Apartments | 0 (0.0%) | 42 (100.0%) |
| 3 or 4 Unit Apartments | 0 (0.0%) | 53 (100.0%) |
| 5 to 9 Unit Apartments | 0 (0.0%) | 16 (100.0%) |
| 10 or more Apartments | 0 (0.0%) | 90 (100.0%) |
| Mobile Home / Other | 2 (100.0%) | 0 (0.0%) |
| Total | 398 (52.3%) | 363 (47.7%) |
Housing Structures by Number of Rooms in Grayling
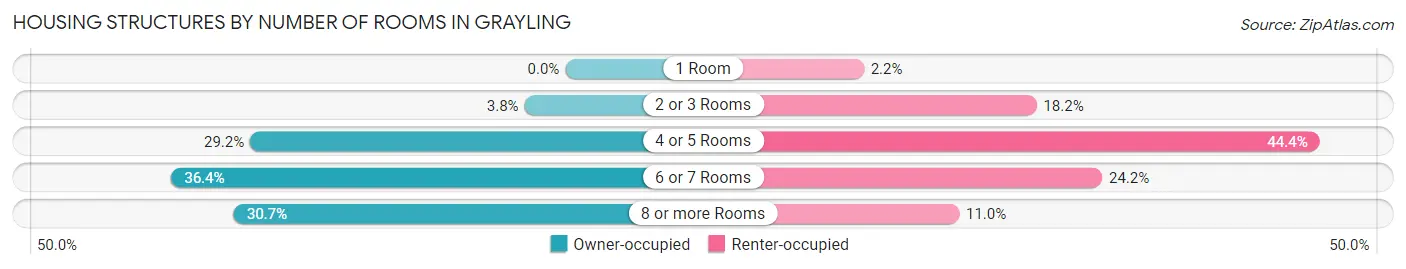
| Number of Rooms | Owner-occupied | Renter-occupied |
| 1 Room | 0 (0.0%) | 8 (2.2%) |
| 2 or 3 Rooms | 15 (3.8%) | 66 (18.2%) |
| 4 or 5 Rooms | 116 (29.1%) | 161 (44.4%) |
| 6 or 7 Rooms | 145 (36.4%) | 88 (24.2%) |
| 8 or more Rooms | 122 (30.6%) | 40 (11.0%) |
| Total | 398 (100.0%) | 363 (100.0%) |
Housing Structure by Heating Type in Grayling
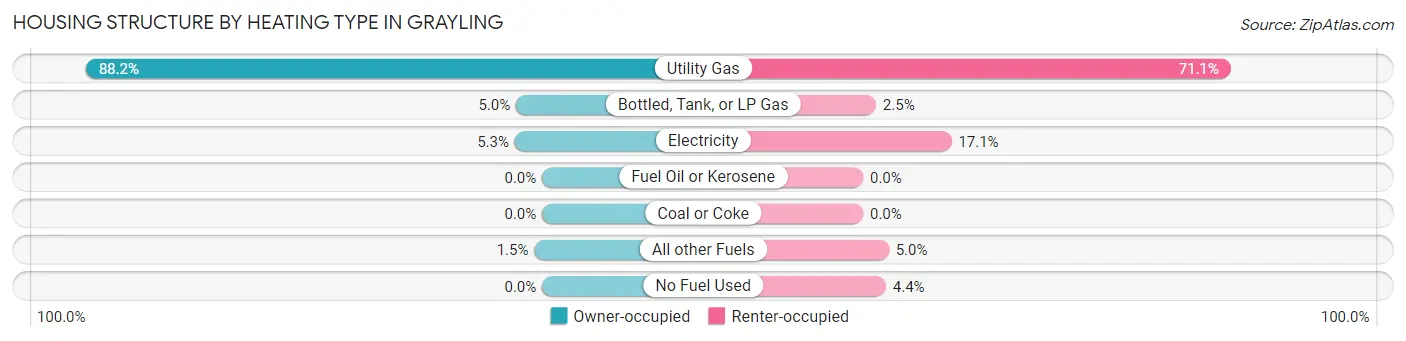
| Heating Type | Owner-occupied | Renter-occupied |
| Utility Gas | 351 (88.2%) | 258 (71.1%) |
| Bottled, Tank, or LP Gas | 20 (5.0%) | 9 (2.5%) |
| Electricity | 21 (5.3%) | 62 (17.1%) |
| Fuel Oil or Kerosene | 0 (0.0%) | 0 (0.0%) |
| Coal or Coke | 0 (0.0%) | 0 (0.0%) |
| All other Fuels | 6 (1.5%) | 18 (5.0%) |
| No Fuel Used | 0 (0.0%) | 16 (4.4%) |
| Total | 398 (100.0%) | 363 (100.0%) |
Household Vehicle Usage in Grayling
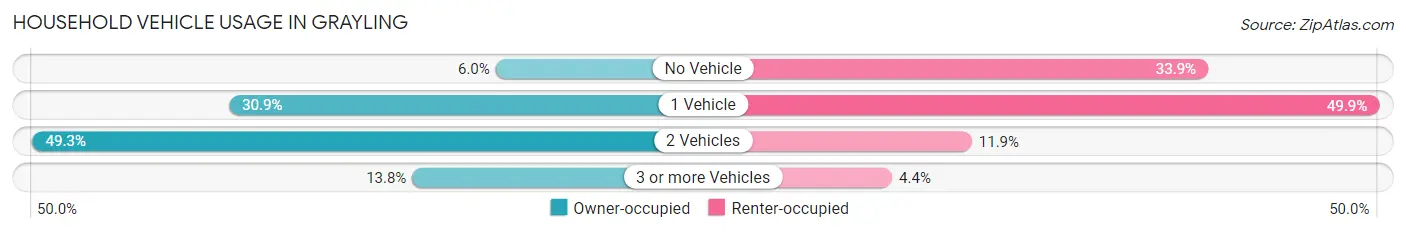
| Vehicles per Household | Owner-occupied | Renter-occupied |
| No Vehicle | 24 (6.0%) | 123 (33.9%) |
| 1 Vehicle | 123 (30.9%) | 181 (49.9%) |
| 2 Vehicles | 196 (49.2%) | 43 (11.8%) |
| 3 or more Vehicles | 55 (13.8%) | 16 (4.4%) |
| Total | 398 (100.0%) | 363 (100.0%) |
Real Estate & Mortgages in Grayling
Real Estate and Mortgage Overview in Grayling
| Characteristic | Without Mortgage | With Mortgage |
| Housing Units | 205 | 193 |
| Median Property Value | $123,300 | $89,100 |
| Median Household Income | $57,703 | $2 |
| Monthly Housing Costs | $452 | $13 |
| Real Estate Taxes | $1,263 | $0 |
Property Value by Mortgage Status in Grayling
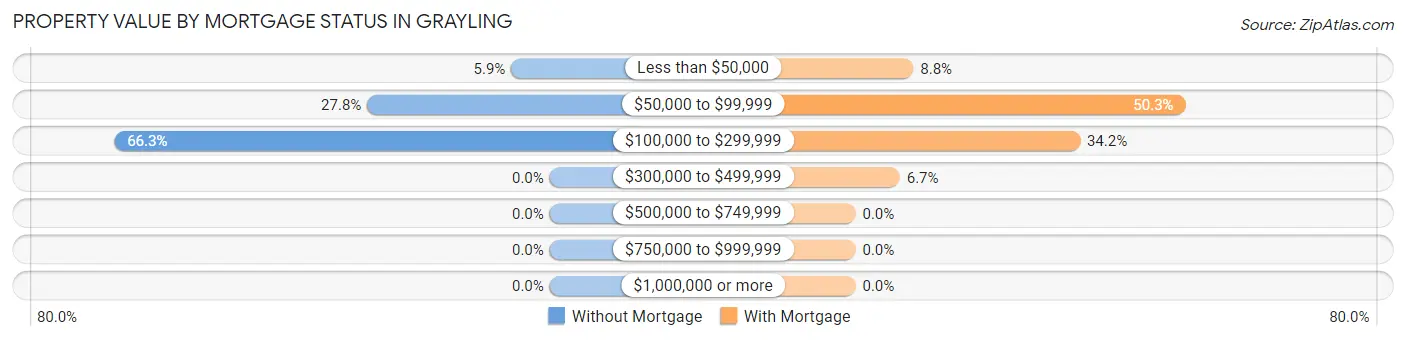
| Property Value | Without Mortgage | With Mortgage |
| Less than $50,000 | 12 (5.9%) | 17 (8.8%) |
| $50,000 to $99,999 | 57 (27.8%) | 97 (50.3%) |
| $100,000 to $299,999 | 136 (66.3%) | 66 (34.2%) |
| $300,000 to $499,999 | 0 (0.0%) | 13 (6.7%) |
| $500,000 to $749,999 | 0 (0.0%) | 0 (0.0%) |
| $750,000 to $999,999 | 0 (0.0%) | 0 (0.0%) |
| $1,000,000 or more | 0 (0.0%) | 0 (0.0%) |
| Total | 205 (100.0%) | 193 (100.0%) |
Household Income by Mortgage Status in Grayling
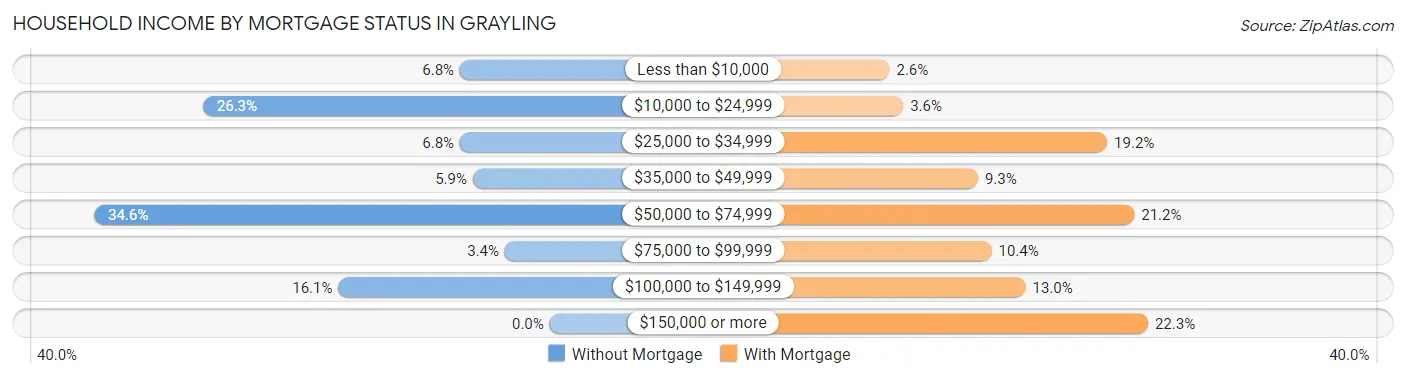
| Household Income | Without Mortgage | With Mortgage |
| Less than $10,000 | 14 (6.8%) | 5 (2.6%) |
| $10,000 to $24,999 | 54 (26.3%) | 7 (3.6%) |
| $25,000 to $34,999 | 14 (6.8%) | 37 (19.2%) |
| $35,000 to $49,999 | 12 (5.9%) | 18 (9.3%) |
| $50,000 to $74,999 | 71 (34.6%) | 41 (21.2%) |
| $75,000 to $99,999 | 7 (3.4%) | 20 (10.4%) |
| $100,000 to $149,999 | 33 (16.1%) | 25 (13.0%) |
| $150,000 or more | 0 (0.0%) | 43 (22.3%) |
| Total | 205 (100.0%) | 193 (100.0%) |
Property Value to Household Income Ratio in Grayling
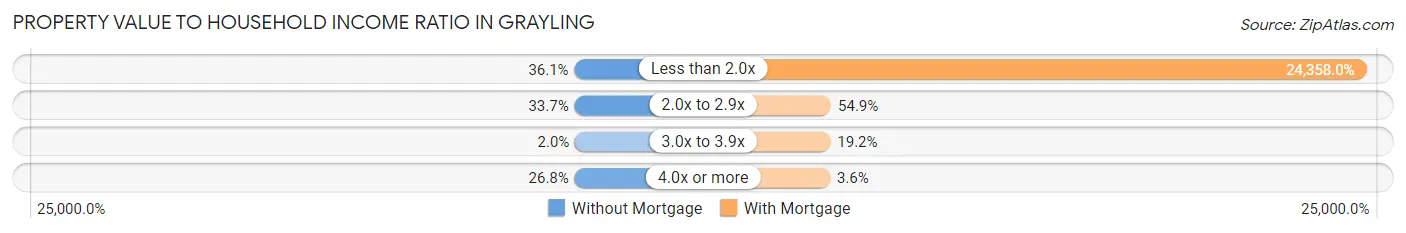
| Value-to-Income Ratio | Without Mortgage | With Mortgage |
| Less than 2.0x | 74 (36.1%) | 47,011 (24,358.0%) |
| 2.0x to 2.9x | 69 (33.7%) | 106 (54.9%) |
| 3.0x to 3.9x | 4 (1.9%) | 37 (19.2%) |
| 4.0x or more | 55 (26.8%) | 7 (3.6%) |
| Total | 205 (100.0%) | 193 (100.0%) |
Real Estate Taxes by Mortgage Status in Grayling
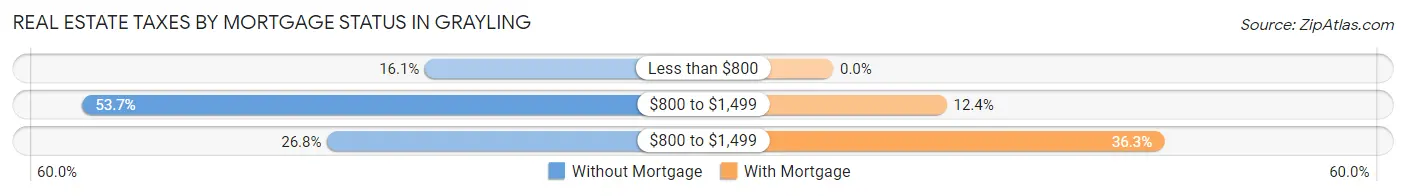
| Property Taxes | Without Mortgage | With Mortgage |
| Less than $800 | 33 (16.1%) | 0 (0.0%) |
| $800 to $1,499 | 110 (53.7%) | 24 (12.4%) |
| $800 to $1,499 | 55 (26.8%) | 70 (36.3%) |
| Total | 205 (100.0%) | 193 (100.0%) |
Health & Disability in Grayling
Health Insurance Coverage by Age in Grayling
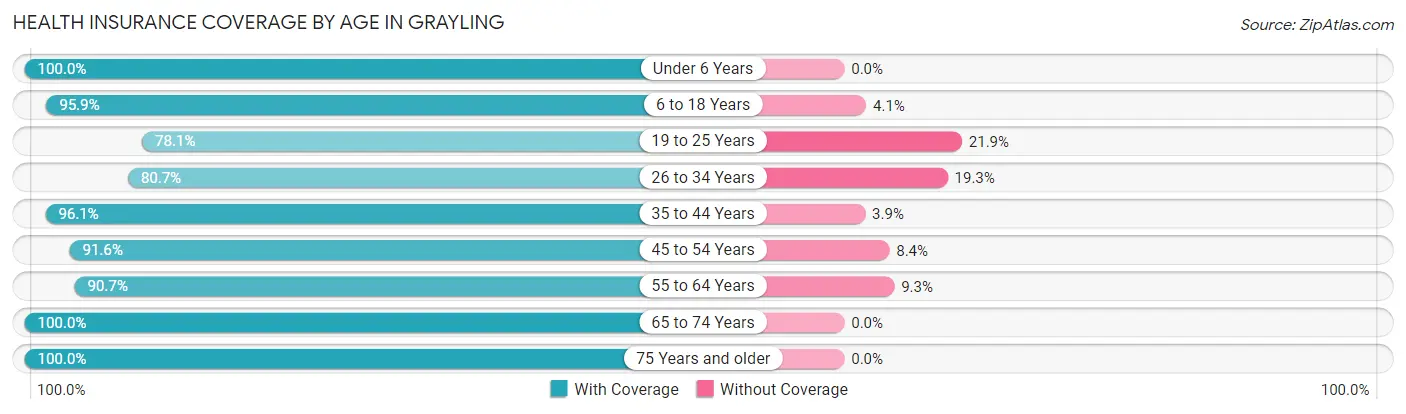
| Age Bracket | With Coverage | Without Coverage |
| Under 6 Years | 118 (100.0%) | 0 (0.0%) |
| 6 to 18 Years | 260 (95.9%) | 11 (4.1%) |
| 19 to 25 Years | 57 (78.1%) | 16 (21.9%) |
| 26 to 34 Years | 155 (80.7%) | 37 (19.3%) |
| 35 to 44 Years | 173 (96.1%) | 7 (3.9%) |
| 45 to 54 Years | 142 (91.6%) | 13 (8.4%) |
| 55 to 64 Years | 263 (90.7%) | 27 (9.3%) |
| 65 to 74 Years | 171 (100.0%) | 0 (0.0%) |
| 75 Years and older | 163 (100.0%) | 0 (0.0%) |
| Total | 1,502 (93.1%) | 111 (6.9%) |
Health Insurance Coverage by Citizenship Status in Grayling
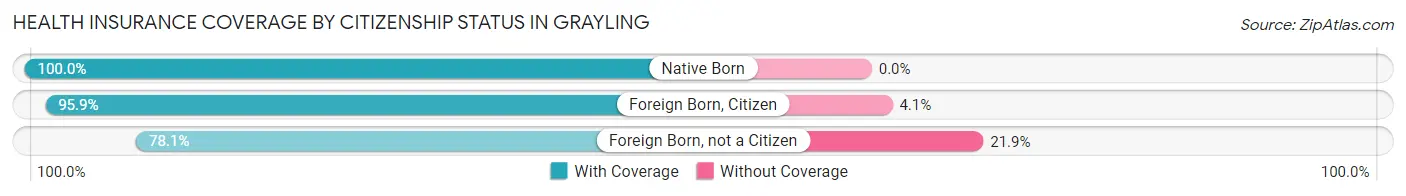
| Citizenship Status | With Coverage | Without Coverage |
| Native Born | 118 (100.0%) | 0 (0.0%) |
| Foreign Born, Citizen | 260 (95.9%) | 11 (4.1%) |
| Foreign Born, not a Citizen | 57 (78.1%) | 16 (21.9%) |
Health Insurance Coverage by Household Income in Grayling
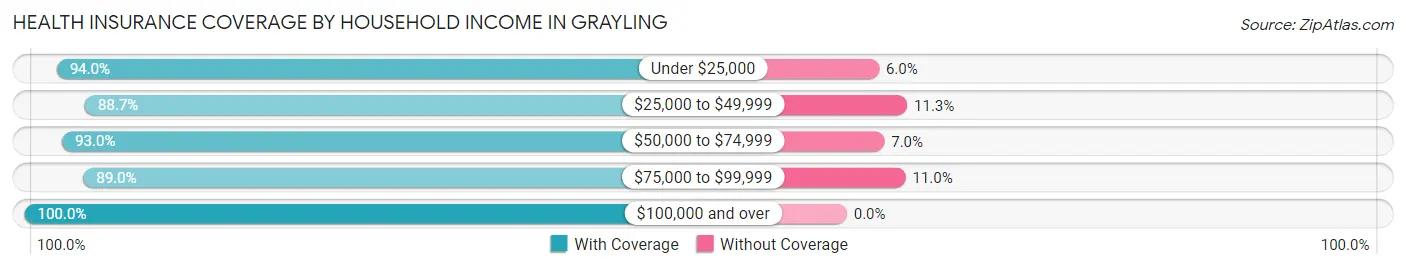
| Household Income | With Coverage | Without Coverage |
| Under $25,000 | 500 (94.0%) | 32 (6.0%) |
| $25,000 to $49,999 | 306 (88.7%) | 39 (11.3%) |
| $50,000 to $74,999 | 371 (93.0%) | 28 (7.0%) |
| $75,000 to $99,999 | 97 (89.0%) | 12 (11.0%) |
| $100,000 and over | 219 (100.0%) | 0 (0.0%) |
Public vs Private Health Insurance Coverage by Age in Grayling
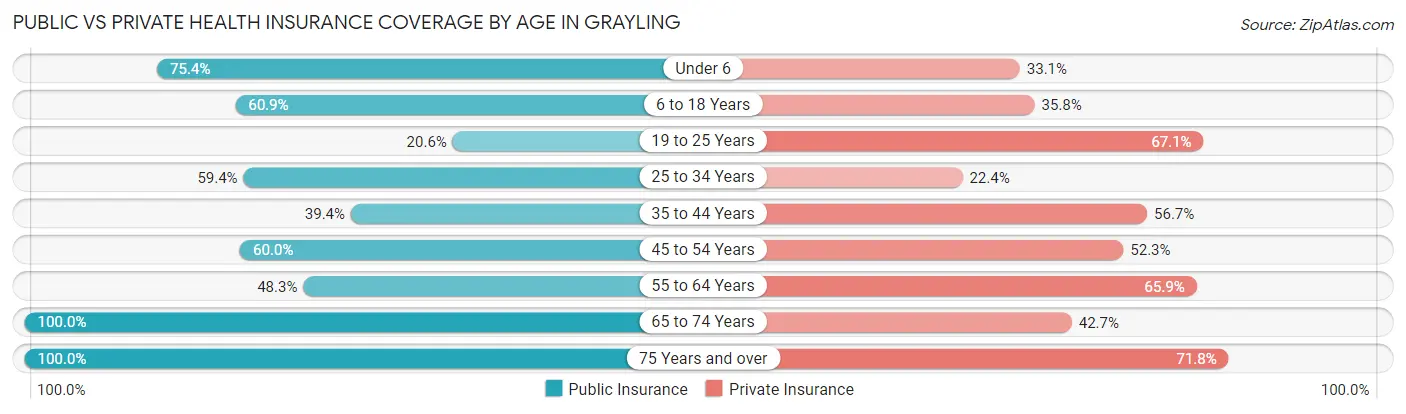
| Age Bracket | Public Insurance | Private Insurance |
| Under 6 | 89 (75.4%) | 39 (33.1%) |
| 6 to 18 Years | 165 (60.9%) | 97 (35.8%) |
| 19 to 25 Years | 15 (20.5%) | 49 (67.1%) |
| 25 to 34 Years | 114 (59.4%) | 43 (22.4%) |
| 35 to 44 Years | 71 (39.4%) | 102 (56.7%) |
| 45 to 54 Years | 93 (60.0%) | 81 (52.3%) |
| 55 to 64 Years | 140 (48.3%) | 191 (65.9%) |
| 65 to 74 Years | 171 (100.0%) | 73 (42.7%) |
| 75 Years and over | 163 (100.0%) | 117 (71.8%) |
| Total | 1,021 (63.3%) | 792 (49.1%) |
Disability Status by Sex by Age in Grayling
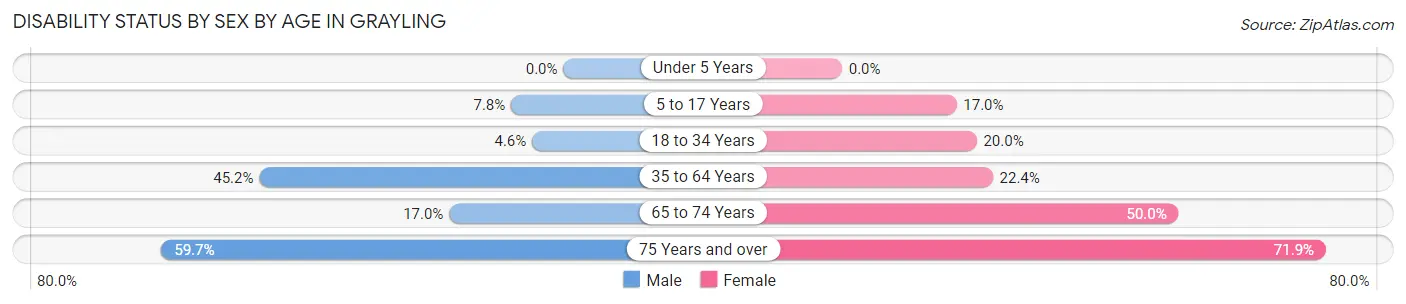
| Age Bracket | Male | Female |
| Under 5 Years | 0 (0.0%) | 0 (0.0%) |
| 5 to 17 Years | 9 (7.8%) | 25 (17.0%) |
| 18 to 34 Years | 7 (4.6%) | 29 (20.0%) |
| 35 to 64 Years | 135 (45.2%) | 73 (22.4%) |
| 65 to 74 Years | 10 (17.0%) | 56 (50.0%) |
| 75 Years and over | 40 (59.7%) | 69 (71.9%) |
Disability Class by Sex by Age in Grayling
Disability Class: Hearing Difficulty
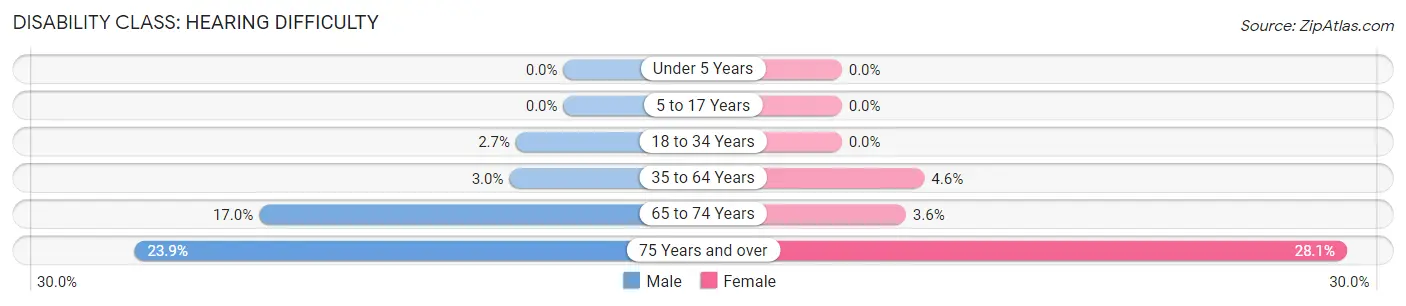
| Age Bracket | Male | Female |
| Under 5 Years | 0 (0.0%) | 0 (0.0%) |
| 5 to 17 Years | 0 (0.0%) | 0 (0.0%) |
| 18 to 34 Years | 4 (2.6%) | 0 (0.0%) |
| 35 to 64 Years | 9 (3.0%) | 15 (4.6%) |
| 65 to 74 Years | 10 (17.0%) | 4 (3.6%) |
| 75 Years and over | 16 (23.9%) | 27 (28.1%) |
Disability Class: Vision Difficulty
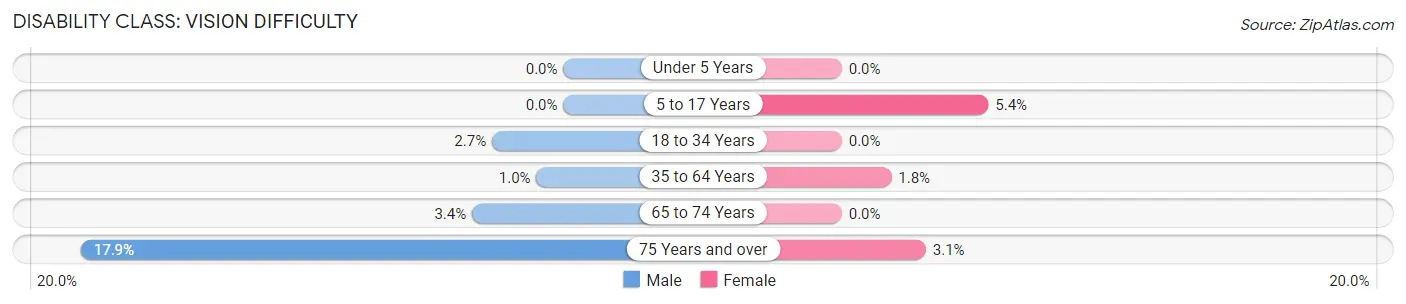
| Age Bracket | Male | Female |
| Under 5 Years | 0 (0.0%) | 0 (0.0%) |
| 5 to 17 Years | 0 (0.0%) | 8 (5.4%) |
| 18 to 34 Years | 4 (2.6%) | 0 (0.0%) |
| 35 to 64 Years | 3 (1.0%) | 6 (1.8%) |
| 65 to 74 Years | 2 (3.4%) | 0 (0.0%) |
| 75 Years and over | 12 (17.9%) | 3 (3.1%) |
Disability Class: Cognitive Difficulty
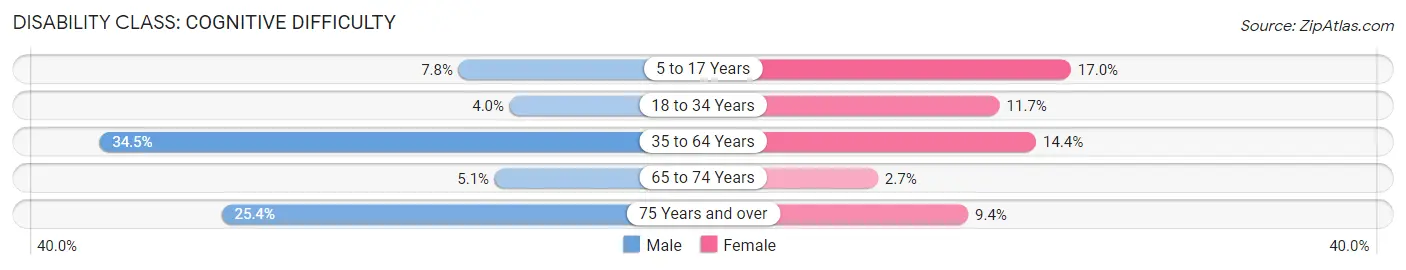
| Age Bracket | Male | Female |
| 5 to 17 Years | 9 (7.8%) | 25 (17.0%) |
| 18 to 34 Years | 6 (4.0%) | 17 (11.7%) |
| 35 to 64 Years | 103 (34.4%) | 47 (14.4%) |
| 65 to 74 Years | 3 (5.1%) | 3 (2.7%) |
| 75 Years and over | 17 (25.4%) | 9 (9.4%) |
Disability Class: Ambulatory Difficulty
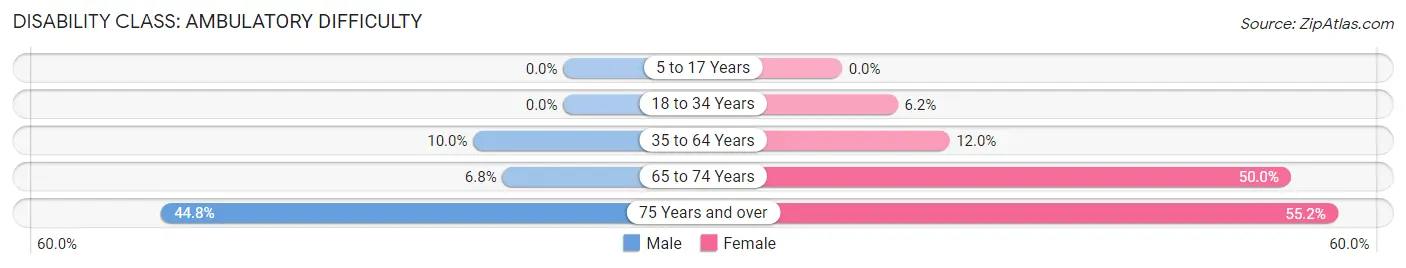
| Age Bracket | Male | Female |
| 5 to 17 Years | 0 (0.0%) | 0 (0.0%) |
| 18 to 34 Years | 0 (0.0%) | 9 (6.2%) |
| 35 to 64 Years | 30 (10.0%) | 39 (12.0%) |
| 65 to 74 Years | 4 (6.8%) | 56 (50.0%) |
| 75 Years and over | 30 (44.8%) | 53 (55.2%) |
Disability Class: Self-Care Difficulty
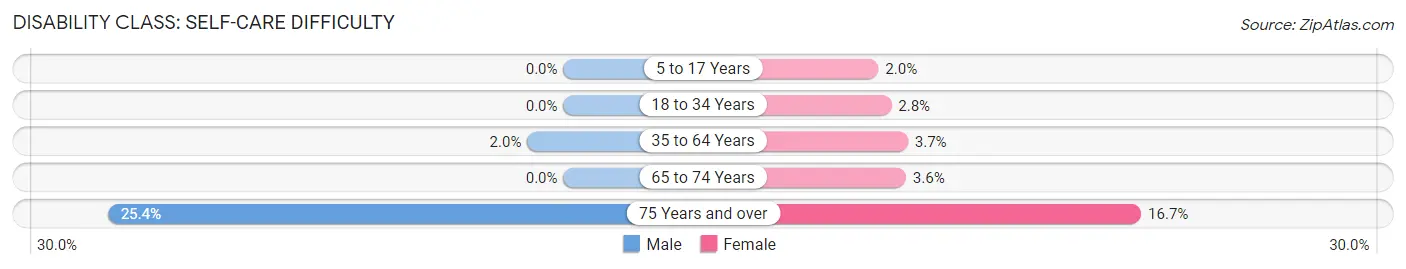
| Age Bracket | Male | Female |
| 5 to 17 Years | 0 (0.0%) | 3 (2.0%) |
| 18 to 34 Years | 0 (0.0%) | 4 (2.8%) |
| 35 to 64 Years | 6 (2.0%) | 12 (3.7%) |
| 65 to 74 Years | 0 (0.0%) | 4 (3.6%) |
| 75 Years and over | 17 (25.4%) | 16 (16.7%) |
Technology Access in Grayling
Computing Device Access in Grayling
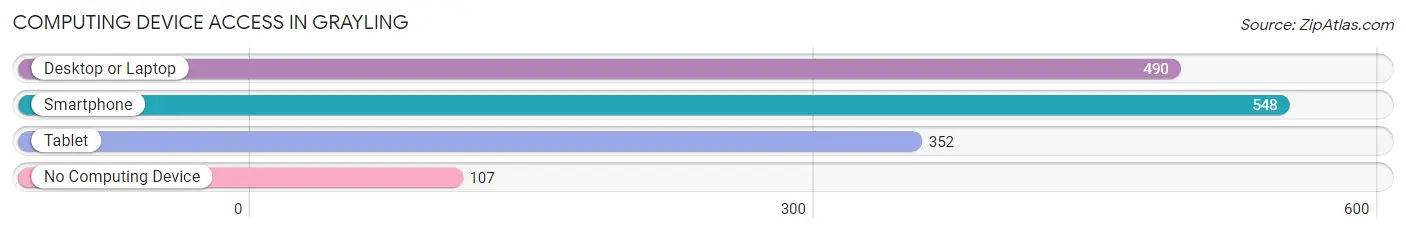
| Device Type | # Households | % Households |
| Desktop or Laptop | 490 | 64.4% |
| Smartphone | 548 | 72.0% |
| Tablet | 352 | 46.3% |
| No Computing Device | 107 | 14.1% |
| Total | 761 | 100.0% |
Internet Access in Grayling
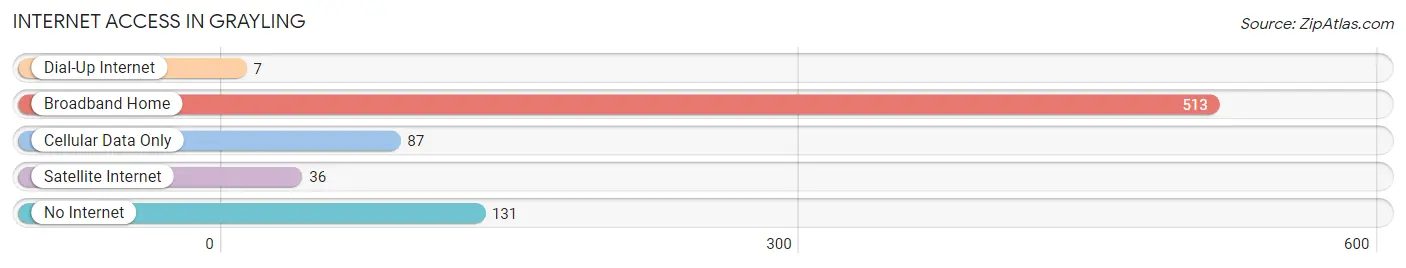
| Internet Type | # Households | % Households |
| Dial-Up Internet | 7 | 0.9% |
| Broadband Home | 513 | 67.4% |
| Cellular Data Only | 87 | 11.4% |
| Satellite Internet | 36 | 4.7% |
| No Internet | 131 | 17.2% |
| Total | 761 | 100.0% |
Grayling Summary
Grayling, Michigan is a small city located in the northern part of the state, in Crawford County. It is situated on the banks of the Au Sable River, and is surrounded by forests and lakes. The city is known for its outdoor recreation opportunities, and is a popular destination for fishing, hunting, camping, and other outdoor activities.
History
Grayling was first settled in 1875 by a group of lumberjacks from Canada. The town was named after the grayling fish, which were abundant in the nearby Au Sable River. The lumber industry was the main source of income for the town, and the population grew steadily throughout the late 19th and early 20th centuries.
In the 1920s, the lumber industry began to decline, and the town began to look for other sources of income. In the 1930s, the Civilian Conservation Corps (CCC) established a camp in Grayling, and began to develop the area for recreational use. The CCC built roads, trails, and other infrastructure, and the area became a popular destination for outdoor recreation.
In the 1950s, the Michigan Department of Natural Resources (DNR) established the Hartwick Pines State Park in Grayling. The park is now one of the most popular state parks in Michigan, and is home to the largest stand of old-growth white pine and hemlock trees in the state.
Geography
Grayling is located in the northern part of Michigan, in Crawford County. It is situated on the banks of the Au Sable River, and is surrounded by forests and lakes. The city is located about 30 miles south of Traverse City, and about 50 miles north of Cadillac.
The terrain around Grayling is mostly flat, with some rolling hills. The area is heavily forested, and is home to a variety of wildlife, including deer, bear, and other animals. The nearby Au Sable River is a popular destination for fishing, canoeing, and other outdoor activities.
Economy
The economy of Grayling is largely based on tourism and outdoor recreation. The city is home to several popular state parks, including Hartwick Pines State Park and the Au Sable State Forest. These parks attract visitors from all over the state and beyond, and provide a boost to the local economy.
The city is also home to several manufacturing companies, including a paper mill and a furniture factory. These companies provide jobs for many of the city’s residents.
Demographics
As of the 2010 census, the population of Grayling was 1,884. The racial makeup of the city was 94.3% White, 0.7% African American, 0.3% Native American, 0.3% Asian, 0.1% Pacific Islander, and 4.3% from other races. Hispanic or Latino of any race were 2.2% of the population.
The median household income in Grayling was $35,938, and the median family income was $45,938. The per capita income was $20,938. About 11.3% of the population was below the poverty line.
Grayling is a small city with a rich history and a vibrant economy. It is a popular destination for outdoor recreation, and is home to several state parks and other attractions. The city is also home to several manufacturing companies, which provide jobs for many of the city’s residents.
Common Questions
What is Per Capita Income in Grayling?
Per Capita income in Grayling is $21,605.
What is the Median Family Income in Grayling?
Median Family Income in Grayling is $48,125.
What is the Median Household income in Grayling?
Median Household Income in Grayling is $30,417.
What is Income or Wage Gap in Grayling?
Income or Wage Gap in Grayling is 3.4%.
Women in Grayling earn 96.6 cents for every dollar earned by a man.
What is Inequality or Gini Index in Grayling?
Inequality or Gini Index in Grayling is 0.44.
What is the Total Population of Grayling?
Total Population of Grayling is 1,758.
What is the Total Male Population of Grayling?
Total Male Population of Grayling is 828.
What is the Total Female Population of Grayling?
Total Female Population of Grayling is 930.
What is the Ratio of Males per 100 Females in Grayling?
There are 89.03 Males per 100 Females in Grayling.
What is the Ratio of Females per 100 Males in Grayling?
There are 112.32 Females per 100 Males in Grayling.
What is the Median Population Age in Grayling?
Median Population Age in Grayling is 48.8 Years.
What is the Average Family Size in Grayling
Average Family Size in Grayling is 2.9 People.
What is the Average Household Size in Grayling
Average Household Size in Grayling is 2.1 People.
How Large is the Labor Force in Grayling?
There are 593 People in the Labor Forcein in Grayling.
What is the Percentage of People in the Labor Force in Grayling?
41.5% of People are in the Labor Force in Grayling.
What is the Unemployment Rate in Grayling?
Unemployment Rate in Grayling is 7.0%.