Potterville, MI Map & Demographics
Potterville Map
Potterville Overview
$26,463
PER CAPITA INCOME
$71,645
AVG FAMILY INCOME
$59,250
AVG HOUSEHOLD INCOME
22.6%
WAGE / INCOME GAP [ % ]
77.4¢/ $1
WAGE / INCOME GAP [ $ ]
0.39
INEQUALITY / GINI INDEX
3,036
TOTAL POPULATION
1,371
MALE POPULATION
1,665
FEMALE POPULATION
82.34
MALES / 100 FEMALES
121.44
FEMALES / 100 MALES
32.0
MEDIAN AGE
3.0
AVG FAMILY SIZE
2.5
AVG HOUSEHOLD SIZE
1,463
LABOR FORCE [ PEOPLE ]
65.8%
PERCENT IN LABOR FORCE
2.9%
UNEMPLOYMENT RATE
Potterville Zip Codes
Potterville Area Codes
Income in Potterville
Income Overview in Potterville
Per Capita Income in Potterville is $26,463, while median incomes of families and households are $71,645 and $59,250 respectively.
| Characteristic | Number | Measure |
| Per Capita Income | 3,036 | $26,463 |
| Median Family Income | 793 | $71,645 |
| Mean Family Income | 793 | $77,794 |
| Median Household Income | 1,220 | $59,250 |
| Mean Household Income | 1,220 | $65,984 |
| Income Deficit | 793 | $0 |
| Wage / Income Gap (%) | 3,036 | 22.63% |
| Wage / Income Gap ($) | 3,036 | 77.37¢ per $1 |
| Gini / Inequality Index | 3,036 | 0.39 |
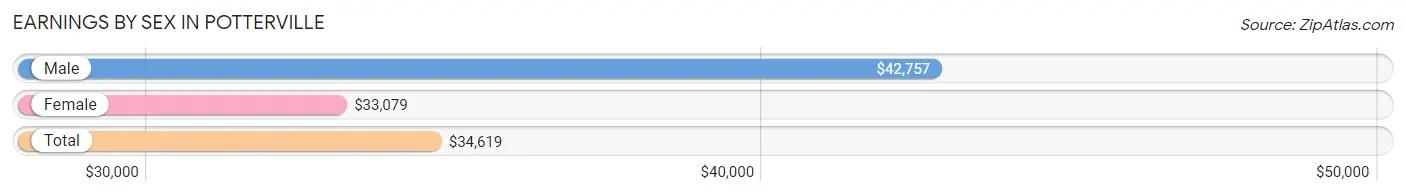
Earnings by Sex in Potterville
Average Earnings in Potterville are $34,619, $42,757 for men and $33,079 for women, a difference of 22.6%.
| Sex | Number | Average Earnings |
| Male | 683 (44.4%) | $42,757 |
| Female | 857 (55.6%) | $33,079 |
| Total | 1,540 (100.0%) | $34,619 |
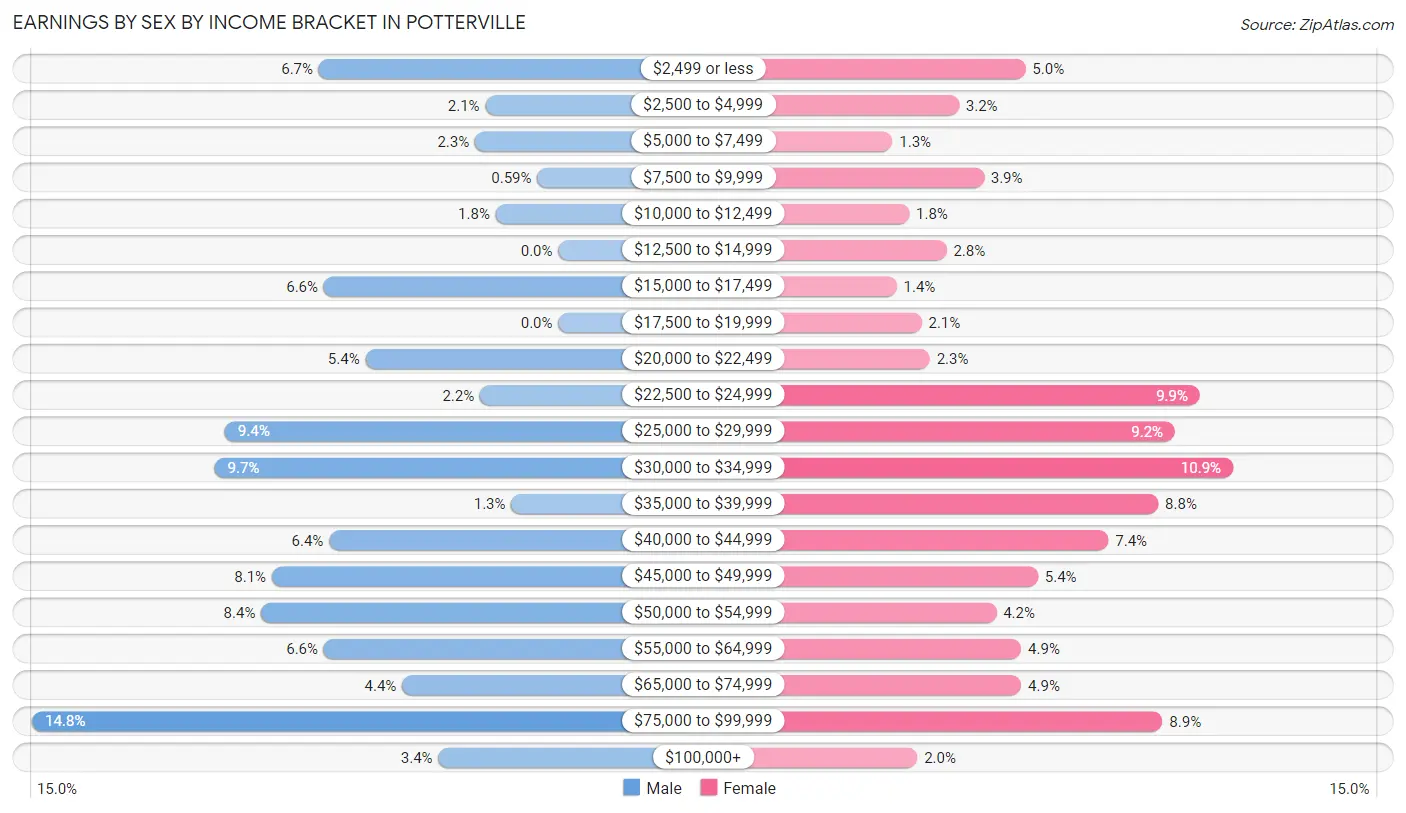
Earnings by Sex by Income Bracket in Potterville
The most common earnings brackets in Potterville are $75,000 to $99,999 for men (101 | 14.8%) and $30,000 to $34,999 for women (93 | 10.8%).
| Income | Male | Female |
| $2,499 or less | 46 (6.7%) | 43 (5.0%) |
| $2,500 to $4,999 | 14 (2.1%) | 27 (3.2%) |
| $5,000 to $7,499 | 16 (2.3%) | 11 (1.3%) |
| $7,500 to $9,999 | 4 (0.6%) | 33 (3.8%) |
| $10,000 to $12,499 | 12 (1.8%) | 15 (1.8%) |
| $12,500 to $14,999 | 0 (0.0%) | 24 (2.8%) |
| $15,000 to $17,499 | 45 (6.6%) | 12 (1.4%) |
| $17,500 to $19,999 | 0 (0.0%) | 18 (2.1%) |
| $20,000 to $22,499 | 37 (5.4%) | 20 (2.3%) |
| $22,500 to $24,999 | 15 (2.2%) | 85 (9.9%) |
| $25,000 to $29,999 | 64 (9.4%) | 79 (9.2%) |
| $30,000 to $34,999 | 66 (9.7%) | 93 (10.8%) |
| $35,000 to $39,999 | 9 (1.3%) | 75 (8.7%) |
| $40,000 to $44,999 | 44 (6.4%) | 63 (7.3%) |
| $45,000 to $49,999 | 55 (8.1%) | 46 (5.4%) |
| $50,000 to $54,999 | 57 (8.4%) | 36 (4.2%) |
| $55,000 to $64,999 | 45 (6.6%) | 42 (4.9%) |
| $65,000 to $74,999 | 30 (4.4%) | 42 (4.9%) |
| $75,000 to $99,999 | 101 (14.8%) | 76 (8.9%) |
| $100,000+ | 23 (3.4%) | 17 (2.0%) |
| Total | 683 (100.0%) | 857 (100.0%) |
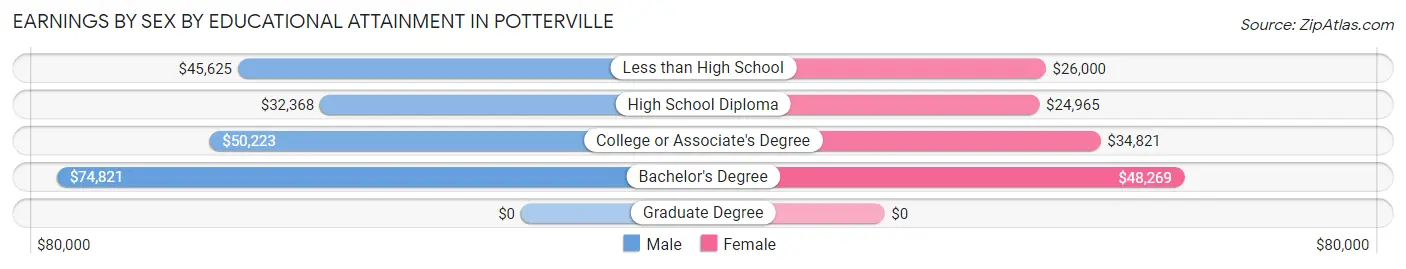
Earnings by Sex by Educational Attainment in Potterville
Average earnings in Potterville are $46,667 for men and $35,164 for women, a difference of 24.6%. Men with an educational attainment of bachelor's degree enjoy the highest average annual earnings of $74,821, while those with high school diploma education earn the least with $32,368. Women with an educational attainment of bachelor's degree earn the most with the average annual earnings of $48,269, while those with high school diploma education have the smallest earnings of $24,965.
| Educational Attainment | Male Income | Female Income |
| Less than High School | $45,625 | $26,000 |
| High School Diploma | $32,368 | $24,965 |
| College or Associate's Degree | $50,223 | $34,821 |
| Bachelor's Degree | $74,821 | $48,269 |
| Graduate Degree | - | - |
| Total | $46,667 | $35,164 |
Family Income in Potterville
Family Income Brackets in Potterville
According to the Potterville family income data, there are 201 families falling into the $75,000 to $99,999 income range, which is the most common income bracket and makes up 25.4% of all families. Conversely, the $10,000 to $14,999 income bracket is the least frequent group with only 10 families (1.3%) belonging to this category.
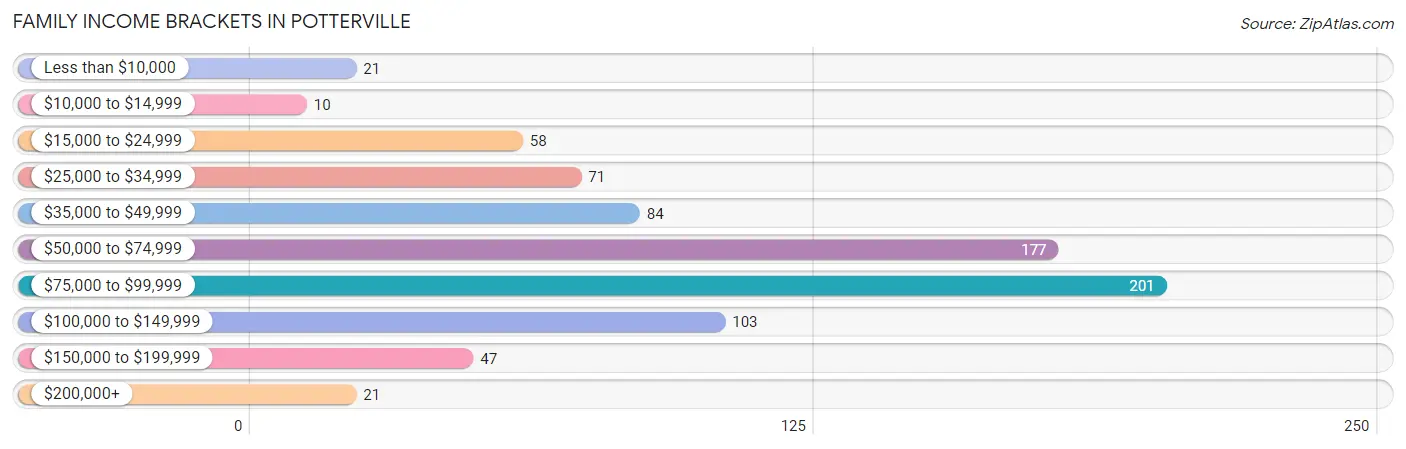
| Income Bracket | # Families | % Families |
| Less than $10,000 | 21 | 2.6% |
| $10,000 to $14,999 | 10 | 1.3% |
| $15,000 to $24,999 | 58 | 7.3% |
| $25,000 to $34,999 | 71 | 9.0% |
| $35,000 to $49,999 | 84 | 10.6% |
| $50,000 to $74,999 | 177 | 22.3% |
| $75,000 to $99,999 | 201 | 25.3% |
| $100,000 to $149,999 | 103 | 13.0% |
| $150,000 to $199,999 | 47 | 5.9% |
| $200,000+ | 21 | 2.6% |
Family Income by Famaliy Size in Potterville
4-person families (103 | 13.0%) account for the highest median family income in Potterville with $91,528 per family, while 2-person families (377 | 47.5%) have the highest median income of $34,952 per family member.
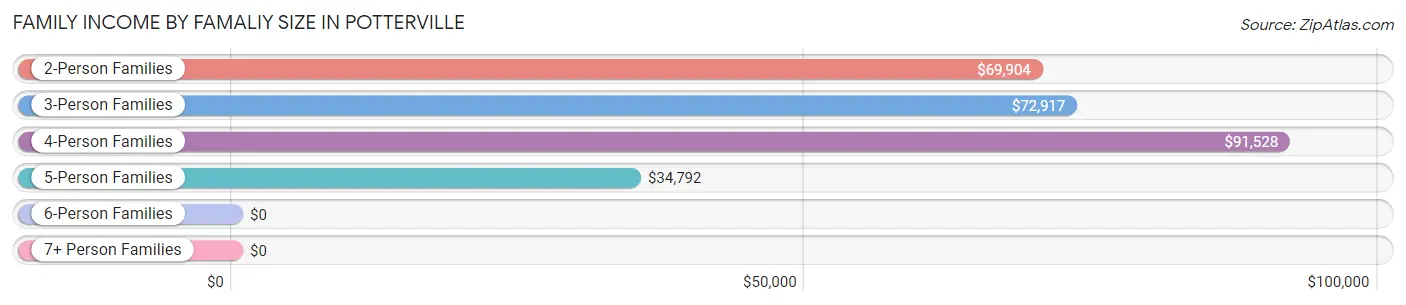
| Income Bracket | # Families | Median Income |
| 2-Person Families | 377 (47.5%) | $69,904 |
| 3-Person Families | 222 (28.0%) | $72,917 |
| 4-Person Families | 103 (13.0%) | $91,528 |
| 5-Person Families | 65 (8.2%) | $34,792 |
| 6-Person Families | 26 (3.3%) | $0 |
| 7+ Person Families | 0 (0.0%) | $0 |
| Total | 793 (100.0%) | $71,645 |
Family Income by Number of Earners in Potterville
The median family income in Potterville is $71,645, with families comprising 3+ earners (60) having the highest median family income of $150,109, while families with no earners (144) have the lowest median family income of $36,786, accounting for 7.6% and 18.2% of families, respectively.
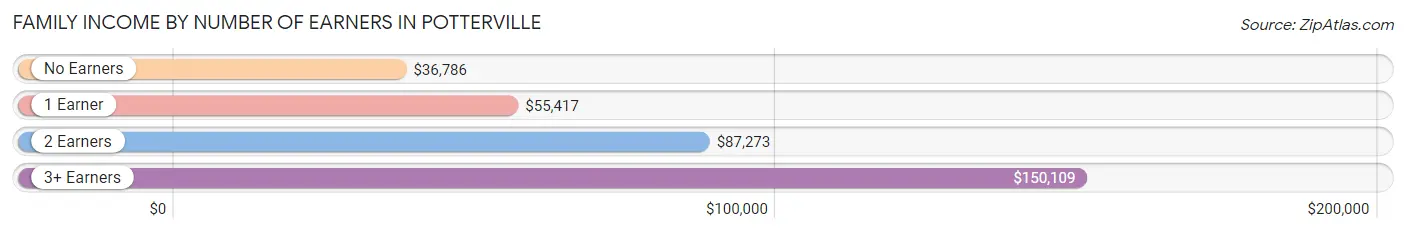
| Number of Earners | # Families | Median Income |
| No Earners | 144 (18.2%) | $36,786 |
| 1 Earner | 297 (37.4%) | $55,417 |
| 2 Earners | 292 (36.8%) | $87,273 |
| 3+ Earners | 60 (7.6%) | $150,109 |
| Total | 793 (100.0%) | $71,645 |
Household Income in Potterville
Household Income Brackets in Potterville
With 251 households falling in the category, the $50,000 to $74,999 income range is the most frequent in Potterville, accounting for 20.6% of all households. In contrast, only 27 households (2.2%) fall into the $200,000+ income bracket, making it the least populous group.
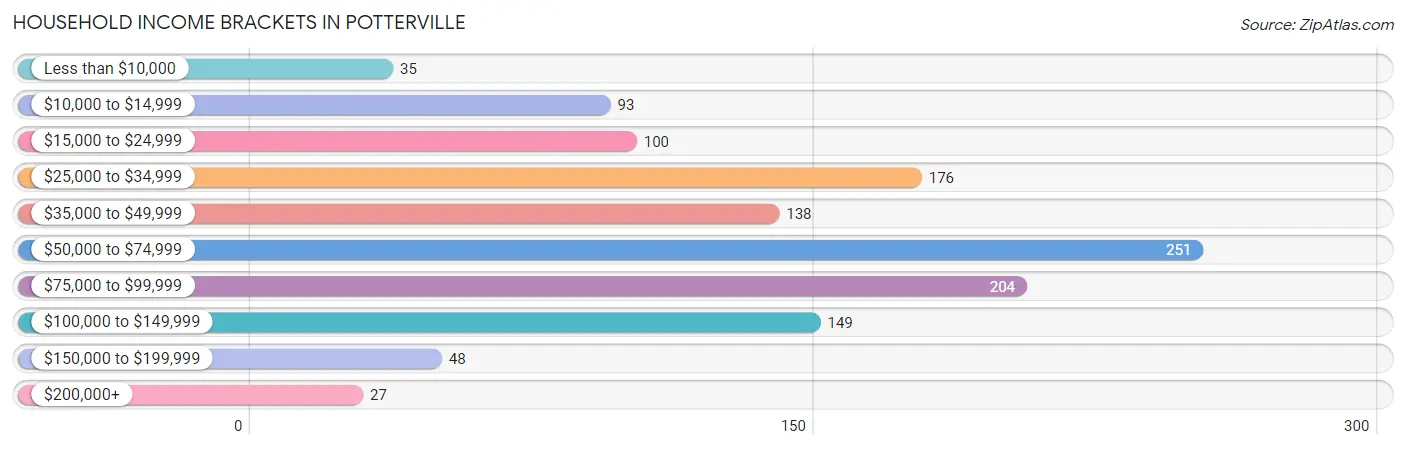
| Income Bracket | # Households | % Households |
| Less than $10,000 | 35 | 2.9% |
| $10,000 to $14,999 | 93 | 7.6% |
| $15,000 to $24,999 | 100 | 8.2% |
| $25,000 to $34,999 | 176 | 14.4% |
| $35,000 to $49,999 | 138 | 11.3% |
| $50,000 to $74,999 | 251 | 20.6% |
| $75,000 to $99,999 | 204 | 16.7% |
| $100,000 to $149,999 | 149 | 12.2% |
| $150,000 to $199,999 | 48 | 3.9% |
| $200,000+ | 27 | 2.2% |
Household Income by Householder Age in Potterville
The median household income in Potterville is $59,250, with the highest median household income of $66,250 found in the 45 to 64 years age bracket for the primary householder. A total of 487 households (39.9%) fall into this category. Meanwhile, the 15 to 24 years age bracket for the primary householder has the lowest median household income of $43,750, with 76 households (6.2%) in this group.
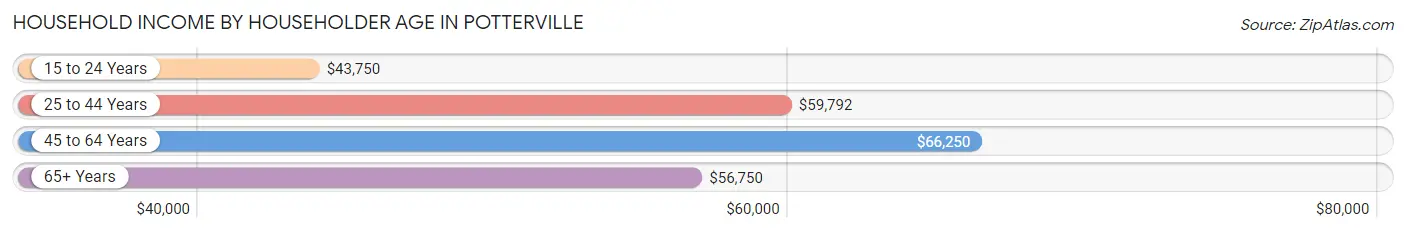
| Income Bracket | # Households | Median Income |
| 15 to 24 Years | 76 (6.2%) | $43,750 |
| 25 to 44 Years | 502 (41.1%) | $59,792 |
| 45 to 64 Years | 487 (39.9%) | $66,250 |
| 65+ Years | 155 (12.7%) | $56,750 |
| Total | 1,220 (100.0%) | $59,250 |
Poverty in Potterville
Income Below Poverty by Sex and Age in Potterville
With 11.3% poverty level for males and 17.6% for females among the residents of Potterville, under 5 year old males and 18 to 24 year old females are the most vulnerable to poverty, with 53 males (42.1%) and 42 females (31.6%) in their respective age groups living below the poverty level.
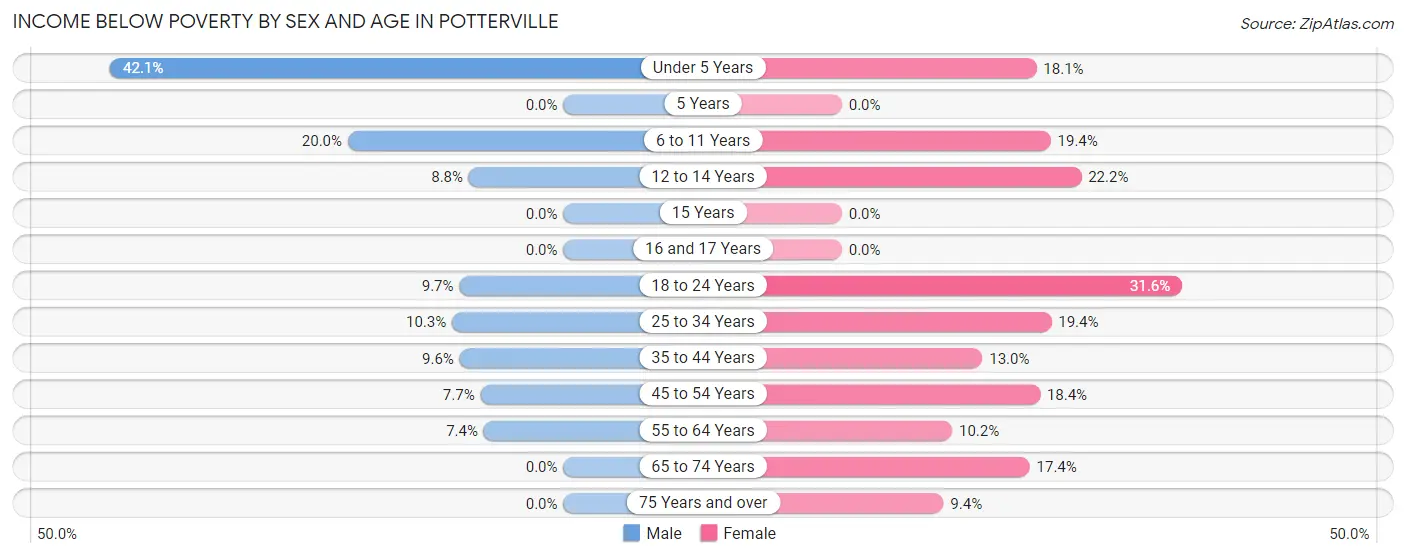
| Age Bracket | Male | Female |
| Under 5 Years | 53 (42.1%) | 41 (18.1%) |
| 5 Years | 0 (0.0%) | 0 (0.0%) |
| 6 to 11 Years | 23 (20.0%) | 25 (19.4%) |
| 12 to 14 Years | 5 (8.8%) | 6 (22.2%) |
| 15 Years | 0 (0.0%) | 0 (0.0%) |
| 16 and 17 Years | 0 (0.0%) | 0 (0.0%) |
| 18 to 24 Years | 11 (9.7%) | 42 (31.6%) |
| 25 to 34 Years | 25 (10.3%) | 62 (19.4%) |
| 35 to 44 Years | 15 (9.6%) | 18 (13.0%) |
| 45 to 54 Years | 13 (7.7%) | 55 (18.4%) |
| 55 to 64 Years | 9 (7.4%) | 18 (10.2%) |
| 65 to 74 Years | 0 (0.0%) | 19 (17.4%) |
| 75 Years and over | 0 (0.0%) | 5 (9.4%) |
| Total | 154 (11.3%) | 291 (17.6%) |
Income Above Poverty by Sex and Age in Potterville
According to the poverty statistics in Potterville, males aged 5 years and females aged 15 years are the age groups that are most secure financially, with 100.0% of males and 100.0% of females in these age groups living above the poverty line.
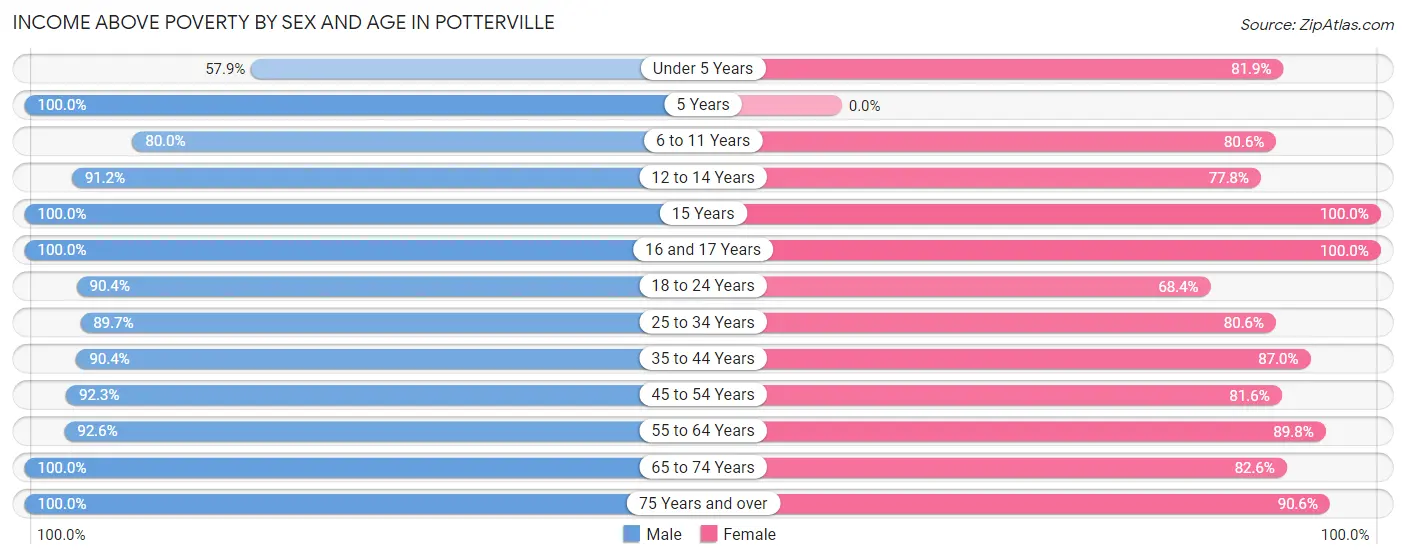
| Age Bracket | Male | Female |
| Under 5 Years | 73 (57.9%) | 186 (81.9%) |
| 5 Years | 84 (100.0%) | 0 (0.0%) |
| 6 to 11 Years | 92 (80.0%) | 104 (80.6%) |
| 12 to 14 Years | 52 (91.2%) | 21 (77.8%) |
| 15 Years | 17 (100.0%) | 14 (100.0%) |
| 16 and 17 Years | 27 (100.0%) | 32 (100.0%) |
| 18 to 24 Years | 103 (90.3%) | 91 (68.4%) |
| 25 to 34 Years | 217 (89.7%) | 257 (80.6%) |
| 35 to 44 Years | 141 (90.4%) | 120 (87.0%) |
| 45 to 54 Years | 156 (92.3%) | 244 (81.6%) |
| 55 to 64 Years | 113 (92.6%) | 158 (89.8%) |
| 65 to 74 Years | 100 (100.0%) | 90 (82.6%) |
| 75 Years and over | 34 (100.0%) | 48 (90.6%) |
| Total | 1,209 (88.7%) | 1,365 (82.4%) |
Income Below Poverty Among Married-Couple Families in Potterville
The poverty statistics for married-couple families in Potterville show that 2.6% or 12 of the total 454 families live below the poverty line. Families with 3 or 4 children have the highest poverty rate of 33.3%, comprising of 8 families. On the other hand, families with no children have the lowest poverty rate of 0.0%, which includes 0 families.
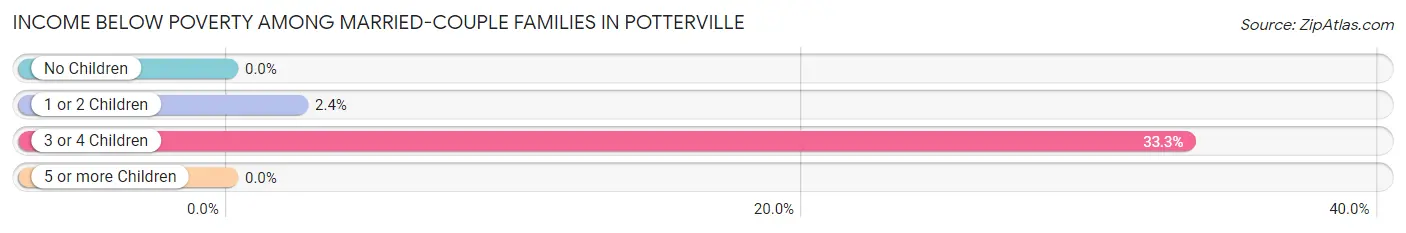
| Children | Above Poverty | Below Poverty |
| No Children | 266 (100.0%) | 0 (0.0%) |
| 1 or 2 Children | 160 (97.6%) | 4 (2.4%) |
| 3 or 4 Children | 16 (66.7%) | 8 (33.3%) |
| 5 or more Children | 0 (0.0%) | 0 (0.0%) |
| Total | 442 (97.4%) | 12 (2.6%) |
Income Below Poverty Among Single-Parent Households in Potterville
According to the poverty data in Potterville, 13.3% or 15 single-father households and 24.8% or 56 single-mother households are living below the poverty line. Among single-father households, those with no children have the highest poverty rate, with 15 households (28.8%) experiencing poverty. Likewise, among single-mother households, those with 3 or 4 children have the highest poverty rate, with 31 households (57.4%) falling below the poverty line.
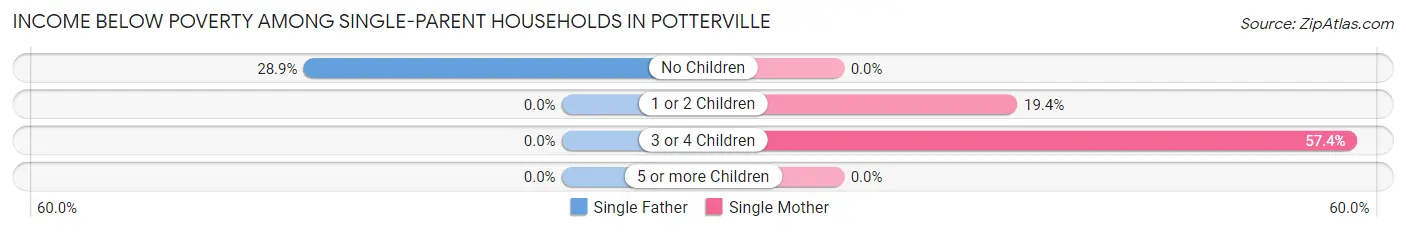
| Children | Single Father | Single Mother |
| No Children | 15 (28.8%) | 0 (0.0%) |
| 1 or 2 Children | 0 (0.0%) | 25 (19.4%) |
| 3 or 4 Children | 0 (0.0%) | 31 (57.4%) |
| 5 or more Children | 0 (0.0%) | 0 (0.0%) |
| Total | 15 (13.3%) | 56 (24.8%) |
Income Below Poverty Among Married-Couple vs Single-Parent Households in Potterville
The poverty data for Potterville shows that 12 of the married-couple family households (2.6%) and 71 of the single-parent households (20.9%) are living below the poverty level. Within the married-couple family households, those with 3 or 4 children have the highest poverty rate, with 8 households (33.3%) falling below the poverty line. Among the single-parent households, those with 3 or 4 children have the highest poverty rate, with 31 household (47.7%) living below poverty.
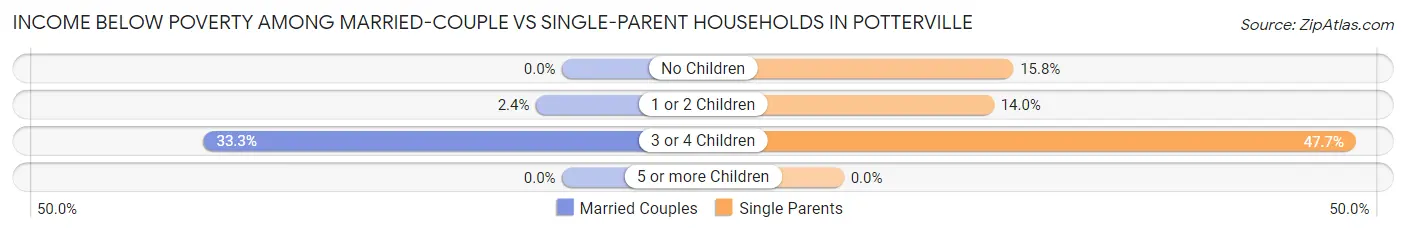
| Children | Married-Couple Families | Single-Parent Households |
| No Children | 0 (0.0%) | 15 (15.8%) |
| 1 or 2 Children | 4 (2.4%) | 25 (14.0%) |
| 3 or 4 Children | 8 (33.3%) | 31 (47.7%) |
| 5 or more Children | 0 (0.0%) | 0 (0.0%) |
| Total | 12 (2.6%) | 71 (20.9%) |
Race in Potterville
The most populous races in Potterville are White / Caucasian (2,785 | 91.7%), Hispanic or Latino (330 | 10.9%), and Two or more Races (140 | 4.6%).
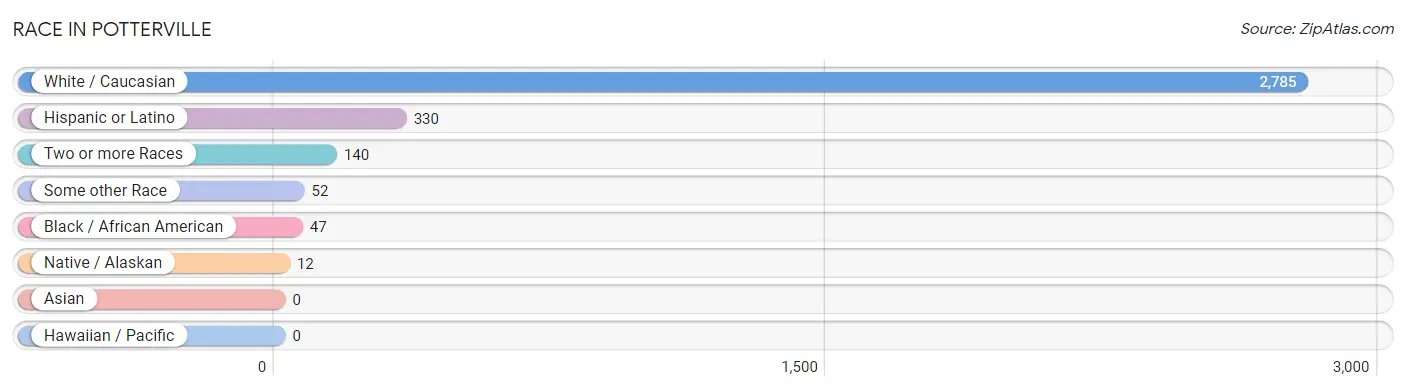
| Race | # Population | % Population |
| Asian | 0 | 0.0% |
| Black / African American | 47 | 1.5% |
| Hawaiian / Pacific | 0 | 0.0% |
| Hispanic or Latino | 330 | 10.9% |
| Native / Alaskan | 12 | 0.4% |
| White / Caucasian | 2,785 | 91.7% |
| Two or more Races | 140 | 4.6% |
| Some other Race | 52 | 1.7% |
| Total | 3,036 | 100.0% |
Ancestry in Potterville
The most populous ancestries reported in Potterville are German (822 | 27.1%), Irish (801 | 26.4%), English (323 | 10.6%), Mexican (292 | 9.6%), and Polish (121 | 4.0%), together accounting for 77.7% of all Potterville residents.
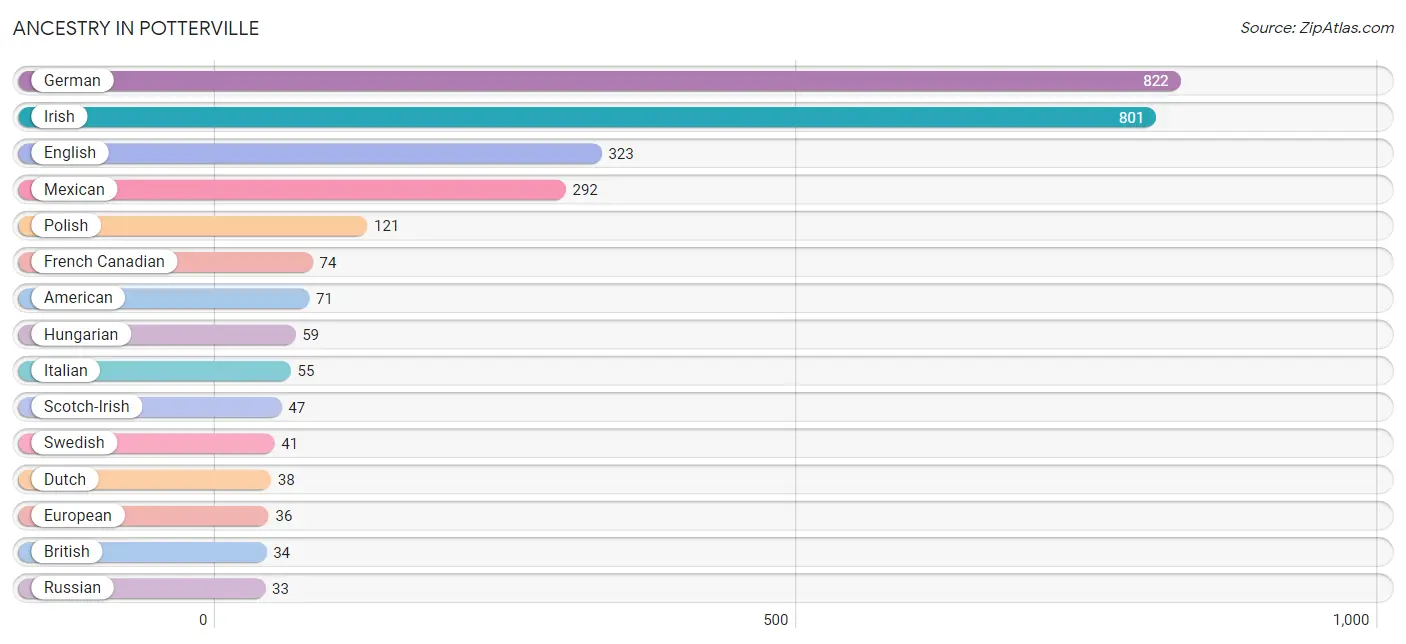
| Ancestry | # Population | % Population |
| American | 71 | 2.3% |
| Arab | 6 | 0.2% |
| Argentinean | 12 | 0.4% |
| Armenian | 24 | 0.8% |
| British | 34 | 1.1% |
| Canadian | 12 | 0.4% |
| Cherokee | 2 | 0.1% |
| Czech | 23 | 0.8% |
| Dutch | 38 | 1.3% |
| English | 323 | 10.6% |
| European | 36 | 1.2% |
| French | 29 | 1.0% |
| French Canadian | 74 | 2.4% |
| German | 822 | 27.1% |
| Hungarian | 59 | 1.9% |
| Irish | 801 | 26.4% |
| Italian | 55 | 1.8% |
| Lebanese | 6 | 0.2% |
| Mexican | 292 | 9.6% |
| Northern European | 7 | 0.2% |
| Norwegian | 31 | 1.0% |
| Ottawa | 9 | 0.3% |
| Polish | 121 | 4.0% |
| Russian | 33 | 1.1% |
| Scandinavian | 28 | 0.9% |
| Scotch-Irish | 47 | 1.5% |
| Scottish | 29 | 1.0% |
| South American | 12 | 0.4% |
| Swedish | 41 | 1.3% |
| Welsh | 17 | 0.6% | View All 30 Rows |
Immigrants in Potterville
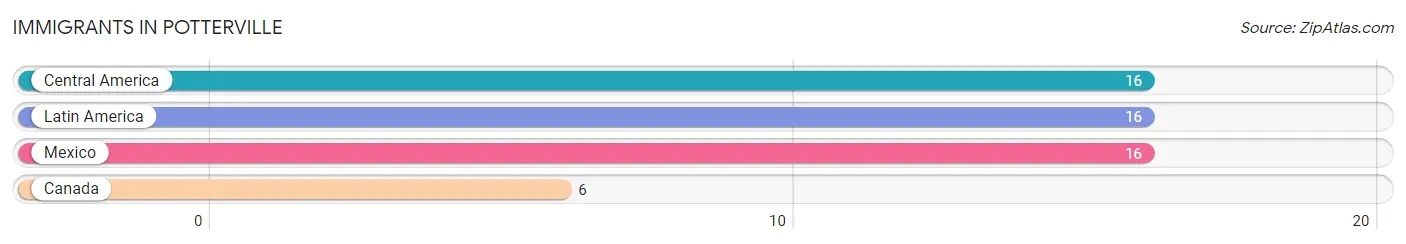
The most numerous immigrant groups reported in Potterville came from Central America (16 | 0.5%), Latin America (16 | 0.5%), Mexico (16 | 0.5%), and Canada (6 | 0.2%), together accounting for 1.8% of all Potterville residents.
| Immigration Origin | # Population | % Population |
| Canada | 6 | 0.2% |
| Central America | 16 | 0.5% |
| Latin America | 16 | 0.5% |
| Mexico | 16 | 0.5% | View All 4 Rows |
Sex and Age in Potterville
Sex and Age in Potterville
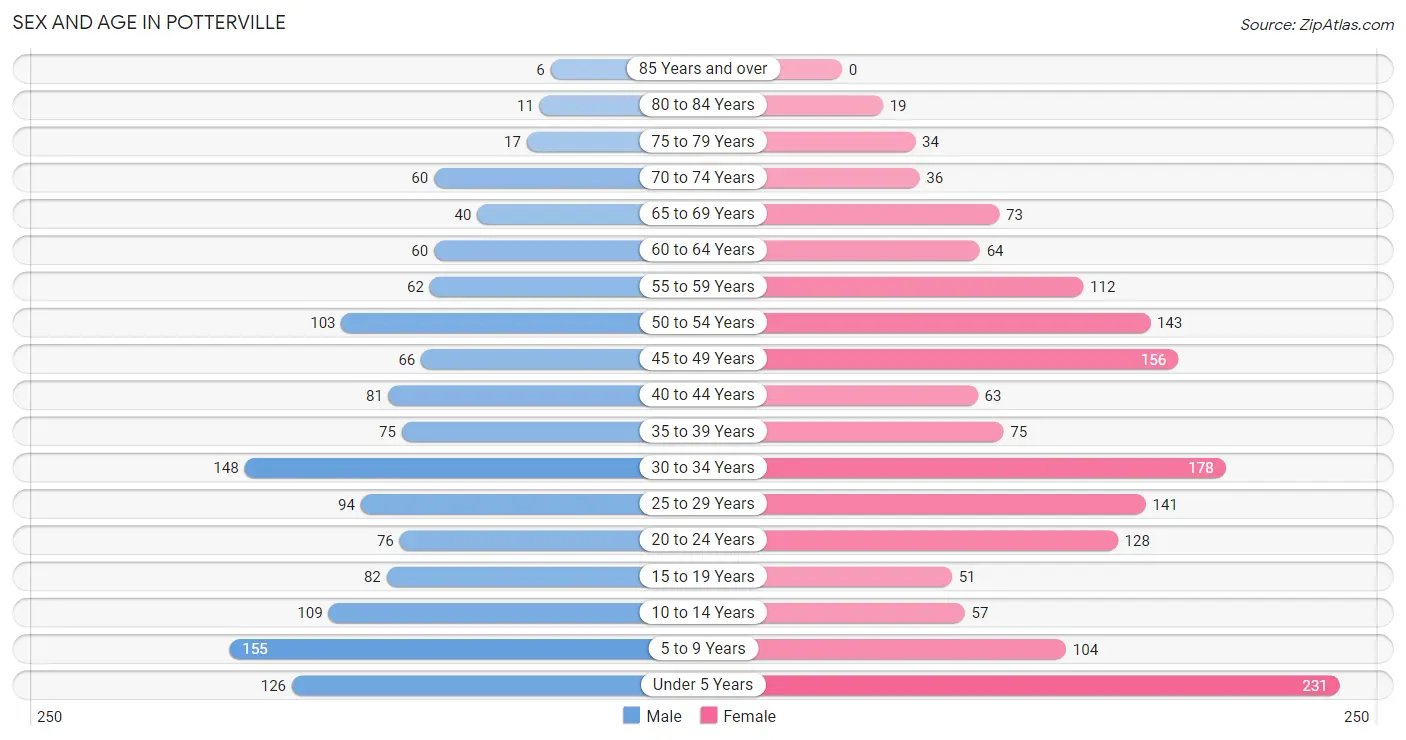
The most populous age groups in Potterville are 5 to 9 Years (155 | 11.3%) for men and Under 5 Years (231 | 13.9%) for women.
| Age Bracket | Male | Female |
| Under 5 Years | 126 (9.2%) | 231 (13.9%) |
| 5 to 9 Years | 155 (11.3%) | 104 (6.2%) |
| 10 to 14 Years | 109 (8.0%) | 57 (3.4%) |
| 15 to 19 Years | 82 (6.0%) | 51 (3.1%) |
| 20 to 24 Years | 76 (5.5%) | 128 (7.7%) |
| 25 to 29 Years | 94 (6.9%) | 141 (8.5%) |
| 30 to 34 Years | 148 (10.8%) | 178 (10.7%) |
| 35 to 39 Years | 75 (5.5%) | 75 (4.5%) |
| 40 to 44 Years | 81 (5.9%) | 63 (3.8%) |
| 45 to 49 Years | 66 (4.8%) | 156 (9.4%) |
| 50 to 54 Years | 103 (7.5%) | 143 (8.6%) |
| 55 to 59 Years | 62 (4.5%) | 112 (6.7%) |
| 60 to 64 Years | 60 (4.4%) | 64 (3.8%) |
| 65 to 69 Years | 40 (2.9%) | 73 (4.4%) |
| 70 to 74 Years | 60 (4.4%) | 36 (2.2%) |
| 75 to 79 Years | 17 (1.2%) | 34 (2.0%) |
| 80 to 84 Years | 11 (0.8%) | 19 (1.1%) |
| 85 Years and over | 6 (0.4%) | 0 (0.0%) |
| Total | 1,371 (100.0%) | 1,665 (100.0%) |
Families and Households in Potterville
Median Family Size in Potterville
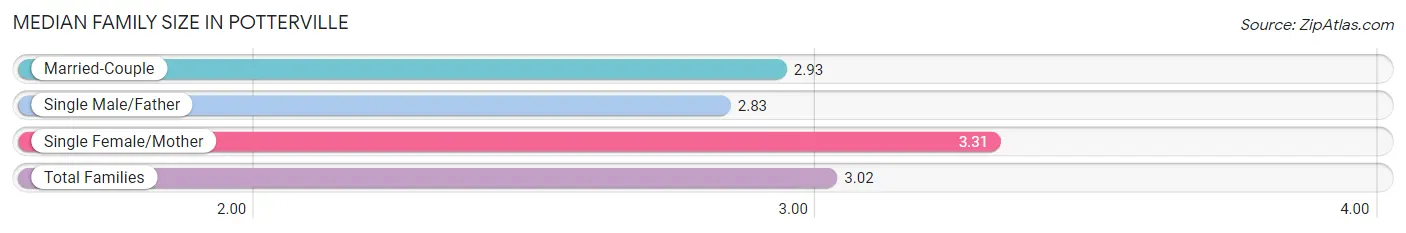
The median family size in Potterville is 3.02 persons per family, with single female/mother families (226 | 28.5%) accounting for the largest median family size of 3.31 persons per family. On the other hand, single male/father families (113 | 14.2%) represent the smallest median family size with 2.83 persons per family.
| Family Type | # Families | Family Size |
| Married-Couple | 454 (57.3%) | 2.93 |
| Single Male/Father | 113 (14.2%) | 2.83 |
| Single Female/Mother | 226 (28.5%) | 3.31 |
| Total Families | 793 (100.0%) | 3.02 |
Median Household Size in Potterville
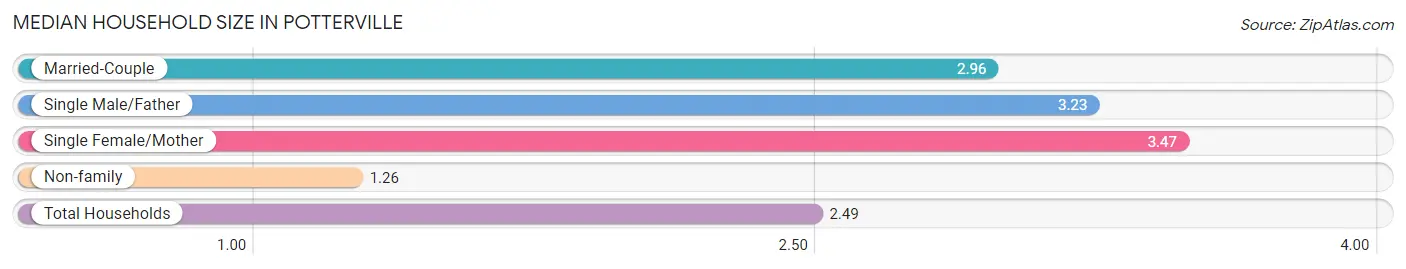
The median household size in Potterville is 2.49 persons per household, with single female/mother households (226 | 18.5%) accounting for the largest median household size of 3.47 persons per household. non-family households (427 | 35.0%) represent the smallest median household size with 1.26 persons per household.
| Household Type | # Households | Household Size |
| Married-Couple | 454 (37.2%) | 2.96 |
| Single Male/Father | 113 (9.3%) | 3.23 |
| Single Female/Mother | 226 (18.5%) | 3.47 |
| Non-family | 427 (35.0%) | 1.26 |
| Total Households | 1,220 (100.0%) | 2.49 |
Household Size by Marriage Status in Potterville
Out of a total of 1,220 households in Potterville, 793 (65.0%) are family households, while 427 (35.0%) are nonfamily households. The most numerous type of family households are 2-person households, comprising 323, and the most common type of nonfamily households are 1-person households, comprising 341.
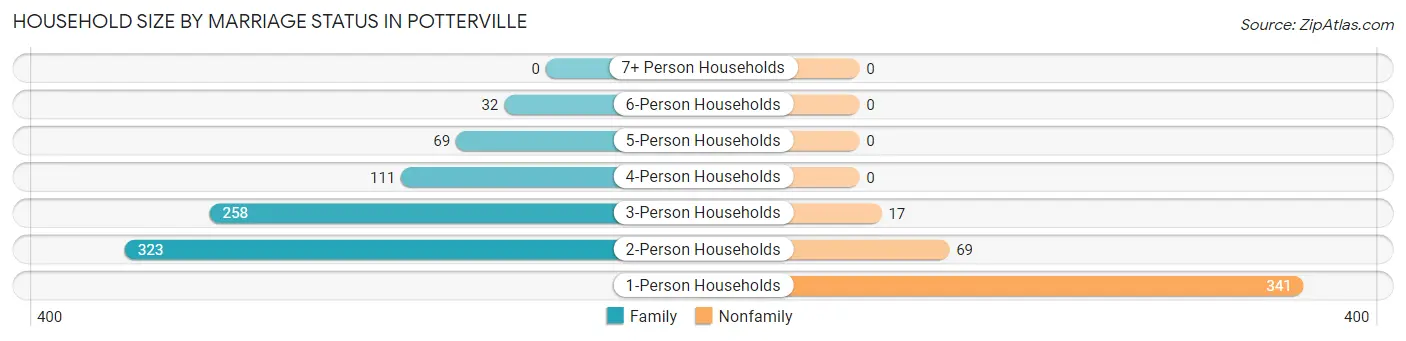
| Household Size | Family Households | Nonfamily Households |
| 1-Person Households | - | 341 (28.0%) |
| 2-Person Households | 323 (26.5%) | 69 (5.7%) |
| 3-Person Households | 258 (21.1%) | 17 (1.4%) |
| 4-Person Households | 111 (9.1%) | 0 (0.0%) |
| 5-Person Households | 69 (5.7%) | 0 (0.0%) |
| 6-Person Households | 32 (2.6%) | 0 (0.0%) |
| 7+ Person Households | 0 (0.0%) | 0 (0.0%) |
| Total | 793 (65.0%) | 427 (35.0%) |
Female Fertility in Potterville
Fertility by Age in Potterville
Average fertility rate in Potterville is 97.0 births per 1,000 women. Women in the age bracket of 20 to 34 years have the highest fertility rate with 152.0 births per 1,000 women. Women in the age bracket of 20 to 34 years acount for 85.0% of all women with births.
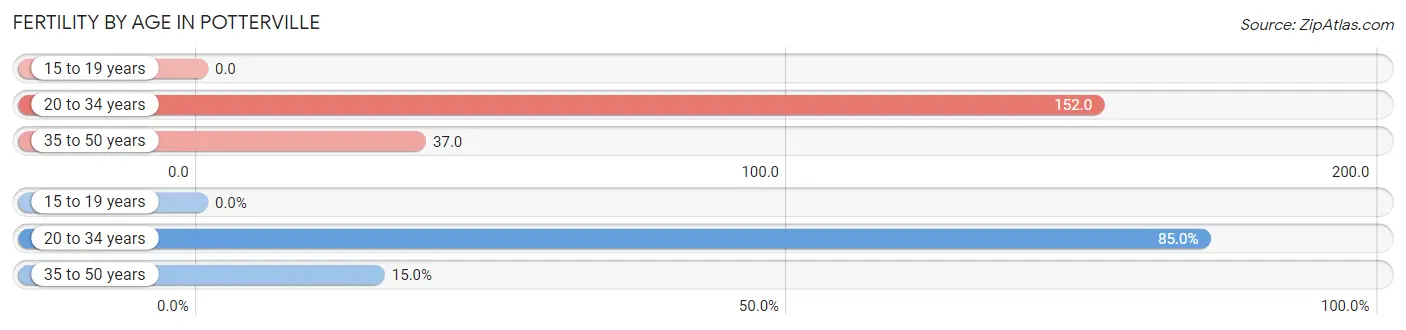
| Age Bracket | Women with Births | Births / 1,000 Women |
| 15 to 19 years | 0 (0.0%) | 0.0 |
| 20 to 34 years | 68 (85.0%) | 152.0 |
| 35 to 50 years | 12 (15.0%) | 37.0 |
| Total | 80 (100.0%) | 97.0 |
Fertility by Age by Marriage Status in Potterville
56.2% of women with births (80) in Potterville are married. The highest percentage of unmarried women with births falls into 35 to 50 years age bracket with 50.0% of them unmarried at the time of birth, while the lowest percentage of unmarried women with births belong to 20 to 34 years age bracket with 42.6% of them unmarried.
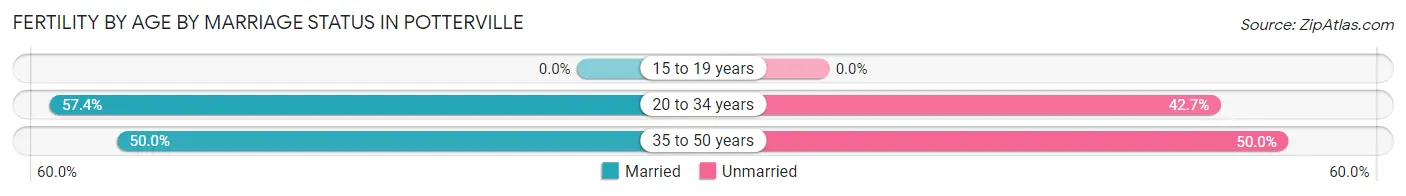
| Age Bracket | Married | Unmarried |
| 15 to 19 years | 0 (0.0%) | 0 (0.0%) |
| 20 to 34 years | 39 (57.4%) | 29 (42.6%) |
| 35 to 50 years | 6 (50.0%) | 6 (50.0%) |
| Total | 45 (56.2%) | 35 (43.8%) |
Fertility by Education in Potterville
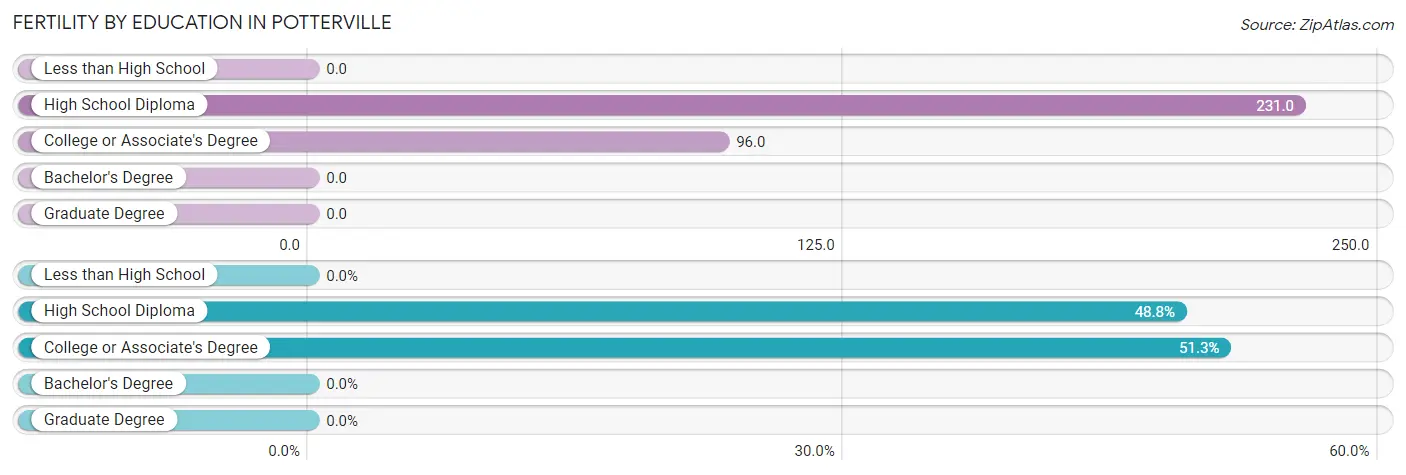
| Educational Attainment | Women with Births | Births / 1,000 Women |
| Less than High School | 0 (0.0%) | 0.0 |
| High School Diploma | 39 (48.7%) | 231.0 |
| College or Associate's Degree | 41 (51.2%) | 96.0 |
| Bachelor's Degree | 0 (0.0%) | 0.0 |
| Graduate Degree | 0 (0.0%) | 0.0 |
| Total | 80 (100.0%) | 97.0 |
Fertility by Education by Marriage Status in Potterville
43.8% of women with births in Potterville are unmarried. Women with the educational attainment of college or associate's degree are most likely to be married with 85.4% of them married at childbirth, while women with the educational attainment of high school diploma are least likely to be married with 74.4% of them unmarried at childbirth.
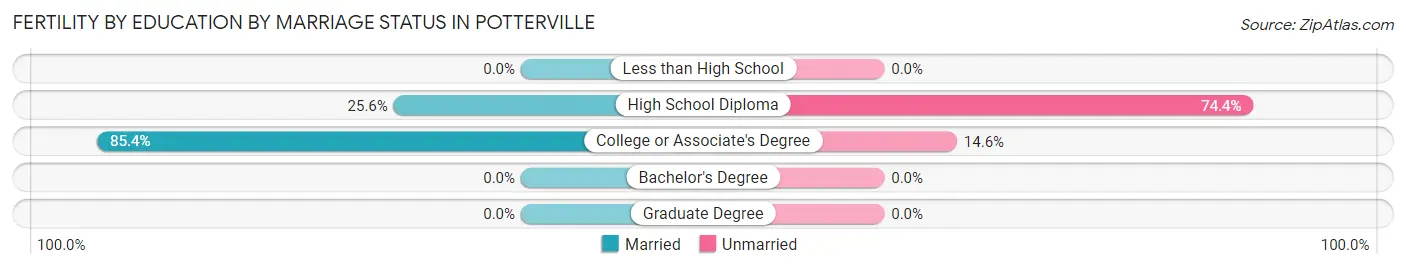
| Educational Attainment | Married | Unmarried |
| Less than High School | 0 (0.0%) | 0 (0.0%) |
| High School Diploma | 10 (25.6%) | 29 (74.4%) |
| College or Associate's Degree | 35 (85.4%) | 6 (14.6%) |
| Bachelor's Degree | 0 (0.0%) | 0 (0.0%) |
| Graduate Degree | 0 (0.0%) | 0 (0.0%) |
| Total | 45 (56.2%) | 35 (43.8%) |
Employment Characteristics in Potterville
Employment by Class of Employer in Potterville
Among the 1,396 employed individuals in Potterville, private company employees (1,053 | 75.4%), not-for-profit organizations (113 | 8.1%), and state government employees (75 | 5.4%) make up the most common classes of employment.
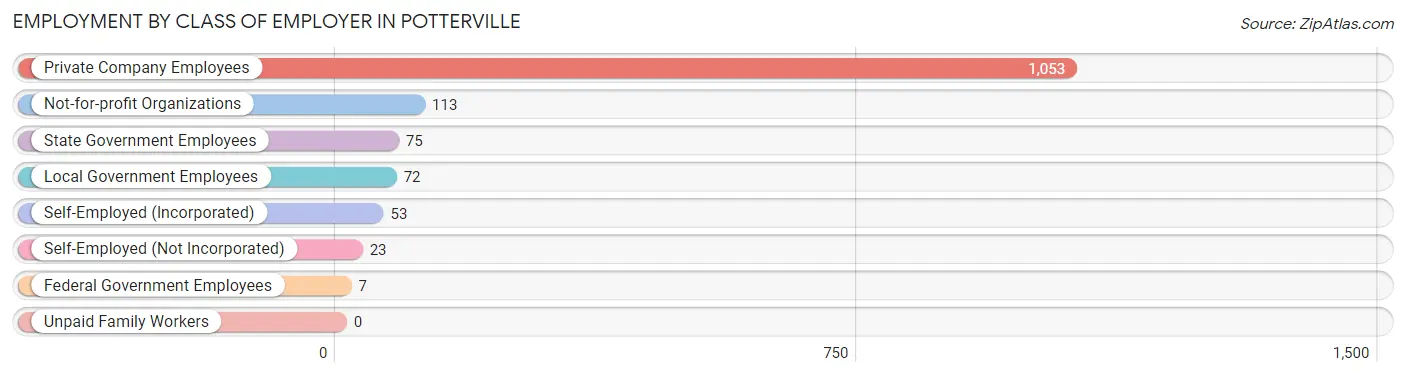
| Employer Class | # Employees | % Employees |
| Private Company Employees | 1,053 | 75.4% |
| Self-Employed (Incorporated) | 53 | 3.8% |
| Self-Employed (Not Incorporated) | 23 | 1.7% |
| Not-for-profit Organizations | 113 | 8.1% |
| Local Government Employees | 72 | 5.2% |
| State Government Employees | 75 | 5.4% |
| Federal Government Employees | 7 | 0.5% |
| Unpaid Family Workers | 0 | 0.0% |
| Total | 1,396 | 100.0% |
Employment Status by Age in Potterville
According to the labor force statistics for Potterville, out of the total population over 16 years of age (2,223), 65.8% or 1,463 individuals are in the labor force, with 2.9% or 42 of them unemployed. The age group with the highest labor force participation rate is 25 to 29 years, with 93.6% or 220 individuals in the labor force. Within the labor force, the 30 to 34 years age range has the highest percentage of unemployed individuals, with 9.6% or 27 of them being unemployed.
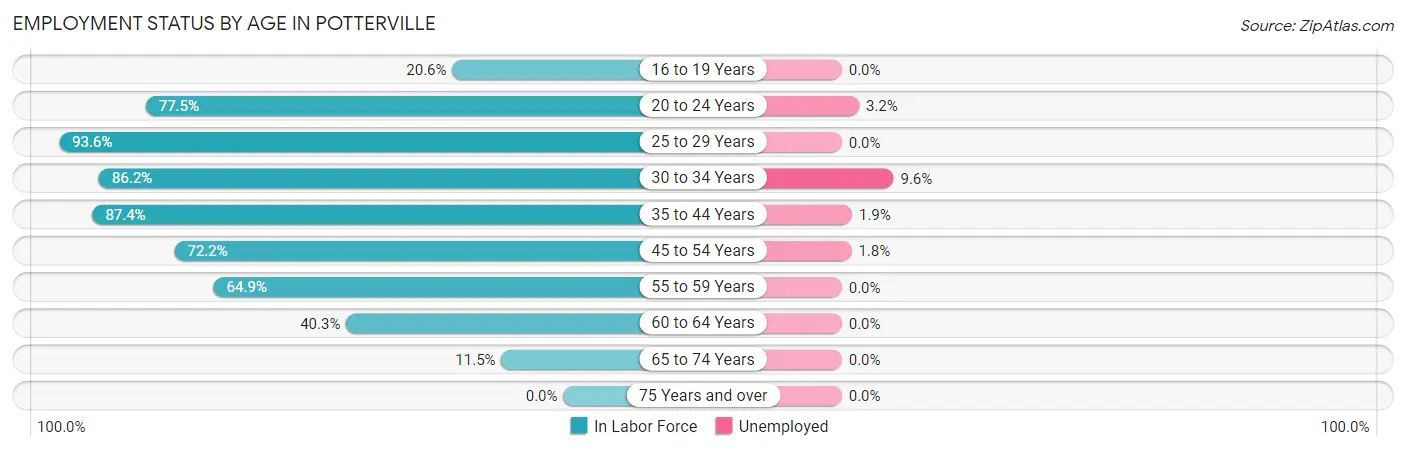
| Age Bracket | In Labor Force | Unemployed |
| 16 to 19 Years | 21 (20.6%) | 0 (0.0%) |
| 20 to 24 Years | 158 (77.5%) | 5 (3.2%) |
| 25 to 29 Years | 220 (93.6%) | 0 (0.0%) |
| 30 to 34 Years | 281 (86.2%) | 27 (9.6%) |
| 35 to 44 Years | 257 (87.4%) | 5 (1.9%) |
| 45 to 54 Years | 338 (72.2%) | 6 (1.8%) |
| 55 to 59 Years | 113 (64.9%) | 0 (0.0%) |
| 60 to 64 Years | 50 (40.3%) | 0 (0.0%) |
| 65 to 74 Years | 24 (11.5%) | 0 (0.0%) |
| 75 Years and over | 0 (0.0%) | 0 (0.0%) |
| Total | 1,463 (65.8%) | 42 (2.9%) |
Employment Status by Educational Attainment in Potterville
According to labor force statistics for Potterville, 77.7% of individuals (1,260) out of the total population between 25 and 64 years of age (1,621) are in the labor force, with 3.0% or 38 of them being unemployed. The group with the highest labor force participation rate are those with the educational attainment of less than high school, with 86.8% or 33 individuals in the labor force. Within the labor force, individuals with high school diploma education have the highest percentage of unemployment, with 6.3% or 21 of them being unemployed.
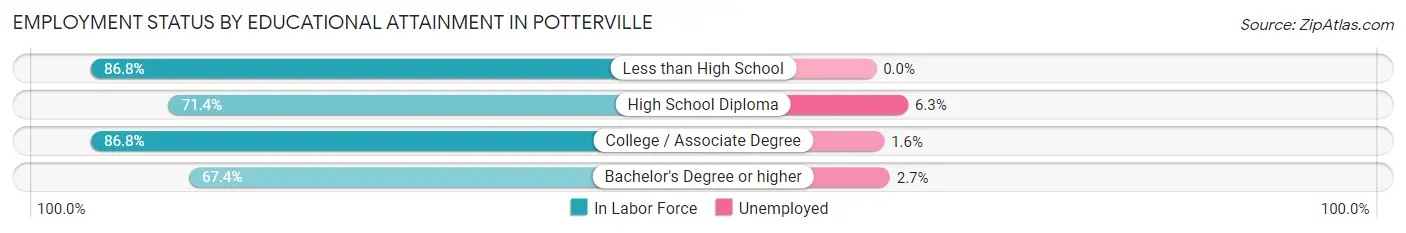
| Educational Attainment | In Labor Force | Unemployed |
| Less than High School | 33 (86.8%) | 0 (0.0%) |
| High School Diploma | 334 (71.4%) | 29 (6.3%) |
| College / Associate Degree | 630 (86.8%) | 12 (1.6%) |
| Bachelor's Degree or higher | 262 (67.4%) | 11 (2.7%) |
| Total | 1,260 (77.7%) | 49 (3.0%) |
Employment Occupations by Sex in Potterville
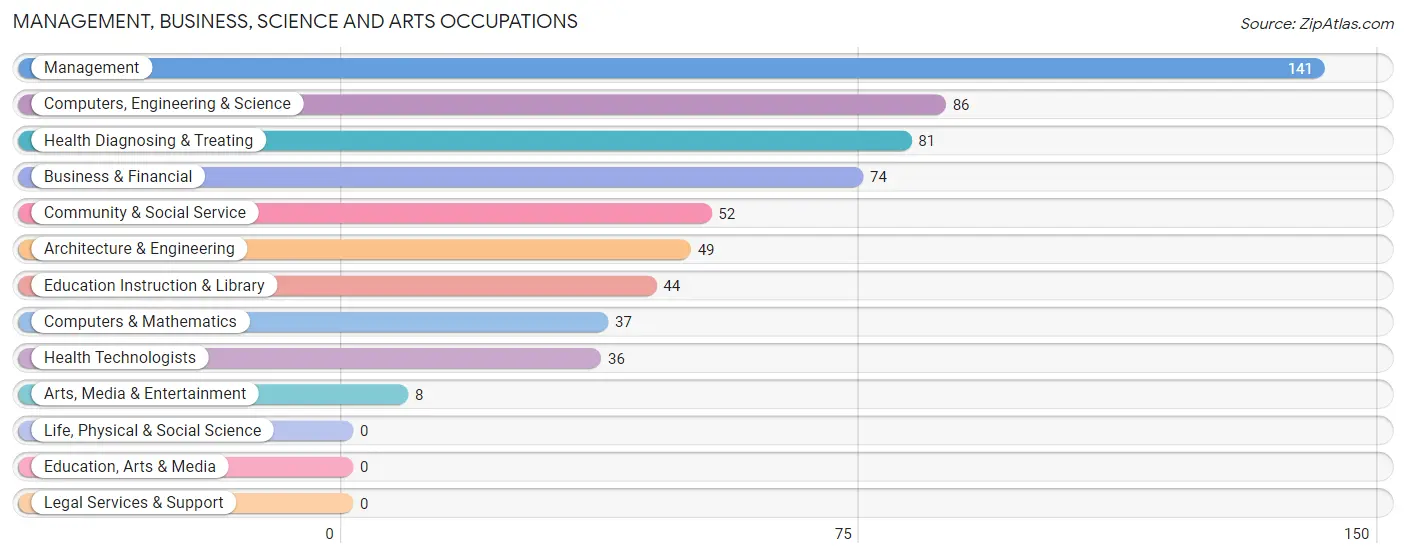
Management, Business, Science and Arts Occupations
The most common Management, Business, Science and Arts occupations in Potterville are Management (141 | 9.9%), Computers, Engineering & Science (86 | 6.1%), Health Diagnosing & Treating (81 | 5.7%), Business & Financial (74 | 5.2%), and Community & Social Service (52 | 3.7%).
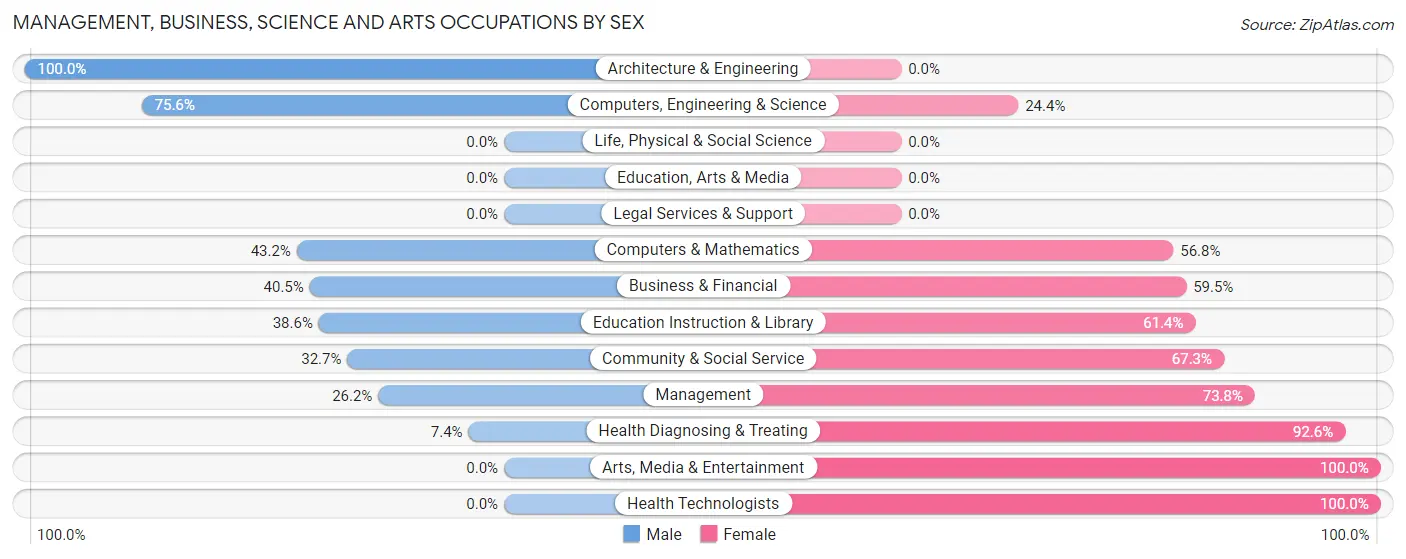
Management, Business, Science and Arts Occupations by Sex
Within the Management, Business, Science and Arts occupations in Potterville, the most male-oriented occupations are Architecture & Engineering (100.0%), Computers, Engineering & Science (75.6%), and Computers & Mathematics (43.2%), while the most female-oriented occupations are Arts, Media & Entertainment (100.0%), Health Technologists (100.0%), and Health Diagnosing & Treating (92.6%).
| Occupation | Male | Female |
| Management | 37 (26.2%) | 104 (73.8%) |
| Business & Financial | 30 (40.5%) | 44 (59.5%) |
| Computers, Engineering & Science | 65 (75.6%) | 21 (24.4%) |
| Computers & Mathematics | 16 (43.2%) | 21 (56.8%) |
| Architecture & Engineering | 49 (100.0%) | 0 (0.0%) |
| Life, Physical & Social Science | 0 (0.0%) | 0 (0.0%) |
| Community & Social Service | 17 (32.7%) | 35 (67.3%) |
| Education, Arts & Media | 0 (0.0%) | 0 (0.0%) |
| Legal Services & Support | 0 (0.0%) | 0 (0.0%) |
| Education Instruction & Library | 17 (38.6%) | 27 (61.4%) |
| Arts, Media & Entertainment | 0 (0.0%) | 8 (100.0%) |
| Health Diagnosing & Treating | 6 (7.4%) | 75 (92.6%) |
| Health Technologists | 0 (0.0%) | 36 (100.0%) |
| Total (Category) | 155 (35.7%) | 279 (64.3%) |
| Total (Overall) | 601 (42.3%) | 818 (57.7%) |
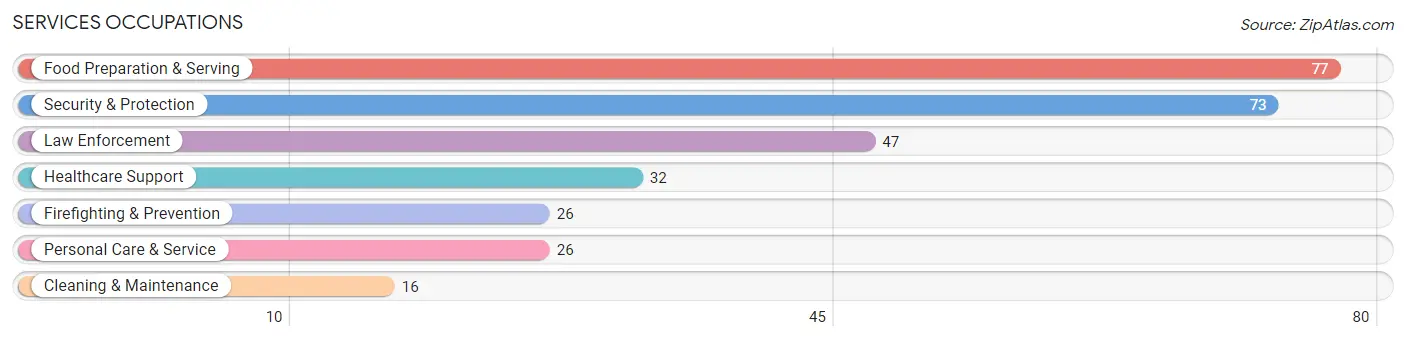
Services Occupations
The most common Services occupations in Potterville are Food Preparation & Serving (77 | 5.4%), Security & Protection (73 | 5.1%), Law Enforcement (47 | 3.3%), Healthcare Support (32 | 2.3%), and Firefighting & Prevention (26 | 1.8%).
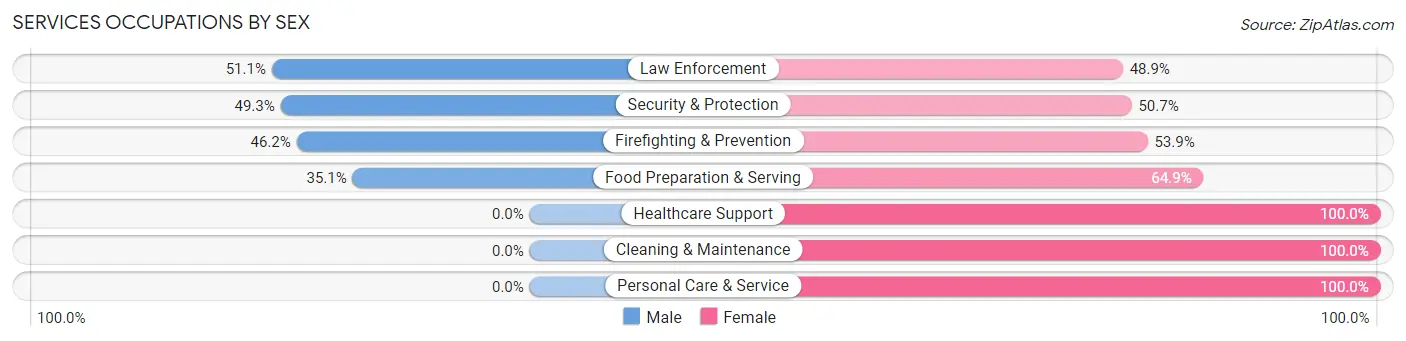
Services Occupations by Sex
Within the Services occupations in Potterville, the most male-oriented occupations are Law Enforcement (51.1%), Security & Protection (49.3%), and Firefighting & Prevention (46.2%), while the most female-oriented occupations are Healthcare Support (100.0%), Cleaning & Maintenance (100.0%), and Personal Care & Service (100.0%).
| Occupation | Male | Female |
| Healthcare Support | 0 (0.0%) | 32 (100.0%) |
| Security & Protection | 36 (49.3%) | 37 (50.7%) |
| Firefighting & Prevention | 12 (46.2%) | 14 (53.8%) |
| Law Enforcement | 24 (51.1%) | 23 (48.9%) |
| Food Preparation & Serving | 27 (35.1%) | 50 (64.9%) |
| Cleaning & Maintenance | 0 (0.0%) | 16 (100.0%) |
| Personal Care & Service | 0 (0.0%) | 26 (100.0%) |
| Total (Category) | 63 (28.1%) | 161 (71.9%) |
| Total (Overall) | 601 (42.3%) | 818 (57.7%) |
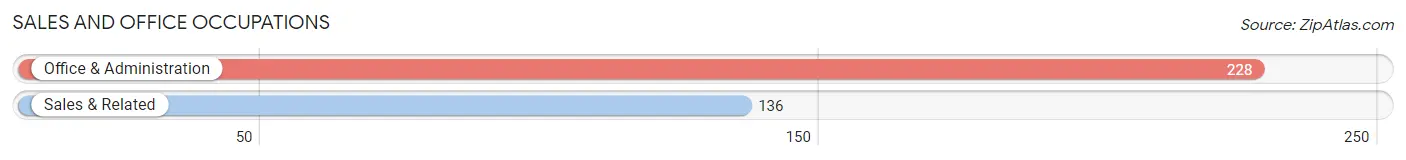
Sales and Office Occupations
The most common Sales and Office occupations in Potterville are Office & Administration (228 | 16.1%), and Sales & Related (136 | 9.6%).
Sales and Office Occupations by Sex
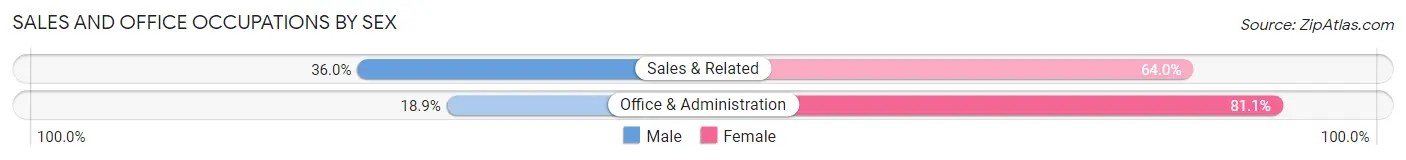
| Occupation | Male | Female |
| Sales & Related | 49 (36.0%) | 87 (64.0%) |
| Office & Administration | 43 (18.9%) | 185 (81.1%) |
| Total (Category) | 92 (25.3%) | 272 (74.7%) |
| Total (Overall) | 601 (42.3%) | 818 (57.7%) |
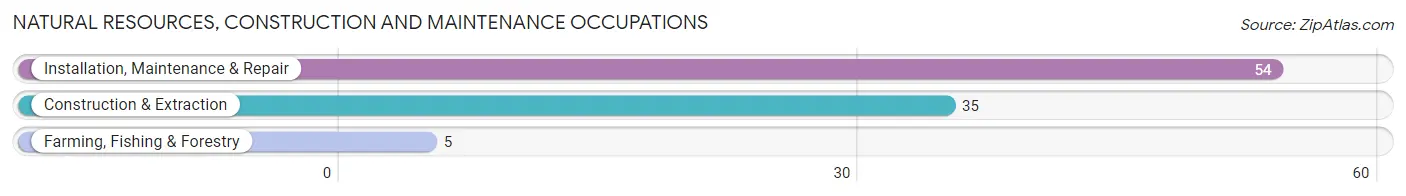
Natural Resources, Construction and Maintenance Occupations
The most common Natural Resources, Construction and Maintenance occupations in Potterville are Installation, Maintenance & Repair (54 | 3.8%), Construction & Extraction (35 | 2.5%), and Farming, Fishing & Forestry (5 | 0.4%).
Natural Resources, Construction and Maintenance Occupations by Sex
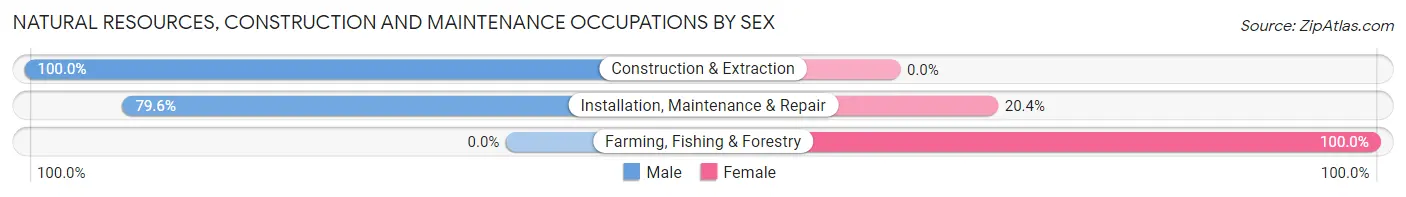
| Occupation | Male | Female |
| Farming, Fishing & Forestry | 0 (0.0%) | 5 (100.0%) |
| Construction & Extraction | 35 (100.0%) | 0 (0.0%) |
| Installation, Maintenance & Repair | 43 (79.6%) | 11 (20.4%) |
| Total (Category) | 78 (83.0%) | 16 (17.0%) |
| Total (Overall) | 601 (42.3%) | 818 (57.7%) |
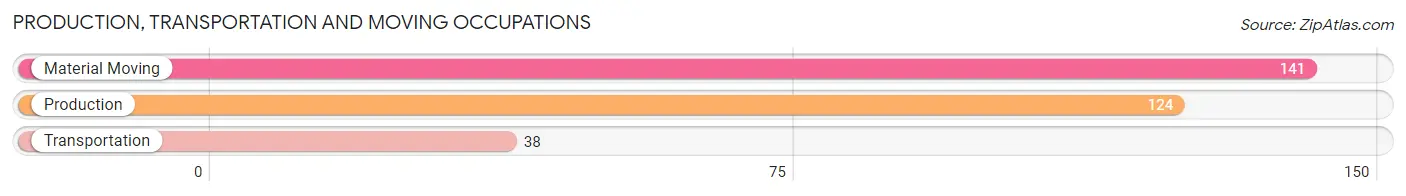
Production, Transportation and Moving Occupations
The most common Production, Transportation and Moving occupations in Potterville are Material Moving (141 | 9.9%), Production (124 | 8.7%), and Transportation (38 | 2.7%).
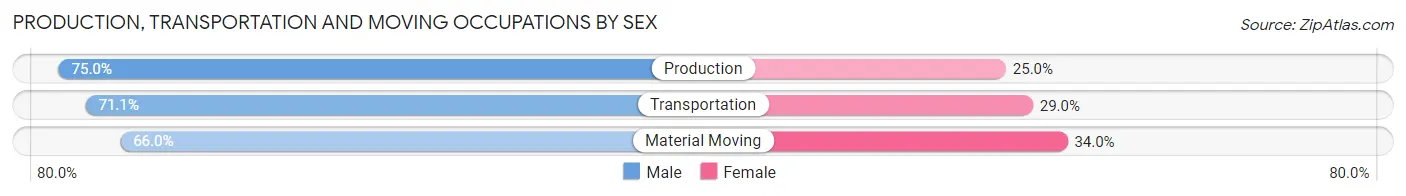
Production, Transportation and Moving Occupations by Sex
| Occupation | Male | Female |
| Production | 93 (75.0%) | 31 (25.0%) |
| Transportation | 27 (71.1%) | 11 (28.9%) |
| Material Moving | 93 (66.0%) | 48 (34.0%) |
| Total (Category) | 213 (70.3%) | 90 (29.7%) |
| Total (Overall) | 601 (42.3%) | 818 (57.7%) |
Employment Industries by Sex in Potterville
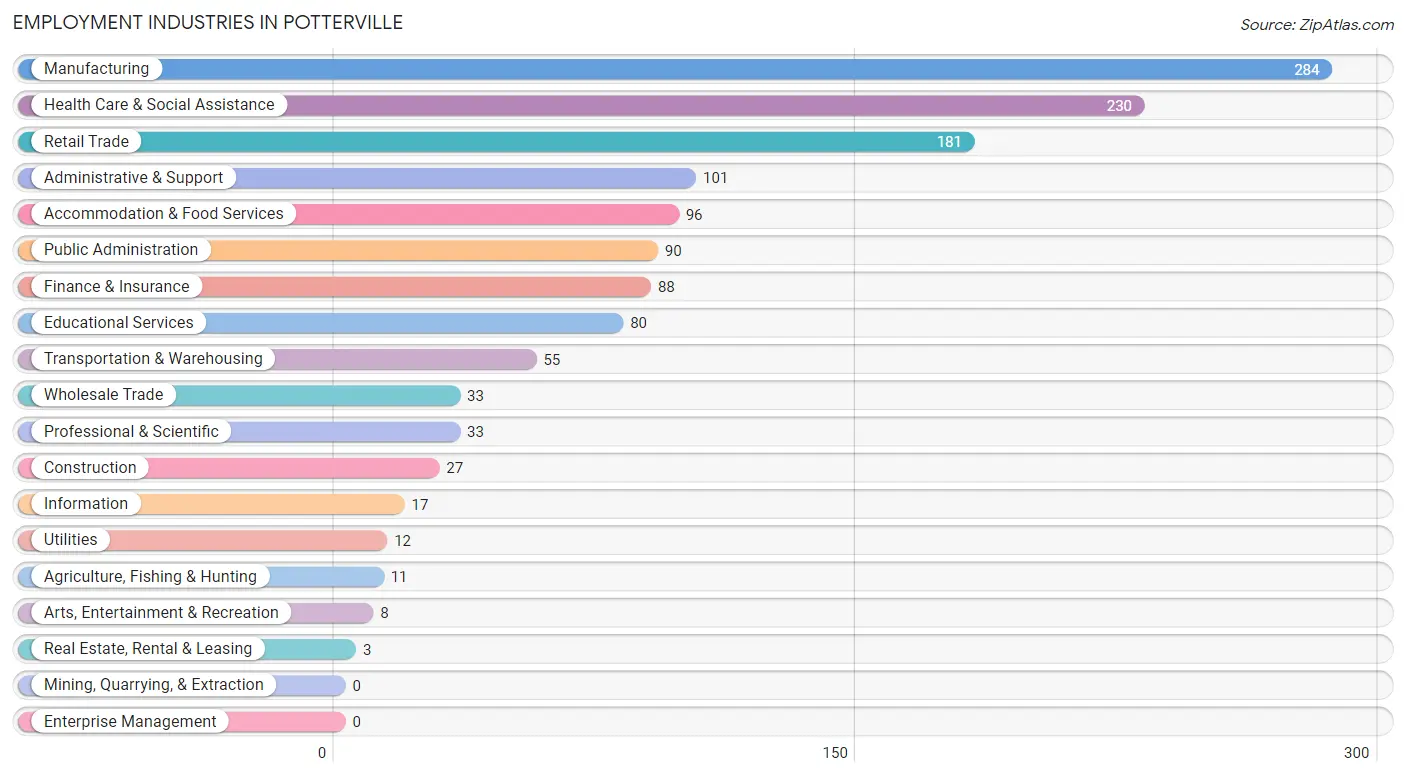
Employment Industries in Potterville
The major employment industries in Potterville include Manufacturing (284 | 20.0%), Health Care & Social Assistance (230 | 16.2%), Retail Trade (181 | 12.8%), Administrative & Support (101 | 7.1%), and Accommodation & Food Services (96 | 6.8%).
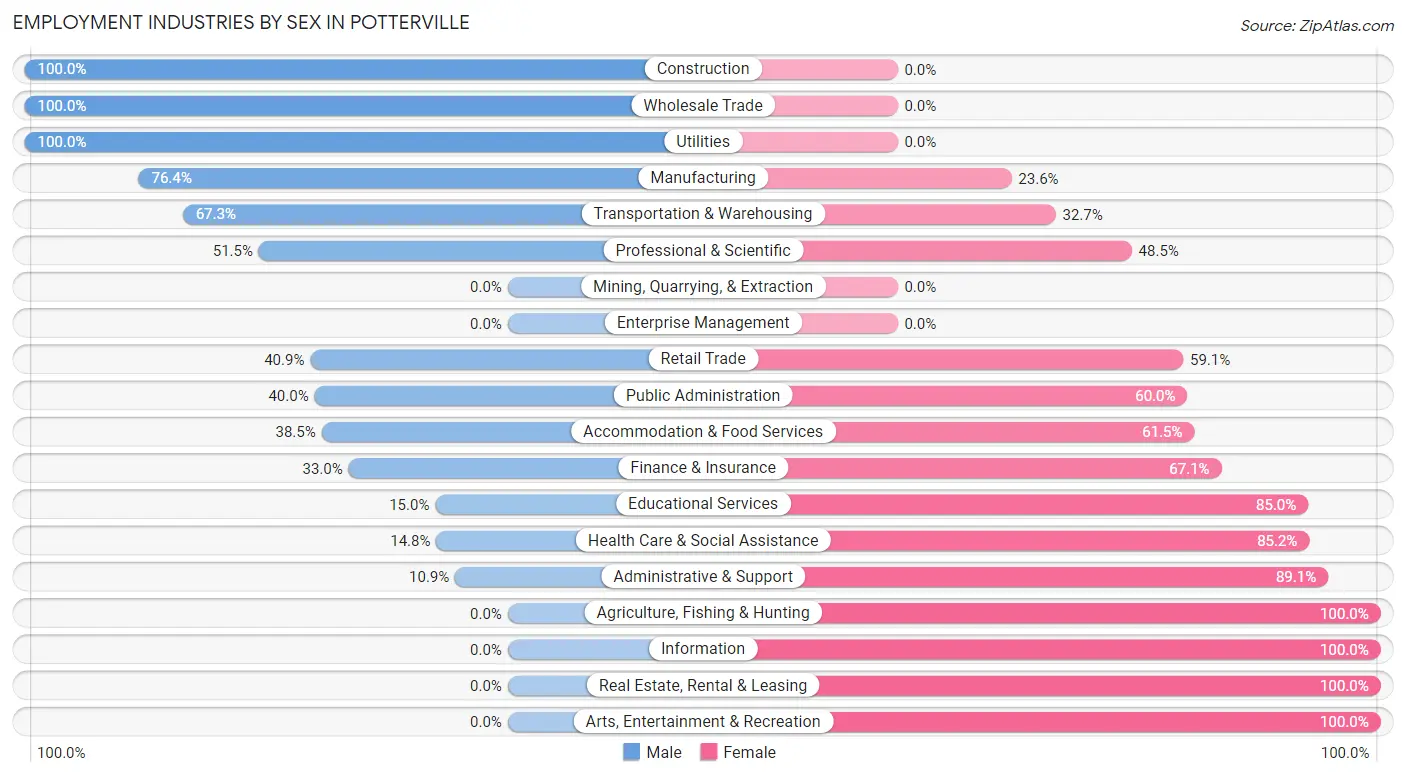
Employment Industries by Sex in Potterville
The Potterville industries that see more men than women are Construction (100.0%), Wholesale Trade (100.0%), and Utilities (100.0%), whereas the industries that tend to have a higher number of women are Agriculture, Fishing & Hunting (100.0%), Information (100.0%), and Real Estate, Rental & Leasing (100.0%).
| Industry | Male | Female |
| Agriculture, Fishing & Hunting | 0 (0.0%) | 11 (100.0%) |
| Mining, Quarrying, & Extraction | 0 (0.0%) | 0 (0.0%) |
| Construction | 27 (100.0%) | 0 (0.0%) |
| Manufacturing | 217 (76.4%) | 67 (23.6%) |
| Wholesale Trade | 33 (100.0%) | 0 (0.0%) |
| Retail Trade | 74 (40.9%) | 107 (59.1%) |
| Transportation & Warehousing | 37 (67.3%) | 18 (32.7%) |
| Utilities | 12 (100.0%) | 0 (0.0%) |
| Information | 0 (0.0%) | 17 (100.0%) |
| Finance & Insurance | 29 (33.0%) | 59 (67.0%) |
| Real Estate, Rental & Leasing | 0 (0.0%) | 3 (100.0%) |
| Professional & Scientific | 17 (51.5%) | 16 (48.5%) |
| Enterprise Management | 0 (0.0%) | 0 (0.0%) |
| Administrative & Support | 11 (10.9%) | 90 (89.1%) |
| Educational Services | 12 (15.0%) | 68 (85.0%) |
| Health Care & Social Assistance | 34 (14.8%) | 196 (85.2%) |
| Arts, Entertainment & Recreation | 0 (0.0%) | 8 (100.0%) |
| Accommodation & Food Services | 37 (38.5%) | 59 (61.5%) |
| Public Administration | 36 (40.0%) | 54 (60.0%) |
| Total | 601 (42.3%) | 818 (57.7%) |
Education in Potterville
School Enrollment in Potterville
The most common levels of schooling among the 651 students in Potterville are elementary school (152 | 23.4%), middle school (137 | 21.0%), and high school (108 | 16.6%).
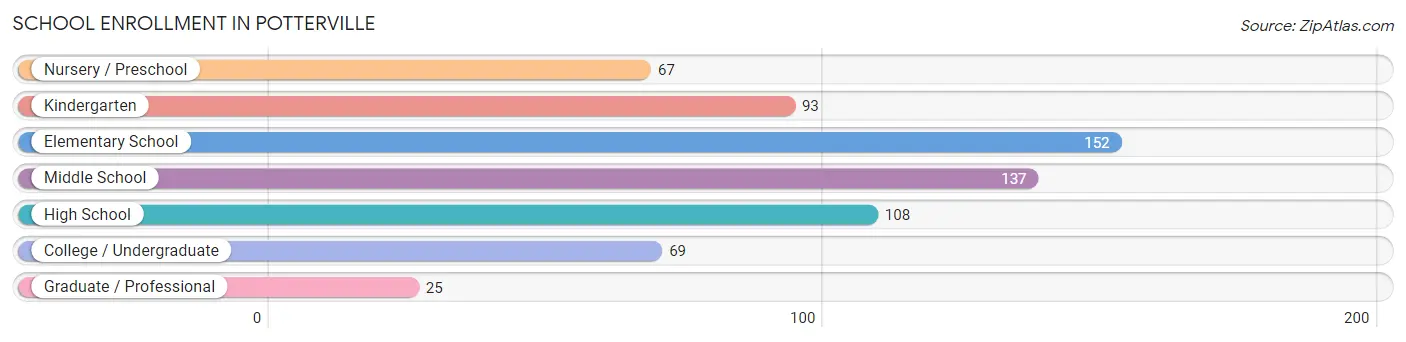
| School Level | # Students | % Students |
| Nursery / Preschool | 67 | 10.3% |
| Kindergarten | 93 | 14.3% |
| Elementary School | 152 | 23.4% |
| Middle School | 137 | 21.0% |
| High School | 108 | 16.6% |
| College / Undergraduate | 69 | 10.6% |
| Graduate / Professional | 25 | 3.8% |
| Total | 651 | 100.0% |
School Enrollment by Age by Funding Source in Potterville
Out of a total of 651 students who are enrolled in schools in Potterville, 102 (15.7%) attend a private institution, while the remaining 549 (84.3%) are enrolled in public schools. The age group of 35 years and over has the highest likelihood of being enrolled in private schools, with 29 (78.4% in the age bracket) enrolled. Conversely, the age group of 15 to 17 year olds has the lowest likelihood of being enrolled in a private school, with 80 (100.0% in the age bracket) attending a public institution.
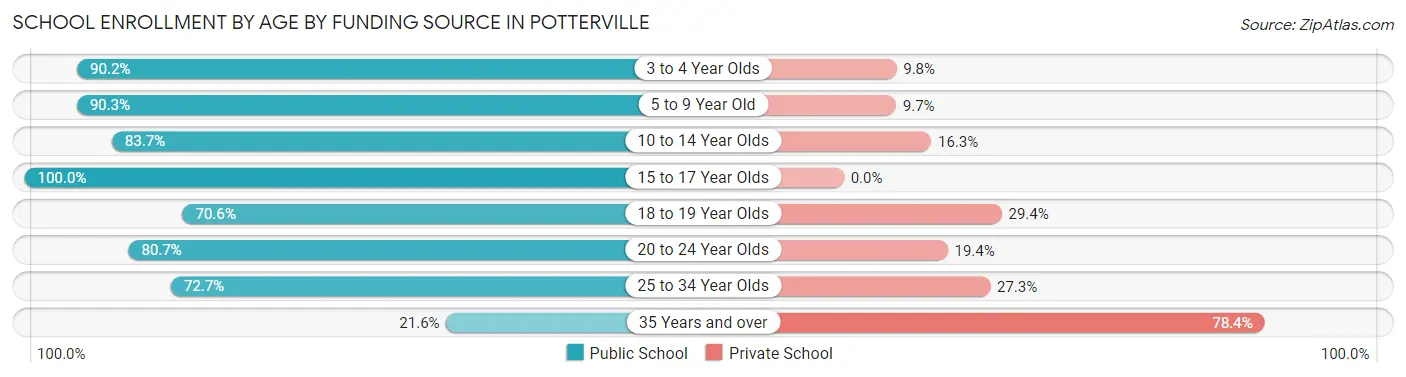
| Age Bracket | Public School | Private School |
| 3 to 4 Year Olds | 46 (90.2%) | 5 (9.8%) |
| 5 to 9 Year Old | 223 (90.3%) | 24 (9.7%) |
| 10 to 14 Year Olds | 139 (83.7%) | 27 (16.3%) |
| 15 to 17 Year Olds | 80 (100.0%) | 0 (0.0%) |
| 18 to 19 Year Olds | 12 (70.6%) | 5 (29.4%) |
| 20 to 24 Year Olds | 25 (80.6%) | 6 (19.4%) |
| 25 to 34 Year Olds | 16 (72.7%) | 6 (27.3%) |
| 35 Years and over | 8 (21.6%) | 29 (78.4%) |
| Total | 549 (84.3%) | 102 (15.7%) |
Educational Attainment by Field of Study in Potterville
Social sciences (69 | 13.3%), education (67 | 12.9%), psychology (63 | 12.1%), business (54 | 10.4%), and science & technology (52 | 10.0%) are the most common fields of study among 519 individuals in Potterville who have obtained a bachelor's degree or higher.
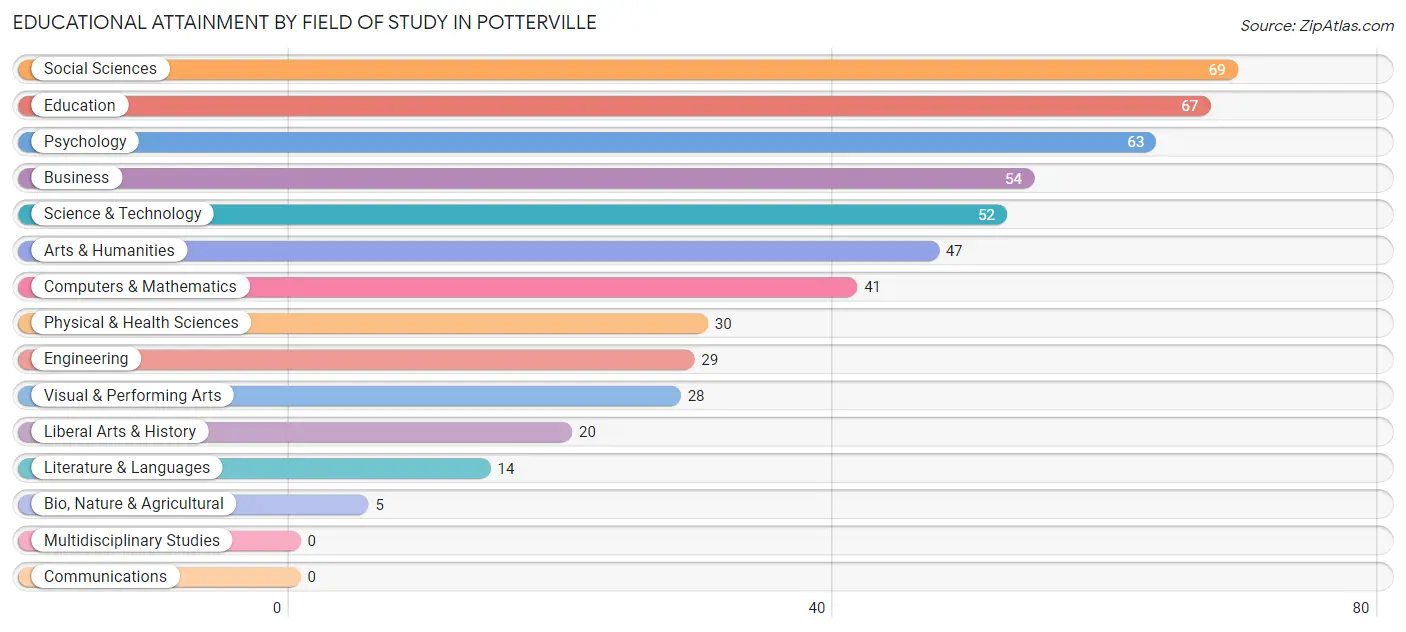
| Field of Study | # Graduates | % Graduates |
| Computers & Mathematics | 41 | 7.9% |
| Bio, Nature & Agricultural | 5 | 1.0% |
| Physical & Health Sciences | 30 | 5.8% |
| Psychology | 63 | 12.1% |
| Social Sciences | 69 | 13.3% |
| Engineering | 29 | 5.6% |
| Multidisciplinary Studies | 0 | 0.0% |
| Science & Technology | 52 | 10.0% |
| Business | 54 | 10.4% |
| Education | 67 | 12.9% |
| Literature & Languages | 14 | 2.7% |
| Liberal Arts & History | 20 | 3.8% |
| Visual & Performing Arts | 28 | 5.4% |
| Communications | 0 | 0.0% |
| Arts & Humanities | 47 | 9.1% |
| Total | 519 | 100.0% |
Transportation & Commute in Potterville
Vehicle Availability by Sex in Potterville
The most prevalent vehicle ownership categories in Potterville are males with 2 vehicles (304, accounting for 50.6%) and females with 2 vehicles (372, making up 38.2%).
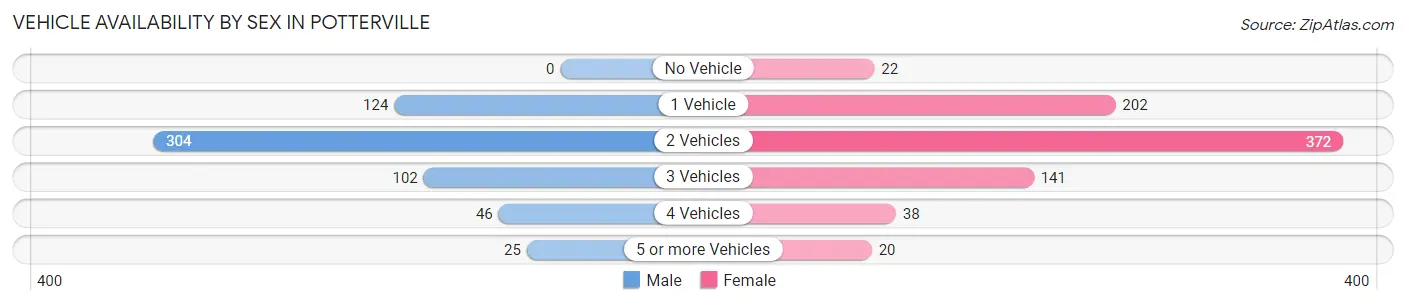
| Vehicles Available | Male | Female |
| No Vehicle | 0 (0.0%) | 22 (2.8%) |
| 1 Vehicle | 124 (20.6%) | 202 (25.4%) |
| 2 Vehicles | 304 (50.6%) | 372 (46.8%) |
| 3 Vehicles | 102 (17.0%) | 141 (17.7%) |
| 4 Vehicles | 46 (7.6%) | 38 (4.8%) |
| 5 or more Vehicles | 25 (4.2%) | 20 (2.5%) |
| Total | 601 (100.0%) | 795 (100.0%) |
Commute Time in Potterville
The most frequently occuring commute durations in Potterville are 15 to 19 minutes (277 commuters, 21.3%), 20 to 24 minutes (256 commuters, 19.7%), and 10 to 14 minutes (196 commuters, 15.0%).
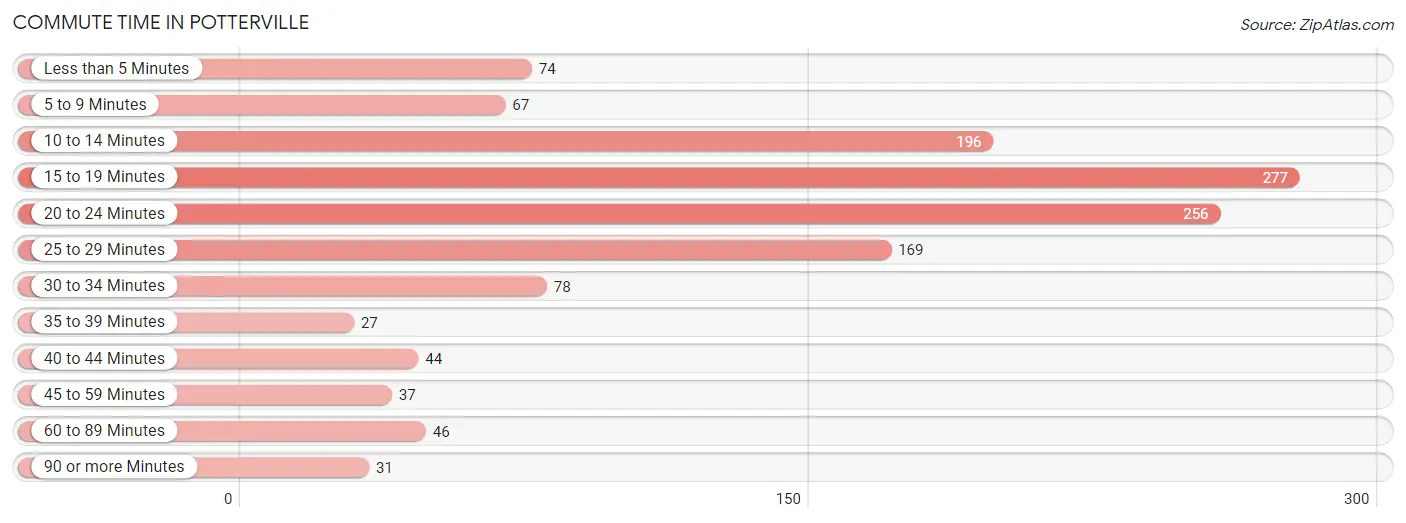
| Commute Time | # Commuters | % Commuters |
| Less than 5 Minutes | 74 | 5.7% |
| 5 to 9 Minutes | 67 | 5.1% |
| 10 to 14 Minutes | 196 | 15.0% |
| 15 to 19 Minutes | 277 | 21.3% |
| 20 to 24 Minutes | 256 | 19.7% |
| 25 to 29 Minutes | 169 | 13.0% |
| 30 to 34 Minutes | 78 | 6.0% |
| 35 to 39 Minutes | 27 | 2.1% |
| 40 to 44 Minutes | 44 | 3.4% |
| 45 to 59 Minutes | 37 | 2.8% |
| 60 to 89 Minutes | 46 | 3.5% |
| 90 or more Minutes | 31 | 2.4% |
Commute Time by Sex in Potterville
The most common commute times in Potterville are 15 to 19 minutes (129 commuters, 22.1%) for males and 20 to 24 minutes (176 commuters, 24.5%) for females.
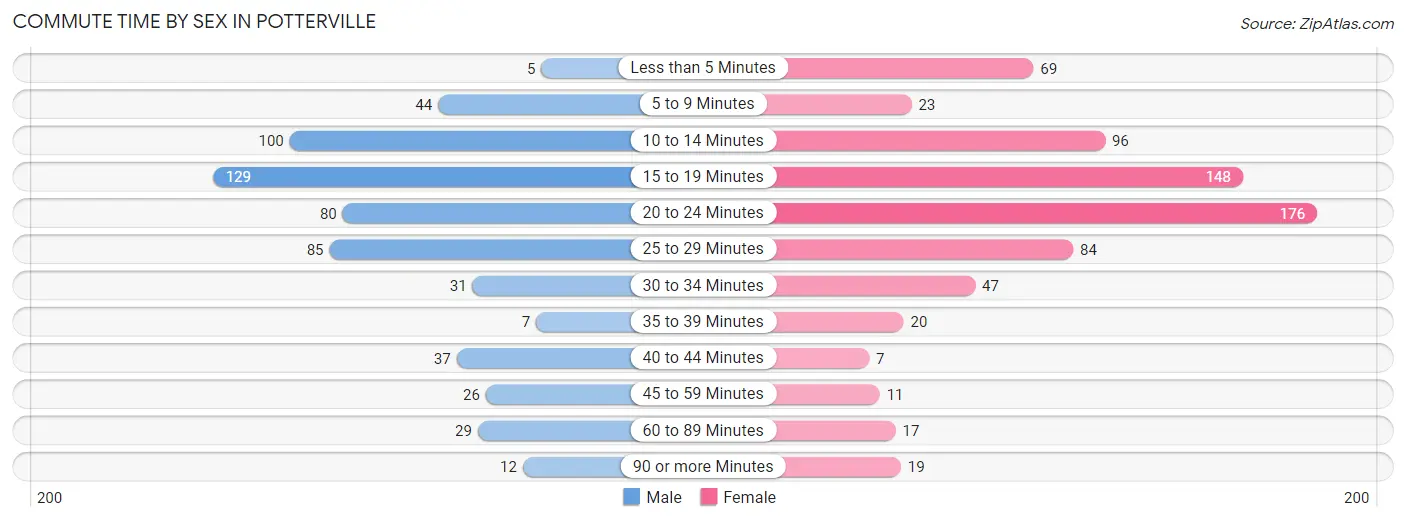
| Commute Time | Male | Female |
| Less than 5 Minutes | 5 (0.9%) | 69 (9.6%) |
| 5 to 9 Minutes | 44 (7.5%) | 23 (3.2%) |
| 10 to 14 Minutes | 100 (17.1%) | 96 (13.4%) |
| 15 to 19 Minutes | 129 (22.1%) | 148 (20.6%) |
| 20 to 24 Minutes | 80 (13.7%) | 176 (24.5%) |
| 25 to 29 Minutes | 85 (14.5%) | 84 (11.7%) |
| 30 to 34 Minutes | 31 (5.3%) | 47 (6.6%) |
| 35 to 39 Minutes | 7 (1.2%) | 20 (2.8%) |
| 40 to 44 Minutes | 37 (6.3%) | 7 (1.0%) |
| 45 to 59 Minutes | 26 (4.4%) | 11 (1.5%) |
| 60 to 89 Minutes | 29 (5.0%) | 17 (2.4%) |
| 90 or more Minutes | 12 (2.1%) | 19 (2.6%) |
Time of Departure to Work by Sex in Potterville
The most frequent times of departure to work in Potterville are 7:30 AM to 7:59 AM (89, 15.2%) for males and 7:00 AM to 7:29 AM (160, 22.3%) for females.
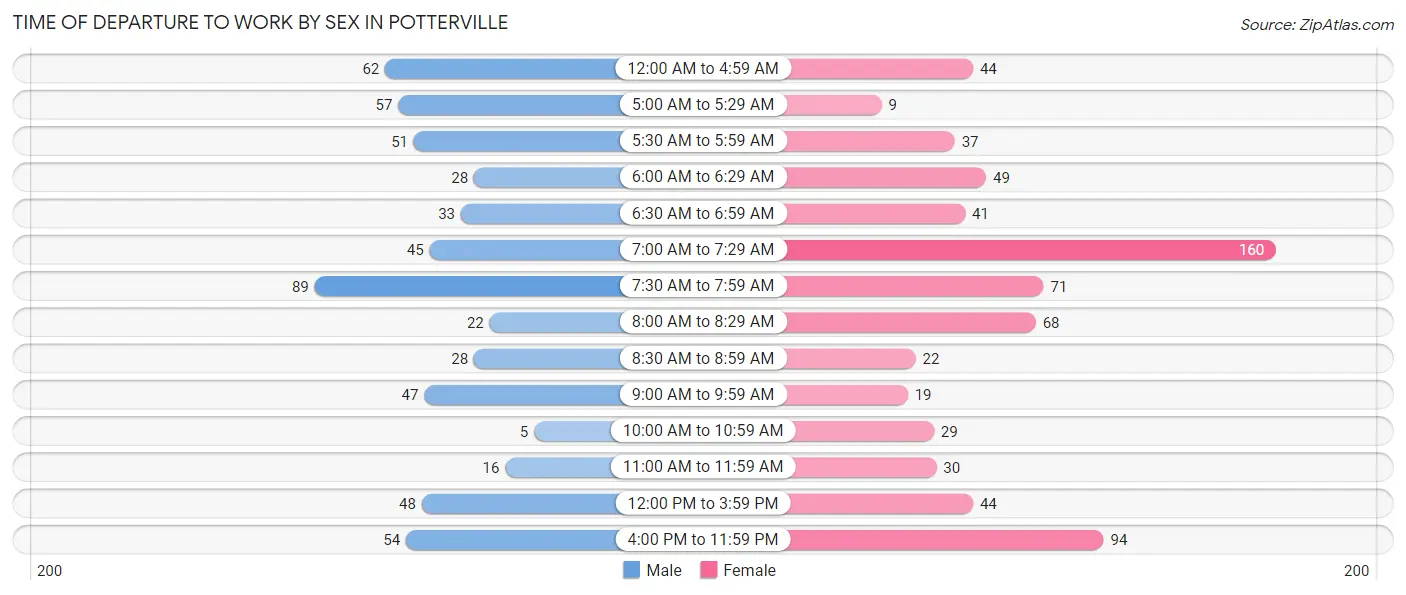
| Time of Departure | Male | Female |
| 12:00 AM to 4:59 AM | 62 (10.6%) | 44 (6.1%) |
| 5:00 AM to 5:29 AM | 57 (9.7%) | 9 (1.3%) |
| 5:30 AM to 5:59 AM | 51 (8.7%) | 37 (5.2%) |
| 6:00 AM to 6:29 AM | 28 (4.8%) | 49 (6.8%) |
| 6:30 AM to 6:59 AM | 33 (5.6%) | 41 (5.7%) |
| 7:00 AM to 7:29 AM | 45 (7.7%) | 160 (22.3%) |
| 7:30 AM to 7:59 AM | 89 (15.2%) | 71 (9.9%) |
| 8:00 AM to 8:29 AM | 22 (3.8%) | 68 (9.5%) |
| 8:30 AM to 8:59 AM | 28 (4.8%) | 22 (3.1%) |
| 9:00 AM to 9:59 AM | 47 (8.0%) | 19 (2.6%) |
| 10:00 AM to 10:59 AM | 5 (0.9%) | 29 (4.0%) |
| 11:00 AM to 11:59 AM | 16 (2.7%) | 30 (4.2%) |
| 12:00 PM to 3:59 PM | 48 (8.2%) | 44 (6.1%) |
| 4:00 PM to 11:59 PM | 54 (9.2%) | 94 (13.1%) |
| Total | 585 (100.0%) | 717 (100.0%) |
Housing Occupancy in Potterville
Occupancy by Ownership in Potterville
Of the total 1,220 dwellings in Potterville, owner-occupied units account for 700 (57.4%), while renter-occupied units make up 520 (42.6%).
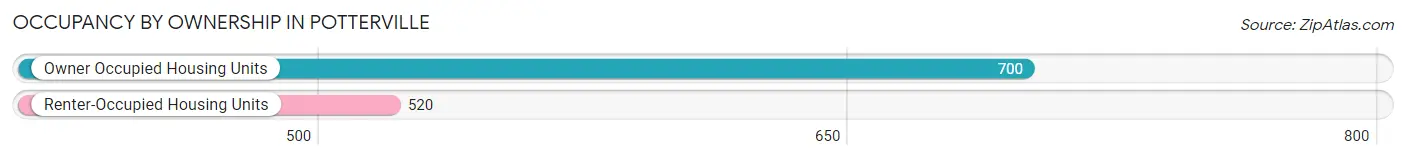
| Occupancy | # Housing Units | % Housing Units |
| Owner Occupied Housing Units | 700 | 57.4% |
| Renter-Occupied Housing Units | 520 | 42.6% |
| Total Occupied Housing Units | 1,220 | 100.0% |
Occupancy by Household Size in Potterville
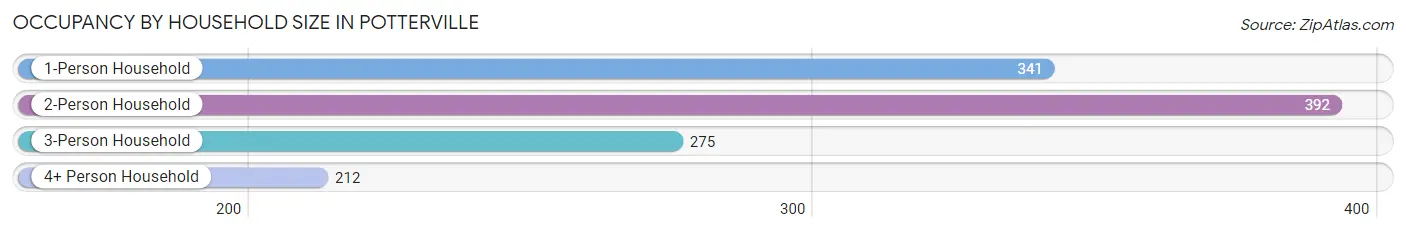
| Household Size | # Housing Units | % Housing Units |
| 1-Person Household | 341 | 28.0% |
| 2-Person Household | 392 | 32.1% |
| 3-Person Household | 275 | 22.5% |
| 4+ Person Household | 212 | 17.4% |
| Total Housing Units | 1,220 | 100.0% |
Occupancy by Ownership by Household Size in Potterville
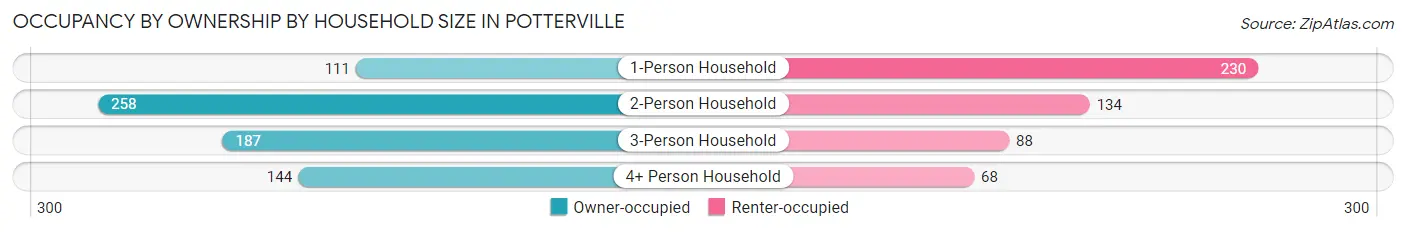
| Household Size | Owner-occupied | Renter-occupied |
| 1-Person Household | 111 (32.6%) | 230 (67.4%) |
| 2-Person Household | 258 (65.8%) | 134 (34.2%) |
| 3-Person Household | 187 (68.0%) | 88 (32.0%) |
| 4+ Person Household | 144 (67.9%) | 68 (32.1%) |
| Total Housing Units | 700 (57.4%) | 520 (42.6%) |
Occupancy by Educational Attainment in Potterville
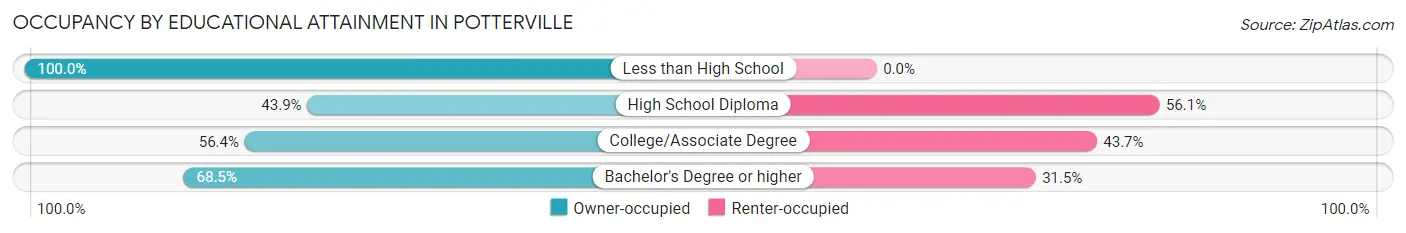
| Household Size | Owner-occupied | Renter-occupied |
| Less than High School | 23 (100.0%) | 0 (0.0%) |
| High School Diploma | 134 (43.9%) | 171 (56.1%) |
| College/Associate Degree | 315 (56.4%) | 244 (43.6%) |
| Bachelor's Degree or higher | 228 (68.5%) | 105 (31.5%) |
Occupancy by Age of Householder in Potterville
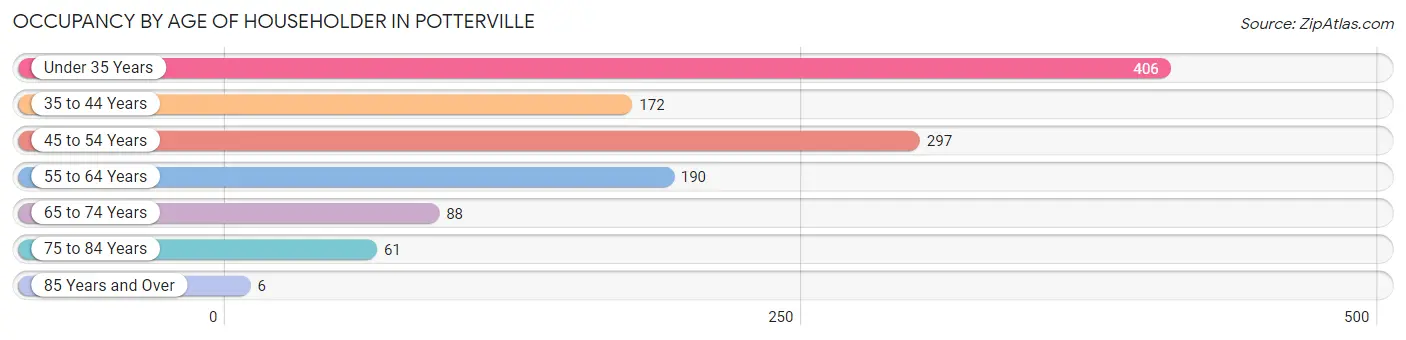
| Age Bracket | # Households | % Households |
| Under 35 Years | 406 | 33.3% |
| 35 to 44 Years | 172 | 14.1% |
| 45 to 54 Years | 297 | 24.3% |
| 55 to 64 Years | 190 | 15.6% |
| 65 to 74 Years | 88 | 7.2% |
| 75 to 84 Years | 61 | 5.0% |
| 85 Years and Over | 6 | 0.5% |
| Total | 1,220 | 100.0% |
Housing Finances in Potterville
Median Income by Occupancy in Potterville
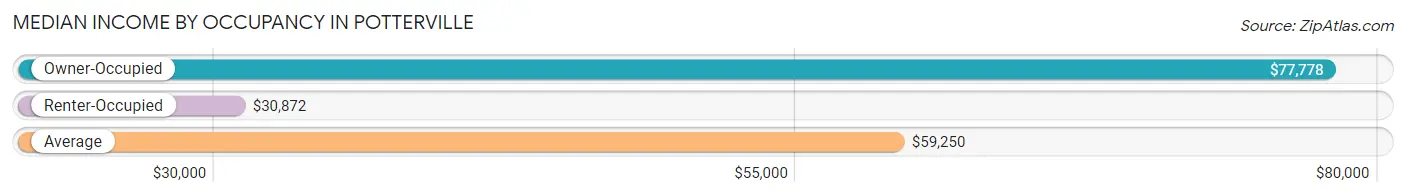
| Occupancy Type | # Households | Median Income |
| Owner-Occupied | 700 (57.4%) | $77,778 |
| Renter-Occupied | 520 (42.6%) | $30,872 |
| Average | 1,220 (100.0%) | $59,250 |
Occupancy by Householder Income Bracket in Potterville
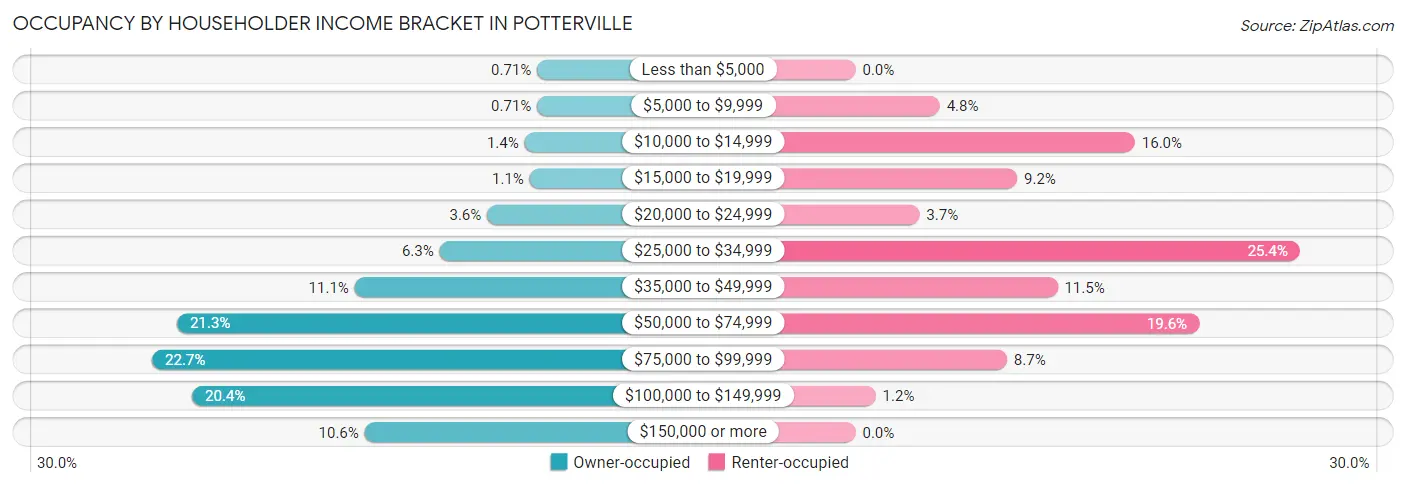
| Income Bracket | Owner-occupied | Renter-occupied |
| Less than $5,000 | 5 (0.7%) | 0 (0.0%) |
| $5,000 to $9,999 | 5 (0.7%) | 25 (4.8%) |
| $10,000 to $14,999 | 10 (1.4%) | 83 (16.0%) |
| $15,000 to $19,999 | 8 (1.1%) | 48 (9.2%) |
| $20,000 to $24,999 | 25 (3.6%) | 19 (3.6%) |
| $25,000 to $34,999 | 44 (6.3%) | 132 (25.4%) |
| $35,000 to $49,999 | 78 (11.1%) | 60 (11.5%) |
| $50,000 to $74,999 | 149 (21.3%) | 102 (19.6%) |
| $75,000 to $99,999 | 159 (22.7%) | 45 (8.6%) |
| $100,000 to $149,999 | 143 (20.4%) | 6 (1.1%) |
| $150,000 or more | 74 (10.6%) | 0 (0.0%) |
| Total | 700 (100.0%) | 520 (100.0%) |
Monthly Housing Cost Tiers in Potterville
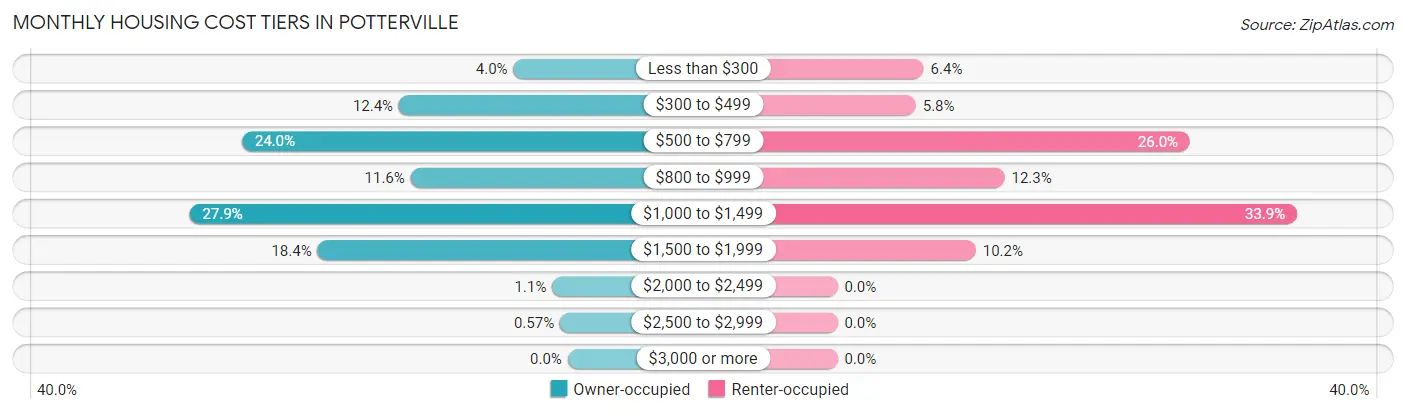
| Monthly Cost | Owner-occupied | Renter-occupied |
| Less than $300 | 28 (4.0%) | 33 (6.4%) |
| $300 to $499 | 87 (12.4%) | 30 (5.8%) |
| $500 to $799 | 168 (24.0%) | 135 (26.0%) |
| $800 to $999 | 81 (11.6%) | 64 (12.3%) |
| $1,000 to $1,499 | 195 (27.9%) | 176 (33.9%) |
| $1,500 to $1,999 | 129 (18.4%) | 53 (10.2%) |
| $2,000 to $2,499 | 8 (1.1%) | 0 (0.0%) |
| $2,500 to $2,999 | 4 (0.6%) | 0 (0.0%) |
| $3,000 or more | 0 (0.0%) | 0 (0.0%) |
| Total | 700 (100.0%) | 520 (100.0%) |
Physical Housing Characteristics in Potterville
Housing Structures in Potterville
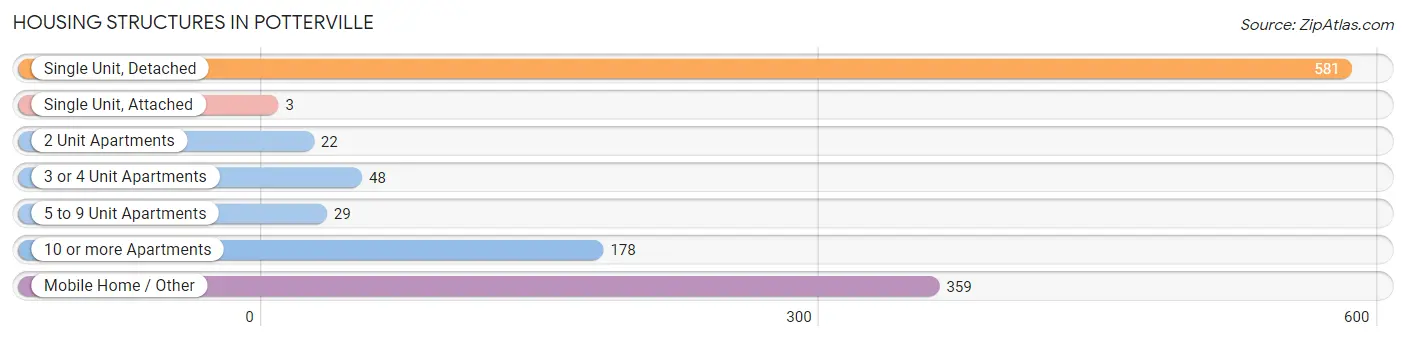
| Structure Type | # Housing Units | % Housing Units |
| Single Unit, Detached | 581 | 47.6% |
| Single Unit, Attached | 3 | 0.3% |
| 2 Unit Apartments | 22 | 1.8% |
| 3 or 4 Unit Apartments | 48 | 3.9% |
| 5 to 9 Unit Apartments | 29 | 2.4% |
| 10 or more Apartments | 178 | 14.6% |
| Mobile Home / Other | 359 | 29.4% |
| Total | 1,220 | 100.0% |
Housing Structures by Occupancy in Potterville
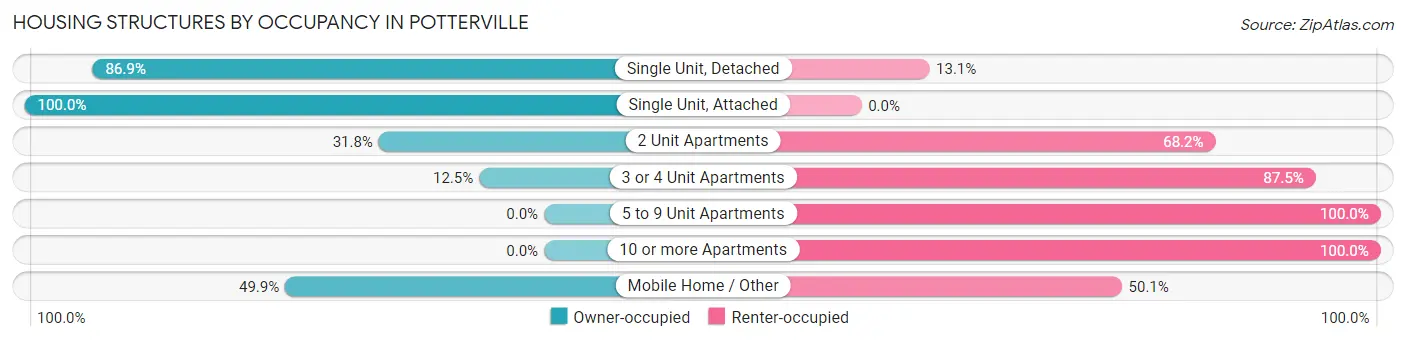
| Structure Type | Owner-occupied | Renter-occupied |
| Single Unit, Detached | 505 (86.9%) | 76 (13.1%) |
| Single Unit, Attached | 3 (100.0%) | 0 (0.0%) |
| 2 Unit Apartments | 7 (31.8%) | 15 (68.2%) |
| 3 or 4 Unit Apartments | 6 (12.5%) | 42 (87.5%) |
| 5 to 9 Unit Apartments | 0 (0.0%) | 29 (100.0%) |
| 10 or more Apartments | 0 (0.0%) | 178 (100.0%) |
| Mobile Home / Other | 179 (49.9%) | 180 (50.1%) |
| Total | 700 (57.4%) | 520 (42.6%) |
Housing Structures by Number of Rooms in Potterville
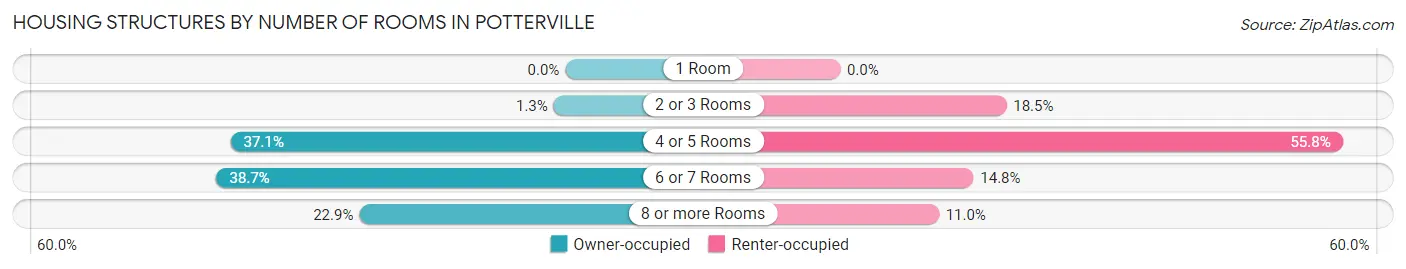
| Number of Rooms | Owner-occupied | Renter-occupied |
| 1 Room | 0 (0.0%) | 0 (0.0%) |
| 2 or 3 Rooms | 9 (1.3%) | 96 (18.5%) |
| 4 or 5 Rooms | 260 (37.1%) | 290 (55.8%) |
| 6 or 7 Rooms | 271 (38.7%) | 77 (14.8%) |
| 8 or more Rooms | 160 (22.9%) | 57 (11.0%) |
| Total | 700 (100.0%) | 520 (100.0%) |
Housing Structure by Heating Type in Potterville
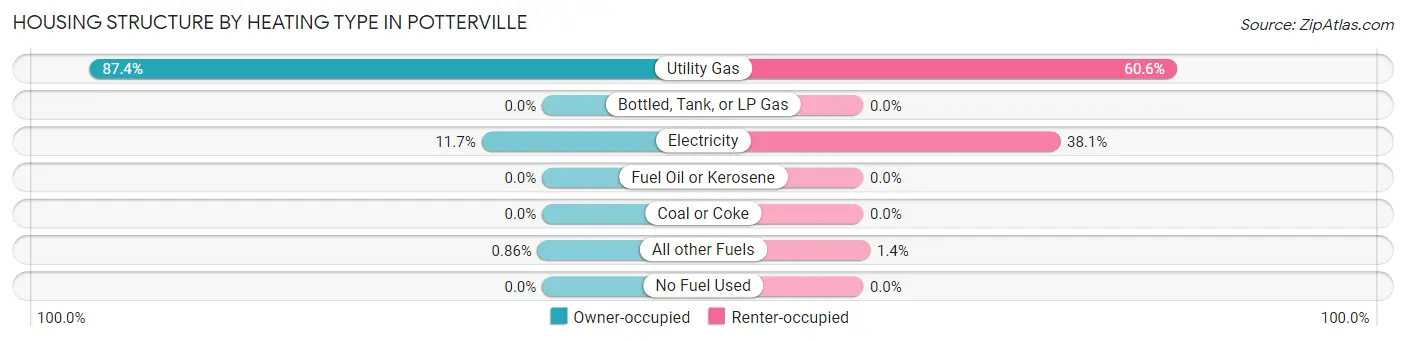
| Heating Type | Owner-occupied | Renter-occupied |
| Utility Gas | 612 (87.4%) | 315 (60.6%) |
| Bottled, Tank, or LP Gas | 0 (0.0%) | 0 (0.0%) |
| Electricity | 82 (11.7%) | 198 (38.1%) |
| Fuel Oil or Kerosene | 0 (0.0%) | 0 (0.0%) |
| Coal or Coke | 0 (0.0%) | 0 (0.0%) |
| All other Fuels | 6 (0.9%) | 7 (1.3%) |
| No Fuel Used | 0 (0.0%) | 0 (0.0%) |
| Total | 700 (100.0%) | 520 (100.0%) |
Household Vehicle Usage in Potterville
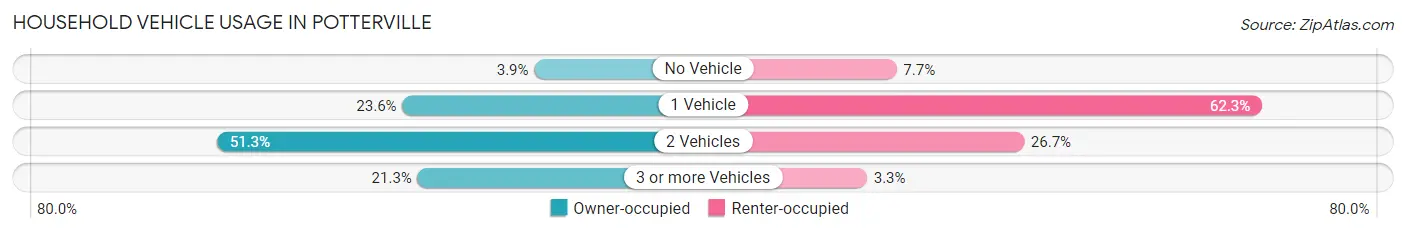
| Vehicles per Household | Owner-occupied | Renter-occupied |
| No Vehicle | 27 (3.9%) | 40 (7.7%) |
| 1 Vehicle | 165 (23.6%) | 324 (62.3%) |
| 2 Vehicles | 359 (51.3%) | 139 (26.7%) |
| 3 or more Vehicles | 149 (21.3%) | 17 (3.3%) |
| Total | 700 (100.0%) | 520 (100.0%) |
Real Estate & Mortgages in Potterville
Real Estate and Mortgage Overview in Potterville
| Characteristic | Without Mortgage | With Mortgage |
| Housing Units | 263 | 437 |
| Median Property Value | $104,500 | $124,000 |
| Median Household Income | $58,125 | $45 |
| Monthly Housing Costs | $552 | $0 |
| Real Estate Taxes | $1,759 | $56 |
Property Value by Mortgage Status in Potterville
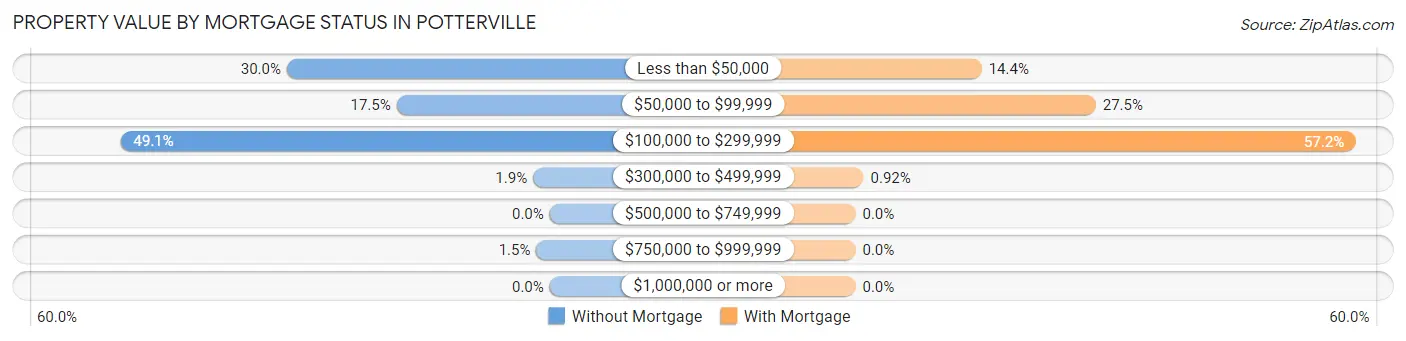
| Property Value | Without Mortgage | With Mortgage |
| Less than $50,000 | 79 (30.0%) | 63 (14.4%) |
| $50,000 to $99,999 | 46 (17.5%) | 120 (27.5%) |
| $100,000 to $299,999 | 129 (49.0%) | 250 (57.2%) |
| $300,000 to $499,999 | 5 (1.9%) | 4 (0.9%) |
| $500,000 to $749,999 | 0 (0.0%) | 0 (0.0%) |
| $750,000 to $999,999 | 4 (1.5%) | 0 (0.0%) |
| $1,000,000 or more | 0 (0.0%) | 0 (0.0%) |
| Total | 263 (100.0%) | 437 (100.0%) |
Household Income by Mortgage Status in Potterville
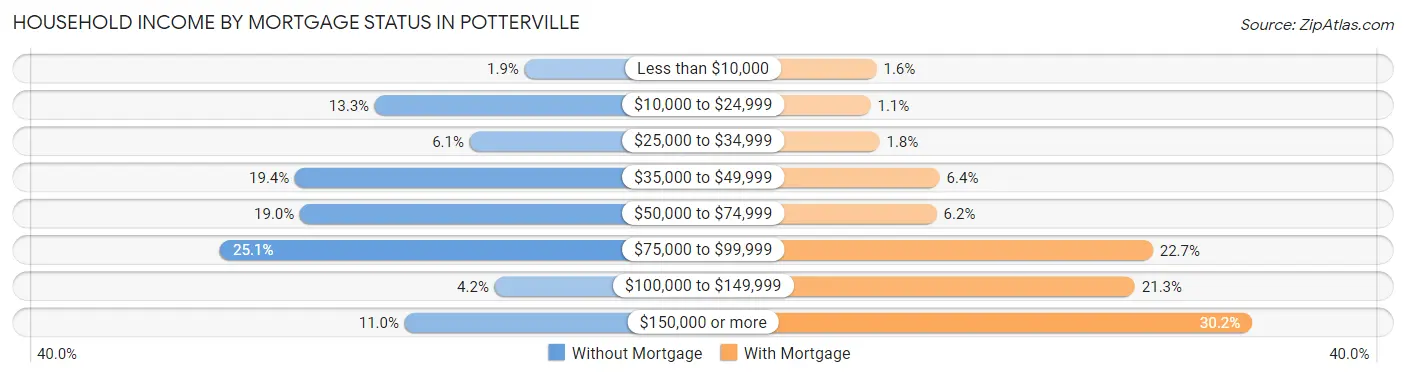
| Household Income | Without Mortgage | With Mortgage |
| Less than $10,000 | 5 (1.9%) | 7 (1.6%) |
| $10,000 to $24,999 | 35 (13.3%) | 5 (1.1%) |
| $25,000 to $34,999 | 16 (6.1%) | 8 (1.8%) |
| $35,000 to $49,999 | 51 (19.4%) | 28 (6.4%) |
| $50,000 to $74,999 | 50 (19.0%) | 27 (6.2%) |
| $75,000 to $99,999 | 66 (25.1%) | 99 (22.7%) |
| $100,000 to $149,999 | 11 (4.2%) | 93 (21.3%) |
| $150,000 or more | 29 (11.0%) | 132 (30.2%) |
| Total | 263 (100.0%) | 437 (100.0%) |
Property Value to Household Income Ratio in Potterville
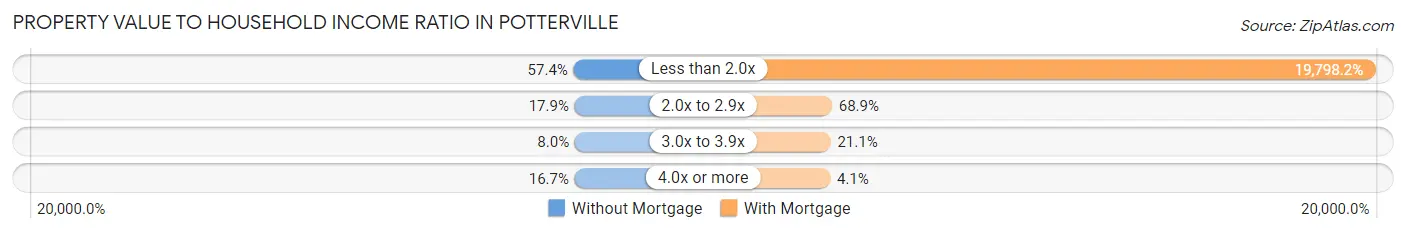
| Value-to-Income Ratio | Without Mortgage | With Mortgage |
| Less than 2.0x | 151 (57.4%) | 86,518 (19,798.2%) |
| 2.0x to 2.9x | 47 (17.9%) | 301 (68.9%) |
| 3.0x to 3.9x | 21 (8.0%) | 92 (21.0%) |
| 4.0x or more | 44 (16.7%) | 18 (4.1%) |
| Total | 263 (100.0%) | 437 (100.0%) |
Real Estate Taxes by Mortgage Status in Potterville
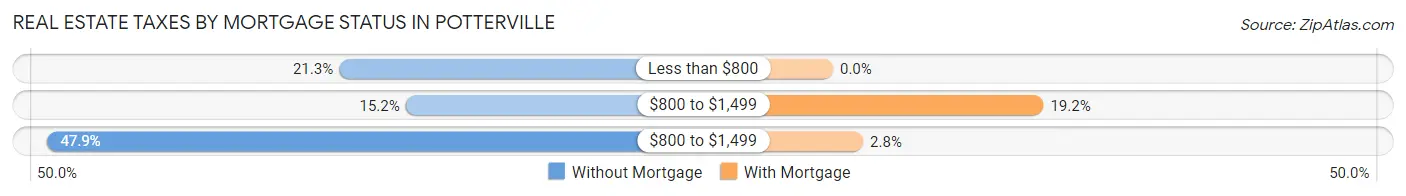
| Property Taxes | Without Mortgage | With Mortgage |
| Less than $800 | 56 (21.3%) | 0 (0.0%) |
| $800 to $1,499 | 40 (15.2%) | 84 (19.2%) |
| $800 to $1,499 | 126 (47.9%) | 12 (2.8%) |
| Total | 263 (100.0%) | 437 (100.0%) |
Health & Disability in Potterville
Health Insurance Coverage by Age in Potterville
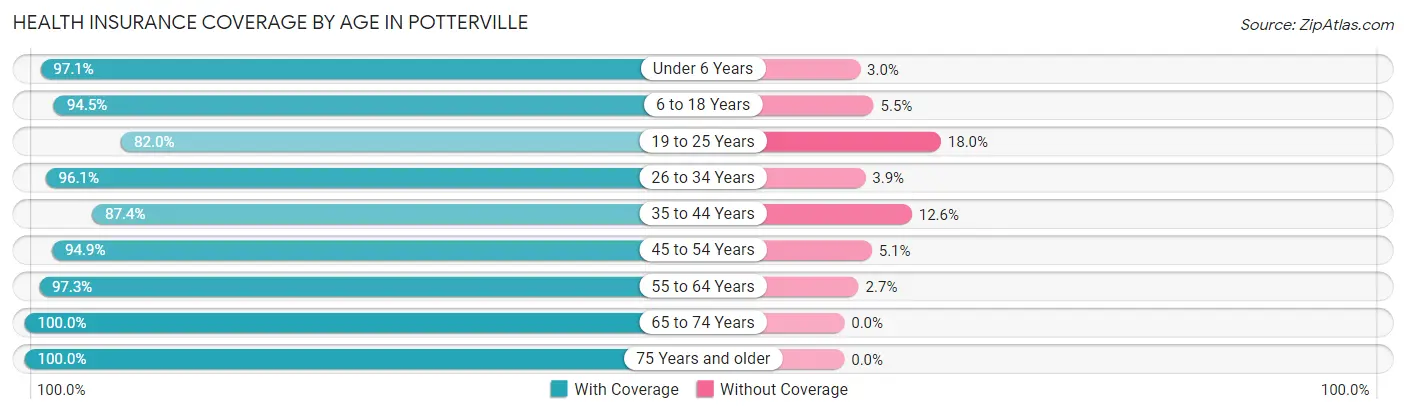
| Age Bracket | With Coverage | Without Coverage |
| Under 6 Years | 428 (97.1%) | 13 (2.9%) |
| 6 to 18 Years | 432 (94.5%) | 25 (5.5%) |
| 19 to 25 Years | 223 (82.0%) | 49 (18.0%) |
| 26 to 34 Years | 490 (96.1%) | 20 (3.9%) |
| 35 to 44 Years | 257 (87.4%) | 37 (12.6%) |
| 45 to 54 Years | 444 (94.9%) | 24 (5.1%) |
| 55 to 64 Years | 290 (97.3%) | 8 (2.7%) |
| 65 to 74 Years | 209 (100.0%) | 0 (0.0%) |
| 75 Years and older | 87 (100.0%) | 0 (0.0%) |
| Total | 2,860 (94.2%) | 176 (5.8%) |
Health Insurance Coverage by Citizenship Status in Potterville
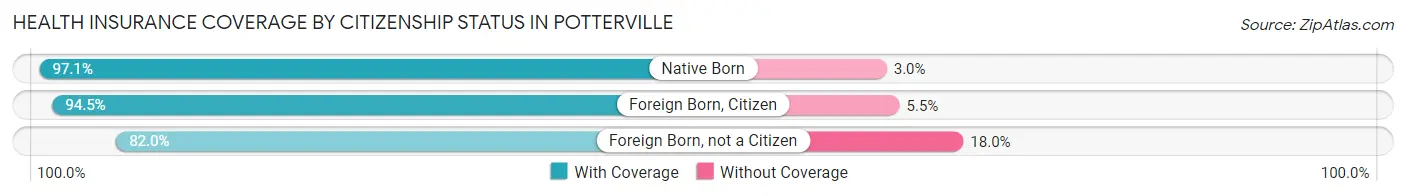
| Citizenship Status | With Coverage | Without Coverage |
| Native Born | 428 (97.1%) | 13 (2.9%) |
| Foreign Born, Citizen | 432 (94.5%) | 25 (5.5%) |
| Foreign Born, not a Citizen | 223 (82.0%) | 49 (18.0%) |
Health Insurance Coverage by Household Income in Potterville
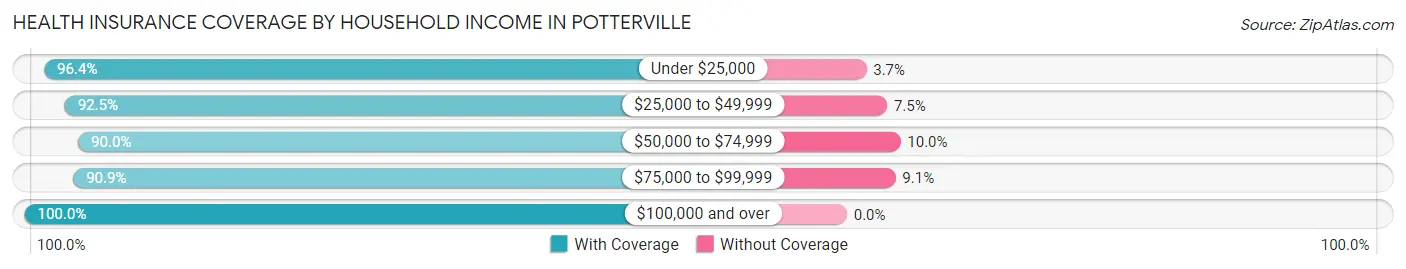
| Household Income | With Coverage | Without Coverage |
| Under $25,000 | 396 (96.4%) | 15 (3.6%) |
| $25,000 to $49,999 | 553 (92.5%) | 45 (7.5%) |
| $50,000 to $74,999 | 609 (90.0%) | 68 (10.0%) |
| $75,000 to $99,999 | 479 (90.9%) | 48 (9.1%) |
| $100,000 and over | 823 (100.0%) | 0 (0.0%) |
Public vs Private Health Insurance Coverage by Age in Potterville
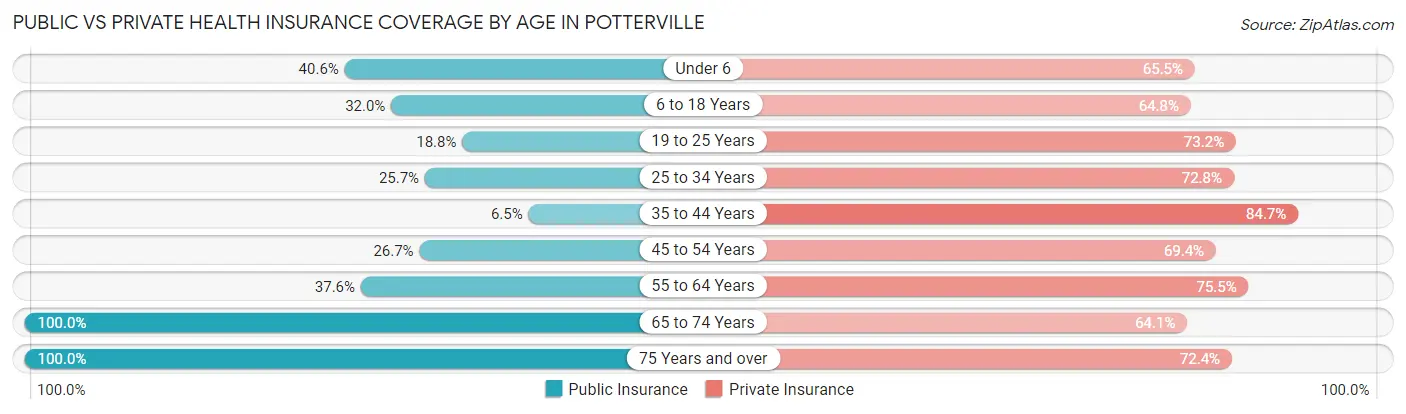
| Age Bracket | Public Insurance | Private Insurance |
| Under 6 | 179 (40.6%) | 289 (65.5%) |
| 6 to 18 Years | 146 (32.0%) | 296 (64.8%) |
| 19 to 25 Years | 51 (18.8%) | 199 (73.2%) |
| 25 to 34 Years | 131 (25.7%) | 371 (72.8%) |
| 35 to 44 Years | 19 (6.5%) | 249 (84.7%) |
| 45 to 54 Years | 125 (26.7%) | 325 (69.4%) |
| 55 to 64 Years | 112 (37.6%) | 225 (75.5%) |
| 65 to 74 Years | 209 (100.0%) | 134 (64.1%) |
| 75 Years and over | 87 (100.0%) | 63 (72.4%) |
| Total | 1,059 (34.9%) | 2,151 (70.9%) |
Disability Status by Sex by Age in Potterville
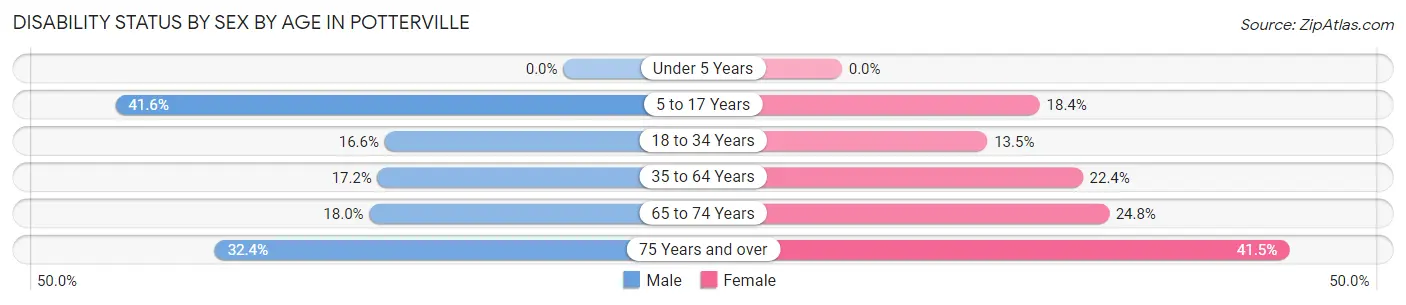
| Age Bracket | Male | Female |
| Under 5 Years | 0 (0.0%) | 0 (0.0%) |
| 5 to 17 Years | 128 (41.6%) | 38 (18.4%) |
| 18 to 34 Years | 59 (16.6%) | 61 (13.5%) |
| 35 to 64 Years | 77 (17.2%) | 137 (22.4%) |
| 65 to 74 Years | 18 (18.0%) | 27 (24.8%) |
| 75 Years and over | 11 (32.4%) | 22 (41.5%) |
Disability Class by Sex by Age in Potterville
Disability Class: Hearing Difficulty
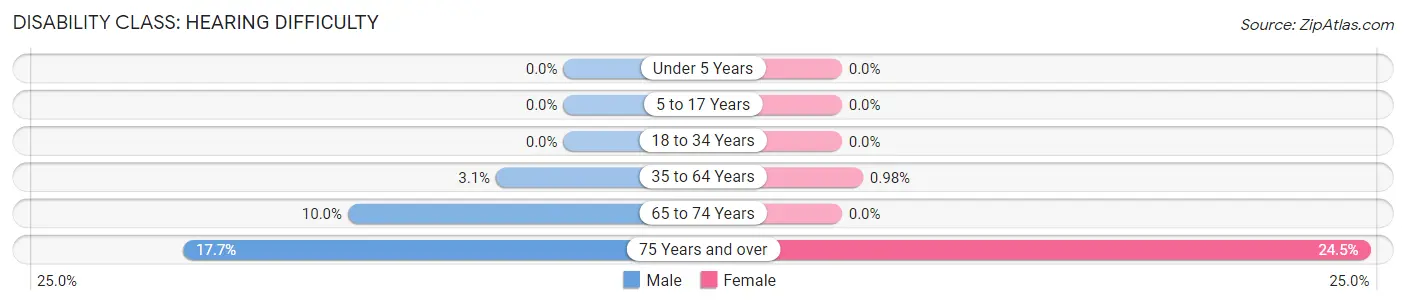
| Age Bracket | Male | Female |
| Under 5 Years | 0 (0.0%) | 0 (0.0%) |
| 5 to 17 Years | 0 (0.0%) | 0 (0.0%) |
| 18 to 34 Years | 0 (0.0%) | 0 (0.0%) |
| 35 to 64 Years | 14 (3.1%) | 6 (1.0%) |
| 65 to 74 Years | 10 (10.0%) | 0 (0.0%) |
| 75 Years and over | 6 (17.6%) | 13 (24.5%) |
Disability Class: Vision Difficulty
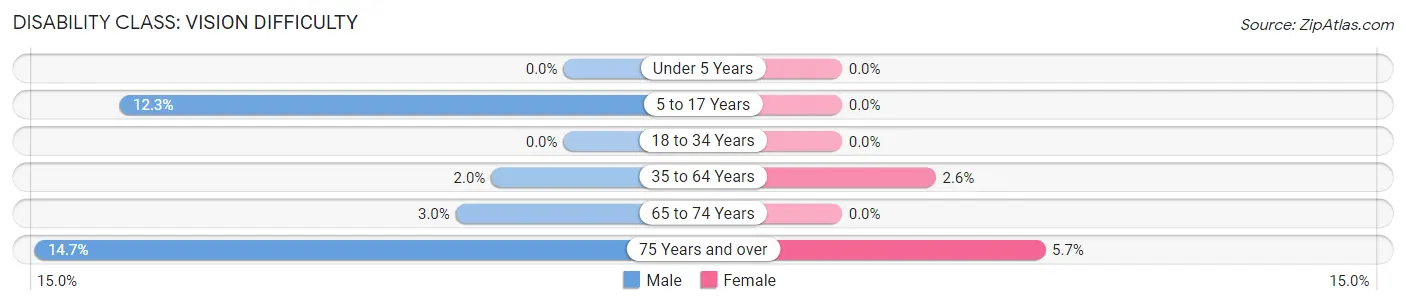
| Age Bracket | Male | Female |
| Under 5 Years | 0 (0.0%) | 0 (0.0%) |
| 5 to 17 Years | 38 (12.3%) | 0 (0.0%) |
| 18 to 34 Years | 0 (0.0%) | 0 (0.0%) |
| 35 to 64 Years | 9 (2.0%) | 16 (2.6%) |
| 65 to 74 Years | 3 (3.0%) | 0 (0.0%) |
| 75 Years and over | 5 (14.7%) | 3 (5.7%) |
Disability Class: Cognitive Difficulty
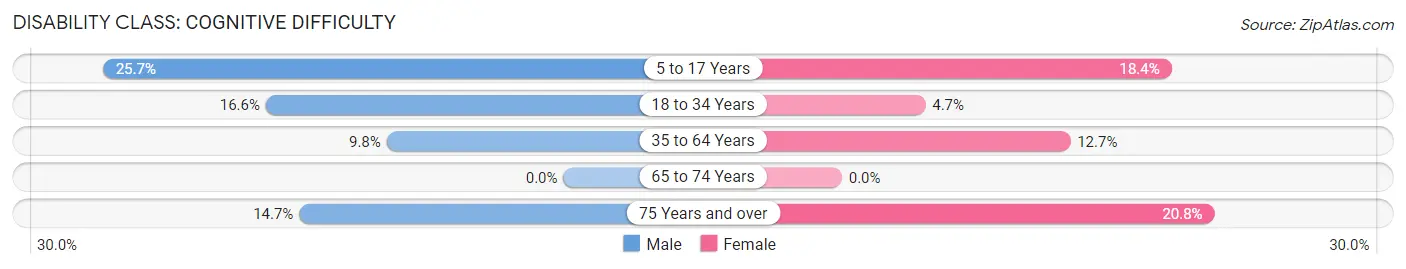
| Age Bracket | Male | Female |
| 5 to 17 Years | 79 (25.7%) | 38 (18.4%) |
| 18 to 34 Years | 59 (16.6%) | 21 (4.6%) |
| 35 to 64 Years | 44 (9.8%) | 78 (12.7%) |
| 65 to 74 Years | 0 (0.0%) | 0 (0.0%) |
| 75 Years and over | 5 (14.7%) | 11 (20.7%) |
Disability Class: Ambulatory Difficulty
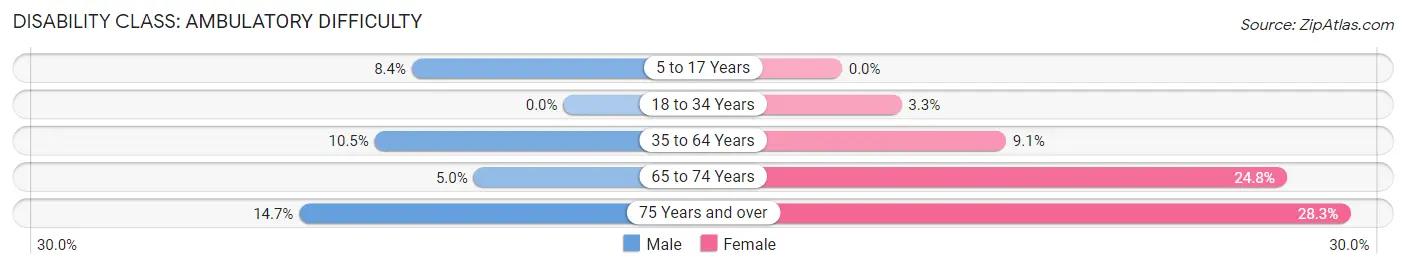
| Age Bracket | Male | Female |
| 5 to 17 Years | 26 (8.4%) | 0 (0.0%) |
| 18 to 34 Years | 0 (0.0%) | 15 (3.3%) |
| 35 to 64 Years | 47 (10.5%) | 56 (9.1%) |
| 65 to 74 Years | 5 (5.0%) | 27 (24.8%) |
| 75 Years and over | 5 (14.7%) | 15 (28.3%) |
Disability Class: Self-Care Difficulty
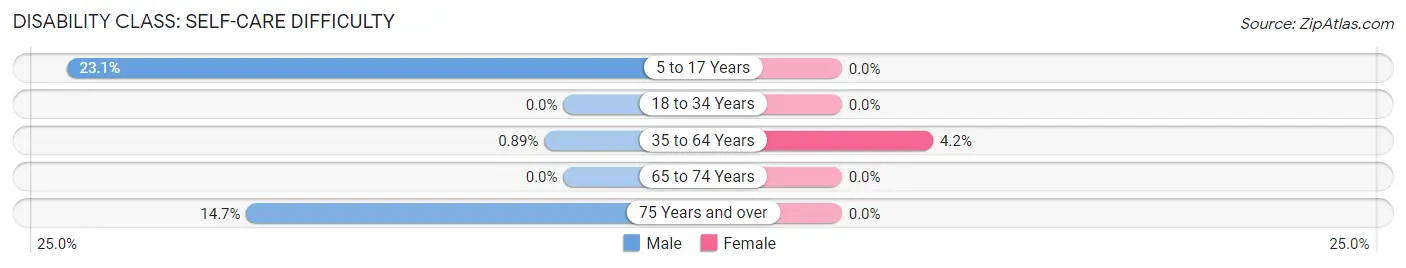
| Age Bracket | Male | Female |
| 5 to 17 Years | 71 (23.1%) | 0 (0.0%) |
| 18 to 34 Years | 0 (0.0%) | 0 (0.0%) |
| 35 to 64 Years | 4 (0.9%) | 26 (4.2%) |
| 65 to 74 Years | 0 (0.0%) | 0 (0.0%) |
| 75 Years and over | 5 (14.7%) | 0 (0.0%) |
Technology Access in Potterville
Computing Device Access in Potterville
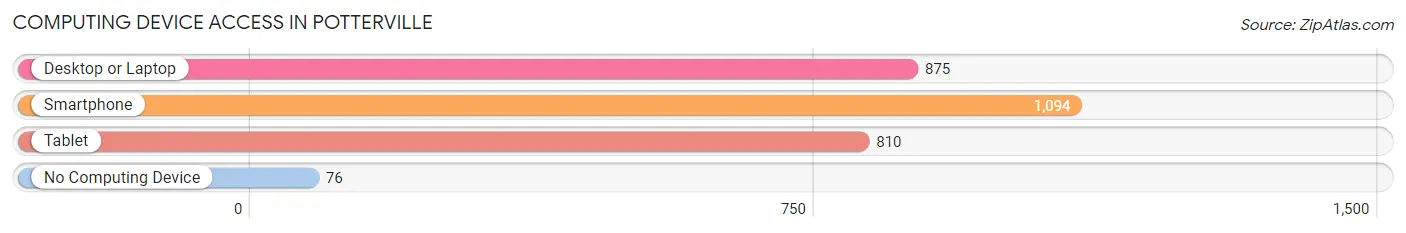
| Device Type | # Households | % Households |
| Desktop or Laptop | 875 | 71.7% |
| Smartphone | 1,094 | 89.7% |
| Tablet | 810 | 66.4% |
| No Computing Device | 76 | 6.2% |
| Total | 1,220 | 100.0% |
Internet Access in Potterville
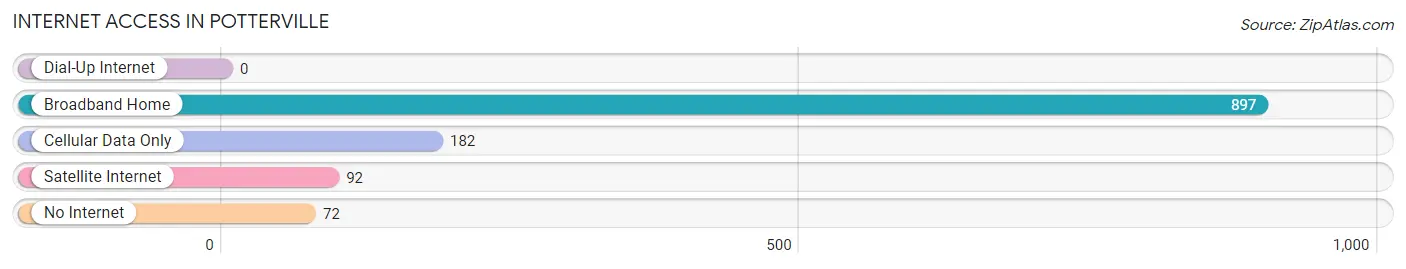
| Internet Type | # Households | % Households |
| Dial-Up Internet | 0 | 0.0% |
| Broadband Home | 897 | 73.5% |
| Cellular Data Only | 182 | 14.9% |
| Satellite Internet | 92 | 7.5% |
| No Internet | 72 | 5.9% |
| Total | 1,220 | 100.0% |
Potterville Summary
Potterville, Michigan is a small city located in Eaton County, Michigan. It is situated on the Grand River, approximately 10 miles east of Lansing, the state capital. The city has a population of approximately 2,500 people and covers an area of 1.3 square miles.
History
Potterville was founded in 1836 by William Potter, a settler from New York. Potter purchased the land from the federal government and began to develop the area. He built a sawmill and a gristmill, and the area quickly grew. Potterville was incorporated as a village in 1867 and as a city in 1871.
In the late 19th century, Potterville was a thriving agricultural community. It was known for its production of apples, peaches, and other fruits. The city also had a thriving lumber industry, with several sawmills located in the area.
In the early 20th century, Potterville began to experience a decline in its agricultural and lumber industries. The city was hit hard by the Great Depression, and many of its residents moved away in search of work.
Geography
Potterville is located in the central part of Michigan, in Eaton County. It is situated on the Grand River, approximately 10 miles east of Lansing, the state capital. The city has a total area of 1.3 square miles, all of which is land.
The terrain of Potterville is mostly flat, with some rolling hills in the northern part of the city. The city is located in a temperate climate zone, with hot summers and cold winters.
Economy
The economy of Potterville is largely based on agriculture and manufacturing. The city is home to several farms, which produce a variety of crops, including apples, peaches, and other fruits. Potterville also has several manufacturing plants, which produce a variety of products, including automotive parts and furniture.
The city also has a thriving tourism industry. Potterville is home to several historic sites, including the Potterville Historical Museum and the Potterville Opera House. The city also has several parks and recreational areas, including the Potterville State Park.
Demographics
As of the 2010 census, Potterville had a population of 2,500 people. The racial makeup of the city was 94.2% White, 1.2% African American, 0.4% Native American, 0.8% Asian, 0.1% Pacific Islander, and 2.3% from other races. Hispanic or Latino of any race were 3.2% of the population.
The median household income in Potterville was $41,250, and the median family income was $50,000. The per capita income was $20,000. About 11.2% of the population was below the poverty line.
Potterville is served by the Potterville Public Schools, which includes one elementary school, one middle school, and one high school. The city also has several private schools, including Potterville Christian Academy and Potterville Montessori School.
Common Questions
What is Per Capita Income in Potterville?
Per Capita income in Potterville is $26,463.
What is the Median Family Income in Potterville?
Median Family Income in Potterville is $71,645.
What is the Median Household income in Potterville?
Median Household Income in Potterville is $59,250.
What is Income or Wage Gap in Potterville?
Income or Wage Gap in Potterville is 22.6%.
Women in Potterville earn 77.4 cents for every dollar earned by a man.
What is Inequality or Gini Index in Potterville?
Inequality or Gini Index in Potterville is 0.39.
What is the Total Population of Potterville?
Total Population of Potterville is 3,036.
What is the Total Male Population of Potterville?
Total Male Population of Potterville is 1,371.
What is the Total Female Population of Potterville?
Total Female Population of Potterville is 1,665.
What is the Ratio of Males per 100 Females in Potterville?
There are 82.34 Males per 100 Females in Potterville.
What is the Ratio of Females per 100 Males in Potterville?
There are 121.44 Females per 100 Males in Potterville.
What is the Median Population Age in Potterville?
Median Population Age in Potterville is 32.0 Years.
What is the Average Family Size in Potterville
Average Family Size in Potterville is 3.0 People.
What is the Average Household Size in Potterville
Average Household Size in Potterville is 2.5 People.
How Large is the Labor Force in Potterville?
There are 1,463 People in the Labor Forcein in Potterville.
What is the Percentage of People in the Labor Force in Potterville?
65.8% of People are in the Labor Force in Potterville.
What is the Unemployment Rate in Potterville?
Unemployment Rate in Potterville is 2.9%.