Howard City, MI Map & Demographics
Howard City Map
Howard City Overview
$24,644
PER CAPITA INCOME
$57,857
AVG FAMILY INCOME
$52,009
AVG HOUSEHOLD INCOME
4.7%
WAGE / INCOME GAP [ % ]
95.3¢/ $1
WAGE / INCOME GAP [ $ ]
$12,144
FAMILY INCOME DEFICIT
0.40
INEQUALITY / GINI INDEX
1,836
TOTAL POPULATION
963
MALE POPULATION
873
FEMALE POPULATION
110.31
MALES / 100 FEMALES
90.65
FEMALES / 100 MALES
31.3
MEDIAN AGE
3.2
AVG FAMILY SIZE
2.6
AVG HOUSEHOLD SIZE
866
LABOR FORCE [ PEOPLE ]
64.8%
PERCENT IN LABOR FORCE
1.5%
UNEMPLOYMENT RATE
Howard City Zip Codes
Howard City Area Codes
Income in Howard City
Income Overview in Howard City
Per Capita Income in Howard City is $24,644, while median incomes of families and households are $57,857 and $52,009 respectively.
| Characteristic | Number | Measure |
| Per Capita Income | 1,836 | $24,644 |
| Median Family Income | 420 | $57,857 |
| Mean Family Income | 420 | $70,963 |
| Median Household Income | 705 | $52,009 |
| Mean Household Income | 705 | $60,636 |
| Income Deficit | 420 | $12,144 |
| Wage / Income Gap (%) | 1,836 | 4.73% |
| Wage / Income Gap ($) | 1,836 | 95.27¢ per $1 |
| Gini / Inequality Index | 1,836 | 0.40 |
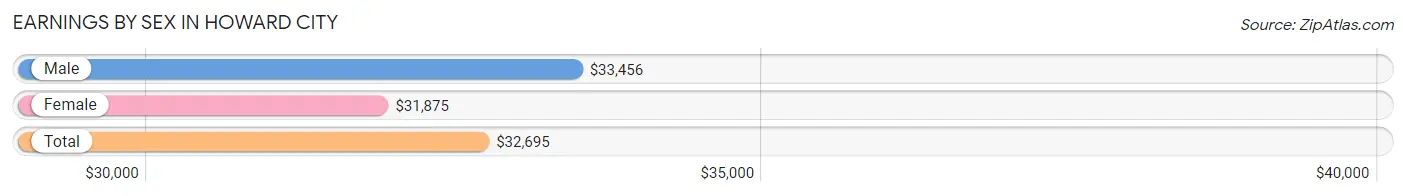
Earnings by Sex in Howard City
Average Earnings in Howard City are $32,695, $33,456 for men and $31,875 for women, a difference of 4.7%.
| Sex | Number | Average Earnings |
| Male | 507 (56.6%) | $33,456 |
| Female | 389 (43.4%) | $31,875 |
| Total | 896 (100.0%) | $32,695 |
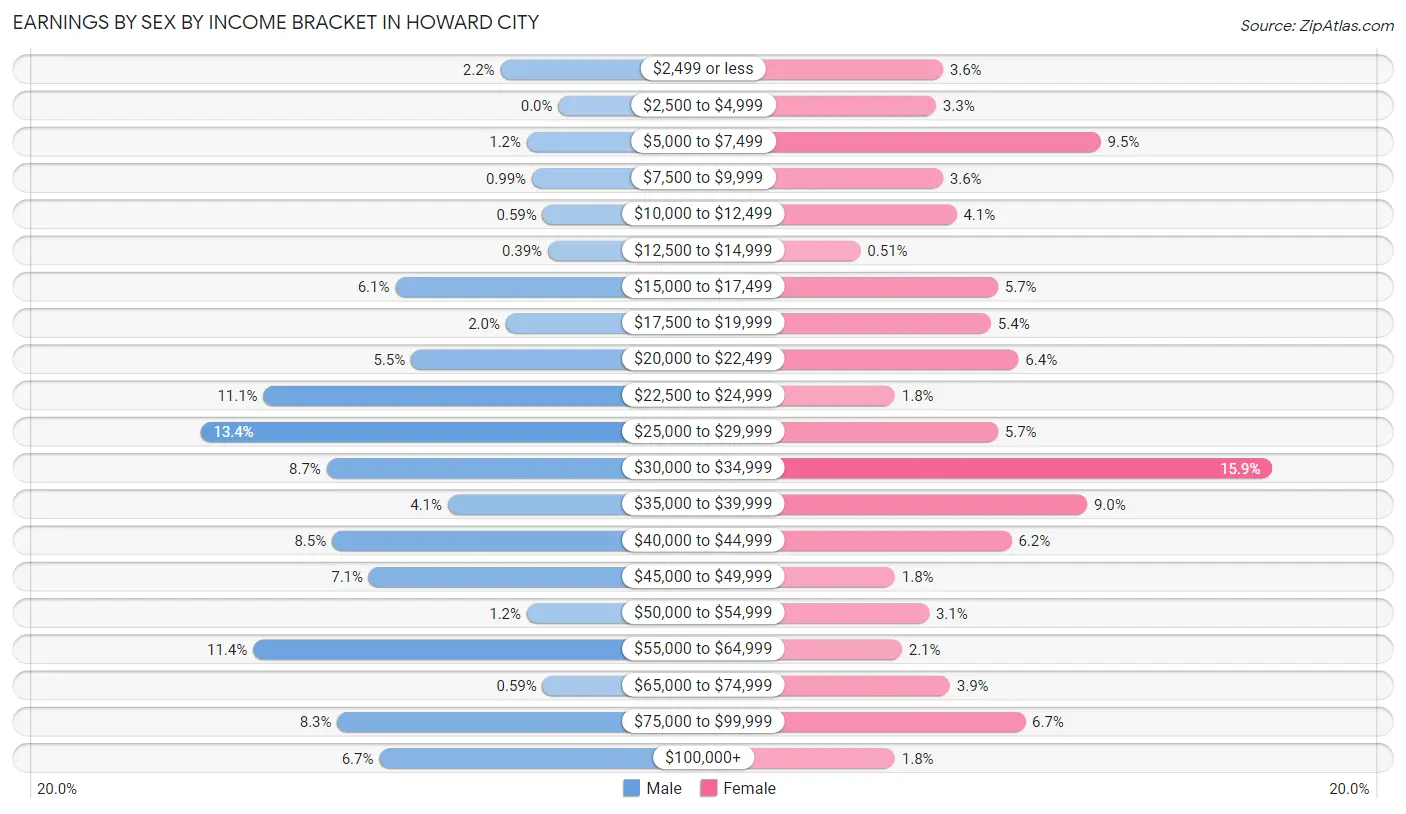
Earnings by Sex by Income Bracket in Howard City
The most common earnings brackets in Howard City are $25,000 to $29,999 for men (68 | 13.4%) and $30,000 to $34,999 for women (62 | 15.9%).
| Income | Male | Female |
| $2,499 or less | 11 (2.2%) | 14 (3.6%) |
| $2,500 to $4,999 | 0 (0.0%) | 13 (3.3%) |
| $5,000 to $7,499 | 6 (1.2%) | 37 (9.5%) |
| $7,500 to $9,999 | 5 (1.0%) | 14 (3.6%) |
| $10,000 to $12,499 | 3 (0.6%) | 16 (4.1%) |
| $12,500 to $14,999 | 2 (0.4%) | 2 (0.5%) |
| $15,000 to $17,499 | 31 (6.1%) | 22 (5.7%) |
| $17,500 to $19,999 | 10 (2.0%) | 21 (5.4%) |
| $20,000 to $22,499 | 28 (5.5%) | 25 (6.4%) |
| $22,500 to $24,999 | 56 (11.1%) | 7 (1.8%) |
| $25,000 to $29,999 | 68 (13.4%) | 22 (5.7%) |
| $30,000 to $34,999 | 44 (8.7%) | 62 (15.9%) |
| $35,000 to $39,999 | 21 (4.1%) | 35 (9.0%) |
| $40,000 to $44,999 | 43 (8.5%) | 24 (6.2%) |
| $45,000 to $49,999 | 36 (7.1%) | 7 (1.8%) |
| $50,000 to $54,999 | 6 (1.2%) | 12 (3.1%) |
| $55,000 to $64,999 | 58 (11.4%) | 8 (2.1%) |
| $65,000 to $74,999 | 3 (0.6%) | 15 (3.9%) |
| $75,000 to $99,999 | 42 (8.3%) | 26 (6.7%) |
| $100,000+ | 34 (6.7%) | 7 (1.8%) |
| Total | 507 (100.0%) | 389 (100.0%) |
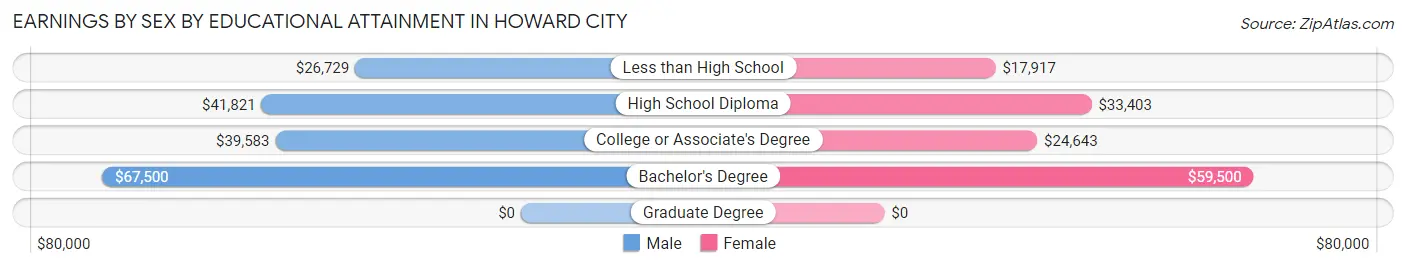
Earnings by Sex by Educational Attainment in Howard City
Average earnings in Howard City are $40,281 for men and $33,021 for women, a difference of 18.0%. Men with an educational attainment of bachelor's degree enjoy the highest average annual earnings of $67,500, while those with less than high school education earn the least with $26,729. Women with an educational attainment of bachelor's degree earn the most with the average annual earnings of $59,500, while those with less than high school education have the smallest earnings of $17,917.
| Educational Attainment | Male Income | Female Income |
| Less than High School | $26,729 | $17,917 |
| High School Diploma | $41,821 | $33,403 |
| College or Associate's Degree | $39,583 | $24,643 |
| Bachelor's Degree | $67,500 | $59,500 |
| Graduate Degree | - | - |
| Total | $40,281 | $33,021 |
Family Income in Howard City
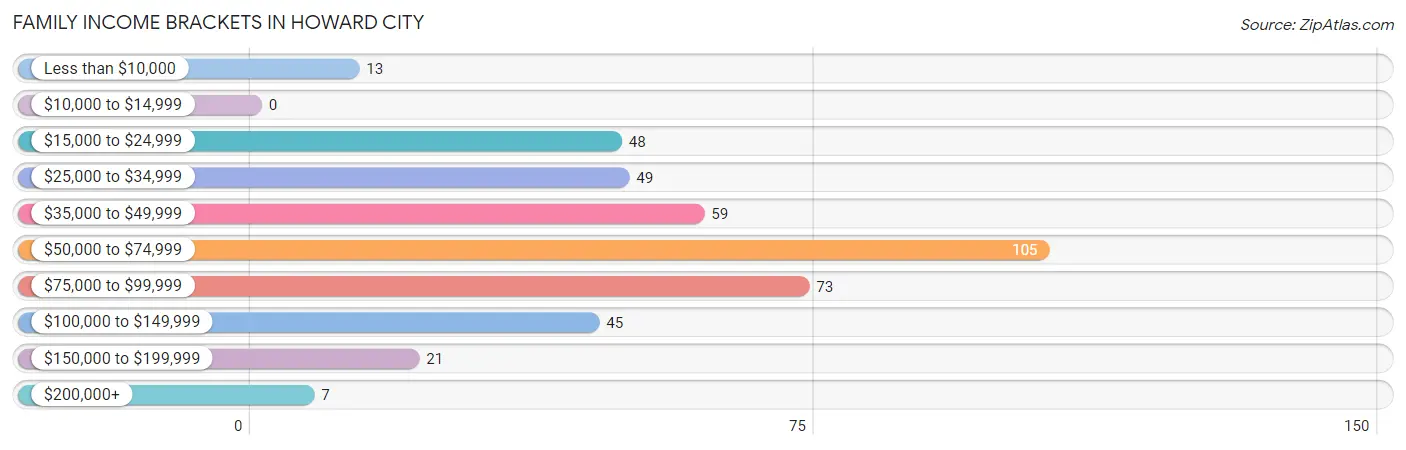
Family Income Brackets in Howard City
According to the Howard City family income data, there are 105 families falling into the $50,000 to $74,999 income range, which is the most common income bracket and makes up 25.0% of all families.
| Income Bracket | # Families | % Families |
| Less than $10,000 | 13 | 3.1% |
| $10,000 to $14,999 | 0 | 0.0% |
| $15,000 to $24,999 | 48 | 11.4% |
| $25,000 to $34,999 | 49 | 11.7% |
| $35,000 to $49,999 | 59 | 14.0% |
| $50,000 to $74,999 | 105 | 25.0% |
| $75,000 to $99,999 | 73 | 17.4% |
| $100,000 to $149,999 | 45 | 10.7% |
| $150,000 to $199,999 | 21 | 5.0% |
| $200,000+ | 7 | 1.7% |
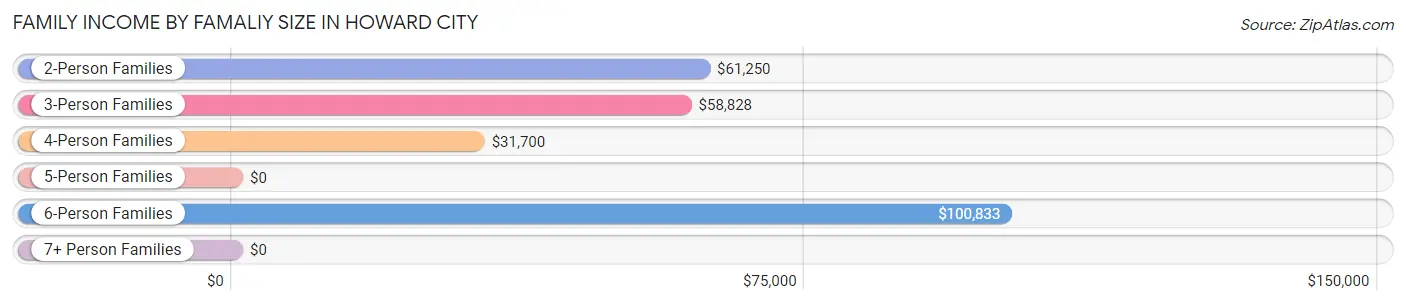
Family Income by Famaliy Size in Howard City
6-person families (8 | 1.9%) account for the highest median family income in Howard City with $100,833 per family, while 2-person families (174 | 41.4%) have the highest median income of $30,625 per family member.
| Income Bracket | # Families | Median Income |
| 2-Person Families | 174 (41.4%) | $61,250 |
| 3-Person Families | 123 (29.3%) | $58,828 |
| 4-Person Families | 86 (20.5%) | $31,700 |
| 5-Person Families | 21 (5.0%) | $0 |
| 6-Person Families | 8 (1.9%) | $100,833 |
| 7+ Person Families | 8 (1.9%) | $0 |
| Total | 420 (100.0%) | $57,857 |
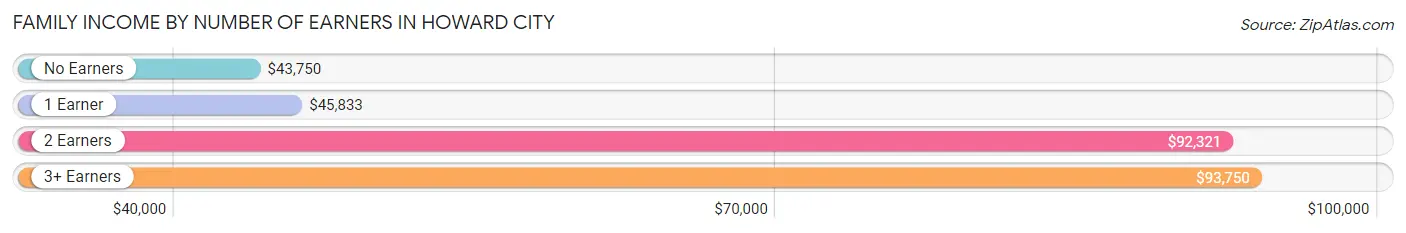
Family Income by Number of Earners in Howard City
The median family income in Howard City is $57,857, with families comprising 3+ earners (45) having the highest median family income of $93,750, while families with no earners (42) have the lowest median family income of $43,750, accounting for 10.7% and 10.0% of families, respectively.
| Number of Earners | # Families | Median Income |
| No Earners | 42 (10.0%) | $43,750 |
| 1 Earner | 224 (53.3%) | $45,833 |
| 2 Earners | 109 (26.0%) | $92,321 |
| 3+ Earners | 45 (10.7%) | $93,750 |
| Total | 420 (100.0%) | $57,857 |
Household Income in Howard City
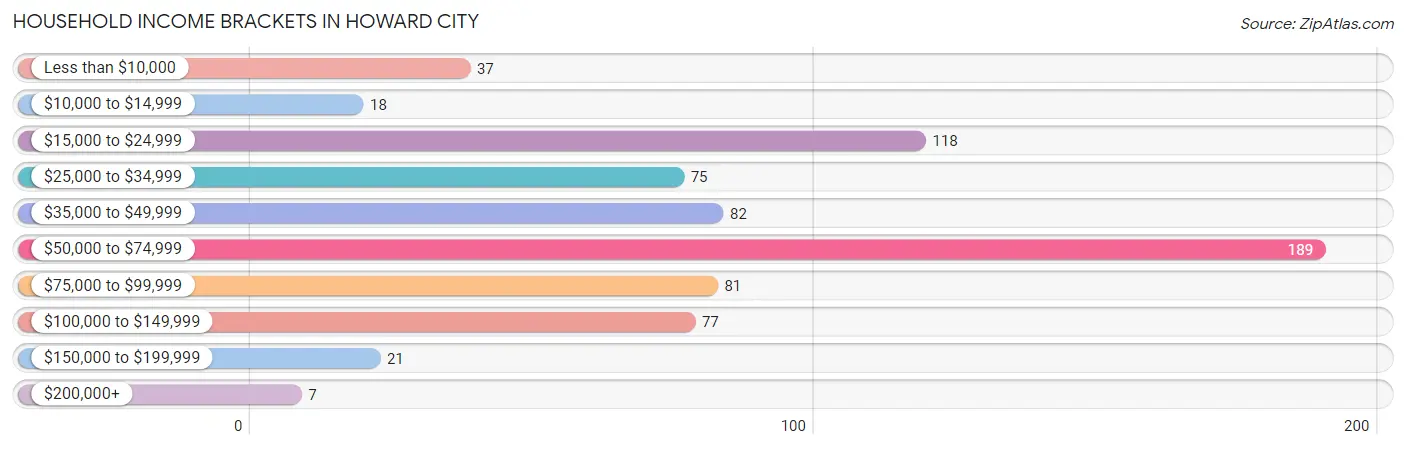
Household Income Brackets in Howard City
With 189 households falling in the category, the $50,000 to $74,999 income range is the most frequent in Howard City, accounting for 26.8% of all households. In contrast, only 7 households (1.0%) fall into the $200,000+ income bracket, making it the least populous group.
| Income Bracket | # Households | % Households |
| Less than $10,000 | 37 | 5.2% |
| $10,000 to $14,999 | 18 | 2.6% |
| $15,000 to $24,999 | 118 | 16.7% |
| $25,000 to $34,999 | 75 | 10.6% |
| $35,000 to $49,999 | 82 | 11.6% |
| $50,000 to $74,999 | 189 | 26.8% |
| $75,000 to $99,999 | 81 | 11.5% |
| $100,000 to $149,999 | 77 | 10.9% |
| $150,000 to $199,999 | 21 | 3.0% |
| $200,000+ | 7 | 1.0% |
Household Income by Householder Age in Howard City
The median household income in Howard City is $52,009, with the highest median household income of $58,293 found in the 25 to 44 years age bracket for the primary householder. A total of 344 households (48.8%) fall into this category. Meanwhile, the 15 to 24 years age bracket for the primary householder has the lowest median household income of $22,083, with 25 households (3.5%) in this group.
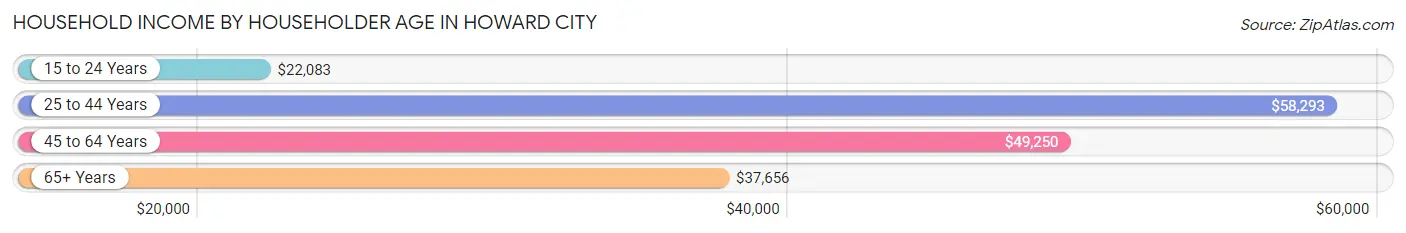
| Income Bracket | # Households | Median Income |
| 15 to 24 Years | 25 (3.5%) | $22,083 |
| 25 to 44 Years | 344 (48.8%) | $58,293 |
| 45 to 64 Years | 185 (26.2%) | $49,250 |
| 65+ Years | 151 (21.4%) | $37,656 |
| Total | 705 (100.0%) | $52,009 |
Poverty in Howard City
Income Below Poverty by Sex and Age in Howard City
With 11.7% poverty level for males and 25.2% for females among the residents of Howard City, 16 and 17 year old males and under 5 year old females are the most vulnerable to poverty, with 5 males (45.5%) and 55 females (79.7%) in their respective age groups living below the poverty level.
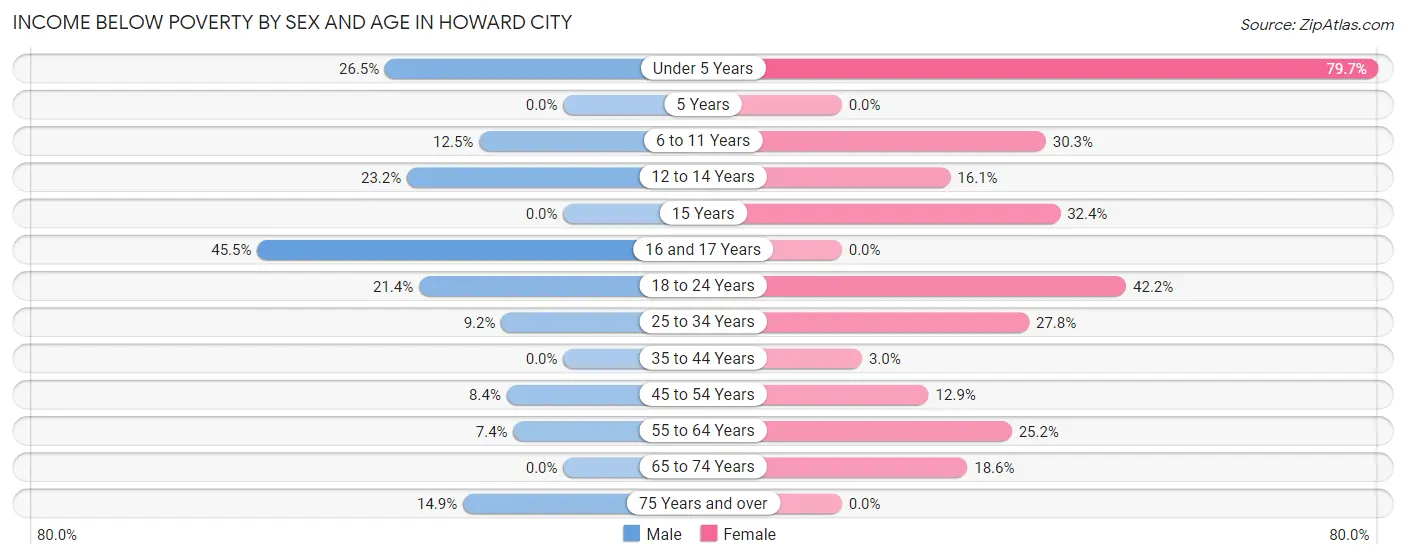
| Age Bracket | Male | Female |
| Under 5 Years | 27 (26.5%) | 55 (79.7%) |
| 5 Years | 0 (0.0%) | 0 (0.0%) |
| 6 to 11 Years | 10 (12.5%) | 30 (30.3%) |
| 12 to 14 Years | 13 (23.2%) | 5 (16.1%) |
| 15 Years | 0 (0.0%) | 12 (32.4%) |
| 16 and 17 Years | 5 (45.5%) | 0 (0.0%) |
| 18 to 24 Years | 15 (21.4%) | 19 (42.2%) |
| 25 to 34 Years | 21 (9.2%) | 47 (27.8%) |
| 35 to 44 Years | 0 (0.0%) | 3 (3.0%) |
| 45 to 54 Years | 9 (8.4%) | 8 (12.9%) |
| 55 to 64 Years | 6 (7.4%) | 27 (25.2%) |
| 65 to 74 Years | 0 (0.0%) | 11 (18.6%) |
| 75 Years and over | 7 (14.9%) | 0 (0.0%) |
| Total | 113 (11.7%) | 217 (25.2%) |
Income Above Poverty by Sex and Age in Howard City
According to the poverty statistics in Howard City, males aged 15 years and females aged 5 years are the age groups that are most secure financially, with 100.0% of males and 100.0% of females in these age groups living above the poverty line.
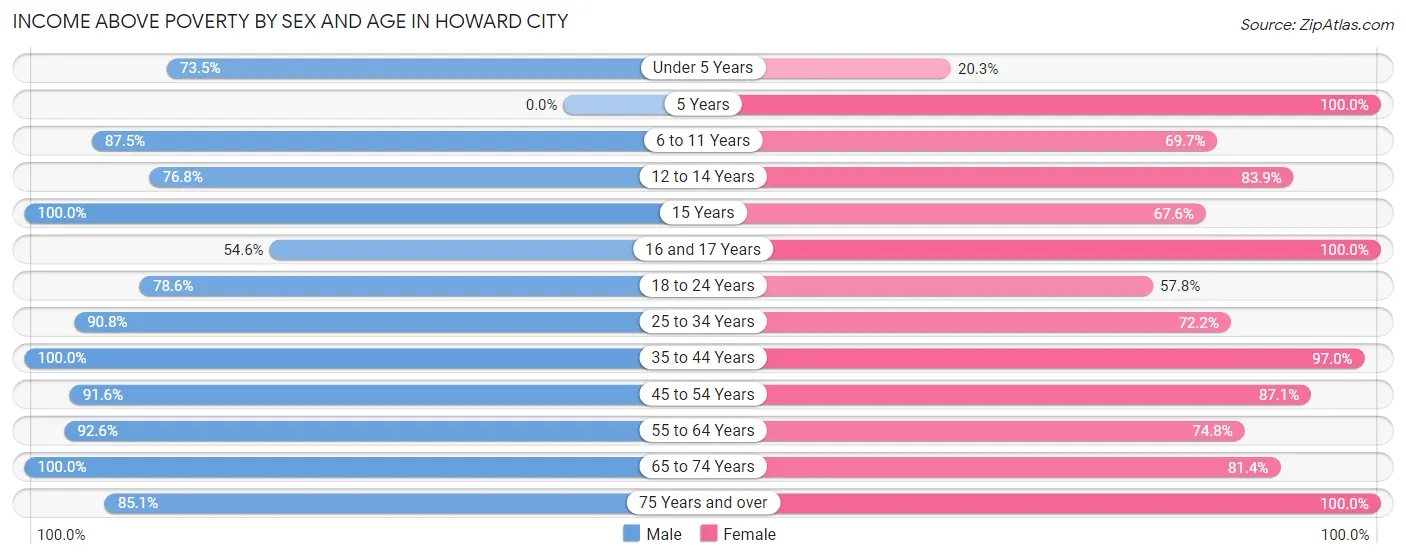
| Age Bracket | Male | Female |
| Under 5 Years | 75 (73.5%) | 14 (20.3%) |
| 5 Years | 0 (0.0%) | 6 (100.0%) |
| 6 to 11 Years | 70 (87.5%) | 69 (69.7%) |
| 12 to 14 Years | 43 (76.8%) | 26 (83.9%) |
| 15 Years | 8 (100.0%) | 25 (67.6%) |
| 16 and 17 Years | 6 (54.5%) | 15 (100.0%) |
| 18 to 24 Years | 55 (78.6%) | 26 (57.8%) |
| 25 to 34 Years | 207 (90.8%) | 122 (72.2%) |
| 35 to 44 Years | 125 (100.0%) | 97 (97.0%) |
| 45 to 54 Years | 98 (91.6%) | 54 (87.1%) |
| 55 to 64 Years | 75 (92.6%) | 80 (74.8%) |
| 65 to 74 Years | 48 (100.0%) | 48 (81.4%) |
| 75 Years and over | 40 (85.1%) | 62 (100.0%) |
| Total | 850 (88.3%) | 644 (74.8%) |
Income Below Poverty Among Married-Couple Families in Howard City
The poverty statistics for married-couple families in Howard City show that 12.6% or 34 of the total 270 families live below the poverty line. Families with 5 or more children have the highest poverty rate of 100.0%, comprising of 8 families. On the other hand, families with no children have the lowest poverty rate of 0.0%, which includes 0 families.
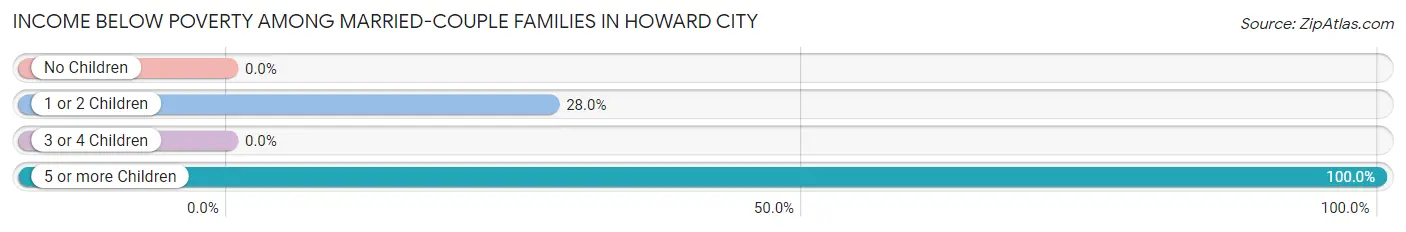
| Children | Above Poverty | Below Poverty |
| No Children | 152 (100.0%) | 0 (0.0%) |
| 1 or 2 Children | 67 (72.0%) | 26 (28.0%) |
| 3 or 4 Children | 17 (100.0%) | 0 (0.0%) |
| 5 or more Children | 0 (0.0%) | 8 (100.0%) |
| Total | 236 (87.4%) | 34 (12.6%) |
Income Below Poverty Among Single-Parent Households in Howard City
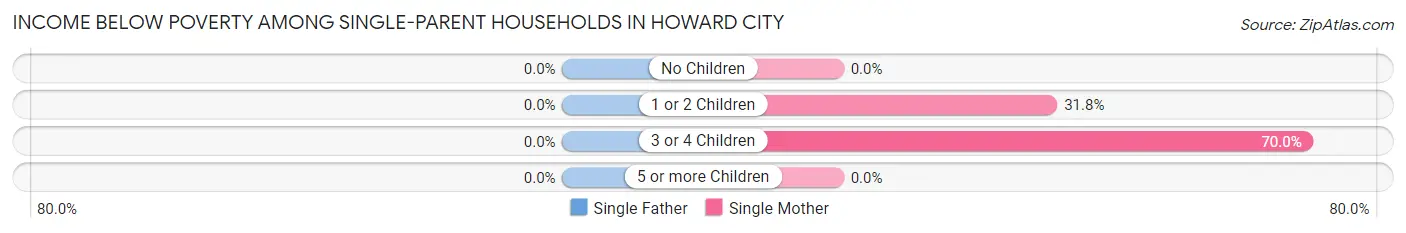
| Children | Single Father | Single Mother |
| No Children | 0 (0.0%) | 0 (0.0%) |
| 1 or 2 Children | 0 (0.0%) | 14 (31.8%) |
| 3 or 4 Children | 0 (0.0%) | 7 (70.0%) |
| 5 or more Children | 0 (0.0%) | 0 (0.0%) |
| Total | 0 (0.0%) | 21 (25.3%) |
Income Below Poverty Among Married-Couple vs Single-Parent Households in Howard City
The poverty data for Howard City shows that 34 of the married-couple family households (12.6%) and 21 of the single-parent households (14.0%) are living below the poverty level. Within the married-couple family households, those with 5 or more children have the highest poverty rate, with 8 households (100.0%) falling below the poverty line. Among the single-parent households, those with 3 or 4 children have the highest poverty rate, with 7 household (70.0%) living below poverty.
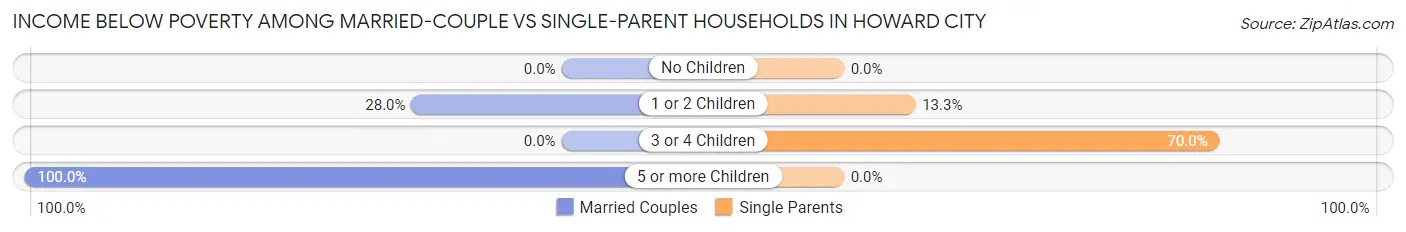
| Children | Married-Couple Families | Single-Parent Households |
| No Children | 0 (0.0%) | 0 (0.0%) |
| 1 or 2 Children | 26 (28.0%) | 14 (13.3%) |
| 3 or 4 Children | 0 (0.0%) | 7 (70.0%) |
| 5 or more Children | 8 (100.0%) | 0 (0.0%) |
| Total | 34 (12.6%) | 21 (14.0%) |
Race in Howard City
The most populous races in Howard City are White / Caucasian (1,740 | 94.8%), Hispanic or Latino (97 | 5.3%), and Two or more Races (93 | 5.1%).
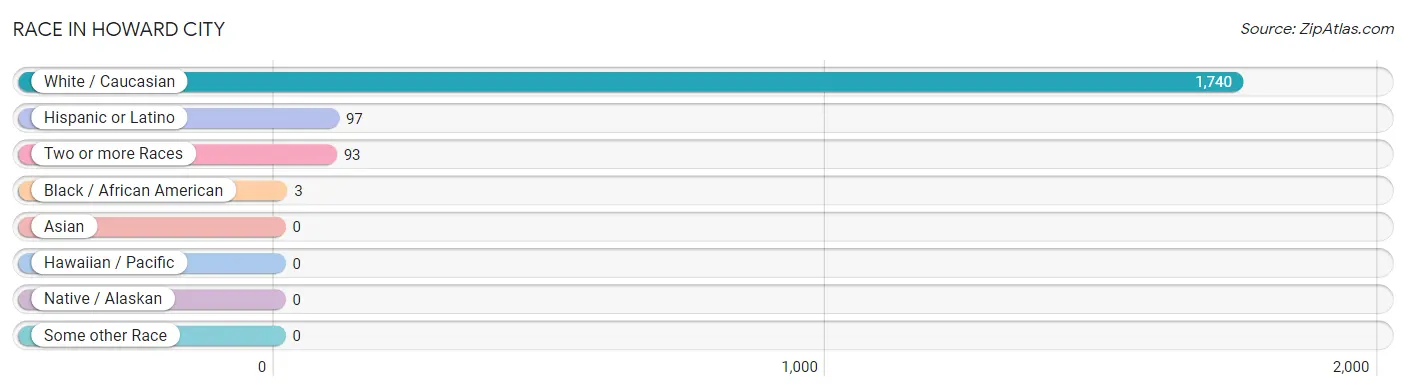
| Race | # Population | % Population |
| Asian | 0 | 0.0% |
| Black / African American | 3 | 0.2% |
| Hawaiian / Pacific | 0 | 0.0% |
| Hispanic or Latino | 97 | 5.3% |
| Native / Alaskan | 0 | 0.0% |
| White / Caucasian | 1,740 | 94.8% |
| Two or more Races | 93 | 5.1% |
| Some other Race | 0 | 0.0% |
| Total | 1,836 | 100.0% |
Ancestry in Howard City
The most populous ancestries reported in Howard City are German (350 | 19.1%), English (291 | 15.9%), Irish (199 | 10.8%), Dutch (158 | 8.6%), and American (128 | 7.0%), together accounting for 61.3% of all Howard City residents.
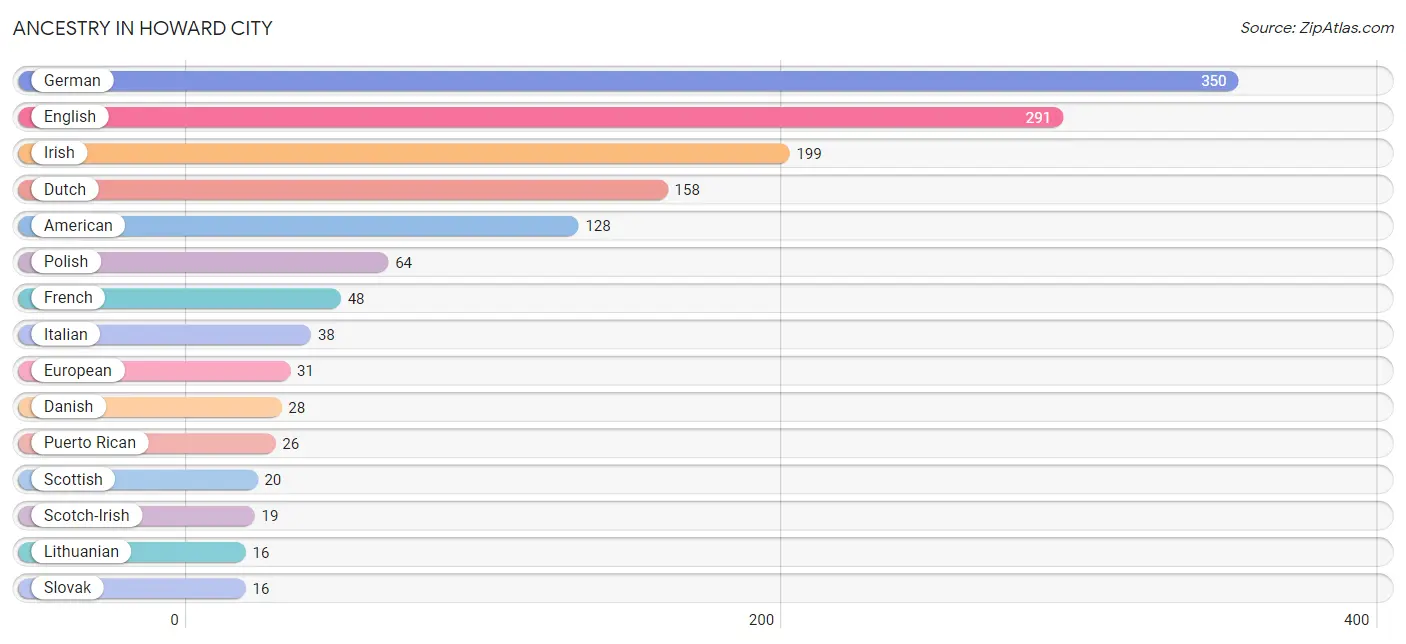
| Ancestry | # Population | % Population |
| American | 128 | 7.0% |
| Arab | 3 | 0.2% |
| Austrian | 3 | 0.2% |
| Belgian | 1 | 0.1% |
| Canadian | 7 | 0.4% |
| Cherokee | 3 | 0.2% |
| Chippewa | 12 | 0.6% |
| Danish | 28 | 1.5% |
| Dutch | 158 | 8.6% |
| English | 291 | 15.9% |
| European | 31 | 1.7% |
| Finnish | 3 | 0.2% |
| French | 48 | 2.6% |
| French Canadian | 8 | 0.4% |
| German | 350 | 19.1% |
| Icelander | 5 | 0.3% |
| Irish | 199 | 10.8% |
| Italian | 38 | 2.1% |
| Jamaican | 3 | 0.2% |
| Lithuanian | 16 | 0.9% |
| Mexican | 14 | 0.8% |
| Native Hawaiian | 4 | 0.2% |
| Norwegian | 9 | 0.5% |
| Pennsylvania German | 3 | 0.2% |
| Polish | 64 | 3.5% |
| Puerto Rican | 26 | 1.4% |
| Russian | 3 | 0.2% |
| Scotch-Irish | 19 | 1.0% |
| Scottish | 20 | 1.1% |
| Slovak | 16 | 0.9% |
| Spaniard | 1 | 0.1% |
| Swedish | 13 | 0.7% |
| Syrian | 3 | 0.2% | View All 33 Rows |
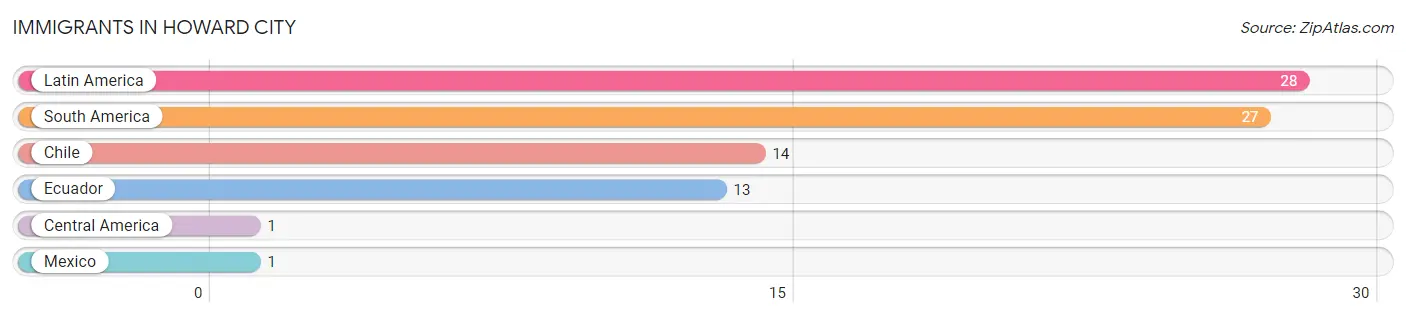
Immigrants in Howard City
The most numerous immigrant groups reported in Howard City came from Latin America (28 | 1.5%), South America (27 | 1.5%), Chile (14 | 0.8%), Ecuador (13 | 0.7%), and Central America (1 | 0.1%), together accounting for 4.5% of all Howard City residents.
| Immigration Origin | # Population | % Population |
| Central America | 1 | 0.1% |
| Chile | 14 | 0.8% |
| Ecuador | 13 | 0.7% |
| Latin America | 28 | 1.5% |
| Mexico | 1 | 0.1% |
| South America | 27 | 1.5% | View All 6 Rows |
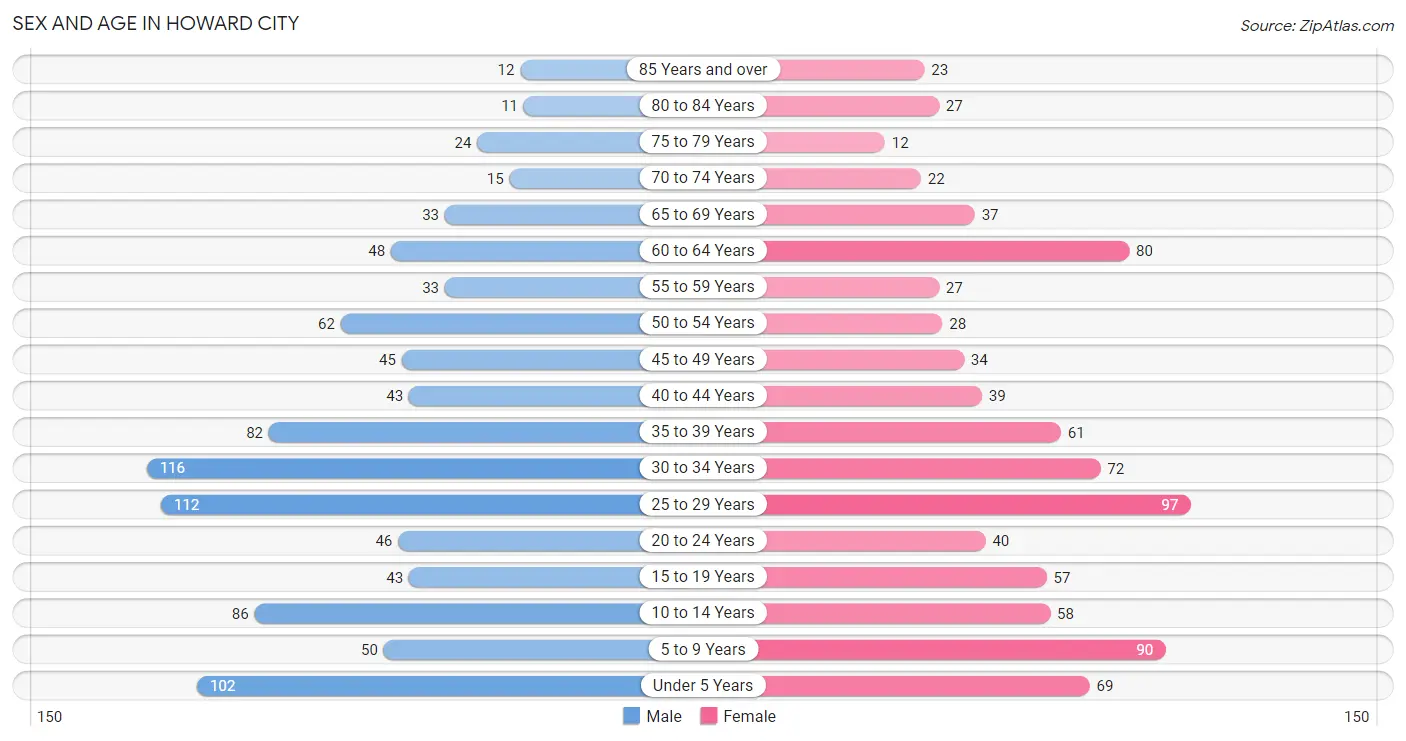
Sex and Age in Howard City
Sex and Age in Howard City
The most populous age groups in Howard City are 30 to 34 Years (116 | 12.0%) for men and 25 to 29 Years (97 | 11.1%) for women.
| Age Bracket | Male | Female |
| Under 5 Years | 102 (10.6%) | 69 (7.9%) |
| 5 to 9 Years | 50 (5.2%) | 90 (10.3%) |
| 10 to 14 Years | 86 (8.9%) | 58 (6.6%) |
| 15 to 19 Years | 43 (4.5%) | 57 (6.5%) |
| 20 to 24 Years | 46 (4.8%) | 40 (4.6%) |
| 25 to 29 Years | 112 (11.6%) | 97 (11.1%) |
| 30 to 34 Years | 116 (12.0%) | 72 (8.3%) |
| 35 to 39 Years | 82 (8.5%) | 61 (7.0%) |
| 40 to 44 Years | 43 (4.5%) | 39 (4.5%) |
| 45 to 49 Years | 45 (4.7%) | 34 (3.9%) |
| 50 to 54 Years | 62 (6.4%) | 28 (3.2%) |
| 55 to 59 Years | 33 (3.4%) | 27 (3.1%) |
| 60 to 64 Years | 48 (5.0%) | 80 (9.2%) |
| 65 to 69 Years | 33 (3.4%) | 37 (4.2%) |
| 70 to 74 Years | 15 (1.6%) | 22 (2.5%) |
| 75 to 79 Years | 24 (2.5%) | 12 (1.4%) |
| 80 to 84 Years | 11 (1.1%) | 27 (3.1%) |
| 85 Years and over | 12 (1.3%) | 23 (2.6%) |
| Total | 963 (100.0%) | 873 (100.0%) |
Families and Households in Howard City
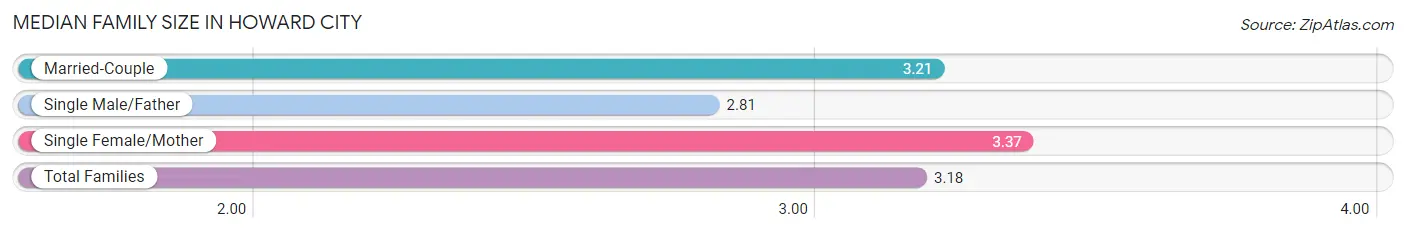
Median Family Size in Howard City
The median family size in Howard City is 3.18 persons per family, with single female/mother families (83 | 19.8%) accounting for the largest median family size of 3.37 persons per family. On the other hand, single male/father families (67 | 16.0%) represent the smallest median family size with 2.81 persons per family.
| Family Type | # Families | Family Size |
| Married-Couple | 270 (64.3%) | 3.21 |
| Single Male/Father | 67 (16.0%) | 2.81 |
| Single Female/Mother | 83 (19.8%) | 3.37 |
| Total Families | 420 (100.0%) | 3.18 |
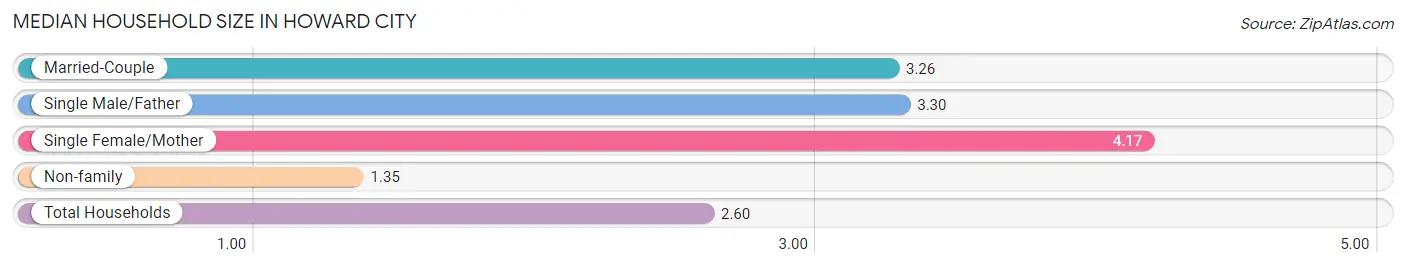
Median Household Size in Howard City
The median household size in Howard City is 2.60 persons per household, with single female/mother households (83 | 11.8%) accounting for the largest median household size of 4.17 persons per household. non-family households (285 | 40.4%) represent the smallest median household size with 1.35 persons per household.
| Household Type | # Households | Household Size |
| Married-Couple | 270 (38.3%) | 3.26 |
| Single Male/Father | 67 (9.5%) | 3.30 |
| Single Female/Mother | 83 (11.8%) | 4.17 |
| Non-family | 285 (40.4%) | 1.35 |
| Total Households | 705 (100.0%) | 2.60 |
Household Size by Marriage Status in Howard City
Out of a total of 705 households in Howard City, 420 (59.6%) are family households, while 285 (40.4%) are nonfamily households. The most numerous type of family households are 2-person households, comprising 162, and the most common type of nonfamily households are 1-person households, comprising 199.
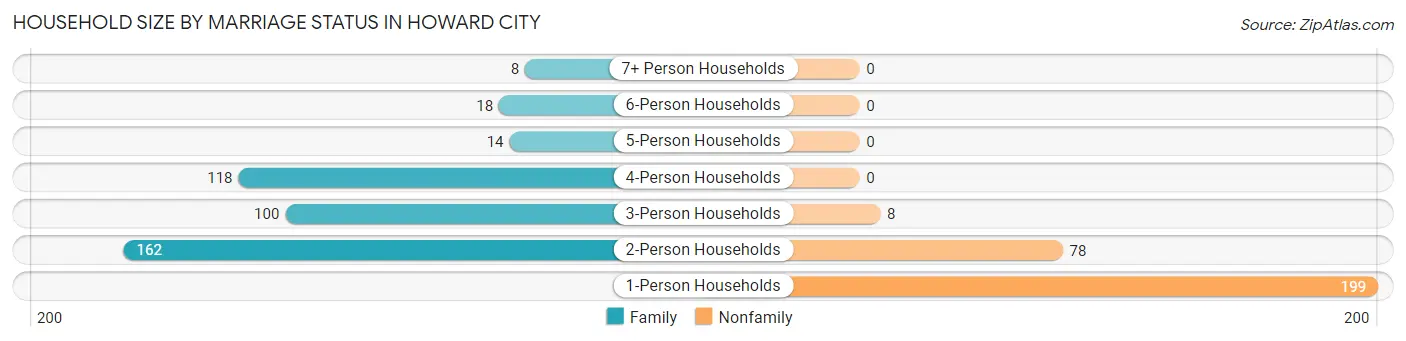
| Household Size | Family Households | Nonfamily Households |
| 1-Person Households | - | 199 (28.2%) |
| 2-Person Households | 162 (23.0%) | 78 (11.1%) |
| 3-Person Households | 100 (14.2%) | 8 (1.1%) |
| 4-Person Households | 118 (16.7%) | 0 (0.0%) |
| 5-Person Households | 14 (2.0%) | 0 (0.0%) |
| 6-Person Households | 18 (2.5%) | 0 (0.0%) |
| 7+ Person Households | 8 (1.1%) | 0 (0.0%) |
| Total | 420 (59.6%) | 285 (40.4%) |
Female Fertility in Howard City
Fertility by Age in Howard City
Average fertility rate in Howard City is 44.0 births per 1,000 women. Women in the age bracket of 20 to 34 years have the highest fertility rate with 86.0 births per 1,000 women. Women in the age bracket of 20 to 34 years acount for 100.0% of all women with births.
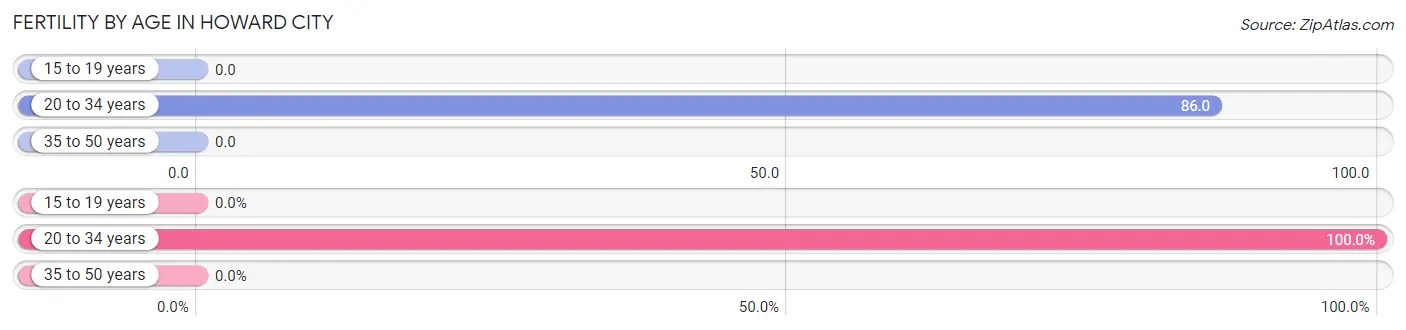
| Age Bracket | Women with Births | Births / 1,000 Women |
| 15 to 19 years | 0 (0.0%) | 0.0 |
| 20 to 34 years | 18 (100.0%) | 86.0 |
| 35 to 50 years | 0 (0.0%) | 0.0 |
| Total | 18 (100.0%) | 44.0 |
Fertility by Age by Marriage Status in Howard City
50.0% of women with births (18) in Howard City are married. The highest percentage of unmarried women with births falls into 20 to 34 years age bracket with 50.0% of them unmarried at the time of birth, while the lowest percentage of unmarried women with births belong to 20 to 34 years age bracket with 50.0% of them unmarried.
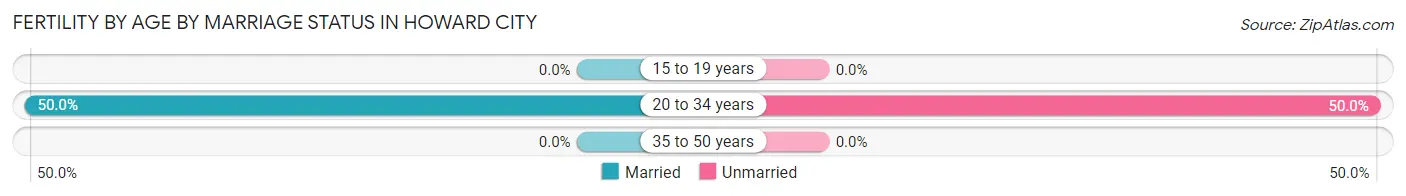
| Age Bracket | Married | Unmarried |
| 15 to 19 years | 0 (0.0%) | 0 (0.0%) |
| 20 to 34 years | 9 (50.0%) | 9 (50.0%) |
| 35 to 50 years | 0 (0.0%) | 0 (0.0%) |
| Total | 9 (50.0%) | 9 (50.0%) |
Fertility by Education in Howard City
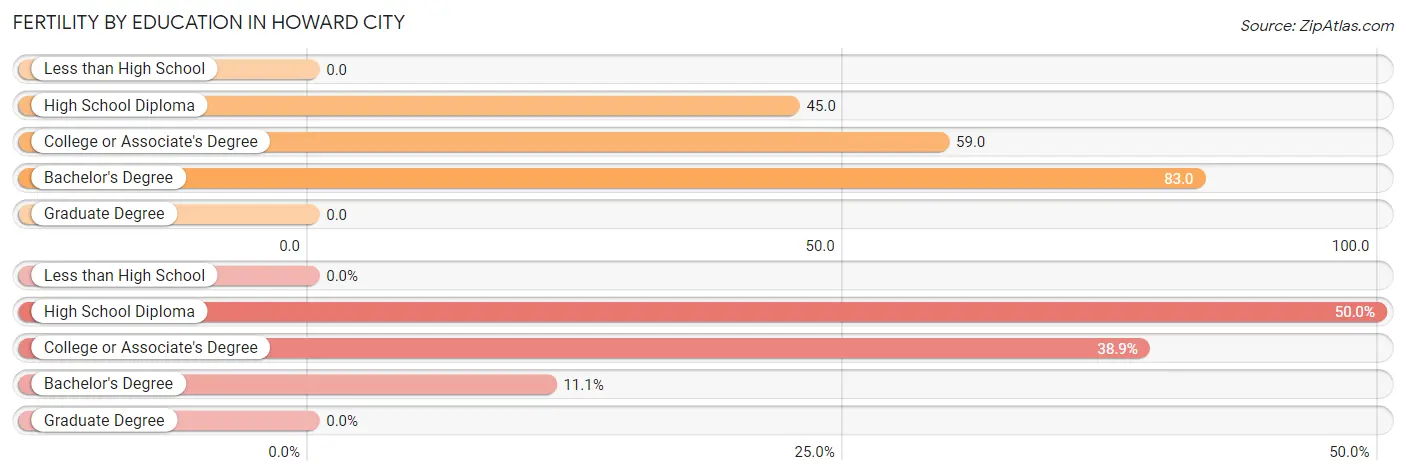
| Educational Attainment | Women with Births | Births / 1,000 Women |
| Less than High School | 0 (0.0%) | 0.0 |
| High School Diploma | 9 (50.0%) | 45.0 |
| College or Associate's Degree | 7 (38.9%) | 59.0 |
| Bachelor's Degree | 2 (11.1%) | 83.0 |
| Graduate Degree | 0 (0.0%) | 0.0 |
| Total | 18 (100.0%) | 44.0 |
Fertility by Education by Marriage Status in Howard City
50.0% of women with births in Howard City are unmarried. Women with the educational attainment of college or associate's degree are most likely to be married with 100.0% of them married at childbirth, while women with the educational attainment of high school diploma are least likely to be married with 100.0% of them unmarried at childbirth.
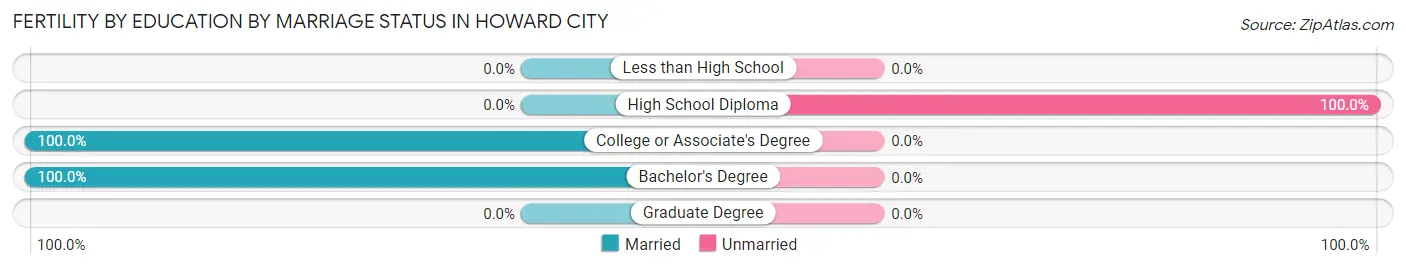
| Educational Attainment | Married | Unmarried |
| Less than High School | 0 (0.0%) | 0 (0.0%) |
| High School Diploma | 0 (0.0%) | 9 (100.0%) |
| College or Associate's Degree | 7 (100.0%) | 0 (0.0%) |
| Bachelor's Degree | 2 (100.0%) | 0 (0.0%) |
| Graduate Degree | 0 (0.0%) | 0 (0.0%) |
| Total | 9 (50.0%) | 9 (50.0%) |
Employment Characteristics in Howard City
Employment by Class of Employer in Howard City
Among the 845 employed individuals in Howard City, private company employees (670 | 79.3%), not-for-profit organizations (90 | 10.6%), and self-employed (not incorporated) (48 | 5.7%) make up the most common classes of employment.
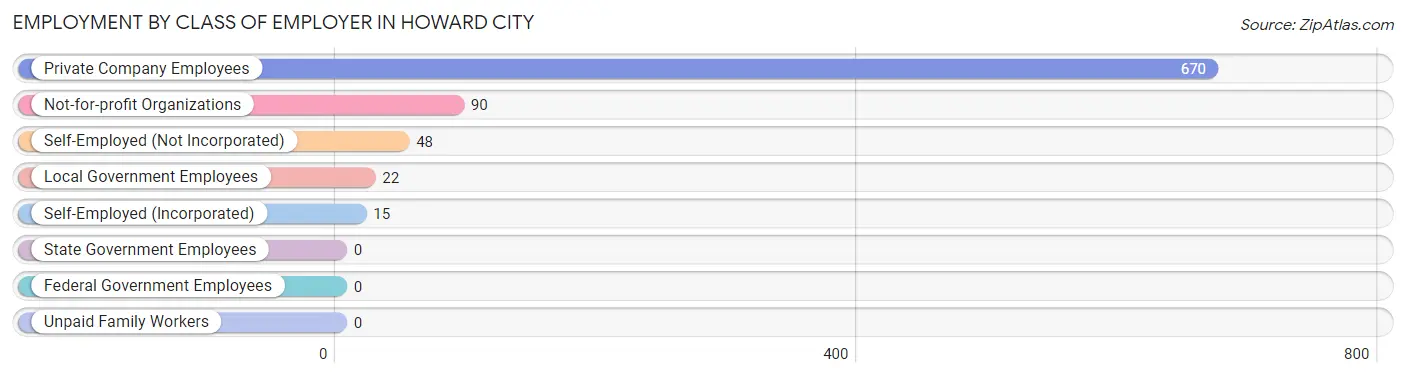
| Employer Class | # Employees | % Employees |
| Private Company Employees | 670 | 79.3% |
| Self-Employed (Incorporated) | 15 | 1.8% |
| Self-Employed (Not Incorporated) | 48 | 5.7% |
| Not-for-profit Organizations | 90 | 10.6% |
| Local Government Employees | 22 | 2.6% |
| State Government Employees | 0 | 0.0% |
| Federal Government Employees | 0 | 0.0% |
| Unpaid Family Workers | 0 | 0.0% |
| Total | 845 | 100.0% |
Employment Status by Age in Howard City
According to the labor force statistics for Howard City, out of the total population over 16 years of age (1,336), 64.8% or 866 individuals are in the labor force, with 1.5% or 13 of them unemployed. The age group with the highest labor force participation rate is 35 to 44 years, with 92.4% or 208 individuals in the labor force. Within the labor force, the 16 to 19 years age range has the highest percentage of unemployed individuals, with 17.2% or 5 of them being unemployed.
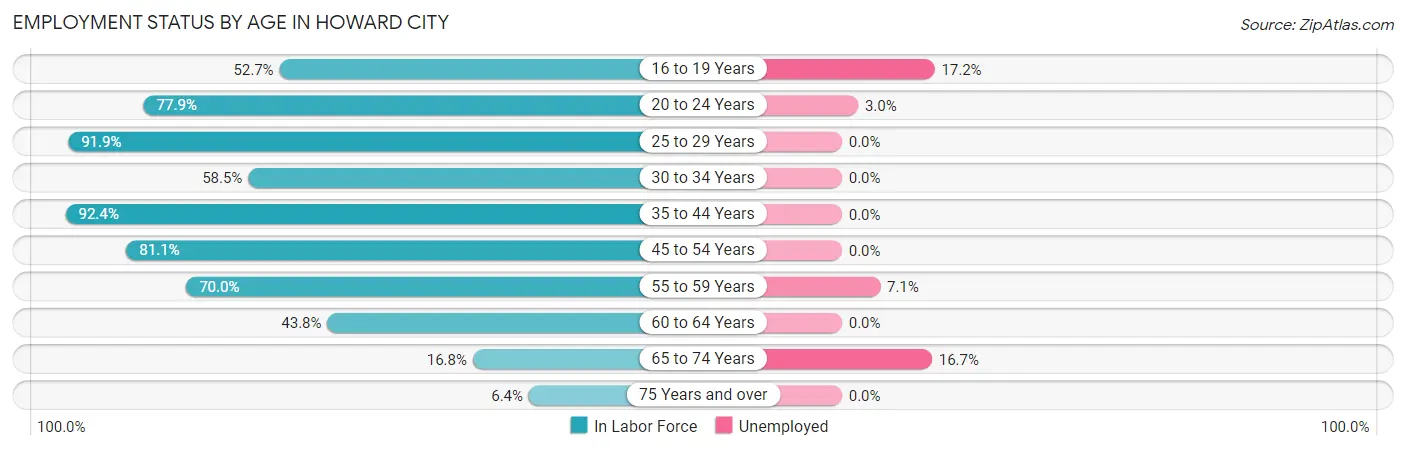
| Age Bracket | In Labor Force | Unemployed |
| 16 to 19 Years | 29 (52.7%) | 5 (17.2%) |
| 20 to 24 Years | 67 (77.9%) | 2 (3.0%) |
| 25 to 29 Years | 192 (91.9%) | 0 (0.0%) |
| 30 to 34 Years | 110 (58.5%) | 0 (0.0%) |
| 35 to 44 Years | 208 (92.4%) | 0 (0.0%) |
| 45 to 54 Years | 137 (81.1%) | 0 (0.0%) |
| 55 to 59 Years | 42 (70.0%) | 3 (7.1%) |
| 60 to 64 Years | 56 (43.8%) | 0 (0.0%) |
| 65 to 74 Years | 18 (16.8%) | 3 (16.7%) |
| 75 Years and over | 7 (6.4%) | 0 (0.0%) |
| Total | 866 (64.8%) | 13 (1.5%) |
Employment Status by Educational Attainment in Howard City
According to labor force statistics for Howard City, 76.1% of individuals (745) out of the total population between 25 and 64 years of age (979) are in the labor force, with 0.4% or 3 of them being unemployed. The group with the highest labor force participation rate are those with the educational attainment of less than high school, with 92.2% or 107 individuals in the labor force. Within the labor force, individuals with college / associate degree education have the highest percentage of unemployment, with 1.4% or 3 of them being unemployed.
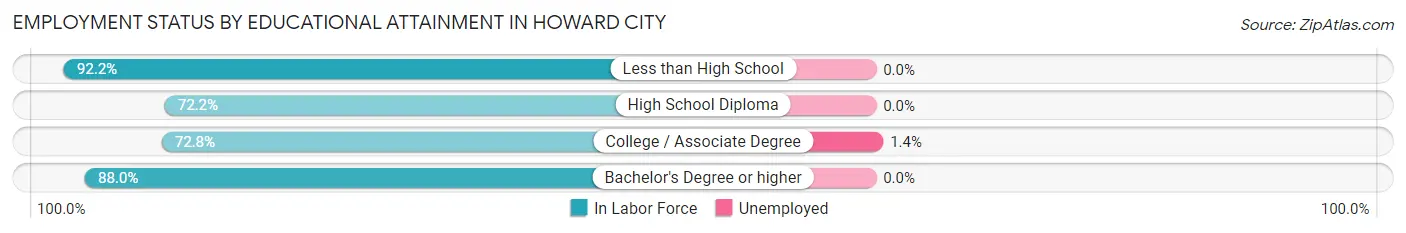
| Educational Attainment | In Labor Force | Unemployed |
| Less than High School | 107 (92.2%) | 0 (0.0%) |
| High School Diploma | 343 (72.2%) | 0 (0.0%) |
| College / Associate Degree | 222 (72.8%) | 4 (1.4%) |
| Bachelor's Degree or higher | 73 (88.0%) | 0 (0.0%) |
| Total | 745 (76.1%) | 4 (0.4%) |
Employment Occupations by Sex in Howard City
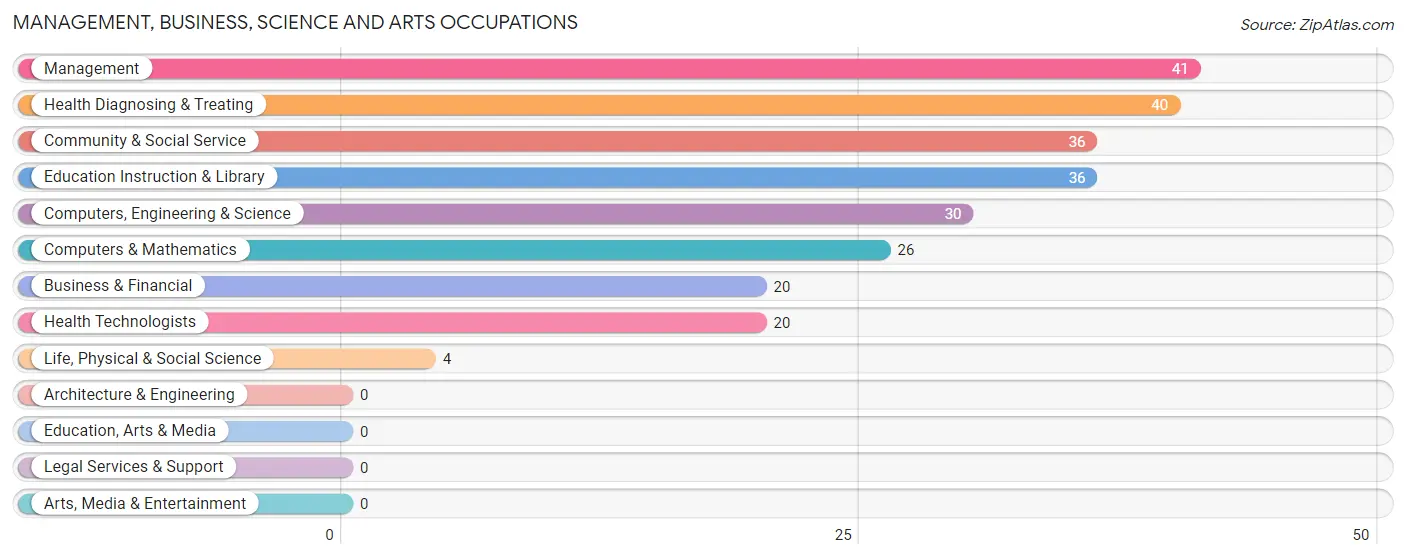
Management, Business, Science and Arts Occupations
The most common Management, Business, Science and Arts occupations in Howard City are Management (41 | 4.8%), Health Diagnosing & Treating (40 | 4.7%), Community & Social Service (36 | 4.2%), Education Instruction & Library (36 | 4.2%), and Computers, Engineering & Science (30 | 3.5%).
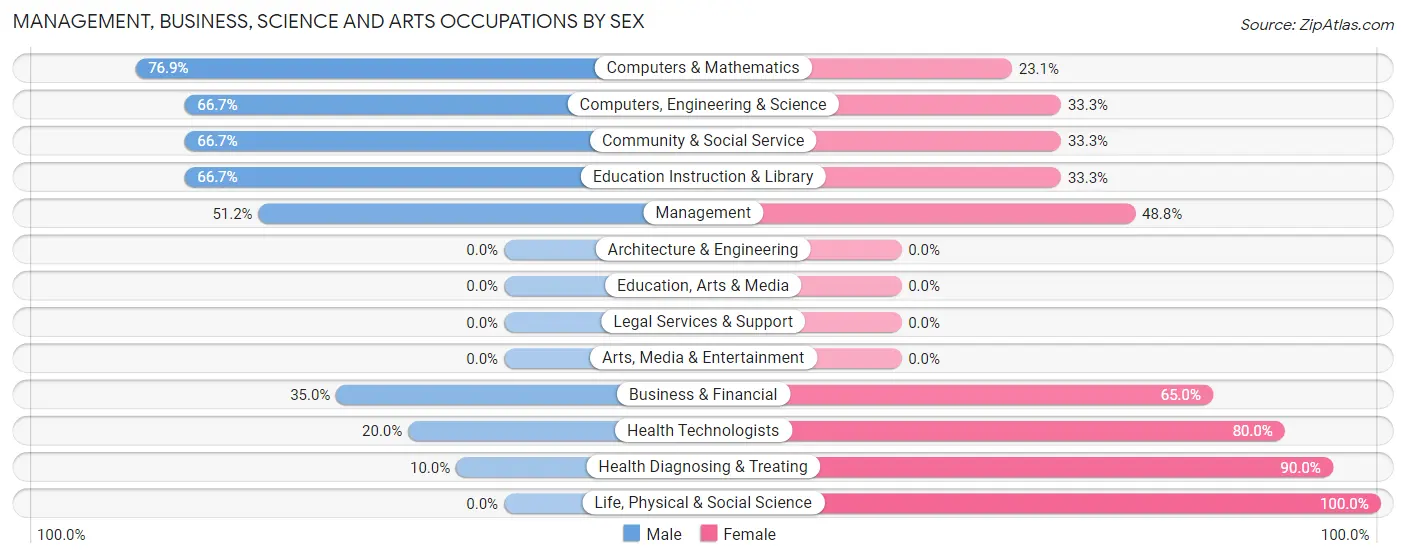
Management, Business, Science and Arts Occupations by Sex
Within the Management, Business, Science and Arts occupations in Howard City, the most male-oriented occupations are Computers & Mathematics (76.9%), Computers, Engineering & Science (66.7%), and Community & Social Service (66.7%), while the most female-oriented occupations are Life, Physical & Social Science (100.0%), Health Diagnosing & Treating (90.0%), and Health Technologists (80.0%).
| Occupation | Male | Female |
| Management | 21 (51.2%) | 20 (48.8%) |
| Business & Financial | 7 (35.0%) | 13 (65.0%) |
| Computers, Engineering & Science | 20 (66.7%) | 10 (33.3%) |
| Computers & Mathematics | 20 (76.9%) | 6 (23.1%) |
| Architecture & Engineering | 0 (0.0%) | 0 (0.0%) |
| Life, Physical & Social Science | 0 (0.0%) | 4 (100.0%) |
| Community & Social Service | 24 (66.7%) | 12 (33.3%) |
| Education, Arts & Media | 0 (0.0%) | 0 (0.0%) |
| Legal Services & Support | 0 (0.0%) | 0 (0.0%) |
| Education Instruction & Library | 24 (66.7%) | 12 (33.3%) |
| Arts, Media & Entertainment | 0 (0.0%) | 0 (0.0%) |
| Health Diagnosing & Treating | 4 (10.0%) | 36 (90.0%) |
| Health Technologists | 4 (20.0%) | 16 (80.0%) |
| Total (Category) | 76 (45.5%) | 91 (54.5%) |
| Total (Overall) | 498 (58.4%) | 355 (41.6%) |
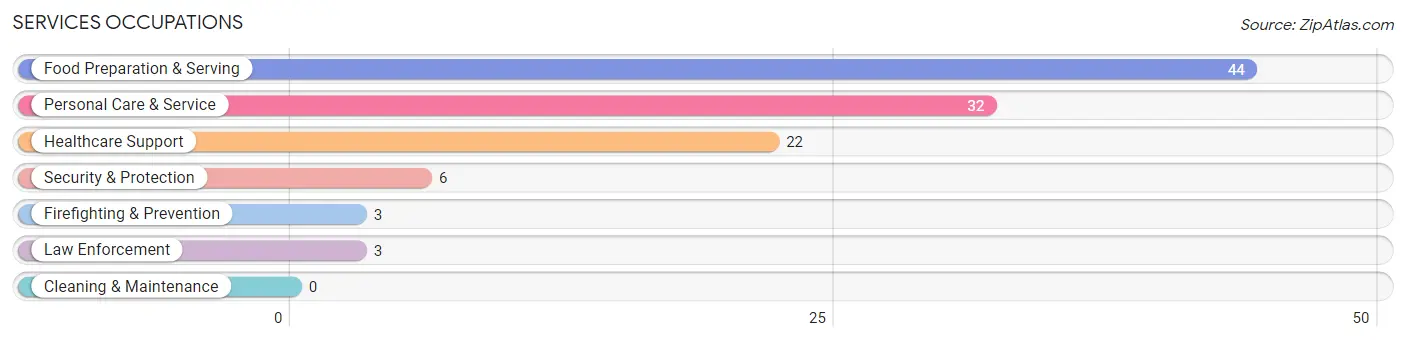
Services Occupations
The most common Services occupations in Howard City are Food Preparation & Serving (44 | 5.2%), Personal Care & Service (32 | 3.7%), Healthcare Support (22 | 2.6%), Security & Protection (6 | 0.7%), and Firefighting & Prevention (3 | 0.4%).
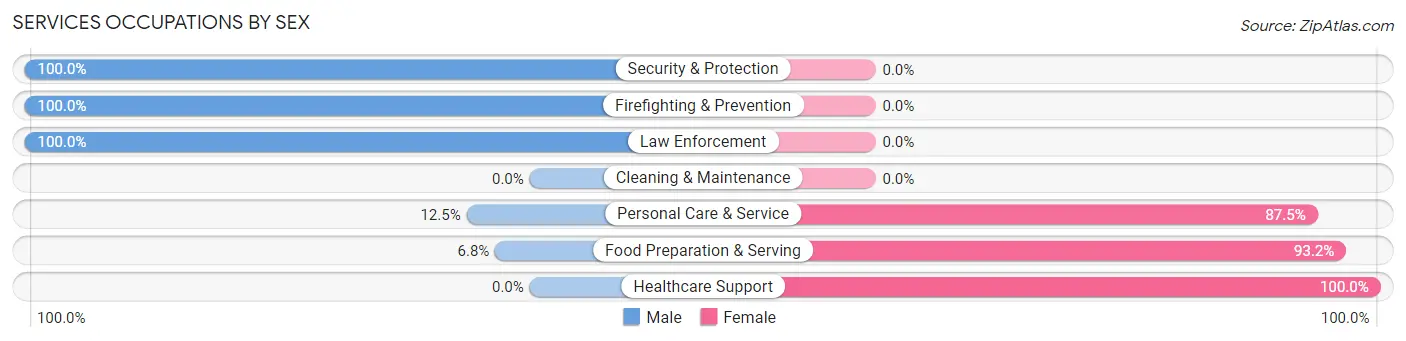
Services Occupations by Sex
Within the Services occupations in Howard City, the most male-oriented occupations are Security & Protection (100.0%), Firefighting & Prevention (100.0%), and Law Enforcement (100.0%), while the most female-oriented occupations are Healthcare Support (100.0%), Food Preparation & Serving (93.2%), and Personal Care & Service (87.5%).
| Occupation | Male | Female |
| Healthcare Support | 0 (0.0%) | 22 (100.0%) |
| Security & Protection | 6 (100.0%) | 0 (0.0%) |
| Firefighting & Prevention | 3 (100.0%) | 0 (0.0%) |
| Law Enforcement | 3 (100.0%) | 0 (0.0%) |
| Food Preparation & Serving | 3 (6.8%) | 41 (93.2%) |
| Cleaning & Maintenance | 0 (0.0%) | 0 (0.0%) |
| Personal Care & Service | 4 (12.5%) | 28 (87.5%) |
| Total (Category) | 13 (12.5%) | 91 (87.5%) |
| Total (Overall) | 498 (58.4%) | 355 (41.6%) |
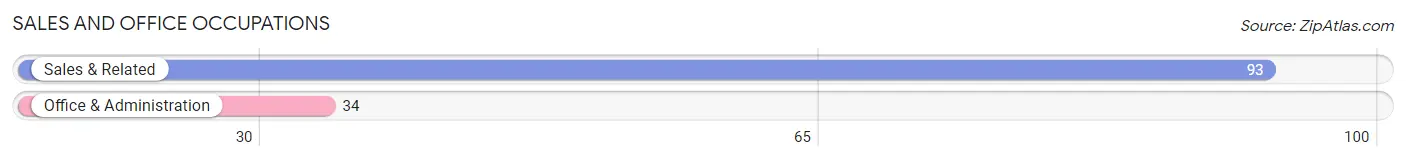
Sales and Office Occupations
The most common Sales and Office occupations in Howard City are Sales & Related (93 | 10.9%), and Office & Administration (34 | 4.0%).
Sales and Office Occupations by Sex
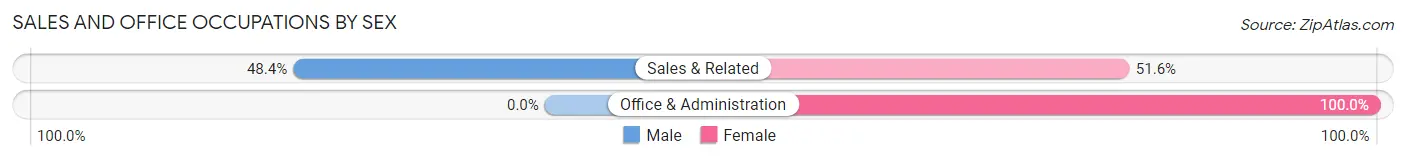
| Occupation | Male | Female |
| Sales & Related | 45 (48.4%) | 48 (51.6%) |
| Office & Administration | 0 (0.0%) | 34 (100.0%) |
| Total (Category) | 45 (35.4%) | 82 (64.6%) |
| Total (Overall) | 498 (58.4%) | 355 (41.6%) |
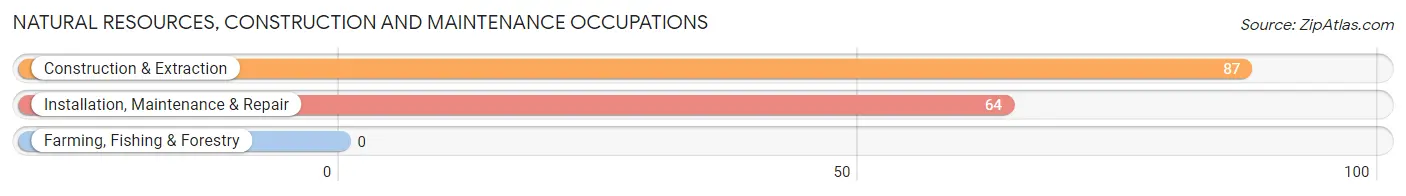
Natural Resources, Construction and Maintenance Occupations
The most common Natural Resources, Construction and Maintenance occupations in Howard City are Construction & Extraction (87 | 10.2%), and Installation, Maintenance & Repair (64 | 7.5%).
Natural Resources, Construction and Maintenance Occupations by Sex
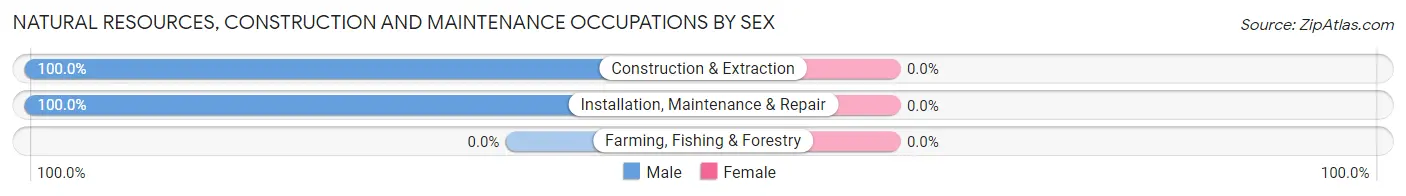
| Occupation | Male | Female |
| Farming, Fishing & Forestry | 0 (0.0%) | 0 (0.0%) |
| Construction & Extraction | 87 (100.0%) | 0 (0.0%) |
| Installation, Maintenance & Repair | 64 (100.0%) | 0 (0.0%) |
| Total (Category) | 151 (100.0%) | 0 (0.0%) |
| Total (Overall) | 498 (58.4%) | 355 (41.6%) |
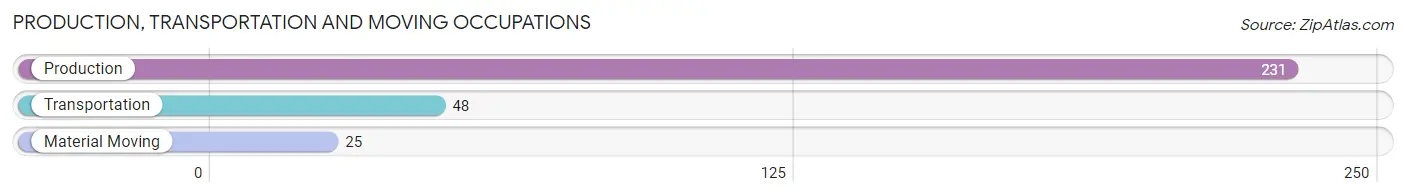
Production, Transportation and Moving Occupations
The most common Production, Transportation and Moving occupations in Howard City are Production (231 | 27.1%), Transportation (48 | 5.6%), and Material Moving (25 | 2.9%).
Production, Transportation and Moving Occupations by Sex
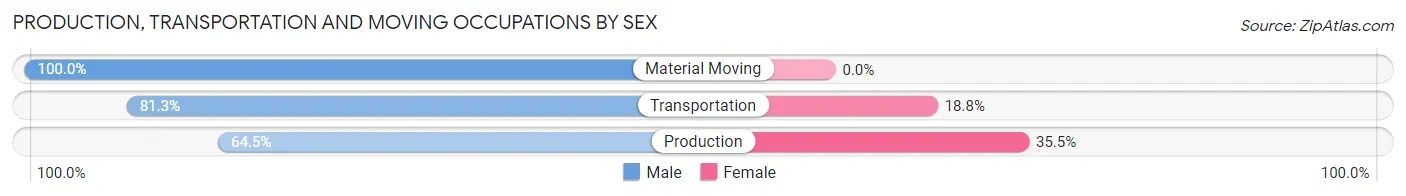
| Occupation | Male | Female |
| Production | 149 (64.5%) | 82 (35.5%) |
| Transportation | 39 (81.2%) | 9 (18.8%) |
| Material Moving | 25 (100.0%) | 0 (0.0%) |
| Total (Category) | 213 (70.1%) | 91 (29.9%) |
| Total (Overall) | 498 (58.4%) | 355 (41.6%) |
Employment Industries by Sex in Howard City
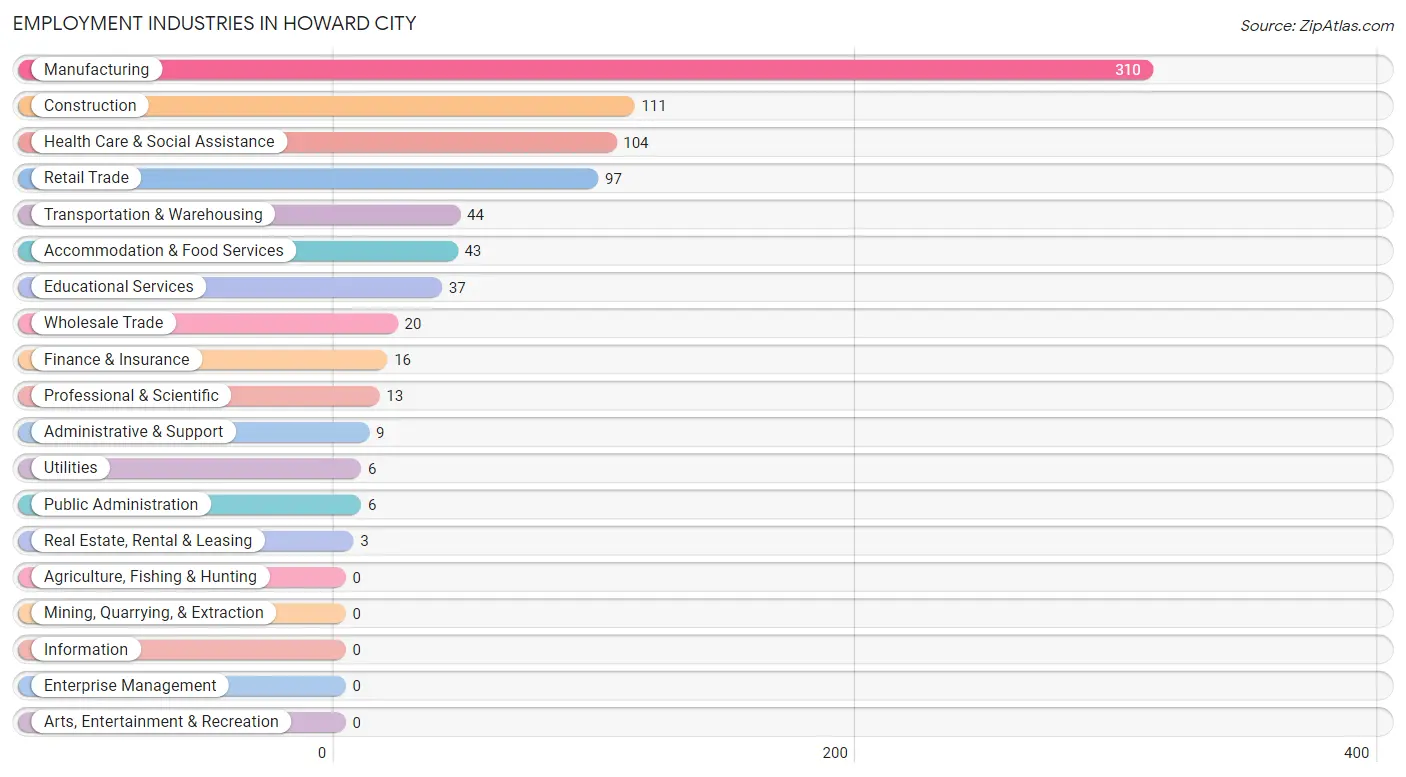
Employment Industries in Howard City
The major employment industries in Howard City include Manufacturing (310 | 36.3%), Construction (111 | 13.0%), Health Care & Social Assistance (104 | 12.2%), Retail Trade (97 | 11.4%), and Transportation & Warehousing (44 | 5.2%).
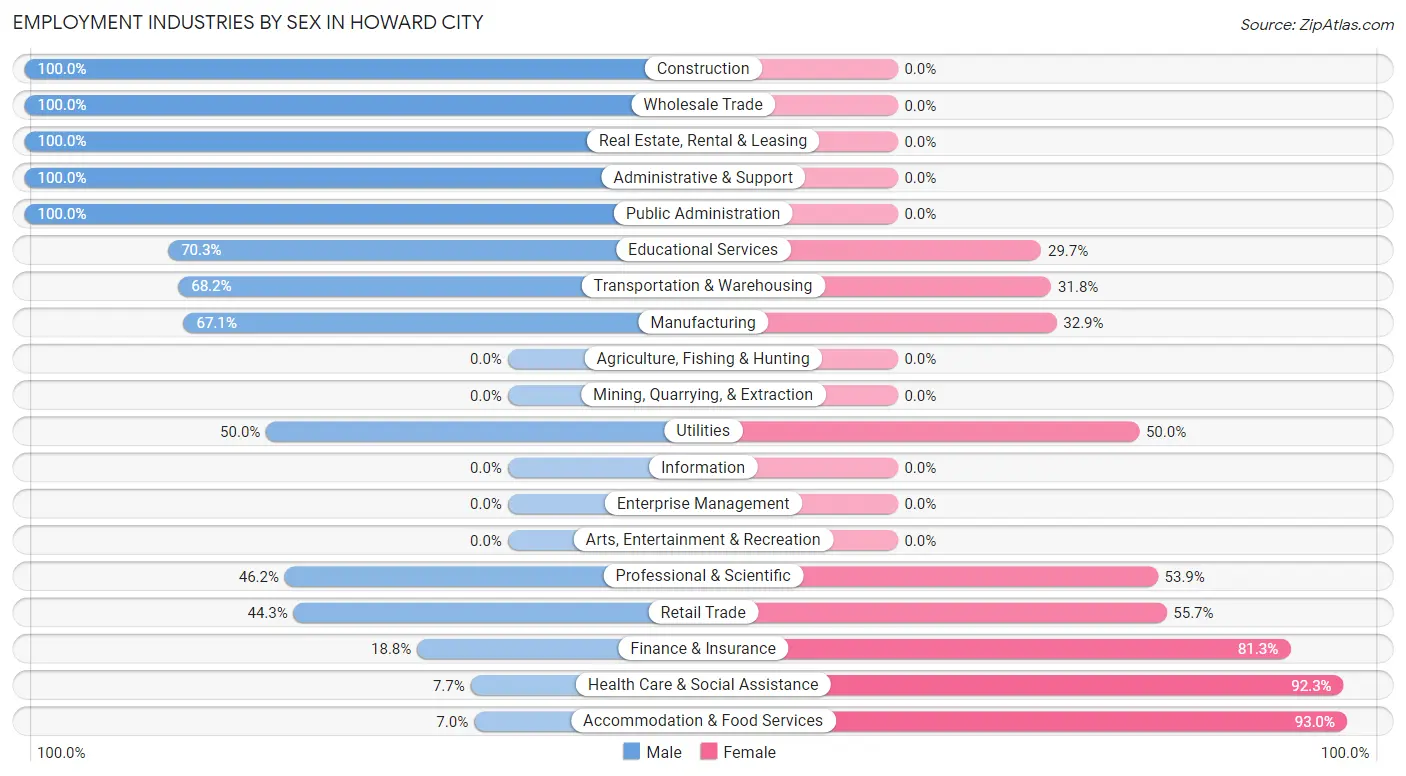
Employment Industries by Sex in Howard City
The Howard City industries that see more men than women are Construction (100.0%), Wholesale Trade (100.0%), and Real Estate, Rental & Leasing (100.0%), whereas the industries that tend to have a higher number of women are Accommodation & Food Services (93.0%), Health Care & Social Assistance (92.3%), and Finance & Insurance (81.2%).
| Industry | Male | Female |
| Agriculture, Fishing & Hunting | 0 (0.0%) | 0 (0.0%) |
| Mining, Quarrying, & Extraction | 0 (0.0%) | 0 (0.0%) |
| Construction | 111 (100.0%) | 0 (0.0%) |
| Manufacturing | 208 (67.1%) | 102 (32.9%) |
| Wholesale Trade | 20 (100.0%) | 0 (0.0%) |
| Retail Trade | 43 (44.3%) | 54 (55.7%) |
| Transportation & Warehousing | 30 (68.2%) | 14 (31.8%) |
| Utilities | 3 (50.0%) | 3 (50.0%) |
| Information | 0 (0.0%) | 0 (0.0%) |
| Finance & Insurance | 3 (18.8%) | 13 (81.2%) |
| Real Estate, Rental & Leasing | 3 (100.0%) | 0 (0.0%) |
| Professional & Scientific | 6 (46.2%) | 7 (53.8%) |
| Enterprise Management | 0 (0.0%) | 0 (0.0%) |
| Administrative & Support | 9 (100.0%) | 0 (0.0%) |
| Educational Services | 26 (70.3%) | 11 (29.7%) |
| Health Care & Social Assistance | 8 (7.7%) | 96 (92.3%) |
| Arts, Entertainment & Recreation | 0 (0.0%) | 0 (0.0%) |
| Accommodation & Food Services | 3 (7.0%) | 40 (93.0%) |
| Public Administration | 6 (100.0%) | 0 (0.0%) |
| Total | 498 (58.4%) | 355 (41.6%) |
Education in Howard City
School Enrollment in Howard City
The most common levels of schooling among the 407 students in Howard City are middle school (128 | 31.5%), elementary school (94 | 23.1%), and high school (82 | 20.2%).
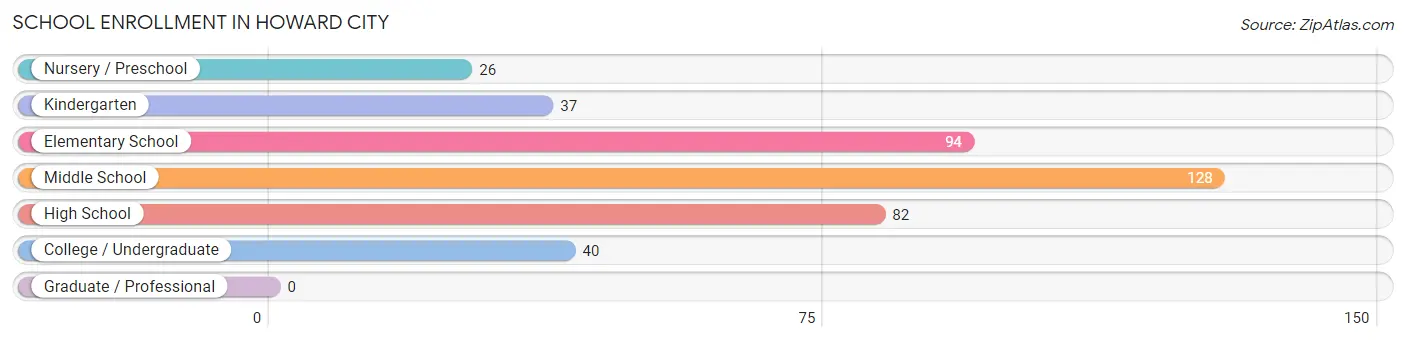
| School Level | # Students | % Students |
| Nursery / Preschool | 26 | 6.4% |
| Kindergarten | 37 | 9.1% |
| Elementary School | 94 | 23.1% |
| Middle School | 128 | 31.5% |
| High School | 82 | 20.2% |
| College / Undergraduate | 40 | 9.8% |
| Graduate / Professional | 0 | 0.0% |
| Total | 407 | 100.0% |
School Enrollment by Age by Funding Source in Howard City
Out of a total of 407 students who are enrolled in schools in Howard City, 19 (4.7%) attend a private institution, while the remaining 388 (95.3%) are enrolled in public schools. The age group of 20 to 24 year olds has the highest likelihood of being enrolled in private schools, with 15 (100.0% in the age bracket) enrolled. Conversely, the age group of 3 to 4 year olds has the lowest likelihood of being enrolled in a private school, with 20 (100.0% in the age bracket) attending a public institution.
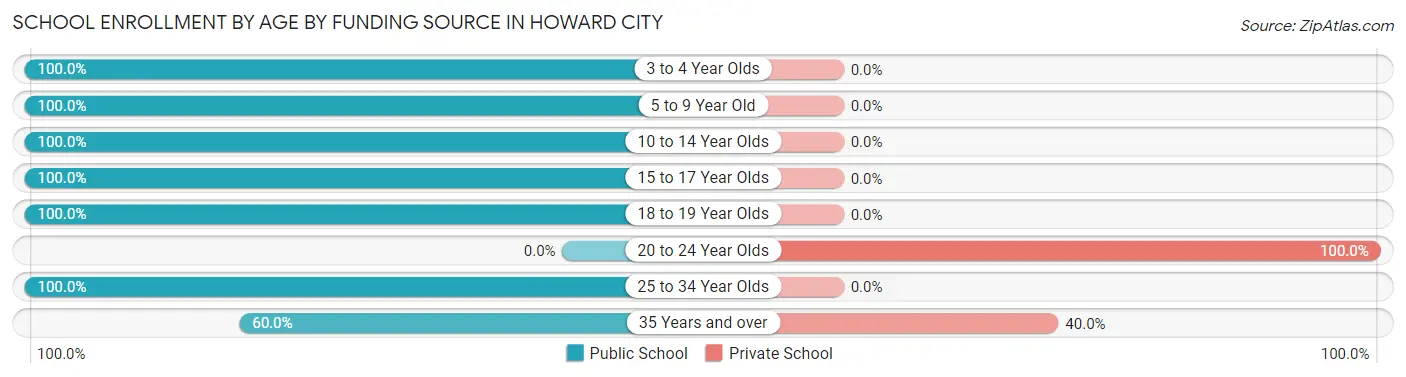
| Age Bracket | Public School | Private School |
| 3 to 4 Year Olds | 20 (100.0%) | 0 (0.0%) |
| 5 to 9 Year Old | 137 (100.0%) | 0 (0.0%) |
| 10 to 14 Year Olds | 133 (100.0%) | 0 (0.0%) |
| 15 to 17 Year Olds | 71 (100.0%) | 0 (0.0%) |
| 18 to 19 Year Olds | 6 (100.0%) | 0 (0.0%) |
| 20 to 24 Year Olds | 0 (0.0%) | 15 (100.0%) |
| 25 to 34 Year Olds | 15 (100.0%) | 0 (0.0%) |
| 35 Years and over | 6 (60.0%) | 4 (40.0%) |
| Total | 388 (95.3%) | 19 (4.7%) |
Educational Attainment by Field of Study in Howard City
Science & technology (30 | 27.3%), computers & mathematics (14 | 12.7%), physical & health sciences (14 | 12.7%), business (13 | 11.8%), and arts & humanities (9 | 8.2%) are the most common fields of study among 110 individuals in Howard City who have obtained a bachelor's degree or higher.
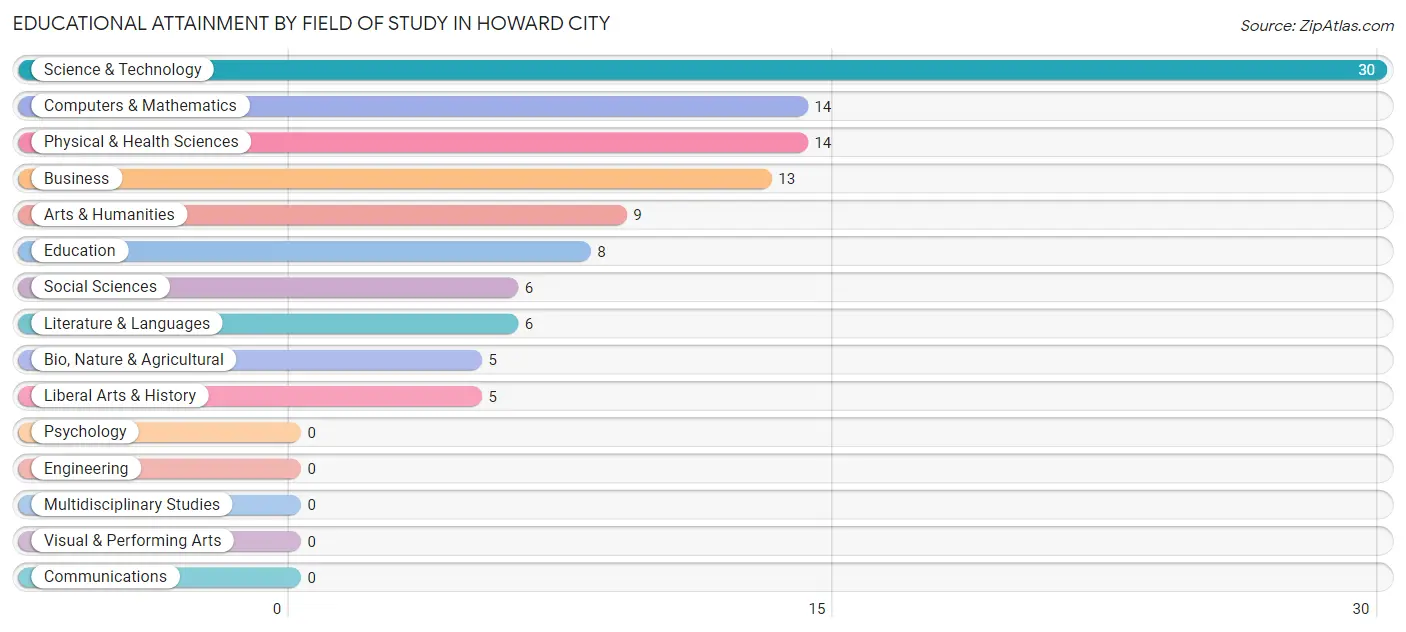
| Field of Study | # Graduates | % Graduates |
| Computers & Mathematics | 14 | 12.7% |
| Bio, Nature & Agricultural | 5 | 4.5% |
| Physical & Health Sciences | 14 | 12.7% |
| Psychology | 0 | 0.0% |
| Social Sciences | 6 | 5.4% |
| Engineering | 0 | 0.0% |
| Multidisciplinary Studies | 0 | 0.0% |
| Science & Technology | 30 | 27.3% |
| Business | 13 | 11.8% |
| Education | 8 | 7.3% |
| Literature & Languages | 6 | 5.4% |
| Liberal Arts & History | 5 | 4.5% |
| Visual & Performing Arts | 0 | 0.0% |
| Communications | 0 | 0.0% |
| Arts & Humanities | 9 | 8.2% |
| Total | 110 | 100.0% |
Transportation & Commute in Howard City
Vehicle Availability by Sex in Howard City
The most prevalent vehicle ownership categories in Howard City are males with 2 vehicles (184, accounting for 36.9%) and females with 2 vehicles (137, making up 53.2%).
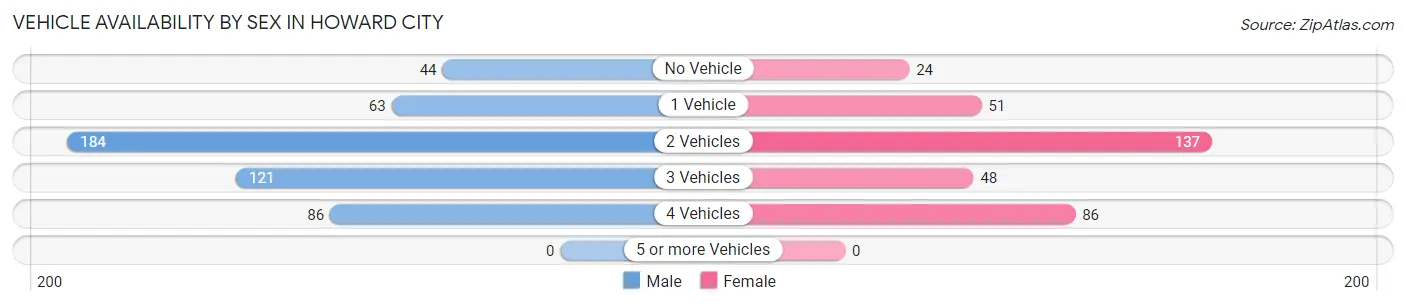
| Vehicles Available | Male | Female |
| No Vehicle | 44 (8.8%) | 24 (6.9%) |
| 1 Vehicle | 63 (12.7%) | 51 (14.7%) |
| 2 Vehicles | 184 (36.9%) | 137 (39.6%) |
| 3 Vehicles | 121 (24.3%) | 48 (13.9%) |
| 4 Vehicles | 86 (17.3%) | 86 (24.9%) |
| 5 or more Vehicles | 0 (0.0%) | 0 (0.0%) |
| Total | 498 (100.0%) | 346 (100.0%) |
Commute Time in Howard City
The most frequently occuring commute durations in Howard City are 45 to 59 minutes (165 commuters, 20.5%), 30 to 34 minutes (159 commuters, 19.8%), and 15 to 19 minutes (94 commuters, 11.7%).
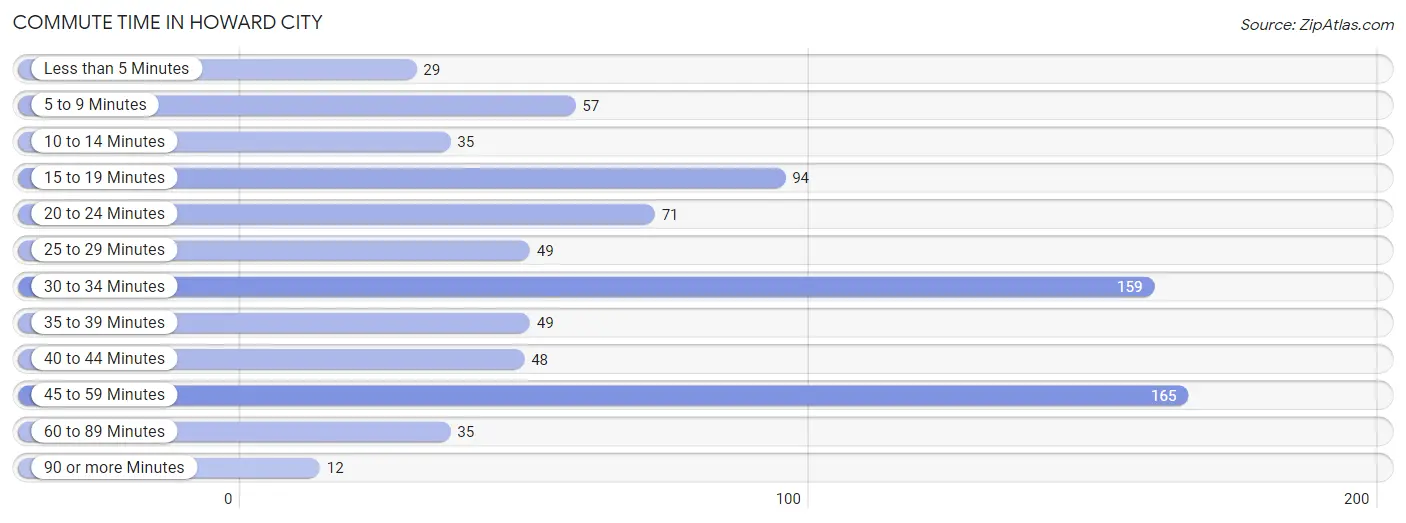
| Commute Time | # Commuters | % Commuters |
| Less than 5 Minutes | 29 | 3.6% |
| 5 to 9 Minutes | 57 | 7.1% |
| 10 to 14 Minutes | 35 | 4.4% |
| 15 to 19 Minutes | 94 | 11.7% |
| 20 to 24 Minutes | 71 | 8.8% |
| 25 to 29 Minutes | 49 | 6.1% |
| 30 to 34 Minutes | 159 | 19.8% |
| 35 to 39 Minutes | 49 | 6.1% |
| 40 to 44 Minutes | 48 | 6.0% |
| 45 to 59 Minutes | 165 | 20.5% |
| 60 to 89 Minutes | 35 | 4.4% |
| 90 or more Minutes | 12 | 1.5% |
Commute Time by Sex in Howard City
The most common commute times in Howard City are 45 to 59 minutes (100 commuters, 21.2%) for males and 30 to 34 minutes (98 commuters, 29.6%) for females.
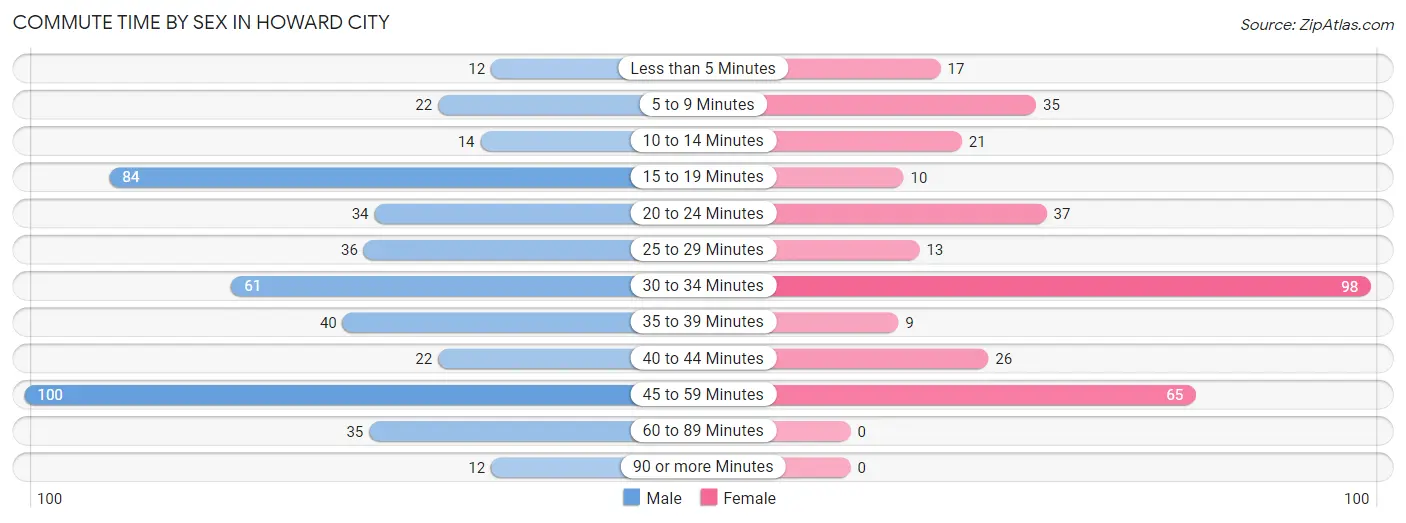
| Commute Time | Male | Female |
| Less than 5 Minutes | 12 (2.5%) | 17 (5.1%) |
| 5 to 9 Minutes | 22 (4.7%) | 35 (10.6%) |
| 10 to 14 Minutes | 14 (3.0%) | 21 (6.3%) |
| 15 to 19 Minutes | 84 (17.8%) | 10 (3.0%) |
| 20 to 24 Minutes | 34 (7.2%) | 37 (11.2%) |
| 25 to 29 Minutes | 36 (7.6%) | 13 (3.9%) |
| 30 to 34 Minutes | 61 (12.9%) | 98 (29.6%) |
| 35 to 39 Minutes | 40 (8.5%) | 9 (2.7%) |
| 40 to 44 Minutes | 22 (4.7%) | 26 (7.9%) |
| 45 to 59 Minutes | 100 (21.2%) | 65 (19.6%) |
| 60 to 89 Minutes | 35 (7.4%) | 0 (0.0%) |
| 90 or more Minutes | 12 (2.5%) | 0 (0.0%) |
Time of Departure to Work by Sex in Howard City
The most frequent times of departure to work in Howard City are 6:30 AM to 6:59 AM (89, 18.9%) for males and 5:00 AM to 5:29 AM (91, 27.5%) for females.
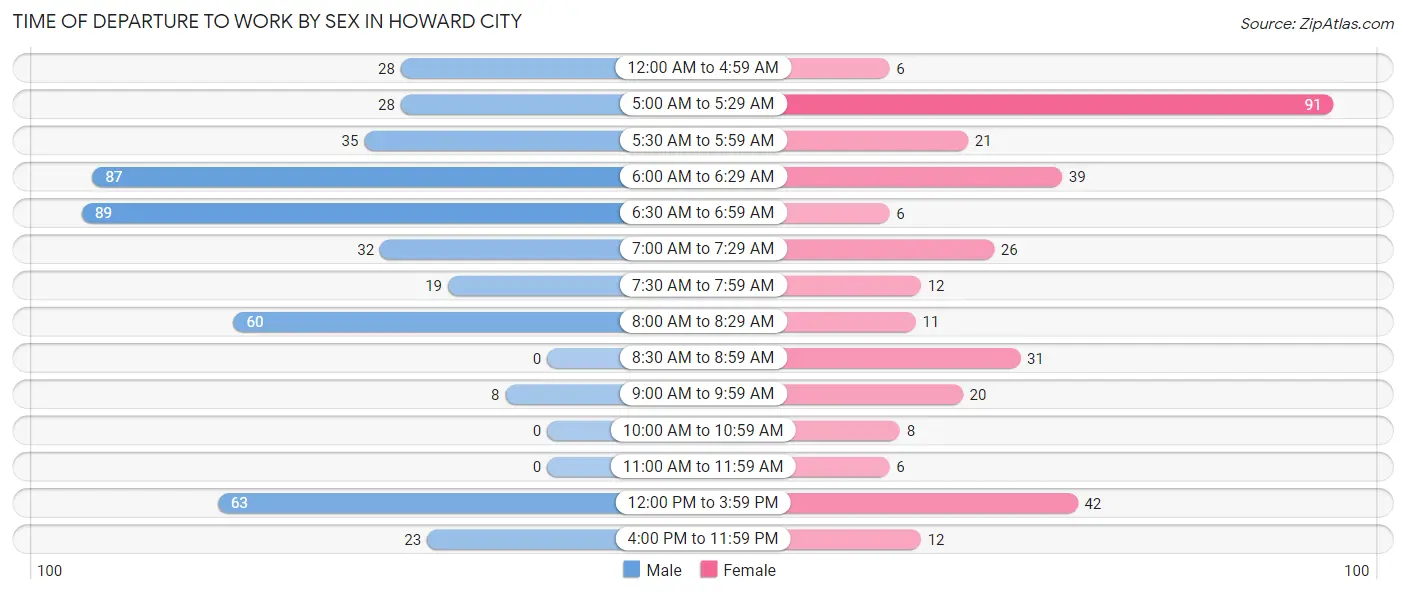
| Time of Departure | Male | Female |
| 12:00 AM to 4:59 AM | 28 (5.9%) | 6 (1.8%) |
| 5:00 AM to 5:29 AM | 28 (5.9%) | 91 (27.5%) |
| 5:30 AM to 5:59 AM | 35 (7.4%) | 21 (6.3%) |
| 6:00 AM to 6:29 AM | 87 (18.4%) | 39 (11.8%) |
| 6:30 AM to 6:59 AM | 89 (18.9%) | 6 (1.8%) |
| 7:00 AM to 7:29 AM | 32 (6.8%) | 26 (7.9%) |
| 7:30 AM to 7:59 AM | 19 (4.0%) | 12 (3.6%) |
| 8:00 AM to 8:29 AM | 60 (12.7%) | 11 (3.3%) |
| 8:30 AM to 8:59 AM | 0 (0.0%) | 31 (9.4%) |
| 9:00 AM to 9:59 AM | 8 (1.7%) | 20 (6.0%) |
| 10:00 AM to 10:59 AM | 0 (0.0%) | 8 (2.4%) |
| 11:00 AM to 11:59 AM | 0 (0.0%) | 6 (1.8%) |
| 12:00 PM to 3:59 PM | 63 (13.4%) | 42 (12.7%) |
| 4:00 PM to 11:59 PM | 23 (4.9%) | 12 (3.6%) |
| Total | 472 (100.0%) | 331 (100.0%) |
Housing Occupancy in Howard City
Occupancy by Ownership in Howard City
Of the total 705 dwellings in Howard City, owner-occupied units account for 477 (67.7%), while renter-occupied units make up 228 (32.3%).
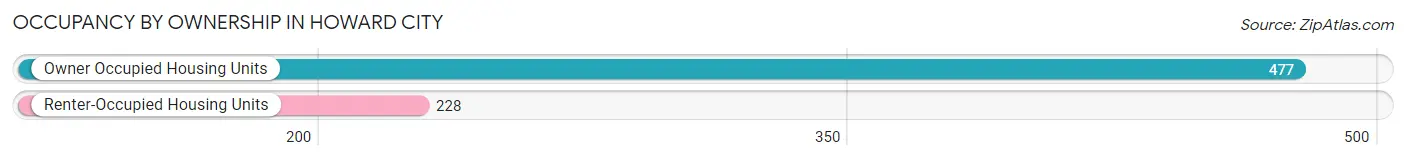
| Occupancy | # Housing Units | % Housing Units |
| Owner Occupied Housing Units | 477 | 67.7% |
| Renter-Occupied Housing Units | 228 | 32.3% |
| Total Occupied Housing Units | 705 | 100.0% |
Occupancy by Household Size in Howard City
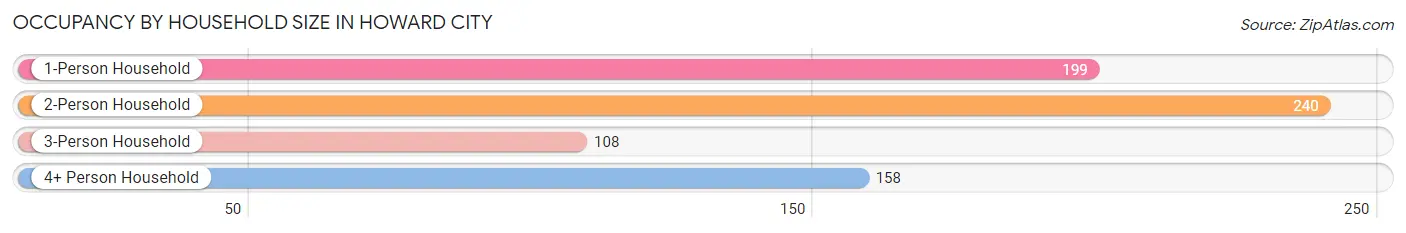
| Household Size | # Housing Units | % Housing Units |
| 1-Person Household | 199 | 28.2% |
| 2-Person Household | 240 | 34.0% |
| 3-Person Household | 108 | 15.3% |
| 4+ Person Household | 158 | 22.4% |
| Total Housing Units | 705 | 100.0% |
Occupancy by Ownership by Household Size in Howard City
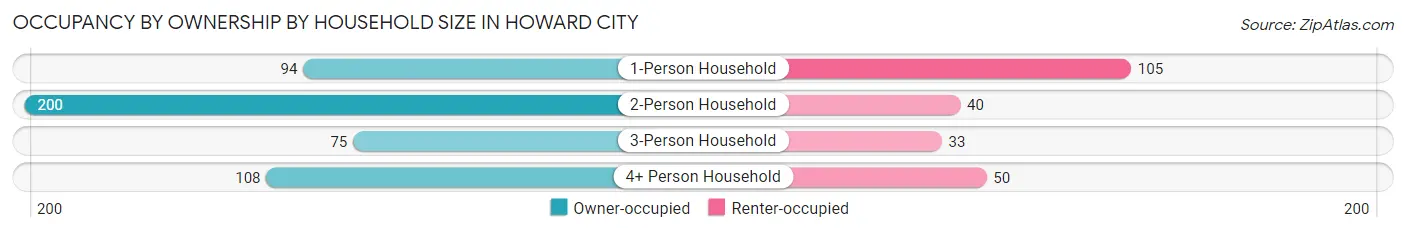
| Household Size | Owner-occupied | Renter-occupied |
| 1-Person Household | 94 (47.2%) | 105 (52.8%) |
| 2-Person Household | 200 (83.3%) | 40 (16.7%) |
| 3-Person Household | 75 (69.4%) | 33 (30.6%) |
| 4+ Person Household | 108 (68.3%) | 50 (31.7%) |
| Total Housing Units | 477 (67.7%) | 228 (32.3%) |
Occupancy by Educational Attainment in Howard City
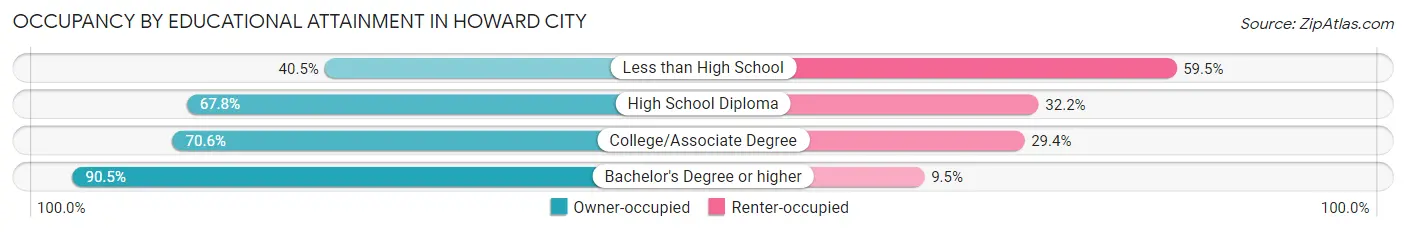
| Household Size | Owner-occupied | Renter-occupied |
| Less than High School | 32 (40.5%) | 47 (59.5%) |
| High School Diploma | 234 (67.8%) | 111 (32.2%) |
| College/Associate Degree | 154 (70.6%) | 64 (29.4%) |
| Bachelor's Degree or higher | 57 (90.5%) | 6 (9.5%) |
Occupancy by Age of Householder in Howard City
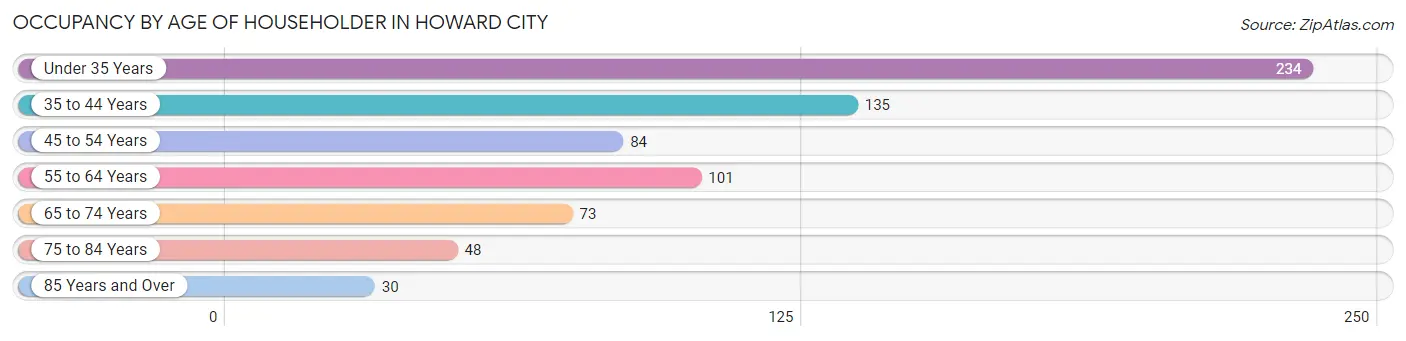
| Age Bracket | # Households | % Households |
| Under 35 Years | 234 | 33.2% |
| 35 to 44 Years | 135 | 19.2% |
| 45 to 54 Years | 84 | 11.9% |
| 55 to 64 Years | 101 | 14.3% |
| 65 to 74 Years | 73 | 10.3% |
| 75 to 84 Years | 48 | 6.8% |
| 85 Years and Over | 30 | 4.3% |
| Total | 705 | 100.0% |
Housing Finances in Howard City
Median Income by Occupancy in Howard City
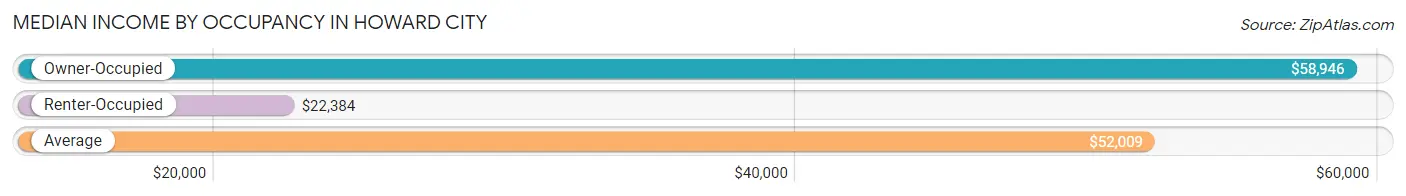
| Occupancy Type | # Households | Median Income |
| Owner-Occupied | 477 (67.7%) | $58,946 |
| Renter-Occupied | 228 (32.3%) | $22,384 |
| Average | 705 (100.0%) | $52,009 |
Occupancy by Householder Income Bracket in Howard City
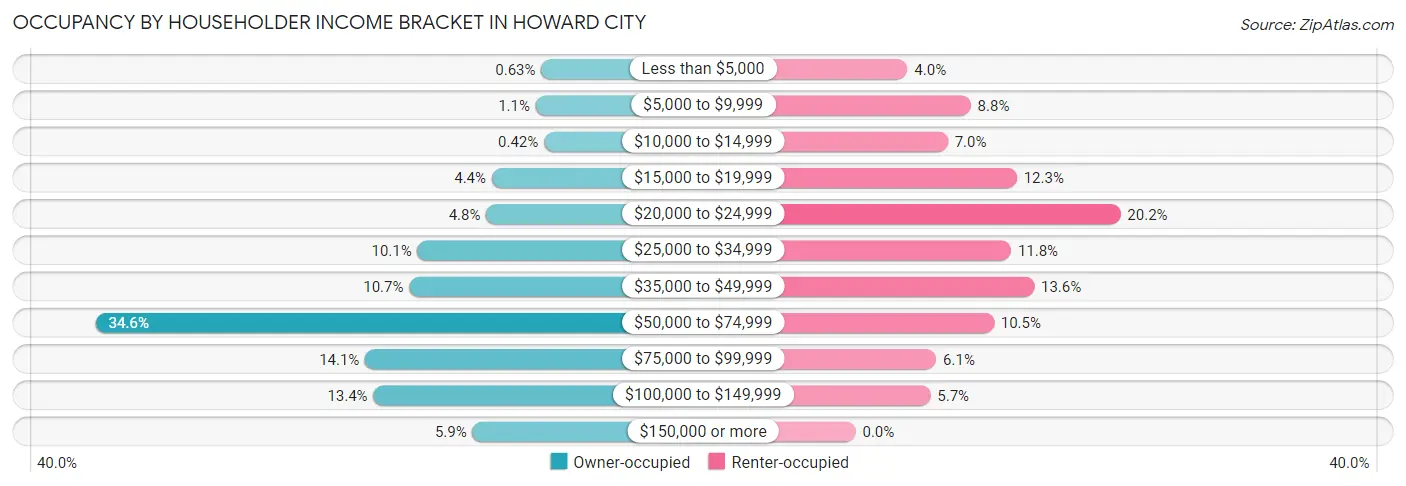
| Income Bracket | Owner-occupied | Renter-occupied |
| Less than $5,000 | 3 (0.6%) | 9 (4.0%) |
| $5,000 to $9,999 | 5 (1.1%) | 20 (8.8%) |
| $10,000 to $14,999 | 2 (0.4%) | 16 (7.0%) |
| $15,000 to $19,999 | 21 (4.4%) | 28 (12.3%) |
| $20,000 to $24,999 | 23 (4.8%) | 46 (20.2%) |
| $25,000 to $34,999 | 48 (10.1%) | 27 (11.8%) |
| $35,000 to $49,999 | 51 (10.7%) | 31 (13.6%) |
| $50,000 to $74,999 | 165 (34.6%) | 24 (10.5%) |
| $75,000 to $99,999 | 67 (14.1%) | 14 (6.1%) |
| $100,000 to $149,999 | 64 (13.4%) | 13 (5.7%) |
| $150,000 or more | 28 (5.9%) | 0 (0.0%) |
| Total | 477 (100.0%) | 228 (100.0%) |
Monthly Housing Cost Tiers in Howard City
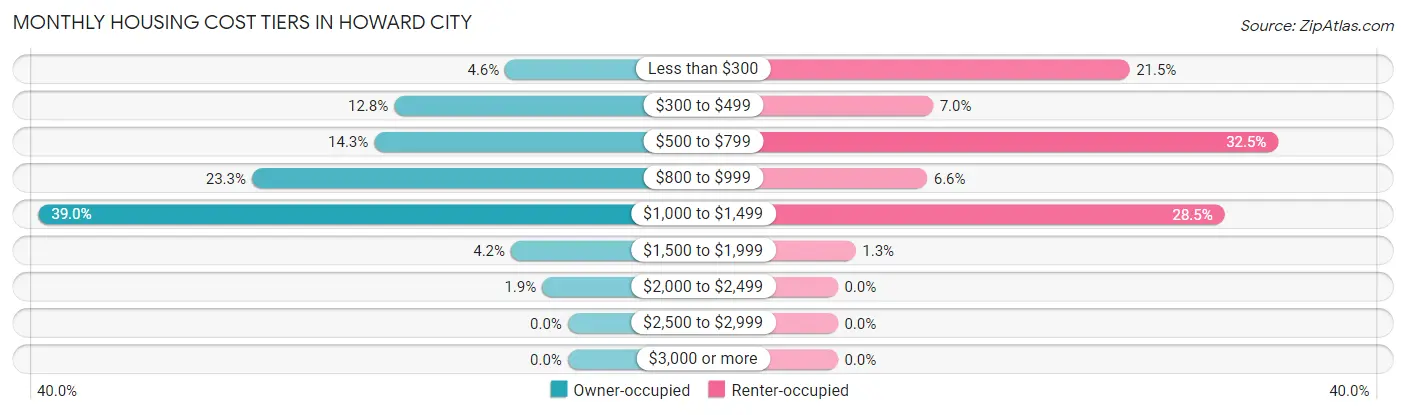
| Monthly Cost | Owner-occupied | Renter-occupied |
| Less than $300 | 22 (4.6%) | 49 (21.5%) |
| $300 to $499 | 61 (12.8%) | 16 (7.0%) |
| $500 to $799 | 68 (14.3%) | 74 (32.5%) |
| $800 to $999 | 111 (23.3%) | 15 (6.6%) |
| $1,000 to $1,499 | 186 (39.0%) | 65 (28.5%) |
| $1,500 to $1,999 | 20 (4.2%) | 3 (1.3%) |
| $2,000 to $2,499 | 9 (1.9%) | 0 (0.0%) |
| $2,500 to $2,999 | 0 (0.0%) | 0 (0.0%) |
| $3,000 or more | 0 (0.0%) | 0 (0.0%) |
| Total | 477 (100.0%) | 228 (100.0%) |
Physical Housing Characteristics in Howard City
Housing Structures in Howard City
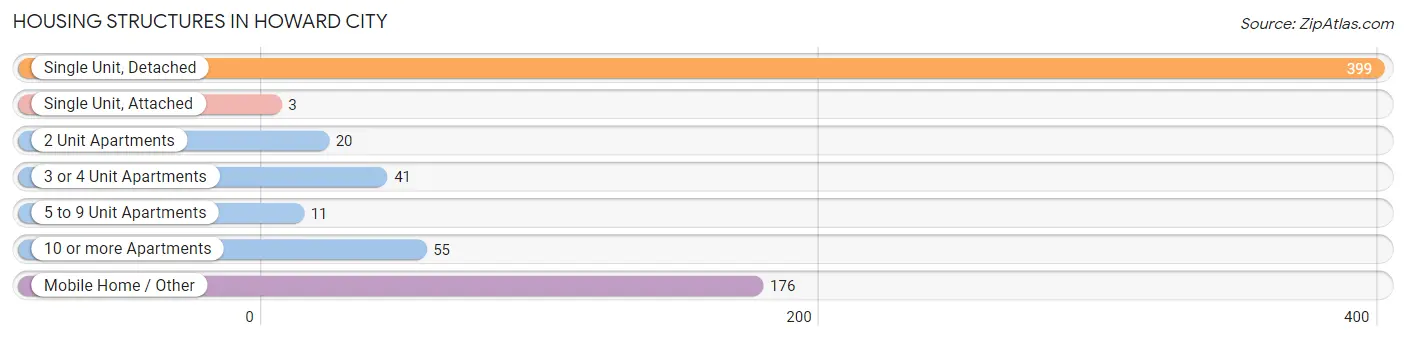
| Structure Type | # Housing Units | % Housing Units |
| Single Unit, Detached | 399 | 56.6% |
| Single Unit, Attached | 3 | 0.4% |
| 2 Unit Apartments | 20 | 2.8% |
| 3 or 4 Unit Apartments | 41 | 5.8% |
| 5 to 9 Unit Apartments | 11 | 1.6% |
| 10 or more Apartments | 55 | 7.8% |
| Mobile Home / Other | 176 | 25.0% |
| Total | 705 | 100.0% |
Housing Structures by Occupancy in Howard City
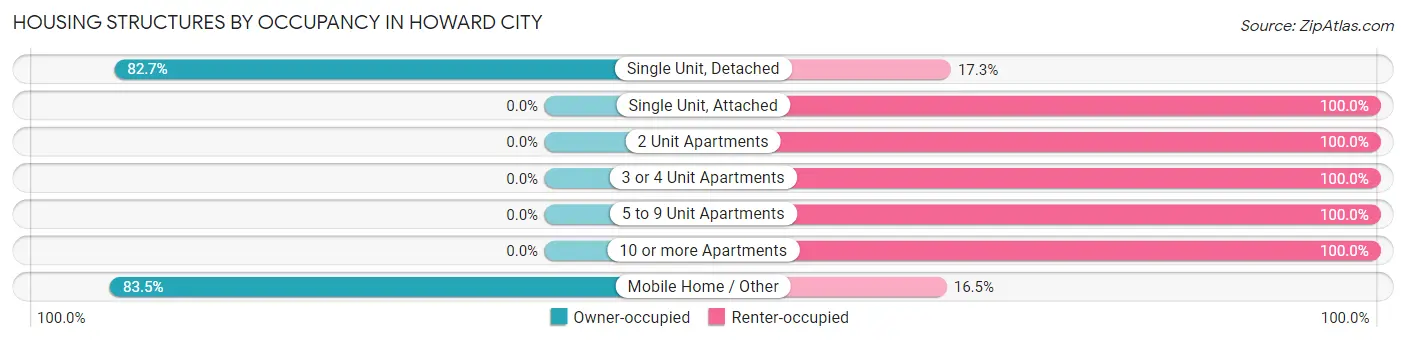
| Structure Type | Owner-occupied | Renter-occupied |
| Single Unit, Detached | 330 (82.7%) | 69 (17.3%) |
| Single Unit, Attached | 0 (0.0%) | 3 (100.0%) |
| 2 Unit Apartments | 0 (0.0%) | 20 (100.0%) |
| 3 or 4 Unit Apartments | 0 (0.0%) | 41 (100.0%) |
| 5 to 9 Unit Apartments | 0 (0.0%) | 11 (100.0%) |
| 10 or more Apartments | 0 (0.0%) | 55 (100.0%) |
| Mobile Home / Other | 147 (83.5%) | 29 (16.5%) |
| Total | 477 (67.7%) | 228 (32.3%) |
Housing Structures by Number of Rooms in Howard City
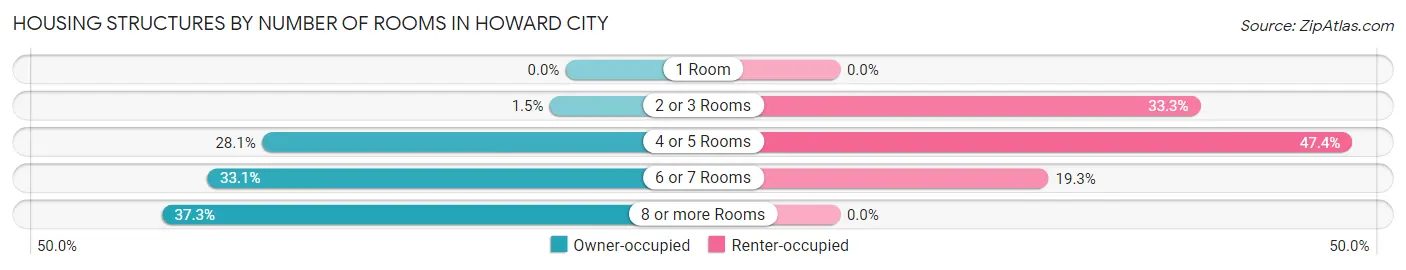
| Number of Rooms | Owner-occupied | Renter-occupied |
| 1 Room | 0 (0.0%) | 0 (0.0%) |
| 2 or 3 Rooms | 7 (1.5%) | 76 (33.3%) |
| 4 or 5 Rooms | 134 (28.1%) | 108 (47.4%) |
| 6 or 7 Rooms | 158 (33.1%) | 44 (19.3%) |
| 8 or more Rooms | 178 (37.3%) | 0 (0.0%) |
| Total | 477 (100.0%) | 228 (100.0%) |
Housing Structure by Heating Type in Howard City

| Heating Type | Owner-occupied | Renter-occupied |
| Utility Gas | 356 (74.6%) | 166 (72.8%) |
| Bottled, Tank, or LP Gas | 88 (18.4%) | 14 (6.1%) |
| Electricity | 12 (2.5%) | 34 (14.9%) |
| Fuel Oil or Kerosene | 0 (0.0%) | 0 (0.0%) |
| Coal or Coke | 0 (0.0%) | 0 (0.0%) |
| All other Fuels | 21 (4.4%) | 14 (6.1%) |
| No Fuel Used | 0 (0.0%) | 0 (0.0%) |
| Total | 477 (100.0%) | 228 (100.0%) |
Household Vehicle Usage in Howard City
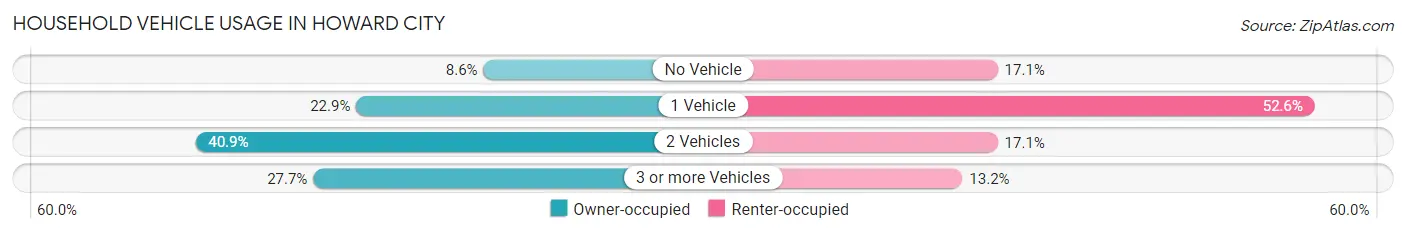
| Vehicles per Household | Owner-occupied | Renter-occupied |
| No Vehicle | 41 (8.6%) | 39 (17.1%) |
| 1 Vehicle | 109 (22.9%) | 120 (52.6%) |
| 2 Vehicles | 195 (40.9%) | 39 (17.1%) |
| 3 or more Vehicles | 132 (27.7%) | 30 (13.2%) |
| Total | 477 (100.0%) | 228 (100.0%) |
Real Estate & Mortgages in Howard City
Real Estate and Mortgage Overview in Howard City
| Characteristic | Without Mortgage | With Mortgage |
| Housing Units | 135 | 342 |
| Median Property Value | $97,500 | $121,600 |
| Median Household Income | $35,179 | $25 |
| Monthly Housing Costs | $445 | $0 |
| Real Estate Taxes | $1,133 | $30 |
Property Value by Mortgage Status in Howard City
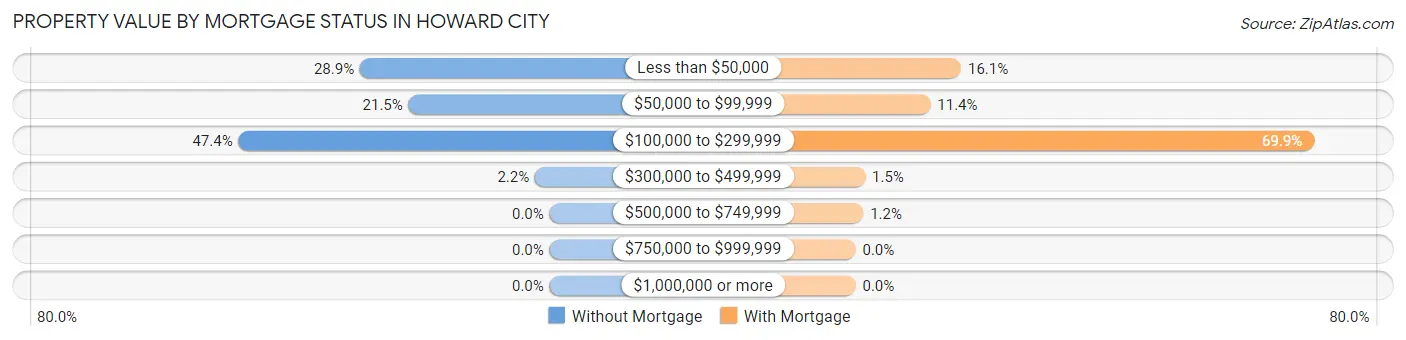
| Property Value | Without Mortgage | With Mortgage |
| Less than $50,000 | 39 (28.9%) | 55 (16.1%) |
| $50,000 to $99,999 | 29 (21.5%) | 39 (11.4%) |
| $100,000 to $299,999 | 64 (47.4%) | 239 (69.9%) |
| $300,000 to $499,999 | 3 (2.2%) | 5 (1.5%) |
| $500,000 to $749,999 | 0 (0.0%) | 4 (1.2%) |
| $750,000 to $999,999 | 0 (0.0%) | 0 (0.0%) |
| $1,000,000 or more | 0 (0.0%) | 0 (0.0%) |
| Total | 135 (100.0%) | 342 (100.0%) |
Household Income by Mortgage Status in Howard City
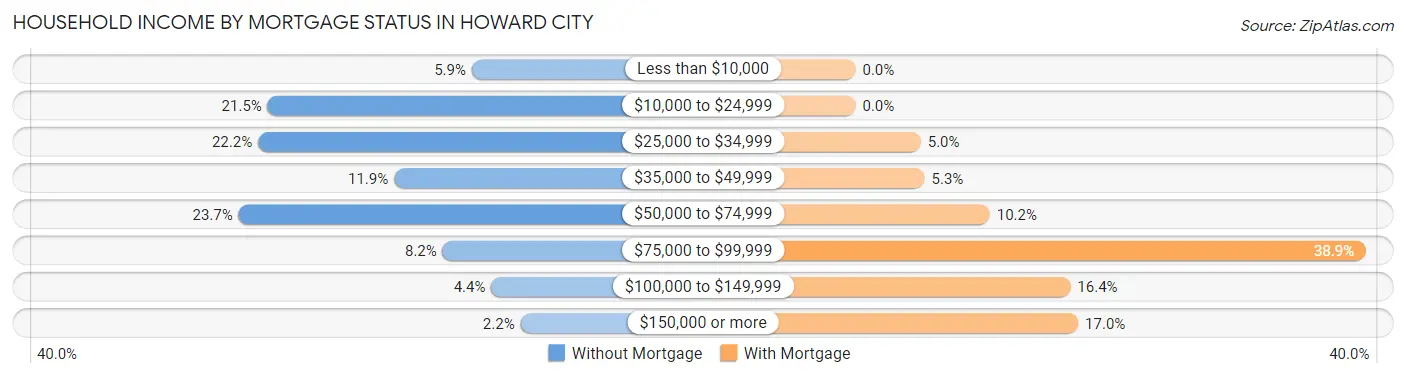
| Household Income | Without Mortgage | With Mortgage |
| Less than $10,000 | 8 (5.9%) | 0 (0.0%) |
| $10,000 to $24,999 | 29 (21.5%) | 0 (0.0%) |
| $25,000 to $34,999 | 30 (22.2%) | 17 (5.0%) |
| $35,000 to $49,999 | 16 (11.8%) | 18 (5.3%) |
| $50,000 to $74,999 | 32 (23.7%) | 35 (10.2%) |
| $75,000 to $99,999 | 11 (8.2%) | 133 (38.9%) |
| $100,000 to $149,999 | 6 (4.4%) | 56 (16.4%) |
| $150,000 or more | 3 (2.2%) | 58 (17.0%) |
| Total | 135 (100.0%) | 342 (100.0%) |
Property Value to Household Income Ratio in Howard City
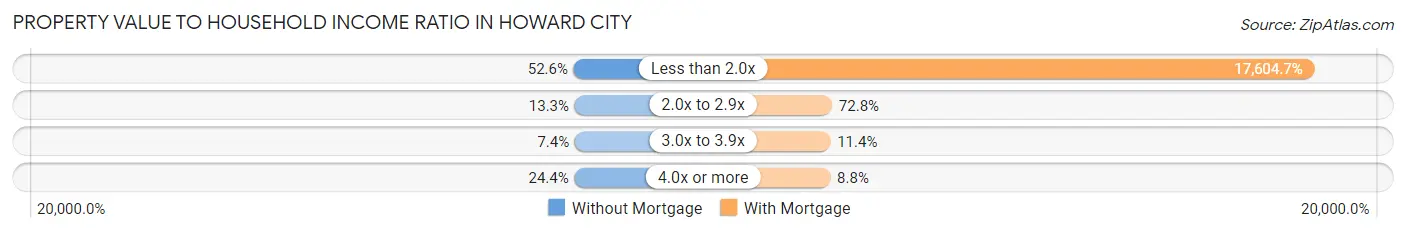
| Value-to-Income Ratio | Without Mortgage | With Mortgage |
| Less than 2.0x | 71 (52.6%) | 60,208 (17,604.7%) |
| 2.0x to 2.9x | 18 (13.3%) | 249 (72.8%) |
| 3.0x to 3.9x | 10 (7.4%) | 39 (11.4%) |
| 4.0x or more | 33 (24.4%) | 30 (8.8%) |
| Total | 135 (100.0%) | 342 (100.0%) |
Real Estate Taxes by Mortgage Status in Howard City
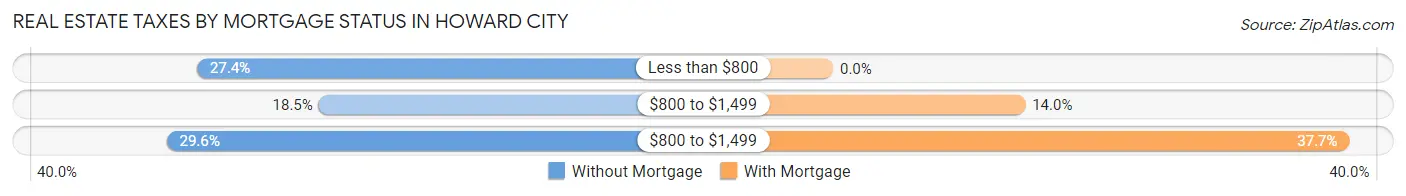
| Property Taxes | Without Mortgage | With Mortgage |
| Less than $800 | 37 (27.4%) | 0 (0.0%) |
| $800 to $1,499 | 25 (18.5%) | 48 (14.0%) |
| $800 to $1,499 | 40 (29.6%) | 129 (37.7%) |
| Total | 135 (100.0%) | 342 (100.0%) |
Health & Disability in Howard City
Health Insurance Coverage by Age in Howard City
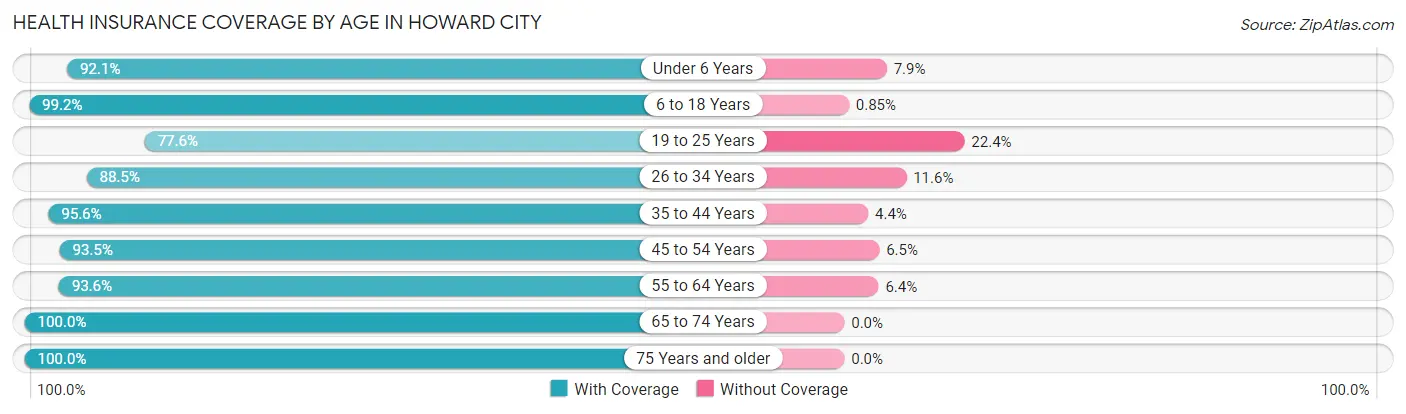
| Age Bracket | With Coverage | Without Coverage |
| Under 6 Years | 163 (92.1%) | 14 (7.9%) |
| 6 to 18 Years | 352 (99.2%) | 3 (0.9%) |
| 19 to 25 Years | 97 (77.6%) | 28 (22.4%) |
| 26 to 34 Years | 337 (88.4%) | 44 (11.6%) |
| 35 to 44 Years | 215 (95.6%) | 10 (4.4%) |
| 45 to 54 Years | 158 (93.5%) | 11 (6.5%) |
| 55 to 64 Years | 176 (93.6%) | 12 (6.4%) |
| 65 to 74 Years | 107 (100.0%) | 0 (0.0%) |
| 75 Years and older | 109 (100.0%) | 0 (0.0%) |
| Total | 1,714 (93.4%) | 122 (6.6%) |
Health Insurance Coverage by Citizenship Status in Howard City
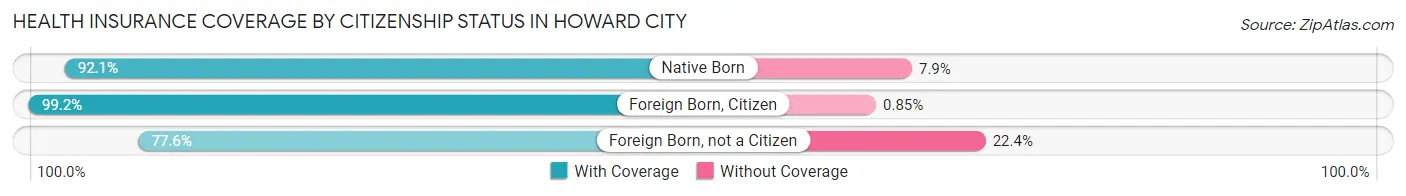
| Citizenship Status | With Coverage | Without Coverage |
| Native Born | 163 (92.1%) | 14 (7.9%) |
| Foreign Born, Citizen | 352 (99.2%) | 3 (0.9%) |
| Foreign Born, not a Citizen | 97 (77.6%) | 28 (22.4%) |
Health Insurance Coverage by Household Income in Howard City
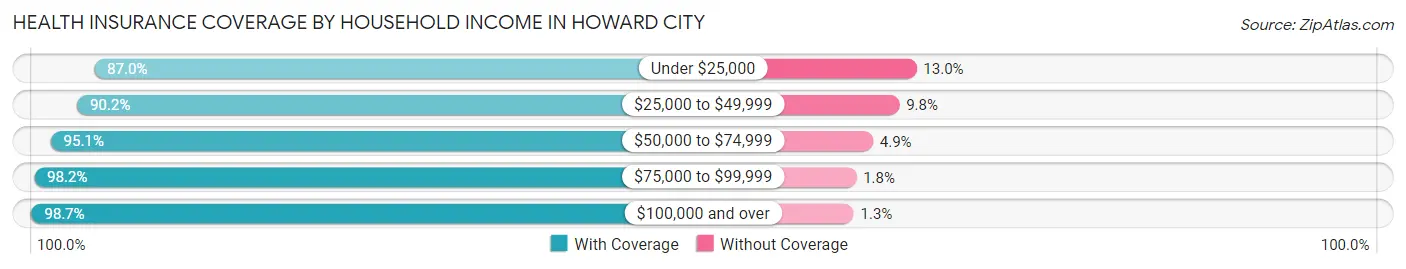
| Household Income | With Coverage | Without Coverage |
| Under $25,000 | 280 (87.0%) | 42 (13.0%) |
| $25,000 to $49,999 | 450 (90.2%) | 49 (9.8%) |
| $50,000 to $74,999 | 448 (95.1%) | 23 (4.9%) |
| $75,000 to $99,999 | 222 (98.2%) | 4 (1.8%) |
| $100,000 and over | 311 (98.7%) | 4 (1.3%) |
Public vs Private Health Insurance Coverage by Age in Howard City
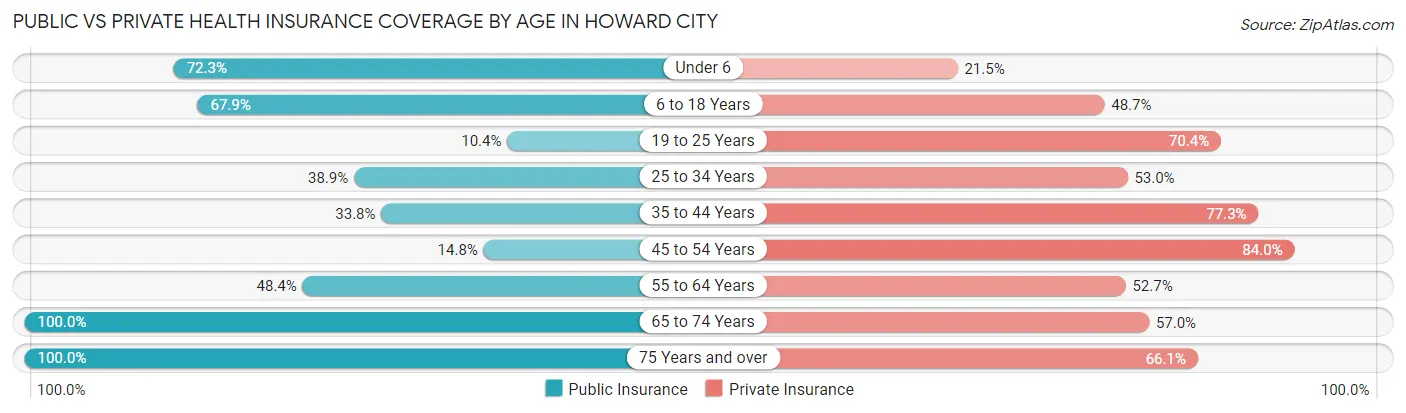
| Age Bracket | Public Insurance | Private Insurance |
| Under 6 | 128 (72.3%) | 38 (21.5%) |
| 6 to 18 Years | 241 (67.9%) | 173 (48.7%) |
| 19 to 25 Years | 13 (10.4%) | 88 (70.4%) |
| 25 to 34 Years | 148 (38.9%) | 202 (53.0%) |
| 35 to 44 Years | 76 (33.8%) | 174 (77.3%) |
| 45 to 54 Years | 25 (14.8%) | 142 (84.0%) |
| 55 to 64 Years | 91 (48.4%) | 99 (52.7%) |
| 65 to 74 Years | 107 (100.0%) | 61 (57.0%) |
| 75 Years and over | 109 (100.0%) | 72 (66.1%) |
| Total | 938 (51.1%) | 1,049 (57.1%) |
Disability Status by Sex by Age in Howard City
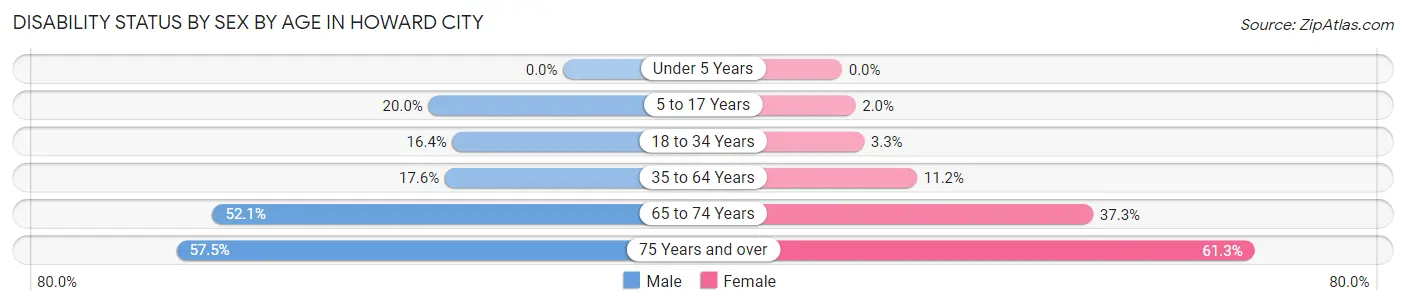
| Age Bracket | Male | Female |
| Under 5 Years | 0 (0.0%) | 0 (0.0%) |
| 5 to 17 Years | 31 (20.0%) | 4 (2.0%) |
| 18 to 34 Years | 49 (16.4%) | 7 (3.3%) |
| 35 to 64 Years | 55 (17.6%) | 30 (11.2%) |
| 65 to 74 Years | 25 (52.1%) | 22 (37.3%) |
| 75 Years and over | 27 (57.5%) | 38 (61.3%) |
Disability Class by Sex by Age in Howard City
Disability Class: Hearing Difficulty
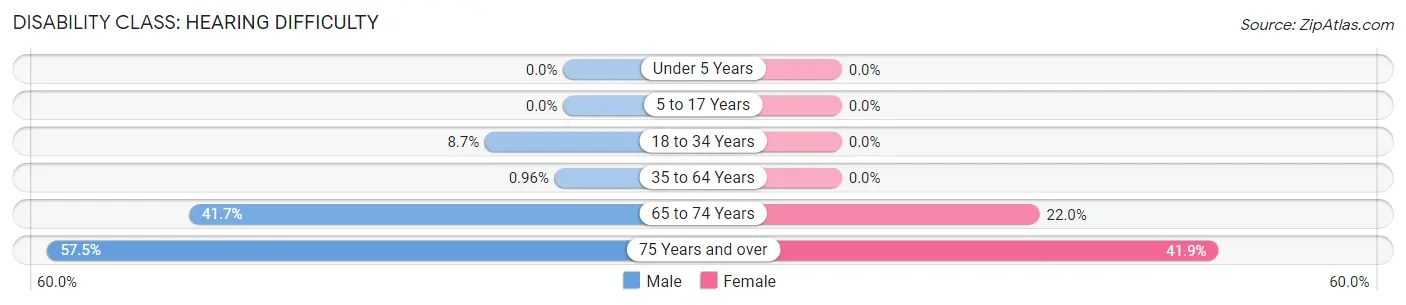
| Age Bracket | Male | Female |
| Under 5 Years | 0 (0.0%) | 0 (0.0%) |
| 5 to 17 Years | 0 (0.0%) | 0 (0.0%) |
| 18 to 34 Years | 26 (8.7%) | 0 (0.0%) |
| 35 to 64 Years | 3 (1.0%) | 0 (0.0%) |
| 65 to 74 Years | 20 (41.7%) | 13 (22.0%) |
| 75 Years and over | 27 (57.5%) | 26 (41.9%) |
Disability Class: Vision Difficulty
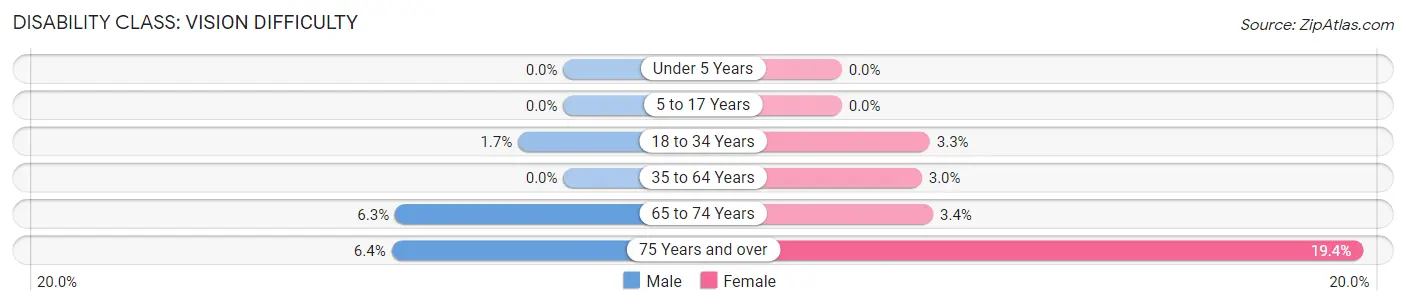
| Age Bracket | Male | Female |
| Under 5 Years | 0 (0.0%) | 0 (0.0%) |
| 5 to 17 Years | 0 (0.0%) | 0 (0.0%) |
| 18 to 34 Years | 5 (1.7%) | 7 (3.3%) |
| 35 to 64 Years | 0 (0.0%) | 8 (3.0%) |
| 65 to 74 Years | 3 (6.2%) | 2 (3.4%) |
| 75 Years and over | 3 (6.4%) | 12 (19.4%) |
Disability Class: Cognitive Difficulty
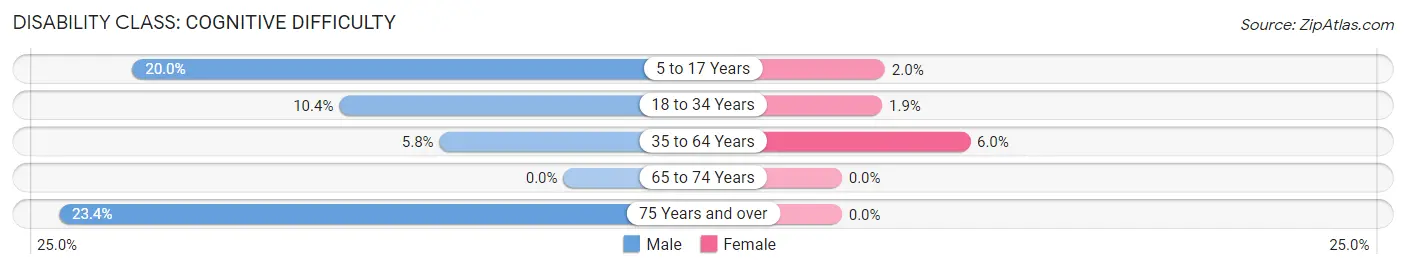
| Age Bracket | Male | Female |
| 5 to 17 Years | 31 (20.0%) | 4 (2.0%) |
| 18 to 34 Years | 31 (10.4%) | 4 (1.9%) |
| 35 to 64 Years | 18 (5.8%) | 16 (5.9%) |
| 65 to 74 Years | 0 (0.0%) | 0 (0.0%) |
| 75 Years and over | 11 (23.4%) | 0 (0.0%) |
Disability Class: Ambulatory Difficulty
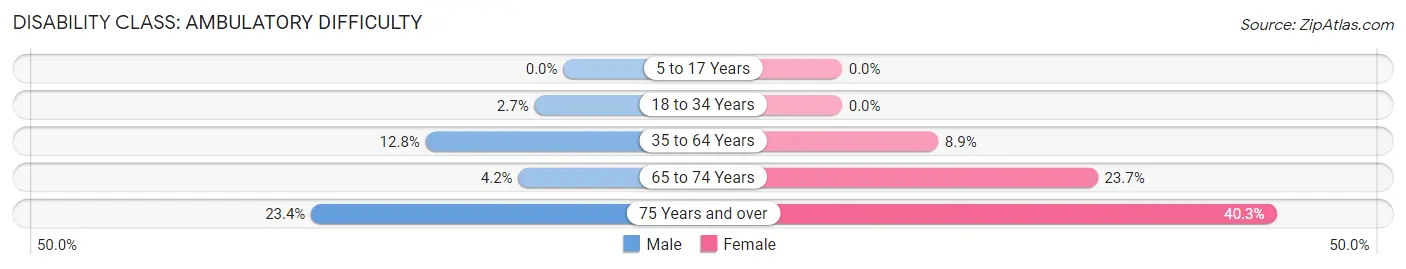
| Age Bracket | Male | Female |
| 5 to 17 Years | 0 (0.0%) | 0 (0.0%) |
| 18 to 34 Years | 8 (2.7%) | 0 (0.0%) |
| 35 to 64 Years | 40 (12.8%) | 24 (8.9%) |
| 65 to 74 Years | 2 (4.2%) | 14 (23.7%) |
| 75 Years and over | 11 (23.4%) | 25 (40.3%) |
Disability Class: Self-Care Difficulty
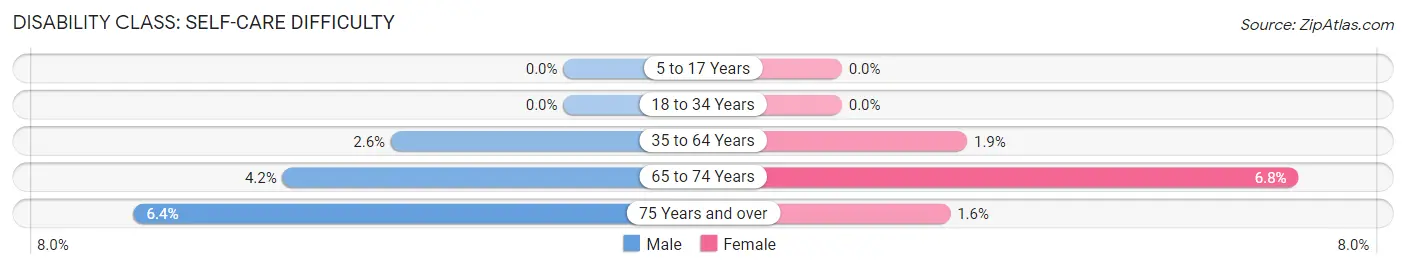
| Age Bracket | Male | Female |
| 5 to 17 Years | 0 (0.0%) | 0 (0.0%) |
| 18 to 34 Years | 0 (0.0%) | 0 (0.0%) |
| 35 to 64 Years | 8 (2.6%) | 5 (1.9%) |
| 65 to 74 Years | 2 (4.2%) | 4 (6.8%) |
| 75 Years and over | 3 (6.4%) | 1 (1.6%) |
Technology Access in Howard City
Computing Device Access in Howard City
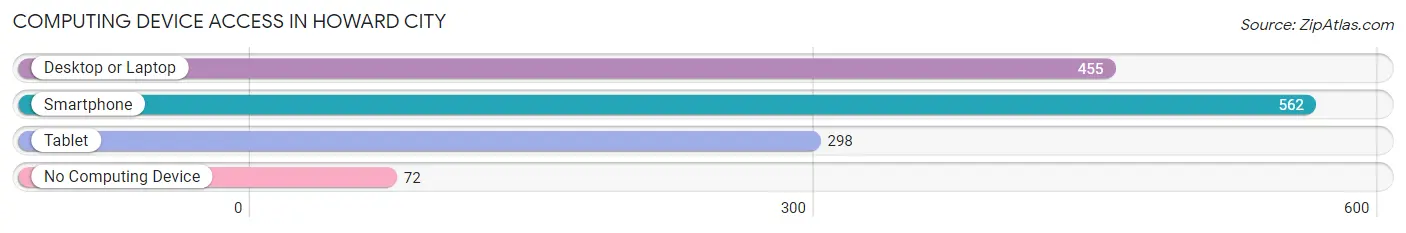
| Device Type | # Households | % Households |
| Desktop or Laptop | 455 | 64.5% |
| Smartphone | 562 | 79.7% |
| Tablet | 298 | 42.3% |
| No Computing Device | 72 | 10.2% |
| Total | 705 | 100.0% |
Internet Access in Howard City
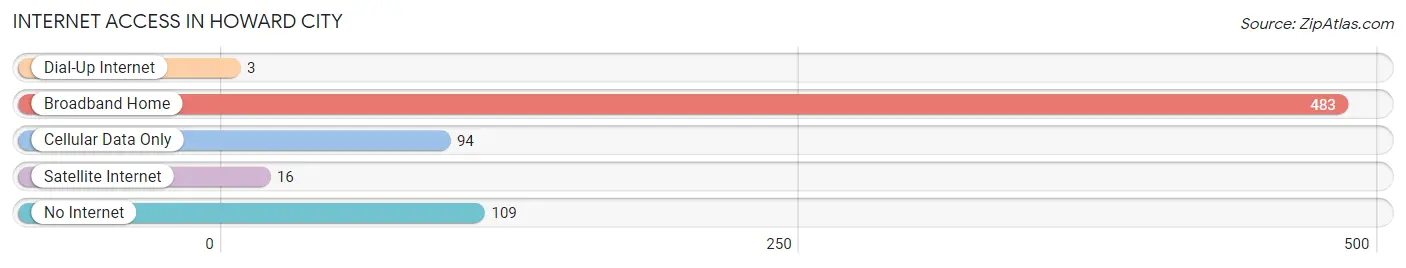
| Internet Type | # Households | % Households |
| Dial-Up Internet | 3 | 0.4% |
| Broadband Home | 483 | 68.5% |
| Cellular Data Only | 94 | 13.3% |
| Satellite Internet | 16 | 2.3% |
| No Internet | 109 | 15.5% |
| Total | 705 | 100.0% |
Howard City Summary
History
Howard City is a small village located in Montcalm County, Michigan. It was founded in 1871 by William Howard, a lumberman from New York. The village was originally called Howard’s Corners, but was later changed to Howard City. The village was incorporated in 1887 and has since grown to a population of 1,845 as of the 2010 census.
The village was originally a lumber town, with the first sawmill being built in 1872. The sawmill was owned by William Howard and was the first of many sawmills that would be built in the area. The lumber industry was the main source of income for the village until the early 1900s when the industry began to decline.
In the early 1900s, the village began to transition to a farming community. The village was home to several dairy farms and other agricultural businesses. The village also had a few small businesses, such as a general store, a blacksmith shop, and a hotel.
In the 1950s, the village began to experience a population boom as people moved to the area from other parts of the state. This population growth was due to the availability of jobs in the area, as well as the proximity to Grand Rapids.
Geography
Howard City is located in Montcalm County, Michigan. It is situated on the Flat River, which is a tributary of the Grand River. The village is located approximately 25 miles northeast of Grand Rapids and is bordered by the townships of Reynolds, Ensley, and Winfield.
The village has a total area of 1.3 square miles, all of which is land. The terrain is mostly flat, with some rolling hills in the area. The village is located in a rural area, with the nearest large city being Grand Rapids.
Economy
The economy of Howard City is largely based on agriculture and tourism. The village is home to several dairy farms, as well as other agricultural businesses. The village also has a few small businesses, such as a general store, a blacksmith shop, and a hotel.
The village is also home to several tourist attractions, such as the Howard City Historical Museum, the Howard City Skate Park, and the Howard City Speedway. The village also hosts several annual events, such as the Howard City Days Festival and the Howard City Car Show.
Demographics
As of the 2010 census, the population of Howard City was 1,845. The racial makeup of the village was 95.3% White, 0.7% African American, 0.3% Native American, 0.7% Asian, 0.1% Pacific Islander, 1.2% from other races, and 1.8% from two or more races. Hispanic or Latino of any race were 3.2% of the population.
The median household income in Howard City was $41,250, and the median family income was $50,000. The per capita income for the village was $20,845. About 11.2% of families and 14.2% of the population were below the poverty line, including 19.2% of those under age 18 and 8.3% of those age 65 or over.
Common Questions
What is Per Capita Income in Howard City?
Per Capita income in Howard City is $24,644.
What is the Median Family Income in Howard City?
Median Family Income in Howard City is $57,857.
What is the Median Household income in Howard City?
Median Household Income in Howard City is $52,009.
What is Income or Wage Gap in Howard City?
Income or Wage Gap in Howard City is 4.7%.
Women in Howard City earn 95.3 cents for every dollar earned by a man.
What is Family Income Deficit in Howard City?
Family Income Deficit in Howard City is $12,144.
Families that are below poverty line in Howard City earn $12,144 less on average than the poverty threshold level.
What is Inequality or Gini Index in Howard City?
Inequality or Gini Index in Howard City is 0.40.
What is the Total Population of Howard City?
Total Population of Howard City is 1,836.
What is the Total Male Population of Howard City?
Total Male Population of Howard City is 963.
What is the Total Female Population of Howard City?
Total Female Population of Howard City is 873.
What is the Ratio of Males per 100 Females in Howard City?
There are 110.31 Males per 100 Females in Howard City.
What is the Ratio of Females per 100 Males in Howard City?
There are 90.65 Females per 100 Males in Howard City.
What is the Median Population Age in Howard City?
Median Population Age in Howard City is 31.3 Years.
What is the Average Family Size in Howard City
Average Family Size in Howard City is 3.2 People.
What is the Average Household Size in Howard City
Average Household Size in Howard City is 2.6 People.
How Large is the Labor Force in Howard City?
There are 866 People in the Labor Forcein in Howard City.
What is the Percentage of People in the Labor Force in Howard City?
64.8% of People are in the Labor Force in Howard City.
What is the Unemployment Rate in Howard City?
Unemployment Rate in Howard City is 1.5%.