Mount Morris, MI Map & Demographics
Mount Morris Map
Mount Morris Overview
$18,780
PER CAPITA INCOME
$44,836
AVG FAMILY INCOME
$40,714
AVG HOUSEHOLD INCOME
39.4%
WAGE / INCOME GAP [ % ]
60.6¢/ $1
WAGE / INCOME GAP [ $ ]
0.37
INEQUALITY / GINI INDEX
3,147
TOTAL POPULATION
1,597
MALE POPULATION
1,550
FEMALE POPULATION
103.03
MALES / 100 FEMALES
97.06
FEMALES / 100 MALES
32.8
MEDIAN AGE
3.0
AVG FAMILY SIZE
2.4
AVG HOUSEHOLD SIZE
1,376
LABOR FORCE [ PEOPLE ]
55.7%
PERCENT IN LABOR FORCE
18.5%
UNEMPLOYMENT RATE
Mount Morris Zip Codes
Mount Morris Area Codes
Income in Mount Morris
Income Overview in Mount Morris
Per Capita Income in Mount Morris is $18,780, while median incomes of families and households are $44,836 and $40,714 respectively.
| Characteristic | Number | Measure |
| Per Capita Income | 3,147 | $18,780 |
| Median Family Income | 785 | $44,836 |
| Mean Family Income | 785 | $50,269 |
| Median Household Income | 1,306 | $40,714 |
| Mean Household Income | 1,306 | $45,076 |
| Income Deficit | 785 | $0 |
| Wage / Income Gap (%) | 3,147 | 39.36% |
| Wage / Income Gap ($) | 3,147 | 60.64¢ per $1 |
| Gini / Inequality Index | 3,147 | 0.37 |
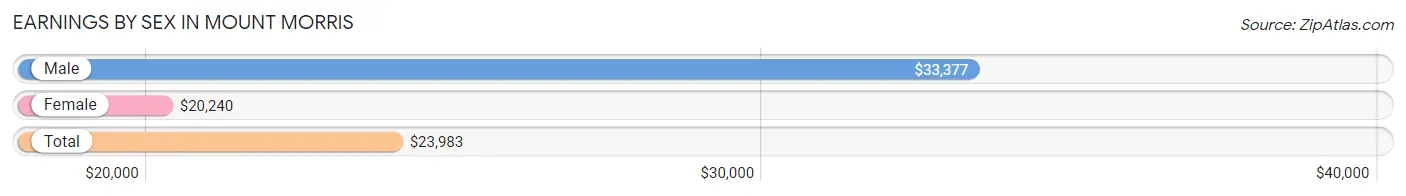
Earnings by Sex in Mount Morris
Average Earnings in Mount Morris are $23,983, $33,377 for men and $20,240 for women, a difference of 39.4%.
| Sex | Number | Average Earnings |
| Male | 765 (57.0%) | $33,377 |
| Female | 578 (43.0%) | $20,240 |
| Total | 1,343 (100.0%) | $23,983 |
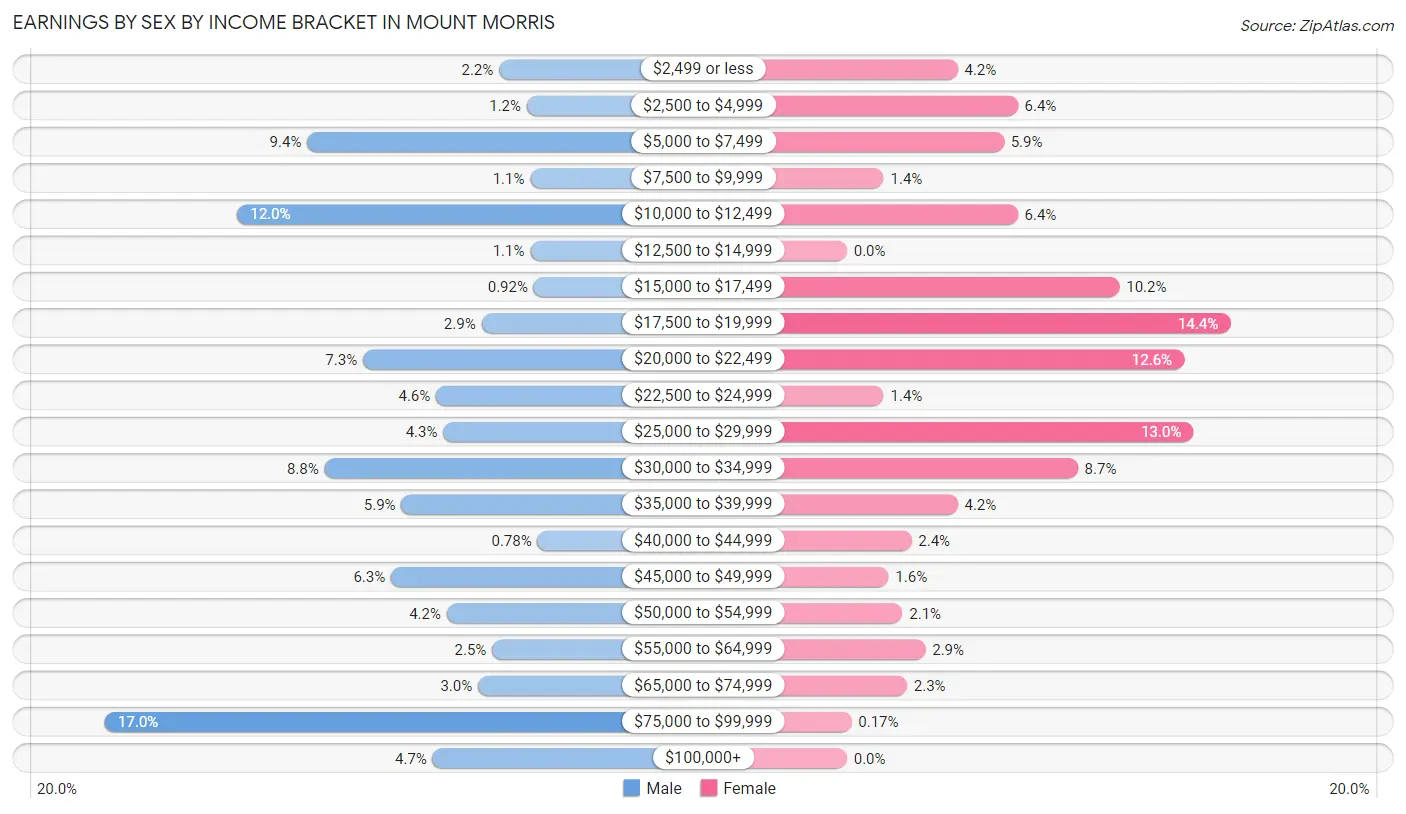
Earnings by Sex by Income Bracket in Mount Morris
The most common earnings brackets in Mount Morris are $75,000 to $99,999 for men (130 | 17.0%) and $17,500 to $19,999 for women (83 | 14.4%).
| Income | Male | Female |
| $2,499 or less | 17 (2.2%) | 24 (4.2%) |
| $2,500 to $4,999 | 9 (1.2%) | 37 (6.4%) |
| $5,000 to $7,499 | 72 (9.4%) | 34 (5.9%) |
| $7,500 to $9,999 | 8 (1.1%) | 8 (1.4%) |
| $10,000 to $12,499 | 92 (12.0%) | 37 (6.4%) |
| $12,500 to $14,999 | 8 (1.1%) | 0 (0.0%) |
| $15,000 to $17,499 | 7 (0.9%) | 59 (10.2%) |
| $17,500 to $19,999 | 22 (2.9%) | 83 (14.4%) |
| $20,000 to $22,499 | 56 (7.3%) | 73 (12.6%) |
| $22,500 to $24,999 | 35 (4.6%) | 8 (1.4%) |
| $25,000 to $29,999 | 33 (4.3%) | 75 (13.0%) |
| $30,000 to $34,999 | 67 (8.8%) | 50 (8.6%) |
| $35,000 to $39,999 | 45 (5.9%) | 24 (4.2%) |
| $40,000 to $44,999 | 6 (0.8%) | 14 (2.4%) |
| $45,000 to $49,999 | 48 (6.3%) | 9 (1.6%) |
| $50,000 to $54,999 | 32 (4.2%) | 12 (2.1%) |
| $55,000 to $64,999 | 19 (2.5%) | 17 (2.9%) |
| $65,000 to $74,999 | 23 (3.0%) | 13 (2.2%) |
| $75,000 to $99,999 | 130 (17.0%) | 1 (0.2%) |
| $100,000+ | 36 (4.7%) | 0 (0.0%) |
| Total | 765 (100.0%) | 578 (100.0%) |
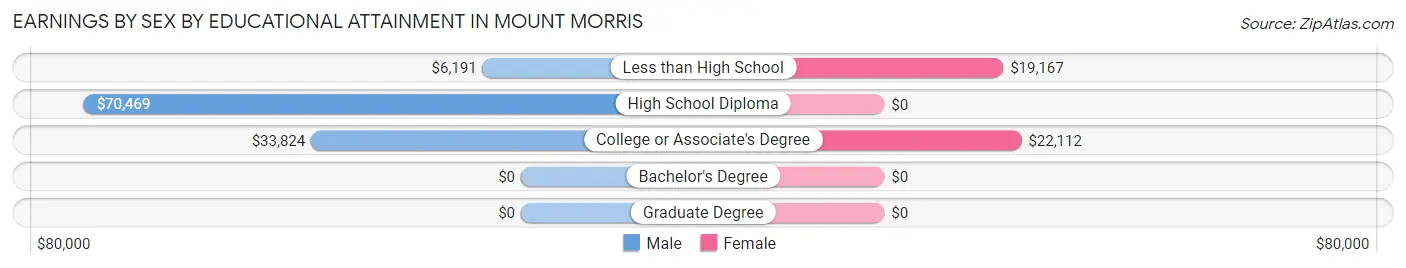
Earnings by Sex by Educational Attainment in Mount Morris
Average earnings in Mount Morris are $36,532 for men and $21,233 for women, a difference of 41.9%. Men with an educational attainment of high school diploma enjoy the highest average annual earnings of $70,469, while those with less than high school education earn the least with $6,191. Women with an educational attainment of college or associate's degree earn the most with the average annual earnings of $22,112, while those with less than high school education have the smallest earnings of $19,167.
| Educational Attainment | Male Income | Female Income |
| Less than High School | $6,191 | $19,167 |
| High School Diploma | $70,469 | $0 |
| College or Associate's Degree | $33,824 | $22,112 |
| Bachelor's Degree | - | - |
| Graduate Degree | - | - |
| Total | $36,532 | $21,233 |
Family Income in Mount Morris
Family Income Brackets in Mount Morris
According to the Mount Morris family income data, there are 171 families falling into the $75,000 to $99,999 income range, which is the most common income bracket and makes up 21.8% of all families.
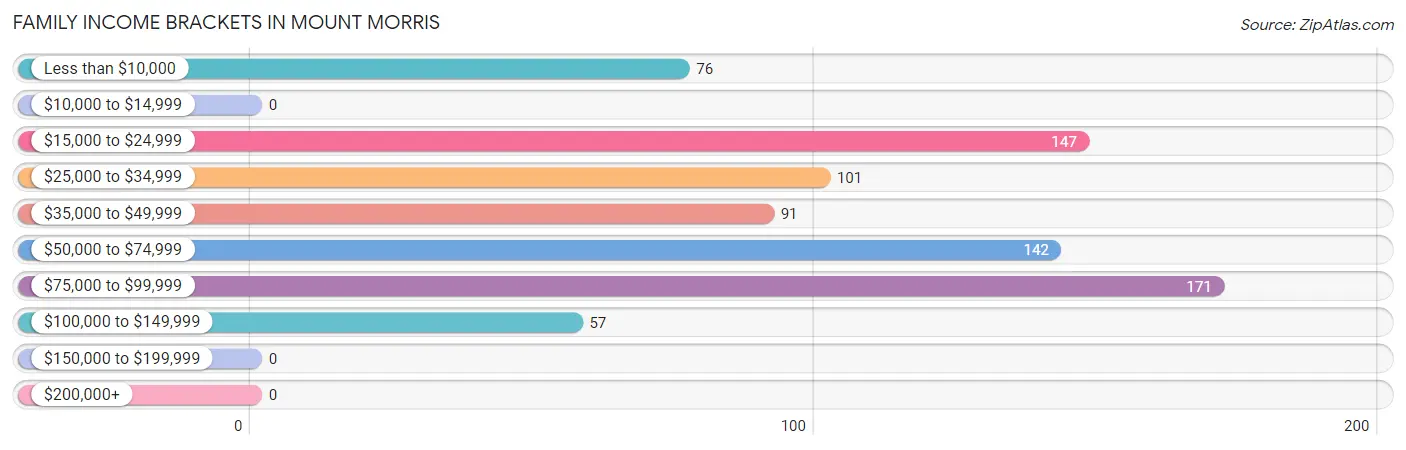
| Income Bracket | # Families | % Families |
| Less than $10,000 | 76 | 9.7% |
| $10,000 to $14,999 | 0 | 0.0% |
| $15,000 to $24,999 | 147 | 18.7% |
| $25,000 to $34,999 | 101 | 12.9% |
| $35,000 to $49,999 | 91 | 11.6% |
| $50,000 to $74,999 | 142 | 18.1% |
| $75,000 to $99,999 | 171 | 21.8% |
| $100,000 to $149,999 | 57 | 7.3% |
| $150,000 to $199,999 | 0 | 0.0% |
| $200,000+ | 0 | 0.0% |
Family Income by Famaliy Size in Mount Morris
4-person families (78 | 9.9%) account for the highest median family income in Mount Morris with $61,818 per family, while 2-person families (297 | 37.8%) have the highest median income of $21,464 per family member.
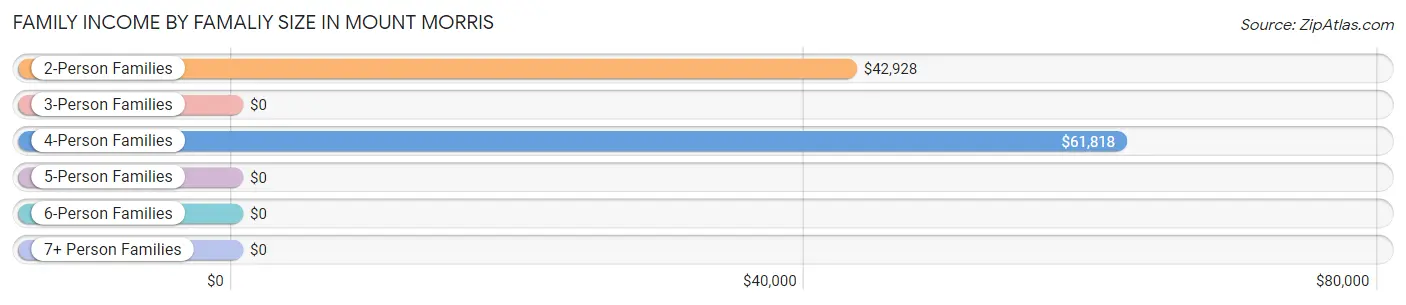
| Income Bracket | # Families | Median Income |
| 2-Person Families | 297 (37.8%) | $42,928 |
| 3-Person Families | 330 (42.0%) | $0 |
| 4-Person Families | 78 (9.9%) | $61,818 |
| 5-Person Families | 60 (7.6%) | $0 |
| 6-Person Families | 20 (2.5%) | $0 |
| 7+ Person Families | 0 (0.0%) | $0 |
| Total | 785 (100.0%) | $44,836 |
Family Income by Number of Earners in Mount Morris
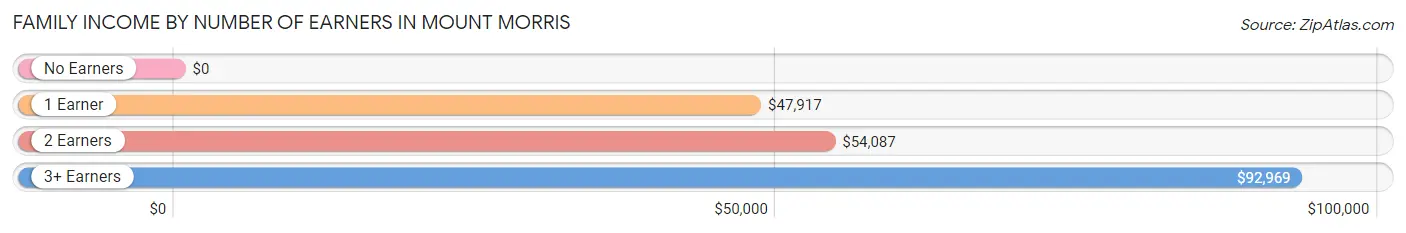
| Number of Earners | # Families | Median Income |
| No Earners | 169 (21.5%) | $0 |
| 1 Earner | 434 (55.3%) | $47,917 |
| 2 Earners | 139 (17.7%) | $54,087 |
| 3+ Earners | 43 (5.5%) | $92,969 |
| Total | 785 (100.0%) | $44,836 |
Household Income in Mount Morris
Household Income Brackets in Mount Morris
With 259 households falling in the category, the $35,000 to $49,999 income range is the most frequent in Mount Morris, accounting for 19.8% of all households.
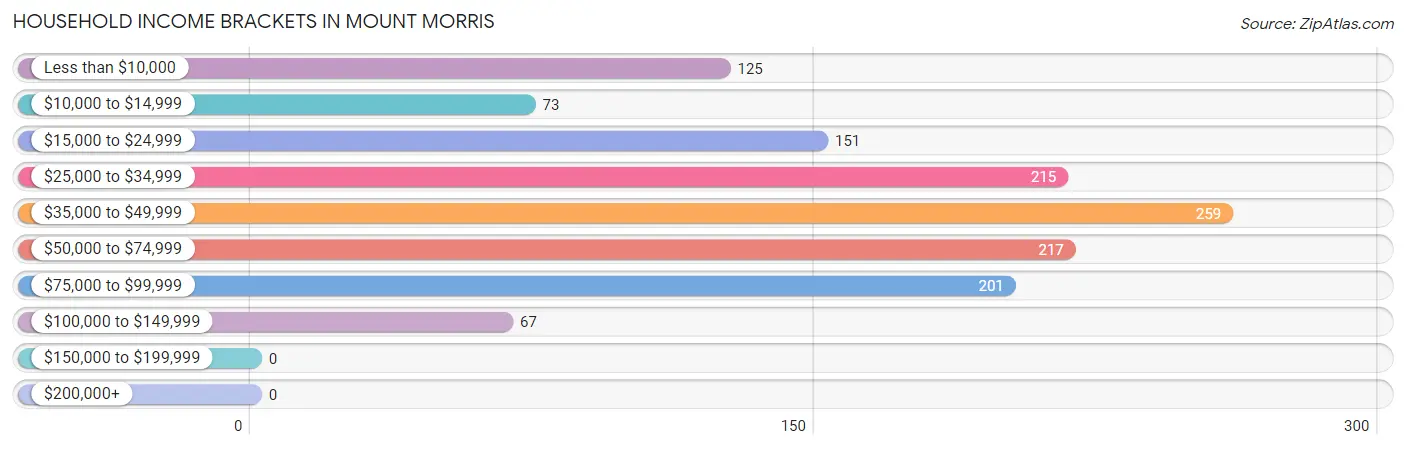
| Income Bracket | # Households | % Households |
| Less than $10,000 | 125 | 9.6% |
| $10,000 to $14,999 | 73 | 5.6% |
| $15,000 to $24,999 | 151 | 11.6% |
| $25,000 to $34,999 | 215 | 16.5% |
| $35,000 to $49,999 | 259 | 19.8% |
| $50,000 to $74,999 | 217 | 16.6% |
| $75,000 to $99,999 | 201 | 15.4% |
| $100,000 to $149,999 | 67 | 5.1% |
| $150,000 to $199,999 | 0 | 0.0% |
| $200,000+ | 0 | 0.0% |
Household Income by Householder Age in Mount Morris
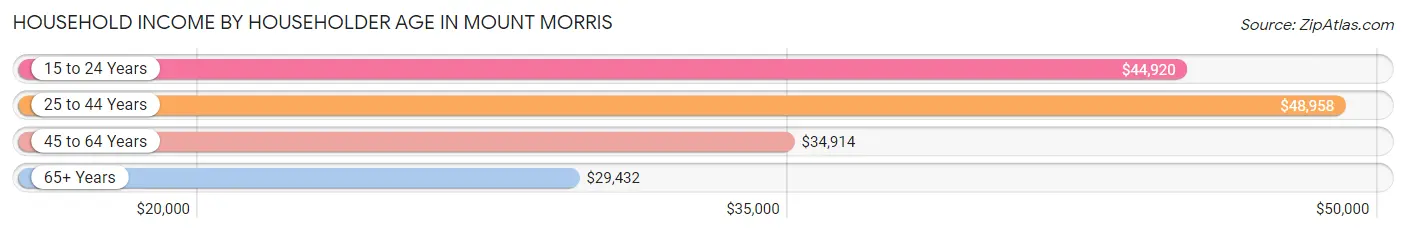
The median household income in Mount Morris is $40,714, with the highest median household income of $48,958 found in the 25 to 44 years age bracket for the primary householder. A total of 515 households (39.4%) fall into this category. Meanwhile, the 65+ years age bracket for the primary householder has the lowest median household income of $29,432, with 186 households (14.2%) in this group.
| Income Bracket | # Households | Median Income |
| 15 to 24 Years | 111 (8.5%) | $44,920 |
| 25 to 44 Years | 515 (39.4%) | $48,958 |
| 45 to 64 Years | 494 (37.8%) | $34,914 |
| 65+ Years | 186 (14.2%) | $29,432 |
| Total | 1,306 (100.0%) | $40,714 |
Poverty in Mount Morris
Income Below Poverty by Sex and Age in Mount Morris
With 31.5% poverty level for males and 29.3% for females among the residents of Mount Morris, under 5 year old males and 6 to 11 year old females are the most vulnerable to poverty, with 116 males (78.4%) and 99 females (60.7%) in their respective age groups living below the poverty level.
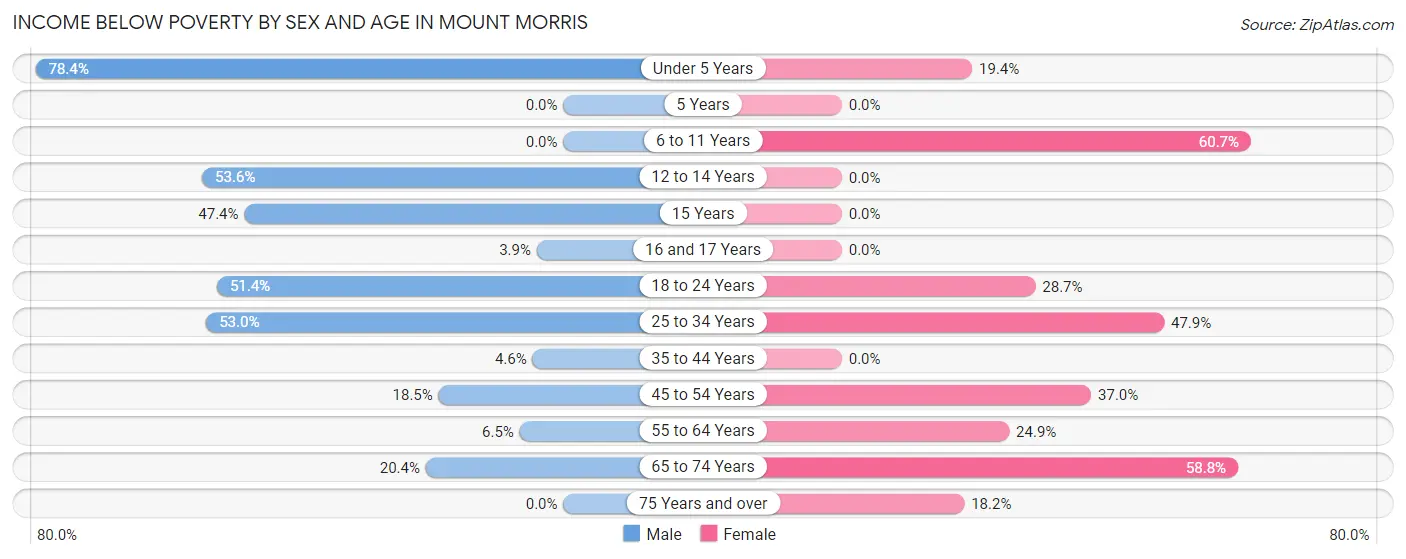
| Age Bracket | Male | Female |
| Under 5 Years | 116 (78.4%) | 12 (19.4%) |
| 5 Years | 0 (0.0%) | 0 (0.0%) |
| 6 to 11 Years | 0 (0.0%) | 99 (60.7%) |
| 12 to 14 Years | 59 (53.6%) | 0 (0.0%) |
| 15 Years | 9 (47.4%) | 0 (0.0%) |
| 16 and 17 Years | 5 (3.9%) | 0 (0.0%) |
| 18 to 24 Years | 162 (51.4%) | 48 (28.7%) |
| 25 to 34 Years | 79 (53.0%) | 78 (47.8%) |
| 35 to 44 Years | 9 (4.6%) | 0 (0.0%) |
| 45 to 54 Years | 30 (18.5%) | 77 (37.0%) |
| 55 to 64 Years | 12 (6.5%) | 42 (24.8%) |
| 65 to 74 Years | 19 (20.4%) | 90 (58.8%) |
| 75 Years and over | 0 (0.0%) | 8 (18.2%) |
| Total | 500 (31.5%) | 454 (29.3%) |
Income Above Poverty by Sex and Age in Mount Morris
According to the poverty statistics in Mount Morris, males aged 5 years and females aged 12 to 14 years are the age groups that are most secure financially, with 100.0% of males and 100.0% of females in these age groups living above the poverty line.
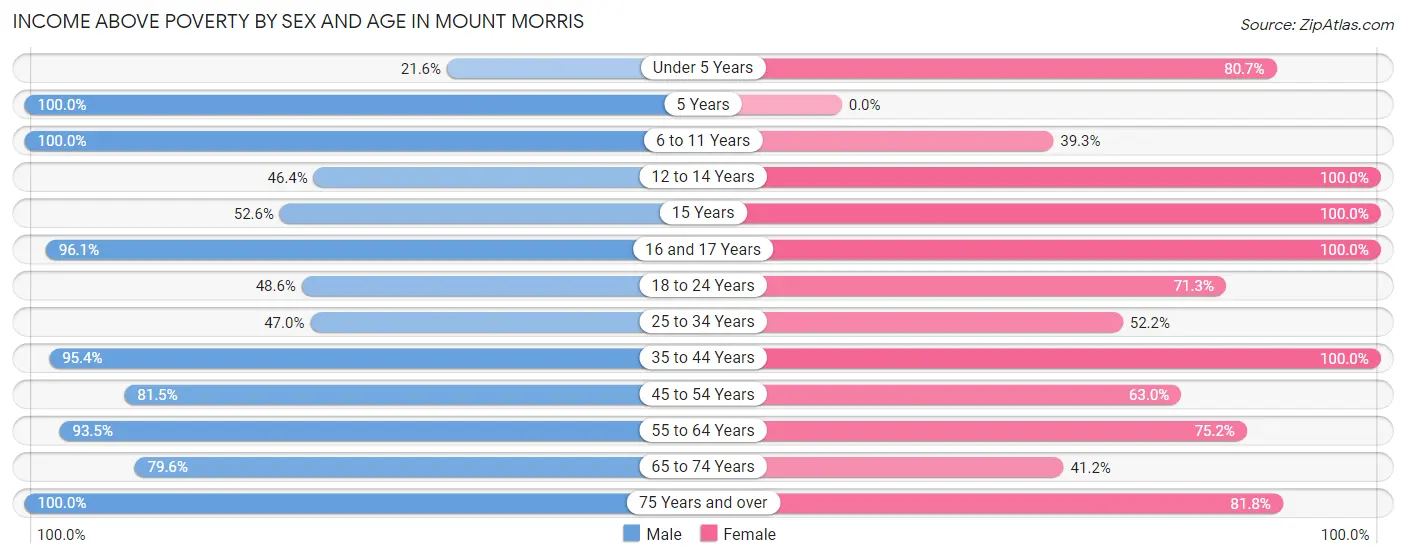
| Age Bracket | Male | Female |
| Under 5 Years | 32 (21.6%) | 50 (80.6%) |
| 5 Years | 8 (100.0%) | 0 (0.0%) |
| 6 to 11 Years | 46 (100.0%) | 64 (39.3%) |
| 12 to 14 Years | 51 (46.4%) | 56 (100.0%) |
| 15 Years | 10 (52.6%) | 56 (100.0%) |
| 16 and 17 Years | 122 (96.1%) | 8 (100.0%) |
| 18 to 24 Years | 153 (48.6%) | 119 (71.3%) |
| 25 to 34 Years | 70 (47.0%) | 85 (52.1%) |
| 35 to 44 Years | 188 (95.4%) | 301 (100.0%) |
| 45 to 54 Years | 132 (81.5%) | 131 (63.0%) |
| 55 to 64 Years | 173 (93.5%) | 127 (75.1%) |
| 65 to 74 Years | 74 (79.6%) | 63 (41.2%) |
| 75 Years and over | 30 (100.0%) | 36 (81.8%) |
| Total | 1,089 (68.5%) | 1,096 (70.7%) |
Income Below Poverty Among Married-Couple Families in Mount Morris
| Children | Above Poverty | Below Poverty |
| No Children | 170 (100.0%) | 0 (0.0%) |
| 1 or 2 Children | 221 (100.0%) | 0 (0.0%) |
| 3 or 4 Children | 20 (100.0%) | 0 (0.0%) |
| 5 or more Children | 0 (0.0%) | 0 (0.0%) |
| Total | 411 (100.0%) | 0 (0.0%) |
Income Below Poverty Among Single-Parent Households in Mount Morris
According to the poverty data in Mount Morris, 72.8% or 59 single-father households and 43.3% or 127 single-mother households are living below the poverty line. Among single-father households, those with 1 or 2 children have the highest poverty rate, with 59 households (72.8%) experiencing poverty. Likewise, among single-mother households, those with 3 or 4 children have the highest poverty rate, with 51 households (100.0%) falling below the poverty line.
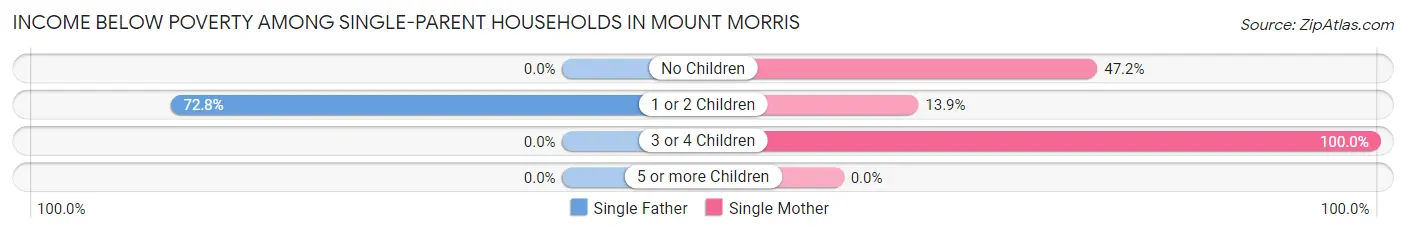
| Children | Single Father | Single Mother |
| No Children | 0 (0.0%) | 60 (47.2%) |
| 1 or 2 Children | 59 (72.8%) | 16 (13.9%) |
| 3 or 4 Children | 0 (0.0%) | 51 (100.0%) |
| 5 or more Children | 0 (0.0%) | 0 (0.0%) |
| Total | 59 (72.8%) | 127 (43.3%) |
Income Below Poverty Among Married-Couple vs Single-Parent Households in Mount Morris
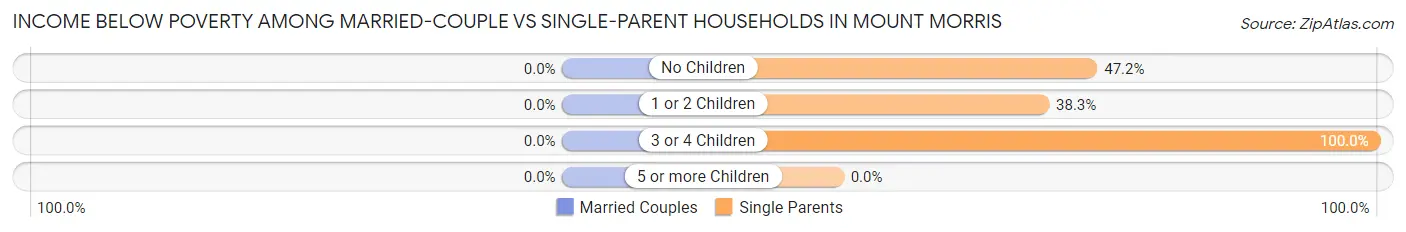
| Children | Married-Couple Families | Single-Parent Households |
| No Children | 0 (0.0%) | 60 (47.2%) |
| 1 or 2 Children | 0 (0.0%) | 75 (38.3%) |
| 3 or 4 Children | 0 (0.0%) | 51 (100.0%) |
| 5 or more Children | 0 (0.0%) | 0 (0.0%) |
| Total | 0 (0.0%) | 186 (49.7%) |
Race in Mount Morris
The most populous races in Mount Morris are White / Caucasian (1,881 | 59.8%), Black / African American (1,043 | 33.1%), and Two or more Races (200 | 6.4%).
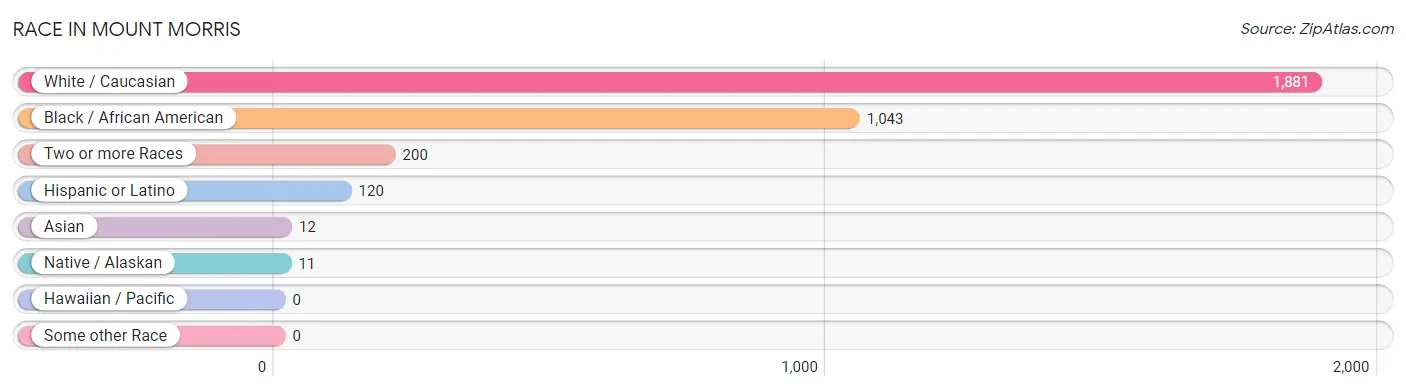
| Race | # Population | % Population |
| Asian | 12 | 0.4% |
| Black / African American | 1,043 | 33.1% |
| Hawaiian / Pacific | 0 | 0.0% |
| Hispanic or Latino | 120 | 3.8% |
| Native / Alaskan | 11 | 0.4% |
| White / Caucasian | 1,881 | 59.8% |
| Two or more Races | 200 | 6.4% |
| Some other Race | 0 | 0.0% |
| Total | 3,147 | 100.0% |
Ancestry in Mount Morris
The most populous ancestries reported in Mount Morris are English (315 | 10.0%), German (257 | 8.2%), American (219 | 7.0%), Irish (173 | 5.5%), and Subsaharan African (135 | 4.3%), together accounting for 34.9% of all Mount Morris residents.
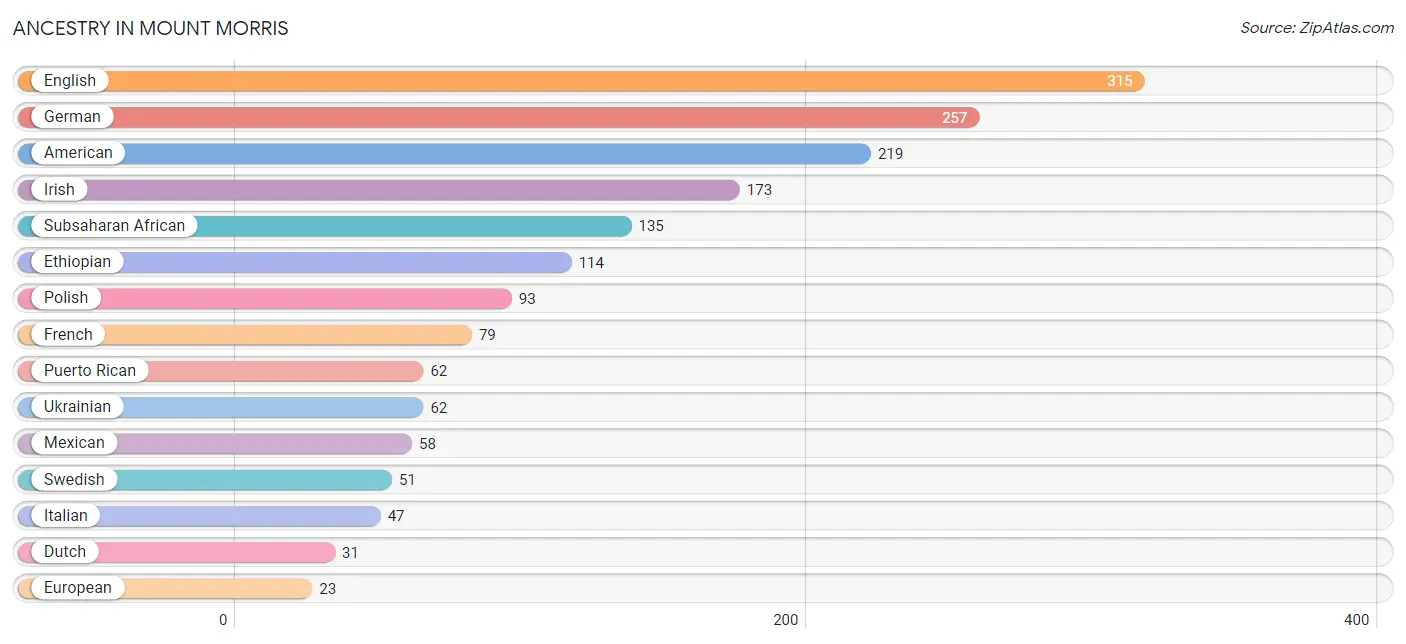
| Ancestry | # Population | % Population |
| African | 21 | 0.7% |
| American | 219 | 7.0% |
| Arab | 6 | 0.2% |
| British | 22 | 0.7% |
| Burmese | 12 | 0.4% |
| Cherokee | 13 | 0.4% |
| Chippewa | 10 | 0.3% |
| Czech | 6 | 0.2% |
| Dutch | 31 | 1.0% |
| English | 315 | 10.0% |
| Ethiopian | 114 | 3.6% |
| European | 23 | 0.7% |
| Finnish | 8 | 0.3% |
| French | 79 | 2.5% |
| French Canadian | 18 | 0.6% |
| German | 257 | 8.2% |
| Irish | 173 | 5.5% |
| Italian | 47 | 1.5% |
| Jamaican | 1 | 0.0% |
| Lebanese | 6 | 0.2% |
| Lithuanian | 7 | 0.2% |
| Mexican | 58 | 1.8% |
| Norwegian | 3 | 0.1% |
| Pennsylvania German | 8 | 0.3% |
| Polish | 93 | 3.0% |
| Puerto Rican | 62 | 2.0% |
| Romanian | 8 | 0.3% |
| Scottish | 5 | 0.2% |
| Subsaharan African | 135 | 4.3% |
| Swedish | 51 | 1.6% |
| Ukrainian | 62 | 2.0% | View All 31 Rows |
Immigrants in Mount Morris
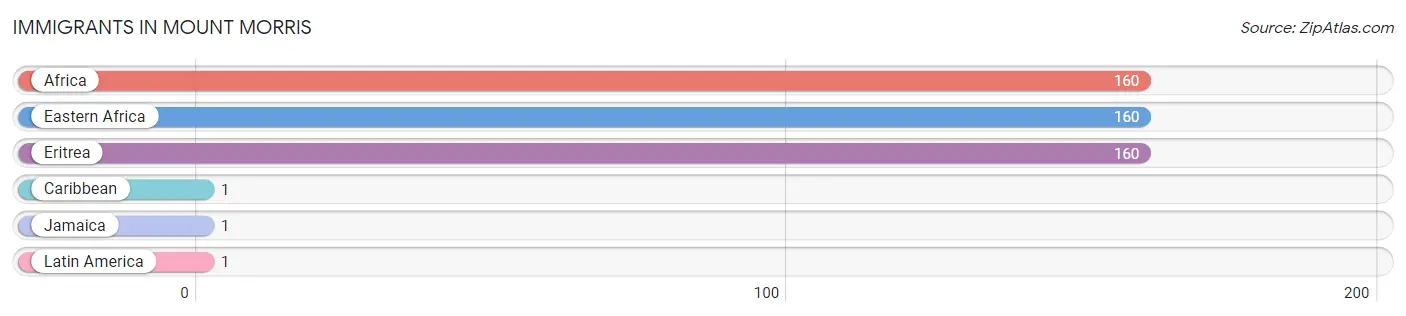
The most numerous immigrant groups reported in Mount Morris came from Africa (160 | 5.1%), Eastern Africa (160 | 5.1%), Eritrea (160 | 5.1%), Caribbean (1 | 0.0%), and Jamaica (1 | 0.0%), together accounting for 15.3% of all Mount Morris residents.
| Immigration Origin | # Population | % Population |
| Africa | 160 | 5.1% |
| Caribbean | 1 | 0.0% |
| Eastern Africa | 160 | 5.1% |
| Eritrea | 160 | 5.1% |
| Jamaica | 1 | 0.0% |
| Latin America | 1 | 0.0% | View All 6 Rows |
Sex and Age in Mount Morris
Sex and Age in Mount Morris
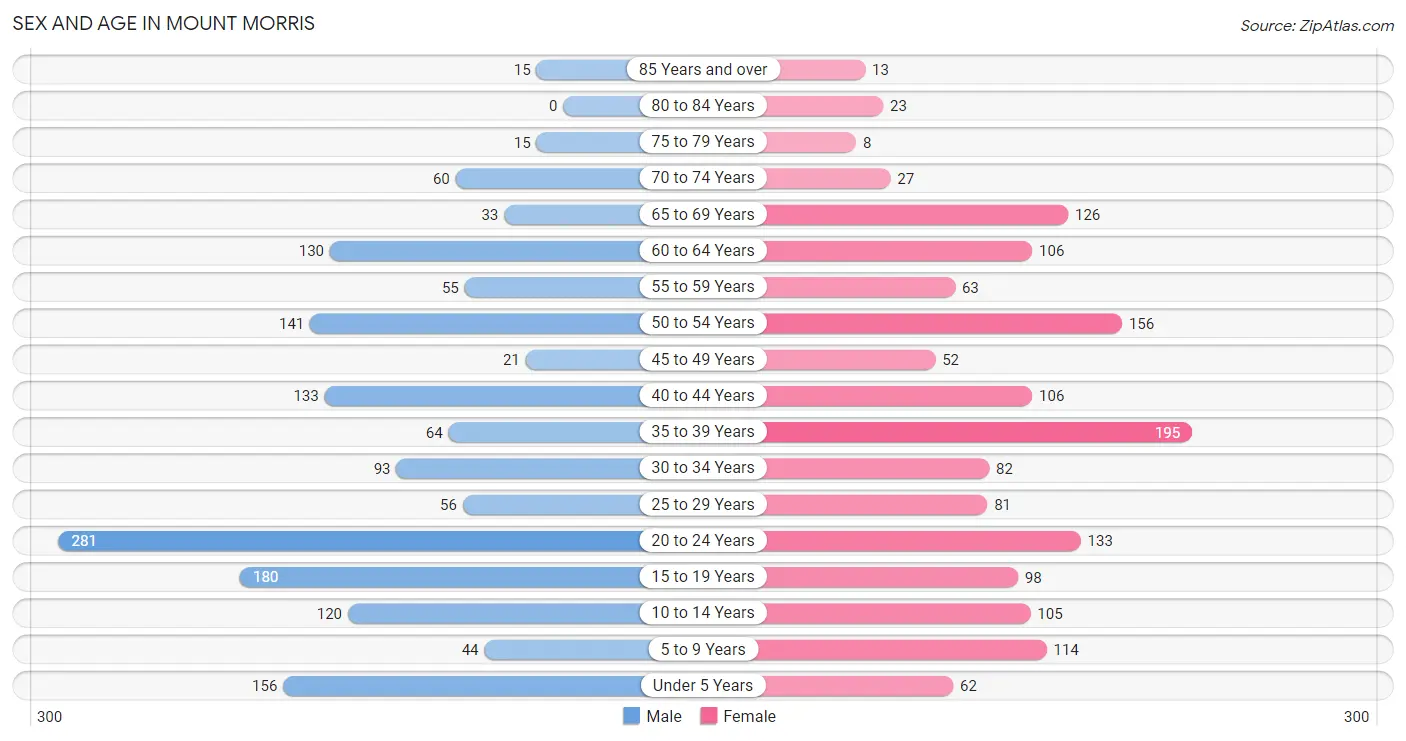
The most populous age groups in Mount Morris are 20 to 24 Years (281 | 17.6%) for men and 35 to 39 Years (195 | 12.6%) for women.
| Age Bracket | Male | Female |
| Under 5 Years | 156 (9.8%) | 62 (4.0%) |
| 5 to 9 Years | 44 (2.8%) | 114 (7.3%) |
| 10 to 14 Years | 120 (7.5%) | 105 (6.8%) |
| 15 to 19 Years | 180 (11.3%) | 98 (6.3%) |
| 20 to 24 Years | 281 (17.6%) | 133 (8.6%) |
| 25 to 29 Years | 56 (3.5%) | 81 (5.2%) |
| 30 to 34 Years | 93 (5.8%) | 82 (5.3%) |
| 35 to 39 Years | 64 (4.0%) | 195 (12.6%) |
| 40 to 44 Years | 133 (8.3%) | 106 (6.8%) |
| 45 to 49 Years | 21 (1.3%) | 52 (3.4%) |
| 50 to 54 Years | 141 (8.8%) | 156 (10.1%) |
| 55 to 59 Years | 55 (3.4%) | 63 (4.1%) |
| 60 to 64 Years | 130 (8.1%) | 106 (6.8%) |
| 65 to 69 Years | 33 (2.1%) | 126 (8.1%) |
| 70 to 74 Years | 60 (3.8%) | 27 (1.7%) |
| 75 to 79 Years | 15 (0.9%) | 8 (0.5%) |
| 80 to 84 Years | 0 (0.0%) | 23 (1.5%) |
| 85 Years and over | 15 (0.9%) | 13 (0.8%) |
| Total | 1,597 (100.0%) | 1,550 (100.0%) |
Families and Households in Mount Morris
Median Family Size in Mount Morris
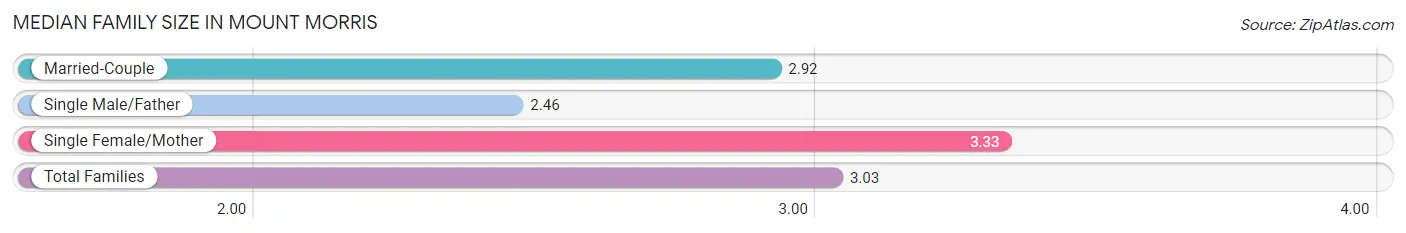
The median family size in Mount Morris is 3.03 persons per family, with single female/mother families (293 | 37.3%) accounting for the largest median family size of 3.33 persons per family. On the other hand, single male/father families (81 | 10.3%) represent the smallest median family size with 2.46 persons per family.
| Family Type | # Families | Family Size |
| Married-Couple | 411 (52.4%) | 2.92 |
| Single Male/Father | 81 (10.3%) | 2.46 |
| Single Female/Mother | 293 (37.3%) | 3.33 |
| Total Families | 785 (100.0%) | 3.03 |
Median Household Size in Mount Morris
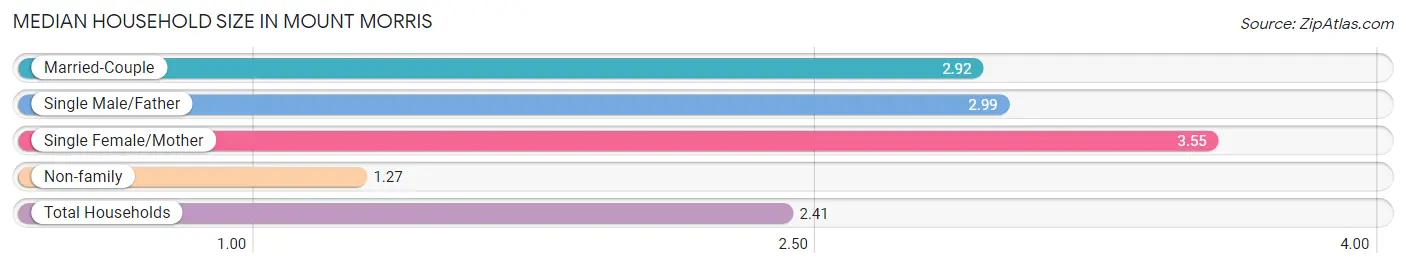
The median household size in Mount Morris is 2.41 persons per household, with single female/mother households (293 | 22.4%) accounting for the largest median household size of 3.55 persons per household. non-family households (521 | 39.9%) represent the smallest median household size with 1.27 persons per household.
| Household Type | # Households | Household Size |
| Married-Couple | 411 (31.5%) | 2.92 |
| Single Male/Father | 81 (6.2%) | 2.99 |
| Single Female/Mother | 293 (22.4%) | 3.55 |
| Non-family | 521 (39.9%) | 1.27 |
| Total Households | 1,306 (100.0%) | 2.41 |
Household Size by Marriage Status in Mount Morris
Out of a total of 1,306 households in Mount Morris, 785 (60.1%) are family households, while 521 (39.9%) are nonfamily households. The most numerous type of family households are 3-person households, comprising 295, and the most common type of nonfamily households are 1-person households, comprising 406.
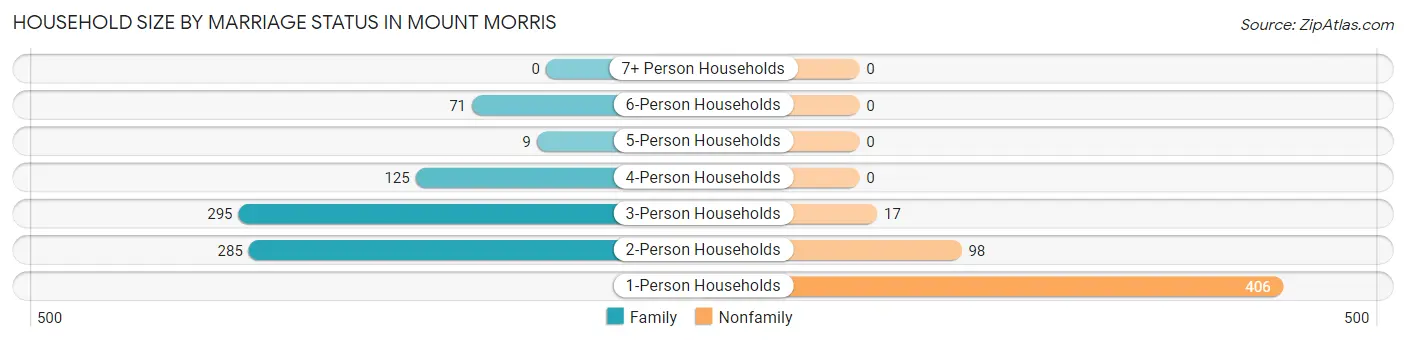
| Household Size | Family Households | Nonfamily Households |
| 1-Person Households | - | 406 (31.1%) |
| 2-Person Households | 285 (21.8%) | 98 (7.5%) |
| 3-Person Households | 295 (22.6%) | 17 (1.3%) |
| 4-Person Households | 125 (9.6%) | 0 (0.0%) |
| 5-Person Households | 9 (0.7%) | 0 (0.0%) |
| 6-Person Households | 71 (5.4%) | 0 (0.0%) |
| 7+ Person Households | 0 (0.0%) | 0 (0.0%) |
| Total | 785 (60.1%) | 521 (39.9%) |
Female Fertility in Mount Morris
Fertility by Age in Mount Morris
Average fertility rate in Mount Morris is 120.0 births per 1,000 women. Women in the age bracket of 20 to 34 years have the highest fertility rate with 348.0 births per 1,000 women. Women in the age bracket of 20 to 34 years acount for 100.0% of all women with births.
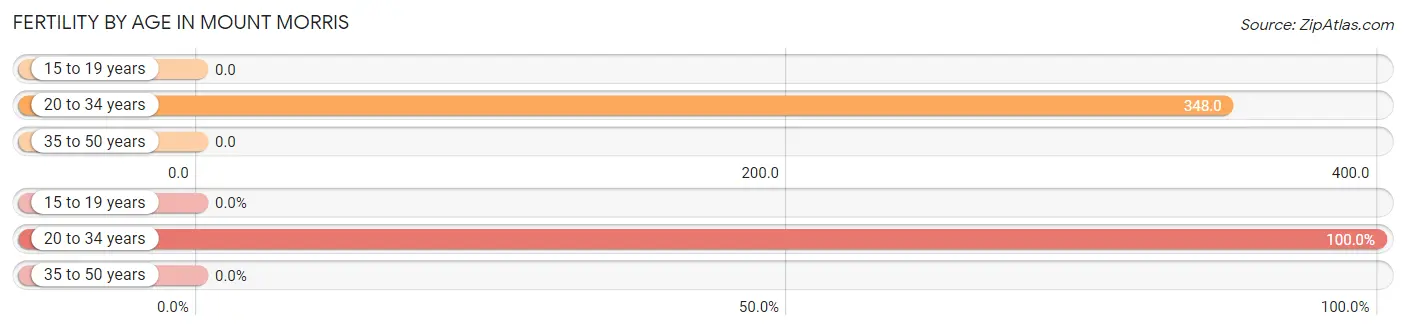
| Age Bracket | Women with Births | Births / 1,000 Women |
| 15 to 19 years | 0 (0.0%) | 0.0 |
| 20 to 34 years | 103 (100.0%) | 348.0 |
| 35 to 50 years | 0 (0.0%) | 0.0 |
| Total | 103 (100.0%) | 120.0 |
Fertility by Age by Marriage Status in Mount Morris
19.4% of women with births (103) in Mount Morris are married. The highest percentage of unmarried women with births falls into 20 to 34 years age bracket with 80.6% of them unmarried at the time of birth, while the lowest percentage of unmarried women with births belong to 20 to 34 years age bracket with 80.6% of them unmarried.
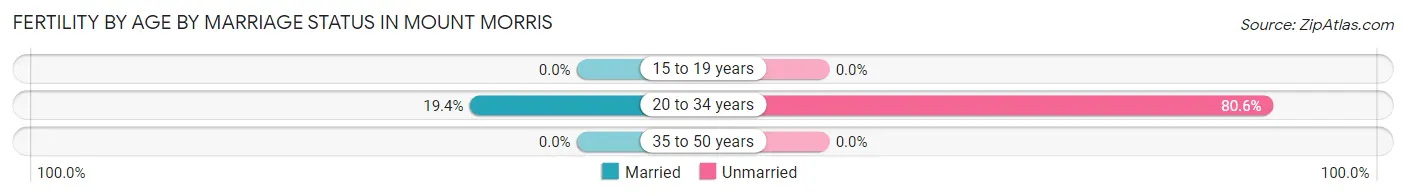
| Age Bracket | Married | Unmarried |
| 15 to 19 years | 0 (0.0%) | 0 (0.0%) |
| 20 to 34 years | 20 (19.4%) | 83 (80.6%) |
| 35 to 50 years | 0 (0.0%) | 0 (0.0%) |
| Total | 20 (19.4%) | 83 (80.6%) |
Fertility by Education in Mount Morris
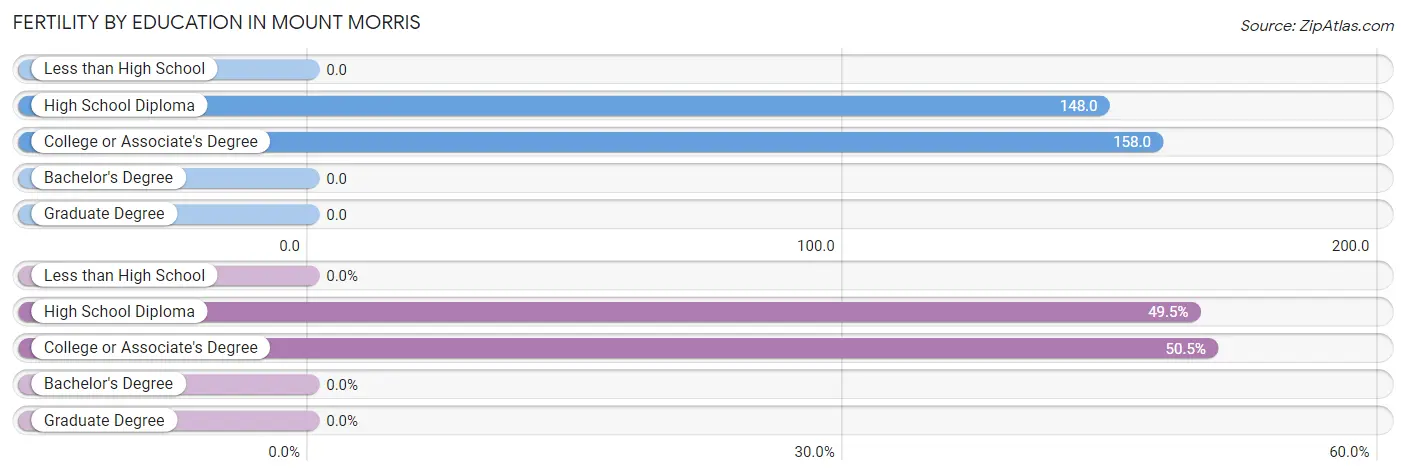
| Educational Attainment | Women with Births | Births / 1,000 Women |
| Less than High School | 0 (0.0%) | 0.0 |
| High School Diploma | 51 (49.5%) | 148.0 |
| College or Associate's Degree | 52 (50.5%) | 158.0 |
| Bachelor's Degree | 0 (0.0%) | 0.0 |
| Graduate Degree | 0 (0.0%) | 0.0 |
| Total | 103 (100.0%) | 120.0 |
Fertility by Education by Marriage Status in Mount Morris
80.6% of women with births in Mount Morris are unmarried. Women with the educational attainment of college or associate's degree are most likely to be married with 38.5% of them married at childbirth, while women with the educational attainment of high school diploma are least likely to be married with 100.0% of them unmarried at childbirth.
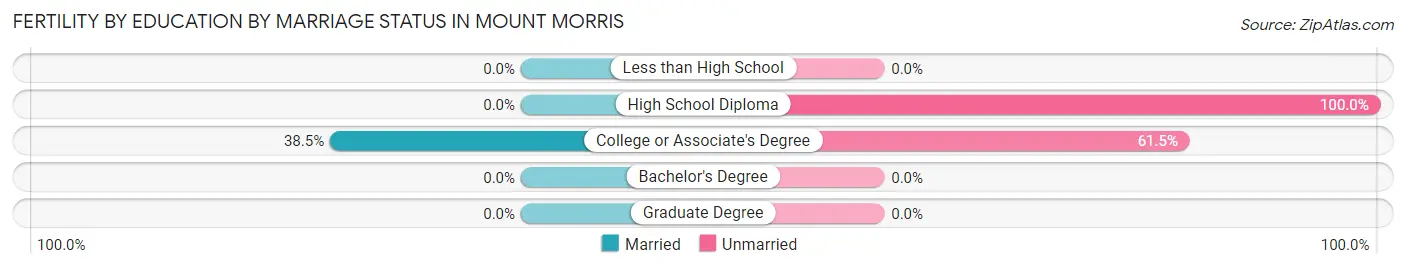
| Educational Attainment | Married | Unmarried |
| Less than High School | 0 (0.0%) | 0 (0.0%) |
| High School Diploma | 0 (0.0%) | 51 (100.0%) |
| College or Associate's Degree | 20 (38.5%) | 32 (61.5%) |
| Bachelor's Degree | 0 (0.0%) | 0 (0.0%) |
| Graduate Degree | 0 (0.0%) | 0 (0.0%) |
| Total | 20 (19.4%) | 83 (80.6%) |
Employment Characteristics in Mount Morris
Employment by Class of Employer in Mount Morris
Among the 1,073 employed individuals in Mount Morris, private company employees (801 | 74.7%), self-employed (not incorporated) (130 | 12.1%), and not-for-profit organizations (108 | 10.1%) make up the most common classes of employment.
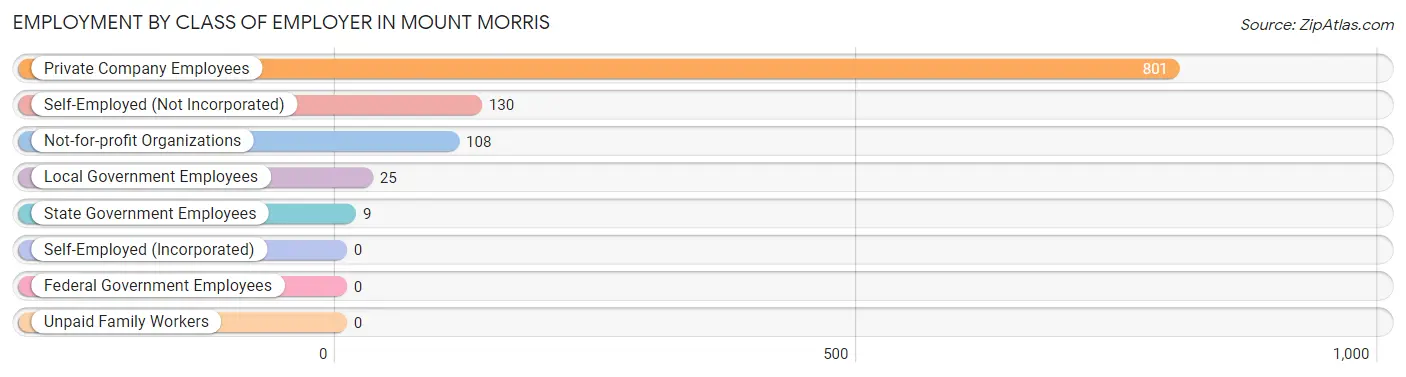
| Employer Class | # Employees | % Employees |
| Private Company Employees | 801 | 74.7% |
| Self-Employed (Incorporated) | 0 | 0.0% |
| Self-Employed (Not Incorporated) | 130 | 12.1% |
| Not-for-profit Organizations | 108 | 10.1% |
| Local Government Employees | 25 | 2.3% |
| State Government Employees | 9 | 0.8% |
| Federal Government Employees | 0 | 0.0% |
| Unpaid Family Workers | 0 | 0.0% |
| Total | 1,073 | 100.0% |
Employment Status by Age in Mount Morris
According to the labor force statistics for Mount Morris, out of the total population over 16 years of age (2,471), 55.7% or 1,376 individuals are in the labor force, with 18.5% or 255 of them unemployed. The age group with the highest labor force participation rate is 20 to 24 years, with 82.1% or 340 individuals in the labor force. Within the labor force, the 16 to 19 years age range has the highest percentage of unemployed individuals, with 45.5% or 35 of them being unemployed.
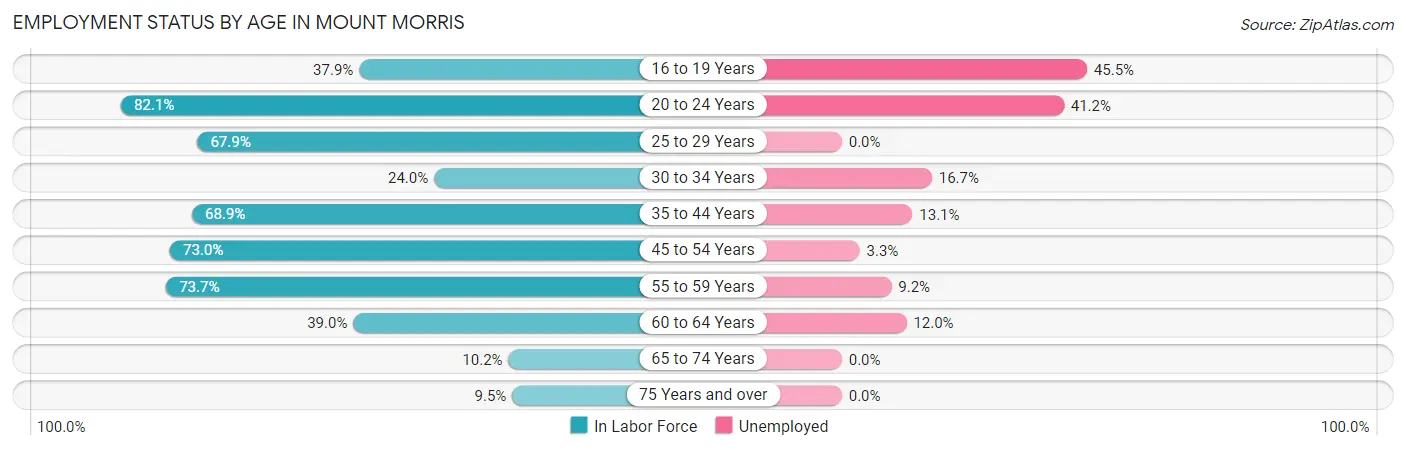
| Age Bracket | In Labor Force | Unemployed |
| 16 to 19 Years | 77 (37.9%) | 35 (45.5%) |
| 20 to 24 Years | 340 (82.1%) | 140 (41.2%) |
| 25 to 29 Years | 93 (67.9%) | 0 (0.0%) |
| 30 to 34 Years | 42 (24.0%) | 7 (16.7%) |
| 35 to 44 Years | 343 (68.9%) | 45 (13.1%) |
| 45 to 54 Years | 270 (73.0%) | 9 (3.3%) |
| 55 to 59 Years | 87 (73.7%) | 8 (9.2%) |
| 60 to 64 Years | 92 (39.0%) | 11 (12.0%) |
| 65 to 74 Years | 25 (10.2%) | 0 (0.0%) |
| 75 Years and over | 7 (9.5%) | 0 (0.0%) |
| Total | 1,376 (55.7%) | 255 (18.5%) |
Employment Status by Educational Attainment in Mount Morris
According to labor force statistics for Mount Morris, 60.4% of individuals (927) out of the total population between 25 and 64 years of age (1,534) are in the labor force, with 8.6% or 80 of them being unemployed. The group with the highest labor force participation rate are those with the educational attainment of college / associate degree, with 75.8% or 441 individuals in the labor force. Within the labor force, individuals with less than high school education have the highest percentage of unemployment, with 49.5% or 45 of them being unemployed.
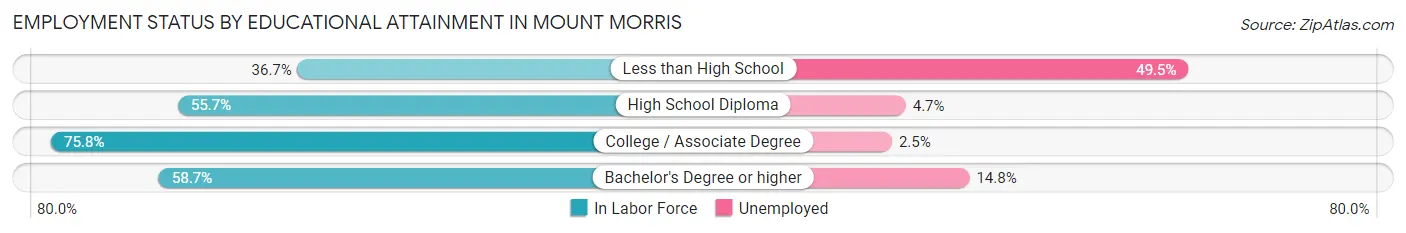
| Educational Attainment | In Labor Force | Unemployed |
| Less than High School | 91 (36.7%) | 123 (49.5%) |
| High School Diploma | 341 (55.7%) | 29 (4.7%) |
| College / Associate Degree | 441 (75.8%) | 15 (2.5%) |
| Bachelor's Degree or higher | 54 (58.7%) | 14 (14.8%) |
| Total | 927 (60.4%) | 132 (8.6%) |
Employment Occupations by Sex in Mount Morris
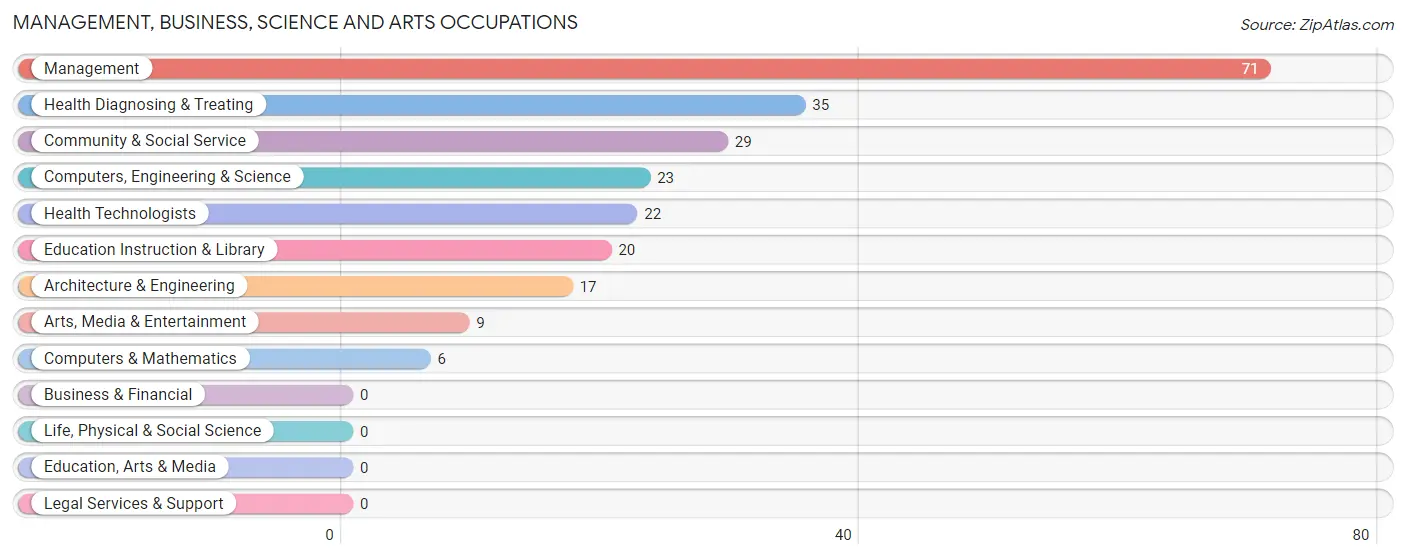
Management, Business, Science and Arts Occupations
The most common Management, Business, Science and Arts occupations in Mount Morris are Management (71 | 6.3%), Health Diagnosing & Treating (35 | 3.1%), Community & Social Service (29 | 2.6%), Computers, Engineering & Science (23 | 2.1%), and Health Technologists (22 | 2.0%).
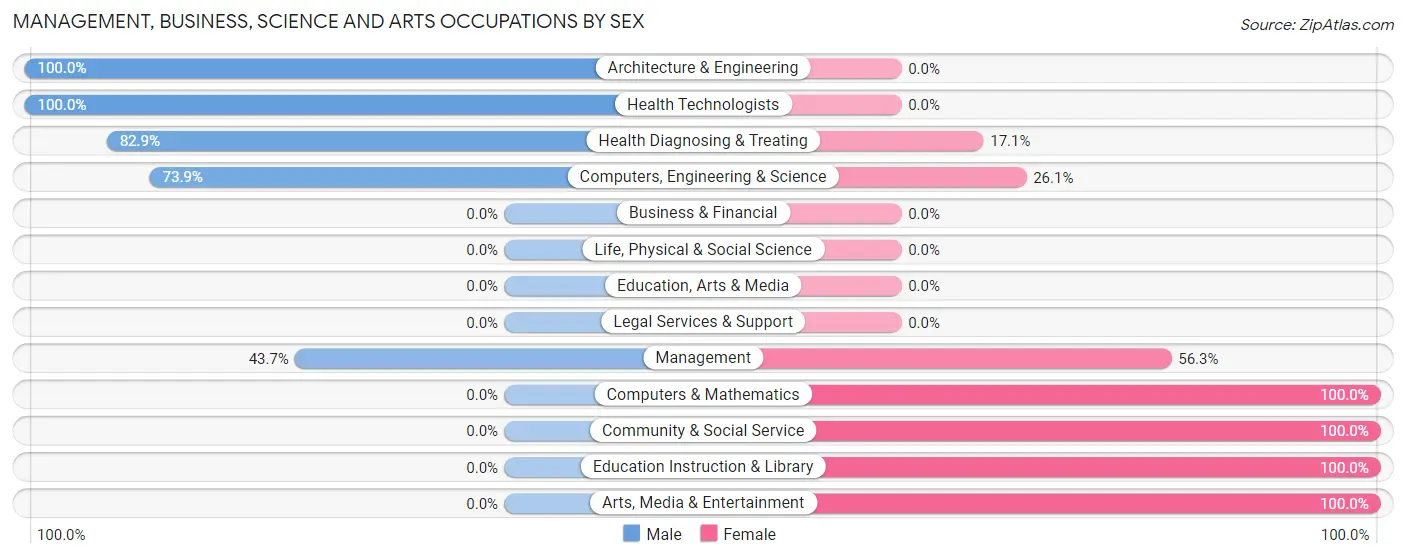
Management, Business, Science and Arts Occupations by Sex
Within the Management, Business, Science and Arts occupations in Mount Morris, the most male-oriented occupations are Architecture & Engineering (100.0%), Health Technologists (100.0%), and Health Diagnosing & Treating (82.9%), while the most female-oriented occupations are Computers & Mathematics (100.0%), Community & Social Service (100.0%), and Education Instruction & Library (100.0%).
| Occupation | Male | Female |
| Management | 31 (43.7%) | 40 (56.3%) |
| Business & Financial | 0 (0.0%) | 0 (0.0%) |
| Computers, Engineering & Science | 17 (73.9%) | 6 (26.1%) |
| Computers & Mathematics | 0 (0.0%) | 6 (100.0%) |
| Architecture & Engineering | 17 (100.0%) | 0 (0.0%) |
| Life, Physical & Social Science | 0 (0.0%) | 0 (0.0%) |
| Community & Social Service | 0 (0.0%) | 29 (100.0%) |
| Education, Arts & Media | 0 (0.0%) | 0 (0.0%) |
| Legal Services & Support | 0 (0.0%) | 0 (0.0%) |
| Education Instruction & Library | 0 (0.0%) | 20 (100.0%) |
| Arts, Media & Entertainment | 0 (0.0%) | 9 (100.0%) |
| Health Diagnosing & Treating | 29 (82.9%) | 6 (17.1%) |
| Health Technologists | 22 (100.0%) | 0 (0.0%) |
| Total (Category) | 77 (48.7%) | 81 (51.3%) |
| Total (Overall) | 666 (59.4%) | 455 (40.6%) |
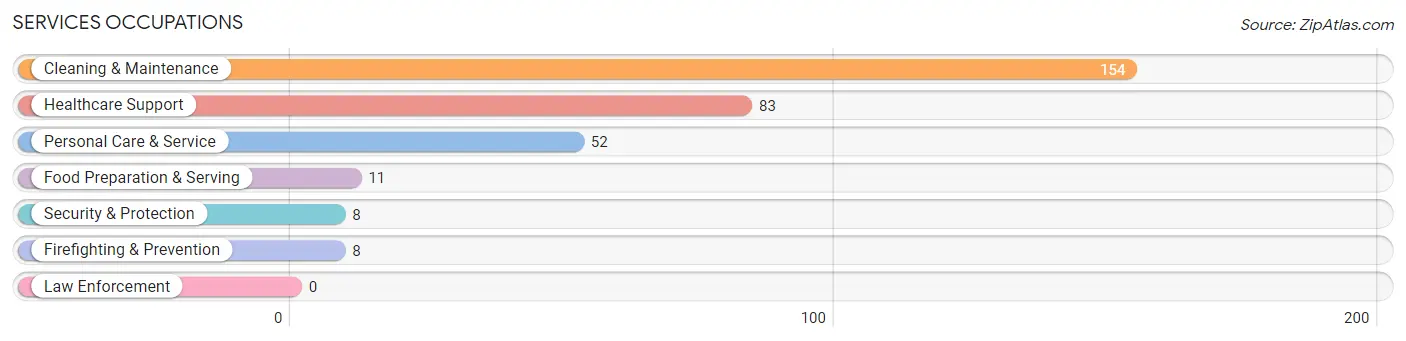
Services Occupations
The most common Services occupations in Mount Morris are Cleaning & Maintenance (154 | 13.7%), Healthcare Support (83 | 7.4%), Personal Care & Service (52 | 4.6%), Food Preparation & Serving (11 | 1.0%), and Security & Protection (8 | 0.7%).
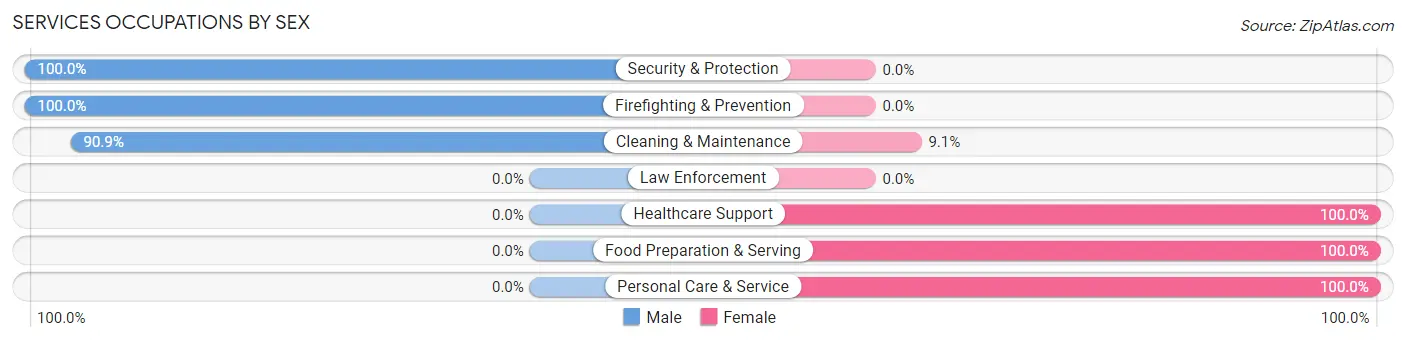
Services Occupations by Sex
Within the Services occupations in Mount Morris, the most male-oriented occupations are Security & Protection (100.0%), Firefighting & Prevention (100.0%), and Cleaning & Maintenance (90.9%), while the most female-oriented occupations are Healthcare Support (100.0%), Food Preparation & Serving (100.0%), and Personal Care & Service (100.0%).
| Occupation | Male | Female |
| Healthcare Support | 0 (0.0%) | 83 (100.0%) |
| Security & Protection | 8 (100.0%) | 0 (0.0%) |
| Firefighting & Prevention | 8 (100.0%) | 0 (0.0%) |
| Law Enforcement | 0 (0.0%) | 0 (0.0%) |
| Food Preparation & Serving | 0 (0.0%) | 11 (100.0%) |
| Cleaning & Maintenance | 140 (90.9%) | 14 (9.1%) |
| Personal Care & Service | 0 (0.0%) | 52 (100.0%) |
| Total (Category) | 148 (48.0%) | 160 (51.9%) |
| Total (Overall) | 666 (59.4%) | 455 (40.6%) |
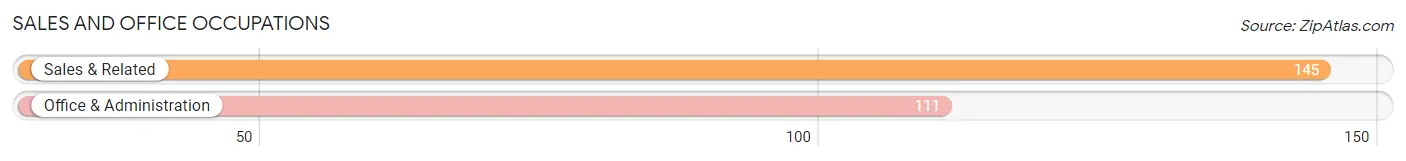
Sales and Office Occupations
The most common Sales and Office occupations in Mount Morris are Sales & Related (145 | 12.9%), and Office & Administration (111 | 9.9%).
Sales and Office Occupations by Sex
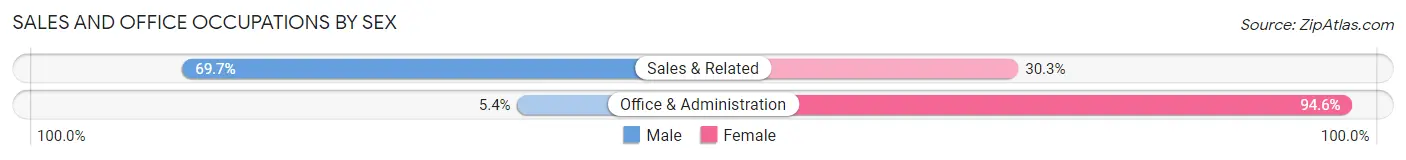
| Occupation | Male | Female |
| Sales & Related | 101 (69.7%) | 44 (30.3%) |
| Office & Administration | 6 (5.4%) | 105 (94.6%) |
| Total (Category) | 107 (41.8%) | 149 (58.2%) |
| Total (Overall) | 666 (59.4%) | 455 (40.6%) |
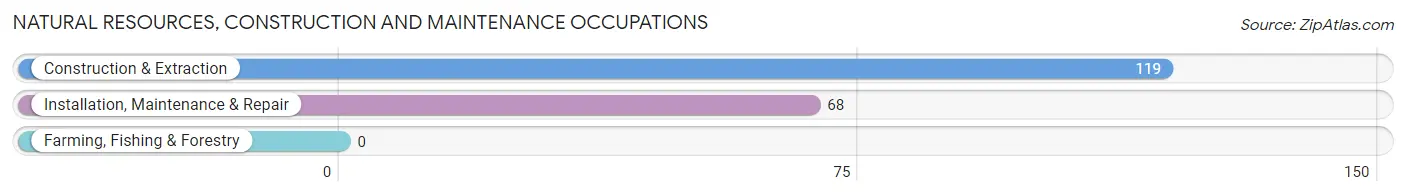
Natural Resources, Construction and Maintenance Occupations
The most common Natural Resources, Construction and Maintenance occupations in Mount Morris are Construction & Extraction (119 | 10.6%), and Installation, Maintenance & Repair (68 | 6.1%).
Natural Resources, Construction and Maintenance Occupations by Sex
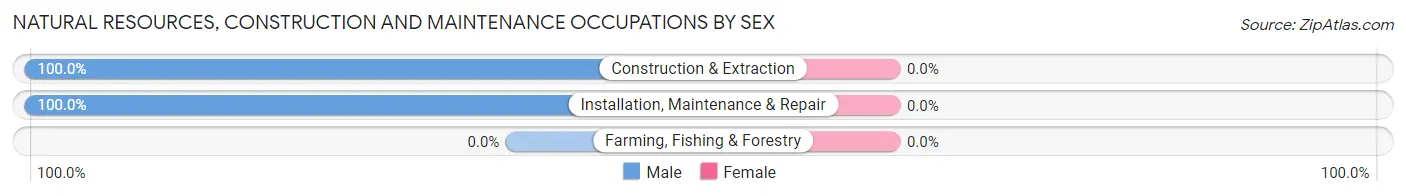
| Occupation | Male | Female |
| Farming, Fishing & Forestry | 0 (0.0%) | 0 (0.0%) |
| Construction & Extraction | 119 (100.0%) | 0 (0.0%) |
| Installation, Maintenance & Repair | 68 (100.0%) | 0 (0.0%) |
| Total (Category) | 187 (100.0%) | 0 (0.0%) |
| Total (Overall) | 666 (59.4%) | 455 (40.6%) |
Production, Transportation and Moving Occupations
The most common Production, Transportation and Moving occupations in Mount Morris are Production (126 | 11.2%), Transportation (49 | 4.4%), and Material Moving (37 | 3.3%).

Production, Transportation and Moving Occupations by Sex
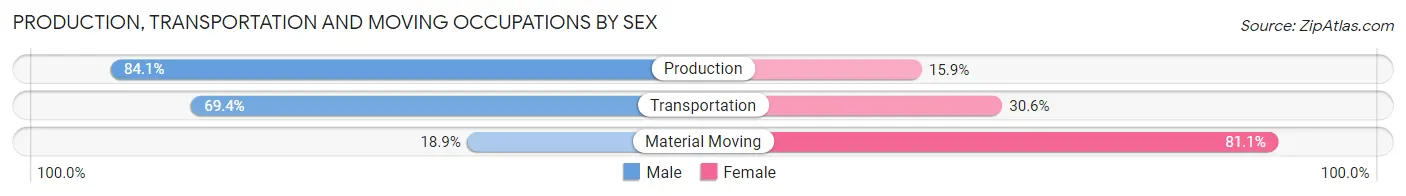
| Occupation | Male | Female |
| Production | 106 (84.1%) | 20 (15.9%) |
| Transportation | 34 (69.4%) | 15 (30.6%) |
| Material Moving | 7 (18.9%) | 30 (81.1%) |
| Total (Category) | 147 (69.3%) | 65 (30.7%) |
| Total (Overall) | 666 (59.4%) | 455 (40.6%) |
Employment Industries by Sex in Mount Morris
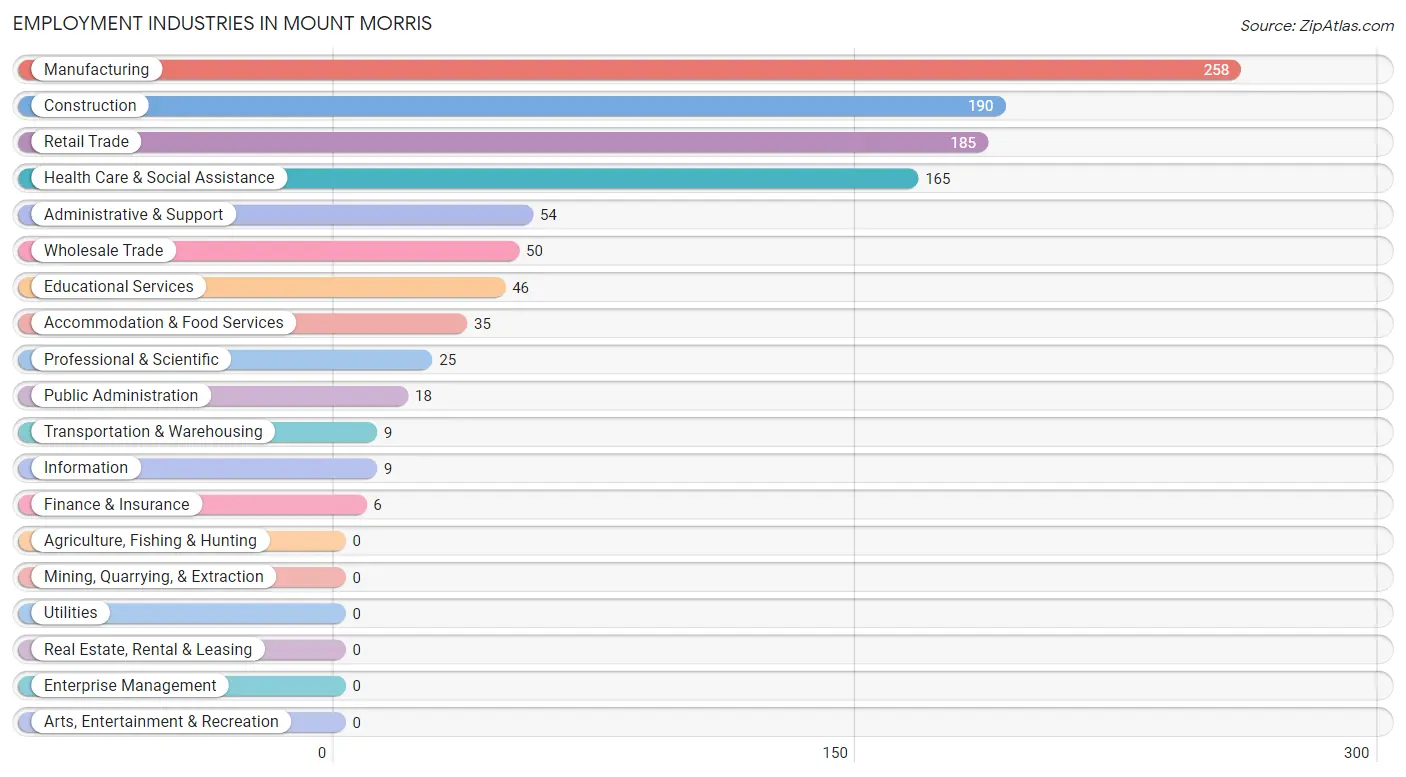
Employment Industries in Mount Morris
The major employment industries in Mount Morris include Manufacturing (258 | 23.0%), Construction (190 | 17.0%), Retail Trade (185 | 16.5%), Health Care & Social Assistance (165 | 14.7%), and Administrative & Support (54 | 4.8%).
Employment Industries by Sex in Mount Morris
The Mount Morris industries that see more men than women are Transportation & Warehousing (100.0%), Construction (88.4%), and Manufacturing (86.1%), whereas the industries that tend to have a higher number of women are Information (100.0%), Finance & Insurance (100.0%), and Accommodation & Food Services (100.0%).

| Industry | Male | Female |
| Agriculture, Fishing & Hunting | 0 (0.0%) | 0 (0.0%) |
| Mining, Quarrying, & Extraction | 0 (0.0%) | 0 (0.0%) |
| Construction | 168 (88.4%) | 22 (11.6%) |
| Manufacturing | 222 (86.1%) | 36 (14.0%) |
| Wholesale Trade | 36 (72.0%) | 14 (28.0%) |
| Retail Trade | 111 (60.0%) | 74 (40.0%) |
| Transportation & Warehousing | 9 (100.0%) | 0 (0.0%) |
| Utilities | 0 (0.0%) | 0 (0.0%) |
| Information | 0 (0.0%) | 9 (100.0%) |
| Finance & Insurance | 0 (0.0%) | 6 (100.0%) |
| Real Estate, Rental & Leasing | 0 (0.0%) | 0 (0.0%) |
| Professional & Scientific | 7 (28.0%) | 18 (72.0%) |
| Enterprise Management | 0 (0.0%) | 0 (0.0%) |
| Administrative & Support | 40 (74.1%) | 14 (25.9%) |
| Educational Services | 8 (17.4%) | 38 (82.6%) |
| Health Care & Social Assistance | 37 (22.4%) | 128 (77.6%) |
| Arts, Entertainment & Recreation | 0 (0.0%) | 0 (0.0%) |
| Accommodation & Food Services | 0 (0.0%) | 35 (100.0%) |
| Public Administration | 9 (50.0%) | 9 (50.0%) |
| Total | 666 (59.4%) | 455 (40.6%) |
Education in Mount Morris
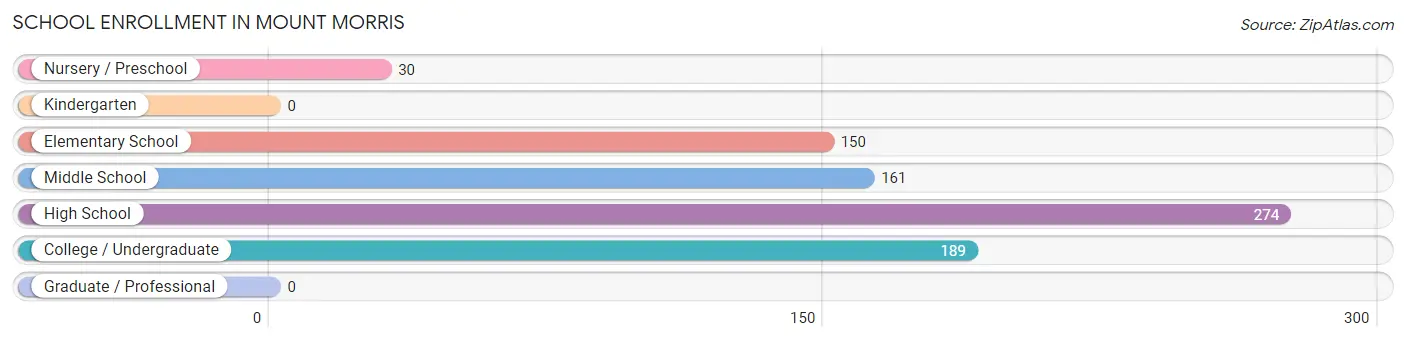
School Enrollment in Mount Morris
The most common levels of schooling among the 804 students in Mount Morris are high school (274 | 34.1%), college / undergraduate (189 | 23.5%), and middle school (161 | 20.0%).
| School Level | # Students | % Students |
| Nursery / Preschool | 30 | 3.7% |
| Kindergarten | 0 | 0.0% |
| Elementary School | 150 | 18.7% |
| Middle School | 161 | 20.0% |
| High School | 274 | 34.1% |
| College / Undergraduate | 189 | 23.5% |
| Graduate / Professional | 0 | 0.0% |
| Total | 804 | 100.0% |
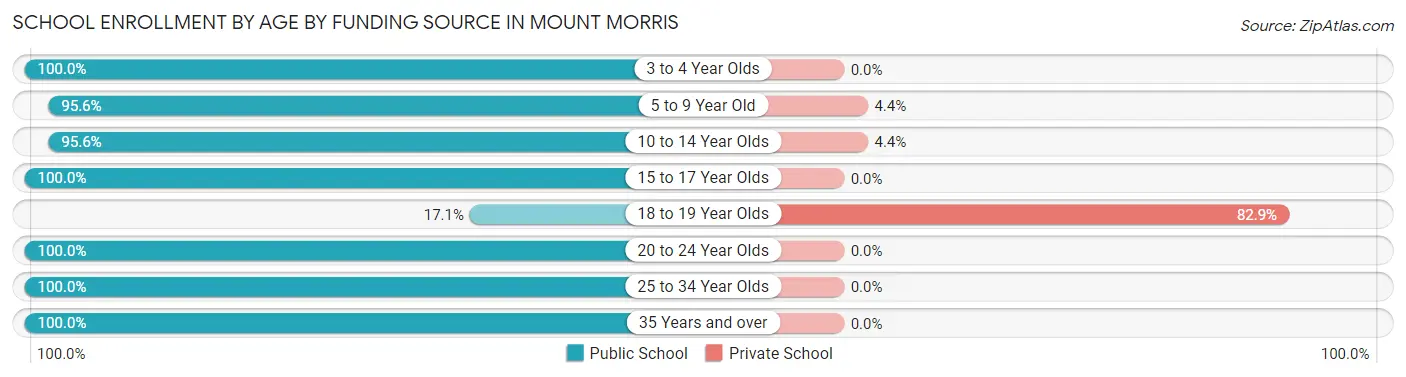
School Enrollment by Age by Funding Source in Mount Morris
Out of a total of 804 students who are enrolled in schools in Mount Morris, 51 (6.3%) attend a private institution, while the remaining 753 (93.7%) are enrolled in public schools. The age group of 18 to 19 year olds has the highest likelihood of being enrolled in private schools, with 34 (82.9% in the age bracket) enrolled. Conversely, the age group of 3 to 4 year olds has the lowest likelihood of being enrolled in a private school, with 22 (100.0% in the age bracket) attending a public institution.
| Age Bracket | Public School | Private School |
| 3 to 4 Year Olds | 22 (100.0%) | 0 (0.0%) |
| 5 to 9 Year Old | 151 (95.6%) | 7 (4.4%) |
| 10 to 14 Year Olds | 215 (95.6%) | 10 (4.4%) |
| 15 to 17 Year Olds | 210 (100.0%) | 0 (0.0%) |
| 18 to 19 Year Olds | 7 (17.1%) | 34 (82.9%) |
| 20 to 24 Year Olds | 120 (100.0%) | 0 (0.0%) |
| 25 to 34 Year Olds | 10 (100.0%) | 0 (0.0%) |
| 35 Years and over | 18 (100.0%) | 0 (0.0%) |
| Total | 753 (93.7%) | 51 (6.3%) |
Educational Attainment by Field of Study in Mount Morris
Arts & humanities (56 | 56.0%), education (10 | 10.0%), engineering (9 | 9.0%), literature & languages (9 | 9.0%), and computers & mathematics (8 | 8.0%) are the most common fields of study among 100 individuals in Mount Morris who have obtained a bachelor's degree or higher.
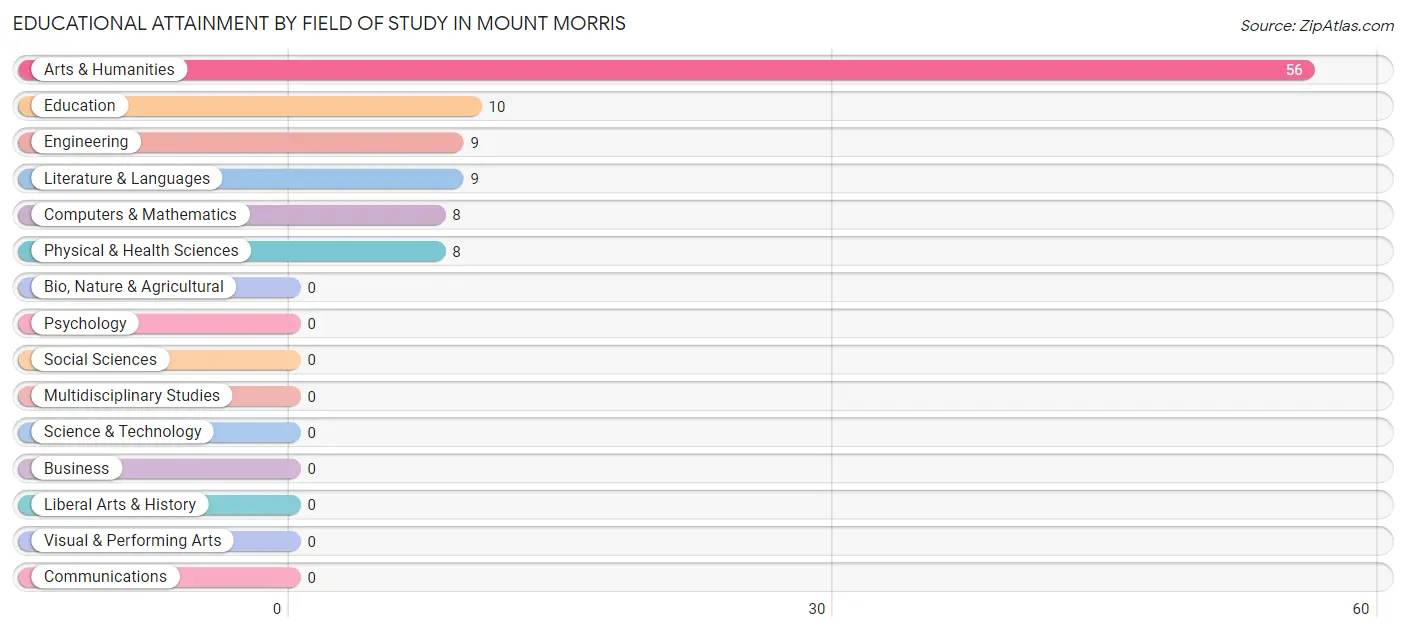
| Field of Study | # Graduates | % Graduates |
| Computers & Mathematics | 8 | 8.0% |
| Bio, Nature & Agricultural | 0 | 0.0% |
| Physical & Health Sciences | 8 | 8.0% |
| Psychology | 0 | 0.0% |
| Social Sciences | 0 | 0.0% |
| Engineering | 9 | 9.0% |
| Multidisciplinary Studies | 0 | 0.0% |
| Science & Technology | 0 | 0.0% |
| Business | 0 | 0.0% |
| Education | 10 | 10.0% |
| Literature & Languages | 9 | 9.0% |
| Liberal Arts & History | 0 | 0.0% |
| Visual & Performing Arts | 0 | 0.0% |
| Communications | 0 | 0.0% |
| Arts & Humanities | 56 | 56.0% |
| Total | 100 | 100.0% |
Transportation & Commute in Mount Morris
Vehicle Availability by Sex in Mount Morris
The most prevalent vehicle ownership categories in Mount Morris are males with 2 vehicles (287, accounting for 43.1%) and females with 2 vehicles (224, making up 70.9%).
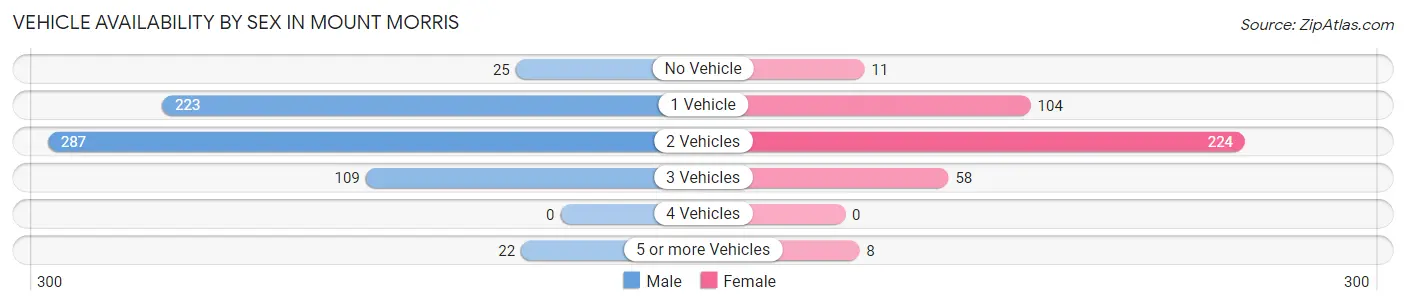
| Vehicles Available | Male | Female |
| No Vehicle | 25 (3.7%) | 11 (2.7%) |
| 1 Vehicle | 223 (33.5%) | 104 (25.7%) |
| 2 Vehicles | 287 (43.1%) | 224 (55.3%) |
| 3 Vehicles | 109 (16.4%) | 58 (14.3%) |
| 4 Vehicles | 0 (0.0%) | 0 (0.0%) |
| 5 or more Vehicles | 22 (3.3%) | 8 (2.0%) |
| Total | 666 (100.0%) | 405 (100.0%) |
Commute Time in Mount Morris
The most frequently occuring commute durations in Mount Morris are 5 to 9 minutes (249 commuters, 25.3%), 20 to 24 minutes (233 commuters, 23.7%), and 15 to 19 minutes (214 commuters, 21.7%).
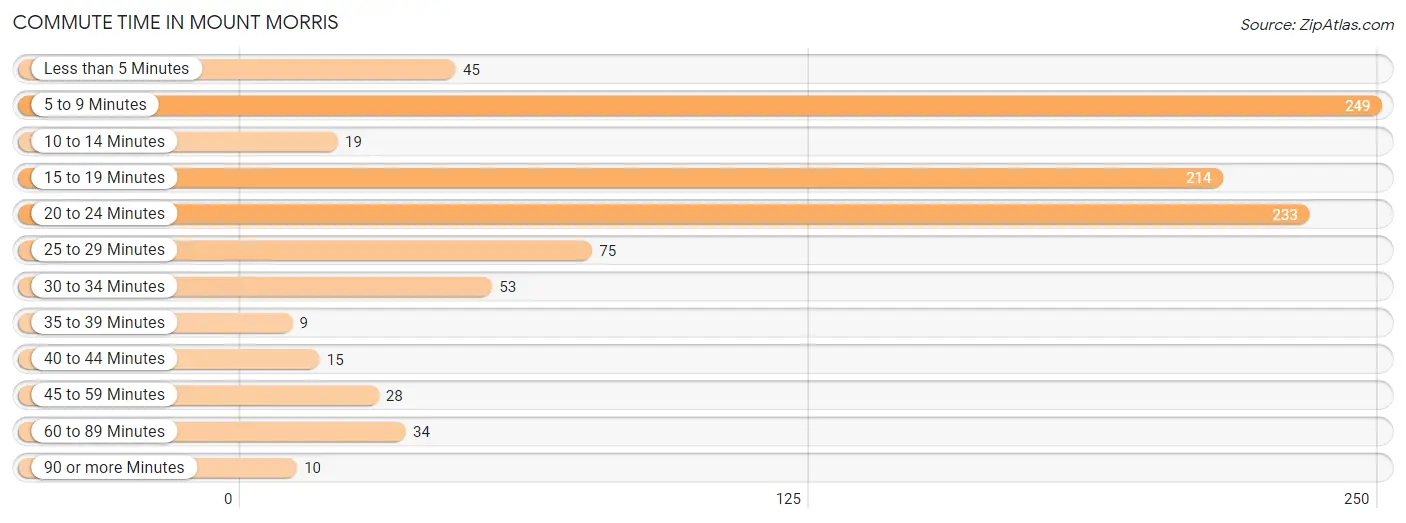
| Commute Time | # Commuters | % Commuters |
| Less than 5 Minutes | 45 | 4.6% |
| 5 to 9 Minutes | 249 | 25.3% |
| 10 to 14 Minutes | 19 | 1.9% |
| 15 to 19 Minutes | 214 | 21.7% |
| 20 to 24 Minutes | 233 | 23.7% |
| 25 to 29 Minutes | 75 | 7.6% |
| 30 to 34 Minutes | 53 | 5.4% |
| 35 to 39 Minutes | 9 | 0.9% |
| 40 to 44 Minutes | 15 | 1.5% |
| 45 to 59 Minutes | 28 | 2.9% |
| 60 to 89 Minutes | 34 | 3.5% |
| 90 or more Minutes | 10 | 1.0% |
Commute Time by Sex in Mount Morris
The most common commute times in Mount Morris are 5 to 9 minutes (182 commuters, 29.3%) for males and 15 to 19 minutes (132 commuters, 36.4%) for females.
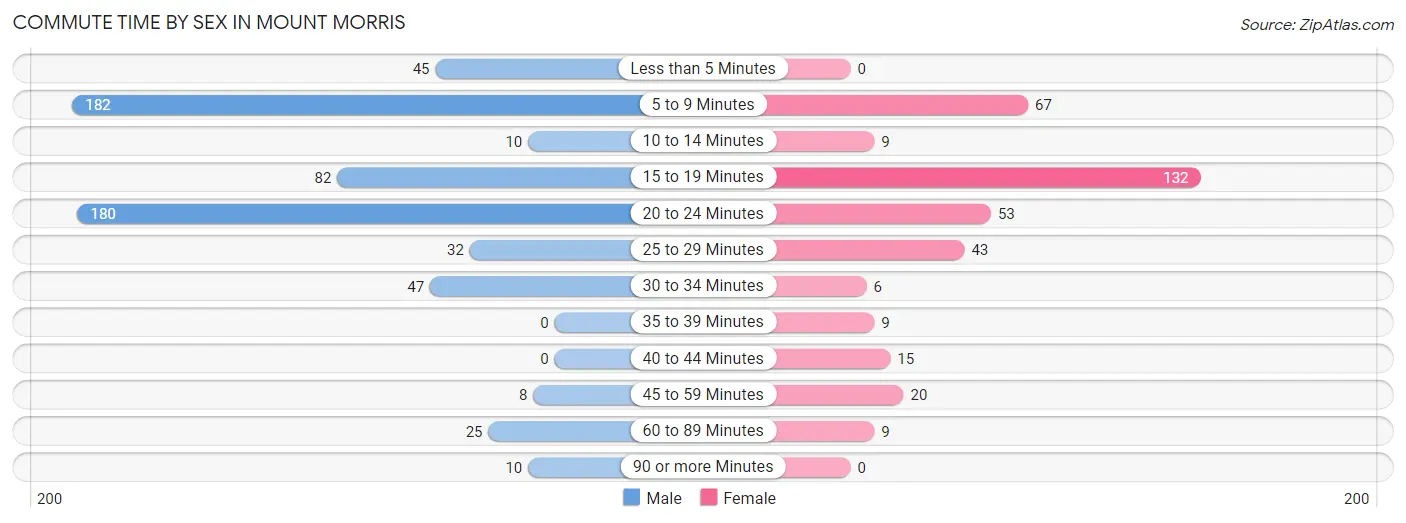
| Commute Time | Male | Female |
| Less than 5 Minutes | 45 (7.2%) | 0 (0.0%) |
| 5 to 9 Minutes | 182 (29.3%) | 67 (18.5%) |
| 10 to 14 Minutes | 10 (1.6%) | 9 (2.5%) |
| 15 to 19 Minutes | 82 (13.2%) | 132 (36.4%) |
| 20 to 24 Minutes | 180 (29.0%) | 53 (14.6%) |
| 25 to 29 Minutes | 32 (5.1%) | 43 (11.8%) |
| 30 to 34 Minutes | 47 (7.6%) | 6 (1.7%) |
| 35 to 39 Minutes | 0 (0.0%) | 9 (2.5%) |
| 40 to 44 Minutes | 0 (0.0%) | 15 (4.1%) |
| 45 to 59 Minutes | 8 (1.3%) | 20 (5.5%) |
| 60 to 89 Minutes | 25 (4.0%) | 9 (2.5%) |
| 90 or more Minutes | 10 (1.6%) | 0 (0.0%) |
Time of Departure to Work by Sex in Mount Morris
The most frequent times of departure to work in Mount Morris are 5:00 AM to 5:29 AM (142, 22.9%) for males and 7:30 AM to 7:59 AM (102, 28.1%) for females.
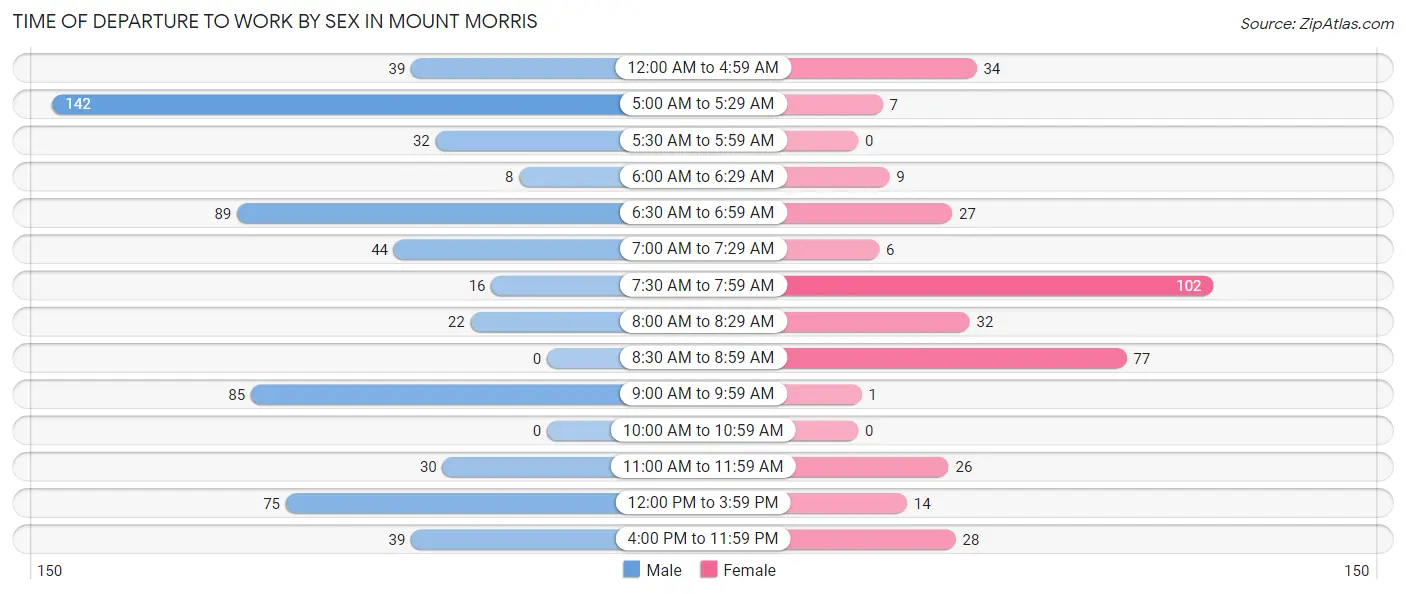
| Time of Departure | Male | Female |
| 12:00 AM to 4:59 AM | 39 (6.3%) | 34 (9.4%) |
| 5:00 AM to 5:29 AM | 142 (22.9%) | 7 (1.9%) |
| 5:30 AM to 5:59 AM | 32 (5.1%) | 0 (0.0%) |
| 6:00 AM to 6:29 AM | 8 (1.3%) | 9 (2.5%) |
| 6:30 AM to 6:59 AM | 89 (14.3%) | 27 (7.4%) |
| 7:00 AM to 7:29 AM | 44 (7.1%) | 6 (1.7%) |
| 7:30 AM to 7:59 AM | 16 (2.6%) | 102 (28.1%) |
| 8:00 AM to 8:29 AM | 22 (3.5%) | 32 (8.8%) |
| 8:30 AM to 8:59 AM | 0 (0.0%) | 77 (21.2%) |
| 9:00 AM to 9:59 AM | 85 (13.7%) | 1 (0.3%) |
| 10:00 AM to 10:59 AM | 0 (0.0%) | 0 (0.0%) |
| 11:00 AM to 11:59 AM | 30 (4.8%) | 26 (7.2%) |
| 12:00 PM to 3:59 PM | 75 (12.1%) | 14 (3.9%) |
| 4:00 PM to 11:59 PM | 39 (6.3%) | 28 (7.7%) |
| Total | 621 (100.0%) | 363 (100.0%) |
Housing Occupancy in Mount Morris
Occupancy by Ownership in Mount Morris
Of the total 1,306 dwellings in Mount Morris, owner-occupied units account for 736 (56.4%), while renter-occupied units make up 570 (43.6%).
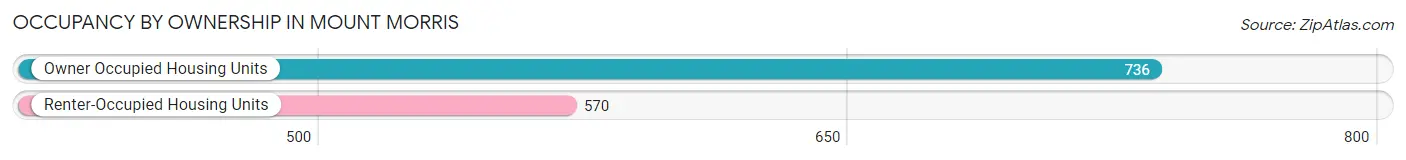
| Occupancy | # Housing Units | % Housing Units |
| Owner Occupied Housing Units | 736 | 56.4% |
| Renter-Occupied Housing Units | 570 | 43.6% |
| Total Occupied Housing Units | 1,306 | 100.0% |
Occupancy by Household Size in Mount Morris
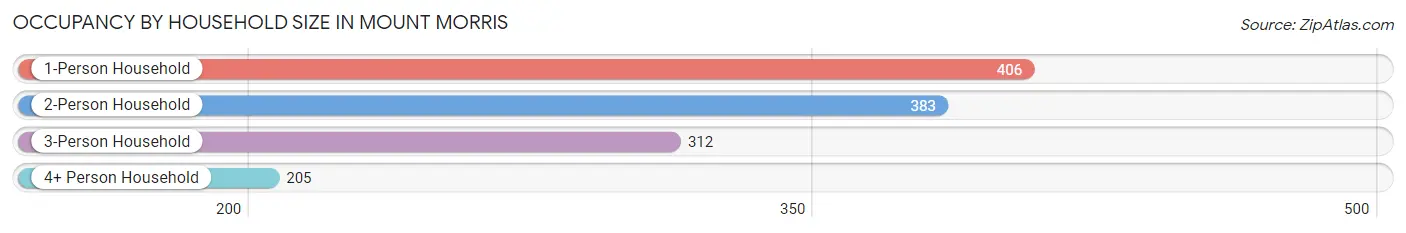
| Household Size | # Housing Units | % Housing Units |
| 1-Person Household | 406 | 31.1% |
| 2-Person Household | 383 | 29.3% |
| 3-Person Household | 312 | 23.9% |
| 4+ Person Household | 205 | 15.7% |
| Total Housing Units | 1,306 | 100.0% |
Occupancy by Ownership by Household Size in Mount Morris
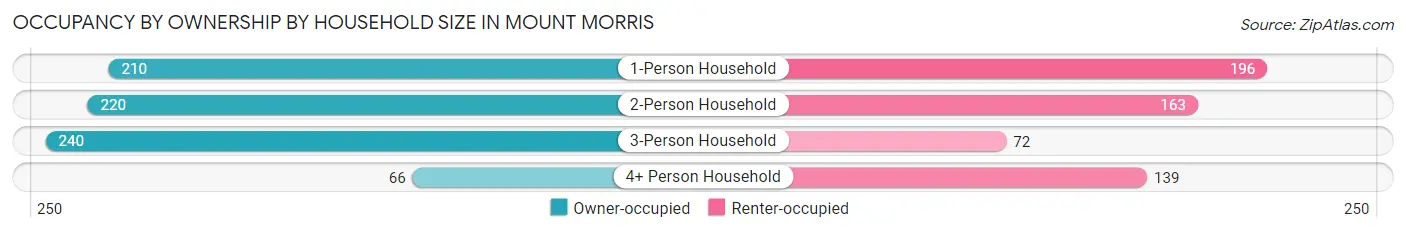
| Household Size | Owner-occupied | Renter-occupied |
| 1-Person Household | 210 (51.7%) | 196 (48.3%) |
| 2-Person Household | 220 (57.4%) | 163 (42.6%) |
| 3-Person Household | 240 (76.9%) | 72 (23.1%) |
| 4+ Person Household | 66 (32.2%) | 139 (67.8%) |
| Total Housing Units | 736 (56.4%) | 570 (43.6%) |
Occupancy by Educational Attainment in Mount Morris
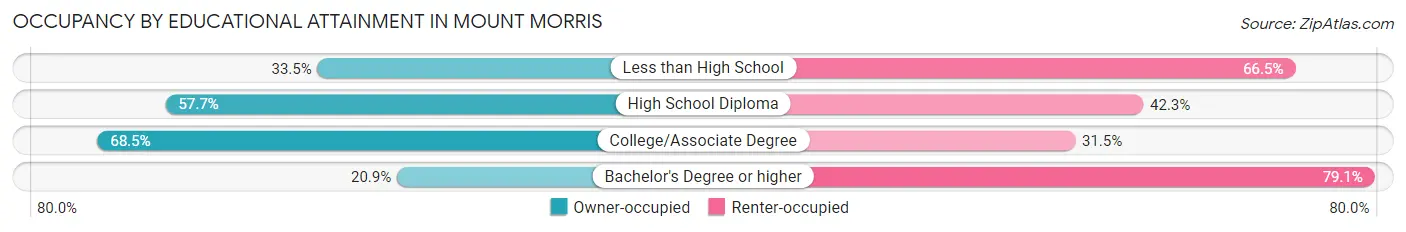
| Household Size | Owner-occupied | Renter-occupied |
| Less than High School | 55 (33.5%) | 109 (66.5%) |
| High School Diploma | 320 (57.7%) | 235 (42.3%) |
| College/Associate Degree | 343 (68.5%) | 158 (31.5%) |
| Bachelor's Degree or higher | 18 (20.9%) | 68 (79.1%) |
Occupancy by Age of Householder in Mount Morris
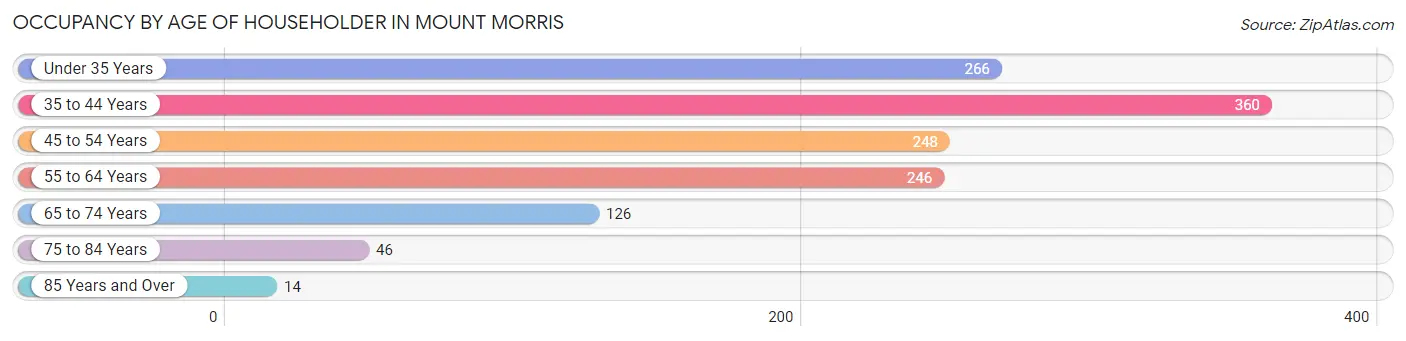
| Age Bracket | # Households | % Households |
| Under 35 Years | 266 | 20.4% |
| 35 to 44 Years | 360 | 27.6% |
| 45 to 54 Years | 248 | 19.0% |
| 55 to 64 Years | 246 | 18.8% |
| 65 to 74 Years | 126 | 9.7% |
| 75 to 84 Years | 46 | 3.5% |
| 85 Years and Over | 14 | 1.1% |
| Total | 1,306 | 100.0% |
Housing Finances in Mount Morris
Median Income by Occupancy in Mount Morris
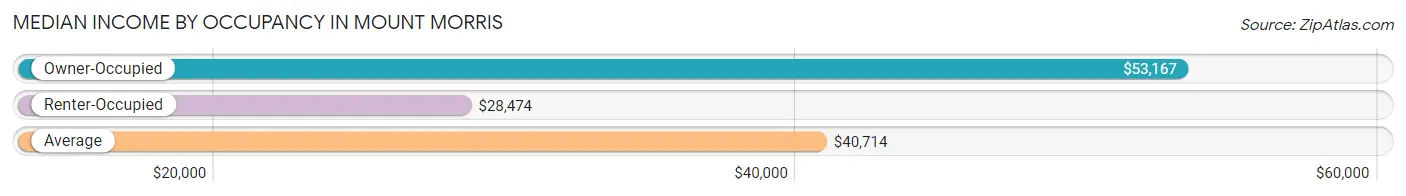
| Occupancy Type | # Households | Median Income |
| Owner-Occupied | 736 (56.4%) | $53,167 |
| Renter-Occupied | 570 (43.6%) | $28,474 |
| Average | 1,306 (100.0%) | $40,714 |
Occupancy by Householder Income Bracket in Mount Morris
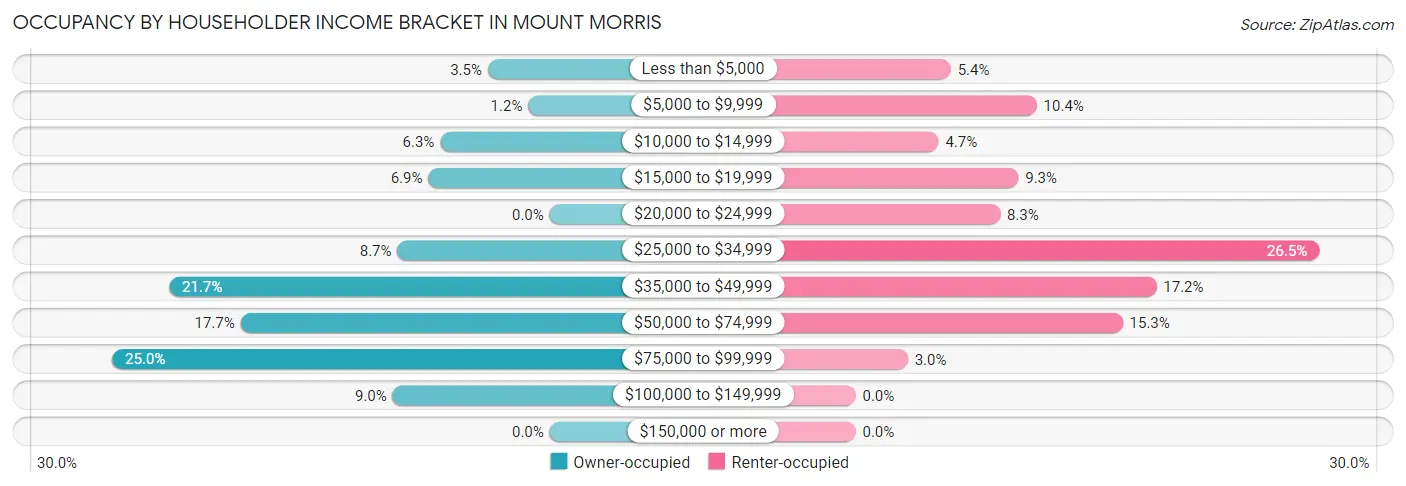
| Income Bracket | Owner-occupied | Renter-occupied |
| Less than $5,000 | 26 (3.5%) | 31 (5.4%) |
| $5,000 to $9,999 | 9 (1.2%) | 59 (10.3%) |
| $10,000 to $14,999 | 46 (6.2%) | 27 (4.7%) |
| $15,000 to $19,999 | 51 (6.9%) | 53 (9.3%) |
| $20,000 to $24,999 | 0 (0.0%) | 47 (8.3%) |
| $25,000 to $34,999 | 64 (8.7%) | 151 (26.5%) |
| $35,000 to $49,999 | 160 (21.7%) | 98 (17.2%) |
| $50,000 to $74,999 | 130 (17.7%) | 87 (15.3%) |
| $75,000 to $99,999 | 184 (25.0%) | 17 (3.0%) |
| $100,000 to $149,999 | 66 (9.0%) | 0 (0.0%) |
| $150,000 or more | 0 (0.0%) | 0 (0.0%) |
| Total | 736 (100.0%) | 570 (100.0%) |
Monthly Housing Cost Tiers in Mount Morris
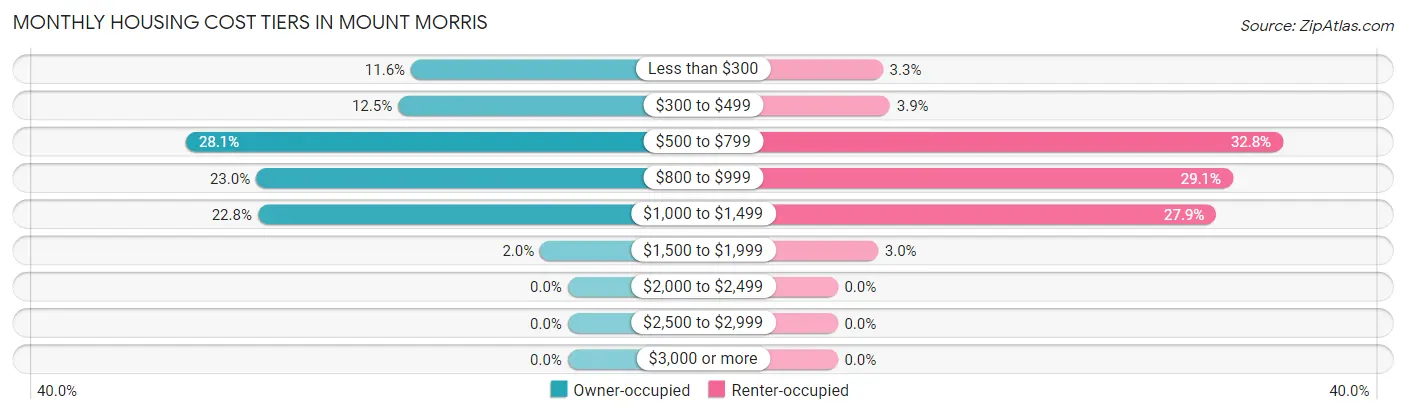
| Monthly Cost | Owner-occupied | Renter-occupied |
| Less than $300 | 85 (11.6%) | 19 (3.3%) |
| $300 to $499 | 92 (12.5%) | 22 (3.9%) |
| $500 to $799 | 207 (28.1%) | 187 (32.8%) |
| $800 to $999 | 169 (23.0%) | 166 (29.1%) |
| $1,000 to $1,499 | 168 (22.8%) | 159 (27.9%) |
| $1,500 to $1,999 | 15 (2.0%) | 17 (3.0%) |
| $2,000 to $2,499 | 0 (0.0%) | 0 (0.0%) |
| $2,500 to $2,999 | 0 (0.0%) | 0 (0.0%) |
| $3,000 or more | 0 (0.0%) | 0 (0.0%) |
| Total | 736 (100.0%) | 570 (100.0%) |
Physical Housing Characteristics in Mount Morris
Housing Structures in Mount Morris
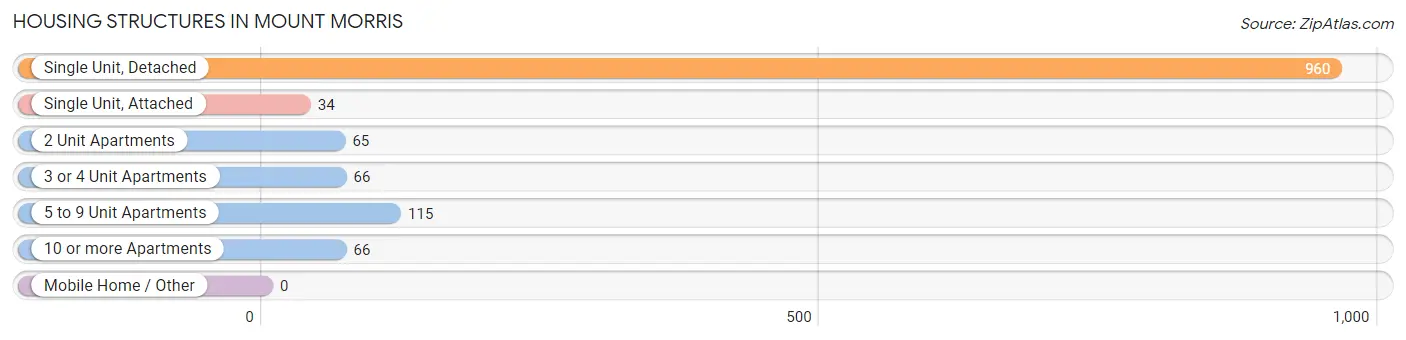
| Structure Type | # Housing Units | % Housing Units |
| Single Unit, Detached | 960 | 73.5% |
| Single Unit, Attached | 34 | 2.6% |
| 2 Unit Apartments | 65 | 5.0% |
| 3 or 4 Unit Apartments | 66 | 5.1% |
| 5 to 9 Unit Apartments | 115 | 8.8% |
| 10 or more Apartments | 66 | 5.1% |
| Mobile Home / Other | 0 | 0.0% |
| Total | 1,306 | 100.0% |
Housing Structures by Occupancy in Mount Morris
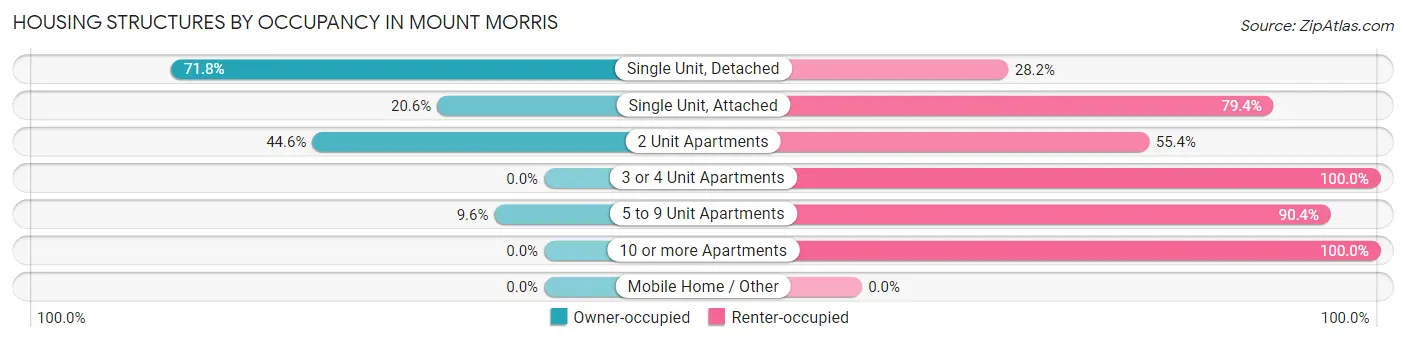
| Structure Type | Owner-occupied | Renter-occupied |
| Single Unit, Detached | 689 (71.8%) | 271 (28.2%) |
| Single Unit, Attached | 7 (20.6%) | 27 (79.4%) |
| 2 Unit Apartments | 29 (44.6%) | 36 (55.4%) |
| 3 or 4 Unit Apartments | 0 (0.0%) | 66 (100.0%) |
| 5 to 9 Unit Apartments | 11 (9.6%) | 104 (90.4%) |
| 10 or more Apartments | 0 (0.0%) | 66 (100.0%) |
| Mobile Home / Other | 0 (0.0%) | 0 (0.0%) |
| Total | 736 (56.4%) | 570 (43.6%) |
Housing Structures by Number of Rooms in Mount Morris
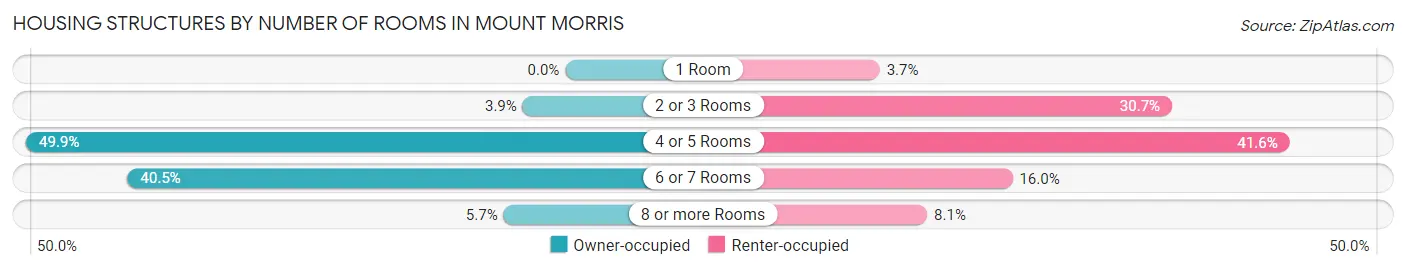
| Number of Rooms | Owner-occupied | Renter-occupied |
| 1 Room | 0 (0.0%) | 21 (3.7%) |
| 2 or 3 Rooms | 29 (3.9%) | 175 (30.7%) |
| 4 or 5 Rooms | 367 (49.9%) | 237 (41.6%) |
| 6 or 7 Rooms | 298 (40.5%) | 91 (16.0%) |
| 8 or more Rooms | 42 (5.7%) | 46 (8.1%) |
| Total | 736 (100.0%) | 570 (100.0%) |
Housing Structure by Heating Type in Mount Morris
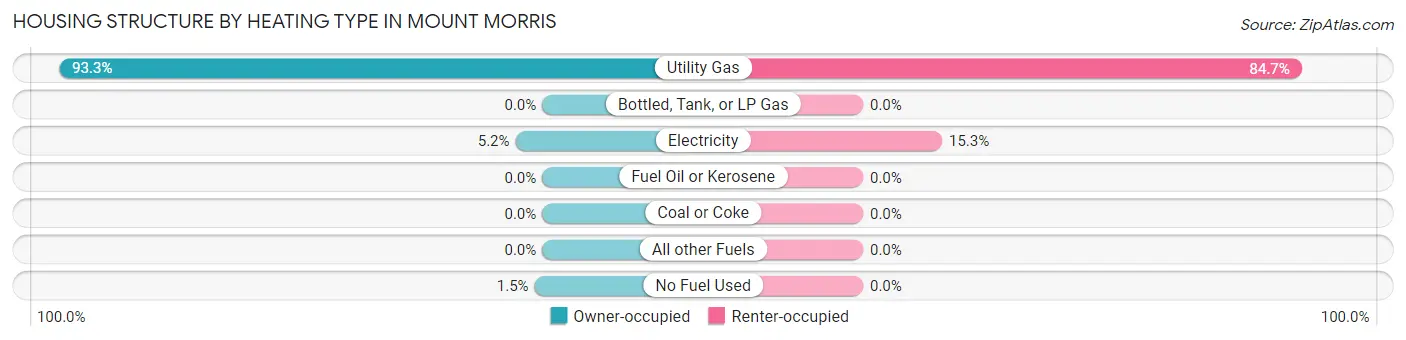
| Heating Type | Owner-occupied | Renter-occupied |
| Utility Gas | 687 (93.3%) | 483 (84.7%) |
| Bottled, Tank, or LP Gas | 0 (0.0%) | 0 (0.0%) |
| Electricity | 38 (5.2%) | 87 (15.3%) |
| Fuel Oil or Kerosene | 0 (0.0%) | 0 (0.0%) |
| Coal or Coke | 0 (0.0%) | 0 (0.0%) |
| All other Fuels | 0 (0.0%) | 0 (0.0%) |
| No Fuel Used | 11 (1.5%) | 0 (0.0%) |
| Total | 736 (100.0%) | 570 (100.0%) |
Household Vehicle Usage in Mount Morris
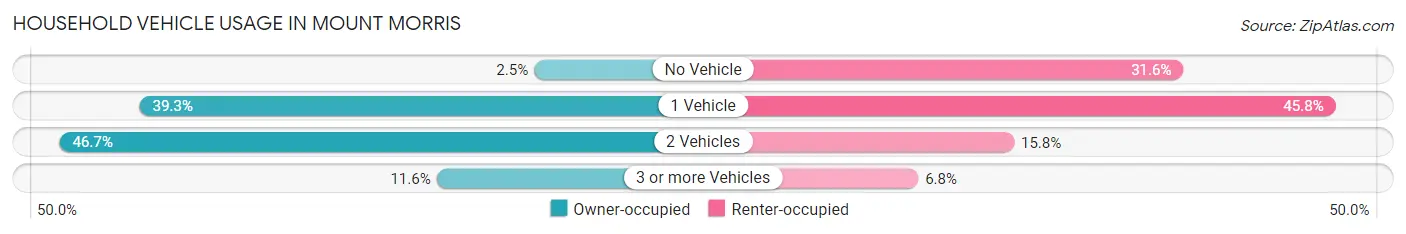
| Vehicles per Household | Owner-occupied | Renter-occupied |
| No Vehicle | 18 (2.5%) | 180 (31.6%) |
| 1 Vehicle | 289 (39.3%) | 261 (45.8%) |
| 2 Vehicles | 344 (46.7%) | 90 (15.8%) |
| 3 or more Vehicles | 85 (11.6%) | 39 (6.8%) |
| Total | 736 (100.0%) | 570 (100.0%) |
Real Estate & Mortgages in Mount Morris
Real Estate and Mortgage Overview in Mount Morris
| Characteristic | Without Mortgage | With Mortgage |
| Housing Units | 282 | 454 |
| Median Property Value | $56,900 | $93,400 |
| Median Household Income | $41,429 | $0 |
| Monthly Housing Costs | $415 | $0 |
| Real Estate Taxes | $1,073 | $33 |
Property Value by Mortgage Status in Mount Morris
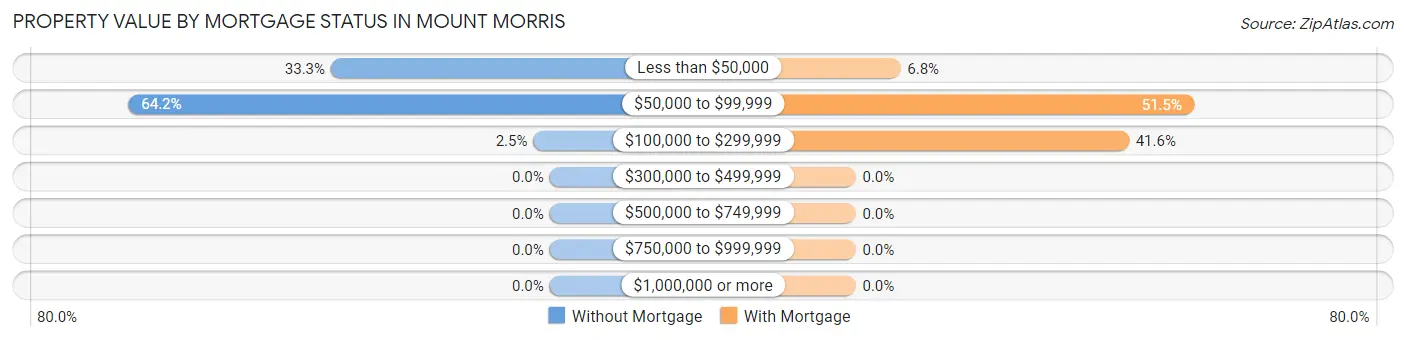
| Property Value | Without Mortgage | With Mortgage |
| Less than $50,000 | 94 (33.3%) | 31 (6.8%) |
| $50,000 to $99,999 | 181 (64.2%) | 234 (51.5%) |
| $100,000 to $299,999 | 7 (2.5%) | 189 (41.6%) |
| $300,000 to $499,999 | 0 (0.0%) | 0 (0.0%) |
| $500,000 to $749,999 | 0 (0.0%) | 0 (0.0%) |
| $750,000 to $999,999 | 0 (0.0%) | 0 (0.0%) |
| $1,000,000 or more | 0 (0.0%) | 0 (0.0%) |
| Total | 282 (100.0%) | 454 (100.0%) |
Household Income by Mortgage Status in Mount Morris
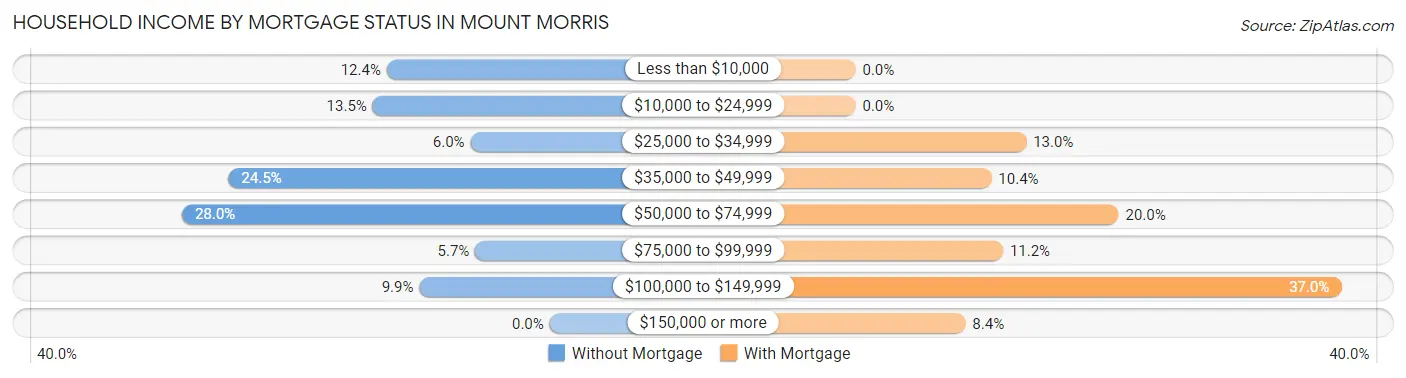
| Household Income | Without Mortgage | With Mortgage |
| Less than $10,000 | 35 (12.4%) | 0 (0.0%) |
| $10,000 to $24,999 | 38 (13.5%) | 0 (0.0%) |
| $25,000 to $34,999 | 17 (6.0%) | 59 (13.0%) |
| $35,000 to $49,999 | 69 (24.5%) | 47 (10.3%) |
| $50,000 to $74,999 | 79 (28.0%) | 91 (20.0%) |
| $75,000 to $99,999 | 16 (5.7%) | 51 (11.2%) |
| $100,000 to $149,999 | 28 (9.9%) | 168 (37.0%) |
| $150,000 or more | 0 (0.0%) | 38 (8.4%) |
| Total | 282 (100.0%) | 454 (100.0%) |
Property Value to Household Income Ratio in Mount Morris
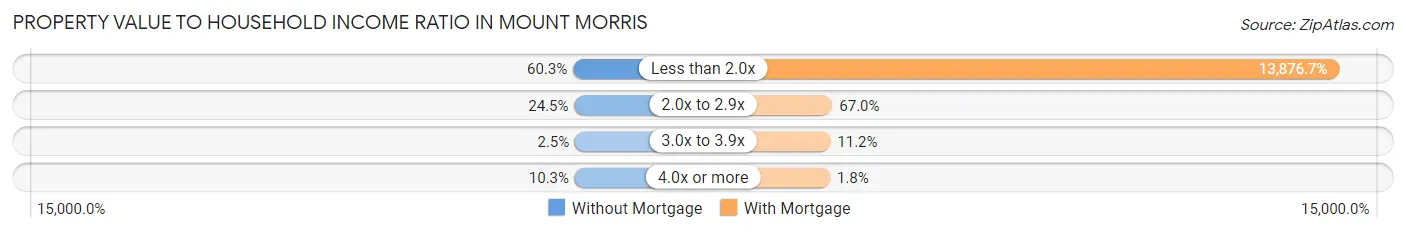
| Value-to-Income Ratio | Without Mortgage | With Mortgage |
| Less than 2.0x | 170 (60.3%) | 63,000 (13,876.7%) |
| 2.0x to 2.9x | 69 (24.5%) | 304 (67.0%) |
| 3.0x to 3.9x | 7 (2.5%) | 51 (11.2%) |
| 4.0x or more | 29 (10.3%) | 8 (1.8%) |
| Total | 282 (100.0%) | 454 (100.0%) |
Real Estate Taxes by Mortgage Status in Mount Morris
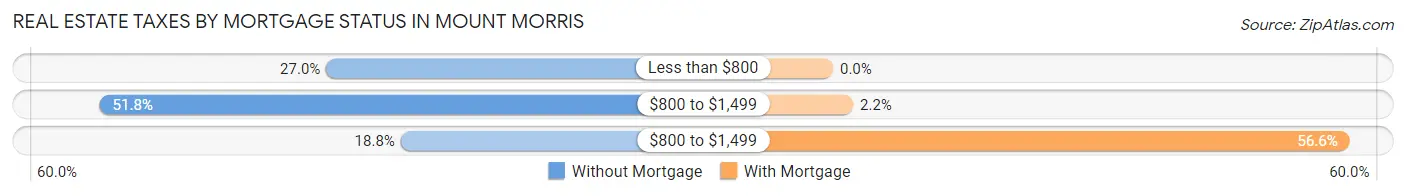
| Property Taxes | Without Mortgage | With Mortgage |
| Less than $800 | 76 (27.0%) | 0 (0.0%) |
| $800 to $1,499 | 146 (51.8%) | 10 (2.2%) |
| $800 to $1,499 | 53 (18.8%) | 257 (56.6%) |
| Total | 282 (100.0%) | 454 (100.0%) |
Health & Disability in Mount Morris
Health Insurance Coverage by Age in Mount Morris
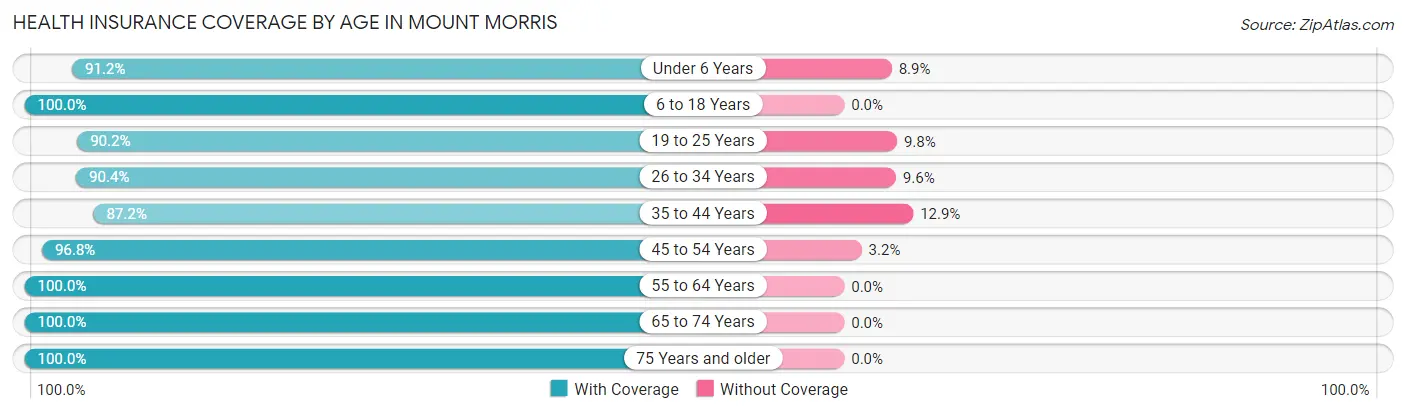
| Age Bracket | With Coverage | Without Coverage |
| Under 6 Years | 206 (91.1%) | 20 (8.8%) |
| 6 to 18 Years | 619 (100.0%) | 0 (0.0%) |
| 19 to 25 Years | 404 (90.2%) | 44 (9.8%) |
| 26 to 34 Years | 282 (90.4%) | 30 (9.6%) |
| 35 to 44 Years | 434 (87.2%) | 64 (12.9%) |
| 45 to 54 Years | 358 (96.8%) | 12 (3.2%) |
| 55 to 64 Years | 354 (100.0%) | 0 (0.0%) |
| 65 to 74 Years | 246 (100.0%) | 0 (0.0%) |
| 75 Years and older | 74 (100.0%) | 0 (0.0%) |
| Total | 2,977 (94.6%) | 170 (5.4%) |
Health Insurance Coverage by Citizenship Status in Mount Morris
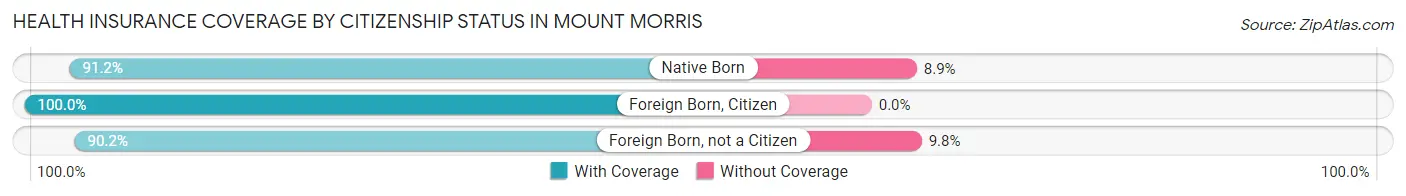
| Citizenship Status | With Coverage | Without Coverage |
| Native Born | 206 (91.1%) | 20 (8.8%) |
| Foreign Born, Citizen | 619 (100.0%) | 0 (0.0%) |
| Foreign Born, not a Citizen | 404 (90.2%) | 44 (9.8%) |
Health Insurance Coverage by Household Income in Mount Morris
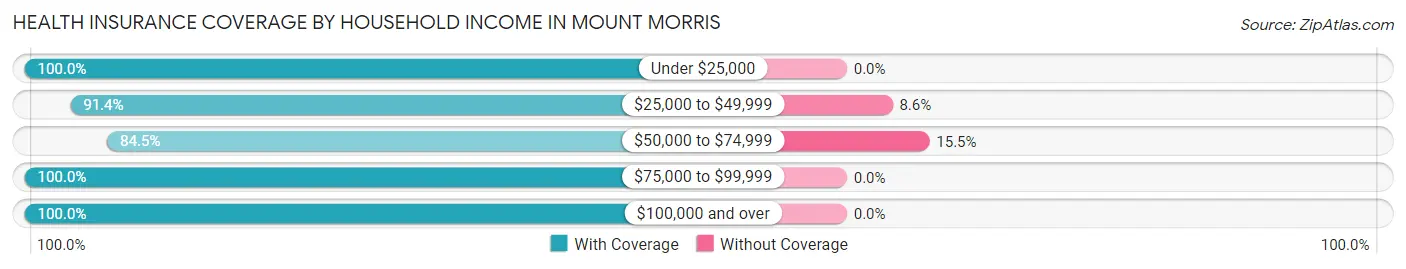
| Household Income | With Coverage | Without Coverage |
| Under $25,000 | 874 (100.0%) | 0 (0.0%) |
| $25,000 to $49,999 | 855 (91.4%) | 80 (8.6%) |
| $50,000 to $74,999 | 481 (84.5%) | 88 (15.5%) |
| $75,000 to $99,999 | 579 (100.0%) | 0 (0.0%) |
| $100,000 and over | 186 (100.0%) | 0 (0.0%) |
Public vs Private Health Insurance Coverage by Age in Mount Morris
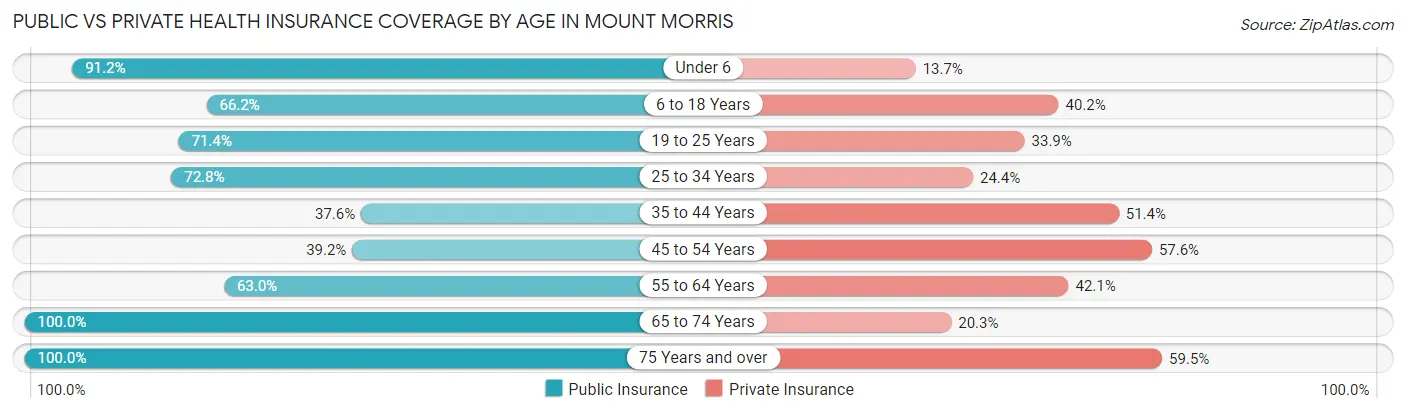
| Age Bracket | Public Insurance | Private Insurance |
| Under 6 | 206 (91.1%) | 31 (13.7%) |
| 6 to 18 Years | 410 (66.2%) | 249 (40.2%) |
| 19 to 25 Years | 320 (71.4%) | 152 (33.9%) |
| 25 to 34 Years | 227 (72.8%) | 76 (24.4%) |
| 35 to 44 Years | 187 (37.6%) | 256 (51.4%) |
| 45 to 54 Years | 145 (39.2%) | 213 (57.6%) |
| 55 to 64 Years | 223 (63.0%) | 149 (42.1%) |
| 65 to 74 Years | 246 (100.0%) | 50 (20.3%) |
| 75 Years and over | 74 (100.0%) | 44 (59.5%) |
| Total | 2,038 (64.8%) | 1,220 (38.8%) |
Disability Status by Sex by Age in Mount Morris
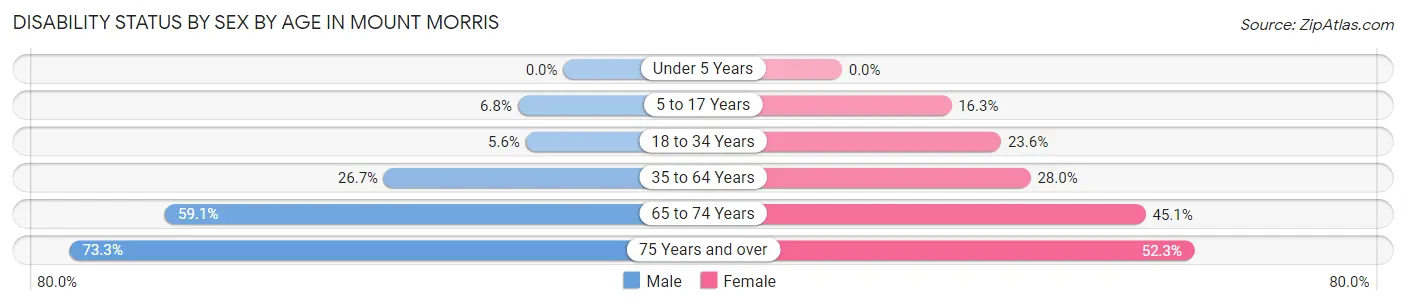
| Age Bracket | Male | Female |
| Under 5 Years | 0 (0.0%) | 0 (0.0%) |
| 5 to 17 Years | 21 (6.8%) | 46 (16.3%) |
| 18 to 34 Years | 26 (5.6%) | 78 (23.6%) |
| 35 to 64 Years | 145 (26.7%) | 190 (28.0%) |
| 65 to 74 Years | 55 (59.1%) | 69 (45.1%) |
| 75 Years and over | 22 (73.3%) | 23 (52.3%) |
Disability Class by Sex by Age in Mount Morris
Disability Class: Hearing Difficulty
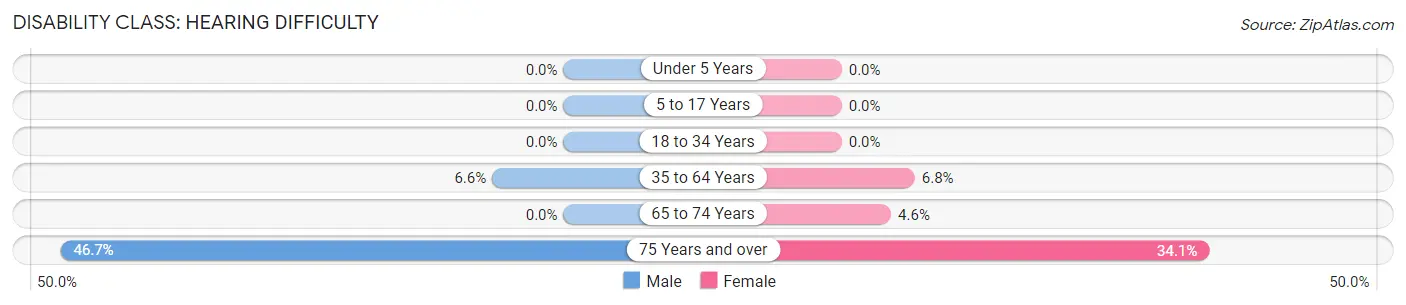
| Age Bracket | Male | Female |
| Under 5 Years | 0 (0.0%) | 0 (0.0%) |
| 5 to 17 Years | 0 (0.0%) | 0 (0.0%) |
| 18 to 34 Years | 0 (0.0%) | 0 (0.0%) |
| 35 to 64 Years | 36 (6.6%) | 46 (6.8%) |
| 65 to 74 Years | 0 (0.0%) | 7 (4.6%) |
| 75 Years and over | 14 (46.7%) | 15 (34.1%) |
Disability Class: Vision Difficulty
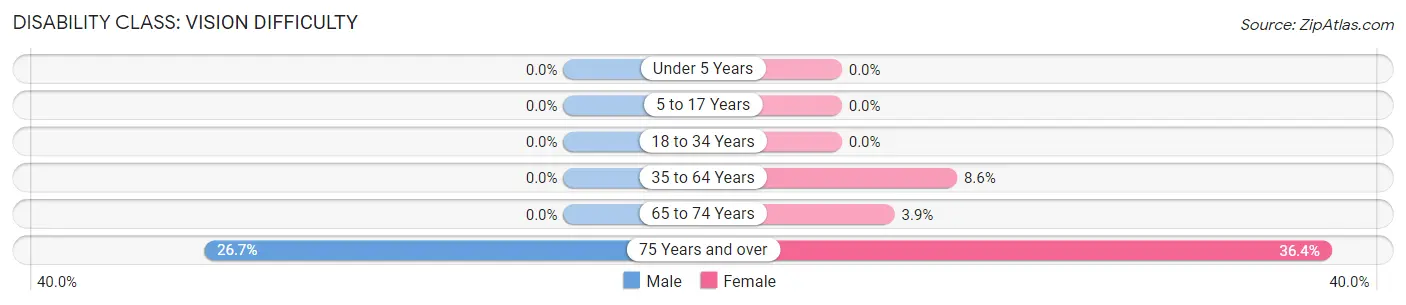
| Age Bracket | Male | Female |
| Under 5 Years | 0 (0.0%) | 0 (0.0%) |
| 5 to 17 Years | 0 (0.0%) | 0 (0.0%) |
| 18 to 34 Years | 0 (0.0%) | 0 (0.0%) |
| 35 to 64 Years | 0 (0.0%) | 58 (8.6%) |
| 65 to 74 Years | 0 (0.0%) | 6 (3.9%) |
| 75 Years and over | 8 (26.7%) | 16 (36.4%) |
Disability Class: Cognitive Difficulty
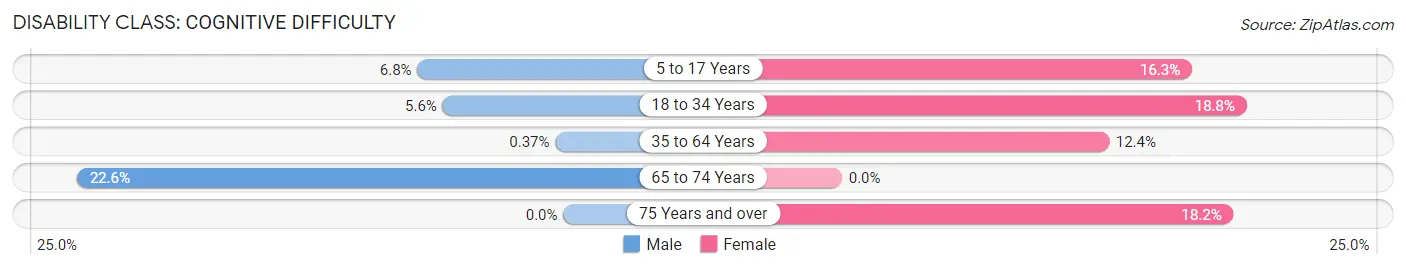
| Age Bracket | Male | Female |
| 5 to 17 Years | 21 (6.8%) | 46 (16.3%) |
| 18 to 34 Years | 26 (5.6%) | 62 (18.8%) |
| 35 to 64 Years | 2 (0.4%) | 84 (12.4%) |
| 65 to 74 Years | 21 (22.6%) | 0 (0.0%) |
| 75 Years and over | 0 (0.0%) | 8 (18.2%) |
Disability Class: Ambulatory Difficulty
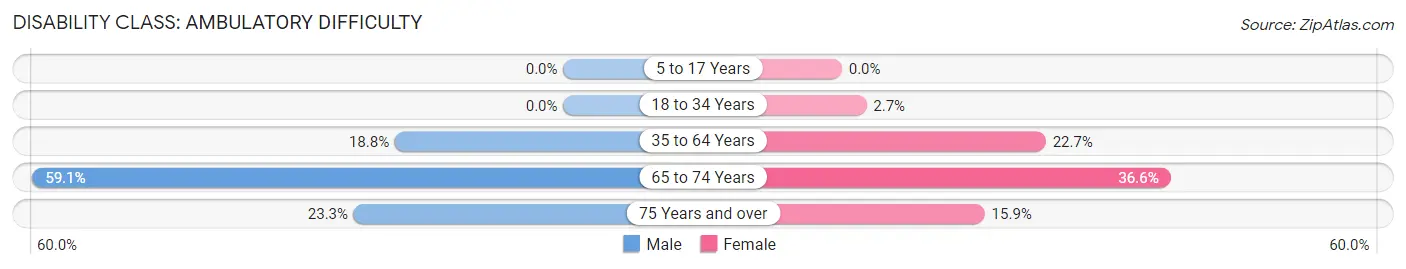
| Age Bracket | Male | Female |
| 5 to 17 Years | 0 (0.0%) | 0 (0.0%) |
| 18 to 34 Years | 0 (0.0%) | 9 (2.7%) |
| 35 to 64 Years | 102 (18.8%) | 154 (22.7%) |
| 65 to 74 Years | 55 (59.1%) | 56 (36.6%) |
| 75 Years and over | 7 (23.3%) | 7 (15.9%) |
Disability Class: Self-Care Difficulty
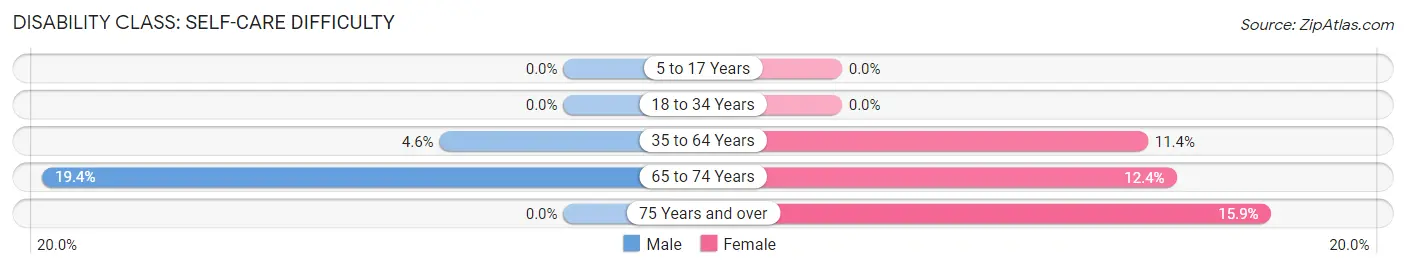
| Age Bracket | Male | Female |
| 5 to 17 Years | 0 (0.0%) | 0 (0.0%) |
| 18 to 34 Years | 0 (0.0%) | 0 (0.0%) |
| 35 to 64 Years | 25 (4.6%) | 77 (11.4%) |
| 65 to 74 Years | 18 (19.4%) | 19 (12.4%) |
| 75 Years and over | 0 (0.0%) | 7 (15.9%) |
Technology Access in Mount Morris
Computing Device Access in Mount Morris
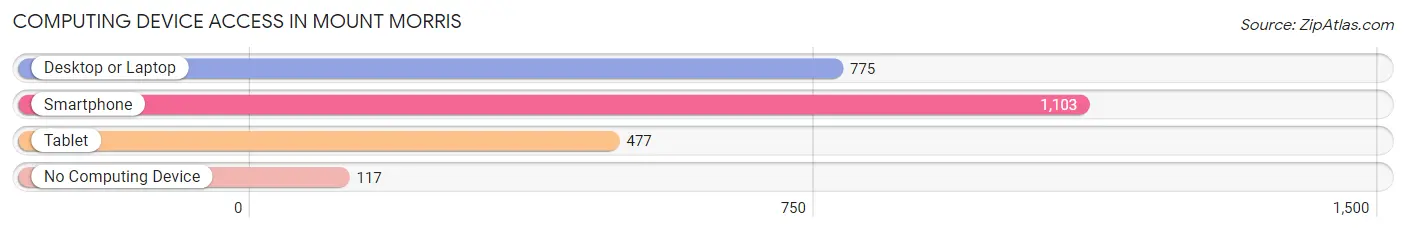
| Device Type | # Households | % Households |
| Desktop or Laptop | 775 | 59.3% |
| Smartphone | 1,103 | 84.5% |
| Tablet | 477 | 36.5% |
| No Computing Device | 117 | 9.0% |
| Total | 1,306 | 100.0% |
Internet Access in Mount Morris
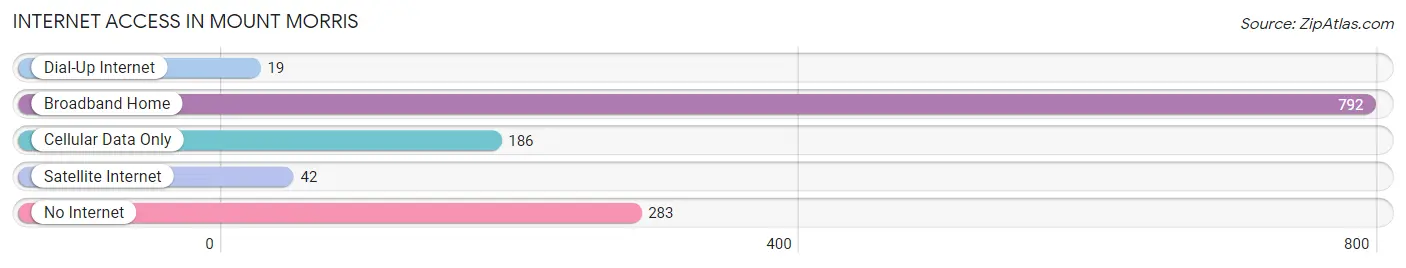
| Internet Type | # Households | % Households |
| Dial-Up Internet | 19 | 1.5% |
| Broadband Home | 792 | 60.6% |
| Cellular Data Only | 186 | 14.2% |
| Satellite Internet | 42 | 3.2% |
| No Internet | 283 | 21.7% |
| Total | 1,306 | 100.0% |
Mount Morris Summary
History
Mount Morris is a small village located in Genesee County, Michigan. It is situated on the Flint River, approximately 10 miles north of Flint. The village was founded in 1836 by a group of settlers from New York. The settlers named the village after Mount Morris, New York, which was the hometown of many of the settlers.
The village was originally a farming community, but it soon became a center for industry. In 1845, the first sawmill was built in the village. This sawmill was followed by a grist mill, a woolen mill, and a paper mill. These industries provided employment for many of the villagers and helped to make the village a prosperous place.
In the late 19th century, the village was connected to the rest of the state by the Flint and Pere Marquette Railroad. This allowed for the transportation of goods and people to and from the village.
In the early 20th century, the village experienced a period of growth. The population increased from 1,000 in 1900 to 2,000 in 1920. This growth was due in part to the influx of immigrants from Europe. Many of these immigrants were employed in the local industries.
In the mid-20th century, the village experienced a period of decline. The local industries began to close and the population decreased. By the 1970s, the population had dropped to 1,000.
Geography
Mount Morris is located in Genesee County, Michigan. It is situated on the Flint River, approximately 10 miles north of Flint. The village is located in a rural area and is surrounded by farmland.
The village has a total area of 1.2 square miles, all of which is land. The terrain is mostly flat, with some rolling hills. The village is located at an elevation of 830 feet above sea level.
The climate in Mount Morris is classified as humid continental. The average temperature in the summer is around 75 degrees Fahrenheit, and the average temperature in the winter is around 25 degrees Fahrenheit. The average annual precipitation is around 30 inches.
Economy
The economy of Mount Morris is largely based on agriculture. The village is surrounded by farmland, and many of the villagers are employed in the agricultural industry. The village also has a few small businesses, such as a grocery store, a hardware store, and a few restaurants.
The village is also home to a few manufacturing companies. These companies produce a variety of products, including automotive parts, furniture, and medical supplies.
Demographics
As of the 2010 census, the population of Mount Morris was 1,845. The racial makeup of the village was 95.3% White, 1.2% African American, 0.3% Native American, 0.7% Asian, 0.1% Pacific Islander, 0.7% from other races, and 1.7% from two or more races. Hispanic or Latino of any race were 2.2% of the population.
The median household income in the village was $37,917, and the median family income was $45,625. The per capita income was $18,945. About 11.3% of the population was below the poverty line.
Common Questions
What is Per Capita Income in Mount Morris?
Per Capita income in Mount Morris is $18,780.
What is the Median Family Income in Mount Morris?
Median Family Income in Mount Morris is $44,836.
What is the Median Household income in Mount Morris?
Median Household Income in Mount Morris is $40,714.
What is Income or Wage Gap in Mount Morris?
Income or Wage Gap in Mount Morris is 39.4%.
Women in Mount Morris earn 60.6 cents for every dollar earned by a man.
What is Inequality or Gini Index in Mount Morris?
Inequality or Gini Index in Mount Morris is 0.37.
What is the Total Population of Mount Morris?
Total Population of Mount Morris is 3,147.
What is the Total Male Population of Mount Morris?
Total Male Population of Mount Morris is 1,597.
What is the Total Female Population of Mount Morris?
Total Female Population of Mount Morris is 1,550.
What is the Ratio of Males per 100 Females in Mount Morris?
There are 103.03 Males per 100 Females in Mount Morris.
What is the Ratio of Females per 100 Males in Mount Morris?
There are 97.06 Females per 100 Males in Mount Morris.
What is the Median Population Age in Mount Morris?
Median Population Age in Mount Morris is 32.8 Years.
What is the Average Family Size in Mount Morris
Average Family Size in Mount Morris is 3.0 People.
What is the Average Household Size in Mount Morris
Average Household Size in Mount Morris is 2.4 People.
How Large is the Labor Force in Mount Morris?
There are 1,376 People in the Labor Forcein in Mount Morris.
What is the Percentage of People in the Labor Force in Mount Morris?
55.7% of People are in the Labor Force in Mount Morris.
What is the Unemployment Rate in Mount Morris?
Unemployment Rate in Mount Morris is 18.5%.