Cities with the Highest Percentage of Federal Government Employees in Maryland
RELATED REPORTS & OPTIONS
Federal Government Employees
Maryland
Compare Cities
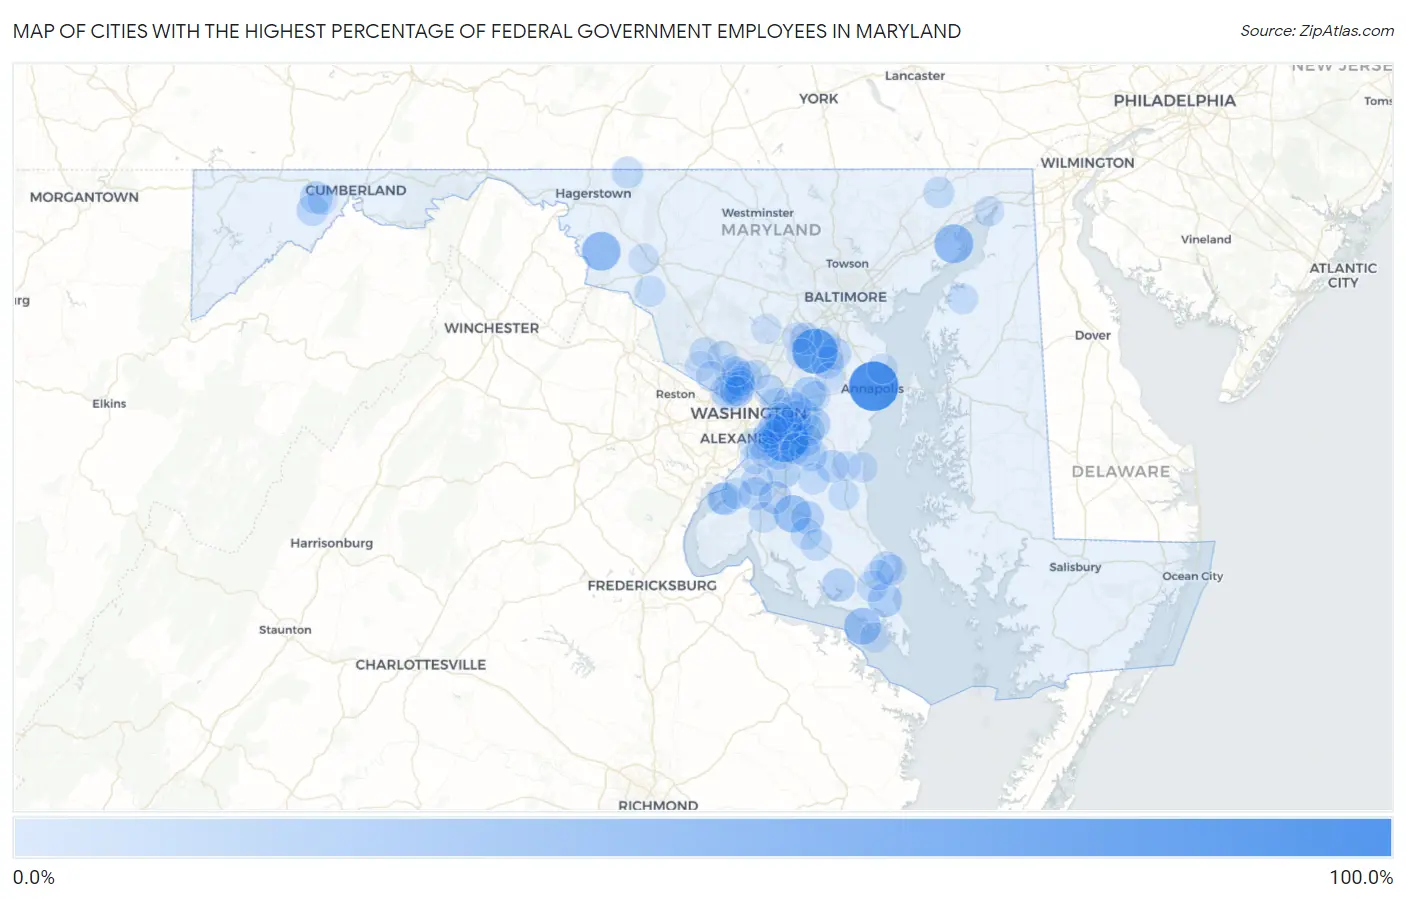
Map of Cities with the Highest Percentage of Federal Government Employees in Maryland
0.0%
100.0%
Cities with the Highest Percentage of Federal Government Employees in Maryland
| City | % Federal Government Employees | vs State | vs National | |
| 1. | Naval Academy | 89.6% | 11.3%(+78.3)#1 | 3.4%(+86.2)#32 |
| 2. | Andrews Afb | 77.1% | 11.3%(+65.9)#2 | 3.4%(+73.8)#79 |
| 3. | Fort Meade | 72.6% | 11.3%(+61.3)#3 | 3.4%(+69.2)#99 |
| 4. | Aberdeen Proving Ground | 48.6% | 11.3%(+37.3)#4 | 3.4%(+45.2)#186 |
| 5. | Mount Briar | 47.7% | 11.3%(+36.5)#5 | 3.4%(+44.4)#194 |
| 6. | Bryantown | 42.5% | 11.3%(+31.2)#6 | 3.4%(+39.1)#230 |
| 7. | Wildewood | 41.2% | 11.3%(+29.9)#7 | 3.4%(+37.8)#239 |
| 8. | Tall Timbers | 41.0% | 11.3%(+29.7)#8 | 3.4%(+37.6)#241 |
| 9. | Callaway | 37.2% | 11.3%(+25.9)#9 | 3.4%(+33.8)#272 |
| 10. | Lexington Park | 31.5% | 11.3%(+20.2)#10 | 3.4%(+28.1)#373 |
| 11. | Fairwood | 31.1% | 11.3%(+19.9)#11 | 3.4%(+27.8)#382 |
| 12. | Westphalia | 28.9% | 11.3%(+17.7)#12 | 3.4%(+25.6)#427 |
| 13. | Brandywine | 28.4% | 11.3%(+17.2)#13 | 3.4%(+25.0)#441 |
| 14. | Melwood | 28.2% | 11.3%(+16.9)#14 | 3.4%(+24.8)#444 |
| 15. | Brock Hall | 28.0% | 11.3%(+16.7)#15 | 3.4%(+24.6)#448 |
| 16. | Leonardtown | 27.8% | 11.3%(+16.5)#16 | 3.4%(+24.4)#457 |
| 17. | Hughesville | 27.1% | 11.3%(+15.8)#17 | 3.4%(+23.7)#482 |
| 18. | Potomac Heights | 26.7% | 11.3%(+15.4)#18 | 3.4%(+23.3)#495 |
| 19. | Morningside | 26.4% | 11.3%(+15.1)#19 | 3.4%(+23.0)#508 |
| 20. | Bensville | 26.3% | 11.3%(+15.0)#20 | 3.4%(+22.9)#511 |
| 21. | Waldorf | 26.0% | 11.3%(+14.7)#21 | 3.4%(+22.6)#519 |
| 22. | Shaft | 26.0% | 11.3%(+14.7)#22 | 3.4%(+22.6)#522 |
| 23. | Odenton | 25.7% | 11.3%(+14.5)#23 | 3.4%(+22.4)#530 |
| 24. | Dunkirk | 25.5% | 11.3%(+14.2)#24 | 3.4%(+22.1)#542 |
| 25. | Kettering | 25.4% | 11.3%(+14.1)#25 | 3.4%(+22.0)#546 |
| 26. | Lusby | 25.3% | 11.3%(+14.0)#26 | 3.4%(+21.9)#549 |
| 27. | Gambrills | 24.9% | 11.3%(+13.6)#27 | 3.4%(+21.5)#578 |
| 28. | Croom | 24.8% | 11.3%(+13.6)#28 | 3.4%(+21.5)#580 |
| 29. | Jessup | 24.5% | 11.3%(+13.2)#29 | 3.4%(+21.1)#590 |
| 30. | Queensland | 24.2% | 11.3%(+12.9)#30 | 3.4%(+20.8)#600 |
| 31. | Friendship Heights Village | 23.9% | 11.3%(+12.7)#31 | 3.4%(+20.6)#614 |
| 32. | Marlboro Village | 23.9% | 11.3%(+12.6)#32 | 3.4%(+20.5)#615 |
| 33. | South Kensington | 23.3% | 11.3%(+12.0)#33 | 3.4%(+19.9)#648 |
| 34. | Gilmore | 23.0% | 11.3%(+11.8)#34 | 3.4%(+19.7)#658 |
| 35. | Accokeek | 22.9% | 11.3%(+11.6)#35 | 3.4%(+19.5)#665 |
| 36. | Clinton | 22.7% | 11.3%(+11.5)#36 | 3.4%(+19.4)#671 |
| 37. | Cheverly | 22.7% | 11.3%(+11.4)#37 | 3.4%(+19.3)#678 |
| 38. | California | 22.2% | 11.3%(+10.9)#38 | 3.4%(+18.8)#716 |
| 39. | Ringgold | 22.0% | 11.3%(+10.7)#39 | 3.4%(+18.6)#729 |
| 40. | Baden | 21.7% | 11.3%(+10.4)#40 | 3.4%(+18.3)#746 |
| 41. | Charlotte Hall | 21.6% | 11.3%(+10.4)#41 | 3.4%(+18.3)#747 |
| 42. | Mechanicsville | 21.4% | 11.3%(+10.2)#42 | 3.4%(+18.1)#758 |
| 43. | Peppermill Village | 21.0% | 11.3%(+9.76)#43 | 3.4%(+17.7)#774 |
| 44. | Indian Head | 21.0% | 11.3%(+9.75)#44 | 3.4%(+17.6)#775 |
| 45. | Darlington | 20.8% | 11.3%(+9.50)#45 | 3.4%(+17.4)#788 |
| 46. | Chevy Chase | 20.8% | 11.3%(+9.50)#46 | 3.4%(+17.4)#789 |
| 47. | University Park | 20.7% | 11.3%(+9.41)#47 | 3.4%(+17.3)#795 |
| 48. | Bethesda | 20.5% | 11.3%(+9.27)#48 | 3.4%(+17.2)#805 |
| 49. | Severn | 20.3% | 11.3%(+9.07)#49 | 3.4%(+17.0)#815 |
| 50. | Rosaryville | 20.1% | 11.3%(+8.85)#50 | 3.4%(+16.7)#824 |
| 51. | National Harbor | 20.1% | 11.3%(+8.81)#51 | 3.4%(+16.7)#829 |
| 52. | Bryans Road | 19.8% | 11.3%(+8.57)#52 | 3.4%(+16.5)#849 |
| 53. | Walker Mill | 19.8% | 11.3%(+8.53)#53 | 3.4%(+16.4)#851 |
| 54. | North Potomac | 19.7% | 11.3%(+8.45)#54 | 3.4%(+16.3)#853 |
| 55. | Adamstown | 19.7% | 11.3%(+8.39)#55 | 3.4%(+16.3)#859 |
| 56. | Huntingtown | 19.5% | 11.3%(+8.24)#56 | 3.4%(+16.1)#871 |
| 57. | Butlertown | 19.5% | 11.3%(+8.20)#57 | 3.4%(+16.1)#874 |
| 58. | Bowie | 19.4% | 11.3%(+8.18)#58 | 3.4%(+16.1)#876 |
| 59. | North Bethesda | 19.3% | 11.3%(+8.08)#59 | 3.4%(+16.0)#885 |
| 60. | Chesapeake Ranch Estates | 19.2% | 11.3%(+7.97)#60 | 3.4%(+15.9)#890 |
| 61. | Fort Washington | 19.2% | 11.3%(+7.94)#61 | 3.4%(+15.8)#900 |
| 62. | Marlton | 19.1% | 11.3%(+7.87)#62 | 3.4%(+15.8)#907 |
| 63. | Forest Glen | 19.0% | 11.3%(+7.73)#63 | 3.4%(+15.6)#915 |
| 64. | Maryland Park | 18.9% | 11.3%(+7.60)#64 | 3.4%(+15.5)#924 |
| 65. | Rockville | 18.8% | 11.3%(+7.49)#65 | 3.4%(+15.4)#934 |
| 66. | Glen Echo | 18.8% | 11.3%(+7.48)#66 | 3.4%(+15.4)#935 |
| 67. | Savage | 18.5% | 11.3%(+7.25)#67 | 3.4%(+15.1)#953 |
| 68. | Four Corners | 18.4% | 11.3%(+7.11)#68 | 3.4%(+15.0)#962 |
| 69. | Cape St Claire | 18.4% | 11.3%(+7.10)#69 | 3.4%(+15.0)#963 |
| 70. | La Plata | 18.3% | 11.3%(+7.00)#70 | 3.4%(+14.9)#968 |
| 71. | Largo | 18.2% | 11.3%(+6.96)#71 | 3.4%(+14.9)#969 |
| 72. | Temple Hills | 18.2% | 11.3%(+6.96)#72 | 3.4%(+14.9)#970 |
| 73. | Oxon Hill | 18.2% | 11.3%(+6.91)#73 | 3.4%(+14.8)#973 |
| 74. | Vale Summit | 18.0% | 11.3%(+6.71)#74 | 3.4%(+14.6)#983 |
| 75. | Lake Arbor | 17.9% | 11.3%(+6.64)#75 | 3.4%(+14.5)#991 |
| 76. | Braddock Heights | 17.8% | 11.3%(+6.58)#76 | 3.4%(+14.5)#998 |
| 77. | Chevy Chase Section Five | 17.8% | 11.3%(+6.51)#77 | 3.4%(+14.4)#1,003 |
| 78. | Solomons | 17.7% | 11.3%(+6.45)#78 | 3.4%(+14.3)#1,007 |
| 79. | Charlestown | 17.7% | 11.3%(+6.41)#79 | 3.4%(+14.3)#1,009 |
| 80. | Suitland | 17.7% | 11.3%(+6.39)#80 | 3.4%(+14.3)#1,011 |
| 81. | Glenarden | 17.6% | 11.3%(+6.35)#81 | 3.4%(+14.2)#1,023 |
| 82. | Marlow Heights | 17.6% | 11.3%(+6.35)#82 | 3.4%(+14.2)#1,024 |
| 83. | Brookmont | 17.6% | 11.3%(+6.32)#83 | 3.4%(+14.2)#1,027 |
| 84. | St George Island | 17.5% | 11.3%(+6.26)#84 | 3.4%(+14.1)#1,032 |
| 85. | Friendly | 17.4% | 11.3%(+6.08)#85 | 3.4%(+14.0)#1,043 |
| 86. | North Chevy Chase | 17.3% | 11.3%(+6.00)#86 | 3.4%(+13.9)#1,050 |
| 87. | Travilah | 17.2% | 11.3%(+5.94)#87 | 3.4%(+13.8)#1,058 |
| 88. | Lisbon | 17.1% | 11.3%(+5.87)#88 | 3.4%(+13.8)#1,064 |
| 89. | Potomac | 17.1% | 11.3%(+5.79)#89 | 3.4%(+13.7)#1,073 |
| 90. | Crofton | 17.0% | 11.3%(+5.69)#90 | 3.4%(+13.6)#1,080 |
| 91. | Chevy Chase Village | 16.9% | 11.3%(+5.63)#91 | 3.4%(+13.5)#1,086 |
| 92. | North Beach | 16.9% | 11.3%(+5.59)#92 | 3.4%(+13.5)#1,088 |
| 93. | Capitol Heights | 16.7% | 11.3%(+5.40)#93 | 3.4%(+13.3)#1,094 |
| 94. | Somerset | 16.6% | 11.3%(+5.36)#94 | 3.4%(+13.3)#1,110 |
| 95. | Maryland City | 16.5% | 11.3%(+5.23)#95 | 3.4%(+13.1)#1,122 |
| 96. | Forestville | 16.4% | 11.3%(+5.15)#96 | 3.4%(+13.0)#1,127 |
| 97. | Garrett Park | 16.3% | 11.3%(+5.07)#97 | 3.4%(+13.0)#1,135 |
| 98. | Silver Hill | 16.3% | 11.3%(+5.00)#98 | 3.4%(+12.9)#1,141 |
| 99. | Highland | 16.3% | 11.3%(+4.99)#99 | 3.4%(+12.9)#1,144 |
| 100. | Owings | 16.2% | 11.3%(+4.98)#100 | 3.4%(+12.9)#1,145 |
Common Questions
What are the Top 10 Cities with the Highest Percentage of Federal Government Employees in Maryland?
Top 10 Cities with the Highest Percentage of Federal Government Employees in Maryland are:
#1
89.6%
#2
77.1%
#3
72.6%
#4
48.6%
#5
47.7%
#6
42.5%
#7
41.0%
#8
31.5%
#9
31.1%
#10
28.9%
What city has the Highest Percentage of Federal Government Employees in Maryland?
Naval Academy has the Highest Percentage of Federal Government Employees in Maryland with 89.6%.
What is the Percentage of Federal Government Employees in the State of Maryland?
Percentage of Federal Government Employees in Maryland is 11.3%.
What is the Percentage of Federal Government Employees in the United States?
Percentage of Federal Government Employees in the United States is 3.4%.