Cities with the Highest Percentage of Population Employed in Computer & Mathematics in Kansas
RELATED REPORTS & OPTIONS
Computer & Mathematics
Kansas
Compare Cities
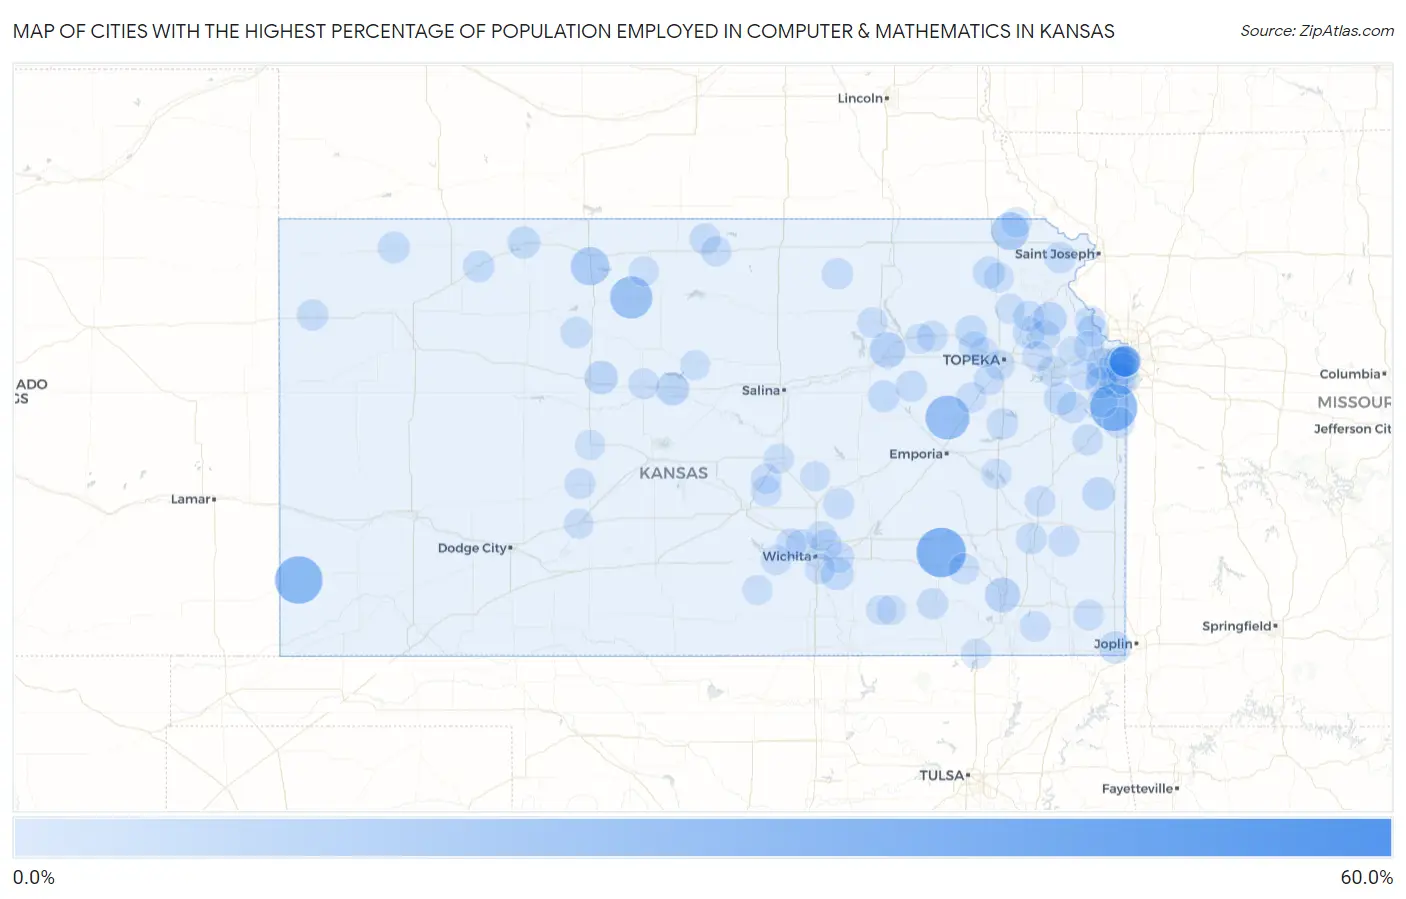
Map of Cities with the Highest Percentage of Population Employed in Computer & Mathematics in Kansas
0.0%
60.0%
Cities with the Highest Percentage of Population Employed in Computer & Mathematics in Kansas
| City | % Employed | vs State | vs National | |
| 1. | Furley | 57.1% | 3.0%(+54.2)#1 | 3.5%(+53.6)#12 |
| 2. | Climax | 33.3% | 3.0%(+30.4)#2 | 3.5%(+29.8)#60 |
| 3. | Manter | 30.0% | 3.0%(+27.0)#3 | 3.5%(+26.5)#68 |
| 4. | Bucyrus | 29.5% | 3.0%(+26.6)#4 | 3.5%(+26.0)#72 |
| 5. | Allen | 24.5% | 3.0%(+21.5)#5 | 3.5%(+20.9)#108 |
| 6. | Alton | 21.6% | 3.0%(+18.6)#6 | 3.5%(+18.1)#144 |
| 7. | Wabaunsee | 17.4% | 3.0%(+14.4)#7 | 3.5%(+13.9)#222 |
| 8. | Glade | 15.6% | 3.0%(+12.6)#8 | 3.5%(+12.1)#288 |
| 9. | Hamlin | 14.3% | 3.0%(+11.3)#9 | 3.5%(+10.8)#357 |
| 10. | Ogden | 11.6% | 3.0%(+8.61)#10 | 3.5%(+8.06)#533 |
| 11. | Neodesha | 10.3% | 3.0%(+7.36)#11 | 3.5%(+6.81)#677 |
| 12. | Merriam | 8.2% | 3.0%(+5.23)#12 | 3.5%(+4.69)#1,144 |
| 13. | Overland Park | 8.1% | 3.0%(+5.16)#13 | 3.5%(+4.61)#1,168 |
| 14. | Winchester | 8.0% | 3.0%(+5.00)#14 | 3.5%(+4.45)#1,233 |
| 15. | Catharine | 7.9% | 3.0%(+4.89)#15 | 3.5%(+4.34)#1,277 |
| 16. | Dorrance | 7.8% | 3.0%(+4.86)#16 | 3.5%(+4.32)#1,284 |
| 17. | Mound City | 7.0% | 3.0%(+4.06)#17 | 3.5%(+3.51)#1,579 |
| 18. | Rose Hill | 6.8% | 3.0%(+3.81)#18 | 3.5%(+3.26)#1,710 |
| 19. | Baldwin City | 6.5% | 3.0%(+3.55)#19 | 3.5%(+3.00)#1,857 |
| 20. | Lowell | 6.3% | 3.0%(+3.37)#20 | 3.5%(+2.82)#1,945 |
| 21. | Norton | 6.3% | 3.0%(+3.31)#21 | 3.5%(+2.76)#1,975 |
| 22. | Wetmore | 5.9% | 3.0%(+2.90)#22 | 3.5%(+2.36)#2,259 |
| 23. | Delia | 5.8% | 3.0%(+2.86)#23 | 3.5%(+2.31)#2,287 |
| 24. | Ozawkie | 5.8% | 3.0%(+2.79)#24 | 3.5%(+2.24)#2,335 |
| 25. | Lenexa | 5.7% | 3.0%(+2.70)#25 | 3.5%(+2.15)#2,419 |
| 26. | Atwood | 5.5% | 3.0%(+2.49)#26 | 3.5%(+1.95)#2,596 |
| 27. | Roeland Park | 5.5% | 3.0%(+2.48)#27 | 3.5%(+1.93)#2,610 |
| 28. | Shawnee | 5.4% | 3.0%(+2.43)#28 | 3.5%(+1.88)#2,666 |
| 29. | White City | 5.4% | 3.0%(+2.40)#29 | 3.5%(+1.85)#2,696 |
| 30. | Olathe | 5.4% | 3.0%(+2.39)#30 | 3.5%(+1.85)#2,701 |
| 31. | Lansing | 5.3% | 3.0%(+2.35)#31 | 3.5%(+1.81)#2,742 |
| 32. | Mission | 5.2% | 3.0%(+2.24)#32 | 3.5%(+1.69)#2,840 |
| 33. | Jennings | 5.1% | 3.0%(+2.15)#33 | 3.5%(+1.60)#2,947 |
| 34. | Bendena | 5.1% | 3.0%(+2.08)#34 | 3.5%(+1.54)#3,018 |
| 35. | Lyndon | 5.0% | 3.0%(+2.04)#35 | 3.5%(+1.49)#3,070 |
| 36. | Zurich | 5.0% | 3.0%(+2.02)#36 | 3.5%(+1.48)#3,097 |
| 37. | Leawood | 5.0% | 3.0%(+2.00)#37 | 3.5%(+1.46)#3,116 |
| 38. | Alta Vista | 5.0% | 3.0%(+1.99)#38 | 3.5%(+1.45)#3,123 |
| 39. | Mission Woods | 4.9% | 3.0%(+1.96)#39 | 3.5%(+1.41)#3,161 |
| 40. | Louisburg | 4.9% | 3.0%(+1.95)#40 | 3.5%(+1.41)#3,169 |
| 41. | Prairie Village | 4.9% | 3.0%(+1.91)#41 | 3.5%(+1.37)#3,206 |
| 42. | Wellsville | 4.9% | 3.0%(+1.88)#42 | 3.5%(+1.34)#3,253 |
| 43. | Goodland | 4.8% | 3.0%(+1.77)#43 | 3.5%(+1.23)#3,375 |
| 44. | Maize | 4.7% | 3.0%(+1.67)#44 | 3.5%(+1.13)#3,509 |
| 45. | Palmer | 4.5% | 3.0%(+1.57)#45 | 3.5%(+1.02)#3,627 |
| 46. | Burr Oak | 4.5% | 3.0%(+1.57)#46 | 3.5%(+1.02)#3,630 |
| 47. | Bel Aire | 4.5% | 3.0%(+1.52)#47 | 3.5%(+0.978)#3,674 |
| 48. | Elbing | 4.5% | 3.0%(+1.50)#48 | 3.5%(+0.953)#3,706 |
| 49. | Fairway | 4.4% | 3.0%(+1.45)#49 | 3.5%(+0.903)#3,770 |
| 50. | Moline | 4.3% | 3.0%(+1.37)#50 | 3.5%(+0.823)#3,898 |
| 51. | Wamego | 4.3% | 3.0%(+1.28)#51 | 3.5%(+0.735)#4,037 |
| 52. | Humboldt | 4.2% | 3.0%(+1.23)#52 | 3.5%(+0.680)#4,120 |
| 53. | Lawrence | 4.2% | 3.0%(+1.20)#53 | 3.5%(+0.655)#4,164 |
| 54. | Osawatomie | 4.2% | 3.0%(+1.19)#54 | 3.5%(+0.648)#4,180 |
| 55. | Fall River | 4.2% | 3.0%(+1.19)#55 | 3.5%(+0.642)#4,198 |
| 56. | Rozel | 4.2% | 3.0%(+1.19)#56 | 3.5%(+0.642)#4,204 |
| 57. | Elsmore | 4.2% | 3.0%(+1.19)#57 | 3.5%(+0.642)#4,206 |
| 58. | Andover | 4.2% | 3.0%(+1.17)#58 | 3.5%(+0.629)#4,221 |
| 59. | Valley Falls | 4.1% | 3.0%(+1.13)#59 | 3.5%(+0.583)#4,292 |
| 60. | De Soto | 4.0% | 3.0%(+1.07)#60 | 3.5%(+0.521)#4,388 |
| 61. | Colwich | 3.9% | 3.0%(+0.959)#61 | 3.5%(+0.414)#4,570 |
| 62. | West Mineral | 3.9% | 3.0%(+0.942)#62 | 3.5%(+0.397)#4,601 |
| 63. | Russell | 3.9% | 3.0%(+0.926)#63 | 3.5%(+0.381)#4,628 |
| 64. | Westwood | 3.9% | 3.0%(+0.916)#64 | 3.5%(+0.372)#4,642 |
| 65. | Leavenworth | 3.9% | 3.0%(+0.908)#65 | 3.5%(+0.363)#4,666 |
| 66. | Colony | 3.8% | 3.0%(+0.866)#66 | 3.5%(+0.322)#4,728 |
| 67. | Harveyville | 3.7% | 3.0%(+0.770)#67 | 3.5%(+0.225)#4,911 |
| 68. | Riley | 3.7% | 3.0%(+0.716)#68 | 3.5%(+0.172)#5,017 |
| 69. | Oaklawn Sunview | 3.7% | 3.0%(+0.697)#69 | 3.5%(+0.153)#5,050 |
| 70. | Westwood Hills | 3.7% | 3.0%(+0.694)#70 | 3.5%(+0.149)#5,061 |
| 71. | Mound Valley | 3.6% | 3.0%(+0.617)#71 | 3.5%(+0.073)#5,211 |
| 72. | Basehor | 3.6% | 3.0%(+0.600)#72 | 3.5%(+0.055)#5,245 |
| 73. | Oskaloosa | 3.6% | 3.0%(+0.571)#73 | 3.5%(+0.027)#5,305 |
| 74. | Garden Plain | 3.5% | 3.0%(+0.549)#74 | 3.5%(+0.005)#5,356 |
| 75. | Mankato | 3.5% | 3.0%(+0.515)#75 | 3.5%(-0.030)#5,431 |
| 76. | Buhler | 3.5% | 3.0%(+0.503)#76 | 3.5%(-0.042)#5,459 |
| 77. | Inman | 3.4% | 3.0%(+0.421)#77 | 3.5%(-0.123)#5,635 |
| 78. | Auburn | 3.3% | 3.0%(+0.335)#78 | 3.5%(-0.210)#5,828 |
| 79. | Perry | 3.3% | 3.0%(+0.301)#79 | 3.5%(-0.243)#5,914 |
| 80. | Goessel | 3.2% | 3.0%(+0.259)#80 | 3.5%(-0.286)#6,010 |
| 81. | Netawaka | 3.2% | 3.0%(+0.246)#81 | 3.5%(-0.299)#6,051 |
| 82. | Reserve | 3.2% | 3.0%(+0.246)#82 | 3.5%(-0.299)#6,055 |
| 83. | Spring Hill | 3.2% | 3.0%(+0.236)#83 | 3.5%(-0.309)#6,074 |
| 84. | Topeka | 3.2% | 3.0%(+0.209)#84 | 3.5%(-0.336)#6,143 |
| 85. | St George | 3.2% | 3.0%(+0.180)#85 | 3.5%(-0.365)#6,209 |
| 86. | New Strawn | 3.1% | 3.0%(+0.131)#86 | 3.5%(-0.413)#6,328 |
| 87. | Sylvan Grove | 3.1% | 3.0%(+0.126)#87 | 3.5%(-0.419)#6,339 |
| 88. | Rush Center | 3.1% | 3.0%(+0.121)#88 | 3.5%(-0.424)#6,357 |
| 89. | Burden | 3.0% | 3.0%(+0.050)#89 | 3.5%(-0.494)#6,526 |
| 90. | Mcpherson | 3.0% | 3.0%(-0.004)#90 | 3.5%(-0.548)#6,657 |
| 91. | Silver Lake | 3.0% | 3.0%(-0.016)#91 | 3.5%(-0.560)#6,686 |
| 92. | Kechi | 3.0% | 3.0%(-0.027)#92 | 3.5%(-0.572)#6,712 |
| 93. | Cambridge | 2.9% | 3.0%(-0.039)#93 | 3.5%(-0.583)#6,750 |
| 94. | Caney | 2.9% | 3.0%(-0.050)#94 | 3.5%(-0.594)#6,773 |
| 95. | Tonganoxie | 2.9% | 3.0%(-0.105)#95 | 3.5%(-0.650)#6,897 |
| 96. | Norwich | 2.9% | 3.0%(-0.111)#96 | 3.5%(-0.656)#6,917 |
| 97. | Gaylord | 2.9% | 3.0%(-0.123)#97 | 3.5%(-0.667)#6,956 |
| 98. | Rossville | 2.8% | 3.0%(-0.146)#98 | 3.5%(-0.691)#7,007 |
| 99. | Kinsley | 2.8% | 3.0%(-0.156)#99 | 3.5%(-0.701)#7,032 |
| 100. | Denison | 2.8% | 3.0%(-0.163)#100 | 3.5%(-0.708)#7,052 |
Common Questions
What are the Top 10 Cities with the Highest Percentage of Population Employed in Computer & Mathematics in Kansas?
Top 10 Cities with the Highest Percentage of Population Employed in Computer & Mathematics in Kansas are:
What city has the Highest Percentage of Population Employed in Computer & Mathematics in Kansas?
Climax has the Highest Percentage of Population Employed in Computer & Mathematics in Kansas with 33.3%.
What is the Percentage of Population Employed in Computer & Mathematics in the State of Kansas?
Percentage of Population Employed in Computer & Mathematics in Kansas is 3.0%.
What is the Percentage of Population Employed in Computer & Mathematics in the United States?
Percentage of Population Employed in Computer & Mathematics in the United States is 3.5%.