Leavenworth, KS Map & Demographics
Leavenworth Map
Leavenworth Overview
$32,849
PER CAPITA INCOME
$92,229
AVG FAMILY INCOME
$67,360
AVG HOUSEHOLD INCOME
26.9%
WAGE / INCOME GAP [ % ]
73.1¢/ $1
WAGE / INCOME GAP [ $ ]
$9,917
FAMILY INCOME DEFICIT
0.44
INEQUALITY / GINI INDEX
37,193
TOTAL POPULATION
20,377
MALE POPULATION
16,816
FEMALE POPULATION
121.18
MALES / 100 FEMALES
82.52
FEMALES / 100 MALES
35.9
MEDIAN AGE
3.2
AVG FAMILY SIZE
2.5
AVG HOUSEHOLD SIZE
16,508
LABOR FORCE [ PEOPLE ]
56.5%
PERCENT IN LABOR FORCE
4.6%
UNEMPLOYMENT RATE
Leavenworth Zip Codes
Leavenworth Area Codes
Income in Leavenworth
Income Overview in Leavenworth
Per Capita Income in Leavenworth is $32,849, while median incomes of families and households are $92,229 and $67,360 respectively.
| Characteristic | Number | Measure |
| Per Capita Income | 37,193 | $32,849 |
| Median Family Income | 8,201 | $92,229 |
| Mean Family Income | 8,201 | $106,046 |
| Median Household Income | 13,285 | $67,360 |
| Mean Household Income | 13,285 | $86,108 |
| Income Deficit | 8,201 | $9,917 |
| Wage / Income Gap (%) | 37,193 | 26.87% |
| Wage / Income Gap ($) | 37,193 | 73.13¢ per $1 |
| Gini / Inequality Index | 37,193 | 0.44 |
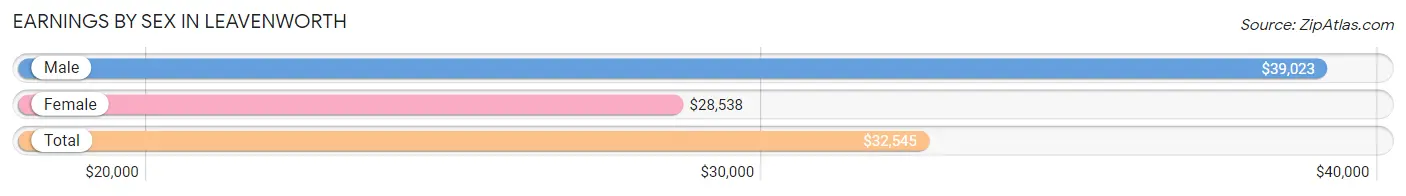
Earnings by Sex in Leavenworth
Average Earnings in Leavenworth are $32,545, $39,023 for men and $28,538 for women, a difference of 26.9%.
| Sex | Number | Average Earnings |
| Male | 11,729 (59.5%) | $39,023 |
| Female | 7,979 (40.5%) | $28,538 |
| Total | 19,708 (100.0%) | $32,545 |
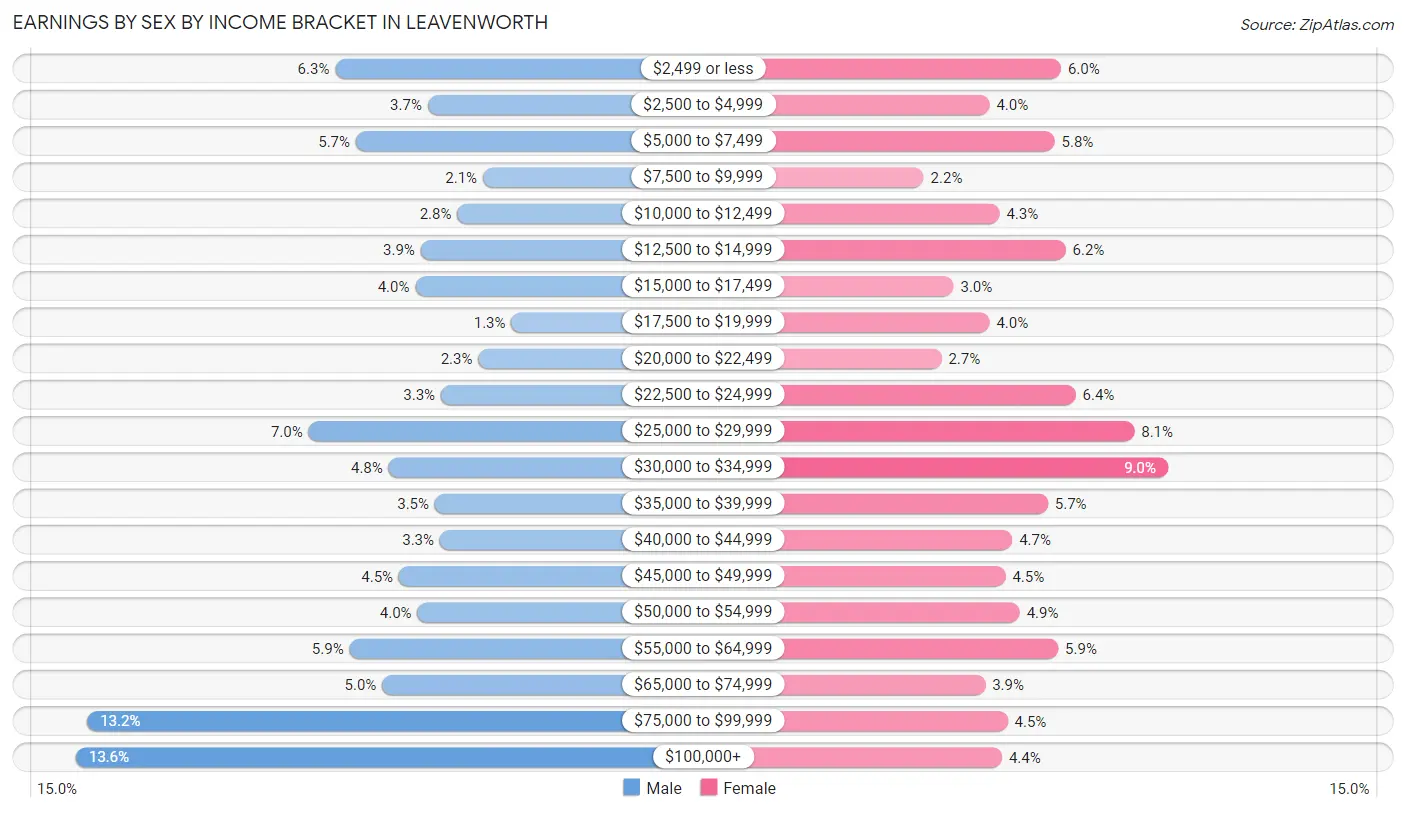
Earnings by Sex by Income Bracket in Leavenworth
The most common earnings brackets in Leavenworth are $100,000+ for men (1,591 | 13.6%) and $30,000 to $34,999 for women (720 | 9.0%).
| Income | Male | Female |
| $2,499 or less | 735 (6.3%) | 480 (6.0%) |
| $2,500 to $4,999 | 431 (3.7%) | 320 (4.0%) |
| $5,000 to $7,499 | 667 (5.7%) | 466 (5.8%) |
| $7,500 to $9,999 | 249 (2.1%) | 172 (2.2%) |
| $10,000 to $12,499 | 333 (2.8%) | 342 (4.3%) |
| $12,500 to $14,999 | 454 (3.9%) | 491 (6.1%) |
| $15,000 to $17,499 | 472 (4.0%) | 239 (3.0%) |
| $17,500 to $19,999 | 155 (1.3%) | 320 (4.0%) |
| $20,000 to $22,499 | 264 (2.2%) | 212 (2.7%) |
| $22,500 to $24,999 | 387 (3.3%) | 513 (6.4%) |
| $25,000 to $29,999 | 823 (7.0%) | 645 (8.1%) |
| $30,000 to $34,999 | 559 (4.8%) | 720 (9.0%) |
| $35,000 to $39,999 | 407 (3.5%) | 451 (5.7%) |
| $40,000 to $44,999 | 391 (3.3%) | 371 (4.6%) |
| $45,000 to $49,999 | 526 (4.5%) | 356 (4.5%) |
| $50,000 to $54,999 | 464 (4.0%) | 388 (4.9%) |
| $55,000 to $64,999 | 688 (5.9%) | 474 (5.9%) |
| $65,000 to $74,999 | 580 (5.0%) | 310 (3.9%) |
| $75,000 to $99,999 | 1,553 (13.2%) | 361 (4.5%) |
| $100,000+ | 1,591 (13.6%) | 348 (4.4%) |
| Total | 11,729 (100.0%) | 7,979 (100.0%) |
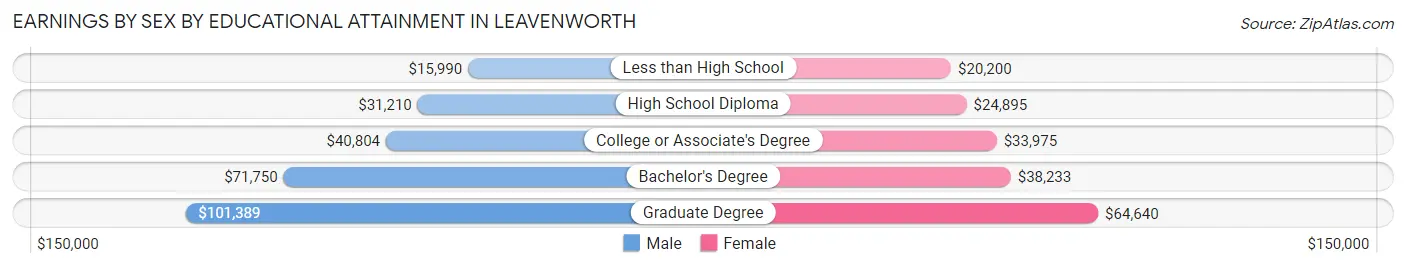
Earnings by Sex by Educational Attainment in Leavenworth
Average earnings in Leavenworth are $47,873 for men and $32,935 for women, a difference of 31.2%. Men with an educational attainment of graduate degree enjoy the highest average annual earnings of $101,389, while those with less than high school education earn the least with $15,990. Women with an educational attainment of graduate degree earn the most with the average annual earnings of $64,640, while those with less than high school education have the smallest earnings of $20,200.
| Educational Attainment | Male Income | Female Income |
| Less than High School | $15,990 | $20,200 |
| High School Diploma | $31,210 | $24,895 |
| College or Associate's Degree | $40,804 | $33,975 |
| Bachelor's Degree | $71,750 | $38,233 |
| Graduate Degree | $101,389 | $64,640 |
| Total | $47,873 | $32,935 |
Family Income in Leavenworth
Family Income Brackets in Leavenworth
According to the Leavenworth family income data, there are 1,878 families falling into the $100,000 to $149,999 income range, which is the most common income bracket and makes up 22.9% of all families. Conversely, the $10,000 to $14,999 income bracket is the least frequent group with only 66 families (0.8%) belonging to this category.
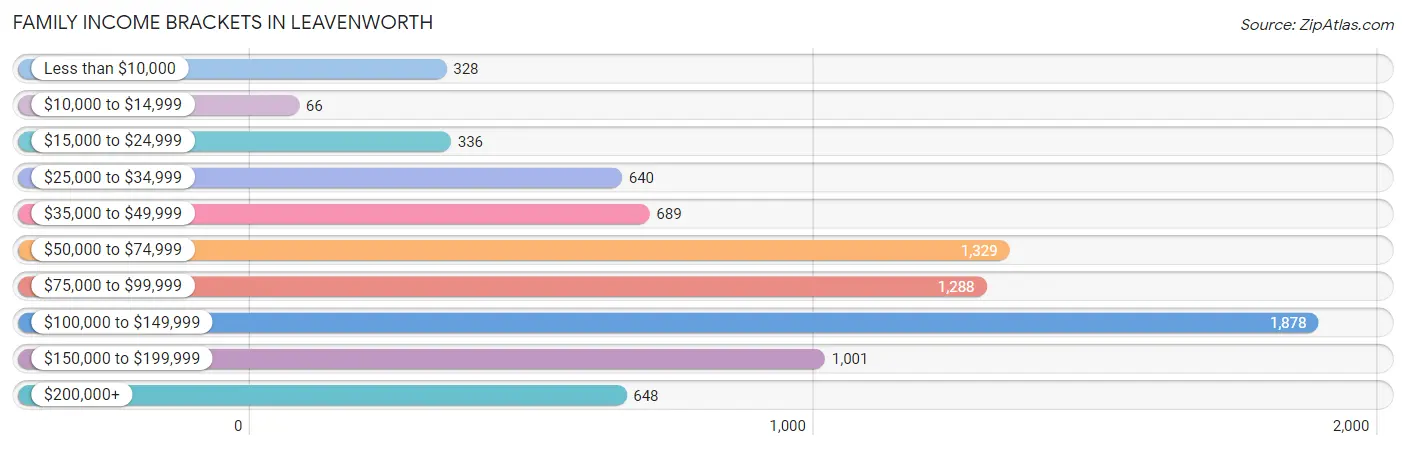
| Income Bracket | # Families | % Families |
| Less than $10,000 | 328 | 4.0% |
| $10,000 to $14,999 | 66 | 0.8% |
| $15,000 to $24,999 | 336 | 4.1% |
| $25,000 to $34,999 | 640 | 7.8% |
| $35,000 to $49,999 | 689 | 8.4% |
| $50,000 to $74,999 | 1,329 | 16.2% |
| $75,000 to $99,999 | 1,288 | 15.7% |
| $100,000 to $149,999 | 1,878 | 22.9% |
| $150,000 to $199,999 | 1,001 | 12.2% |
| $200,000+ | 648 | 7.9% |
Family Income by Famaliy Size in Leavenworth
7+ person families (184 | 2.2%) account for the highest median family income in Leavenworth with $130,799 per family, while 2-person families (4,055 | 49.4%) have the highest median income of $43,362 per family member.
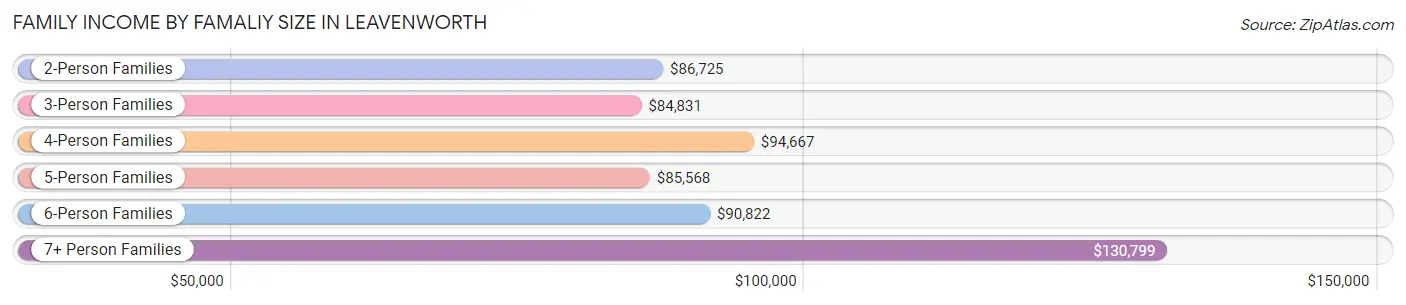
| Income Bracket | # Families | Median Income |
| 2-Person Families | 4,055 (49.4%) | $86,725 |
| 3-Person Families | 1,570 (19.1%) | $84,831 |
| 4-Person Families | 1,313 (16.0%) | $94,667 |
| 5-Person Families | 661 (8.1%) | $85,568 |
| 6-Person Families | 418 (5.1%) | $90,822 |
| 7+ Person Families | 184 (2.2%) | $130,799 |
| Total | 8,201 (100.0%) | $92,229 |
Family Income by Number of Earners in Leavenworth
The median family income in Leavenworth is $92,229, with families comprising 2 earners (3,368) having the highest median family income of $113,283, while families with no earners (1,016) have the lowest median family income of $46,786, accounting for 41.1% and 12.4% of families, respectively.
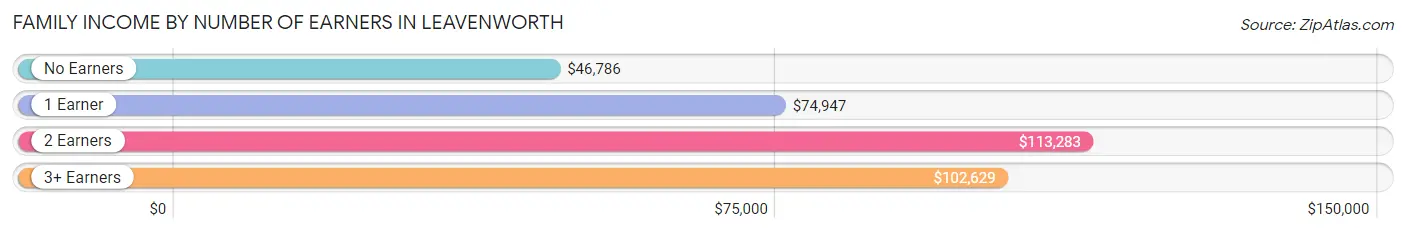
| Number of Earners | # Families | Median Income |
| No Earners | 1,016 (12.4%) | $46,786 |
| 1 Earner | 3,138 (38.3%) | $74,947 |
| 2 Earners | 3,368 (41.1%) | $113,283 |
| 3+ Earners | 679 (8.3%) | $102,629 |
| Total | 8,201 (100.0%) | $92,229 |
Household Income in Leavenworth
Household Income Brackets in Leavenworth
With 2,471 households falling in the category, the $50,000 to $74,999 income range is the most frequent in Leavenworth, accounting for 18.6% of all households. In contrast, only 478 households (3.6%) fall into the $10,000 to $14,999 income bracket, making it the least populous group.
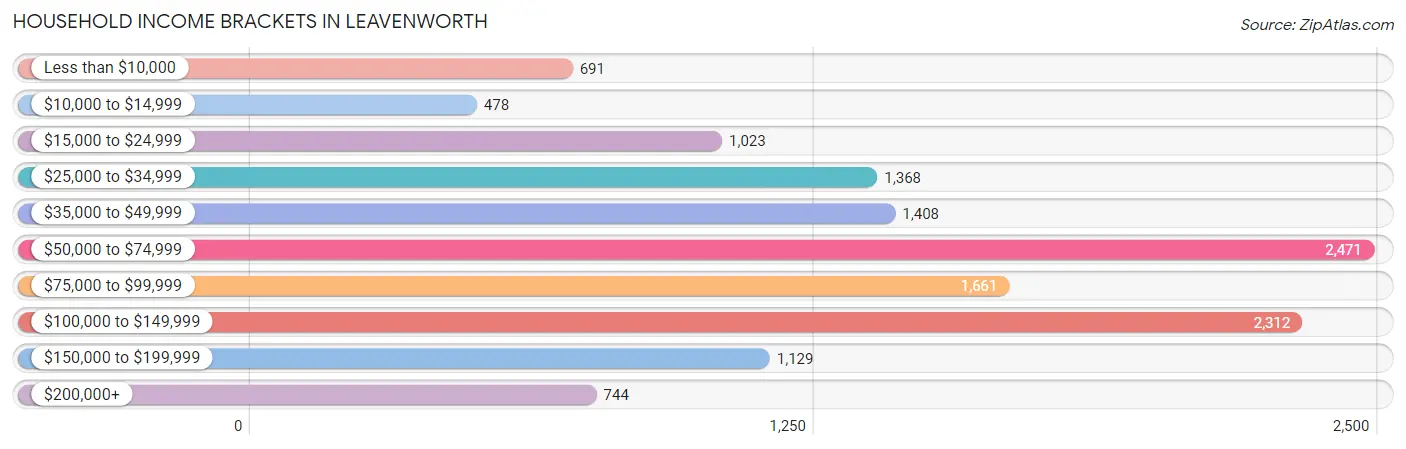
| Income Bracket | # Households | % Households |
| Less than $10,000 | 691 | 5.2% |
| $10,000 to $14,999 | 478 | 3.6% |
| $15,000 to $24,999 | 1,023 | 7.7% |
| $25,000 to $34,999 | 1,368 | 10.3% |
| $35,000 to $49,999 | 1,408 | 10.6% |
| $50,000 to $74,999 | 2,471 | 18.6% |
| $75,000 to $99,999 | 1,661 | 12.5% |
| $100,000 to $149,999 | 2,312 | 17.4% |
| $150,000 to $199,999 | 1,129 | 8.5% |
| $200,000+ | 744 | 5.6% |
Household Income by Householder Age in Leavenworth
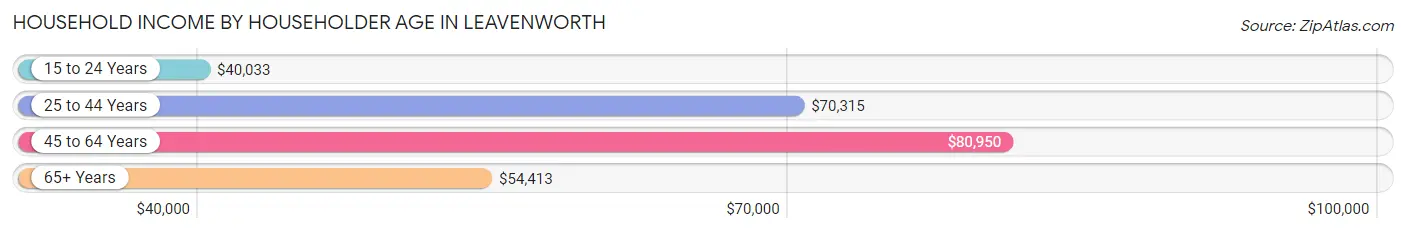
The median household income in Leavenworth is $67,360, with the highest median household income of $80,950 found in the 45 to 64 years age bracket for the primary householder. A total of 4,443 households (33.4%) fall into this category. Meanwhile, the 15 to 24 years age bracket for the primary householder has the lowest median household income of $40,033, with 1,010 households (7.6%) in this group.
| Income Bracket | # Households | Median Income |
| 15 to 24 Years | 1,010 (7.6%) | $40,033 |
| 25 to 44 Years | 4,859 (36.6%) | $70,315 |
| 45 to 64 Years | 4,443 (33.4%) | $80,950 |
| 65+ Years | 2,973 (22.4%) | $54,413 |
| Total | 13,285 (100.0%) | $67,360 |
Poverty in Leavenworth
Income Below Poverty by Sex and Age in Leavenworth
With 14.6% poverty level for males and 14.6% for females among the residents of Leavenworth, 18 to 24 year old males and under 5 year old females are the most vulnerable to poverty, with 488 males (29.2%) and 388 females (28.9%) in their respective age groups living below the poverty level.
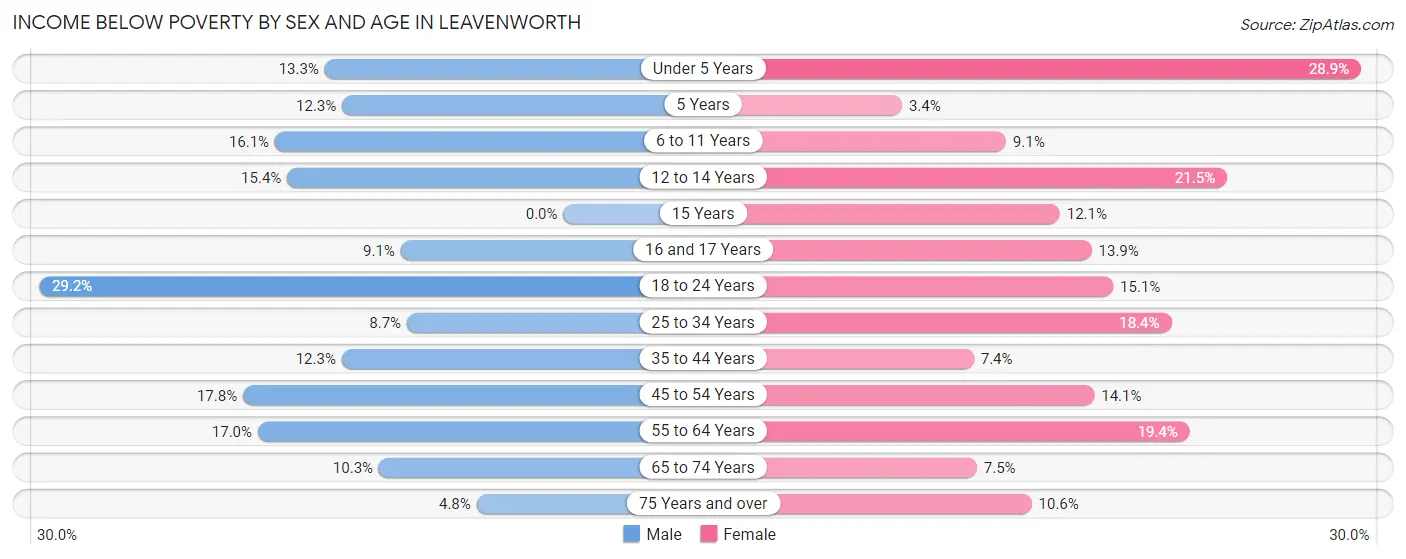
| Age Bracket | Male | Female |
| Under 5 Years | 192 (13.3%) | 388 (28.9%) |
| 5 Years | 26 (12.3%) | 8 (3.4%) |
| 6 to 11 Years | 289 (16.1%) | 121 (9.1%) |
| 12 to 14 Years | 74 (15.4%) | 127 (21.4%) |
| 15 Years | 0 (0.0%) | 34 (12.1%) |
| 16 and 17 Years | 30 (9.1%) | 47 (13.9%) |
| 18 to 24 Years | 488 (29.2%) | 238 (15.1%) |
| 25 to 34 Years | 204 (8.7%) | 374 (18.3%) |
| 35 to 44 Years | 298 (12.3%) | 164 (7.3%) |
| 45 to 54 Years | 343 (17.8%) | 226 (14.1%) |
| 55 to 64 Years | 368 (17.0%) | 433 (19.4%) |
| 65 to 74 Years | 149 (10.3%) | 100 (7.5%) |
| 75 Years and over | 35 (4.8%) | 143 (10.6%) |
| Total | 2,496 (14.6%) | 2,403 (14.6%) |
Income Above Poverty by Sex and Age in Leavenworth
According to the poverty statistics in Leavenworth, males aged 15 years and females aged 5 years are the age groups that are most secure financially, with 100.0% of males and 96.7% of females in these age groups living above the poverty line.
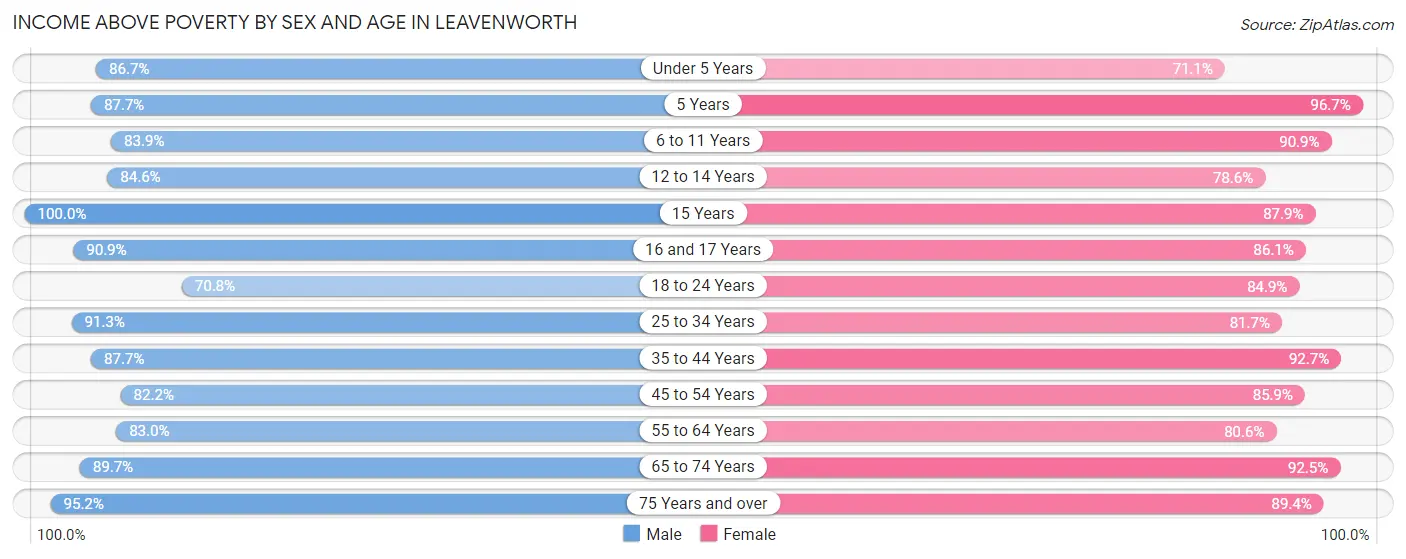
| Age Bracket | Male | Female |
| Under 5 Years | 1,253 (86.7%) | 954 (71.1%) |
| 5 Years | 185 (87.7%) | 231 (96.7%) |
| 6 to 11 Years | 1,510 (83.9%) | 1,203 (90.9%) |
| 12 to 14 Years | 407 (84.6%) | 465 (78.5%) |
| 15 Years | 99 (100.0%) | 246 (87.9%) |
| 16 and 17 Years | 301 (90.9%) | 291 (86.1%) |
| 18 to 24 Years | 1,183 (70.8%) | 1,337 (84.9%) |
| 25 to 34 Years | 2,138 (91.3%) | 1,664 (81.7%) |
| 35 to 44 Years | 2,117 (87.7%) | 2,068 (92.6%) |
| 45 to 54 Years | 1,580 (82.2%) | 1,381 (85.9%) |
| 55 to 64 Years | 1,796 (83.0%) | 1,802 (80.6%) |
| 65 to 74 Years | 1,302 (89.7%) | 1,229 (92.5%) |
| 75 Years and over | 689 (95.2%) | 1,210 (89.4%) |
| Total | 14,560 (85.4%) | 14,081 (85.4%) |
Income Below Poverty Among Married-Couple Families in Leavenworth
The poverty statistics for married-couple families in Leavenworth show that 5.4% or 353 of the total 6,568 families live below the poverty line. Families with 3 or 4 children have the highest poverty rate of 10.5%, comprising of 78 families. On the other hand, families with 5 or more children have the lowest poverty rate of 0.0%, which includes 0 families.
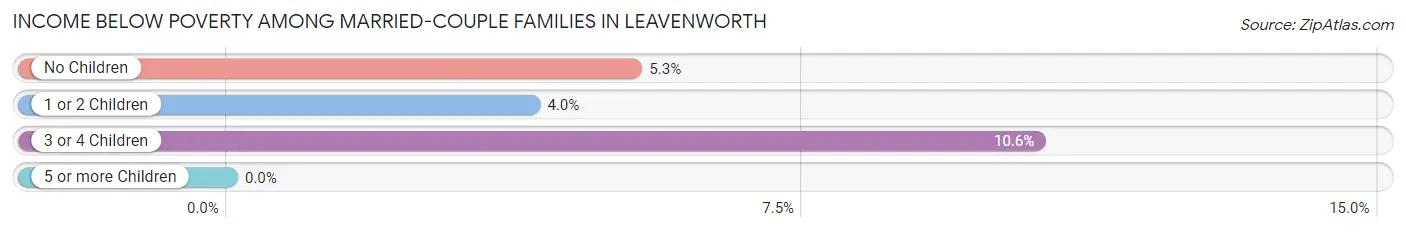
| Children | Above Poverty | Below Poverty |
| No Children | 3,371 (94.7%) | 188 (5.3%) |
| 1 or 2 Children | 2,118 (96.1%) | 87 (4.0%) |
| 3 or 4 Children | 661 (89.4%) | 78 (10.5%) |
| 5 or more Children | 65 (100.0%) | 0 (0.0%) |
| Total | 6,215 (94.6%) | 353 (5.4%) |
Income Below Poverty Among Single-Parent Households in Leavenworth
According to the poverty data in Leavenworth, 19.1% or 96 single-father households and 29.6% or 334 single-mother households are living below the poverty line. Among single-father households, those with 1 or 2 children have the highest poverty rate, with 65 households (39.4%) experiencing poverty. Likewise, among single-mother households, those with 5 or more children have the highest poverty rate, with 7 households (100.0%) falling below the poverty line.
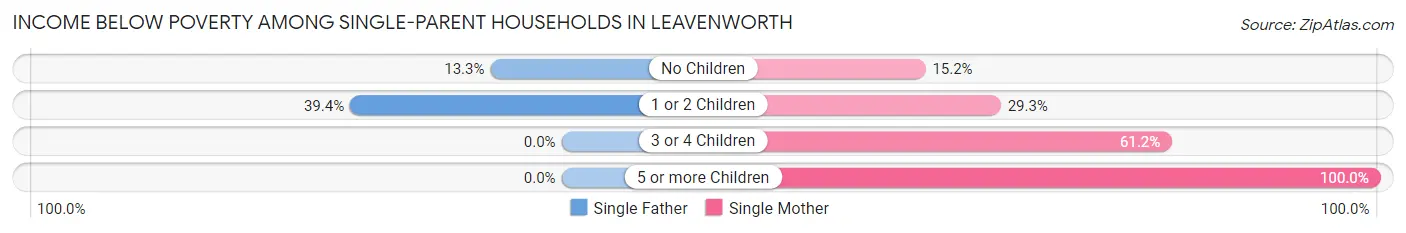
| Children | Single Father | Single Mother |
| No Children | 31 (13.3%) | 37 (15.2%) |
| 1 or 2 Children | 65 (39.4%) | 227 (29.2%) |
| 3 or 4 Children | 0 (0.0%) | 63 (61.2%) |
| 5 or more Children | 0 (0.0%) | 7 (100.0%) |
| Total | 96 (19.1%) | 334 (29.6%) |
Income Below Poverty Among Married-Couple vs Single-Parent Households in Leavenworth
The poverty data for Leavenworth shows that 353 of the married-couple family households (5.4%) and 430 of the single-parent households (26.3%) are living below the poverty level. Within the married-couple family households, those with 3 or 4 children have the highest poverty rate, with 78 households (10.5%) falling below the poverty line. Among the single-parent households, those with 3 or 4 children have the highest poverty rate, with 63 household (50.8%) living below poverty.
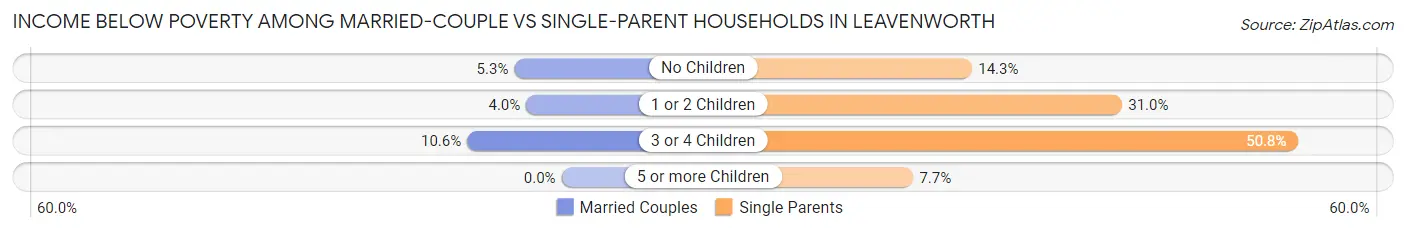
| Children | Married-Couple Families | Single-Parent Households |
| No Children | 188 (5.3%) | 68 (14.3%) |
| 1 or 2 Children | 87 (4.0%) | 292 (31.0%) |
| 3 or 4 Children | 78 (10.5%) | 63 (50.8%) |
| 5 or more Children | 0 (0.0%) | 7 (7.7%) |
| Total | 353 (5.4%) | 430 (26.3%) |
Race in Leavenworth
The most populous races in Leavenworth are White / Caucasian (28,016 | 75.3%), Black / African American (4,176 | 11.2%), and Two or more Races (3,271 | 8.8%).
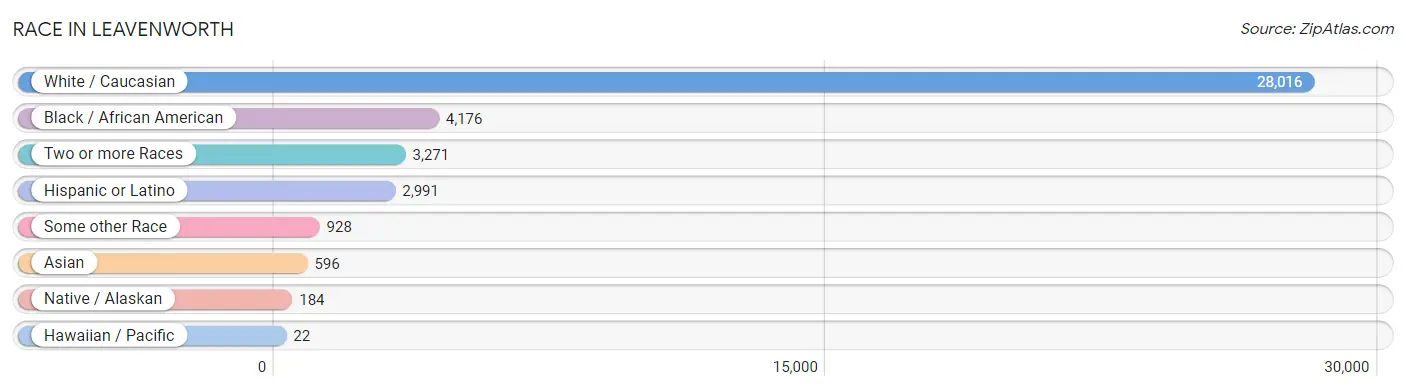
| Race | # Population | % Population |
| Asian | 596 | 1.6% |
| Black / African American | 4,176 | 11.2% |
| Hawaiian / Pacific | 22 | 0.1% |
| Hispanic or Latino | 2,991 | 8.0% |
| Native / Alaskan | 184 | 0.5% |
| White / Caucasian | 28,016 | 75.3% |
| Two or more Races | 3,271 | 8.8% |
| Some other Race | 928 | 2.5% |
| Total | 37,193 | 100.0% |
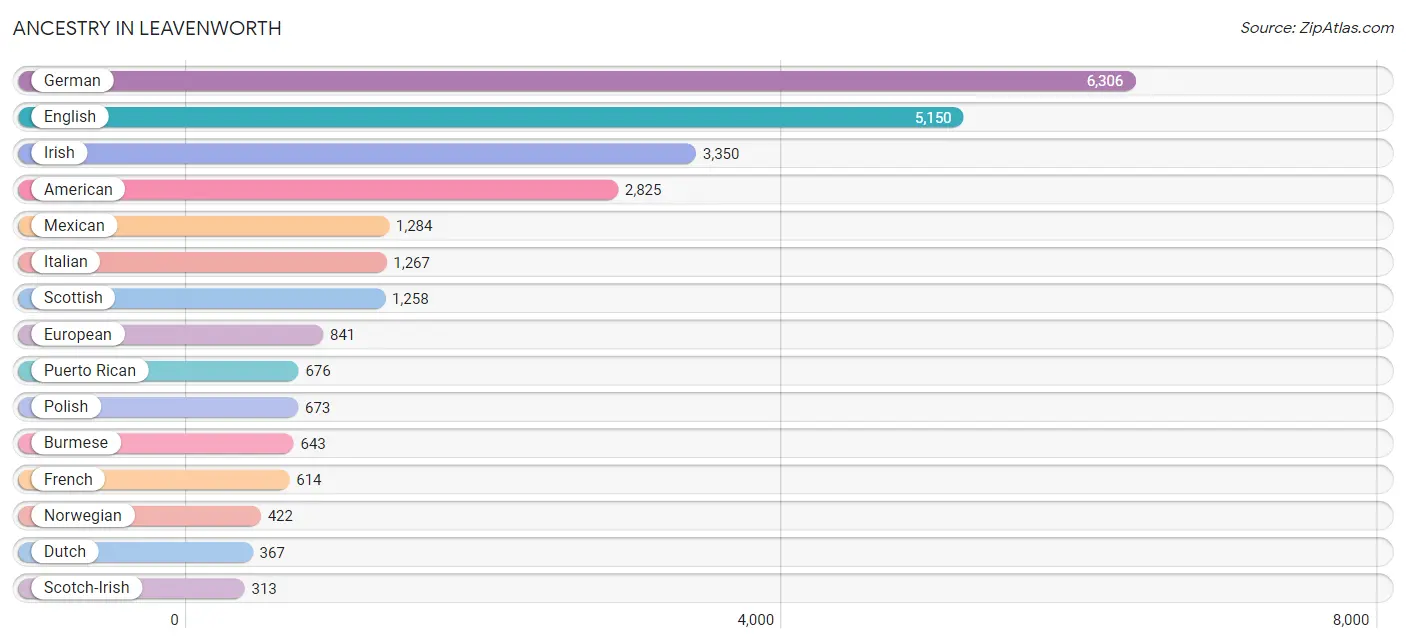
Ancestry in Leavenworth
The most populous ancestries reported in Leavenworth are German (6,306 | 17.0%), English (5,150 | 13.9%), Irish (3,350 | 9.0%), American (2,825 | 7.6%), and Mexican (1,284 | 3.5%), together accounting for 50.9% of all Leavenworth residents.
| Ancestry | # Population | % Population |
| African | 90 | 0.2% |
| American | 2,825 | 7.6% |
| Apache | 113 | 0.3% |
| Arab | 82 | 0.2% |
| Arapaho | 10 | 0.0% |
| Argentinean | 30 | 0.1% |
| Armenian | 4 | 0.0% |
| Australian | 25 | 0.1% |
| Austrian | 6 | 0.0% |
| Belgian | 16 | 0.0% |
| Bhutanese | 237 | 0.6% |
| Blackfeet | 193 | 0.5% |
| Brazilian | 76 | 0.2% |
| British | 159 | 0.4% |
| Bulgarian | 95 | 0.3% |
| Burmese | 643 | 1.7% |
| Canadian | 54 | 0.2% |
| Central American | 83 | 0.2% |
| Central American Indian | 5 | 0.0% |
| Cherokee | 206 | 0.5% |
| Choctaw | 13 | 0.0% |
| Colombian | 8 | 0.0% |
| Cree | 6 | 0.0% |
| Creek | 22 | 0.1% |
| Croatian | 32 | 0.1% |
| Cuban | 45 | 0.1% |
| Czech | 100 | 0.3% |
| Czechoslovakian | 30 | 0.1% |
| Danish | 208 | 0.6% |
| Dominican | 106 | 0.3% |
| Dutch | 367 | 1.0% |
| Eastern European | 64 | 0.2% |
| Ecuadorian | 17 | 0.1% |
| English | 5,150 | 13.9% |
| European | 841 | 2.3% |
| Finnish | 49 | 0.1% |
| French | 614 | 1.7% |
| French American Indian | 30 | 0.1% |
| French Canadian | 124 | 0.3% |
| German | 6,306 | 17.0% |
| Greek | 125 | 0.3% |
| Guamanian / Chamorro | 38 | 0.1% |
| Haitian | 15 | 0.0% |
| Hopi | 4 | 0.0% |
| Hungarian | 172 | 0.5% |
| Indian (Asian) | 30 | 0.1% |
| Iranian | 8 | 0.0% |
| Irish | 3,350 | 9.0% |
| Italian | 1,267 | 3.4% |
| Jamaican | 127 | 0.3% |
| Jordanian | 40 | 0.1% |
| Korean | 80 | 0.2% |
| Lebanese | 19 | 0.1% |
| Lithuanian | 8 | 0.0% |
| Mexican | 1,284 | 3.5% |
| Moroccan | 23 | 0.1% |
| Native Hawaiian | 61 | 0.2% |
| New Zealander | 13 | 0.0% |
| Nigerian | 185 | 0.5% |
| Northern European | 224 | 0.6% |
| Norwegian | 422 | 1.1% |
| Ottawa | 6 | 0.0% |
| Pakistani | 51 | 0.1% |
| Pennsylvania German | 189 | 0.5% |
| Polish | 673 | 1.8% |
| Portuguese | 220 | 0.6% |
| Potawatomi | 91 | 0.2% |
| Puerto Rican | 676 | 1.8% |
| Romanian | 14 | 0.0% |
| Russian | 69 | 0.2% |
| Salvadoran | 83 | 0.2% |
| Samoan | 18 | 0.1% |
| Scandinavian | 142 | 0.4% |
| Scotch-Irish | 313 | 0.8% |
| Scottish | 1,258 | 3.4% |
| Seminole | 51 | 0.1% |
| Sioux | 24 | 0.1% |
| Slavic | 90 | 0.2% |
| Slovak | 27 | 0.1% |
| South American | 55 | 0.2% |
| Spaniard | 113 | 0.3% |
| Spanish | 234 | 0.6% |
| Sri Lankan | 55 | 0.2% |
| Subsaharan African | 288 | 0.8% |
| Swedish | 279 | 0.7% |
| Swiss | 64 | 0.2% |
| Thai | 22 | 0.1% |
| Ukrainian | 49 | 0.1% |
| Welsh | 119 | 0.3% |
| Yaqui | 11 | 0.0% | View All 90 Rows |
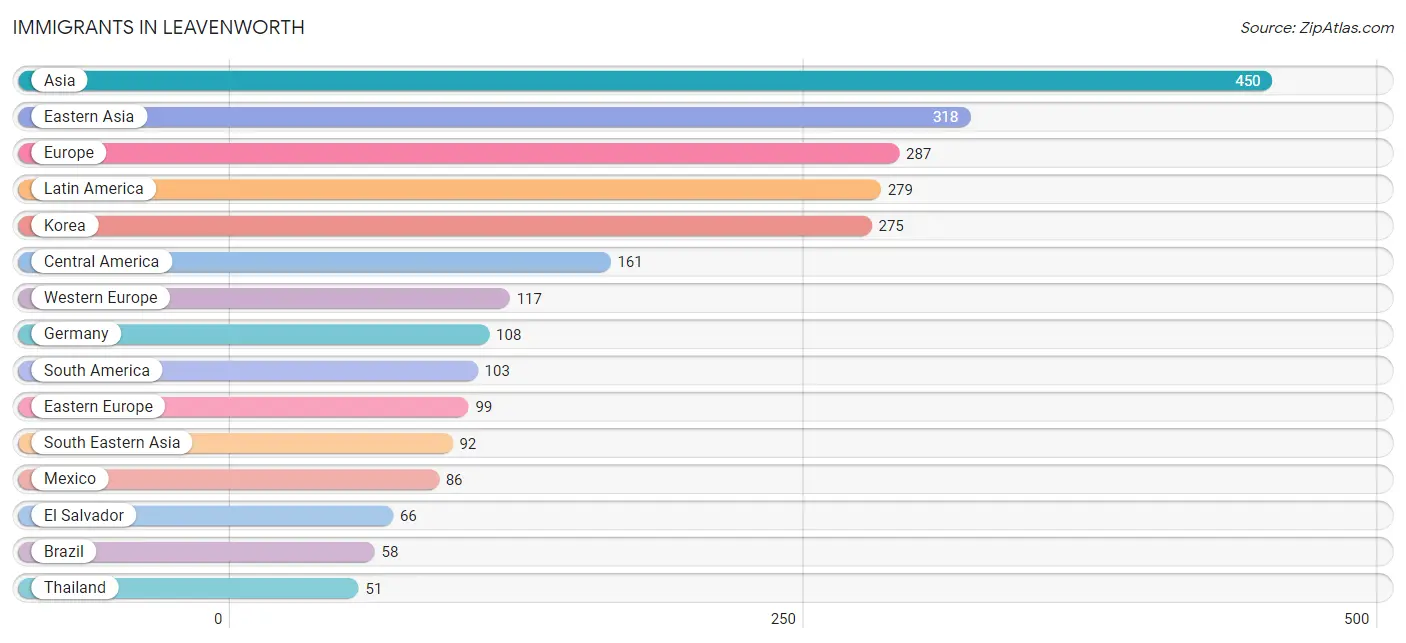
Immigrants in Leavenworth
The most numerous immigrant groups reported in Leavenworth came from Asia (450 | 1.2%), Eastern Asia (318 | 0.9%), Europe (287 | 0.8%), Latin America (279 | 0.7%), and Korea (275 | 0.7%), together accounting for 4.3% of all Leavenworth residents.
| Immigration Origin | # Population | % Population |
| Africa | 50 | 0.1% |
| Argentina | 18 | 0.1% |
| Asia | 450 | 1.2% |
| Australia | 9 | 0.0% |
| Brazil | 58 | 0.2% |
| Bulgaria | 38 | 0.1% |
| Canada | 26 | 0.1% |
| Caribbean | 15 | 0.0% |
| Central America | 161 | 0.4% |
| China | 16 | 0.0% |
| Colombia | 10 | 0.0% |
| Czechoslovakia | 16 | 0.0% |
| Eastern Africa | 13 | 0.0% |
| Eastern Asia | 318 | 0.9% |
| Eastern Europe | 99 | 0.3% |
| Ecuador | 17 | 0.1% |
| El Salvador | 66 | 0.2% |
| England | 26 | 0.1% |
| Europe | 287 | 0.8% |
| France | 9 | 0.0% |
| Germany | 108 | 0.3% |
| Haiti | 15 | 0.0% |
| Honduras | 9 | 0.0% |
| Ireland | 8 | 0.0% |
| Japan | 27 | 0.1% |
| Jordan | 40 | 0.1% |
| Kenya | 13 | 0.0% |
| Korea | 275 | 0.7% |
| Latin America | 279 | 0.7% |
| Mexico | 86 | 0.2% |
| Middle Africa | 6 | 0.0% |
| Moldova | 25 | 0.1% |
| Nigeria | 17 | 0.1% |
| Northern Europe | 48 | 0.1% |
| Oceania | 9 | 0.0% |
| Philippines | 10 | 0.0% |
| Portugal | 5 | 0.0% |
| Russia | 13 | 0.0% |
| Serbia | 7 | 0.0% |
| South America | 103 | 0.3% |
| South Eastern Asia | 92 | 0.3% |
| Southern Europe | 23 | 0.1% |
| Spain | 18 | 0.1% |
| Thailand | 51 | 0.1% |
| Vietnam | 31 | 0.1% |
| Western Africa | 17 | 0.1% |
| Western Asia | 40 | 0.1% |
| Western Europe | 117 | 0.3% | View All 48 Rows |
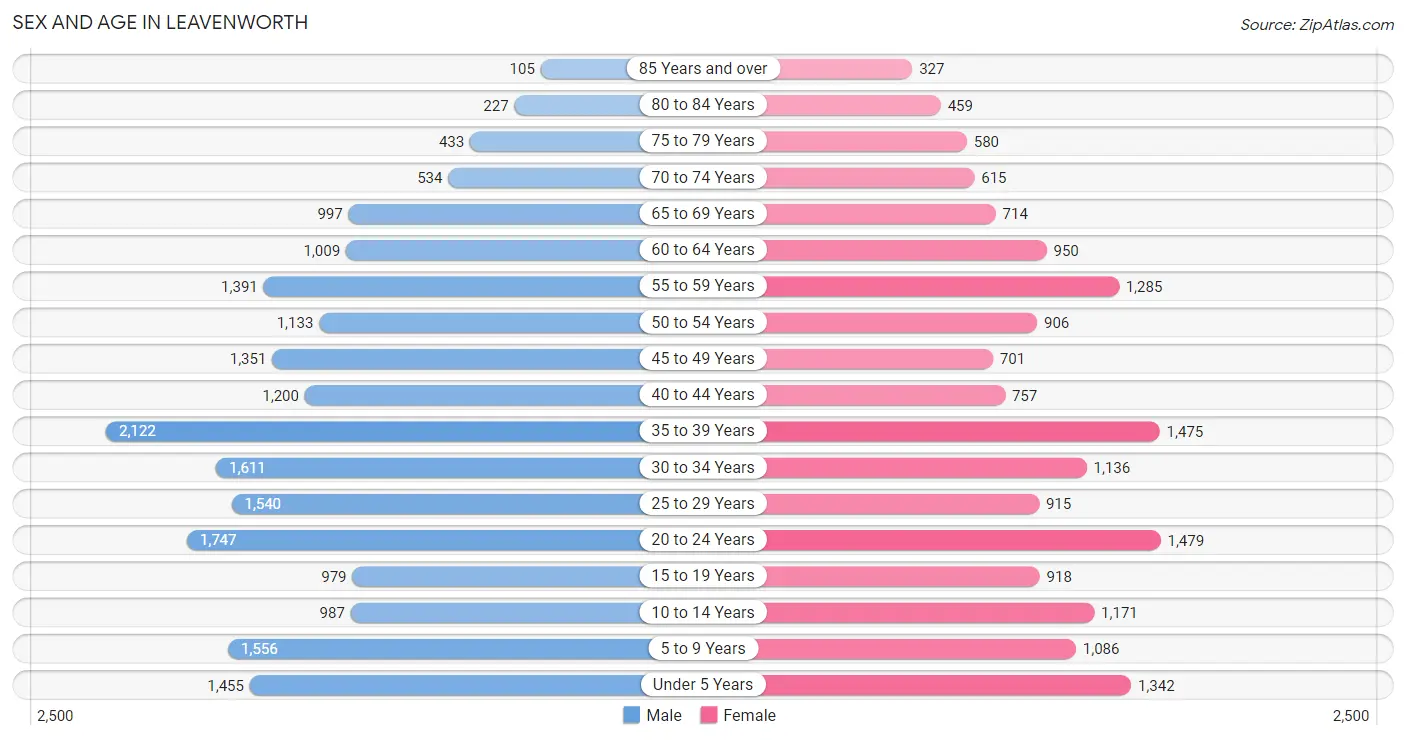
Sex and Age in Leavenworth
Sex and Age in Leavenworth
The most populous age groups in Leavenworth are 35 to 39 Years (2,122 | 10.4%) for men and 20 to 24 Years (1,479 | 8.8%) for women.
| Age Bracket | Male | Female |
| Under 5 Years | 1,455 (7.1%) | 1,342 (8.0%) |
| 5 to 9 Years | 1,556 (7.6%) | 1,086 (6.5%) |
| 10 to 14 Years | 987 (4.8%) | 1,171 (7.0%) |
| 15 to 19 Years | 979 (4.8%) | 918 (5.5%) |
| 20 to 24 Years | 1,747 (8.6%) | 1,479 (8.8%) |
| 25 to 29 Years | 1,540 (7.6%) | 915 (5.4%) |
| 30 to 34 Years | 1,611 (7.9%) | 1,136 (6.8%) |
| 35 to 39 Years | 2,122 (10.4%) | 1,475 (8.8%) |
| 40 to 44 Years | 1,200 (5.9%) | 757 (4.5%) |
| 45 to 49 Years | 1,351 (6.6%) | 701 (4.2%) |
| 50 to 54 Years | 1,133 (5.6%) | 906 (5.4%) |
| 55 to 59 Years | 1,391 (6.8%) | 1,285 (7.6%) |
| 60 to 64 Years | 1,009 (5.0%) | 950 (5.7%) |
| 65 to 69 Years | 997 (4.9%) | 714 (4.3%) |
| 70 to 74 Years | 534 (2.6%) | 615 (3.7%) |
| 75 to 79 Years | 433 (2.1%) | 580 (3.5%) |
| 80 to 84 Years | 227 (1.1%) | 459 (2.7%) |
| 85 Years and over | 105 (0.5%) | 327 (1.9%) |
| Total | 20,377 (100.0%) | 16,816 (100.0%) |
Families and Households in Leavenworth
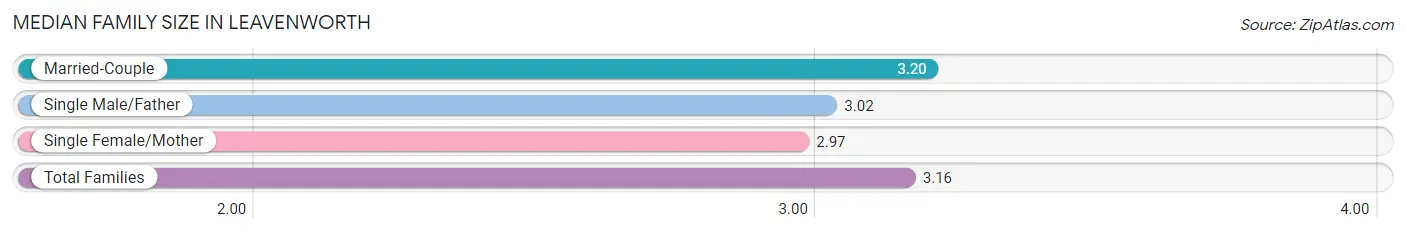
Median Family Size in Leavenworth
The median family size in Leavenworth is 3.16 persons per family, with married-couple families (6,568 | 80.1%) accounting for the largest median family size of 3.2 persons per family. On the other hand, single female/mother families (1,129 | 13.8%) represent the smallest median family size with 2.97 persons per family.
| Family Type | # Families | Family Size |
| Married-Couple | 6,568 (80.1%) | 3.20 |
| Single Male/Father | 504 (6.1%) | 3.02 |
| Single Female/Mother | 1,129 (13.8%) | 2.97 |
| Total Families | 8,201 (100.0%) | 3.16 |
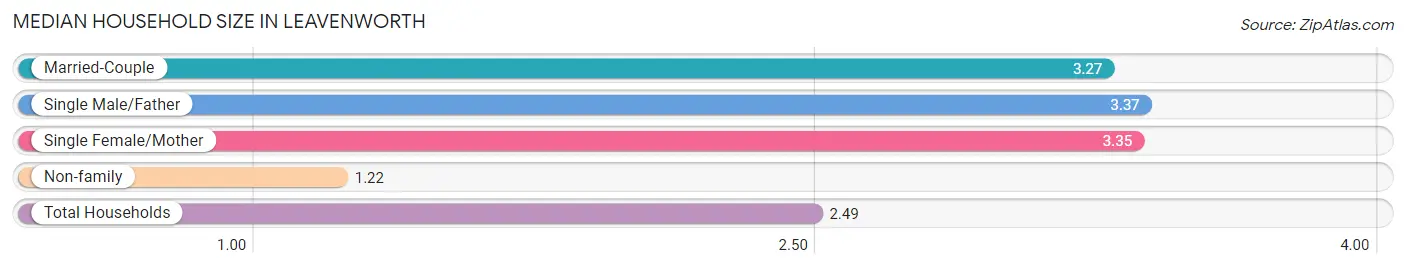
Median Household Size in Leavenworth
The median household size in Leavenworth is 2.49 persons per household, with single male/father households (504 | 3.8%) accounting for the largest median household size of 3.37 persons per household. non-family households (5,084 | 38.3%) represent the smallest median household size with 1.22 persons per household.
| Household Type | # Households | Household Size |
| Married-Couple | 6,568 (49.4%) | 3.27 |
| Single Male/Father | 504 (3.8%) | 3.37 |
| Single Female/Mother | 1,129 (8.5%) | 3.35 |
| Non-family | 5,084 (38.3%) | 1.22 |
| Total Households | 13,285 (100.0%) | 2.49 |
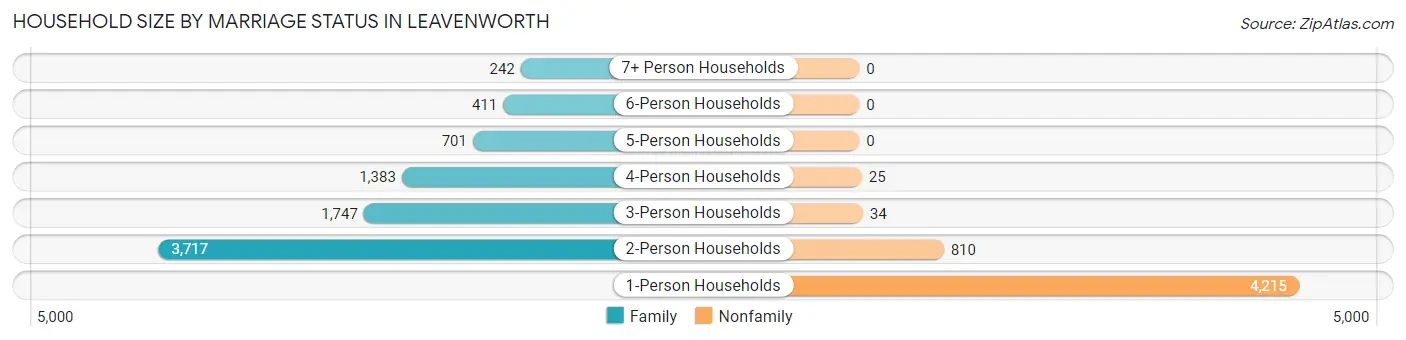
Household Size by Marriage Status in Leavenworth
Out of a total of 13,285 households in Leavenworth, 8,201 (61.7%) are family households, while 5,084 (38.3%) are nonfamily households. The most numerous type of family households are 2-person households, comprising 3,717, and the most common type of nonfamily households are 1-person households, comprising 4,215.
| Household Size | Family Households | Nonfamily Households |
| 1-Person Households | - | 4,215 (31.7%) |
| 2-Person Households | 3,717 (28.0%) | 810 (6.1%) |
| 3-Person Households | 1,747 (13.2%) | 34 (0.3%) |
| 4-Person Households | 1,383 (10.4%) | 25 (0.2%) |
| 5-Person Households | 701 (5.3%) | 0 (0.0%) |
| 6-Person Households | 411 (3.1%) | 0 (0.0%) |
| 7+ Person Households | 242 (1.8%) | 0 (0.0%) |
| Total | 8,201 (61.7%) | 5,084 (38.3%) |
Female Fertility in Leavenworth
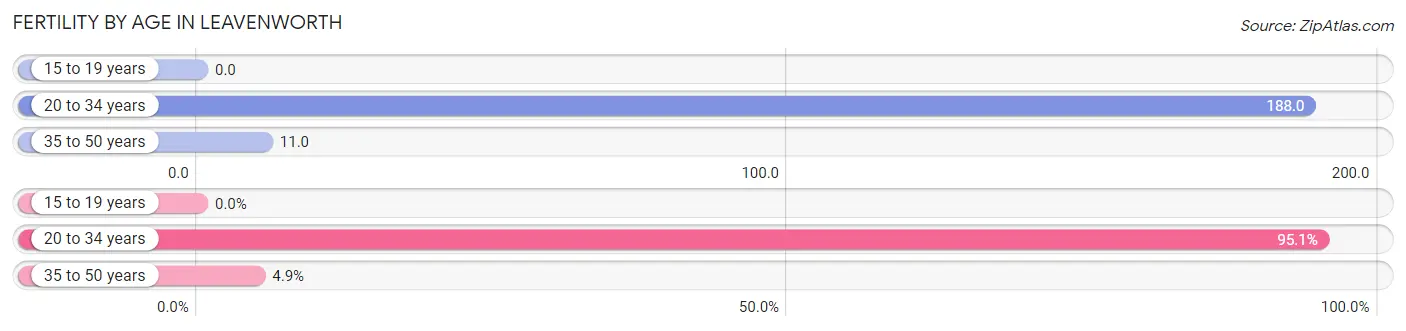
Fertility by Age in Leavenworth
Average fertility rate in Leavenworth is 93.0 births per 1,000 women. Women in the age bracket of 20 to 34 years have the highest fertility rate with 188.0 births per 1,000 women. Women in the age bracket of 20 to 34 years acount for 95.1% of all women with births.
| Age Bracket | Women with Births | Births / 1,000 Women |
| 15 to 19 years | 0 (0.0%) | 0.0 |
| 20 to 34 years | 665 (95.1%) | 188.0 |
| 35 to 50 years | 34 (4.9%) | 11.0 |
| Total | 699 (100.0%) | 93.0 |
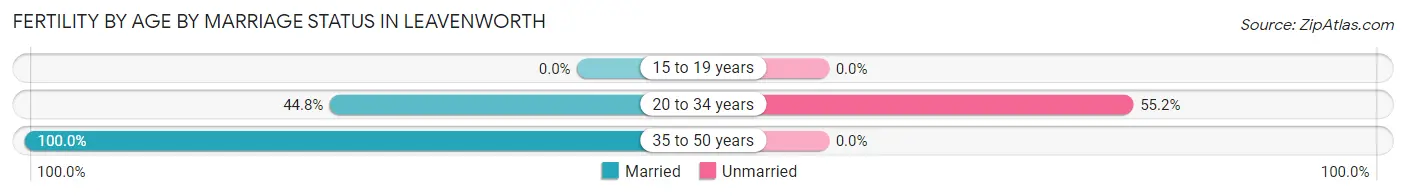
Fertility by Age by Marriage Status in Leavenworth
47.5% of women with births (699) in Leavenworth are married. The highest percentage of unmarried women with births falls into 20 to 34 years age bracket with 55.2% of them unmarried at the time of birth, while the lowest percentage of unmarried women with births belong to 35 to 50 years age bracket with 0.0% of them unmarried.
| Age Bracket | Married | Unmarried |
| 15 to 19 years | 0 (0.0%) | 0 (0.0%) |
| 20 to 34 years | 298 (44.8%) | 367 (55.2%) |
| 35 to 50 years | 34 (100.0%) | 0 (0.0%) |
| Total | 332 (47.5%) | 367 (52.5%) |
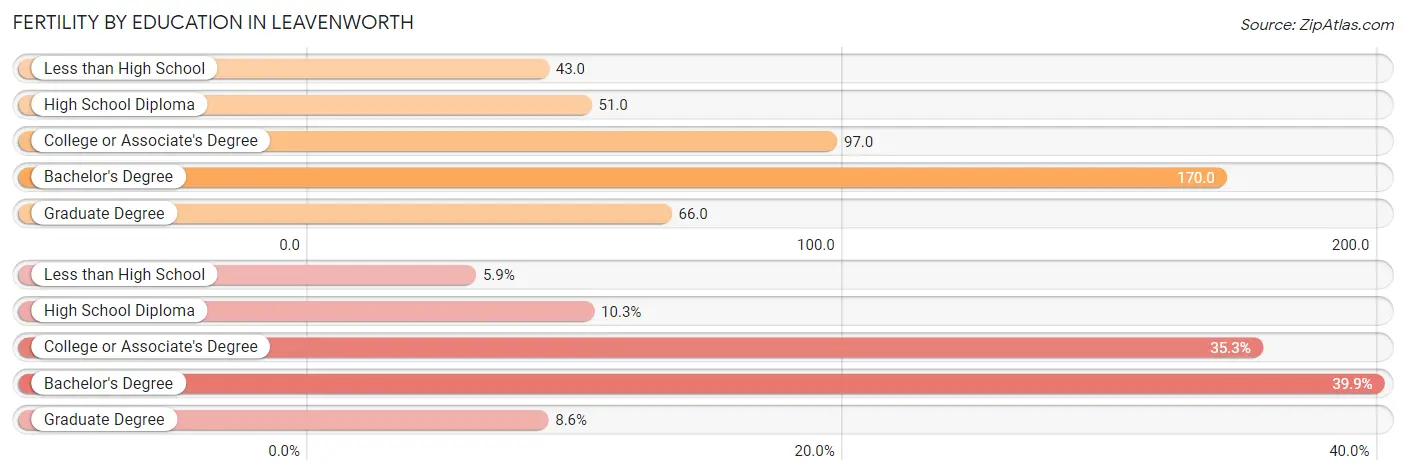
Fertility by Education in Leavenworth
Average fertility rate in Leavenworth is 93.0 births per 1,000 women. Women with the education attainment of bachelor's degree have the highest fertility rate of 170.0 births per 1,000 women, while women with the education attainment of less than high school have the lowest fertility at 43.0 births per 1,000 women. Women with the education attainment of bachelor's degree represent 39.9% of all women with births.
| Educational Attainment | Women with Births | Births / 1,000 Women |
| Less than High School | 41 (5.9%) | 43.0 |
| High School Diploma | 72 (10.3%) | 51.0 |
| College or Associate's Degree | 247 (35.3%) | 97.0 |
| Bachelor's Degree | 279 (39.9%) | 170.0 |
| Graduate Degree | 60 (8.6%) | 66.0 |
| Total | 699 (100.0%) | 93.0 |
Fertility by Education by Marriage Status in Leavenworth
52.5% of women with births in Leavenworth are unmarried. Women with the educational attainment of graduate degree are most likely to be married with 100.0% of them married at childbirth, while women with the educational attainment of high school diploma are least likely to be married with 83.3% of them unmarried at childbirth.
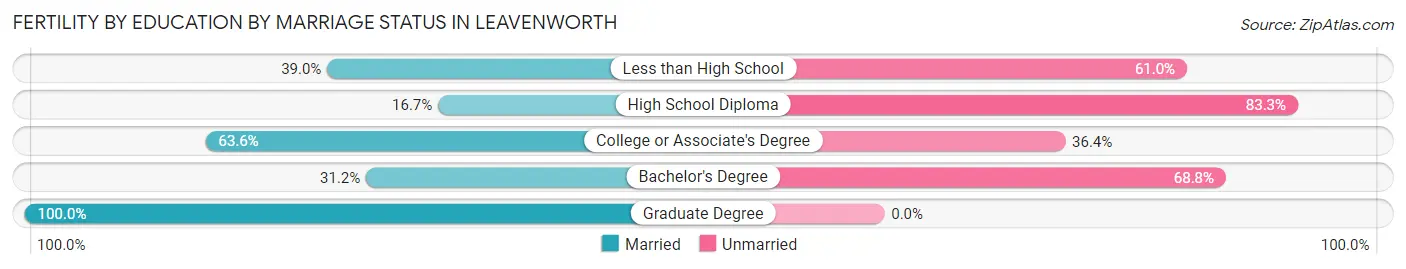
| Educational Attainment | Married | Unmarried |
| Less than High School | 16 (39.0%) | 25 (61.0%) |
| High School Diploma | 12 (16.7%) | 60 (83.3%) |
| College or Associate's Degree | 157 (63.6%) | 90 (36.4%) |
| Bachelor's Degree | 87 (31.2%) | 192 (68.8%) |
| Graduate Degree | 60 (100.0%) | 0 (0.0%) |
| Total | 332 (47.5%) | 367 (52.5%) |
Employment Characteristics in Leavenworth
Employment by Class of Employer in Leavenworth
Among the 15,753 employed individuals in Leavenworth, private company employees (7,521 | 47.7%), federal government employees (4,506 | 28.6%), and self-employed (not incorporated) (1,158 | 7.3%) make up the most common classes of employment.
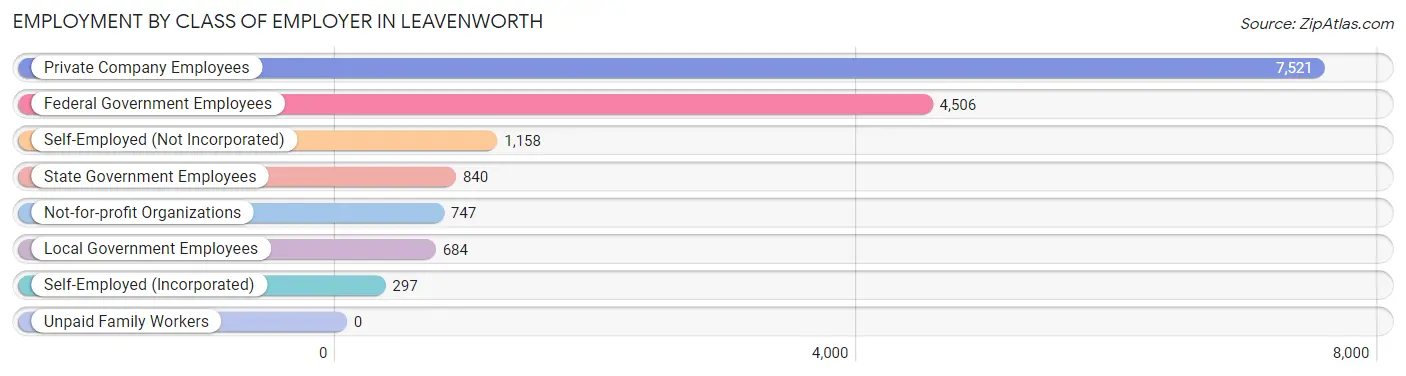
| Employer Class | # Employees | % Employees |
| Private Company Employees | 7,521 | 47.7% |
| Self-Employed (Incorporated) | 297 | 1.9% |
| Self-Employed (Not Incorporated) | 1,158 | 7.3% |
| Not-for-profit Organizations | 747 | 4.7% |
| Local Government Employees | 684 | 4.3% |
| State Government Employees | 840 | 5.3% |
| Federal Government Employees | 4,506 | 28.6% |
| Unpaid Family Workers | 0 | 0.0% |
| Total | 15,753 | 100.0% |
Employment Status by Age in Leavenworth
According to the labor force statistics for Leavenworth, out of the total population over 16 years of age (29,217), 56.5% or 16,508 individuals are in the labor force, with 4.6% or 759 of them unemployed. The age group with the highest labor force participation rate is 25 to 29 years, with 72.5% or 1,780 individuals in the labor force. Within the labor force, the 30 to 34 years age range has the highest percentage of unemployed individuals, with 12.8% or 230 of them being unemployed.
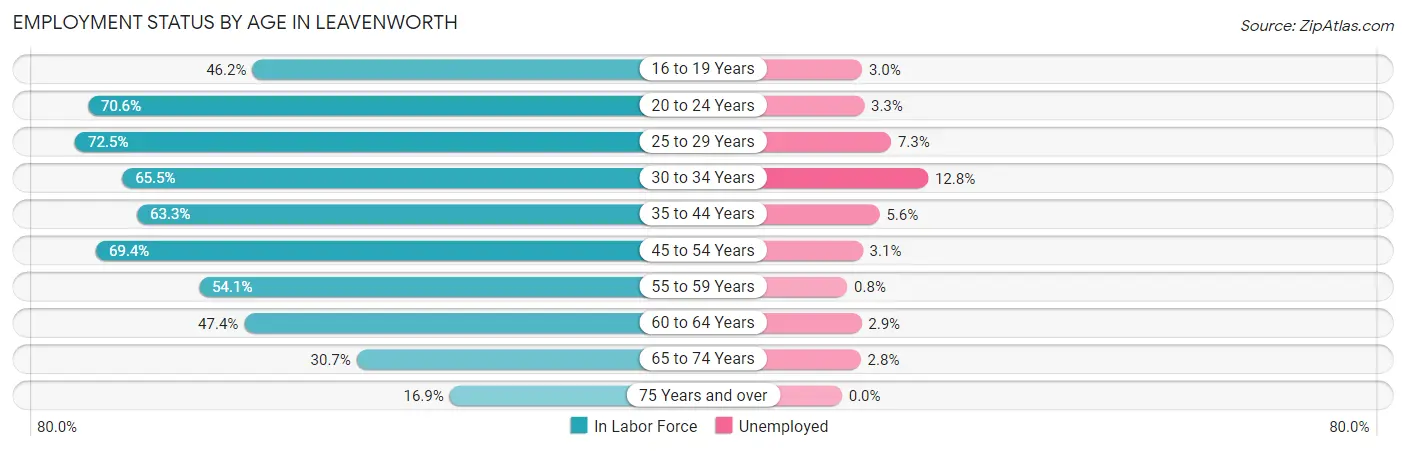
| Age Bracket | In Labor Force | Unemployed |
| 16 to 19 Years | 701 (46.2%) | 21 (3.0%) |
| 20 to 24 Years | 2,278 (70.6%) | 75 (3.3%) |
| 25 to 29 Years | 1,780 (72.5%) | 130 (7.3%) |
| 30 to 34 Years | 1,799 (65.5%) | 230 (12.8%) |
| 35 to 44 Years | 3,516 (63.3%) | 197 (5.6%) |
| 45 to 54 Years | 2,839 (69.4%) | 88 (3.1%) |
| 55 to 59 Years | 1,448 (54.1%) | 12 (0.8%) |
| 60 to 64 Years | 929 (47.4%) | 27 (2.9%) |
| 65 to 74 Years | 878 (30.7%) | 25 (2.8%) |
| 75 Years and over | 360 (16.9%) | 0 (0.0%) |
| Total | 16,508 (56.5%) | 759 (4.6%) |
Employment Status by Educational Attainment in Leavenworth
According to labor force statistics for Leavenworth, 63.2% of individuals (12,313) out of the total population between 25 and 64 years of age (19,482) are in the labor force, with 5.3% or 653 of them being unemployed. The group with the highest labor force participation rate are those with the educational attainment of bachelor's degree or higher, with 73.0% or 4,925 individuals in the labor force. Within the labor force, individuals with less than high school education have the highest percentage of unemployment, with 11.7% or 79 of them being unemployed.
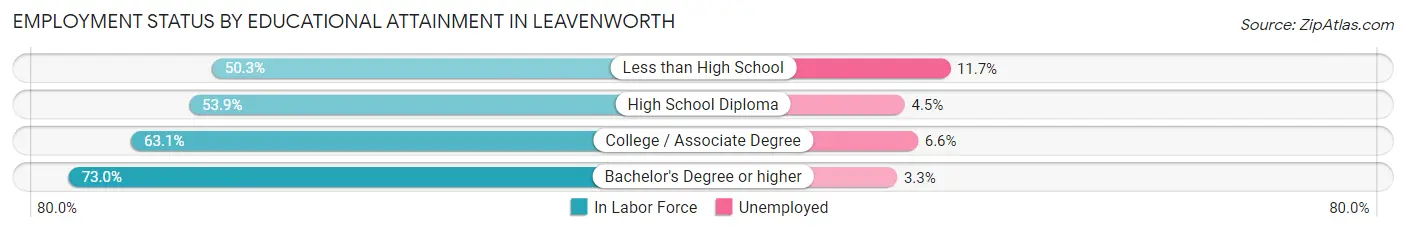
| Educational Attainment | In Labor Force | Unemployed |
| Less than High School | 675 (50.3%) | 157 (11.7%) |
| High School Diploma | 2,850 (53.9%) | 238 (4.5%) |
| College / Associate Degree | 3,853 (63.1%) | 403 (6.6%) |
| Bachelor's Degree or higher | 4,925 (73.0%) | 223 (3.3%) |
| Total | 12,313 (63.2%) | 1,033 (5.3%) |
Employment Occupations by Sex in Leavenworth
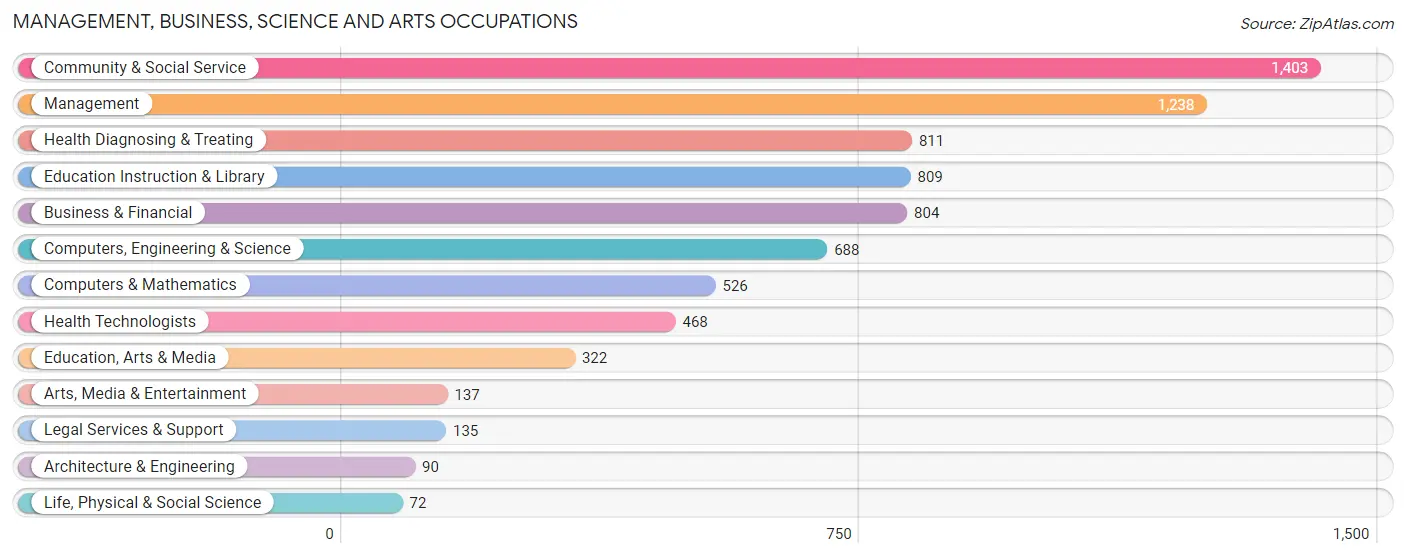
Management, Business, Science and Arts Occupations
The most common Management, Business, Science and Arts occupations in Leavenworth are Community & Social Service (1,403 | 10.4%), Management (1,238 | 9.1%), Health Diagnosing & Treating (811 | 6.0%), Education Instruction & Library (809 | 6.0%), and Business & Financial (804 | 5.9%).
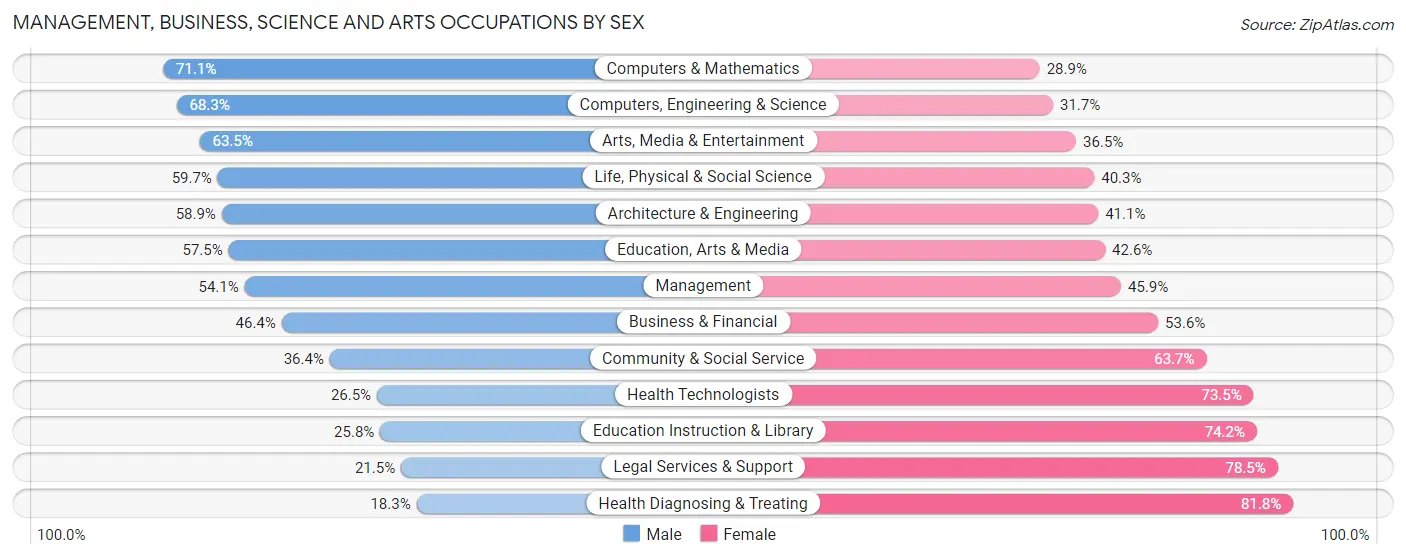
Management, Business, Science and Arts Occupations by Sex
Within the Management, Business, Science and Arts occupations in Leavenworth, the most male-oriented occupations are Computers & Mathematics (71.1%), Computers, Engineering & Science (68.3%), and Arts, Media & Entertainment (63.5%), while the most female-oriented occupations are Health Diagnosing & Treating (81.8%), Legal Services & Support (78.5%), and Education Instruction & Library (74.2%).
| Occupation | Male | Female |
| Management | 670 (54.1%) | 568 (45.9%) |
| Business & Financial | 373 (46.4%) | 431 (53.6%) |
| Computers, Engineering & Science | 470 (68.3%) | 218 (31.7%) |
| Computers & Mathematics | 374 (71.1%) | 152 (28.9%) |
| Architecture & Engineering | 53 (58.9%) | 37 (41.1%) |
| Life, Physical & Social Science | 43 (59.7%) | 29 (40.3%) |
| Community & Social Service | 510 (36.3%) | 893 (63.6%) |
| Education, Arts & Media | 185 (57.5%) | 137 (42.5%) |
| Legal Services & Support | 29 (21.5%) | 106 (78.5%) |
| Education Instruction & Library | 209 (25.8%) | 600 (74.2%) |
| Arts, Media & Entertainment | 87 (63.5%) | 50 (36.5%) |
| Health Diagnosing & Treating | 148 (18.2%) | 663 (81.8%) |
| Health Technologists | 124 (26.5%) | 344 (73.5%) |
| Total (Category) | 2,171 (43.9%) | 2,773 (56.1%) |
| Total (Overall) | 6,873 (50.8%) | 6,657 (49.2%) |
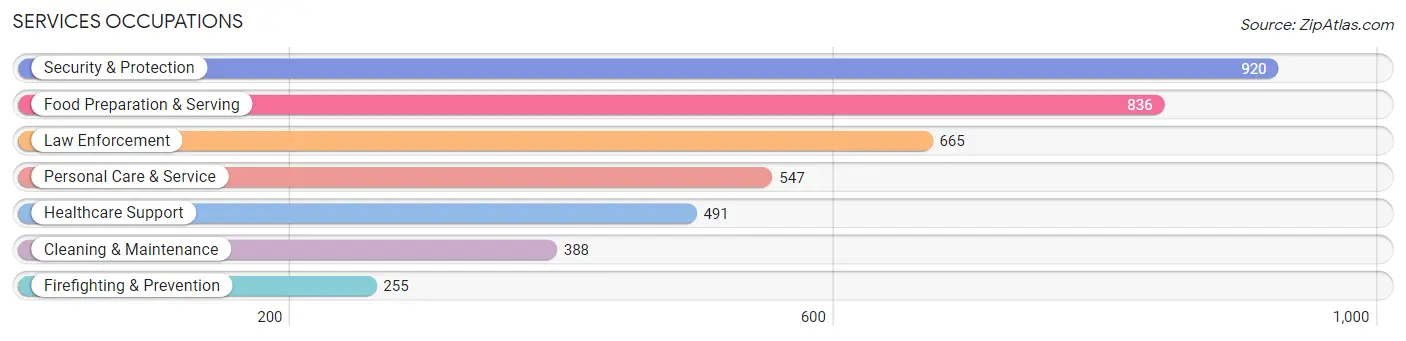
Services Occupations
The most common Services occupations in Leavenworth are Security & Protection (920 | 6.8%), Food Preparation & Serving (836 | 6.2%), Law Enforcement (665 | 4.9%), Personal Care & Service (547 | 4.0%), and Healthcare Support (491 | 3.6%).
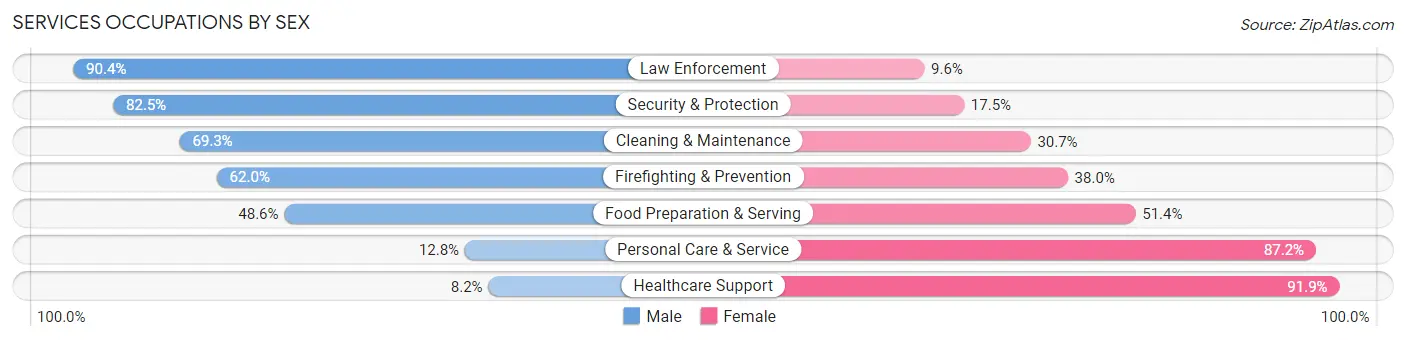
Services Occupations by Sex
Within the Services occupations in Leavenworth, the most male-oriented occupations are Law Enforcement (90.4%), Security & Protection (82.5%), and Cleaning & Maintenance (69.3%), while the most female-oriented occupations are Healthcare Support (91.8%), Personal Care & Service (87.2%), and Food Preparation & Serving (51.4%).
| Occupation | Male | Female |
| Healthcare Support | 40 (8.2%) | 451 (91.8%) |
| Security & Protection | 759 (82.5%) | 161 (17.5%) |
| Firefighting & Prevention | 158 (62.0%) | 97 (38.0%) |
| Law Enforcement | 601 (90.4%) | 64 (9.6%) |
| Food Preparation & Serving | 406 (48.6%) | 430 (51.4%) |
| Cleaning & Maintenance | 269 (69.3%) | 119 (30.7%) |
| Personal Care & Service | 70 (12.8%) | 477 (87.2%) |
| Total (Category) | 1,544 (48.5%) | 1,638 (51.5%) |
| Total (Overall) | 6,873 (50.8%) | 6,657 (49.2%) |
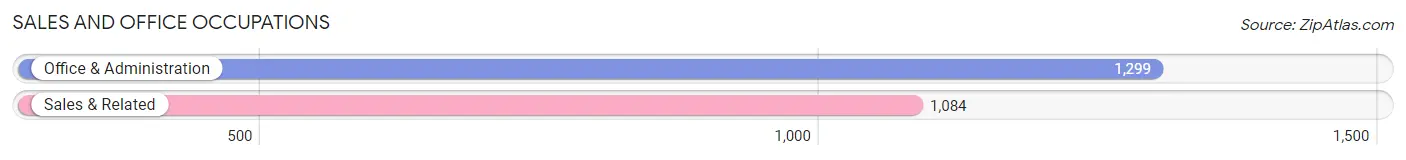
Sales and Office Occupations
The most common Sales and Office occupations in Leavenworth are Office & Administration (1,299 | 9.6%), and Sales & Related (1,084 | 8.0%).
Sales and Office Occupations by Sex
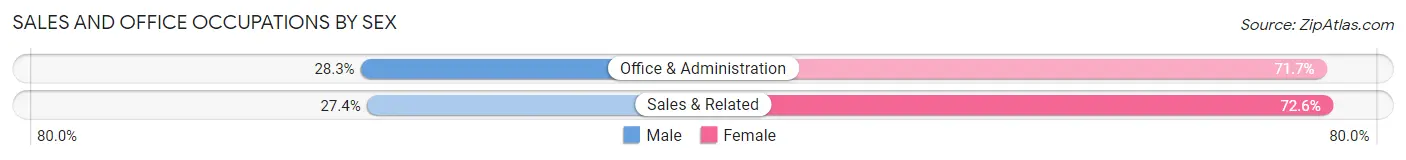
| Occupation | Male | Female |
| Sales & Related | 297 (27.4%) | 787 (72.6%) |
| Office & Administration | 368 (28.3%) | 931 (71.7%) |
| Total (Category) | 665 (27.9%) | 1,718 (72.1%) |
| Total (Overall) | 6,873 (50.8%) | 6,657 (49.2%) |
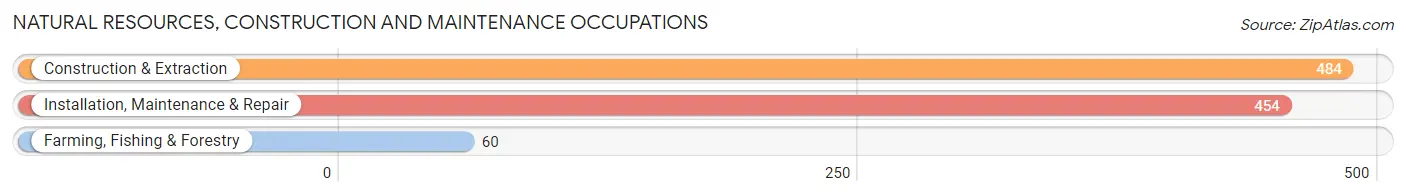
Natural Resources, Construction and Maintenance Occupations
The most common Natural Resources, Construction and Maintenance occupations in Leavenworth are Construction & Extraction (484 | 3.6%), Installation, Maintenance & Repair (454 | 3.4%), and Farming, Fishing & Forestry (60 | 0.4%).
Natural Resources, Construction and Maintenance Occupations by Sex
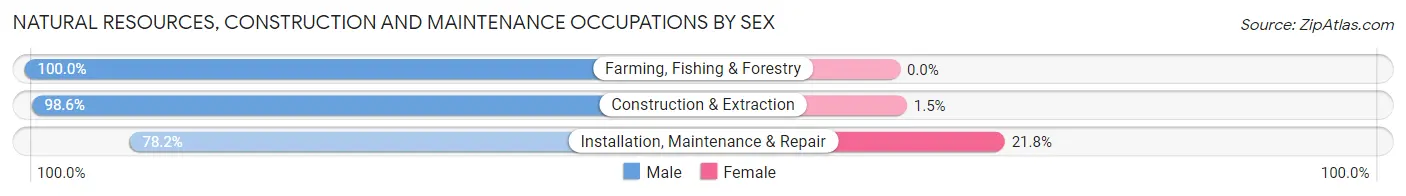
| Occupation | Male | Female |
| Farming, Fishing & Forestry | 60 (100.0%) | 0 (0.0%) |
| Construction & Extraction | 477 (98.6%) | 7 (1.5%) |
| Installation, Maintenance & Repair | 355 (78.2%) | 99 (21.8%) |
| Total (Category) | 892 (89.4%) | 106 (10.6%) |
| Total (Overall) | 6,873 (50.8%) | 6,657 (49.2%) |
Production, Transportation and Moving Occupations
The most common Production, Transportation and Moving occupations in Leavenworth are Material Moving (815 | 6.0%), Production (645 | 4.8%), and Transportation (563 | 4.2%).
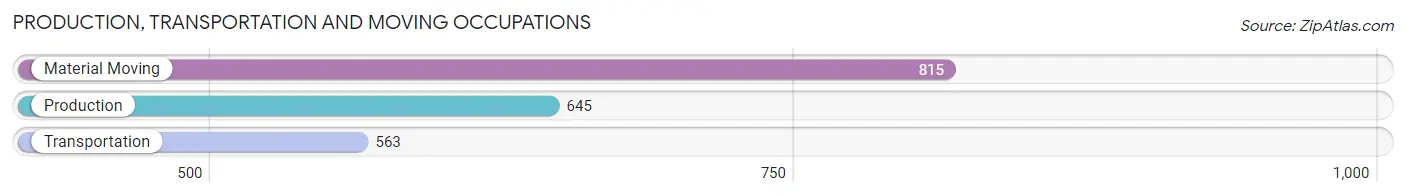
Production, Transportation and Moving Occupations by Sex
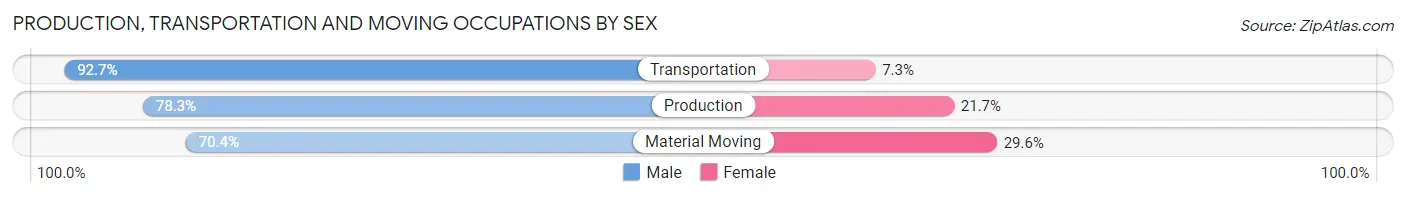
| Occupation | Male | Female |
| Production | 505 (78.3%) | 140 (21.7%) |
| Transportation | 522 (92.7%) | 41 (7.3%) |
| Material Moving | 574 (70.4%) | 241 (29.6%) |
| Total (Category) | 1,601 (79.1%) | 422 (20.9%) |
| Total (Overall) | 6,873 (50.8%) | 6,657 (49.2%) |
Employment Industries by Sex in Leavenworth
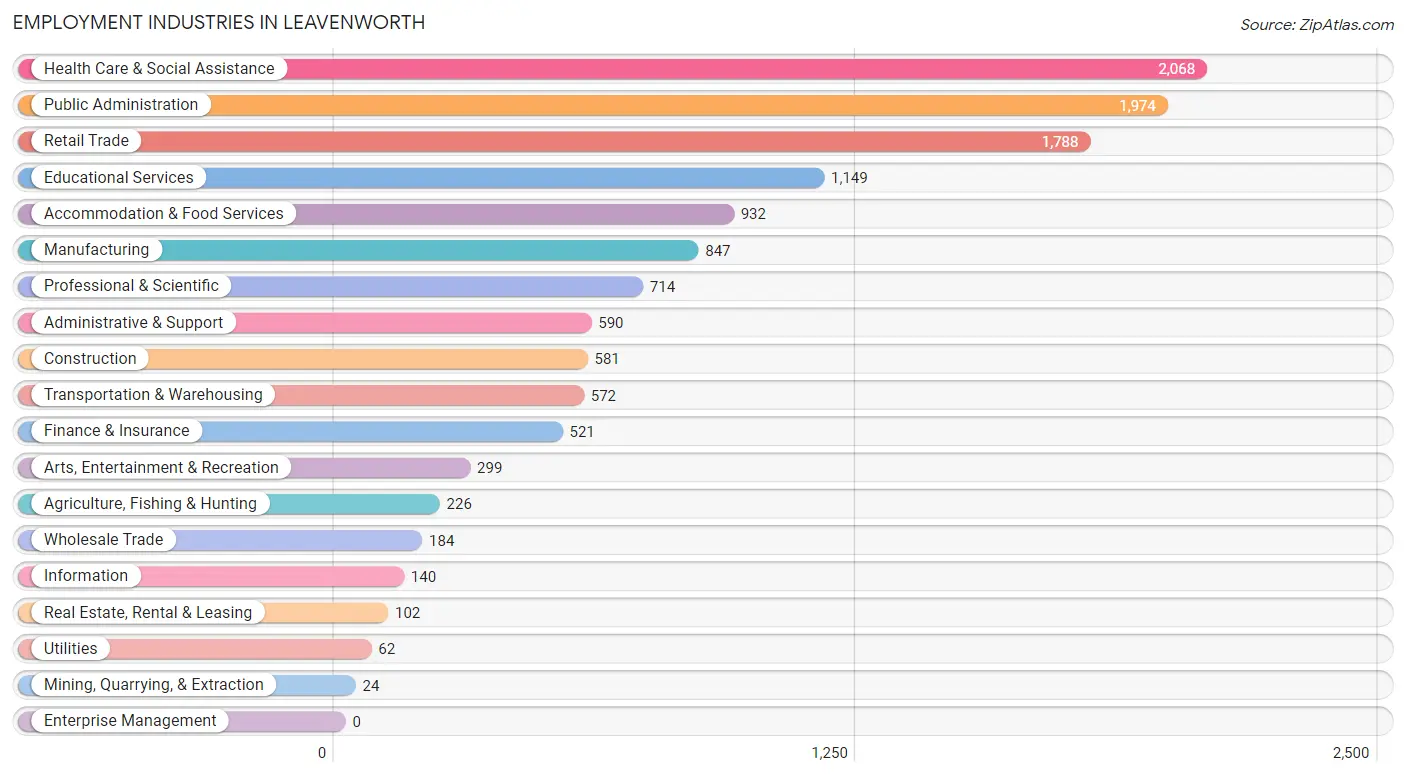
Employment Industries in Leavenworth
The major employment industries in Leavenworth include Health Care & Social Assistance (2,068 | 15.3%), Public Administration (1,974 | 14.6%), Retail Trade (1,788 | 13.2%), Educational Services (1,149 | 8.5%), and Accommodation & Food Services (932 | 6.9%).
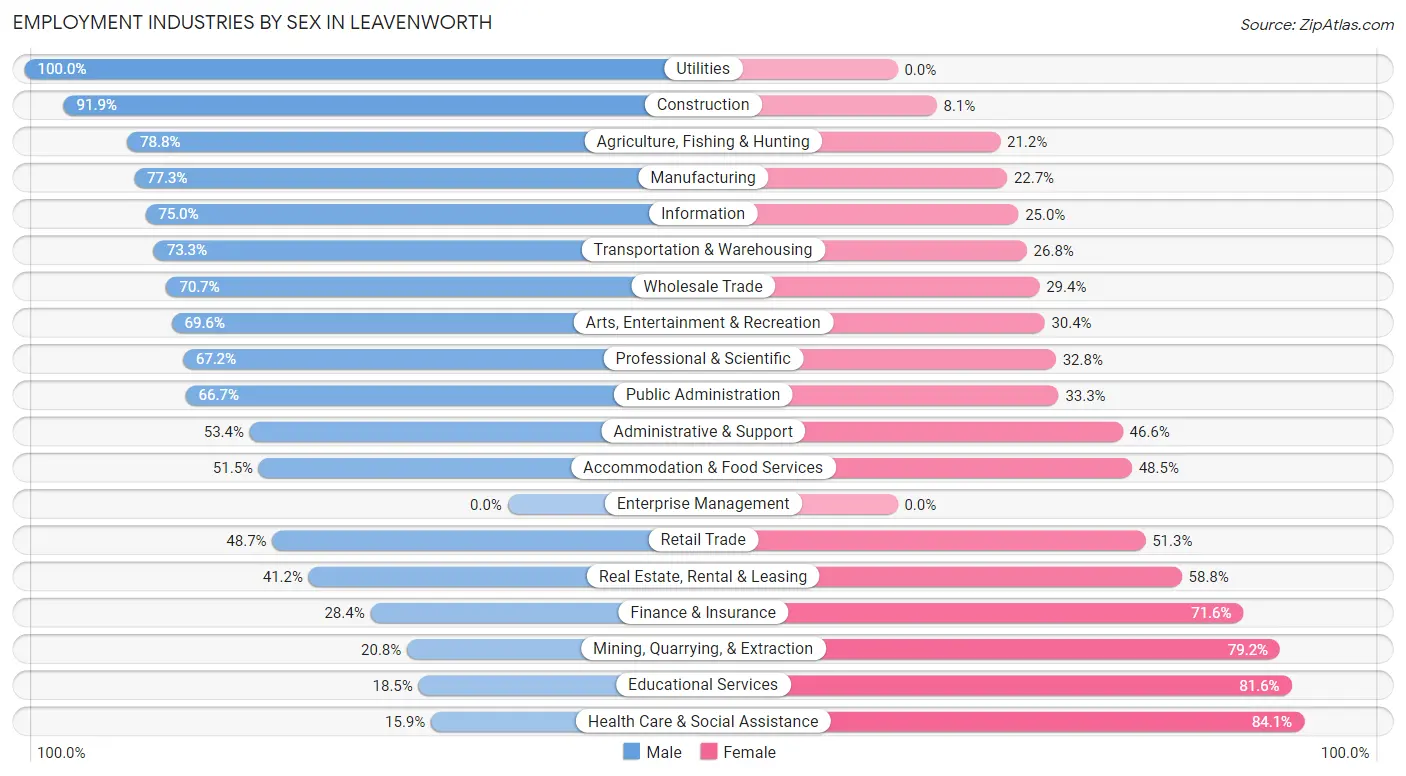
Employment Industries by Sex in Leavenworth
The Leavenworth industries that see more men than women are Utilities (100.0%), Construction (91.9%), and Agriculture, Fishing & Hunting (78.8%), whereas the industries that tend to have a higher number of women are Health Care & Social Assistance (84.1%), Educational Services (81.6%), and Mining, Quarrying, & Extraction (79.2%).
| Industry | Male | Female |
| Agriculture, Fishing & Hunting | 178 (78.8%) | 48 (21.2%) |
| Mining, Quarrying, & Extraction | 5 (20.8%) | 19 (79.2%) |
| Construction | 534 (91.9%) | 47 (8.1%) |
| Manufacturing | 655 (77.3%) | 192 (22.7%) |
| Wholesale Trade | 130 (70.7%) | 54 (29.3%) |
| Retail Trade | 871 (48.7%) | 917 (51.3%) |
| Transportation & Warehousing | 419 (73.3%) | 153 (26.8%) |
| Utilities | 62 (100.0%) | 0 (0.0%) |
| Information | 105 (75.0%) | 35 (25.0%) |
| Finance & Insurance | 148 (28.4%) | 373 (71.6%) |
| Real Estate, Rental & Leasing | 42 (41.2%) | 60 (58.8%) |
| Professional & Scientific | 480 (67.2%) | 234 (32.8%) |
| Enterprise Management | 0 (0.0%) | 0 (0.0%) |
| Administrative & Support | 315 (53.4%) | 275 (46.6%) |
| Educational Services | 212 (18.4%) | 937 (81.6%) |
| Health Care & Social Assistance | 328 (15.9%) | 1,740 (84.1%) |
| Arts, Entertainment & Recreation | 208 (69.6%) | 91 (30.4%) |
| Accommodation & Food Services | 480 (51.5%) | 452 (48.5%) |
| Public Administration | 1,316 (66.7%) | 658 (33.3%) |
| Total | 6,873 (50.8%) | 6,657 (49.2%) |
Education in Leavenworth
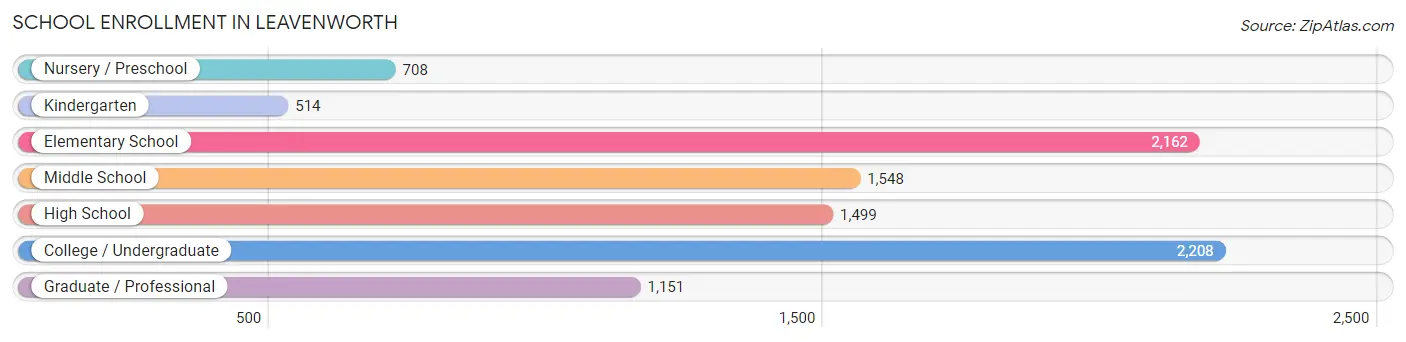
School Enrollment in Leavenworth
The most common levels of schooling among the 9,790 students in Leavenworth are college / undergraduate (2,208 | 22.6%), elementary school (2,162 | 22.1%), and middle school (1,548 | 15.8%).
| School Level | # Students | % Students |
| Nursery / Preschool | 708 | 7.2% |
| Kindergarten | 514 | 5.2% |
| Elementary School | 2,162 | 22.1% |
| Middle School | 1,548 | 15.8% |
| High School | 1,499 | 15.3% |
| College / Undergraduate | 2,208 | 22.6% |
| Graduate / Professional | 1,151 | 11.8% |
| Total | 9,790 | 100.0% |
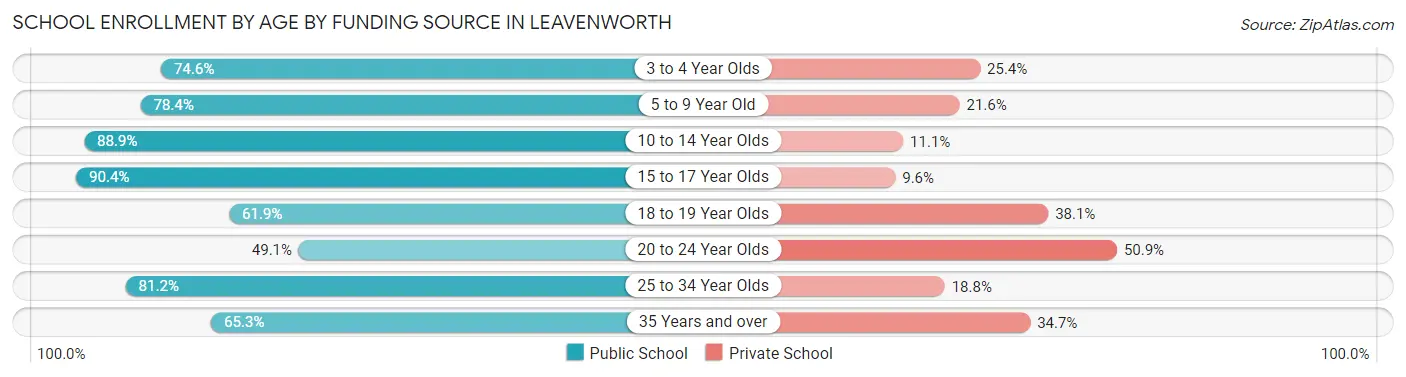
School Enrollment by Age by Funding Source in Leavenworth
Out of a total of 9,790 students who are enrolled in schools in Leavenworth, 2,369 (24.2%) attend a private institution, while the remaining 7,421 (75.8%) are enrolled in public schools. The age group of 20 to 24 year olds has the highest likelihood of being enrolled in private schools, with 595 (50.9% in the age bracket) enrolled. Conversely, the age group of 15 to 17 year olds has the lowest likelihood of being enrolled in a private school, with 884 (90.4% in the age bracket) attending a public institution.
| Age Bracket | Public School | Private School |
| 3 to 4 Year Olds | 405 (74.6%) | 138 (25.4%) |
| 5 to 9 Year Old | 1,968 (78.4%) | 542 (21.6%) |
| 10 to 14 Year Olds | 1,838 (88.9%) | 229 (11.1%) |
| 15 to 17 Year Olds | 884 (90.4%) | 94 (9.6%) |
| 18 to 19 Year Olds | 325 (61.9%) | 200 (38.1%) |
| 20 to 24 Year Olds | 574 (49.1%) | 595 (50.9%) |
| 25 to 34 Year Olds | 638 (81.2%) | 148 (18.8%) |
| 35 Years and over | 791 (65.3%) | 421 (34.7%) |
| Total | 7,421 (75.8%) | 2,369 (24.2%) |
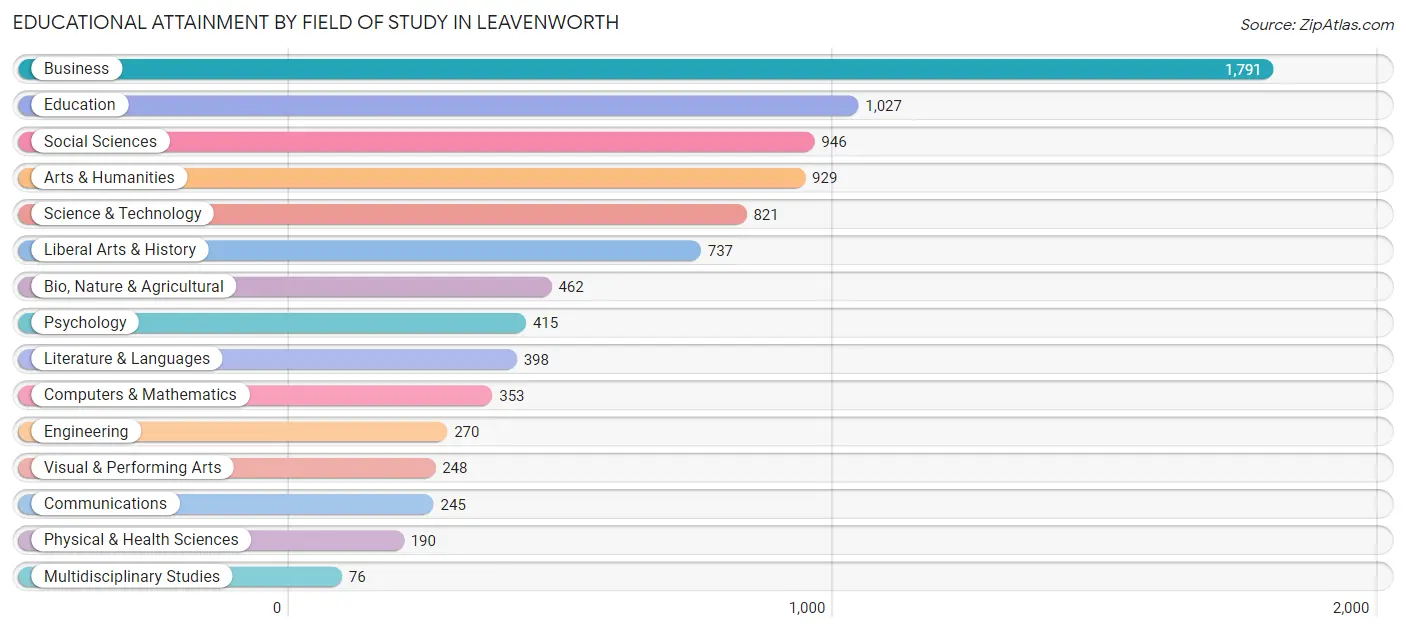
Educational Attainment by Field of Study in Leavenworth
Business (1,791 | 20.1%), education (1,027 | 11.5%), social sciences (946 | 10.6%), arts & humanities (929 | 10.4%), and science & technology (821 | 9.2%) are the most common fields of study among 8,908 individuals in Leavenworth who have obtained a bachelor's degree or higher.
| Field of Study | # Graduates | % Graduates |
| Computers & Mathematics | 353 | 4.0% |
| Bio, Nature & Agricultural | 462 | 5.2% |
| Physical & Health Sciences | 190 | 2.1% |
| Psychology | 415 | 4.7% |
| Social Sciences | 946 | 10.6% |
| Engineering | 270 | 3.0% |
| Multidisciplinary Studies | 76 | 0.9% |
| Science & Technology | 821 | 9.2% |
| Business | 1,791 | 20.1% |
| Education | 1,027 | 11.5% |
| Literature & Languages | 398 | 4.5% |
| Liberal Arts & History | 737 | 8.3% |
| Visual & Performing Arts | 248 | 2.8% |
| Communications | 245 | 2.8% |
| Arts & Humanities | 929 | 10.4% |
| Total | 8,908 | 100.0% |
Transportation & Commute in Leavenworth
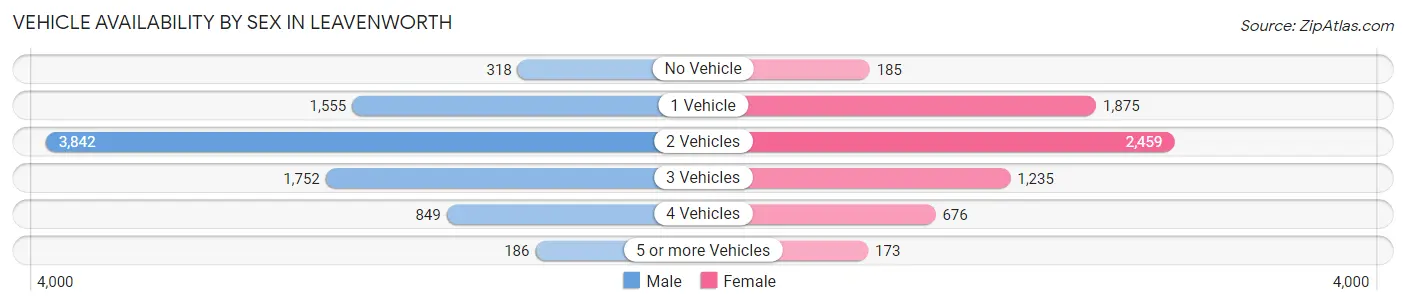
Vehicle Availability by Sex in Leavenworth
The most prevalent vehicle ownership categories in Leavenworth are males with 2 vehicles (3,842, accounting for 45.2%) and females with 2 vehicles (2,459, making up 58.2%).
| Vehicles Available | Male | Female |
| No Vehicle | 318 (3.7%) | 185 (2.8%) |
| 1 Vehicle | 1,555 (18.3%) | 1,875 (28.4%) |
| 2 Vehicles | 3,842 (45.2%) | 2,459 (37.2%) |
| 3 Vehicles | 1,752 (20.6%) | 1,235 (18.7%) |
| 4 Vehicles | 849 (10.0%) | 676 (10.2%) |
| 5 or more Vehicles | 186 (2.2%) | 173 (2.6%) |
| Total | 8,502 (100.0%) | 6,603 (100.0%) |
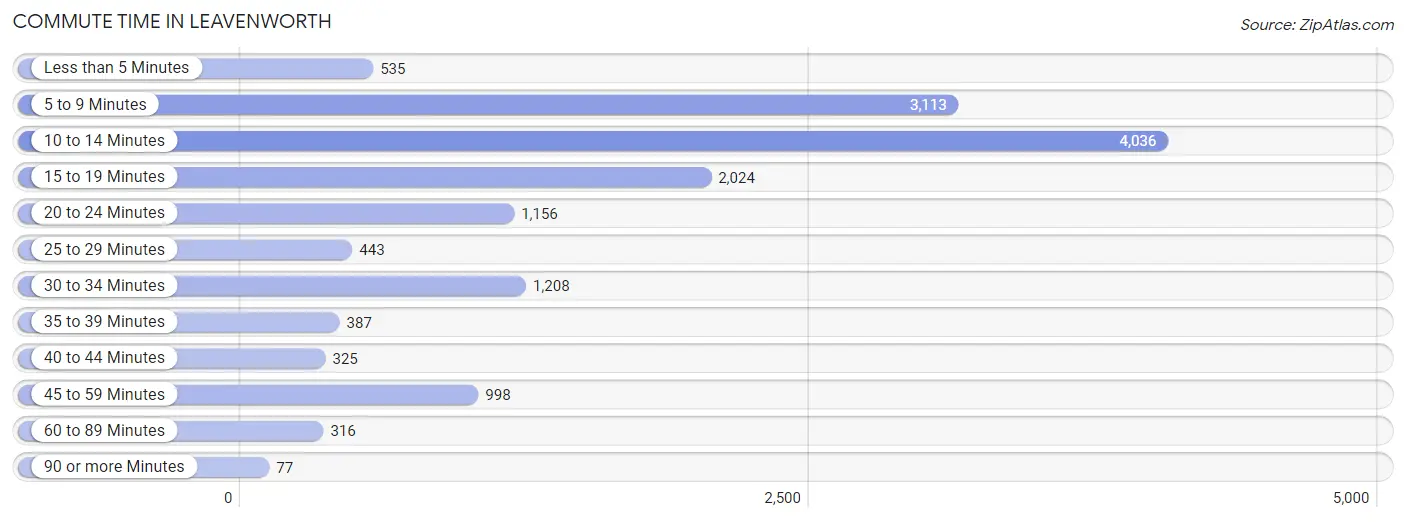
Commute Time in Leavenworth
The most frequently occuring commute durations in Leavenworth are 10 to 14 minutes (4,036 commuters, 27.6%), 5 to 9 minutes (3,113 commuters, 21.3%), and 15 to 19 minutes (2,024 commuters, 13.9%).
| Commute Time | # Commuters | % Commuters |
| Less than 5 Minutes | 535 | 3.7% |
| 5 to 9 Minutes | 3,113 | 21.3% |
| 10 to 14 Minutes | 4,036 | 27.6% |
| 15 to 19 Minutes | 2,024 | 13.9% |
| 20 to 24 Minutes | 1,156 | 7.9% |
| 25 to 29 Minutes | 443 | 3.0% |
| 30 to 34 Minutes | 1,208 | 8.3% |
| 35 to 39 Minutes | 387 | 2.6% |
| 40 to 44 Minutes | 325 | 2.2% |
| 45 to 59 Minutes | 998 | 6.8% |
| 60 to 89 Minutes | 316 | 2.2% |
| 90 or more Minutes | 77 | 0.5% |
Commute Time by Sex in Leavenworth
The most common commute times in Leavenworth are 10 to 14 minutes (2,431 commuters, 28.4%) for males and 10 to 14 minutes (1,605 commuters, 26.4%) for females.
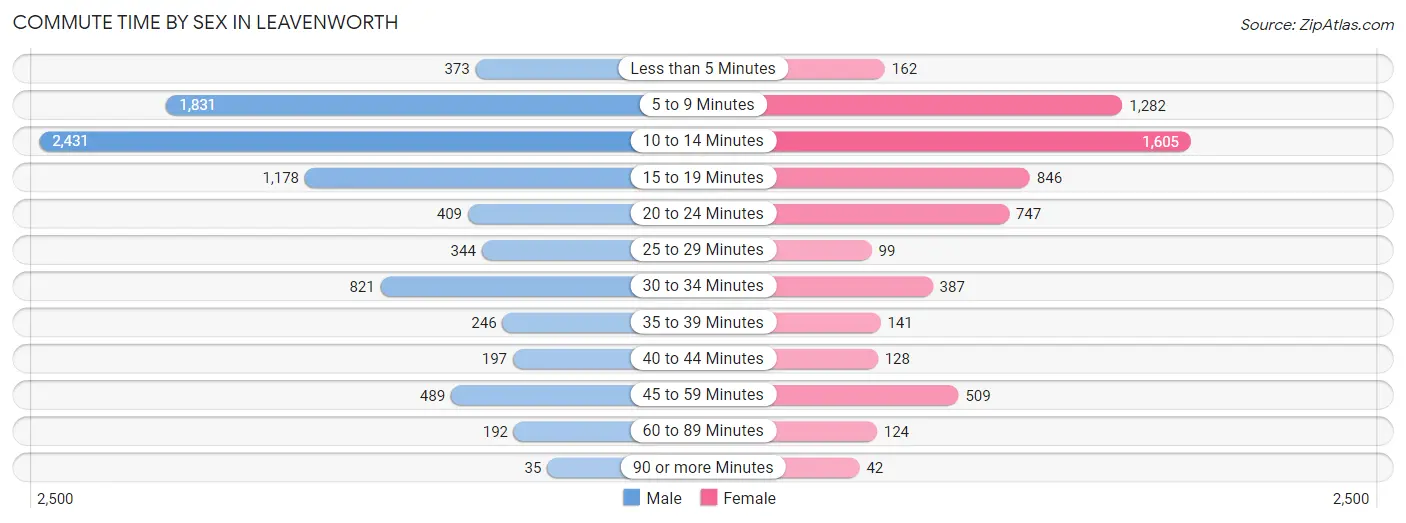
| Commute Time | Male | Female |
| Less than 5 Minutes | 373 (4.4%) | 162 (2.7%) |
| 5 to 9 Minutes | 1,831 (21.4%) | 1,282 (21.1%) |
| 10 to 14 Minutes | 2,431 (28.4%) | 1,605 (26.4%) |
| 15 to 19 Minutes | 1,178 (13.8%) | 846 (13.9%) |
| 20 to 24 Minutes | 409 (4.8%) | 747 (12.3%) |
| 25 to 29 Minutes | 344 (4.0%) | 99 (1.6%) |
| 30 to 34 Minutes | 821 (9.6%) | 387 (6.4%) |
| 35 to 39 Minutes | 246 (2.9%) | 141 (2.3%) |
| 40 to 44 Minutes | 197 (2.3%) | 128 (2.1%) |
| 45 to 59 Minutes | 489 (5.7%) | 509 (8.4%) |
| 60 to 89 Minutes | 192 (2.2%) | 124 (2.0%) |
| 90 or more Minutes | 35 (0.4%) | 42 (0.7%) |
Time of Departure to Work by Sex in Leavenworth
The most frequent times of departure to work in Leavenworth are 7:30 AM to 7:59 AM (1,451, 17.0%) for males and 7:30 AM to 7:59 AM (1,153, 19.0%) for females.
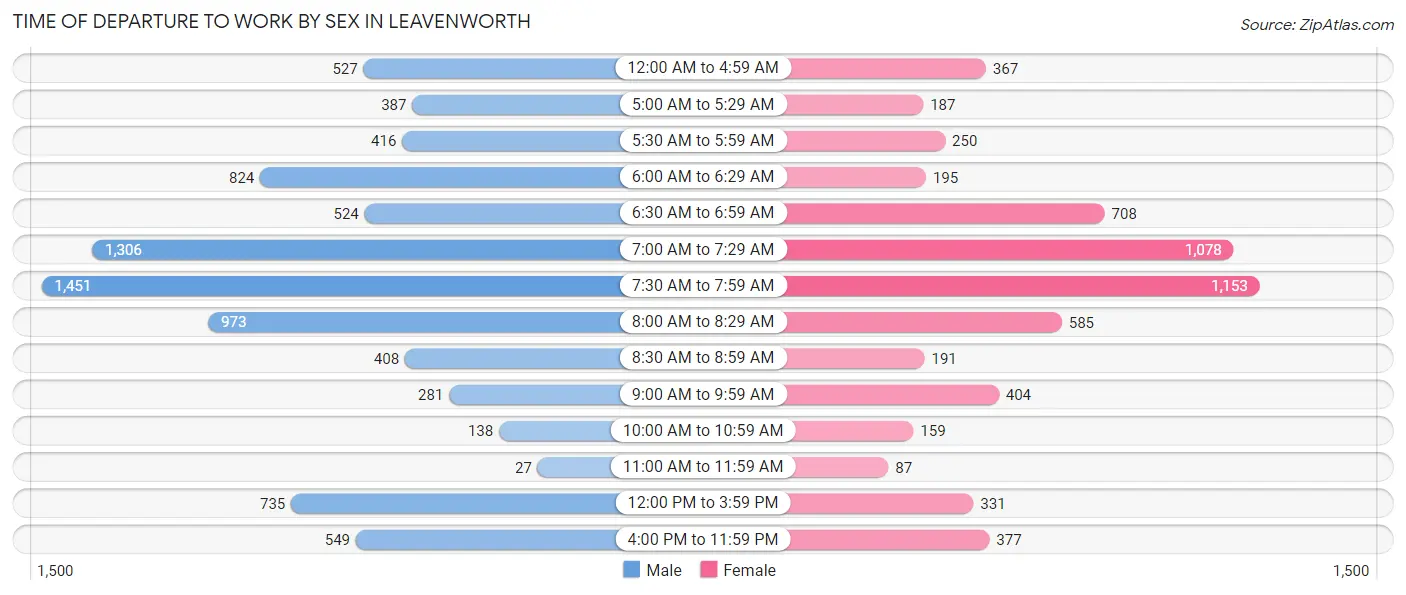
| Time of Departure | Male | Female |
| 12:00 AM to 4:59 AM | 527 (6.2%) | 367 (6.0%) |
| 5:00 AM to 5:29 AM | 387 (4.5%) | 187 (3.1%) |
| 5:30 AM to 5:59 AM | 416 (4.9%) | 250 (4.1%) |
| 6:00 AM to 6:29 AM | 824 (9.6%) | 195 (3.2%) |
| 6:30 AM to 6:59 AM | 524 (6.1%) | 708 (11.7%) |
| 7:00 AM to 7:29 AM | 1,306 (15.3%) | 1,078 (17.7%) |
| 7:30 AM to 7:59 AM | 1,451 (17.0%) | 1,153 (19.0%) |
| 8:00 AM to 8:29 AM | 973 (11.4%) | 585 (9.6%) |
| 8:30 AM to 8:59 AM | 408 (4.8%) | 191 (3.2%) |
| 9:00 AM to 9:59 AM | 281 (3.3%) | 404 (6.7%) |
| 10:00 AM to 10:59 AM | 138 (1.6%) | 159 (2.6%) |
| 11:00 AM to 11:59 AM | 27 (0.3%) | 87 (1.4%) |
| 12:00 PM to 3:59 PM | 735 (8.6%) | 331 (5.4%) |
| 4:00 PM to 11:59 PM | 549 (6.4%) | 377 (6.2%) |
| Total | 8,546 (100.0%) | 6,072 (100.0%) |
Housing Occupancy in Leavenworth
Occupancy by Ownership in Leavenworth
Of the total 13,285 dwellings in Leavenworth, owner-occupied units account for 6,647 (50.0%), while renter-occupied units make up 6,638 (50.0%).
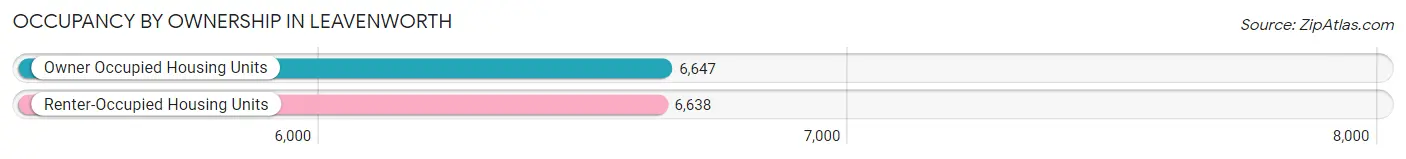
| Occupancy | # Housing Units | % Housing Units |
| Owner Occupied Housing Units | 6,647 | 50.0% |
| Renter-Occupied Housing Units | 6,638 | 50.0% |
| Total Occupied Housing Units | 13,285 | 100.0% |
Occupancy by Household Size in Leavenworth
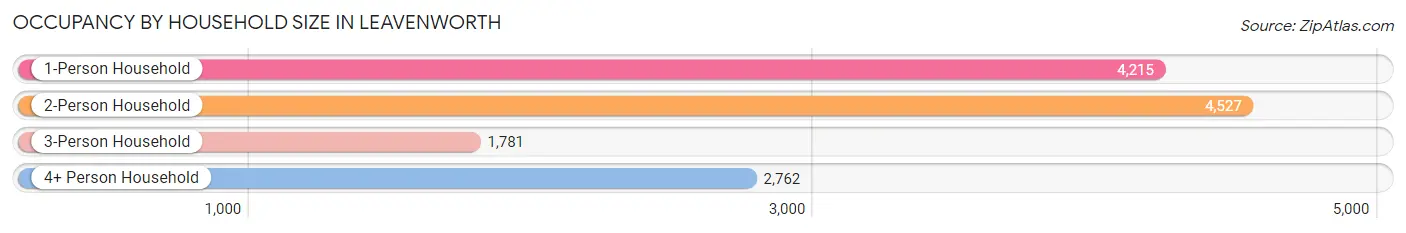
| Household Size | # Housing Units | % Housing Units |
| 1-Person Household | 4,215 | 31.7% |
| 2-Person Household | 4,527 | 34.1% |
| 3-Person Household | 1,781 | 13.4% |
| 4+ Person Household | 2,762 | 20.8% |
| Total Housing Units | 13,285 | 100.0% |
Occupancy by Ownership by Household Size in Leavenworth
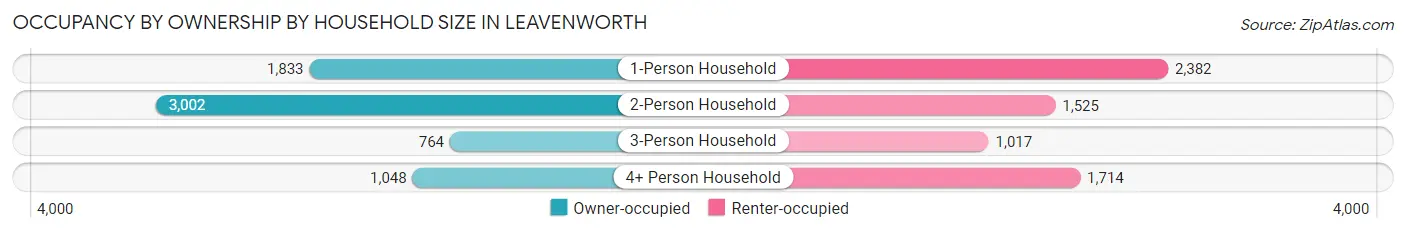
| Household Size | Owner-occupied | Renter-occupied |
| 1-Person Household | 1,833 (43.5%) | 2,382 (56.5%) |
| 2-Person Household | 3,002 (66.3%) | 1,525 (33.7%) |
| 3-Person Household | 764 (42.9%) | 1,017 (57.1%) |
| 4+ Person Household | 1,048 (37.9%) | 1,714 (62.1%) |
| Total Housing Units | 6,647 (50.0%) | 6,638 (50.0%) |
Occupancy by Educational Attainment in Leavenworth
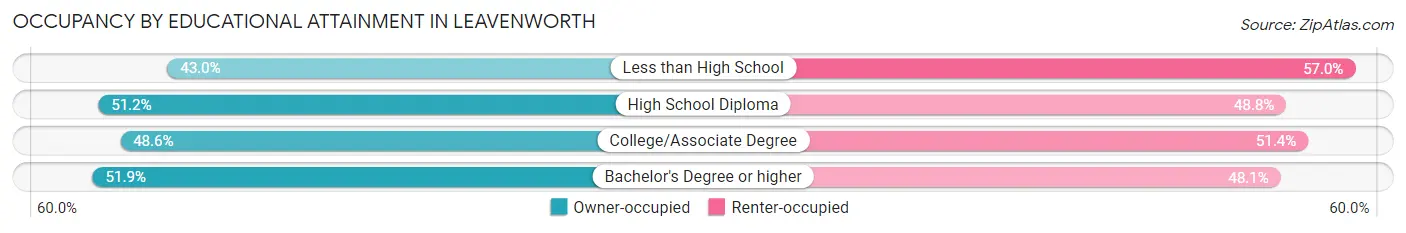
| Household Size | Owner-occupied | Renter-occupied |
| Less than High School | 367 (43.0%) | 486 (57.0%) |
| High School Diploma | 1,556 (51.2%) | 1,481 (48.8%) |
| College/Associate Degree | 2,252 (48.6%) | 2,380 (51.4%) |
| Bachelor's Degree or higher | 2,472 (51.9%) | 2,291 (48.1%) |
Occupancy by Age of Householder in Leavenworth
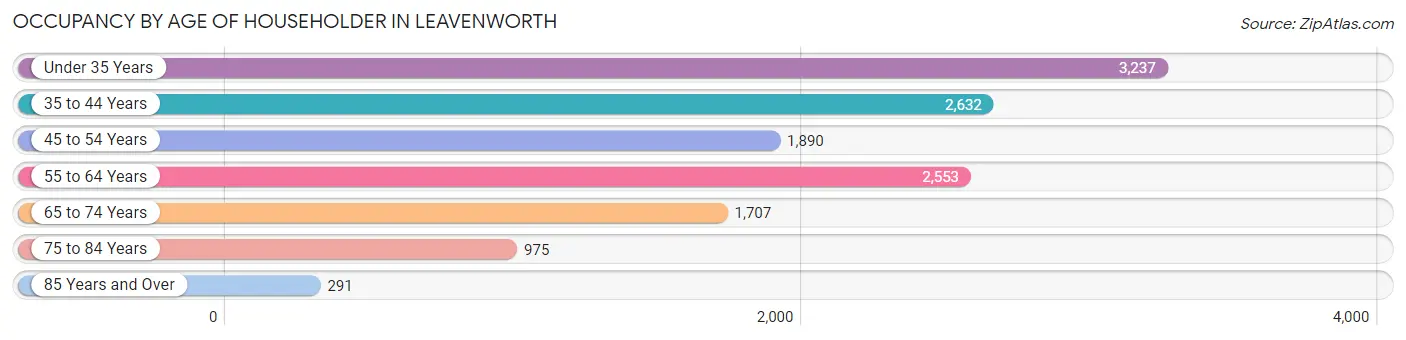
| Age Bracket | # Households | % Households |
| Under 35 Years | 3,237 | 24.4% |
| 35 to 44 Years | 2,632 | 19.8% |
| 45 to 54 Years | 1,890 | 14.2% |
| 55 to 64 Years | 2,553 | 19.2% |
| 65 to 74 Years | 1,707 | 12.9% |
| 75 to 84 Years | 975 | 7.3% |
| 85 Years and Over | 291 | 2.2% |
| Total | 13,285 | 100.0% |
Housing Finances in Leavenworth
Median Income by Occupancy in Leavenworth
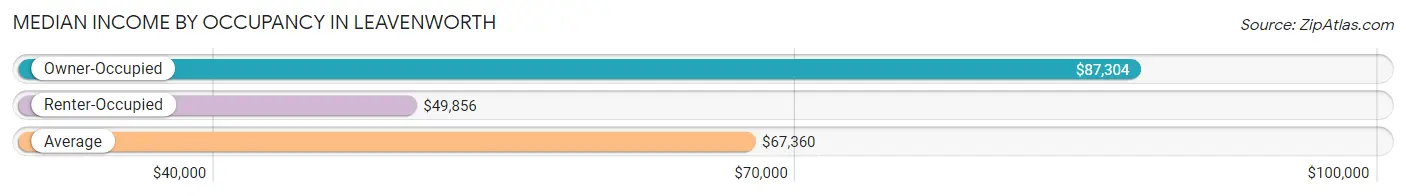
| Occupancy Type | # Households | Median Income |
| Owner-Occupied | 6,647 (50.0%) | $87,304 |
| Renter-Occupied | 6,638 (50.0%) | $49,856 |
| Average | 13,285 (100.0%) | $67,360 |
Occupancy by Householder Income Bracket in Leavenworth
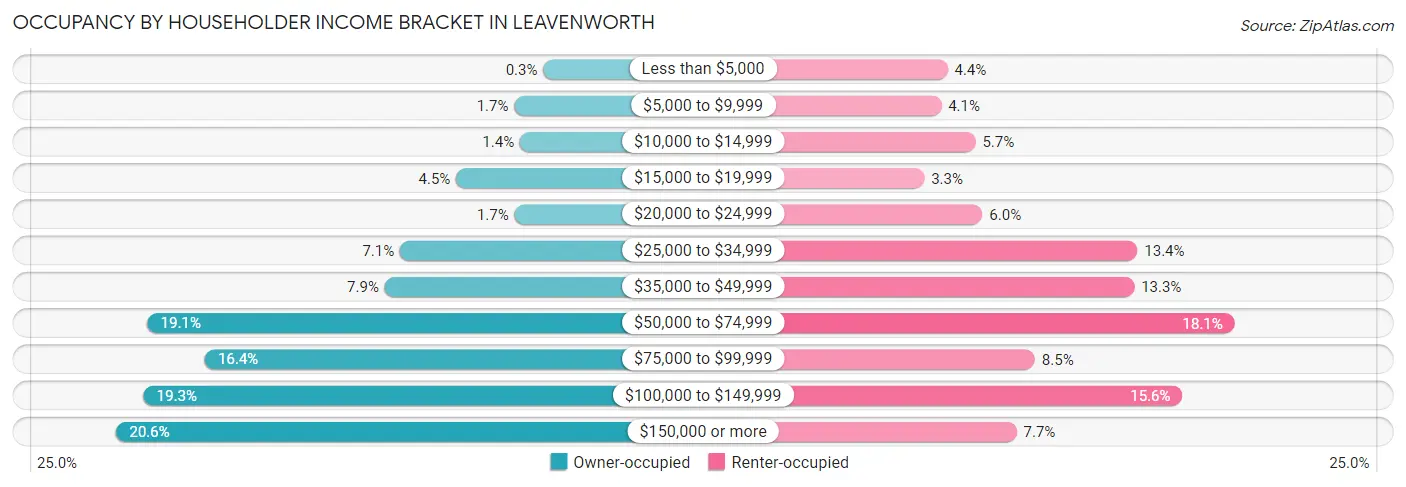
| Income Bracket | Owner-occupied | Renter-occupied |
| Less than $5,000 | 20 (0.3%) | 291 (4.4%) |
| $5,000 to $9,999 | 112 (1.7%) | 271 (4.1%) |
| $10,000 to $14,999 | 94 (1.4%) | 379 (5.7%) |
| $15,000 to $19,999 | 296 (4.4%) | 217 (3.3%) |
| $20,000 to $24,999 | 111 (1.7%) | 401 (6.0%) |
| $25,000 to $34,999 | 473 (7.1%) | 891 (13.4%) |
| $35,000 to $49,999 | 522 (7.9%) | 881 (13.3%) |
| $50,000 to $74,999 | 1,272 (19.1%) | 1,198 (18.0%) |
| $75,000 to $99,999 | 1,091 (16.4%) | 567 (8.5%) |
| $100,000 to $149,999 | 1,285 (19.3%) | 1,033 (15.6%) |
| $150,000 or more | 1,371 (20.6%) | 509 (7.7%) |
| Total | 6,647 (100.0%) | 6,638 (100.0%) |
Monthly Housing Cost Tiers in Leavenworth
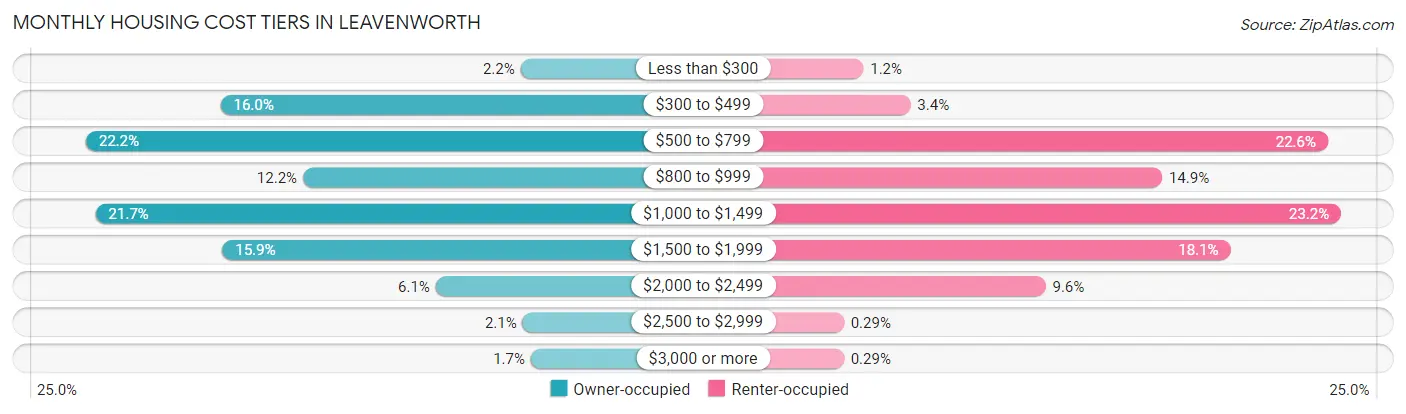
| Monthly Cost | Owner-occupied | Renter-occupied |
| Less than $300 | 144 (2.2%) | 79 (1.2%) |
| $300 to $499 | 1,062 (16.0%) | 223 (3.4%) |
| $500 to $799 | 1,474 (22.2%) | 1,498 (22.6%) |
| $800 to $999 | 810 (12.2%) | 992 (14.9%) |
| $1,000 to $1,499 | 1,445 (21.7%) | 1,539 (23.2%) |
| $1,500 to $1,999 | 1,057 (15.9%) | 1,201 (18.1%) |
| $2,000 to $2,499 | 404 (6.1%) | 636 (9.6%) |
| $2,500 to $2,999 | 138 (2.1%) | 19 (0.3%) |
| $3,000 or more | 113 (1.7%) | 19 (0.3%) |
| Total | 6,647 (100.0%) | 6,638 (100.0%) |
Physical Housing Characteristics in Leavenworth
Housing Structures in Leavenworth
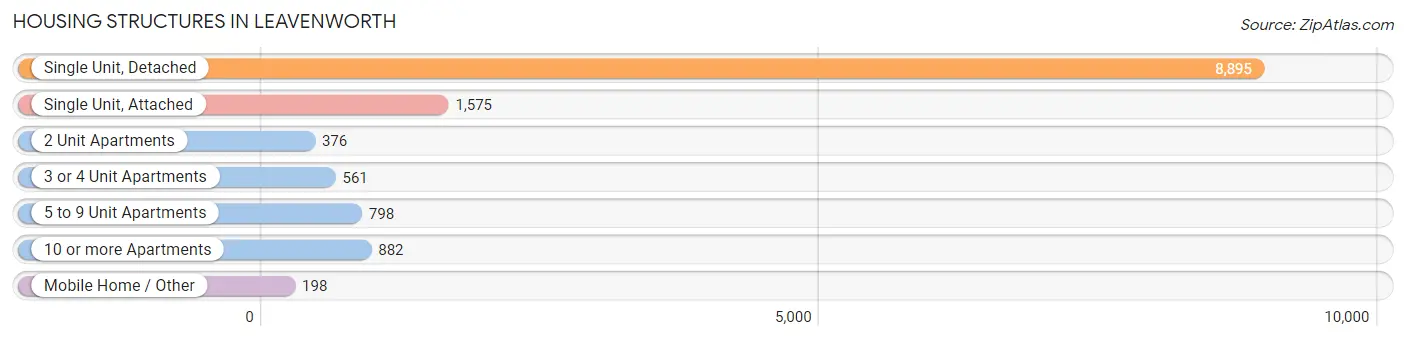
| Structure Type | # Housing Units | % Housing Units |
| Single Unit, Detached | 8,895 | 67.0% |
| Single Unit, Attached | 1,575 | 11.9% |
| 2 Unit Apartments | 376 | 2.8% |
| 3 or 4 Unit Apartments | 561 | 4.2% |
| 5 to 9 Unit Apartments | 798 | 6.0% |
| 10 or more Apartments | 882 | 6.6% |
| Mobile Home / Other | 198 | 1.5% |
| Total | 13,285 | 100.0% |
Housing Structures by Occupancy in Leavenworth
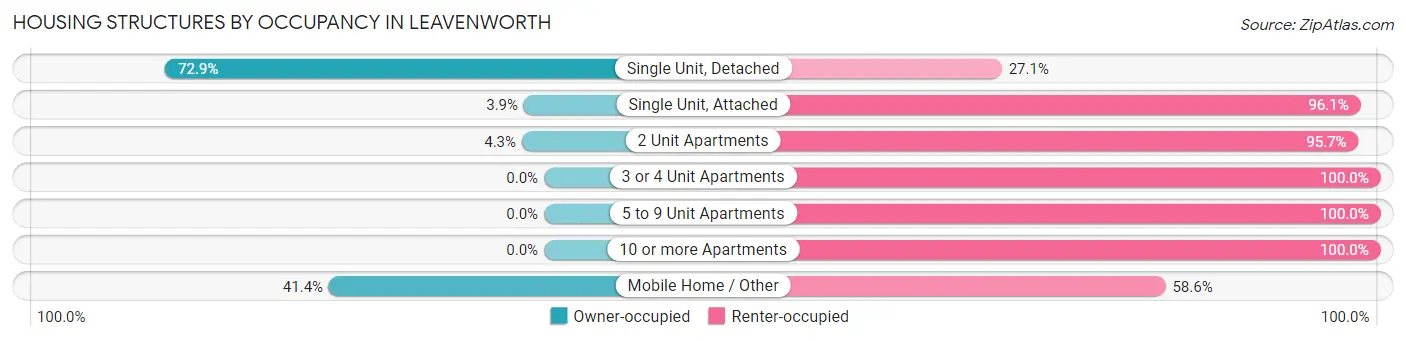
| Structure Type | Owner-occupied | Renter-occupied |
| Single Unit, Detached | 6,488 (72.9%) | 2,407 (27.1%) |
| Single Unit, Attached | 61 (3.9%) | 1,514 (96.1%) |
| 2 Unit Apartments | 16 (4.3%) | 360 (95.7%) |
| 3 or 4 Unit Apartments | 0 (0.0%) | 561 (100.0%) |
| 5 to 9 Unit Apartments | 0 (0.0%) | 798 (100.0%) |
| 10 or more Apartments | 0 (0.0%) | 882 (100.0%) |
| Mobile Home / Other | 82 (41.4%) | 116 (58.6%) |
| Total | 6,647 (50.0%) | 6,638 (50.0%) |
Housing Structures by Number of Rooms in Leavenworth
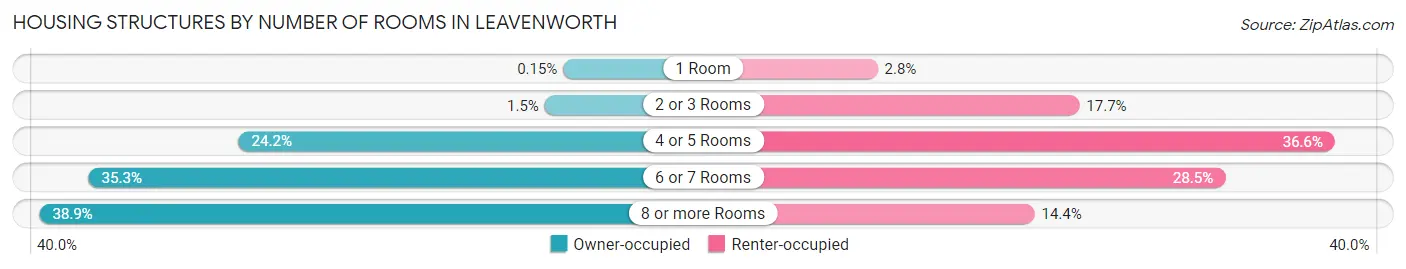
| Number of Rooms | Owner-occupied | Renter-occupied |
| 1 Room | 10 (0.2%) | 185 (2.8%) |
| 2 or 3 Rooms | 101 (1.5%) | 1,176 (17.7%) |
| 4 or 5 Rooms | 1,606 (24.2%) | 2,430 (36.6%) |
| 6 or 7 Rooms | 2,344 (35.3%) | 1,891 (28.5%) |
| 8 or more Rooms | 2,586 (38.9%) | 956 (14.4%) |
| Total | 6,647 (100.0%) | 6,638 (100.0%) |
Housing Structure by Heating Type in Leavenworth
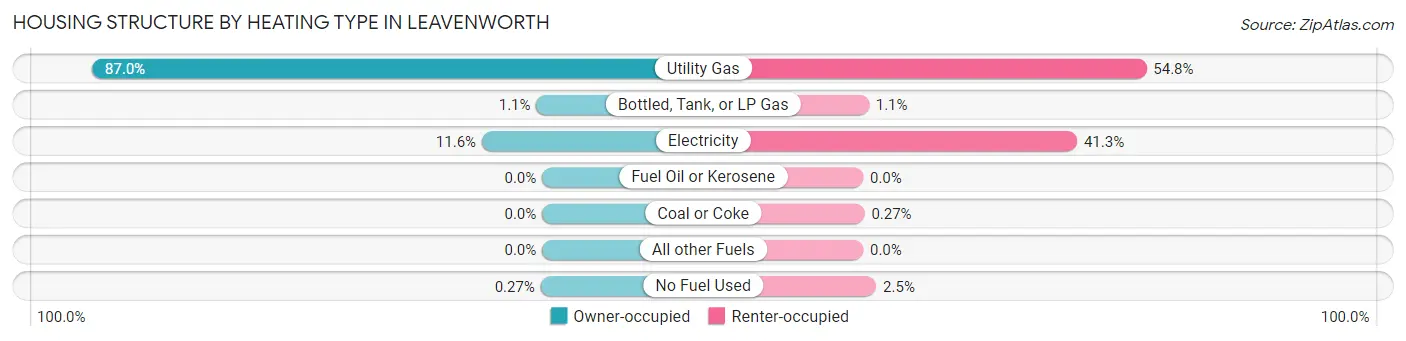
| Heating Type | Owner-occupied | Renter-occupied |
| Utility Gas | 5,782 (87.0%) | 3,634 (54.7%) |
| Bottled, Tank, or LP Gas | 74 (1.1%) | 74 (1.1%) |
| Electricity | 773 (11.6%) | 2,744 (41.3%) |
| Fuel Oil or Kerosene | 0 (0.0%) | 0 (0.0%) |
| Coal or Coke | 0 (0.0%) | 18 (0.3%) |
| All other Fuels | 0 (0.0%) | 0 (0.0%) |
| No Fuel Used | 18 (0.3%) | 168 (2.5%) |
| Total | 6,647 (100.0%) | 6,638 (100.0%) |
Household Vehicle Usage in Leavenworth
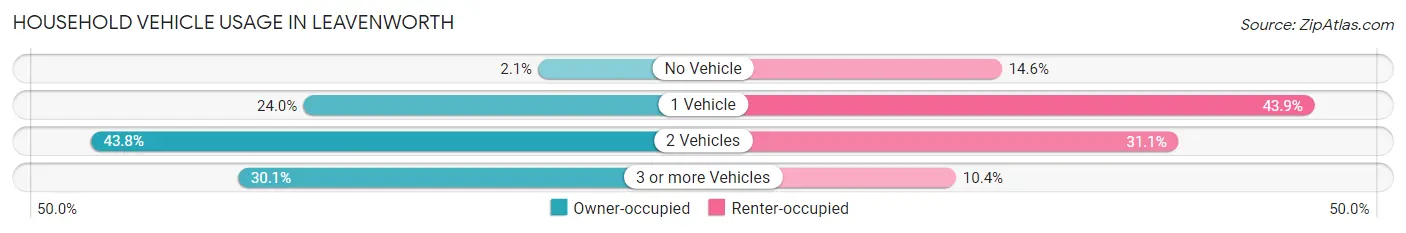
| Vehicles per Household | Owner-occupied | Renter-occupied |
| No Vehicle | 138 (2.1%) | 972 (14.6%) |
| 1 Vehicle | 1,595 (24.0%) | 2,911 (43.9%) |
| 2 Vehicles | 2,914 (43.8%) | 2,067 (31.1%) |
| 3 or more Vehicles | 2,000 (30.1%) | 688 (10.4%) |
| Total | 6,647 (100.0%) | 6,638 (100.0%) |
Real Estate & Mortgages in Leavenworth
Real Estate and Mortgage Overview in Leavenworth
| Characteristic | Without Mortgage | With Mortgage |
| Housing Units | 2,755 | 3,892 |
| Median Property Value | $142,400 | $177,400 |
| Median Household Income | $68,448 | $750 |
| Monthly Housing Costs | $537 | $113 |
| Real Estate Taxes | $1,828 | $37 |
Property Value by Mortgage Status in Leavenworth
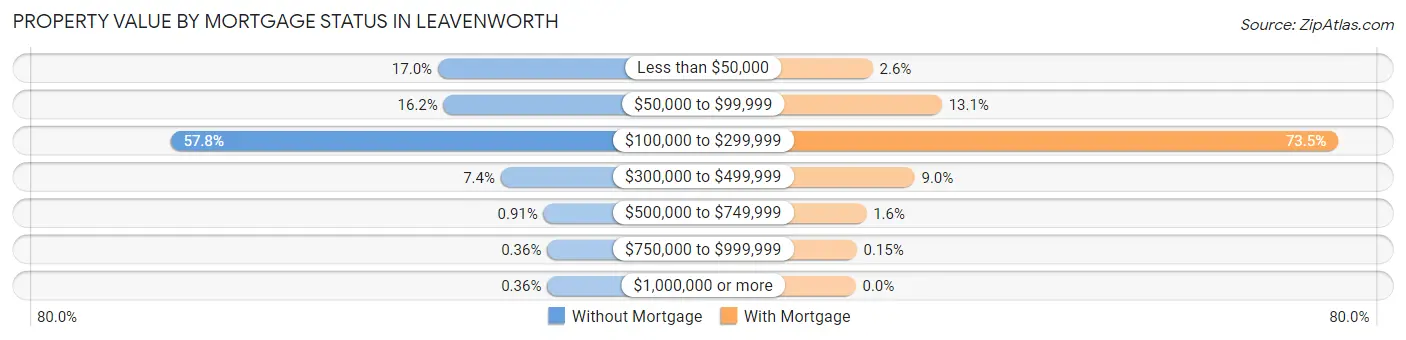
| Property Value | Without Mortgage | With Mortgage |
| Less than $50,000 | 469 (17.0%) | 101 (2.6%) |
| $50,000 to $99,999 | 445 (16.2%) | 511 (13.1%) |
| $100,000 to $299,999 | 1,591 (57.8%) | 2,861 (73.5%) |
| $300,000 to $499,999 | 205 (7.4%) | 350 (9.0%) |
| $500,000 to $749,999 | 25 (0.9%) | 63 (1.6%) |
| $750,000 to $999,999 | 10 (0.4%) | 6 (0.2%) |
| $1,000,000 or more | 10 (0.4%) | 0 (0.0%) |
| Total | 2,755 (100.0%) | 3,892 (100.0%) |
Household Income by Mortgage Status in Leavenworth
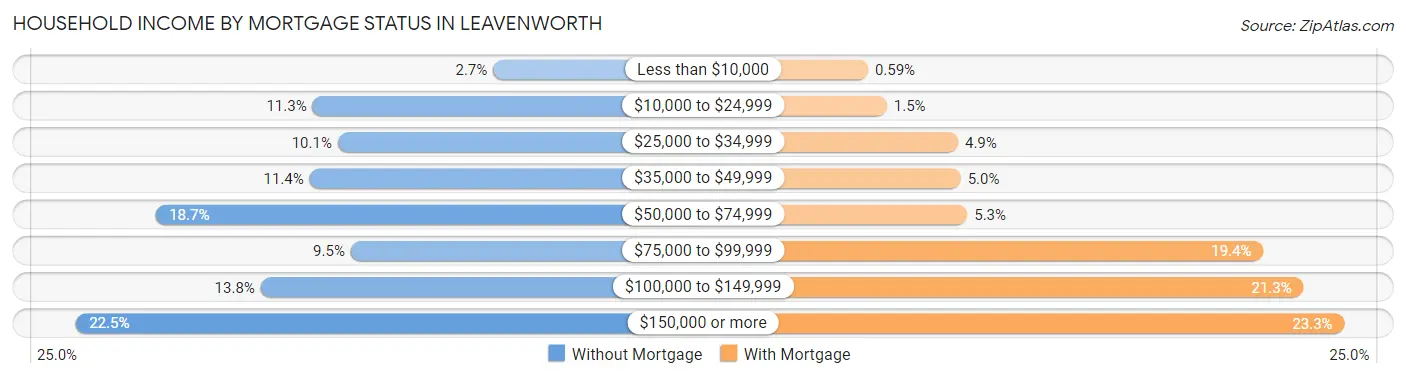
| Household Income | Without Mortgage | With Mortgage |
| Less than $10,000 | 74 (2.7%) | 23 (0.6%) |
| $10,000 to $24,999 | 311 (11.3%) | 58 (1.5%) |
| $25,000 to $34,999 | 278 (10.1%) | 190 (4.9%) |
| $35,000 to $49,999 | 315 (11.4%) | 195 (5.0%) |
| $50,000 to $74,999 | 516 (18.7%) | 207 (5.3%) |
| $75,000 to $99,999 | 261 (9.5%) | 756 (19.4%) |
| $100,000 to $149,999 | 379 (13.8%) | 830 (21.3%) |
| $150,000 or more | 621 (22.5%) | 906 (23.3%) |
| Total | 2,755 (100.0%) | 3,892 (100.0%) |
Property Value to Household Income Ratio in Leavenworth
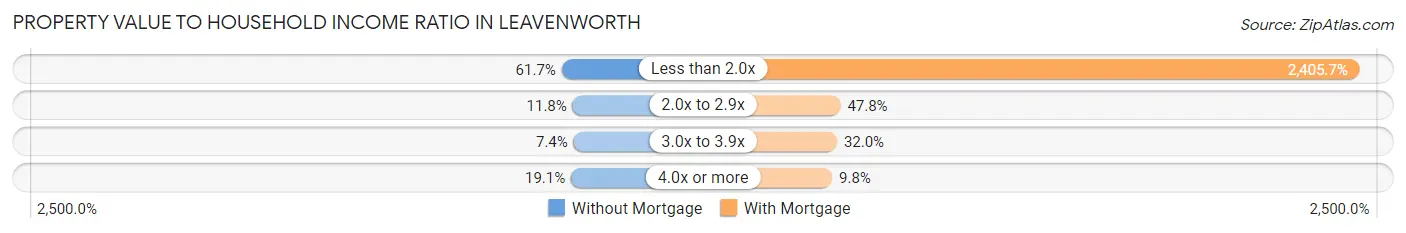
| Value-to-Income Ratio | Without Mortgage | With Mortgage |
| Less than 2.0x | 1,699 (61.7%) | 93,631 (2,405.7%) |
| 2.0x to 2.9x | 326 (11.8%) | 1,862 (47.8%) |
| 3.0x to 3.9x | 203 (7.4%) | 1,246 (32.0%) |
| 4.0x or more | 527 (19.1%) | 380 (9.8%) |
| Total | 2,755 (100.0%) | 3,892 (100.0%) |
Real Estate Taxes by Mortgage Status in Leavenworth
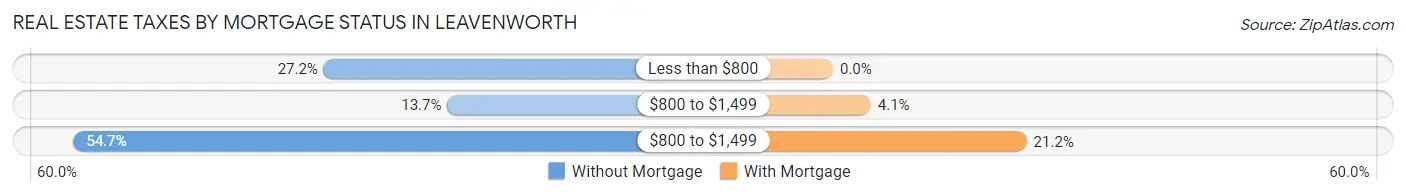
| Property Taxes | Without Mortgage | With Mortgage |
| Less than $800 | 750 (27.2%) | 0 (0.0%) |
| $800 to $1,499 | 377 (13.7%) | 161 (4.1%) |
| $800 to $1,499 | 1,506 (54.7%) | 826 (21.2%) |
| Total | 2,755 (100.0%) | 3,892 (100.0%) |
Health & Disability in Leavenworth
Health Insurance Coverage by Age in Leavenworth
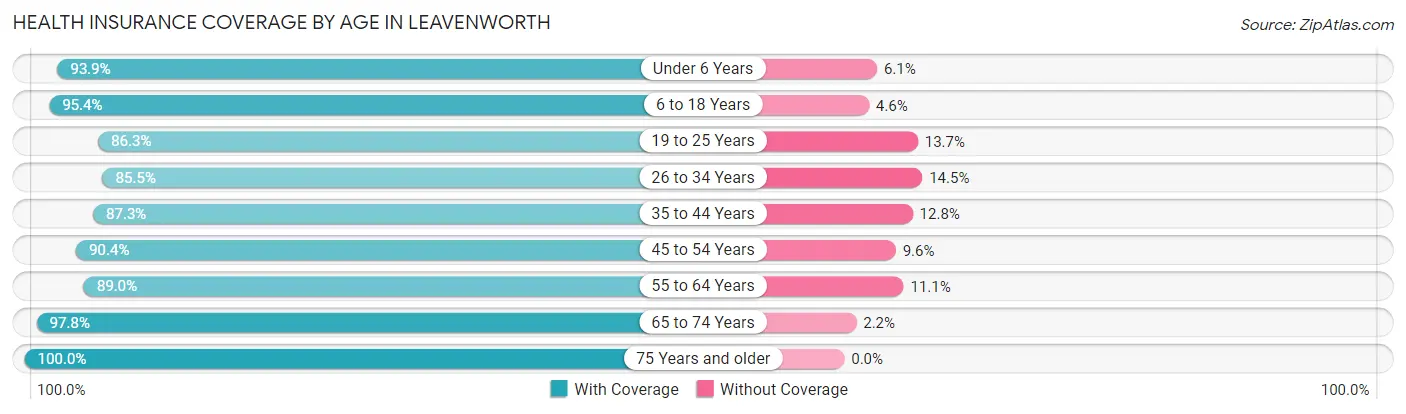
| Age Bracket | With Coverage | Without Coverage |
| Under 6 Years | 3,077 (93.9%) | 200 (6.1%) |
| 6 to 18 Years | 5,490 (95.4%) | 264 (4.6%) |
| 19 to 25 Years | 2,996 (86.3%) | 476 (13.7%) |
| 26 to 34 Years | 2,795 (85.5%) | 475 (14.5%) |
| 35 to 44 Years | 3,359 (87.3%) | 491 (12.8%) |
| 45 to 54 Years | 2,877 (90.4%) | 305 (9.6%) |
| 55 to 64 Years | 3,895 (88.9%) | 484 (11.1%) |
| 65 to 74 Years | 2,718 (97.8%) | 62 (2.2%) |
| 75 Years and older | 2,077 (100.0%) | 0 (0.0%) |
| Total | 29,284 (91.4%) | 2,757 (8.6%) |
Health Insurance Coverage by Citizenship Status in Leavenworth
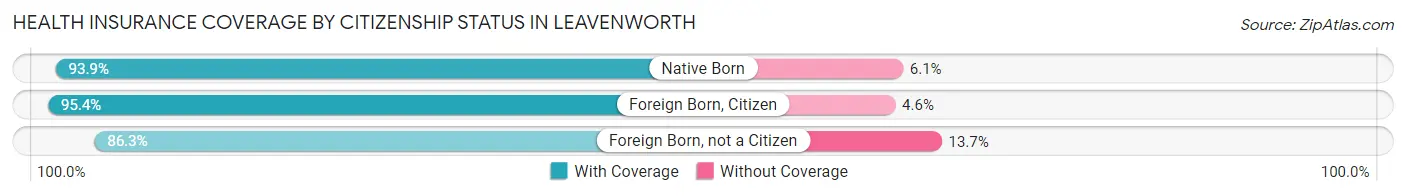
| Citizenship Status | With Coverage | Without Coverage |
| Native Born | 3,077 (93.9%) | 200 (6.1%) |
| Foreign Born, Citizen | 5,490 (95.4%) | 264 (4.6%) |
| Foreign Born, not a Citizen | 2,996 (86.3%) | 476 (13.7%) |
Health Insurance Coverage by Household Income in Leavenworth
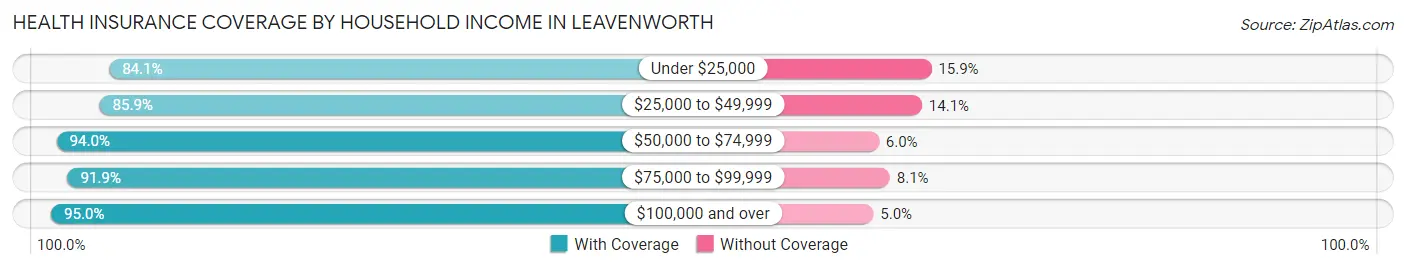
| Household Income | With Coverage | Without Coverage |
| Under $25,000 | 3,115 (84.1%) | 587 (15.9%) |
| $25,000 to $49,999 | 4,494 (85.9%) | 736 (14.1%) |
| $50,000 to $74,999 | 5,650 (94.0%) | 361 (6.0%) |
| $75,000 to $99,999 | 4,404 (91.9%) | 386 (8.1%) |
| $100,000 and over | 10,876 (95.0%) | 569 (5.0%) |
Public vs Private Health Insurance Coverage by Age in Leavenworth
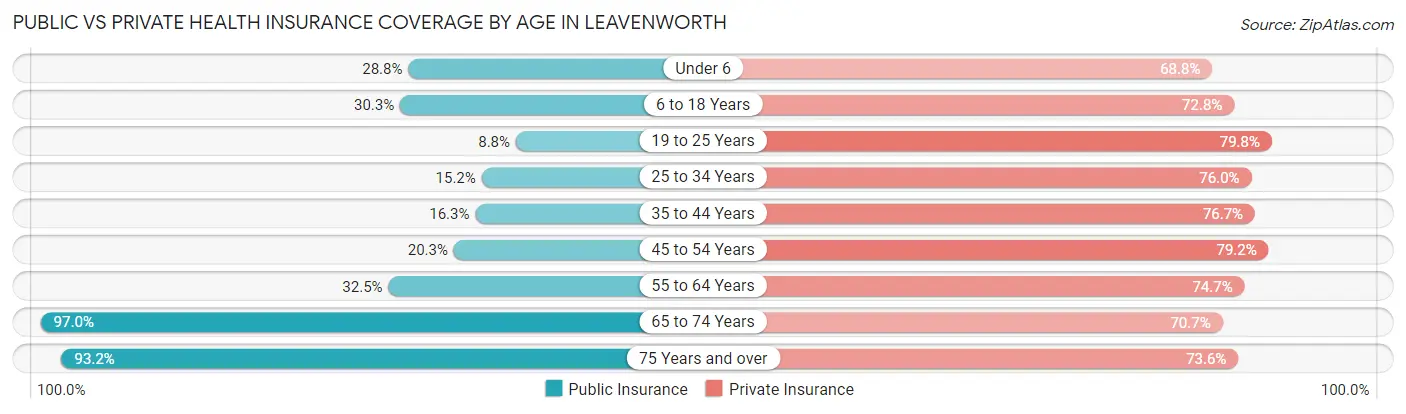
| Age Bracket | Public Insurance | Private Insurance |
| Under 6 | 943 (28.8%) | 2,253 (68.8%) |
| 6 to 18 Years | 1,744 (30.3%) | 4,190 (72.8%) |
| 19 to 25 Years | 306 (8.8%) | 2,771 (79.8%) |
| 25 to 34 Years | 496 (15.2%) | 2,486 (76.0%) |
| 35 to 44 Years | 629 (16.3%) | 2,952 (76.7%) |
| 45 to 54 Years | 647 (20.3%) | 2,520 (79.2%) |
| 55 to 64 Years | 1,422 (32.5%) | 3,273 (74.7%) |
| 65 to 74 Years | 2,697 (97.0%) | 1,964 (70.7%) |
| 75 Years and over | 1,935 (93.2%) | 1,528 (73.6%) |
| Total | 10,819 (33.8%) | 23,937 (74.7%) |
Disability Status by Sex by Age in Leavenworth
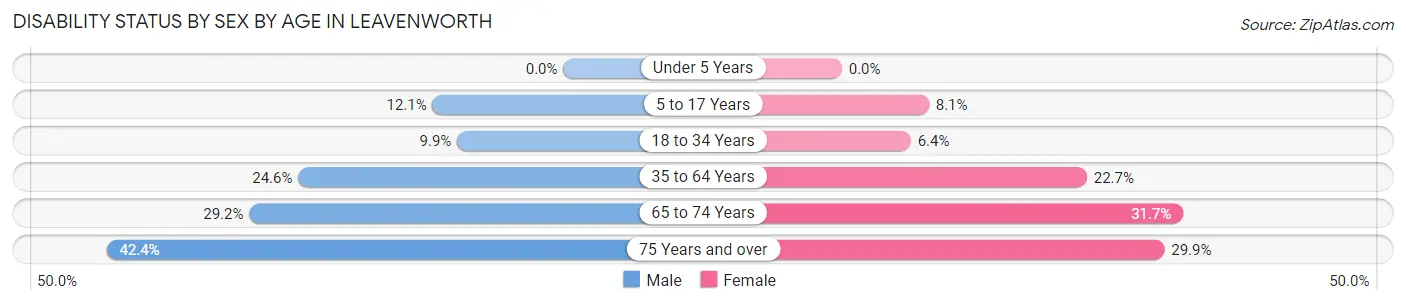
| Age Bracket | Male | Female |
| Under 5 Years | 0 (0.0%) | 0 (0.0%) |
| 5 to 17 Years | 361 (12.1%) | 232 (8.1%) |
| 18 to 34 Years | 342 (9.9%) | 234 (6.4%) |
| 35 to 64 Years | 1,333 (24.6%) | 1,363 (22.7%) |
| 65 to 74 Years | 423 (29.1%) | 421 (31.7%) |
| 75 Years and over | 307 (42.4%) | 405 (29.9%) |
Disability Class by Sex by Age in Leavenworth
Disability Class: Hearing Difficulty
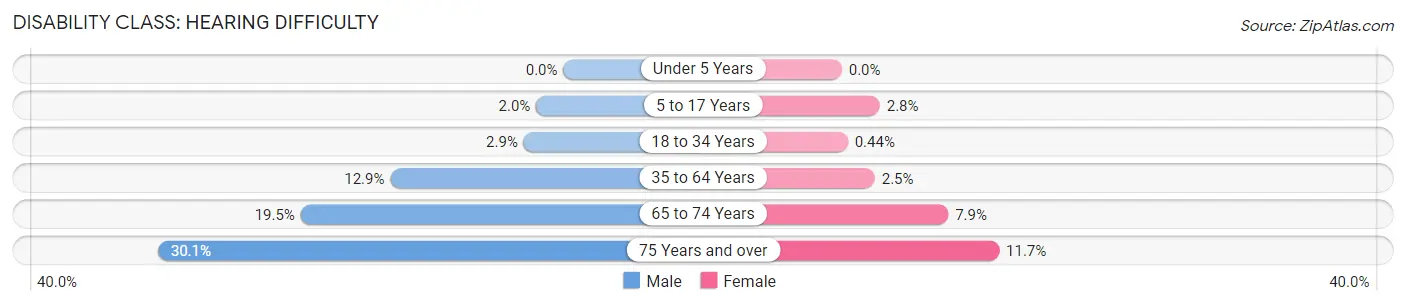
| Age Bracket | Male | Female |
| Under 5 Years | 0 (0.0%) | 0 (0.0%) |
| 5 to 17 Years | 60 (2.0%) | 81 (2.8%) |
| 18 to 34 Years | 102 (2.9%) | 16 (0.4%) |
| 35 to 64 Years | 696 (12.9%) | 147 (2.5%) |
| 65 to 74 Years | 283 (19.5%) | 105 (7.9%) |
| 75 Years and over | 218 (30.1%) | 158 (11.7%) |
Disability Class: Vision Difficulty
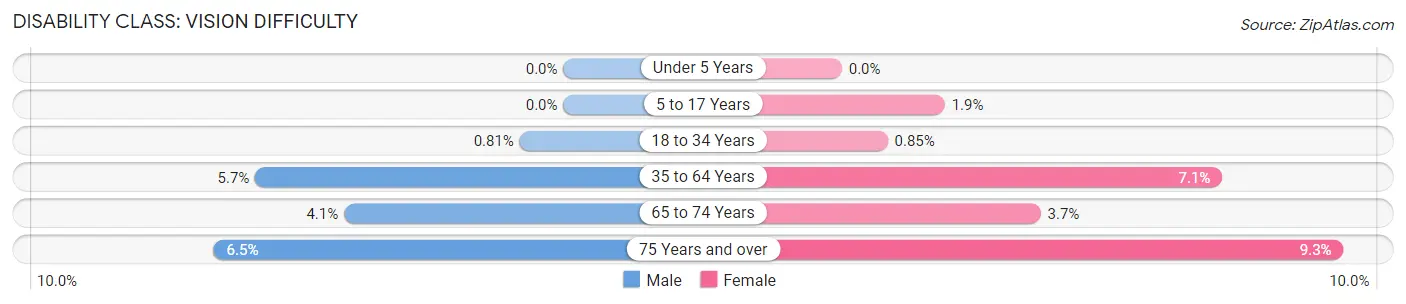
| Age Bracket | Male | Female |
| Under 5 Years | 0 (0.0%) | 0 (0.0%) |
| 5 to 17 Years | 0 (0.0%) | 55 (1.9%) |
| 18 to 34 Years | 28 (0.8%) | 31 (0.9%) |
| 35 to 64 Years | 310 (5.7%) | 423 (7.1%) |
| 65 to 74 Years | 59 (4.1%) | 49 (3.7%) |
| 75 Years and over | 47 (6.5%) | 126 (9.3%) |
Disability Class: Cognitive Difficulty
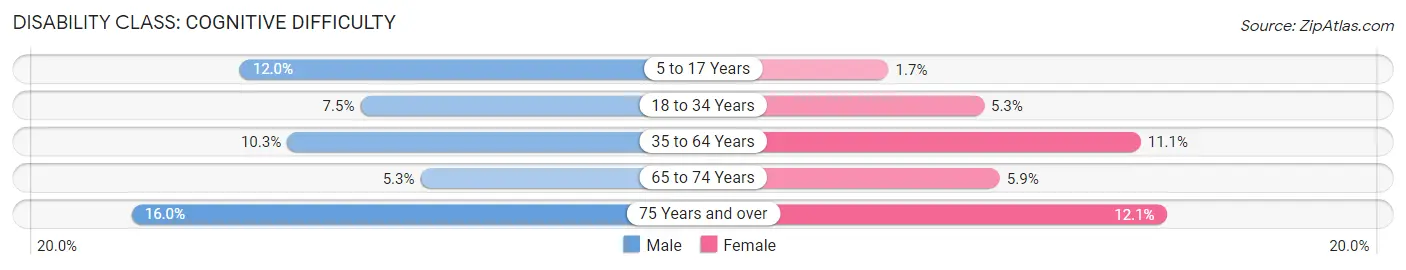
| Age Bracket | Male | Female |
| 5 to 17 Years | 357 (12.0%) | 50 (1.7%) |
| 18 to 34 Years | 262 (7.5%) | 193 (5.3%) |
| 35 to 64 Years | 556 (10.3%) | 665 (11.1%) |
| 65 to 74 Years | 77 (5.3%) | 78 (5.9%) |
| 75 Years and over | 116 (16.0%) | 163 (12.0%) |
Disability Class: Ambulatory Difficulty
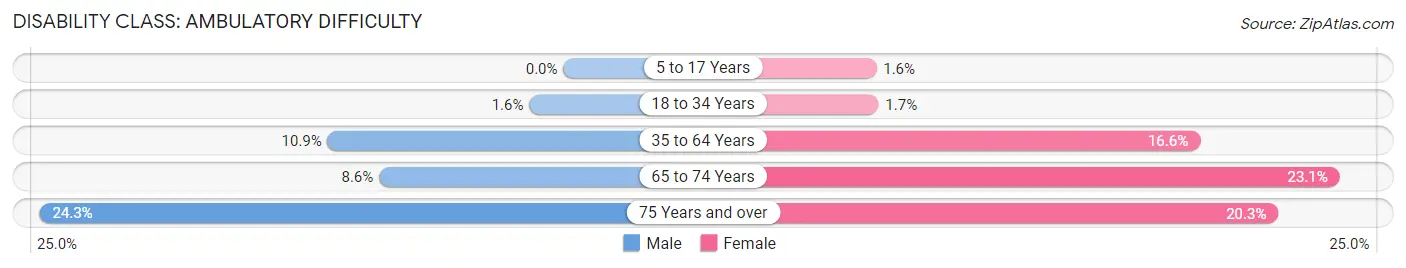
| Age Bracket | Male | Female |
| 5 to 17 Years | 0 (0.0%) | 46 (1.6%) |
| 18 to 34 Years | 55 (1.6%) | 62 (1.7%) |
| 35 to 64 Years | 593 (10.9%) | 996 (16.6%) |
| 65 to 74 Years | 124 (8.6%) | 307 (23.1%) |
| 75 Years and over | 176 (24.3%) | 274 (20.3%) |
Disability Class: Self-Care Difficulty
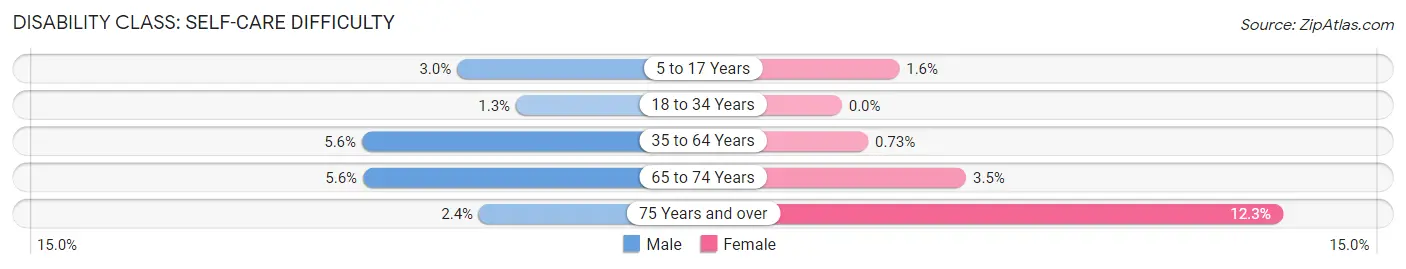
| Age Bracket | Male | Female |
| 5 to 17 Years | 88 (3.0%) | 46 (1.6%) |
| 18 to 34 Years | 46 (1.3%) | 0 (0.0%) |
| 35 to 64 Years | 304 (5.6%) | 44 (0.7%) |
| 65 to 74 Years | 81 (5.6%) | 46 (3.5%) |
| 75 Years and over | 17 (2.4%) | 166 (12.3%) |
Technology Access in Leavenworth
Computing Device Access in Leavenworth
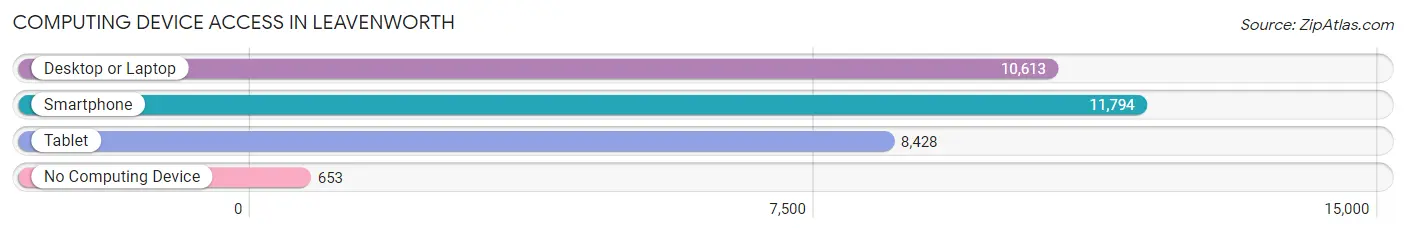
| Device Type | # Households | % Households |
| Desktop or Laptop | 10,613 | 79.9% |
| Smartphone | 11,794 | 88.8% |
| Tablet | 8,428 | 63.4% |
| No Computing Device | 653 | 4.9% |
| Total | 13,285 | 100.0% |
Internet Access in Leavenworth
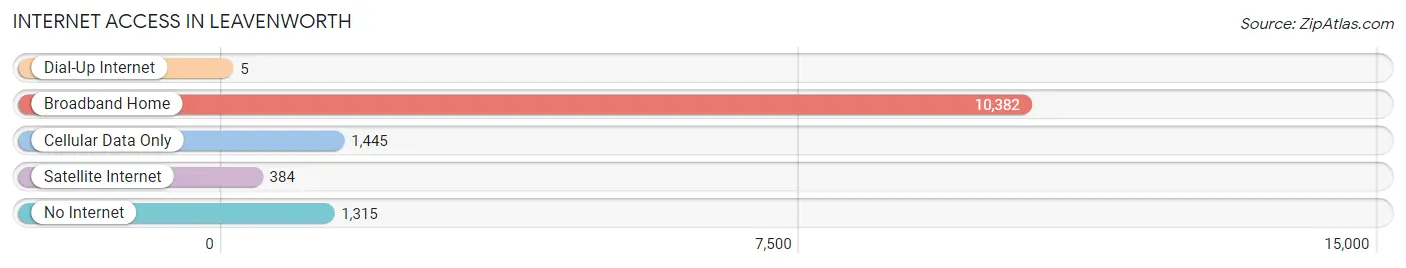
| Internet Type | # Households | % Households |
| Dial-Up Internet | 5 | 0.0% |
| Broadband Home | 10,382 | 78.1% |
| Cellular Data Only | 1,445 | 10.9% |
| Satellite Internet | 384 | 2.9% |
| No Internet | 1,315 | 9.9% |
| Total | 13,285 | 100.0% |
Leavenworth Summary
Leavenworth, Kansas is a city located in the northeastern part of the state, in Leavenworth County. It is situated on the Missouri River, and is the county seat of Leavenworth County. The city is located approximately 25 miles northwest of Kansas City, Missouri, and is part of the Kansas City metropolitan area. As of the 2010 census, the city had a population of 35,251, making it the largest city in Leavenworth County.
History
Leavenworth was founded in 1854 by Colonel Henry Leavenworth, a veteran of the War of 1812. He named the city after himself, and it quickly became a major trading post and supply center for the region. The city was incorporated in 1858, and by the 1860s it had become a major transportation hub, with the Missouri Pacific Railroad running through the city.
During the Civil War, Leavenworth was a major supply center for the Union Army, and the city was the site of several battles. After the war, the city continued to grow, and by the late 19th century it had become a major industrial center, with several factories and mills located in the city.
Geography
Leavenworth is located in northeastern Kansas, in Leavenworth County. It is situated on the Missouri River, and is approximately 25 miles northwest of Kansas City, Missouri. The city has a total area of 16.2 square miles, of which 15.9 square miles is land and 0.3 square miles is water.
The city is located in the humid continental climate zone, with hot, humid summers and cold, dry winters. The average annual temperature is 54.3°F, and the average annual precipitation is 37.3 inches.
Economy
Leavenworth’s economy is largely based on manufacturing and government services. The city is home to several major employers, including the U.S. Army’s Fort Leavenworth, the Leavenworth Federal Penitentiary, and the Leavenworth County Government. The city is also home to several manufacturing companies, including the Leavenworth Manufacturing Company, which produces automotive parts, and the Leavenworth Paper Company, which produces paper products.
Demographics
As of the 2010 census, the city had a population of 35,251. The racial makeup of the city was 79.2% White, 11.3% African American, 0.7% Native American, 1.3% Asian, 0.1% Pacific Islander, 4.2% from other races, and 3.2% from two or more races. Hispanic or Latino of any race were 8.7% of the population.
The median income for a household in the city was $41,945, and the median income for a family was $50,945. The per capita income for the city was $20,945. About 11.3% of families and 14.2% of the population were below the poverty line, including 19.2% of those under age 18 and 8.2% of those age 65 or over.
Common Questions
What is Per Capita Income in Leavenworth?
Per Capita income in Leavenworth is $32,849.
What is the Median Family Income in Leavenworth?
Median Family Income in Leavenworth is $92,229.
What is the Median Household income in Leavenworth?
Median Household Income in Leavenworth is $67,360.
What is Income or Wage Gap in Leavenworth?
Income or Wage Gap in Leavenworth is 26.9%.
Women in Leavenworth earn 73.1 cents for every dollar earned by a man.
What is Family Income Deficit in Leavenworth?
Family Income Deficit in Leavenworth is $9,917.
Families that are below poverty line in Leavenworth earn $9,917 less on average than the poverty threshold level.
What is Inequality or Gini Index in Leavenworth?
Inequality or Gini Index in Leavenworth is 0.44.
What is the Total Population of Leavenworth?
Total Population of Leavenworth is 37,193.
What is the Total Male Population of Leavenworth?
Total Male Population of Leavenworth is 20,377.
What is the Total Female Population of Leavenworth?
Total Female Population of Leavenworth is 16,816.
What is the Ratio of Males per 100 Females in Leavenworth?
There are 121.18 Males per 100 Females in Leavenworth.
What is the Ratio of Females per 100 Males in Leavenworth?
There are 82.52 Females per 100 Males in Leavenworth.
What is the Median Population Age in Leavenworth?
Median Population Age in Leavenworth is 35.9 Years.
What is the Average Family Size in Leavenworth
Average Family Size in Leavenworth is 3.2 People.
What is the Average Household Size in Leavenworth
Average Household Size in Leavenworth is 2.5 People.
How Large is the Labor Force in Leavenworth?
There are 16,508 People in the Labor Forcein in Leavenworth.
What is the Percentage of People in the Labor Force in Leavenworth?
56.5% of People are in the Labor Force in Leavenworth.
What is the Unemployment Rate in Leavenworth?
Unemployment Rate in Leavenworth is 4.6%.