Colwich, KS Map & Demographics
Colwich Map
Colwich Overview
$39,838
PER CAPITA INCOME
$100,875
AVG FAMILY INCOME
$84,403
AVG HOUSEHOLD INCOME
25.7%
WAGE / INCOME GAP [ % ]
74.3¢/ $1
WAGE / INCOME GAP [ $ ]
0.31
INEQUALITY / GINI INDEX
1,513
TOTAL POPULATION
694
MALE POPULATION
819
FEMALE POPULATION
84.74
MALES / 100 FEMALES
118.01
FEMALES / 100 MALES
36.5
MEDIAN AGE
3.3
AVG FAMILY SIZE
2.7
AVG HOUSEHOLD SIZE
858
LABOR FORCE [ PEOPLE ]
73.0%
PERCENT IN LABOR FORCE
8.4%
UNEMPLOYMENT RATE
Colwich Zip Codes
Income in Colwich
Income Overview in Colwich
Per Capita Income in Colwich is $39,838, while median incomes of families and households are $100,875 and $84,403 respectively.
| Characteristic | Number | Measure |
| Per Capita Income | 1,513 | $39,838 |
| Median Family Income | 391 | $100,875 |
| Mean Family Income | 391 | $116,947 |
| Median Household Income | 561 | $84,403 |
| Mean Household Income | 561 | $103,589 |
| Income Deficit | 391 | $0 |
| Wage / Income Gap (%) | 1,513 | 25.74% |
| Wage / Income Gap ($) | 1,513 | 74.26¢ per $1 |
| Gini / Inequality Index | 1,513 | 0.31 |
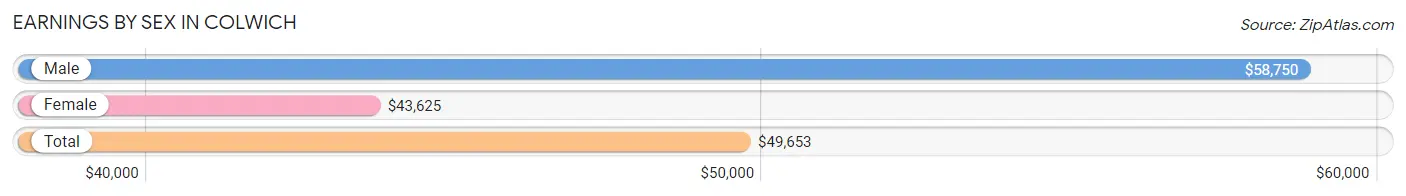
Earnings by Sex in Colwich
Average Earnings in Colwich are $49,653, $58,750 for men and $43,625 for women, a difference of 25.7%.
| Sex | Number | Average Earnings |
| Male | 436 (49.5%) | $58,750 |
| Female | 445 (50.5%) | $43,625 |
| Total | 881 (100.0%) | $49,653 |
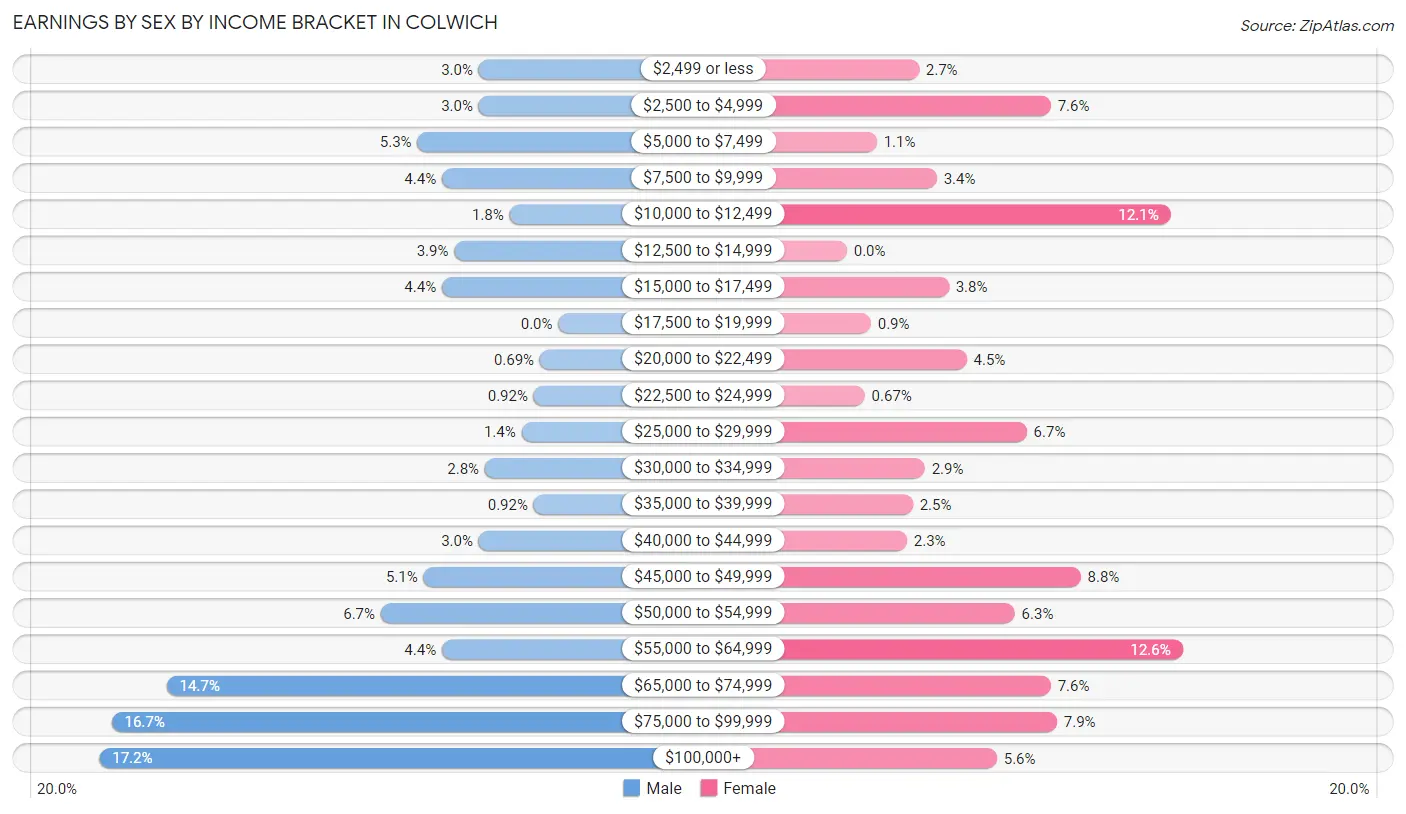
Earnings by Sex by Income Bracket in Colwich
The most common earnings brackets in Colwich are $100,000+ for men (75 | 17.2%) and $55,000 to $64,999 for women (56 | 12.6%).
| Income | Male | Female |
| $2,499 or less | 13 (3.0%) | 12 (2.7%) |
| $2,500 to $4,999 | 13 (3.0%) | 34 (7.6%) |
| $5,000 to $7,499 | 23 (5.3%) | 5 (1.1%) |
| $7,500 to $9,999 | 19 (4.4%) | 15 (3.4%) |
| $10,000 to $12,499 | 8 (1.8%) | 54 (12.1%) |
| $12,500 to $14,999 | 17 (3.9%) | 0 (0.0%) |
| $15,000 to $17,499 | 19 (4.4%) | 17 (3.8%) |
| $17,500 to $19,999 | 0 (0.0%) | 4 (0.9%) |
| $20,000 to $22,499 | 3 (0.7%) | 20 (4.5%) |
| $22,500 to $24,999 | 4 (0.9%) | 3 (0.7%) |
| $25,000 to $29,999 | 6 (1.4%) | 30 (6.7%) |
| $30,000 to $34,999 | 12 (2.8%) | 13 (2.9%) |
| $35,000 to $39,999 | 4 (0.9%) | 11 (2.5%) |
| $40,000 to $44,999 | 13 (3.0%) | 10 (2.2%) |
| $45,000 to $49,999 | 22 (5.1%) | 39 (8.8%) |
| $50,000 to $54,999 | 29 (6.7%) | 28 (6.3%) |
| $55,000 to $64,999 | 19 (4.4%) | 56 (12.6%) |
| $65,000 to $74,999 | 64 (14.7%) | 34 (7.6%) |
| $75,000 to $99,999 | 73 (16.7%) | 35 (7.9%) |
| $100,000+ | 75 (17.2%) | 25 (5.6%) |
| Total | 436 (100.0%) | 445 (100.0%) |
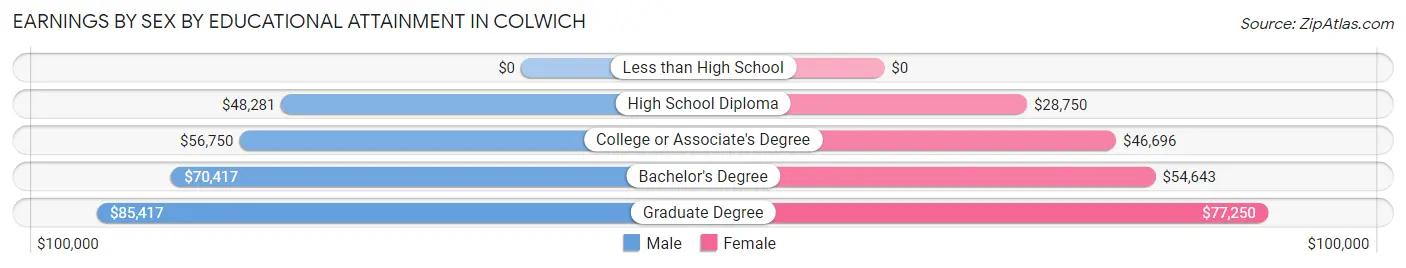
Earnings by Sex by Educational Attainment in Colwich
Average earnings in Colwich are $68,875 for men and $51,389 for women, a difference of 25.4%. Men with an educational attainment of graduate degree enjoy the highest average annual earnings of $85,417, while those with high school diploma education earn the least with $48,281. Women with an educational attainment of graduate degree earn the most with the average annual earnings of $77,250, while those with high school diploma education have the smallest earnings of $28,750.
| Educational Attainment | Male Income | Female Income |
| Less than High School | - | - |
| High School Diploma | $48,281 | $28,750 |
| College or Associate's Degree | $56,750 | $46,696 |
| Bachelor's Degree | $70,417 | $54,643 |
| Graduate Degree | $85,417 | $77,250 |
| Total | $68,875 | $51,389 |
Family Income in Colwich
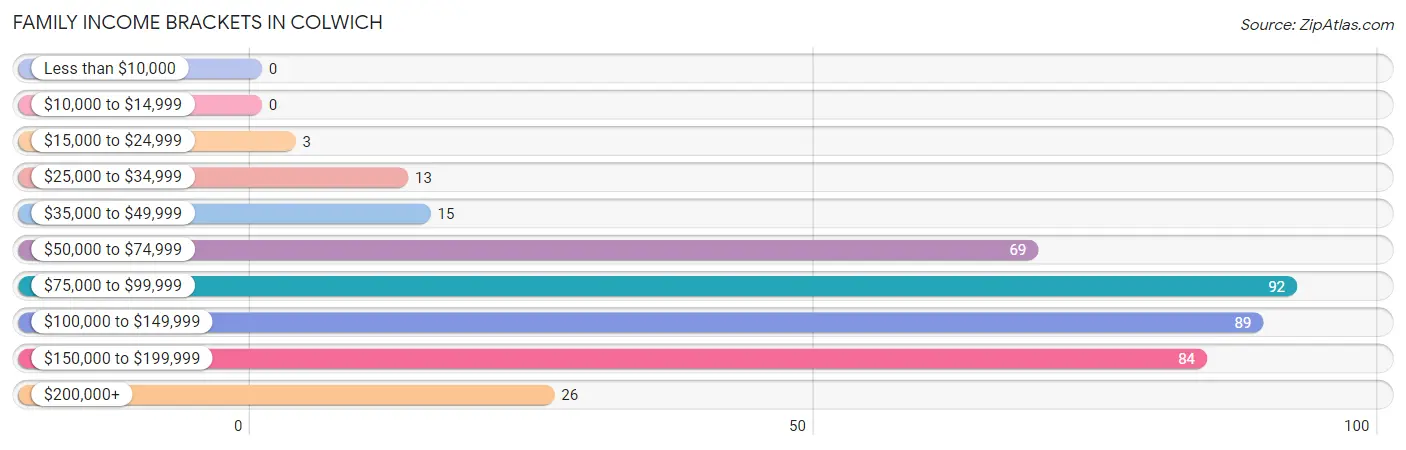
Family Income Brackets in Colwich
According to the Colwich family income data, there are 92 families falling into the $75,000 to $99,999 income range, which is the most common income bracket and makes up 23.5% of all families.
| Income Bracket | # Families | % Families |
| Less than $10,000 | 0 | 0.0% |
| $10,000 to $14,999 | 0 | 0.0% |
| $15,000 to $24,999 | 3 | 0.8% |
| $25,000 to $34,999 | 13 | 3.3% |
| $35,000 to $49,999 | 15 | 3.8% |
| $50,000 to $74,999 | 69 | 17.6% |
| $75,000 to $99,999 | 92 | 23.5% |
| $100,000 to $149,999 | 89 | 22.8% |
| $150,000 to $199,999 | 84 | 21.5% |
| $200,000+ | 26 | 6.6% |
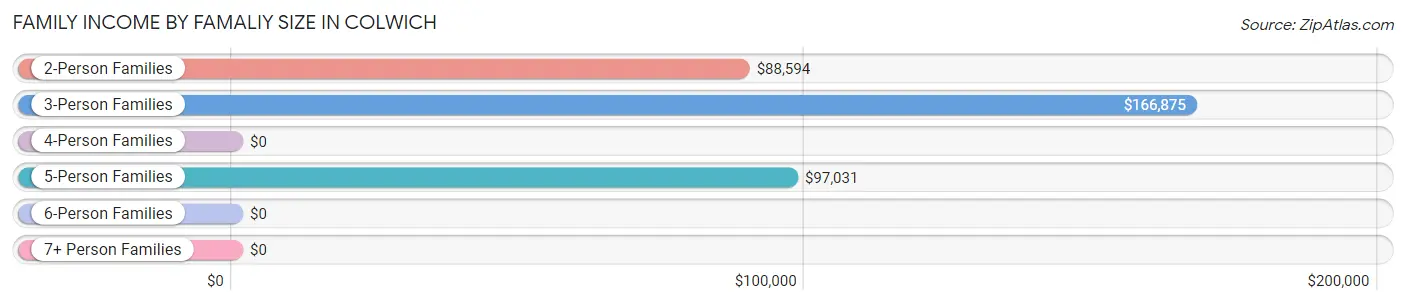
Family Income by Famaliy Size in Colwich
3-person families (85 | 21.7%) account for the highest median family income in Colwich with $166,875 per family, while 3-person families (85 | 21.7%) have the highest median income of $55,625 per family member.
| Income Bracket | # Families | Median Income |
| 2-Person Families | 165 (42.2%) | $88,594 |
| 3-Person Families | 85 (21.7%) | $166,875 |
| 4-Person Families | 77 (19.7%) | $0 |
| 5-Person Families | 51 (13.0%) | $97,031 |
| 6-Person Families | 7 (1.8%) | $0 |
| 7+ Person Families | 6 (1.5%) | $0 |
| Total | 391 (100.0%) | $100,875 |
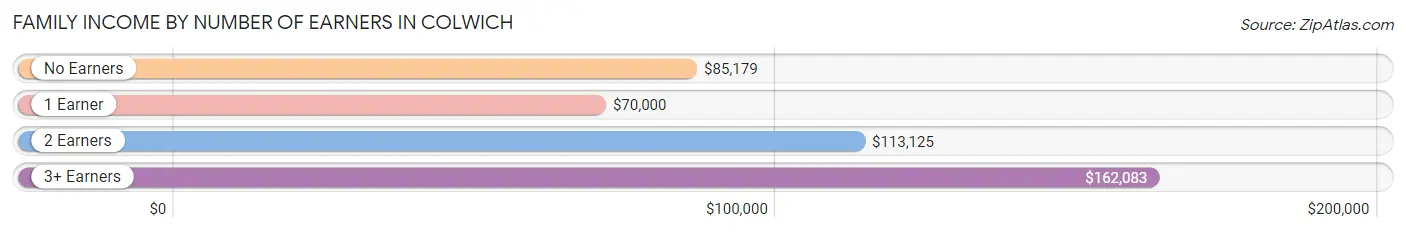
Family Income by Number of Earners in Colwich
The median family income in Colwich is $100,875, with families comprising 3+ earners (55) having the highest median family income of $162,083, while families with 1 earner (86) have the lowest median family income of $70,000, accounting for 14.1% and 22.0% of families, respectively.
| Number of Earners | # Families | Median Income |
| No Earners | 35 (8.9%) | $85,179 |
| 1 Earner | 86 (22.0%) | $70,000 |
| 2 Earners | 215 (55.0%) | $113,125 |
| 3+ Earners | 55 (14.1%) | $162,083 |
| Total | 391 (100.0%) | $100,875 |
Household Income in Colwich
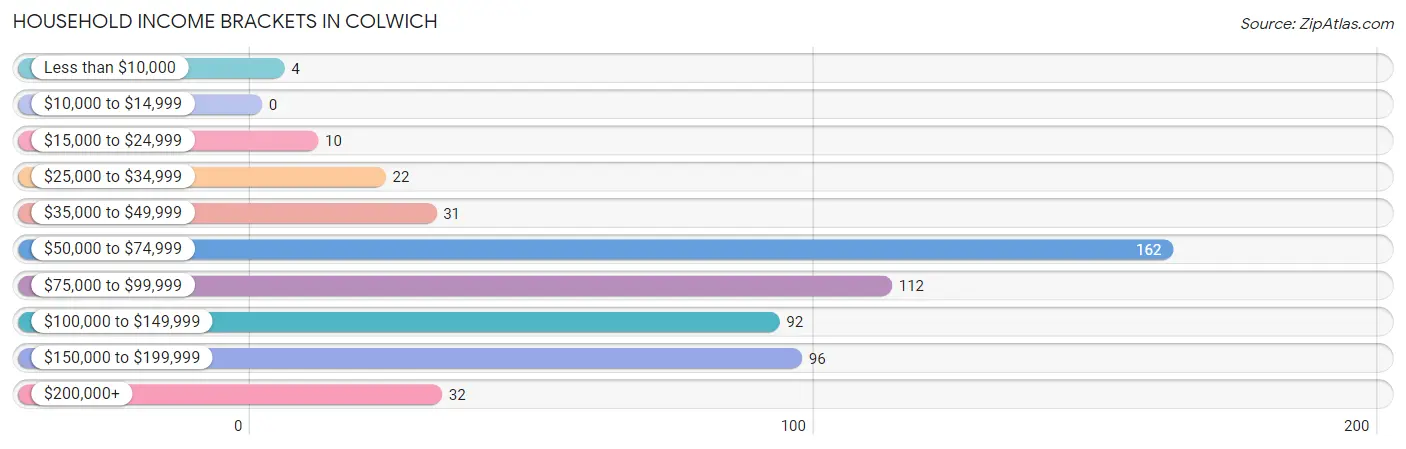
Household Income Brackets in Colwich
With 162 households falling in the category, the $50,000 to $74,999 income range is the most frequent in Colwich, accounting for 28.9% of all households.
| Income Bracket | # Households | % Households |
| Less than $10,000 | 4 | 0.7% |
| $10,000 to $14,999 | 0 | 0.0% |
| $15,000 to $24,999 | 10 | 1.8% |
| $25,000 to $34,999 | 22 | 3.9% |
| $35,000 to $49,999 | 31 | 5.5% |
| $50,000 to $74,999 | 162 | 28.9% |
| $75,000 to $99,999 | 112 | 20.0% |
| $100,000 to $149,999 | 92 | 16.4% |
| $150,000 to $199,999 | 96 | 17.1% |
| $200,000+ | 32 | 5.7% |
Household Income by Householder Age in Colwich
The median household income in Colwich is $84,403, with the highest median household income of $100,000 found in the 45 to 64 years age bracket for the primary householder. A total of 210 households (37.4%) fall into this category. Meanwhile, the 15 to 24 years age bracket for the primary householder has the lowest median household income of $0, with 10 households (1.8%) in this group.
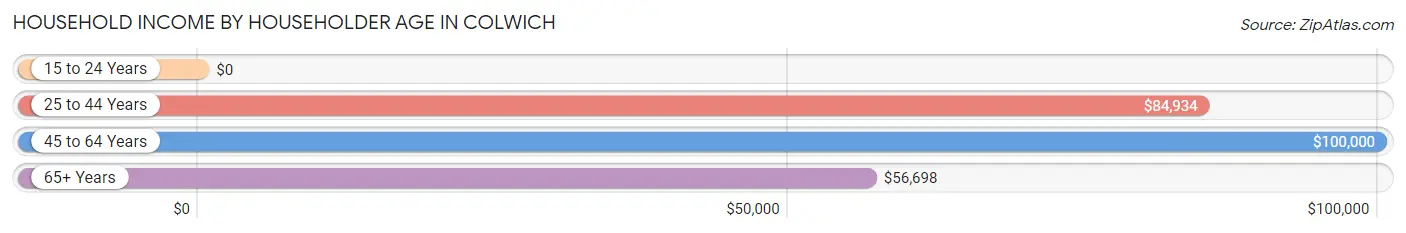
| Income Bracket | # Households | Median Income |
| 15 to 24 Years | 10 (1.8%) | $0 |
| 25 to 44 Years | 190 (33.9%) | $84,934 |
| 45 to 64 Years | 210 (37.4%) | $100,000 |
| 65+ Years | 151 (26.9%) | $56,698 |
| Total | 561 (100.0%) | $84,403 |
Poverty in Colwich
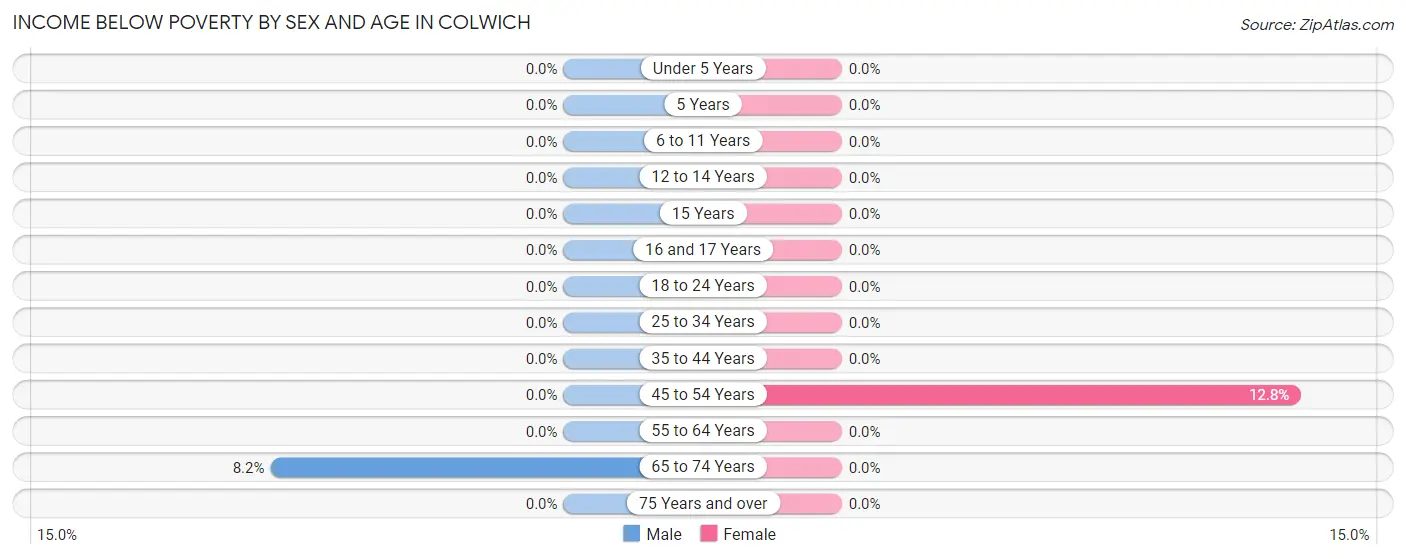
Income Below Poverty by Sex and Age in Colwich
With 0.6% poverty level for males and 1.3% for females among the residents of Colwich, 65 to 74 year old males and 45 to 54 year old females are the most vulnerable to poverty, with 4 males (8.2%) and 11 females (12.8%) in their respective age groups living below the poverty level.
| Age Bracket | Male | Female |
| Under 5 Years | 0 (0.0%) | 0 (0.0%) |
| 5 Years | 0 (0.0%) | 0 (0.0%) |
| 6 to 11 Years | 0 (0.0%) | 0 (0.0%) |
| 12 to 14 Years | 0 (0.0%) | 0 (0.0%) |
| 15 Years | 0 (0.0%) | 0 (0.0%) |
| 16 and 17 Years | 0 (0.0%) | 0 (0.0%) |
| 18 to 24 Years | 0 (0.0%) | 0 (0.0%) |
| 25 to 34 Years | 0 (0.0%) | 0 (0.0%) |
| 35 to 44 Years | 0 (0.0%) | 0 (0.0%) |
| 45 to 54 Years | 0 (0.0%) | 11 (12.8%) |
| 55 to 64 Years | 0 (0.0%) | 0 (0.0%) |
| 65 to 74 Years | 4 (8.2%) | 0 (0.0%) |
| 75 Years and over | 0 (0.0%) | 0 (0.0%) |
| Total | 4 (0.6%) | 11 (1.3%) |
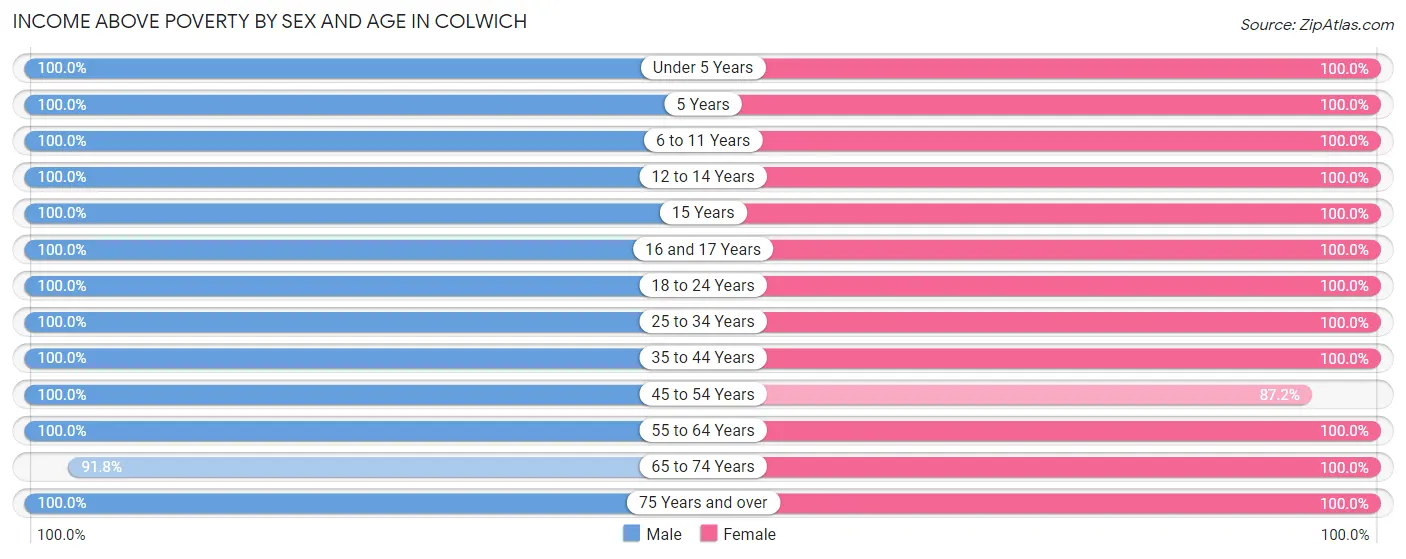
Income Above Poverty by Sex and Age in Colwich
According to the poverty statistics in Colwich, males aged under 5 years and females aged under 5 years are the age groups that are most secure financially, with 100.0% of males and 100.0% of females in these age groups living above the poverty line.
| Age Bracket | Male | Female |
| Under 5 Years | 70 (100.0%) | 50 (100.0%) |
| 5 Years | 3 (100.0%) | 17 (100.0%) |
| 6 to 11 Years | 58 (100.0%) | 42 (100.0%) |
| 12 to 14 Years | 31 (100.0%) | 50 (100.0%) |
| 15 Years | 6 (100.0%) | 7 (100.0%) |
| 16 and 17 Years | 14 (100.0%) | 34 (100.0%) |
| 18 to 24 Years | 48 (100.0%) | 105 (100.0%) |
| 25 to 34 Years | 114 (100.0%) | 91 (100.0%) |
| 35 to 44 Years | 65 (100.0%) | 92 (100.0%) |
| 45 to 54 Years | 103 (100.0%) | 75 (87.2%) |
| 55 to 64 Years | 84 (100.0%) | 100 (100.0%) |
| 65 to 74 Years | 45 (91.8%) | 59 (100.0%) |
| 75 Years and over | 44 (100.0%) | 85 (100.0%) |
| Total | 685 (99.4%) | 807 (98.7%) |
Income Below Poverty Among Married-Couple Families in Colwich
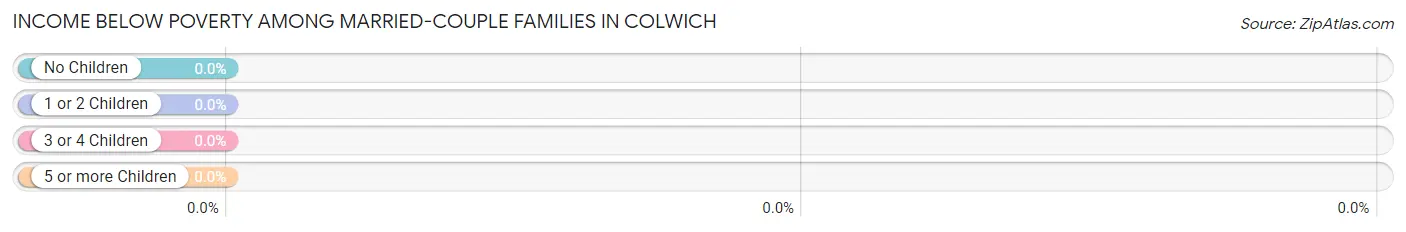
| Children | Above Poverty | Below Poverty |
| No Children | 177 (100.0%) | 0 (0.0%) |
| 1 or 2 Children | 89 (100.0%) | 0 (0.0%) |
| 3 or 4 Children | 25 (100.0%) | 0 (0.0%) |
| 5 or more Children | 4 (100.0%) | 0 (0.0%) |
| Total | 295 (100.0%) | 0 (0.0%) |
Income Below Poverty Among Single-Parent Households in Colwich
| Children | Single Father | Single Mother |
| No Children | 0 (0.0%) | 0 (0.0%) |
| 1 or 2 Children | 0 (0.0%) | 0 (0.0%) |
| 3 or 4 Children | 0 (0.0%) | 0 (0.0%) |
| 5 or more Children | 0 (0.0%) | 0 (0.0%) |
| Total | 0 (0.0%) | 0 (0.0%) |
Income Below Poverty Among Married-Couple vs Single-Parent Households in Colwich
| Children | Married-Couple Families | Single-Parent Households |
| No Children | 0 (0.0%) | 0 (0.0%) |
| 1 or 2 Children | 0 (0.0%) | 0 (0.0%) |
| 3 or 4 Children | 0 (0.0%) | 0 (0.0%) |
| 5 or more Children | 0 (0.0%) | 0 (0.0%) |
| Total | 0 (0.0%) | 0 (0.0%) |
Race in Colwich
The most populous races in Colwich are White / Caucasian (1,420 | 93.9%), Hispanic or Latino (77 | 5.1%), and Two or more Races (52 | 3.4%).
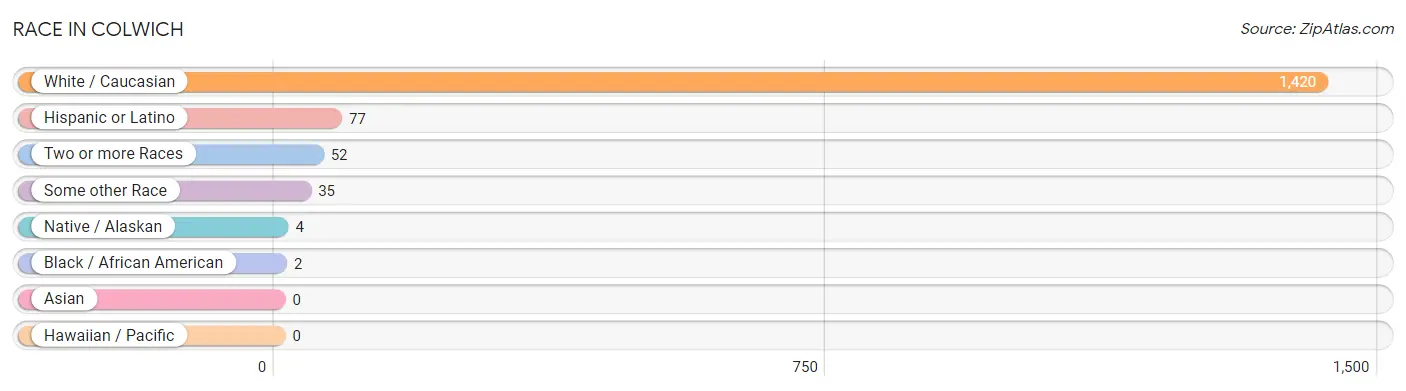
| Race | # Population | % Population |
| Asian | 0 | 0.0% |
| Black / African American | 2 | 0.1% |
| Hawaiian / Pacific | 0 | 0.0% |
| Hispanic or Latino | 77 | 5.1% |
| Native / Alaskan | 4 | 0.3% |
| White / Caucasian | 1,420 | 93.9% |
| Two or more Races | 52 | 3.4% |
| Some other Race | 35 | 2.3% |
| Total | 1,513 | 100.0% |
Ancestry in Colwich
The most populous ancestries reported in Colwich are German (651 | 43.0%), Irish (191 | 12.6%), American (101 | 6.7%), Mexican (77 | 5.1%), and French (61 | 4.0%), together accounting for 71.4% of all Colwich residents.
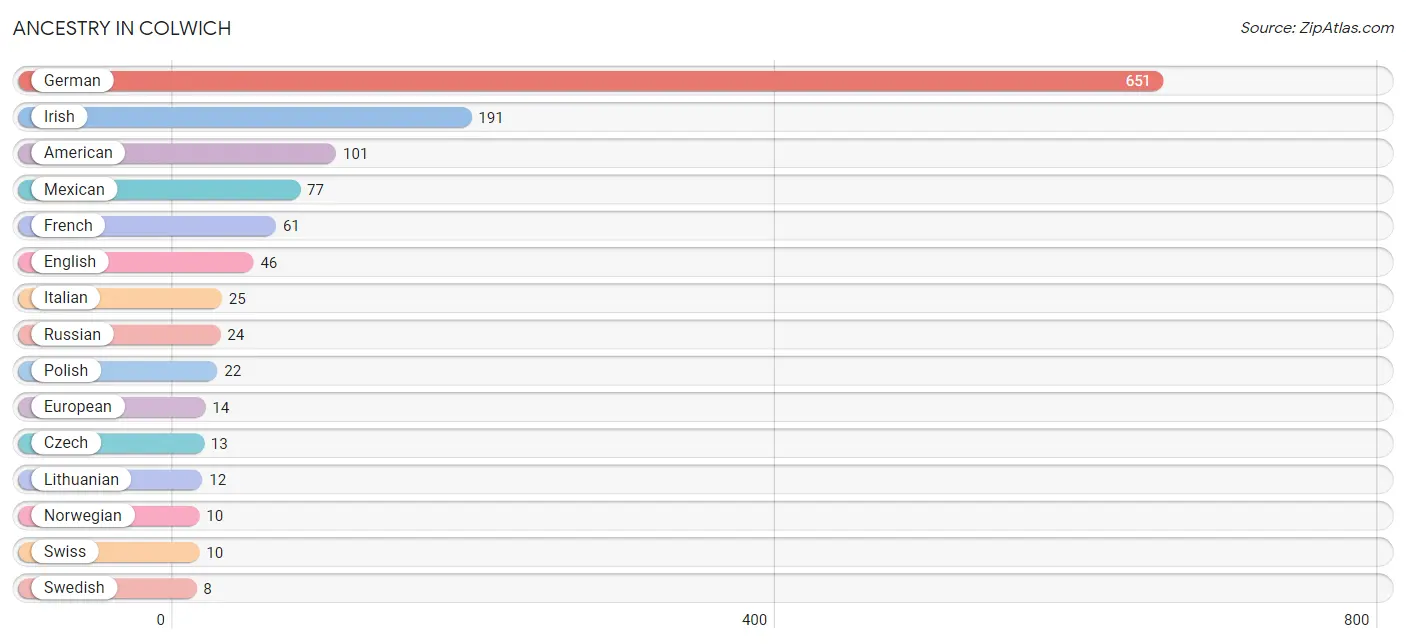
| Ancestry | # Population | % Population |
| African | 2 | 0.1% |
| American | 101 | 6.7% |
| Austrian | 6 | 0.4% |
| Cherokee | 2 | 0.1% |
| Cheyenne | 1 | 0.1% |
| Creek | 4 | 0.3% |
| Czech | 13 | 0.9% |
| Danish | 3 | 0.2% |
| Dutch | 2 | 0.1% |
| English | 46 | 3.0% |
| European | 14 | 0.9% |
| French | 61 | 4.0% |
| French Canadian | 6 | 0.4% |
| German | 651 | 43.0% |
| Hungarian | 3 | 0.2% |
| Irish | 191 | 12.6% |
| Italian | 25 | 1.7% |
| Lithuanian | 12 | 0.8% |
| Mexican | 77 | 5.1% |
| Norwegian | 10 | 0.7% |
| Polish | 22 | 1.5% |
| Russian | 24 | 1.6% |
| Scandinavian | 4 | 0.3% |
| Scottish | 7 | 0.5% |
| Slavic | 2 | 0.1% |
| Subsaharan African | 2 | 0.1% |
| Swedish | 8 | 0.5% |
| Swiss | 10 | 0.7% |
| Welsh | 3 | 0.2% | View All 29 Rows |
Immigrants in Colwich
The most numerous immigrant groups reported in Colwich came from Central America (8 | 0.5%), Latin America (8 | 0.5%), Mexico (8 | 0.5%), Eastern Europe (4 | 0.3%), and Europe (4 | 0.3%), together accounting for 2.1% of all Colwich residents.
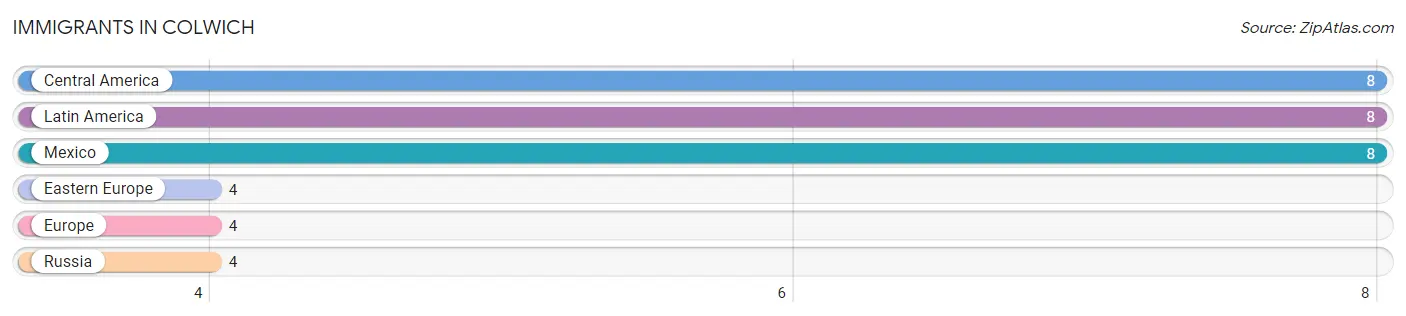
| Immigration Origin | # Population | % Population |
| Central America | 8 | 0.5% |
| Eastern Europe | 4 | 0.3% |
| Europe | 4 | 0.3% |
| Latin America | 8 | 0.5% |
| Mexico | 8 | 0.5% |
| Russia | 4 | 0.3% | View All 6 Rows |
Sex and Age in Colwich
Sex and Age in Colwich
The most populous age groups in Colwich are Under 5 Years (73 | 10.5%) for men and 20 to 24 Years (79 | 9.7%) for women.
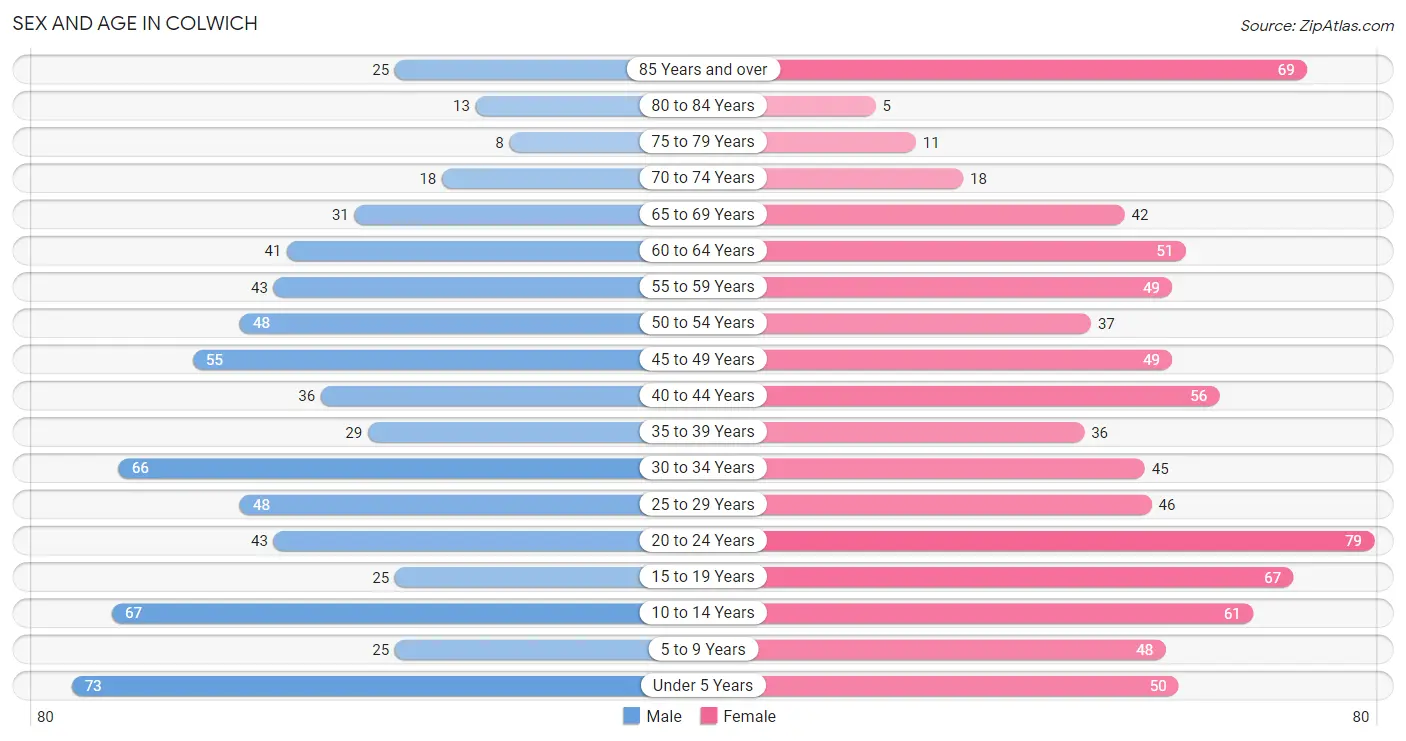
| Age Bracket | Male | Female |
| Under 5 Years | 73 (10.5%) | 50 (6.1%) |
| 5 to 9 Years | 25 (3.6%) | 48 (5.9%) |
| 10 to 14 Years | 67 (9.7%) | 61 (7.4%) |
| 15 to 19 Years | 25 (3.6%) | 67 (8.2%) |
| 20 to 24 Years | 43 (6.2%) | 79 (9.7%) |
| 25 to 29 Years | 48 (6.9%) | 46 (5.6%) |
| 30 to 34 Years | 66 (9.5%) | 45 (5.5%) |
| 35 to 39 Years | 29 (4.2%) | 36 (4.4%) |
| 40 to 44 Years | 36 (5.2%) | 56 (6.8%) |
| 45 to 49 Years | 55 (7.9%) | 49 (6.0%) |
| 50 to 54 Years | 48 (6.9%) | 37 (4.5%) |
| 55 to 59 Years | 43 (6.2%) | 49 (6.0%) |
| 60 to 64 Years | 41 (5.9%) | 51 (6.2%) |
| 65 to 69 Years | 31 (4.5%) | 42 (5.1%) |
| 70 to 74 Years | 18 (2.6%) | 18 (2.2%) |
| 75 to 79 Years | 8 (1.1%) | 11 (1.3%) |
| 80 to 84 Years | 13 (1.9%) | 5 (0.6%) |
| 85 Years and over | 25 (3.6%) | 69 (8.4%) |
| Total | 694 (100.0%) | 819 (100.0%) |
Families and Households in Colwich
Median Family Size in Colwich
The median family size in Colwich is 3.27 persons per family, with single female/mother families (60 | 15.3%) accounting for the largest median family size of 3.5 persons per family. On the other hand, married-couple families (295 | 75.4%) represent the smallest median family size with 3.20 persons per family.
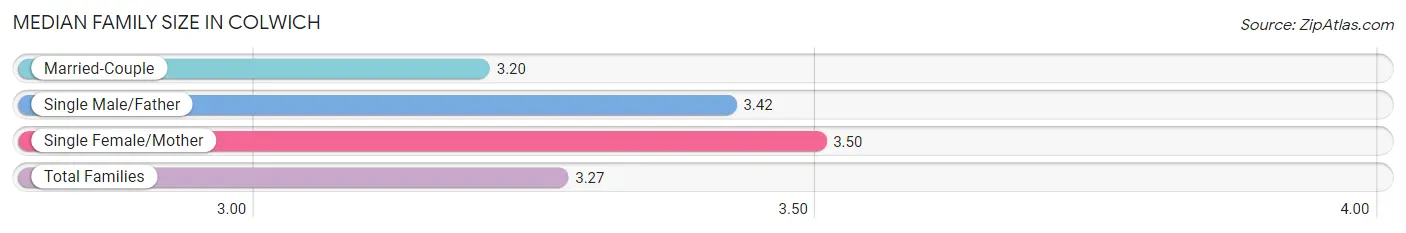
| Family Type | # Families | Family Size |
| Married-Couple | 295 (75.4%) | 3.20 |
| Single Male/Father | 36 (9.2%) | 3.42 |
| Single Female/Mother | 60 (15.3%) | 3.50 |
| Total Families | 391 (100.0%) | 3.27 |
Median Household Size in Colwich
The median household size in Colwich is 2.69 persons per household, with single male/father households (36 | 6.4%) accounting for the largest median household size of 3.83 persons per household. non-family households (170 | 30.3%) represent the smallest median household size with 1.09 persons per household.
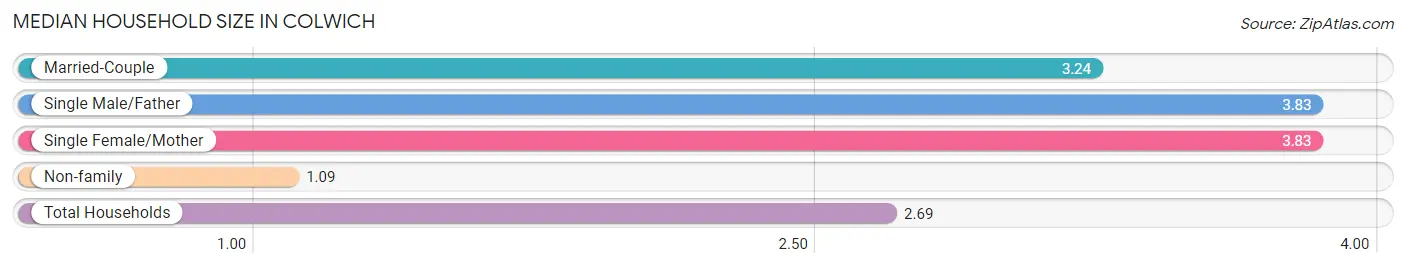
| Household Type | # Households | Household Size |
| Married-Couple | 295 (52.6%) | 3.24 |
| Single Male/Father | 36 (6.4%) | 3.83 |
| Single Female/Mother | 60 (10.7%) | 3.83 |
| Non-family | 170 (30.3%) | 1.09 |
| Total Households | 561 (100.0%) | 2.69 |
Household Size by Marriage Status in Colwich
Out of a total of 561 households in Colwich, 391 (69.7%) are family households, while 170 (30.3%) are nonfamily households. The most numerous type of family households are 2-person households, comprising 155, and the most common type of nonfamily households are 1-person households, comprising 161.
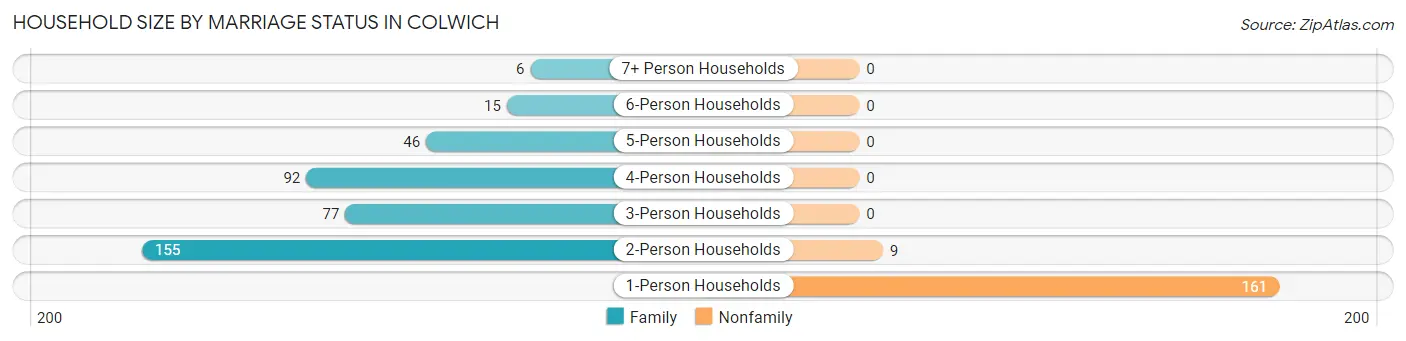
| Household Size | Family Households | Nonfamily Households |
| 1-Person Households | - | 161 (28.7%) |
| 2-Person Households | 155 (27.6%) | 9 (1.6%) |
| 3-Person Households | 77 (13.7%) | 0 (0.0%) |
| 4-Person Households | 92 (16.4%) | 0 (0.0%) |
| 5-Person Households | 46 (8.2%) | 0 (0.0%) |
| 6-Person Households | 15 (2.7%) | 0 (0.0%) |
| 7+ Person Households | 6 (1.1%) | 0 (0.0%) |
| Total | 391 (69.7%) | 170 (30.3%) |
Female Fertility in Colwich
Fertility by Age in Colwich
Average fertility rate in Colwich is 82.0 births per 1,000 women. Women in the age bracket of 20 to 34 years have the highest fertility rate with 129.0 births per 1,000 women. Women in the age bracket of 20 to 34 years acount for 71.0% of all women with births.
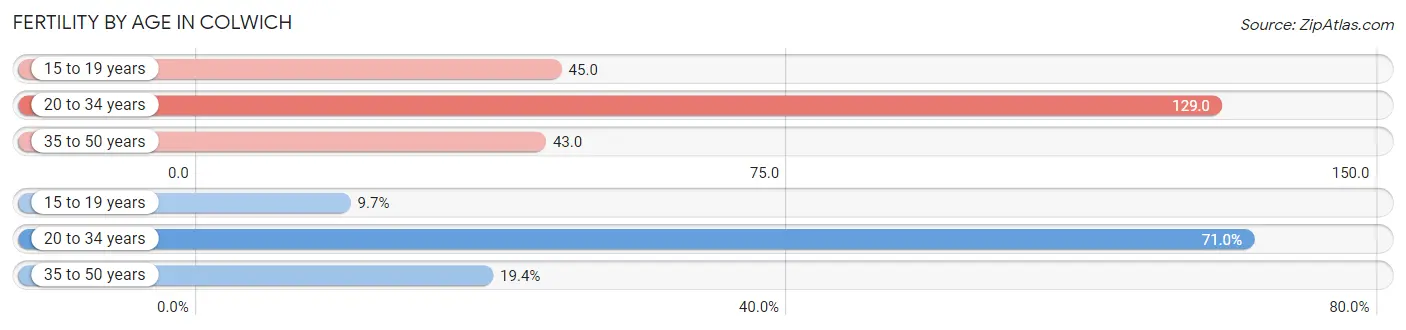
| Age Bracket | Women with Births | Births / 1,000 Women |
| 15 to 19 years | 3 (9.7%) | 45.0 |
| 20 to 34 years | 22 (71.0%) | 129.0 |
| 35 to 50 years | 6 (19.4%) | 43.0 |
| Total | 31 (100.0%) | 82.0 |
Fertility by Age by Marriage Status in Colwich
90.3% of women with births (31) in Colwich are married. The highest percentage of unmarried women with births falls into 15 to 19 years age bracket with 100.0% of them unmarried at the time of birth, while the lowest percentage of unmarried women with births belong to 20 to 34 years age bracket with 0.0% of them unmarried.
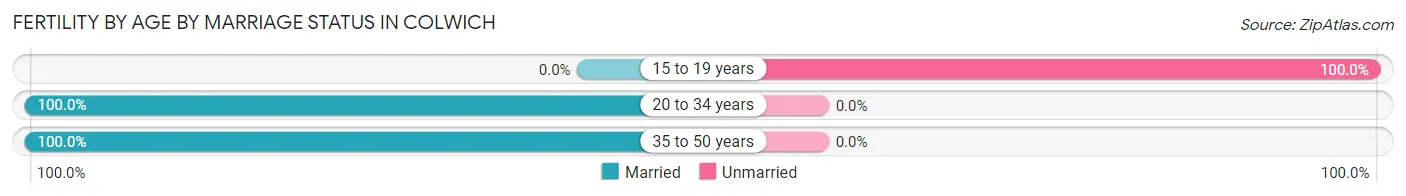
| Age Bracket | Married | Unmarried |
| 15 to 19 years | 0 (0.0%) | 3 (100.0%) |
| 20 to 34 years | 22 (100.0%) | 0 (0.0%) |
| 35 to 50 years | 6 (100.0%) | 0 (0.0%) |
| Total | 28 (90.3%) | 3 (9.7%) |
Fertility by Education in Colwich
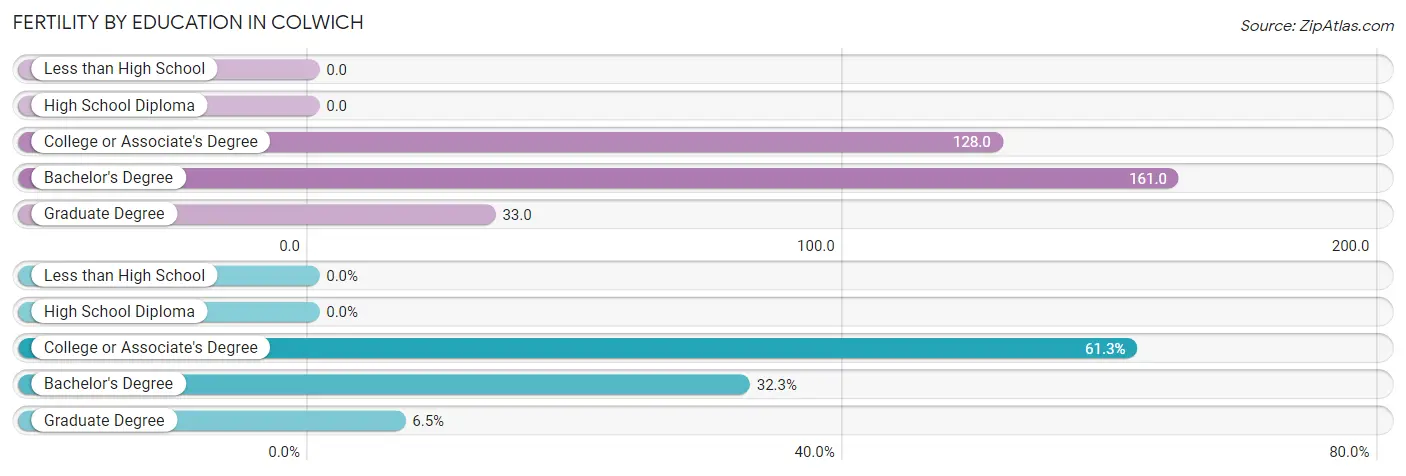
| Educational Attainment | Women with Births | Births / 1,000 Women |
| Less than High School | 0 (0.0%) | 0.0 |
| High School Diploma | 0 (0.0%) | 0.0 |
| College or Associate's Degree | 19 (61.3%) | 128.0 |
| Bachelor's Degree | 10 (32.3%) | 161.0 |
| Graduate Degree | 2 (6.5%) | 33.0 |
| Total | 31 (100.0%) | 82.0 |
Fertility by Education by Marriage Status in Colwich
9.7% of women with births in Colwich are unmarried. Women with the educational attainment of bachelor's degree are most likely to be married with 100.0% of them married at childbirth, while women with the educational attainment of college or associate's degree are least likely to be married with 15.8% of them unmarried at childbirth.
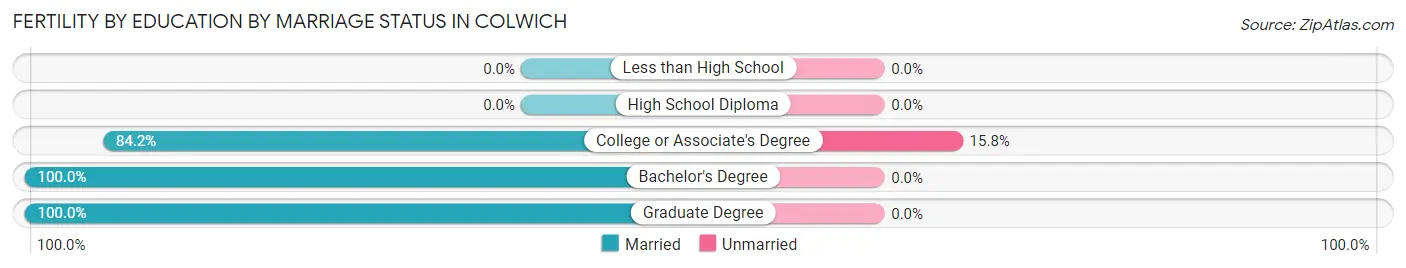
| Educational Attainment | Married | Unmarried |
| Less than High School | 0 (0.0%) | 0 (0.0%) |
| High School Diploma | 0 (0.0%) | 0 (0.0%) |
| College or Associate's Degree | 16 (84.2%) | 3 (15.8%) |
| Bachelor's Degree | 10 (100.0%) | 0 (0.0%) |
| Graduate Degree | 2 (100.0%) | 0 (0.0%) |
| Total | 28 (90.3%) | 3 (9.7%) |
Employment Characteristics in Colwich
Employment by Class of Employer in Colwich
Among the 771 employed individuals in Colwich, private company employees (521 | 67.6%), local government employees (81 | 10.5%), and not-for-profit organizations (70 | 9.1%) make up the most common classes of employment.
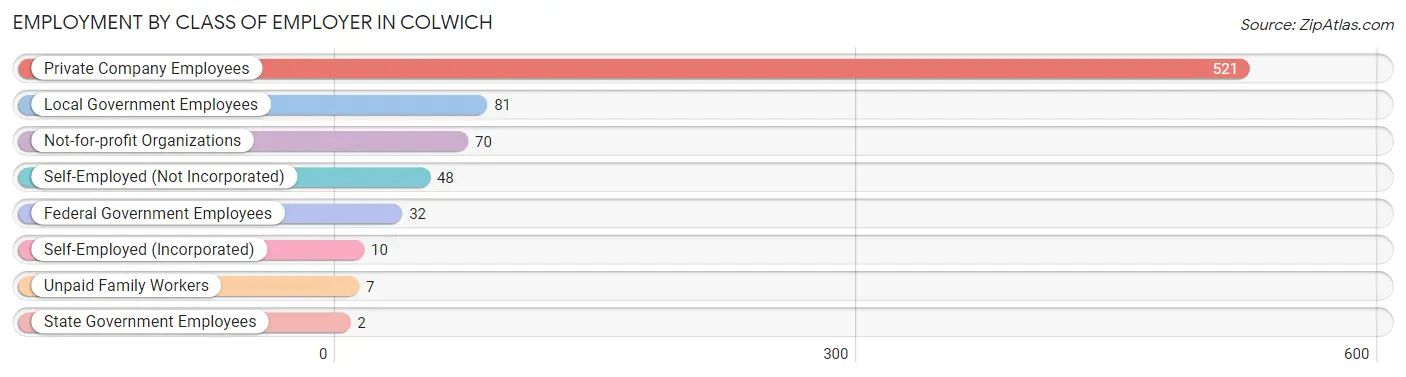
| Employer Class | # Employees | % Employees |
| Private Company Employees | 521 | 67.6% |
| Self-Employed (Incorporated) | 10 | 1.3% |
| Self-Employed (Not Incorporated) | 48 | 6.2% |
| Not-for-profit Organizations | 70 | 9.1% |
| Local Government Employees | 81 | 10.5% |
| State Government Employees | 2 | 0.3% |
| Federal Government Employees | 32 | 4.2% |
| Unpaid Family Workers | 7 | 0.9% |
| Total | 771 | 100.0% |
Employment Status by Age in Colwich
According to the labor force statistics for Colwich, out of the total population over 16 years of age (1,176), 73.0% or 858 individuals are in the labor force, with 8.4% or 72 of them unemployed. The age group with the highest labor force participation rate is 30 to 34 years, with 97.3% or 108 individuals in the labor force. Within the labor force, the 20 to 24 years age range has the highest percentage of unemployed individuals, with 43.1% or 50 of them being unemployed.
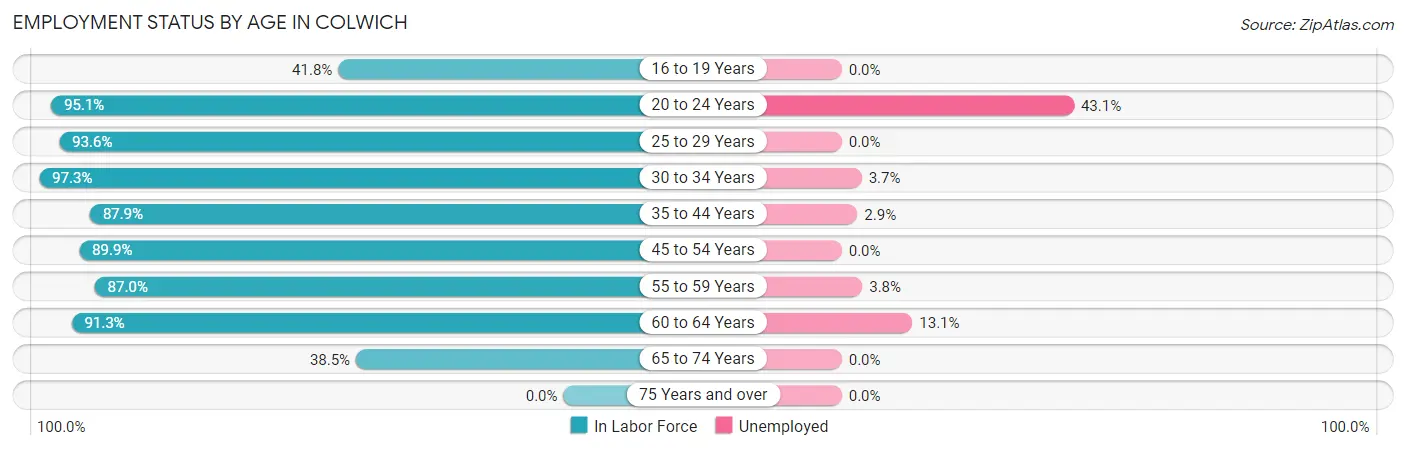
| Age Bracket | In Labor Force | Unemployed |
| 16 to 19 Years | 33 (41.8%) | 0 (0.0%) |
| 20 to 24 Years | 116 (95.1%) | 50 (43.1%) |
| 25 to 29 Years | 88 (93.6%) | 0 (0.0%) |
| 30 to 34 Years | 108 (97.3%) | 4 (3.7%) |
| 35 to 44 Years | 138 (87.9%) | 4 (2.9%) |
| 45 to 54 Years | 170 (89.9%) | 0 (0.0%) |
| 55 to 59 Years | 80 (87.0%) | 3 (3.8%) |
| 60 to 64 Years | 84 (91.3%) | 11 (13.1%) |
| 65 to 74 Years | 42 (38.5%) | 0 (0.0%) |
| 75 Years and over | 0 (0.0%) | 0 (0.0%) |
| Total | 858 (73.0%) | 72 (8.4%) |
Employment Status by Educational Attainment in Colwich
According to labor force statistics for Colwich, 90.9% of individuals (668) out of the total population between 25 and 64 years of age (735) are in the labor force, with 3.3% or 22 of them being unemployed. The group with the highest labor force participation rate are those with the educational attainment of bachelor's degree or higher, with 92.4% or 314 individuals in the labor force. Within the labor force, individuals with less than high school education have the highest percentage of unemployment, with 36.4% or 4 of them being unemployed.
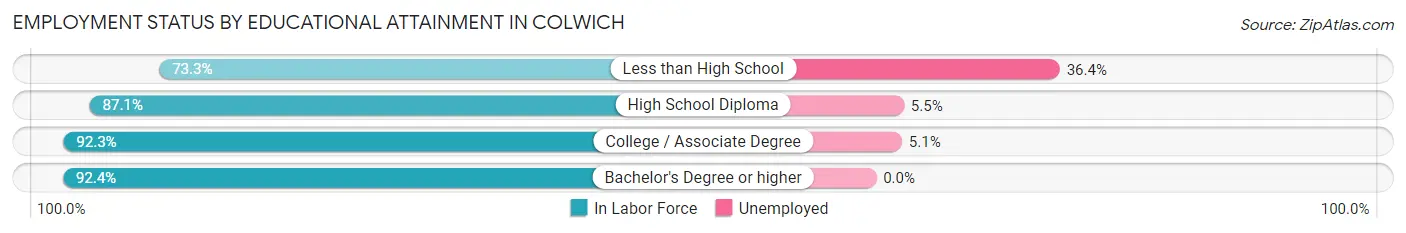
| Educational Attainment | In Labor Force | Unemployed |
| Less than High School | 11 (73.3%) | 5 (36.4%) |
| High School Diploma | 128 (87.1%) | 8 (5.5%) |
| College / Associate Degree | 215 (92.3%) | 12 (5.1%) |
| Bachelor's Degree or higher | 314 (92.4%) | 0 (0.0%) |
| Total | 668 (90.9%) | 24 (3.3%) |
Employment Occupations by Sex in Colwich
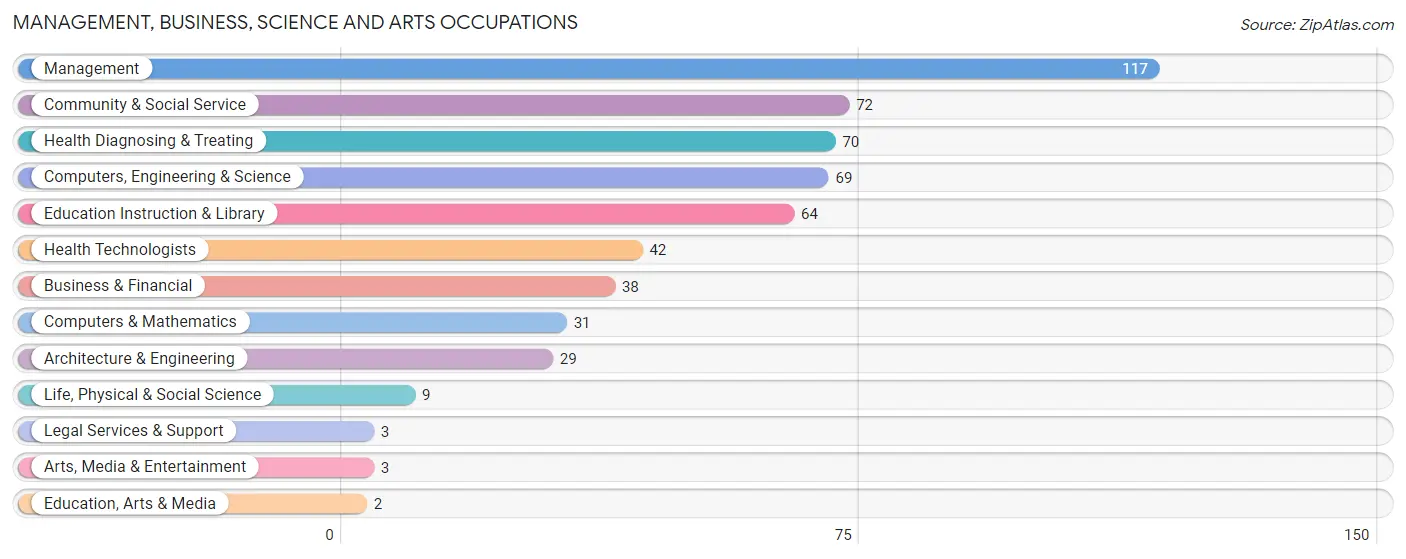
Management, Business, Science and Arts Occupations
The most common Management, Business, Science and Arts occupations in Colwich are Management (117 | 14.9%), Community & Social Service (72 | 9.1%), Health Diagnosing & Treating (70 | 8.9%), Computers, Engineering & Science (69 | 8.8%), and Education Instruction & Library (64 | 8.1%).
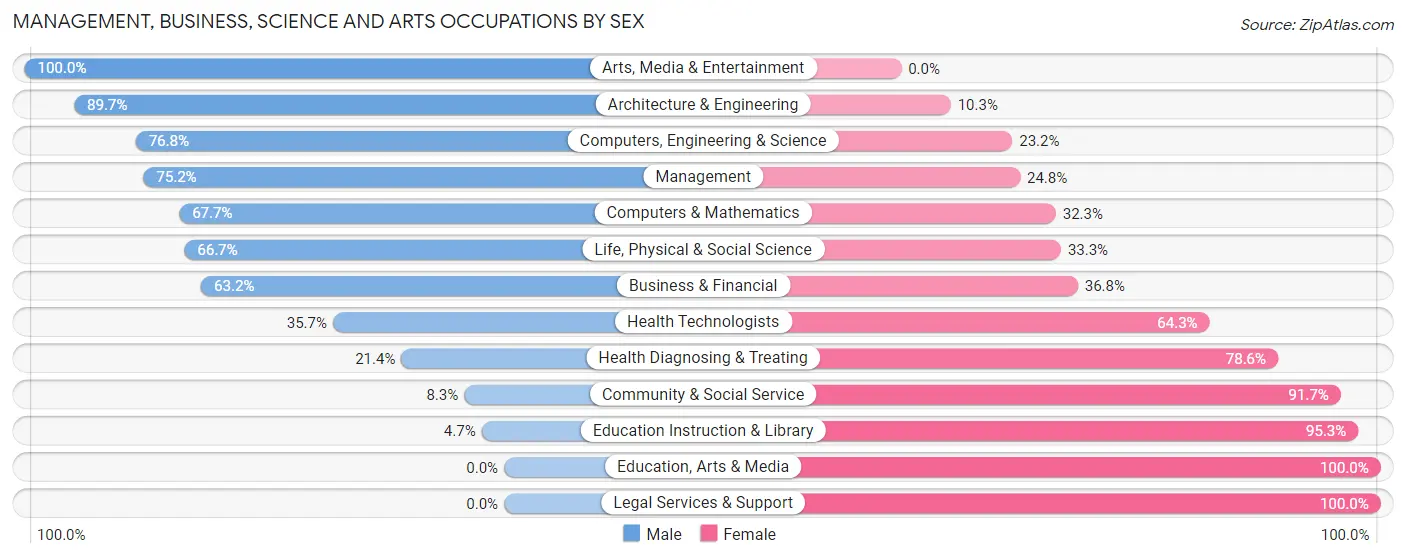
Management, Business, Science and Arts Occupations by Sex
Within the Management, Business, Science and Arts occupations in Colwich, the most male-oriented occupations are Arts, Media & Entertainment (100.0%), Architecture & Engineering (89.7%), and Computers, Engineering & Science (76.8%), while the most female-oriented occupations are Education, Arts & Media (100.0%), Legal Services & Support (100.0%), and Education Instruction & Library (95.3%).
| Occupation | Male | Female |
| Management | 88 (75.2%) | 29 (24.8%) |
| Business & Financial | 24 (63.2%) | 14 (36.8%) |
| Computers, Engineering & Science | 53 (76.8%) | 16 (23.2%) |
| Computers & Mathematics | 21 (67.7%) | 10 (32.3%) |
| Architecture & Engineering | 26 (89.7%) | 3 (10.3%) |
| Life, Physical & Social Science | 6 (66.7%) | 3 (33.3%) |
| Community & Social Service | 6 (8.3%) | 66 (91.7%) |
| Education, Arts & Media | 0 (0.0%) | 2 (100.0%) |
| Legal Services & Support | 0 (0.0%) | 3 (100.0%) |
| Education Instruction & Library | 3 (4.7%) | 61 (95.3%) |
| Arts, Media & Entertainment | 3 (100.0%) | 0 (0.0%) |
| Health Diagnosing & Treating | 15 (21.4%) | 55 (78.6%) |
| Health Technologists | 15 (35.7%) | 27 (64.3%) |
| Total (Category) | 186 (50.8%) | 180 (49.2%) |
| Total (Overall) | 403 (51.2%) | 384 (48.8%) |
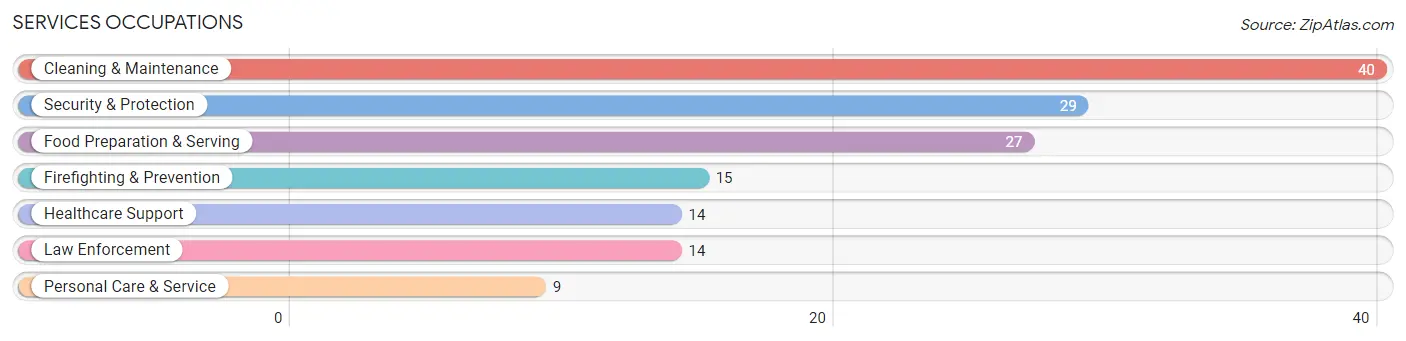
Services Occupations
The most common Services occupations in Colwich are Cleaning & Maintenance (40 | 5.1%), Security & Protection (29 | 3.7%), Food Preparation & Serving (27 | 3.4%), Firefighting & Prevention (15 | 1.9%), and Healthcare Support (14 | 1.8%).
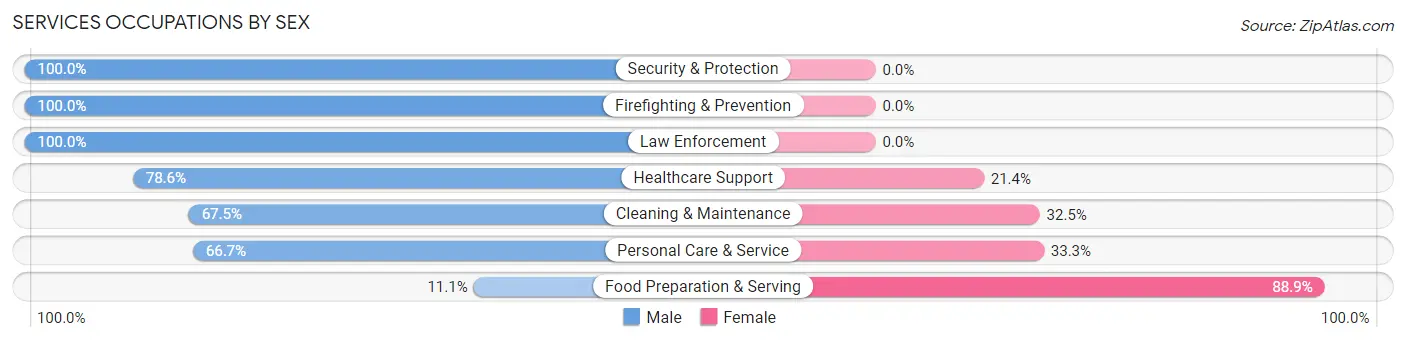
Services Occupations by Sex
Within the Services occupations in Colwich, the most male-oriented occupations are Security & Protection (100.0%), Firefighting & Prevention (100.0%), and Law Enforcement (100.0%), while the most female-oriented occupations are Food Preparation & Serving (88.9%), Personal Care & Service (33.3%), and Cleaning & Maintenance (32.5%).
| Occupation | Male | Female |
| Healthcare Support | 11 (78.6%) | 3 (21.4%) |
| Security & Protection | 29 (100.0%) | 0 (0.0%) |
| Firefighting & Prevention | 15 (100.0%) | 0 (0.0%) |
| Law Enforcement | 14 (100.0%) | 0 (0.0%) |
| Food Preparation & Serving | 3 (11.1%) | 24 (88.9%) |
| Cleaning & Maintenance | 27 (67.5%) | 13 (32.5%) |
| Personal Care & Service | 6 (66.7%) | 3 (33.3%) |
| Total (Category) | 76 (63.9%) | 43 (36.1%) |
| Total (Overall) | 403 (51.2%) | 384 (48.8%) |
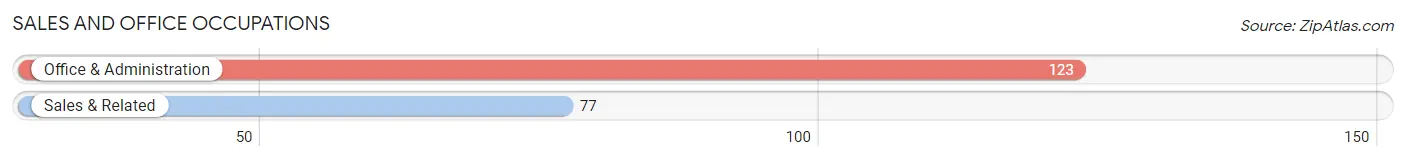
Sales and Office Occupations
The most common Sales and Office occupations in Colwich are Office & Administration (123 | 15.6%), and Sales & Related (77 | 9.8%).
Sales and Office Occupations by Sex
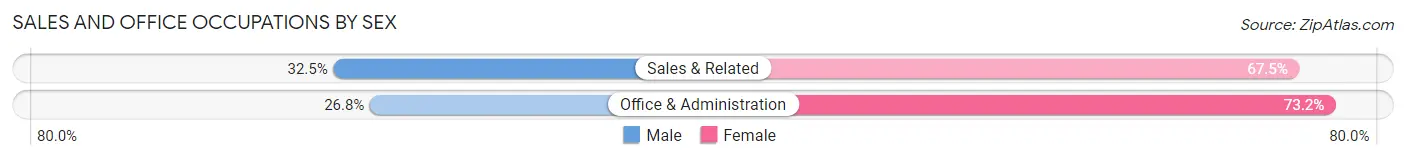
| Occupation | Male | Female |
| Sales & Related | 25 (32.5%) | 52 (67.5%) |
| Office & Administration | 33 (26.8%) | 90 (73.2%) |
| Total (Category) | 58 (29.0%) | 142 (71.0%) |
| Total (Overall) | 403 (51.2%) | 384 (48.8%) |
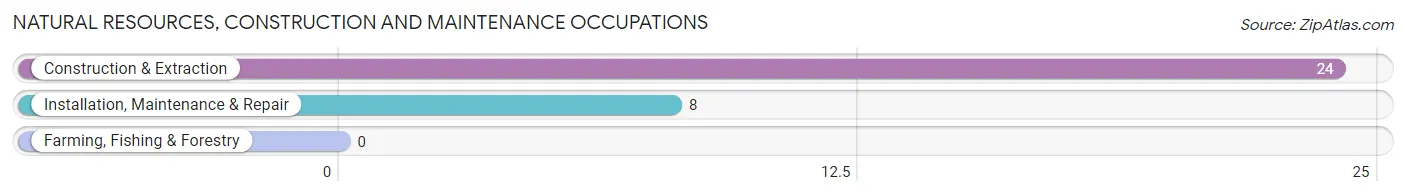
Natural Resources, Construction and Maintenance Occupations
The most common Natural Resources, Construction and Maintenance occupations in Colwich are Construction & Extraction (24 | 3.0%), and Installation, Maintenance & Repair (8 | 1.0%).
Natural Resources, Construction and Maintenance Occupations by Sex
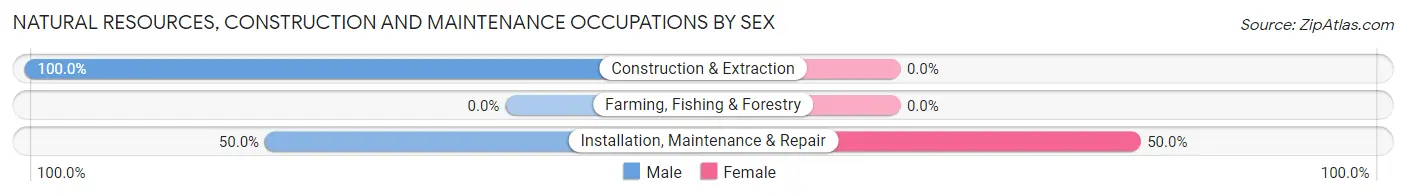
| Occupation | Male | Female |
| Farming, Fishing & Forestry | 0 (0.0%) | 0 (0.0%) |
| Construction & Extraction | 24 (100.0%) | 0 (0.0%) |
| Installation, Maintenance & Repair | 4 (50.0%) | 4 (50.0%) |
| Total (Category) | 28 (87.5%) | 4 (12.5%) |
| Total (Overall) | 403 (51.2%) | 384 (48.8%) |
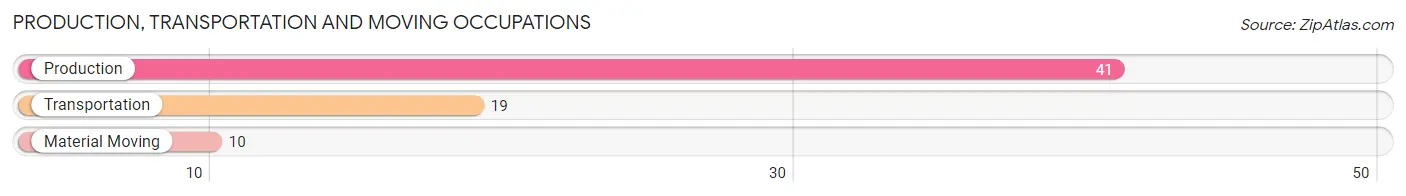
Production, Transportation and Moving Occupations
The most common Production, Transportation and Moving occupations in Colwich are Production (41 | 5.2%), Transportation (19 | 2.4%), and Material Moving (10 | 1.3%).
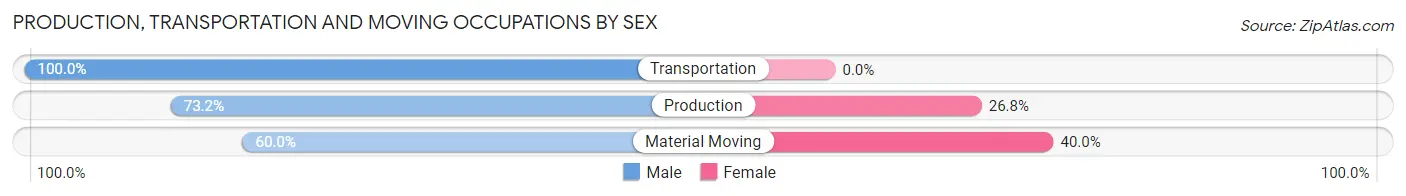
Production, Transportation and Moving Occupations by Sex
| Occupation | Male | Female |
| Production | 30 (73.2%) | 11 (26.8%) |
| Transportation | 19 (100.0%) | 0 (0.0%) |
| Material Moving | 6 (60.0%) | 4 (40.0%) |
| Total (Category) | 55 (78.6%) | 15 (21.4%) |
| Total (Overall) | 403 (51.2%) | 384 (48.8%) |
Employment Industries by Sex in Colwich
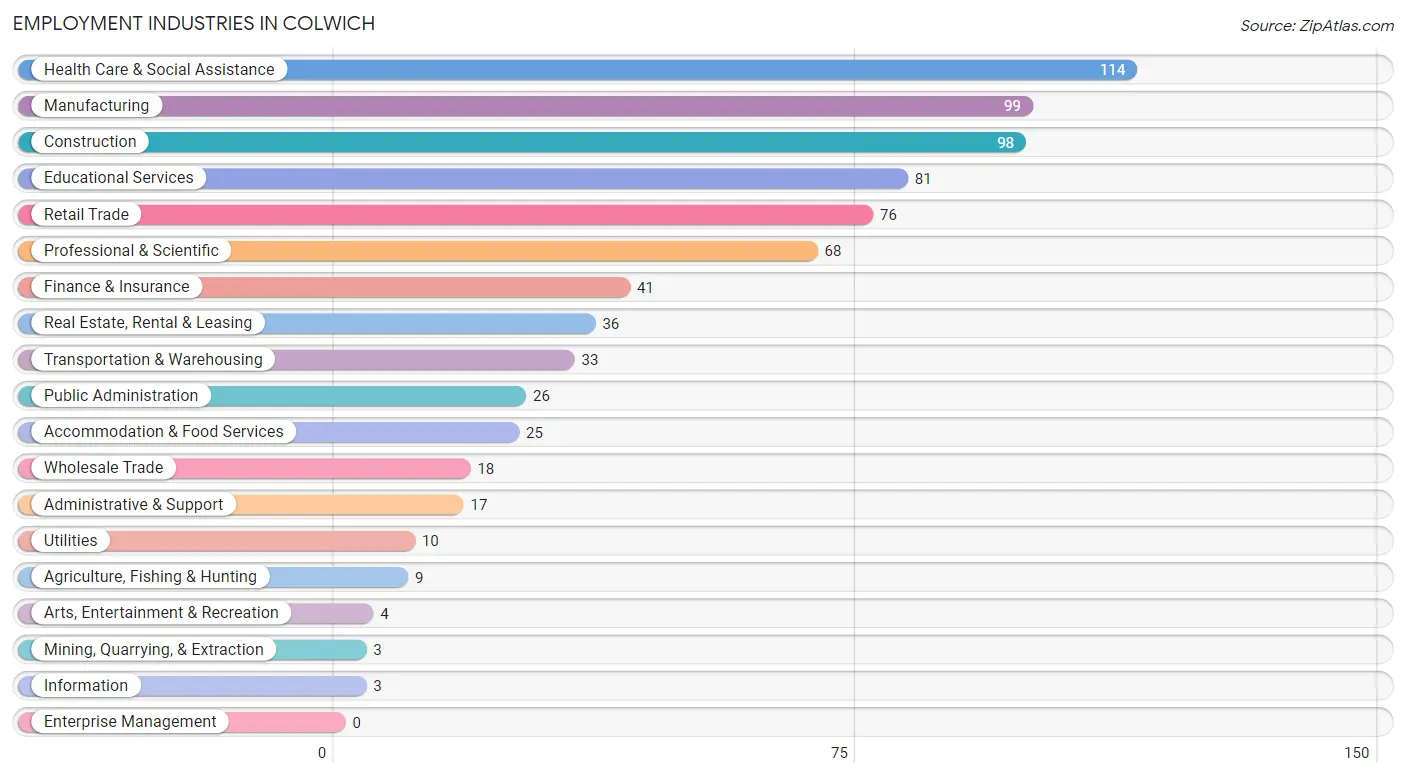
Employment Industries in Colwich
The major employment industries in Colwich include Health Care & Social Assistance (114 | 14.5%), Manufacturing (99 | 12.6%), Construction (98 | 12.4%), Educational Services (81 | 10.3%), and Retail Trade (76 | 9.7%).
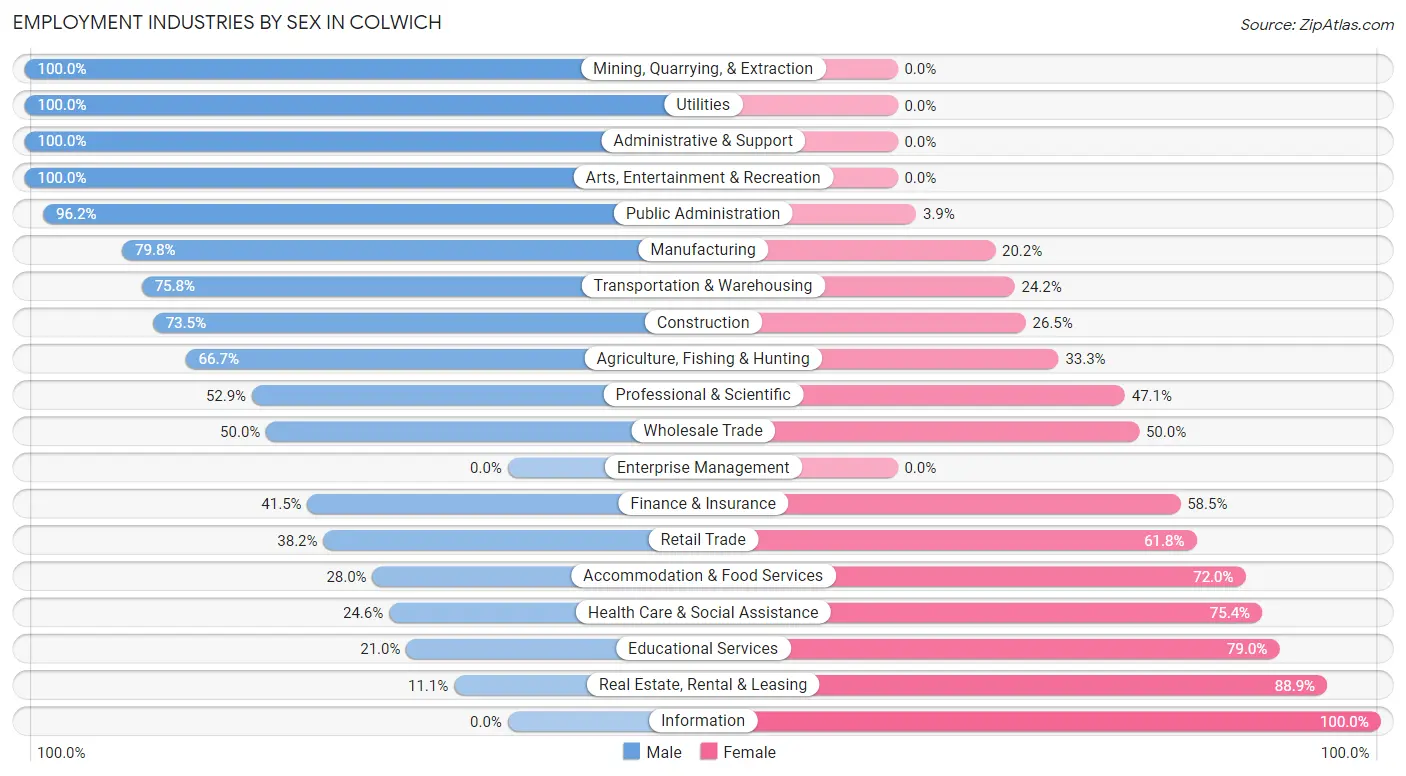
Employment Industries by Sex in Colwich
The Colwich industries that see more men than women are Mining, Quarrying, & Extraction (100.0%), Utilities (100.0%), and Administrative & Support (100.0%), whereas the industries that tend to have a higher number of women are Information (100.0%), Real Estate, Rental & Leasing (88.9%), and Educational Services (79.0%).
| Industry | Male | Female |
| Agriculture, Fishing & Hunting | 6 (66.7%) | 3 (33.3%) |
| Mining, Quarrying, & Extraction | 3 (100.0%) | 0 (0.0%) |
| Construction | 72 (73.5%) | 26 (26.5%) |
| Manufacturing | 79 (79.8%) | 20 (20.2%) |
| Wholesale Trade | 9 (50.0%) | 9 (50.0%) |
| Retail Trade | 29 (38.2%) | 47 (61.8%) |
| Transportation & Warehousing | 25 (75.8%) | 8 (24.2%) |
| Utilities | 10 (100.0%) | 0 (0.0%) |
| Information | 0 (0.0%) | 3 (100.0%) |
| Finance & Insurance | 17 (41.5%) | 24 (58.5%) |
| Real Estate, Rental & Leasing | 4 (11.1%) | 32 (88.9%) |
| Professional & Scientific | 36 (52.9%) | 32 (47.1%) |
| Enterprise Management | 0 (0.0%) | 0 (0.0%) |
| Administrative & Support | 17 (100.0%) | 0 (0.0%) |
| Educational Services | 17 (21.0%) | 64 (79.0%) |
| Health Care & Social Assistance | 28 (24.6%) | 86 (75.4%) |
| Arts, Entertainment & Recreation | 4 (100.0%) | 0 (0.0%) |
| Accommodation & Food Services | 7 (28.0%) | 18 (72.0%) |
| Public Administration | 25 (96.2%) | 1 (3.8%) |
| Total | 403 (51.2%) | 384 (48.8%) |
Education in Colwich
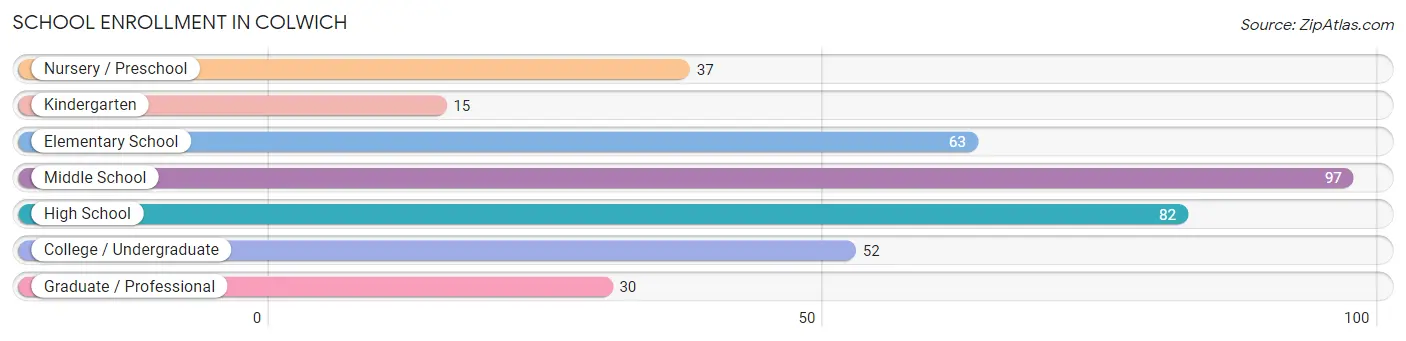
School Enrollment in Colwich
The most common levels of schooling among the 376 students in Colwich are middle school (97 | 25.8%), high school (82 | 21.8%), and elementary school (63 | 16.8%).
| School Level | # Students | % Students |
| Nursery / Preschool | 37 | 9.8% |
| Kindergarten | 15 | 4.0% |
| Elementary School | 63 | 16.8% |
| Middle School | 97 | 25.8% |
| High School | 82 | 21.8% |
| College / Undergraduate | 52 | 13.8% |
| Graduate / Professional | 30 | 8.0% |
| Total | 376 | 100.0% |
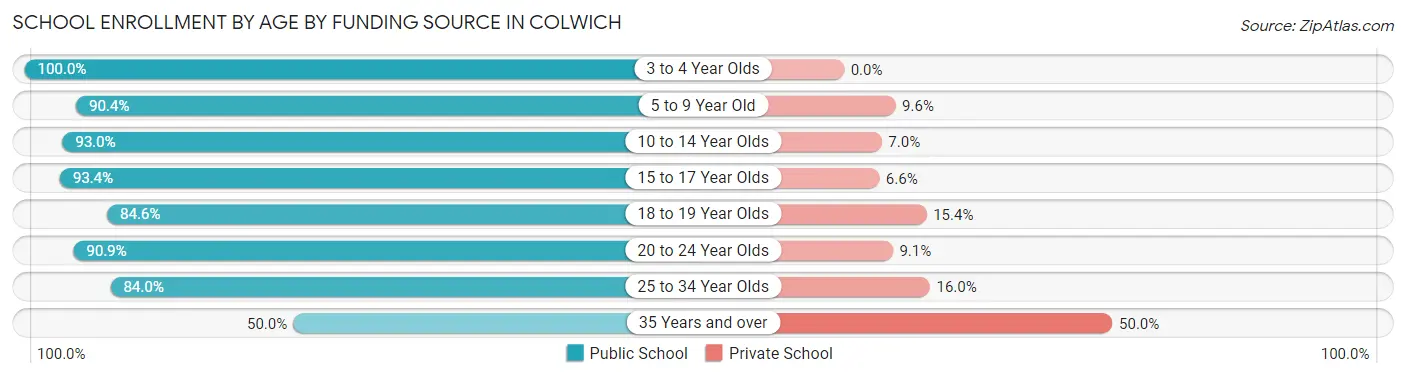
School Enrollment by Age by Funding Source in Colwich
Out of a total of 376 students who are enrolled in schools in Colwich, 39 (10.4%) attend a private institution, while the remaining 337 (89.6%) are enrolled in public schools. The age group of 35 years and over has the highest likelihood of being enrolled in private schools, with 10 (50.0% in the age bracket) enrolled. Conversely, the age group of 3 to 4 year olds has the lowest likelihood of being enrolled in a private school, with 23 (100.0% in the age bracket) attending a public institution.
| Age Bracket | Public School | Private School |
| 3 to 4 Year Olds | 23 (100.0%) | 0 (0.0%) |
| 5 to 9 Year Old | 66 (90.4%) | 7 (9.6%) |
| 10 to 14 Year Olds | 119 (93.0%) | 9 (7.0%) |
| 15 to 17 Year Olds | 57 (93.4%) | 4 (6.6%) |
| 18 to 19 Year Olds | 11 (84.6%) | 2 (15.4%) |
| 20 to 24 Year Olds | 30 (90.9%) | 3 (9.1%) |
| 25 to 34 Year Olds | 21 (84.0%) | 4 (16.0%) |
| 35 Years and over | 10 (50.0%) | 10 (50.0%) |
| Total | 337 (89.6%) | 39 (10.4%) |
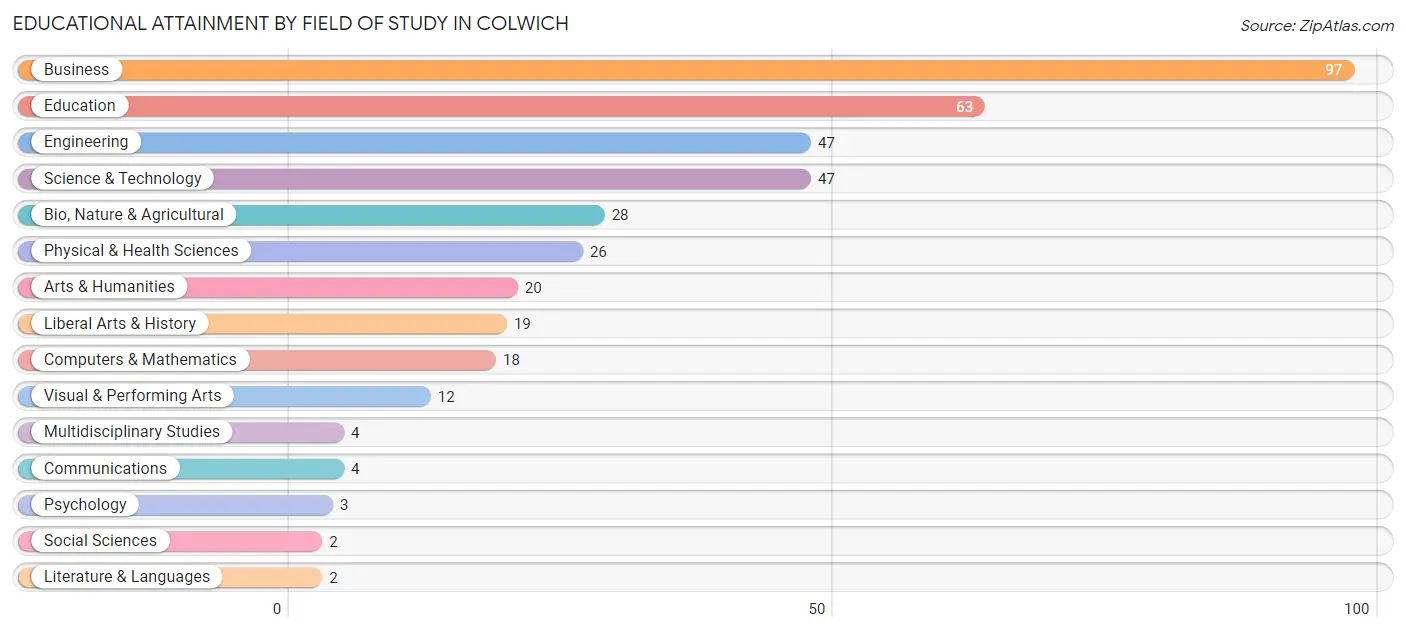
Educational Attainment by Field of Study in Colwich
Business (97 | 24.7%), education (63 | 16.1%), engineering (47 | 12.0%), science & technology (47 | 12.0%), and bio, nature & agricultural (28 | 7.1%) are the most common fields of study among 392 individuals in Colwich who have obtained a bachelor's degree or higher.
| Field of Study | # Graduates | % Graduates |
| Computers & Mathematics | 18 | 4.6% |
| Bio, Nature & Agricultural | 28 | 7.1% |
| Physical & Health Sciences | 26 | 6.6% |
| Psychology | 3 | 0.8% |
| Social Sciences | 2 | 0.5% |
| Engineering | 47 | 12.0% |
| Multidisciplinary Studies | 4 | 1.0% |
| Science & Technology | 47 | 12.0% |
| Business | 97 | 24.7% |
| Education | 63 | 16.1% |
| Literature & Languages | 2 | 0.5% |
| Liberal Arts & History | 19 | 4.9% |
| Visual & Performing Arts | 12 | 3.1% |
| Communications | 4 | 1.0% |
| Arts & Humanities | 20 | 5.1% |
| Total | 392 | 100.0% |
Transportation & Commute in Colwich
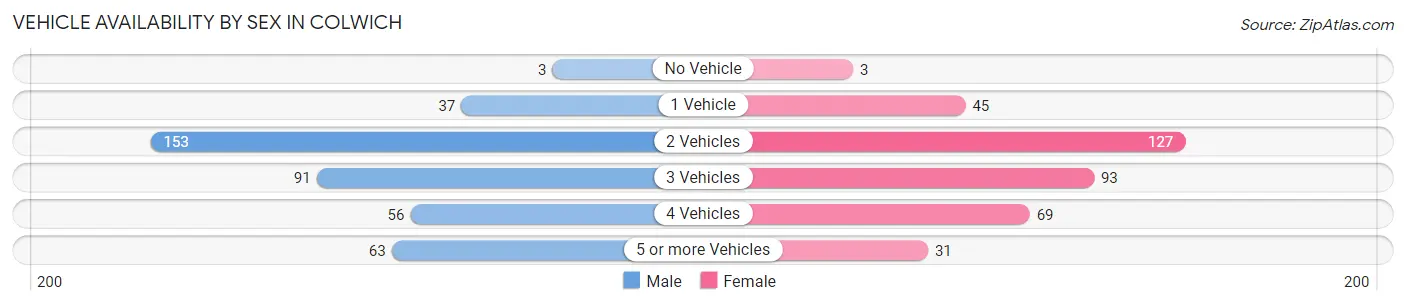
Vehicle Availability by Sex in Colwich
The most prevalent vehicle ownership categories in Colwich are males with 2 vehicles (153, accounting for 38.0%) and females with 2 vehicles (127, making up 41.6%).
| Vehicles Available | Male | Female |
| No Vehicle | 3 (0.7%) | 3 (0.8%) |
| 1 Vehicle | 37 (9.2%) | 45 (12.2%) |
| 2 Vehicles | 153 (38.0%) | 127 (34.5%) |
| 3 Vehicles | 91 (22.6%) | 93 (25.3%) |
| 4 Vehicles | 56 (13.9%) | 69 (18.8%) |
| 5 or more Vehicles | 63 (15.6%) | 31 (8.4%) |
| Total | 403 (100.0%) | 368 (100.0%) |
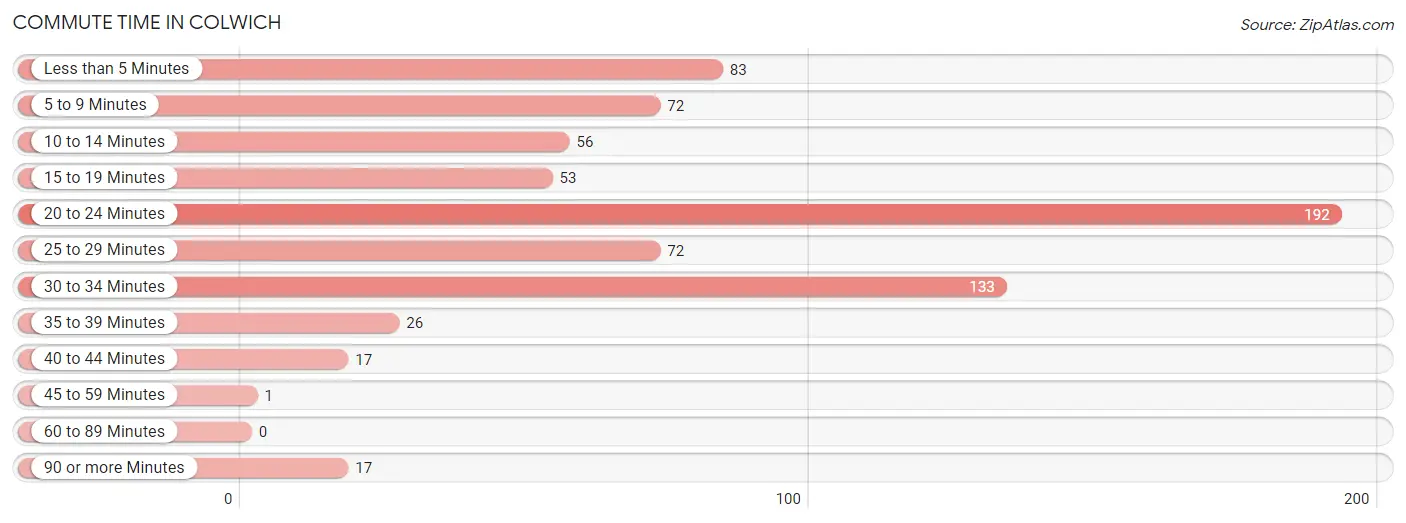
Commute Time in Colwich
The most frequently occuring commute durations in Colwich are 20 to 24 minutes (192 commuters, 26.6%), 30 to 34 minutes (133 commuters, 18.4%), and less than 5 minutes (83 commuters, 11.5%).
| Commute Time | # Commuters | % Commuters |
| Less than 5 Minutes | 83 | 11.5% |
| 5 to 9 Minutes | 72 | 10.0% |
| 10 to 14 Minutes | 56 | 7.8% |
| 15 to 19 Minutes | 53 | 7.3% |
| 20 to 24 Minutes | 192 | 26.6% |
| 25 to 29 Minutes | 72 | 10.0% |
| 30 to 34 Minutes | 133 | 18.4% |
| 35 to 39 Minutes | 26 | 3.6% |
| 40 to 44 Minutes | 17 | 2.4% |
| 45 to 59 Minutes | 1 | 0.1% |
| 60 to 89 Minutes | 0 | 0.0% |
| 90 or more Minutes | 17 | 2.4% |
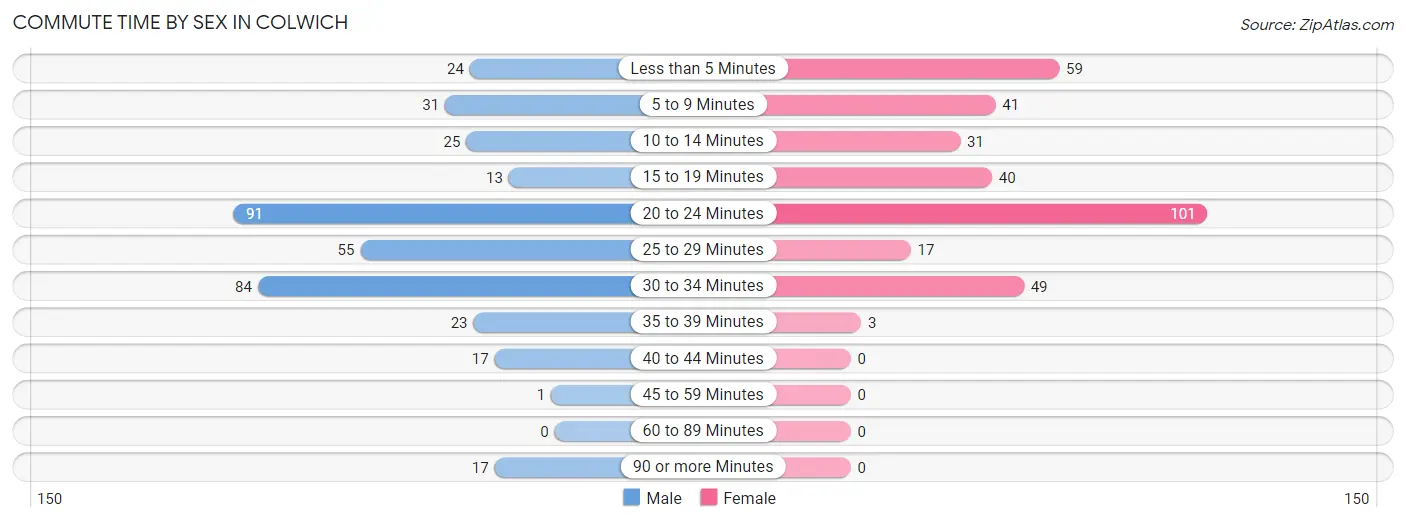
Commute Time by Sex in Colwich
The most common commute times in Colwich are 20 to 24 minutes (91 commuters, 23.9%) for males and 20 to 24 minutes (101 commuters, 29.6%) for females.
| Commute Time | Male | Female |
| Less than 5 Minutes | 24 (6.3%) | 59 (17.3%) |
| 5 to 9 Minutes | 31 (8.1%) | 41 (12.0%) |
| 10 to 14 Minutes | 25 (6.6%) | 31 (9.1%) |
| 15 to 19 Minutes | 13 (3.4%) | 40 (11.7%) |
| 20 to 24 Minutes | 91 (23.9%) | 101 (29.6%) |
| 25 to 29 Minutes | 55 (14.4%) | 17 (5.0%) |
| 30 to 34 Minutes | 84 (22.1%) | 49 (14.4%) |
| 35 to 39 Minutes | 23 (6.0%) | 3 (0.9%) |
| 40 to 44 Minutes | 17 (4.5%) | 0 (0.0%) |
| 45 to 59 Minutes | 1 (0.3%) | 0 (0.0%) |
| 60 to 89 Minutes | 0 (0.0%) | 0 (0.0%) |
| 90 or more Minutes | 17 (4.5%) | 0 (0.0%) |
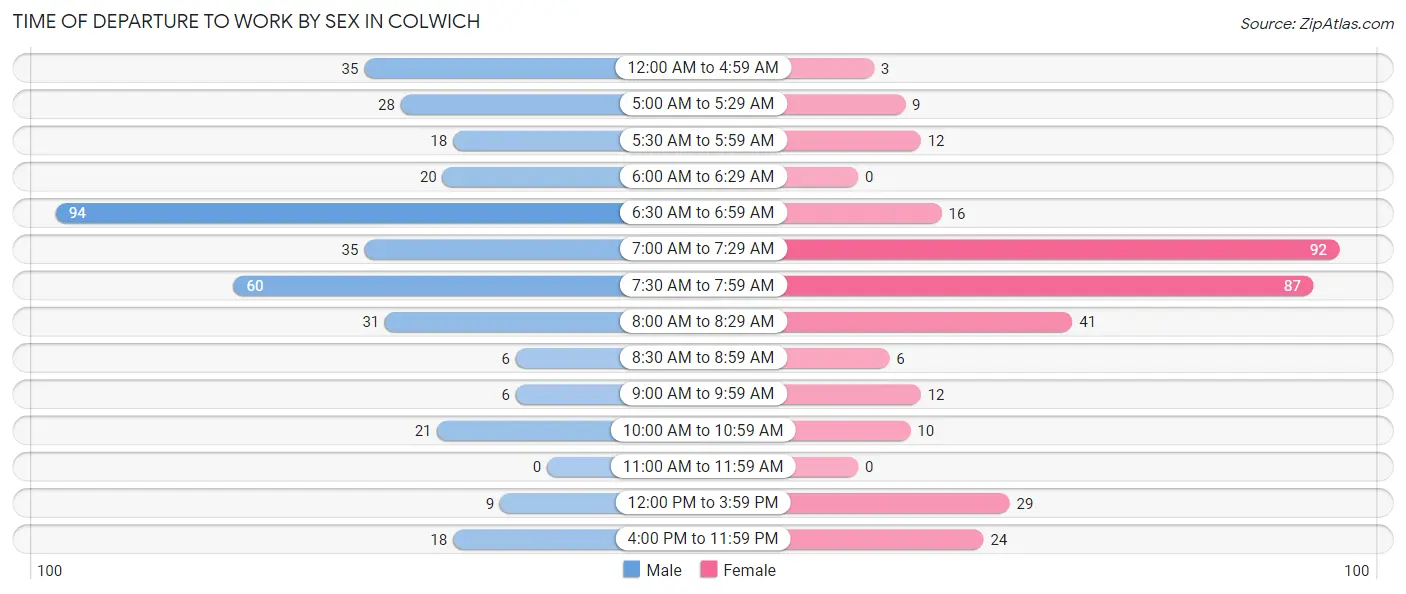
Time of Departure to Work by Sex in Colwich
The most frequent times of departure to work in Colwich are 6:30 AM to 6:59 AM (94, 24.7%) for males and 7:00 AM to 7:29 AM (92, 27.0%) for females.
| Time of Departure | Male | Female |
| 12:00 AM to 4:59 AM | 35 (9.2%) | 3 (0.9%) |
| 5:00 AM to 5:29 AM | 28 (7.3%) | 9 (2.6%) |
| 5:30 AM to 5:59 AM | 18 (4.7%) | 12 (3.5%) |
| 6:00 AM to 6:29 AM | 20 (5.2%) | 0 (0.0%) |
| 6:30 AM to 6:59 AM | 94 (24.7%) | 16 (4.7%) |
| 7:00 AM to 7:29 AM | 35 (9.2%) | 92 (27.0%) |
| 7:30 AM to 7:59 AM | 60 (15.8%) | 87 (25.5%) |
| 8:00 AM to 8:29 AM | 31 (8.1%) | 41 (12.0%) |
| 8:30 AM to 8:59 AM | 6 (1.6%) | 6 (1.8%) |
| 9:00 AM to 9:59 AM | 6 (1.6%) | 12 (3.5%) |
| 10:00 AM to 10:59 AM | 21 (5.5%) | 10 (2.9%) |
| 11:00 AM to 11:59 AM | 0 (0.0%) | 0 (0.0%) |
| 12:00 PM to 3:59 PM | 9 (2.4%) | 29 (8.5%) |
| 4:00 PM to 11:59 PM | 18 (4.7%) | 24 (7.0%) |
| Total | 381 (100.0%) | 341 (100.0%) |
Housing Occupancy in Colwich
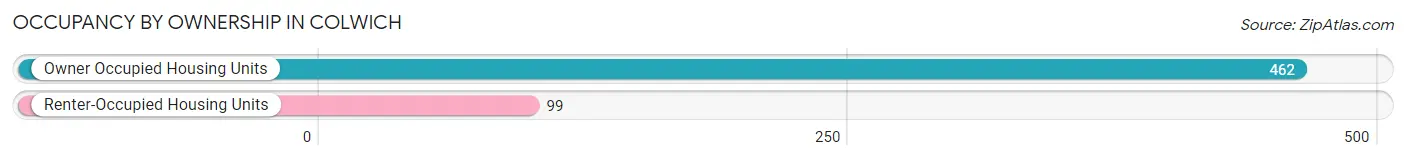
Occupancy by Ownership in Colwich
Of the total 561 dwellings in Colwich, owner-occupied units account for 462 (82.4%), while renter-occupied units make up 99 (17.6%).
| Occupancy | # Housing Units | % Housing Units |
| Owner Occupied Housing Units | 462 | 82.4% |
| Renter-Occupied Housing Units | 99 | 17.6% |
| Total Occupied Housing Units | 561 | 100.0% |
Occupancy by Household Size in Colwich
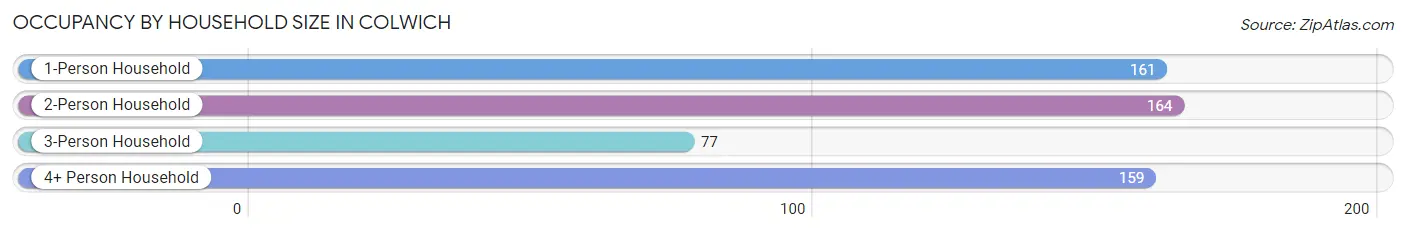
| Household Size | # Housing Units | % Housing Units |
| 1-Person Household | 161 | 28.7% |
| 2-Person Household | 164 | 29.2% |
| 3-Person Household | 77 | 13.7% |
| 4+ Person Household | 159 | 28.3% |
| Total Housing Units | 561 | 100.0% |
Occupancy by Ownership by Household Size in Colwich
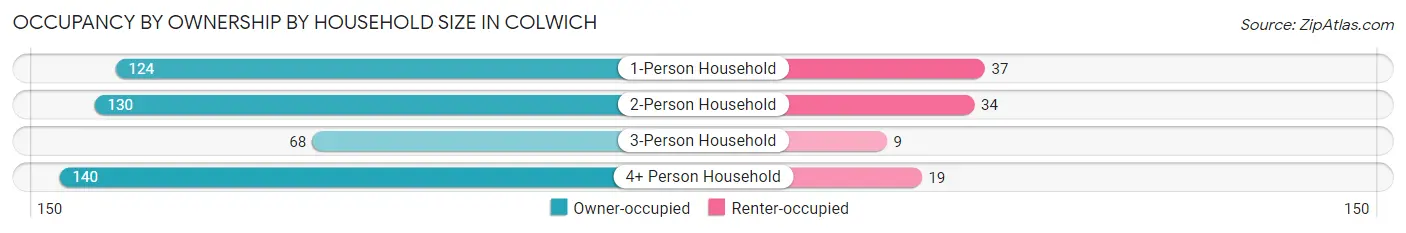
| Household Size | Owner-occupied | Renter-occupied |
| 1-Person Household | 124 (77.0%) | 37 (23.0%) |
| 2-Person Household | 130 (79.3%) | 34 (20.7%) |
| 3-Person Household | 68 (88.3%) | 9 (11.7%) |
| 4+ Person Household | 140 (88.0%) | 19 (11.9%) |
| Total Housing Units | 462 (82.4%) | 99 (17.6%) |
Occupancy by Educational Attainment in Colwich
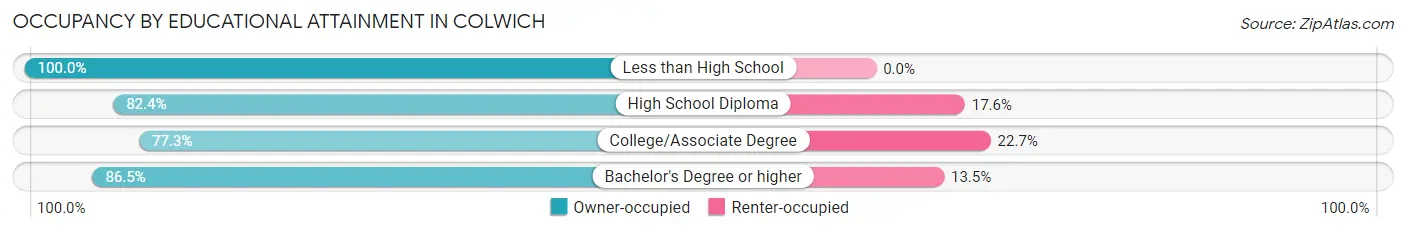
| Household Size | Owner-occupied | Renter-occupied |
| Less than High School | 3 (100.0%) | 0 (0.0%) |
| High School Diploma | 136 (82.4%) | 29 (17.6%) |
| College/Associate Degree | 143 (77.3%) | 42 (22.7%) |
| Bachelor's Degree or higher | 180 (86.5%) | 28 (13.5%) |
Occupancy by Age of Householder in Colwich
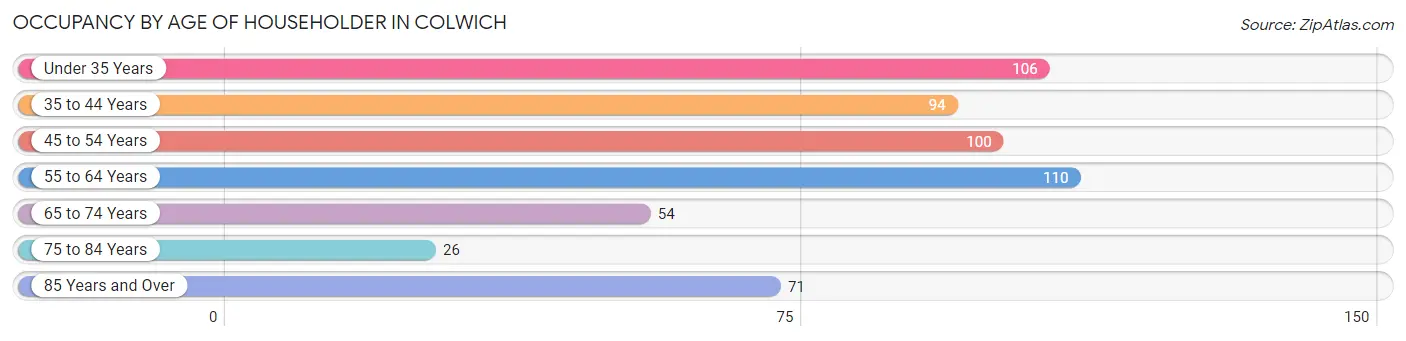
| Age Bracket | # Households | % Households |
| Under 35 Years | 106 | 18.9% |
| 35 to 44 Years | 94 | 16.8% |
| 45 to 54 Years | 100 | 17.8% |
| 55 to 64 Years | 110 | 19.6% |
| 65 to 74 Years | 54 | 9.6% |
| 75 to 84 Years | 26 | 4.6% |
| 85 Years and Over | 71 | 12.7% |
| Total | 561 | 100.0% |
Housing Finances in Colwich
Median Income by Occupancy in Colwich
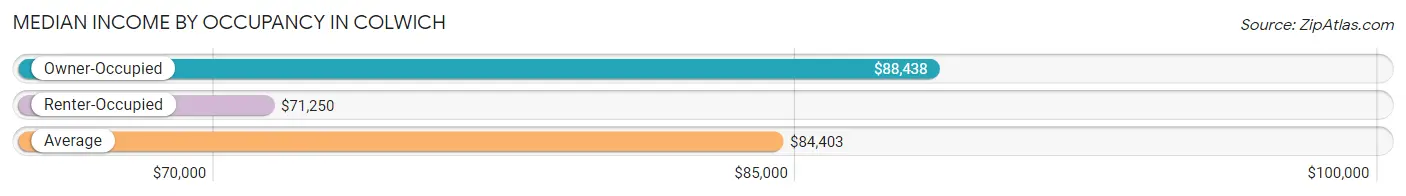
| Occupancy Type | # Households | Median Income |
| Owner-Occupied | 462 (82.4%) | $88,438 |
| Renter-Occupied | 99 (17.6%) | $71,250 |
| Average | 561 (100.0%) | $84,403 |
Occupancy by Householder Income Bracket in Colwich
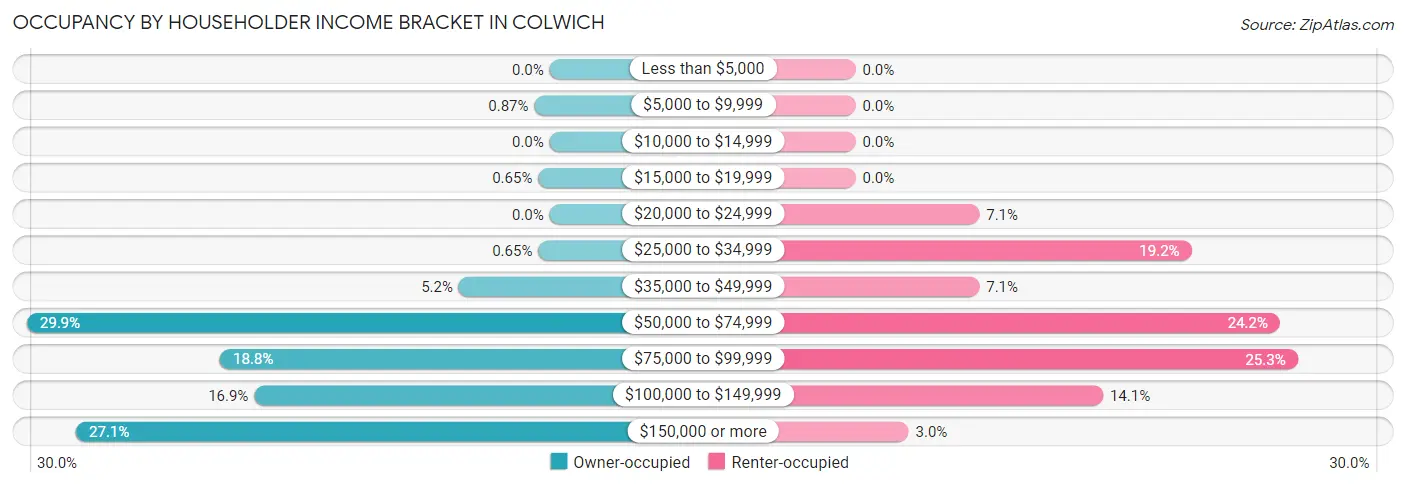
| Income Bracket | Owner-occupied | Renter-occupied |
| Less than $5,000 | 0 (0.0%) | 0 (0.0%) |
| $5,000 to $9,999 | 4 (0.9%) | 0 (0.0%) |
| $10,000 to $14,999 | 0 (0.0%) | 0 (0.0%) |
| $15,000 to $19,999 | 3 (0.6%) | 0 (0.0%) |
| $20,000 to $24,999 | 0 (0.0%) | 7 (7.1%) |
| $25,000 to $34,999 | 3 (0.6%) | 19 (19.2%) |
| $35,000 to $49,999 | 24 (5.2%) | 7 (7.1%) |
| $50,000 to $74,999 | 138 (29.9%) | 24 (24.2%) |
| $75,000 to $99,999 | 87 (18.8%) | 25 (25.3%) |
| $100,000 to $149,999 | 78 (16.9%) | 14 (14.1%) |
| $150,000 or more | 125 (27.1%) | 3 (3.0%) |
| Total | 462 (100.0%) | 99 (100.0%) |
Monthly Housing Cost Tiers in Colwich
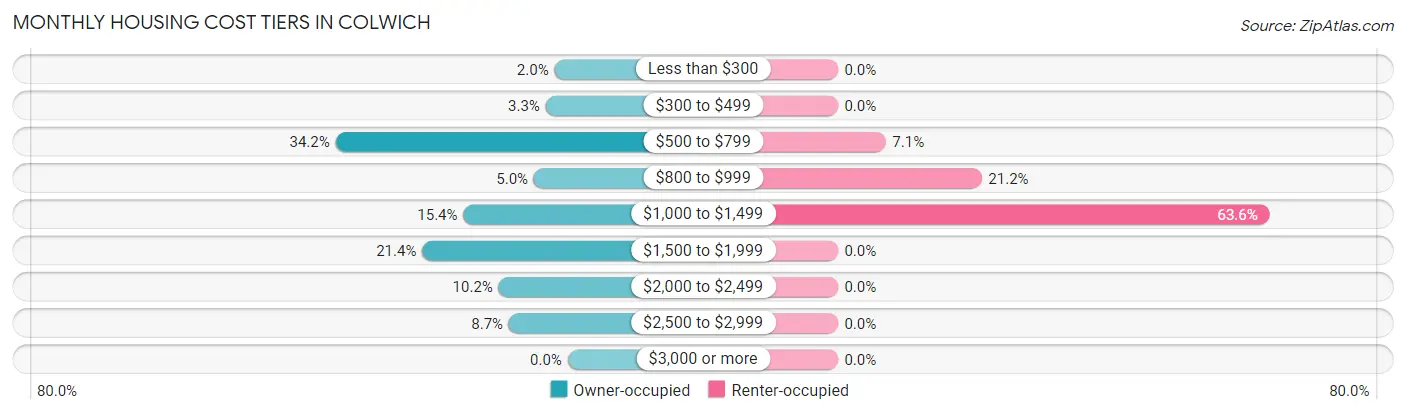
| Monthly Cost | Owner-occupied | Renter-occupied |
| Less than $300 | 9 (1.9%) | 0 (0.0%) |
| $300 to $499 | 15 (3.3%) | 0 (0.0%) |
| $500 to $799 | 158 (34.2%) | 7 (7.1%) |
| $800 to $999 | 23 (5.0%) | 21 (21.2%) |
| $1,000 to $1,499 | 71 (15.4%) | 63 (63.6%) |
| $1,500 to $1,999 | 99 (21.4%) | 0 (0.0%) |
| $2,000 to $2,499 | 47 (10.2%) | 0 (0.0%) |
| $2,500 to $2,999 | 40 (8.7%) | 0 (0.0%) |
| $3,000 or more | 0 (0.0%) | 0 (0.0%) |
| Total | 462 (100.0%) | 99 (100.0%) |
Physical Housing Characteristics in Colwich
Housing Structures in Colwich
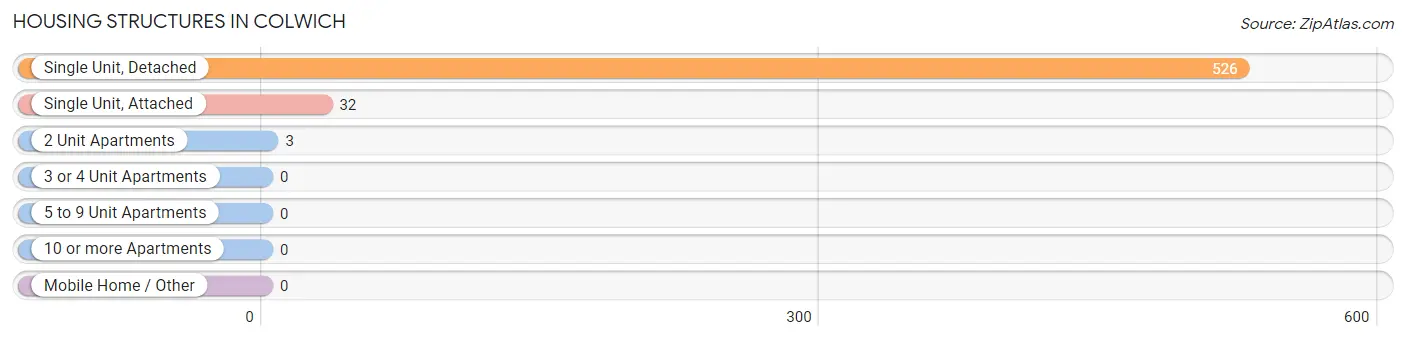
| Structure Type | # Housing Units | % Housing Units |
| Single Unit, Detached | 526 | 93.8% |
| Single Unit, Attached | 32 | 5.7% |
| 2 Unit Apartments | 3 | 0.5% |
| 3 or 4 Unit Apartments | 0 | 0.0% |
| 5 to 9 Unit Apartments | 0 | 0.0% |
| 10 or more Apartments | 0 | 0.0% |
| Mobile Home / Other | 0 | 0.0% |
| Total | 561 | 100.0% |
Housing Structures by Occupancy in Colwich
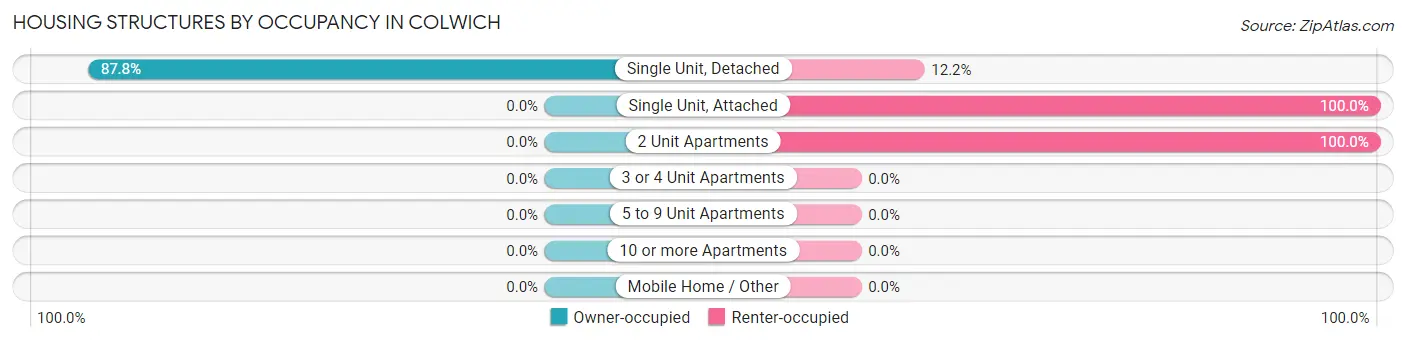
| Structure Type | Owner-occupied | Renter-occupied |
| Single Unit, Detached | 462 (87.8%) | 64 (12.2%) |
| Single Unit, Attached | 0 (0.0%) | 32 (100.0%) |
| 2 Unit Apartments | 0 (0.0%) | 3 (100.0%) |
| 3 or 4 Unit Apartments | 0 (0.0%) | 0 (0.0%) |
| 5 to 9 Unit Apartments | 0 (0.0%) | 0 (0.0%) |
| 10 or more Apartments | 0 (0.0%) | 0 (0.0%) |
| Mobile Home / Other | 0 (0.0%) | 0 (0.0%) |
| Total | 462 (82.4%) | 99 (17.6%) |
Housing Structures by Number of Rooms in Colwich
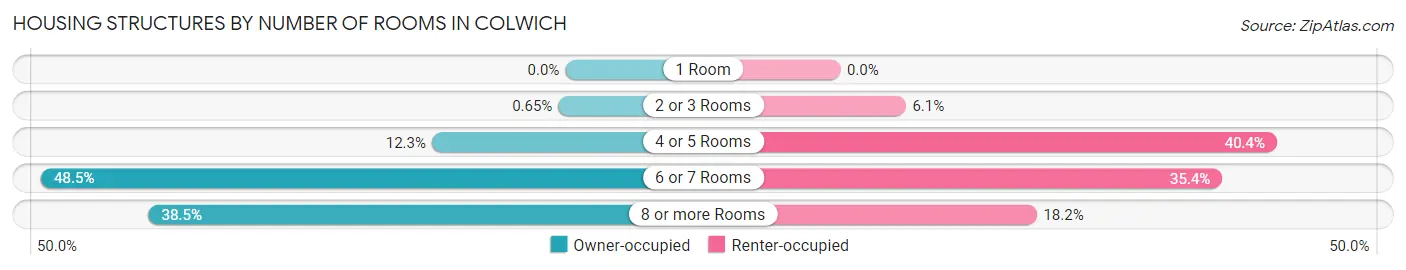
| Number of Rooms | Owner-occupied | Renter-occupied |
| 1 Room | 0 (0.0%) | 0 (0.0%) |
| 2 or 3 Rooms | 3 (0.6%) | 6 (6.1%) |
| 4 or 5 Rooms | 57 (12.3%) | 40 (40.4%) |
| 6 or 7 Rooms | 224 (48.5%) | 35 (35.3%) |
| 8 or more Rooms | 178 (38.5%) | 18 (18.2%) |
| Total | 462 (100.0%) | 99 (100.0%) |
Housing Structure by Heating Type in Colwich
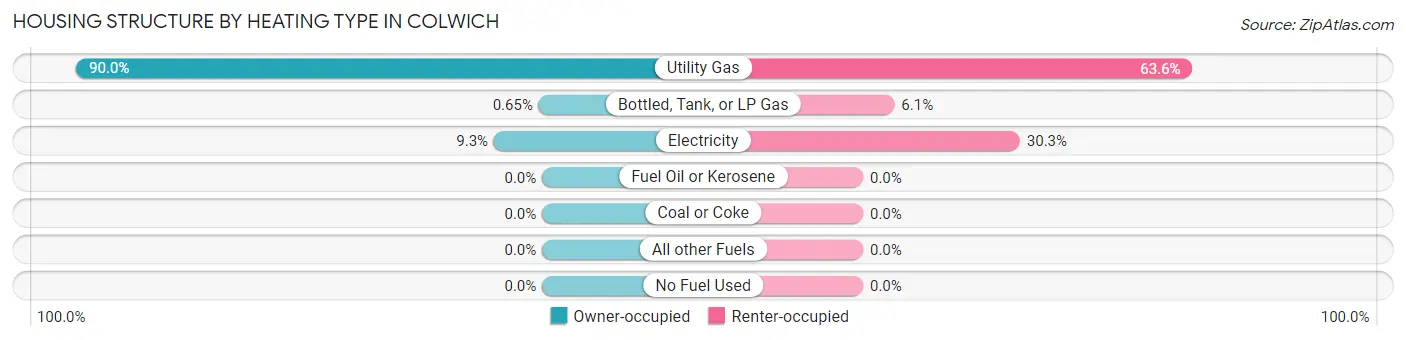
| Heating Type | Owner-occupied | Renter-occupied |
| Utility Gas | 416 (90.0%) | 63 (63.6%) |
| Bottled, Tank, or LP Gas | 3 (0.6%) | 6 (6.1%) |
| Electricity | 43 (9.3%) | 30 (30.3%) |
| Fuel Oil or Kerosene | 0 (0.0%) | 0 (0.0%) |
| Coal or Coke | 0 (0.0%) | 0 (0.0%) |
| All other Fuels | 0 (0.0%) | 0 (0.0%) |
| No Fuel Used | 0 (0.0%) | 0 (0.0%) |
| Total | 462 (100.0%) | 99 (100.0%) |
Household Vehicle Usage in Colwich
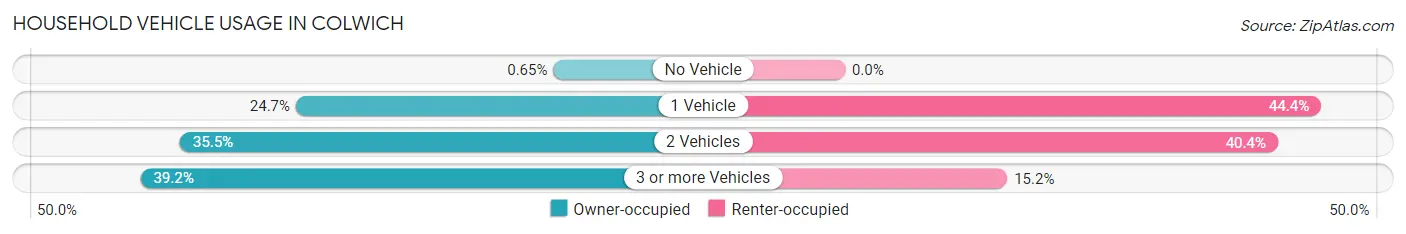
| Vehicles per Household | Owner-occupied | Renter-occupied |
| No Vehicle | 3 (0.6%) | 0 (0.0%) |
| 1 Vehicle | 114 (24.7%) | 44 (44.4%) |
| 2 Vehicles | 164 (35.5%) | 40 (40.4%) |
| 3 or more Vehicles | 181 (39.2%) | 15 (15.1%) |
| Total | 462 (100.0%) | 99 (100.0%) |
Real Estate & Mortgages in Colwich
Real Estate and Mortgage Overview in Colwich
| Characteristic | Without Mortgage | With Mortgage |
| Housing Units | 194 | 268 |
| Median Property Value | $213,200 | $183,500 |
| Median Household Income | $69,167 | $76 |
| Monthly Housing Costs | $579 | $0 |
| Real Estate Taxes | $2,670 | $0 |
Property Value by Mortgage Status in Colwich
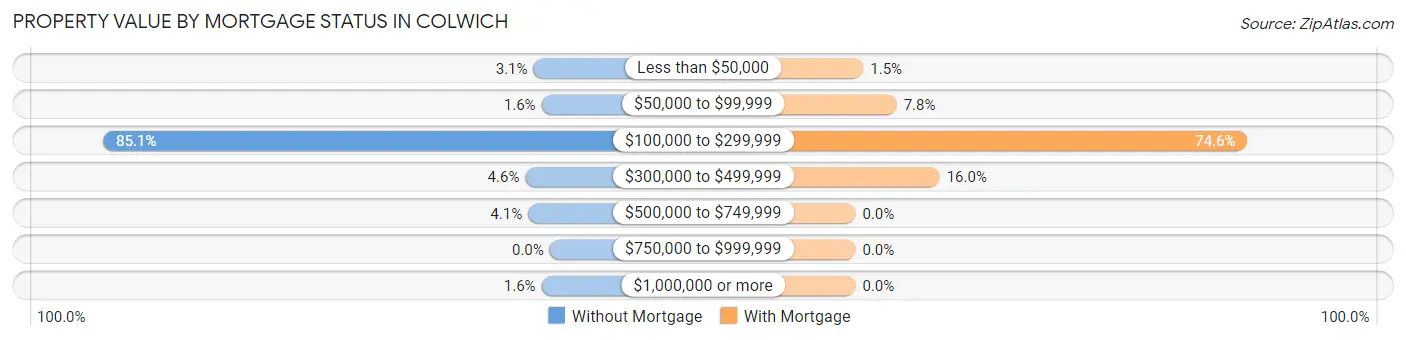
| Property Value | Without Mortgage | With Mortgage |
| Less than $50,000 | 6 (3.1%) | 4 (1.5%) |
| $50,000 to $99,999 | 3 (1.5%) | 21 (7.8%) |
| $100,000 to $299,999 | 165 (85.1%) | 200 (74.6%) |
| $300,000 to $499,999 | 9 (4.6%) | 43 (16.0%) |
| $500,000 to $749,999 | 8 (4.1%) | 0 (0.0%) |
| $750,000 to $999,999 | 0 (0.0%) | 0 (0.0%) |
| $1,000,000 or more | 3 (1.5%) | 0 (0.0%) |
| Total | 194 (100.0%) | 268 (100.0%) |
Household Income by Mortgage Status in Colwich
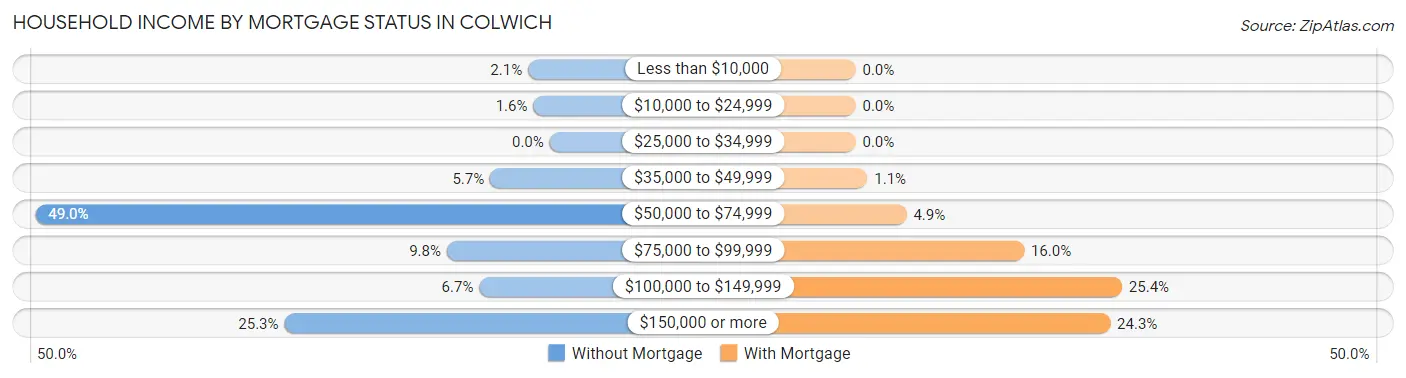
| Household Income | Without Mortgage | With Mortgage |
| Less than $10,000 | 4 (2.1%) | 0 (0.0%) |
| $10,000 to $24,999 | 3 (1.5%) | 0 (0.0%) |
| $25,000 to $34,999 | 0 (0.0%) | 0 (0.0%) |
| $35,000 to $49,999 | 11 (5.7%) | 3 (1.1%) |
| $50,000 to $74,999 | 95 (49.0%) | 13 (4.9%) |
| $75,000 to $99,999 | 19 (9.8%) | 43 (16.0%) |
| $100,000 to $149,999 | 13 (6.7%) | 68 (25.4%) |
| $150,000 or more | 49 (25.3%) | 65 (24.2%) |
| Total | 194 (100.0%) | 268 (100.0%) |
Property Value to Household Income Ratio in Colwich
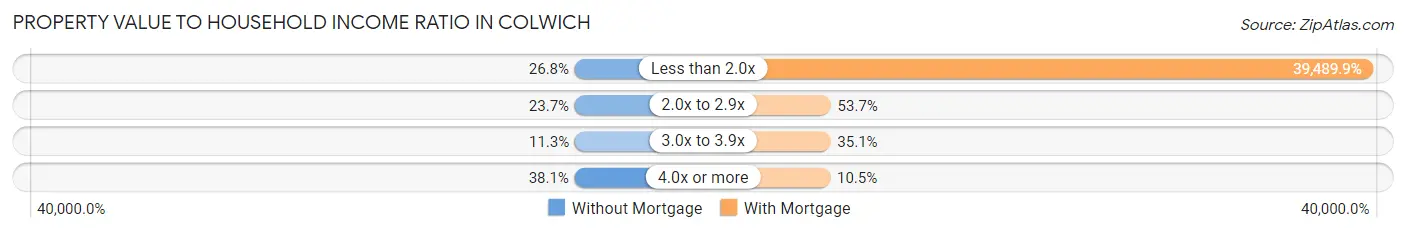
| Value-to-Income Ratio | Without Mortgage | With Mortgage |
| Less than 2.0x | 52 (26.8%) | 105,833 (39,489.9%) |
| 2.0x to 2.9x | 46 (23.7%) | 144 (53.7%) |
| 3.0x to 3.9x | 22 (11.3%) | 94 (35.1%) |
| 4.0x or more | 74 (38.1%) | 28 (10.4%) |
| Total | 194 (100.0%) | 268 (100.0%) |
Real Estate Taxes by Mortgage Status in Colwich
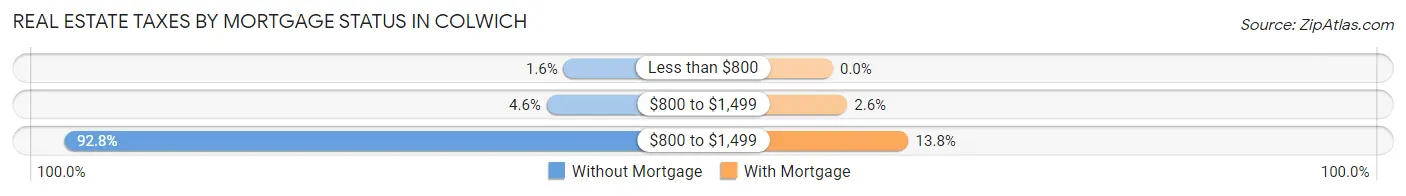
| Property Taxes | Without Mortgage | With Mortgage |
| Less than $800 | 3 (1.5%) | 0 (0.0%) |
| $800 to $1,499 | 9 (4.6%) | 7 (2.6%) |
| $800 to $1,499 | 180 (92.8%) | 37 (13.8%) |
| Total | 194 (100.0%) | 268 (100.0%) |
Health & Disability in Colwich
Health Insurance Coverage by Age in Colwich
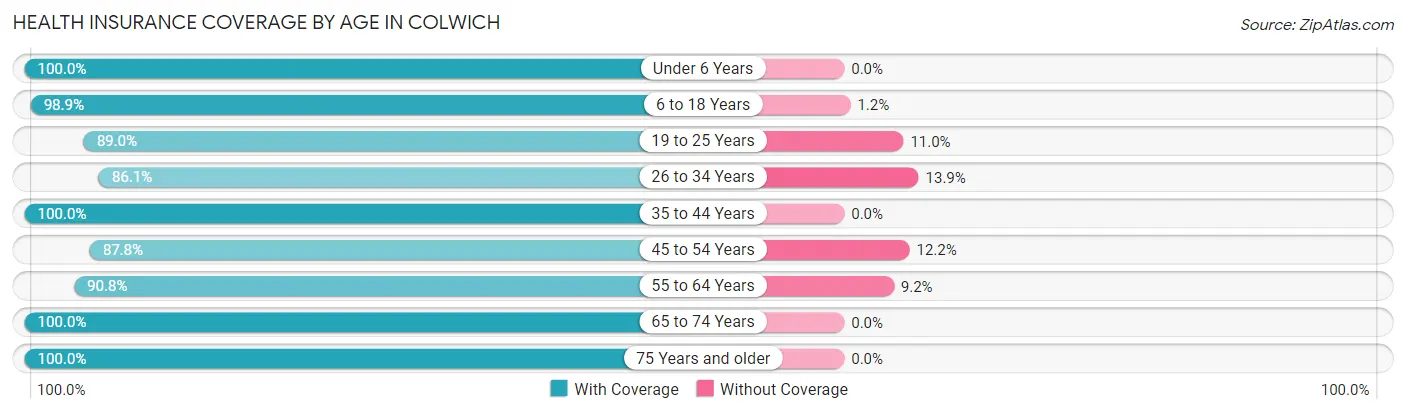
| Age Bracket | With Coverage | Without Coverage |
| Under 6 Years | 143 (100.0%) | 0 (0.0%) |
| 6 to 18 Years | 259 (98.9%) | 3 (1.1%) |
| 19 to 25 Years | 121 (89.0%) | 15 (11.0%) |
| 26 to 34 Years | 174 (86.1%) | 28 (13.9%) |
| 35 to 44 Years | 157 (100.0%) | 0 (0.0%) |
| 45 to 54 Years | 166 (87.8%) | 23 (12.2%) |
| 55 to 64 Years | 167 (90.8%) | 17 (9.2%) |
| 65 to 74 Years | 108 (100.0%) | 0 (0.0%) |
| 75 Years and older | 129 (100.0%) | 0 (0.0%) |
| Total | 1,424 (94.3%) | 86 (5.7%) |
Health Insurance Coverage by Citizenship Status in Colwich
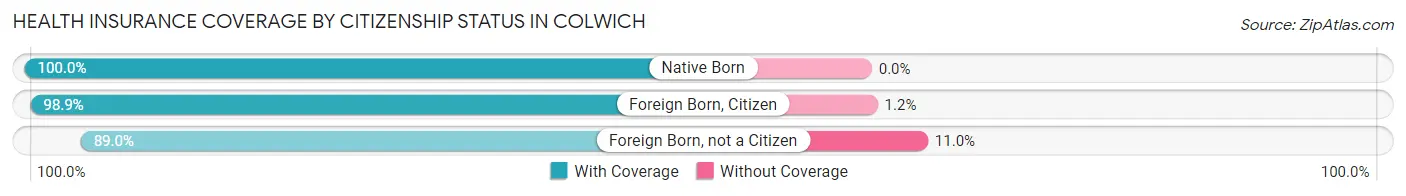
| Citizenship Status | With Coverage | Without Coverage |
| Native Born | 143 (100.0%) | 0 (0.0%) |
| Foreign Born, Citizen | 259 (98.9%) | 3 (1.1%) |
| Foreign Born, not a Citizen | 121 (89.0%) | 15 (11.0%) |
Health Insurance Coverage by Household Income in Colwich
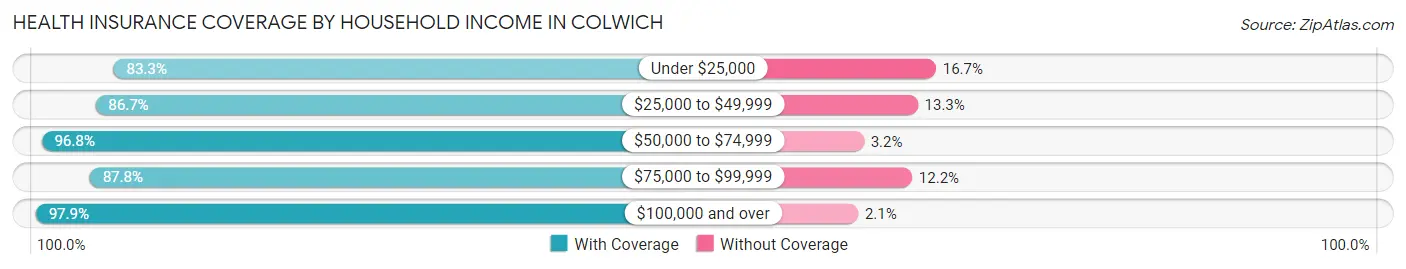
| Household Income | With Coverage | Without Coverage |
| Under $25,000 | 15 (83.3%) | 3 (16.7%) |
| $25,000 to $49,999 | 85 (86.7%) | 13 (13.3%) |
| $50,000 to $74,999 | 244 (96.8%) | 8 (3.2%) |
| $75,000 to $99,999 | 331 (87.8%) | 46 (12.2%) |
| $100,000 and over | 749 (97.9%) | 16 (2.1%) |
Public vs Private Health Insurance Coverage by Age in Colwich
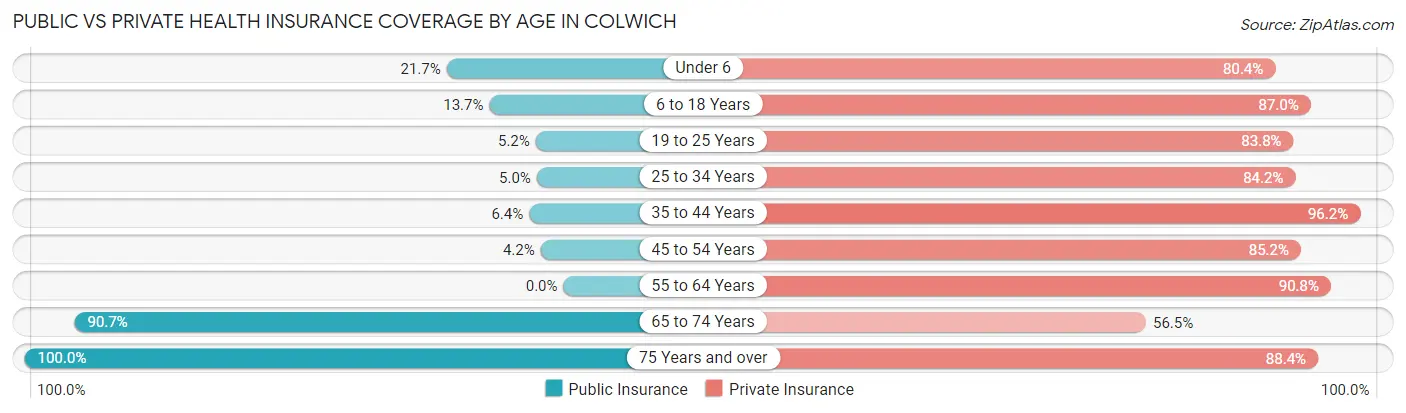
| Age Bracket | Public Insurance | Private Insurance |
| Under 6 | 31 (21.7%) | 115 (80.4%) |
| 6 to 18 Years | 36 (13.7%) | 228 (87.0%) |
| 19 to 25 Years | 7 (5.1%) | 114 (83.8%) |
| 25 to 34 Years | 10 (5.0%) | 170 (84.2%) |
| 35 to 44 Years | 10 (6.4%) | 151 (96.2%) |
| 45 to 54 Years | 8 (4.2%) | 161 (85.2%) |
| 55 to 64 Years | 0 (0.0%) | 167 (90.8%) |
| 65 to 74 Years | 98 (90.7%) | 61 (56.5%) |
| 75 Years and over | 129 (100.0%) | 114 (88.4%) |
| Total | 329 (21.8%) | 1,281 (84.8%) |
Disability Status by Sex by Age in Colwich
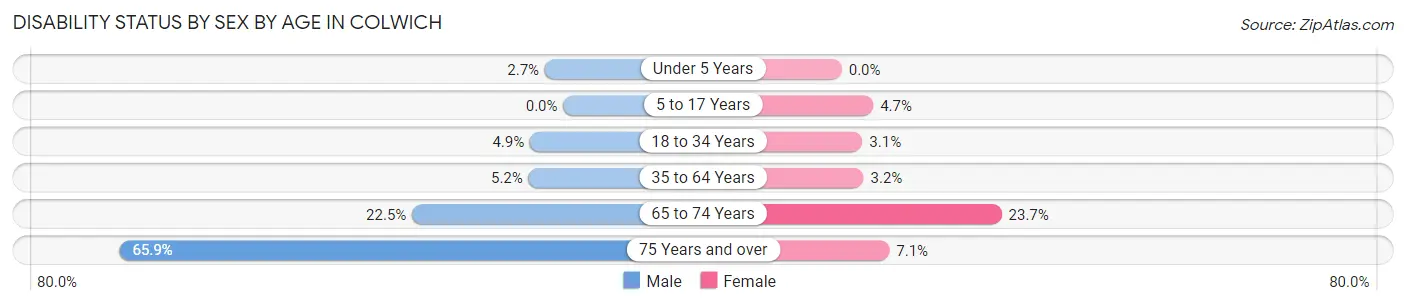
| Age Bracket | Male | Female |
| Under 5 Years | 2 (2.7%) | 0 (0.0%) |
| 5 to 17 Years | 0 (0.0%) | 7 (4.7%) |
| 18 to 34 Years | 8 (4.9%) | 6 (3.1%) |
| 35 to 64 Years | 13 (5.2%) | 9 (3.2%) |
| 65 to 74 Years | 11 (22.5%) | 14 (23.7%) |
| 75 Years and over | 29 (65.9%) | 6 (7.1%) |
Disability Class by Sex by Age in Colwich
Disability Class: Hearing Difficulty
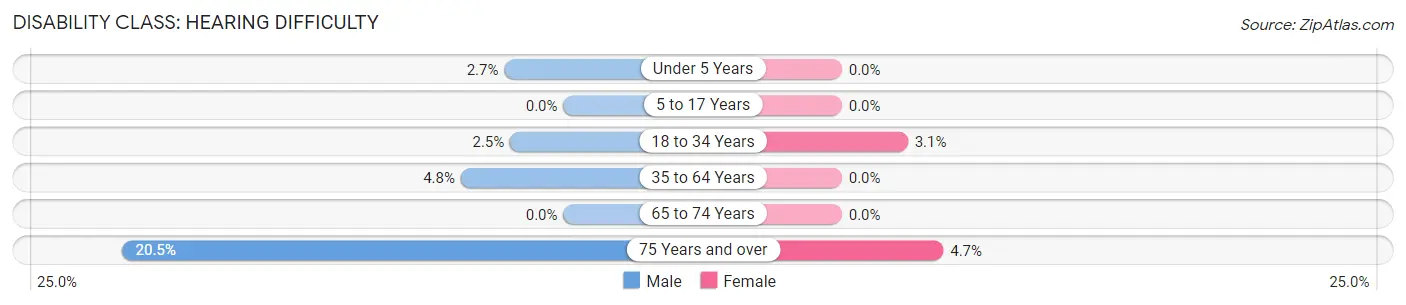
| Age Bracket | Male | Female |
| Under 5 Years | 2 (2.7%) | 0 (0.0%) |
| 5 to 17 Years | 0 (0.0%) | 0 (0.0%) |
| 18 to 34 Years | 4 (2.5%) | 6 (3.1%) |
| 35 to 64 Years | 12 (4.8%) | 0 (0.0%) |
| 65 to 74 Years | 0 (0.0%) | 0 (0.0%) |
| 75 Years and over | 9 (20.4%) | 4 (4.7%) |
Disability Class: Vision Difficulty
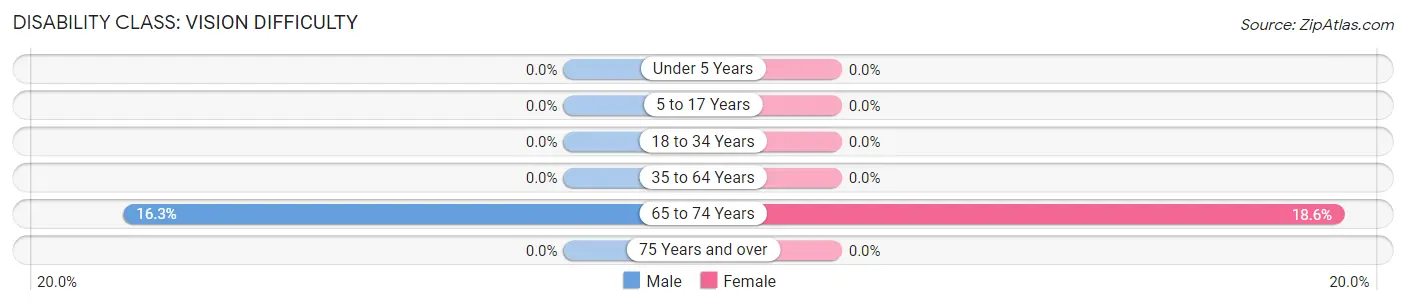
| Age Bracket | Male | Female |
| Under 5 Years | 0 (0.0%) | 0 (0.0%) |
| 5 to 17 Years | 0 (0.0%) | 0 (0.0%) |
| 18 to 34 Years | 0 (0.0%) | 0 (0.0%) |
| 35 to 64 Years | 0 (0.0%) | 0 (0.0%) |
| 65 to 74 Years | 8 (16.3%) | 11 (18.6%) |
| 75 Years and over | 0 (0.0%) | 0 (0.0%) |
Disability Class: Cognitive Difficulty
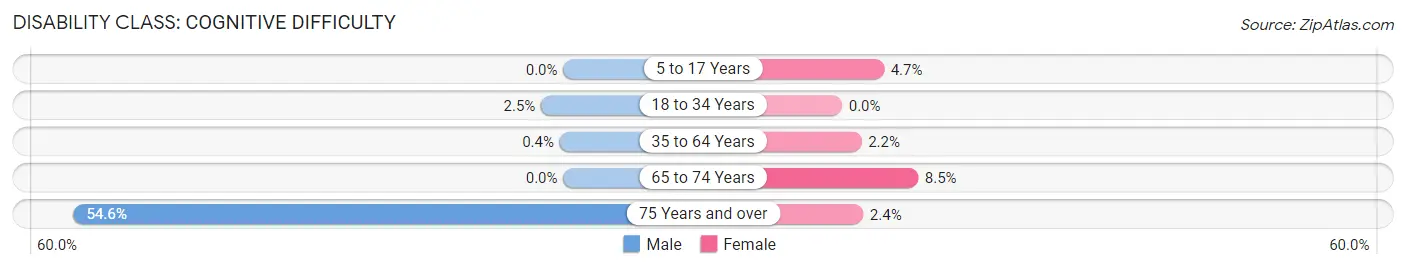
| Age Bracket | Male | Female |
| 5 to 17 Years | 0 (0.0%) | 7 (4.7%) |
| 18 to 34 Years | 4 (2.5%) | 0 (0.0%) |
| 35 to 64 Years | 1 (0.4%) | 6 (2.2%) |
| 65 to 74 Years | 0 (0.0%) | 5 (8.5%) |
| 75 Years and over | 24 (54.5%) | 2 (2.4%) |
Disability Class: Ambulatory Difficulty
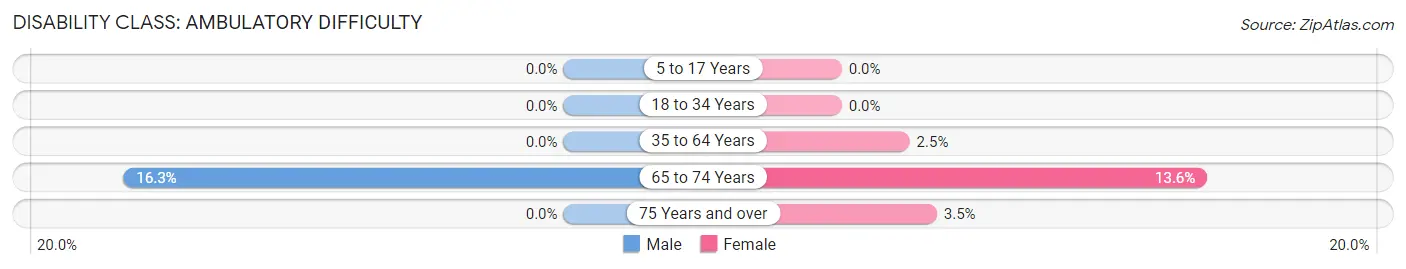
| Age Bracket | Male | Female |
| 5 to 17 Years | 0 (0.0%) | 0 (0.0%) |
| 18 to 34 Years | 0 (0.0%) | 0 (0.0%) |
| 35 to 64 Years | 0 (0.0%) | 7 (2.5%) |
| 65 to 74 Years | 8 (16.3%) | 8 (13.6%) |
| 75 Years and over | 0 (0.0%) | 3 (3.5%) |
Disability Class: Self-Care Difficulty
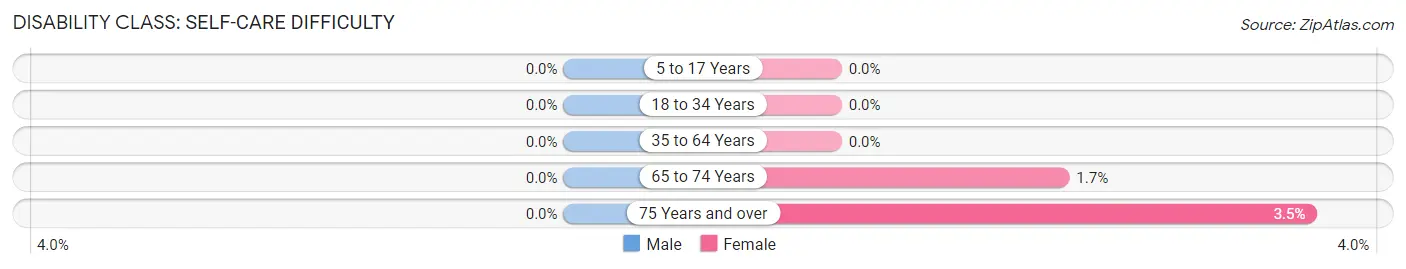
| Age Bracket | Male | Female |
| 5 to 17 Years | 0 (0.0%) | 0 (0.0%) |
| 18 to 34 Years | 0 (0.0%) | 0 (0.0%) |
| 35 to 64 Years | 0 (0.0%) | 0 (0.0%) |
| 65 to 74 Years | 0 (0.0%) | 1 (1.7%) |
| 75 Years and over | 0 (0.0%) | 3 (3.5%) |
Technology Access in Colwich
Computing Device Access in Colwich
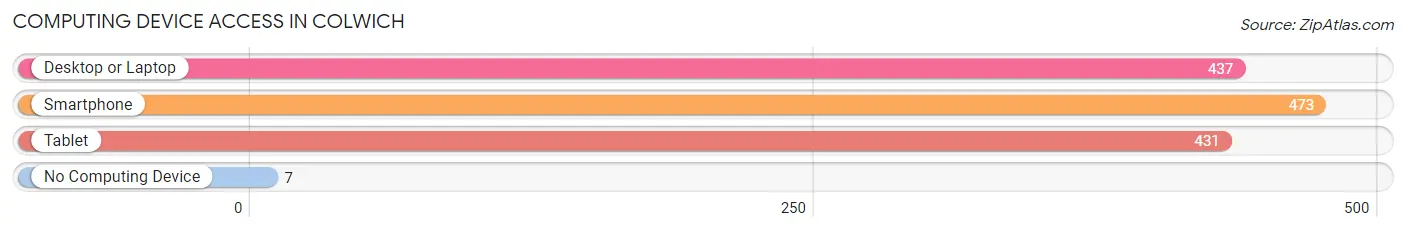
| Device Type | # Households | % Households |
| Desktop or Laptop | 437 | 77.9% |
| Smartphone | 473 | 84.3% |
| Tablet | 431 | 76.8% |
| No Computing Device | 7 | 1.3% |
| Total | 561 | 100.0% |
Internet Access in Colwich
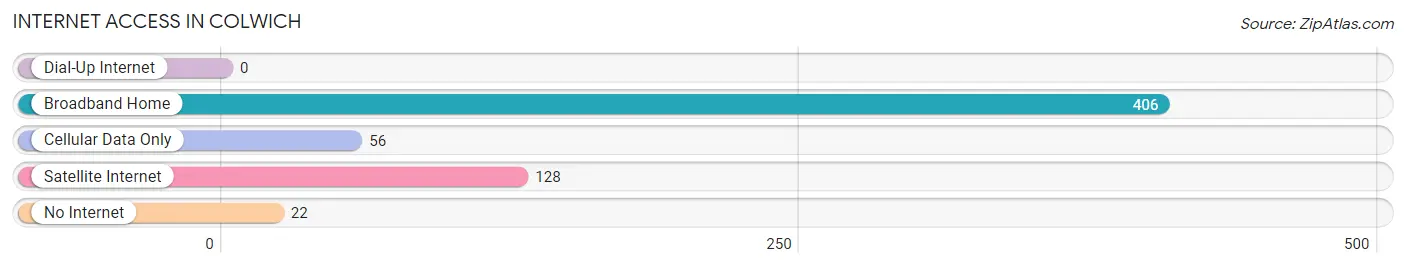
| Internet Type | # Households | % Households |
| Dial-Up Internet | 0 | 0.0% |
| Broadband Home | 406 | 72.4% |
| Cellular Data Only | 56 | 10.0% |
| Satellite Internet | 128 | 22.8% |
| No Internet | 22 | 3.9% |
| Total | 561 | 100.0% |
Colwich Summary
Colwich, Kansas is a small city located in Sedgwick County, Kansas. It is situated on the banks of the Arkansas River, just south of Wichita. The city has a population of approximately 1,400 people and is part of the Wichita metropolitan area.
History
Colwich was founded in 1887 by a group of German immigrants who had settled in the area. The town was named after the Colwich family, who had been among the first settlers in the area. The town was incorporated in 1891 and was home to a variety of businesses, including a flour mill, a creamery, a blacksmith shop, and a general store.
In the early 1900s, Colwich was a thriving agricultural community. The town was home to several grain elevators, a creamery, and a flour mill. The town also had a variety of other businesses, including a hotel, a bank, a newspaper, and a movie theater.
In the 1950s, the town began to decline as the agricultural industry shifted away from the area. The town’s population began to decline as well, and by the 1970s, the town had become a virtual ghost town.
In the 1980s, the town began to experience a resurgence as new businesses began to move into the area. The town’s population began to grow again, and by the 2000s, the town had become a thriving community once again.
Geography
Colwich is located in south-central Kansas, just south of Wichita. The town is situated on the banks of the Arkansas River, and is surrounded by rolling hills and farmland. The town is located in the Great Plains region of the United States, and has a semi-arid climate.
The town is located in Sedgwick County, and is part of the Wichita metropolitan area. The town is located approximately 20 miles south of Wichita, and is accessible via Interstate 35.
Economy
Colwich’s economy is largely based on agriculture. The town is home to several grain elevators, and is a major producer of wheat, corn, and soybeans. The town is also home to several businesses, including a hotel, a bank, a newspaper, and a movie theater.
The town is also home to several manufacturing companies, including a plastics manufacturer and a metal fabrication company. The town is also home to a variety of retail stores, including a grocery store, a hardware store, and a variety of specialty shops.
Demographics
As of the 2010 census, Colwich had a population of 1,400 people. The town is predominantly white, with approximately 95% of the population being white. The town is also home to a small Hispanic population, with approximately 4% of the population being Hispanic.
The town has a median household income of approximately $45,000, and the median home value is approximately $100,000. The town has a low unemployment rate, with approximately 4% of the population being unemployed.
Conclusion
Colwich, Kansas is a small city located in Sedgwick County, Kansas. It is situated on the banks of the Arkansas River, just south of Wichita. The city has a population of approximately 1,400 people and is part of the Wichita metropolitan area. The town’s economy is largely based on agriculture, and the town is home to several businesses, including a hotel, a bank, a newspaper, and a movie theater. The town is predominantly white, with approximately 95% of the population being white. The town has a median household income of approximately $45,000, and the median home value is approximately $100,000.
Common Questions
What is Per Capita Income in Colwich?
Per Capita income in Colwich is $39,838.
What is the Median Family Income in Colwich?
Median Family Income in Colwich is $100,875.
What is the Median Household income in Colwich?
Median Household Income in Colwich is $84,403.
What is Income or Wage Gap in Colwich?
Income or Wage Gap in Colwich is 25.7%.
Women in Colwich earn 74.3 cents for every dollar earned by a man.
What is Inequality or Gini Index in Colwich?
Inequality or Gini Index in Colwich is 0.31.
What is the Total Population of Colwich?
Total Population of Colwich is 1,513.
What is the Total Male Population of Colwich?
Total Male Population of Colwich is 694.
What is the Total Female Population of Colwich?
Total Female Population of Colwich is 819.
What is the Ratio of Males per 100 Females in Colwich?
There are 84.74 Males per 100 Females in Colwich.
What is the Ratio of Females per 100 Males in Colwich?
There are 118.01 Females per 100 Males in Colwich.
What is the Median Population Age in Colwich?
Median Population Age in Colwich is 36.5 Years.
What is the Average Family Size in Colwich
Average Family Size in Colwich is 3.3 People.
What is the Average Household Size in Colwich
Average Household Size in Colwich is 2.7 People.
How Large is the Labor Force in Colwich?
There are 858 People in the Labor Forcein in Colwich.
What is the Percentage of People in the Labor Force in Colwich?
73.0% of People are in the Labor Force in Colwich.
What is the Unemployment Rate in Colwich?
Unemployment Rate in Colwich is 8.4%.