Kechi, KS Map & Demographics
Kechi Map
Kechi Overview
$39,766
PER CAPITA INCOME
$111,667
AVG FAMILY INCOME
$103,625
AVG HOUSEHOLD INCOME
62.7%
WAGE / INCOME GAP [ % ]
37.3¢/ $1
WAGE / INCOME GAP [ $ ]
0.32
INEQUALITY / GINI INDEX
2,949
TOTAL POPULATION
1,231
MALE POPULATION
1,718
FEMALE POPULATION
71.65
MALES / 100 FEMALES
139.56
FEMALES / 100 MALES
40.0
MEDIAN AGE
3.3
AVG FAMILY SIZE
3.1
AVG HOUSEHOLD SIZE
1,508
LABOR FORCE [ PEOPLE ]
68.0%
PERCENT IN LABOR FORCE
1.3%
UNEMPLOYMENT RATE
Kechi Zip Codes
Kechi Area Codes
Income in Kechi
Income Overview in Kechi
Per Capita Income in Kechi is $39,766, while median incomes of families and households are $111,667 and $103,625 respectively.
| Characteristic | Number | Measure |
| Per Capita Income | 2,949 | $39,766 |
| Median Family Income | 818 | $111,667 |
| Mean Family Income | 818 | $125,075 |
| Median Household Income | 961 | $103,625 |
| Mean Household Income | 961 | $117,764 |
| Income Deficit | 818 | $0 |
| Wage / Income Gap (%) | 2,949 | 62.69% |
| Wage / Income Gap ($) | 2,949 | 37.31¢ per $1 |
| Gini / Inequality Index | 2,949 | 0.32 |
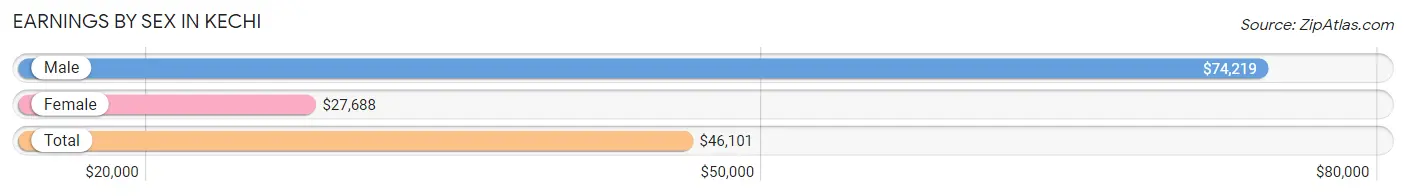
Earnings by Sex in Kechi
Average Earnings in Kechi are $46,101, $74,219 for men and $27,688 for women, a difference of 62.7%.
| Sex | Number | Average Earnings |
| Male | 815 (52.0%) | $74,219 |
| Female | 752 (48.0%) | $27,688 |
| Total | 1,567 (100.0%) | $46,101 |
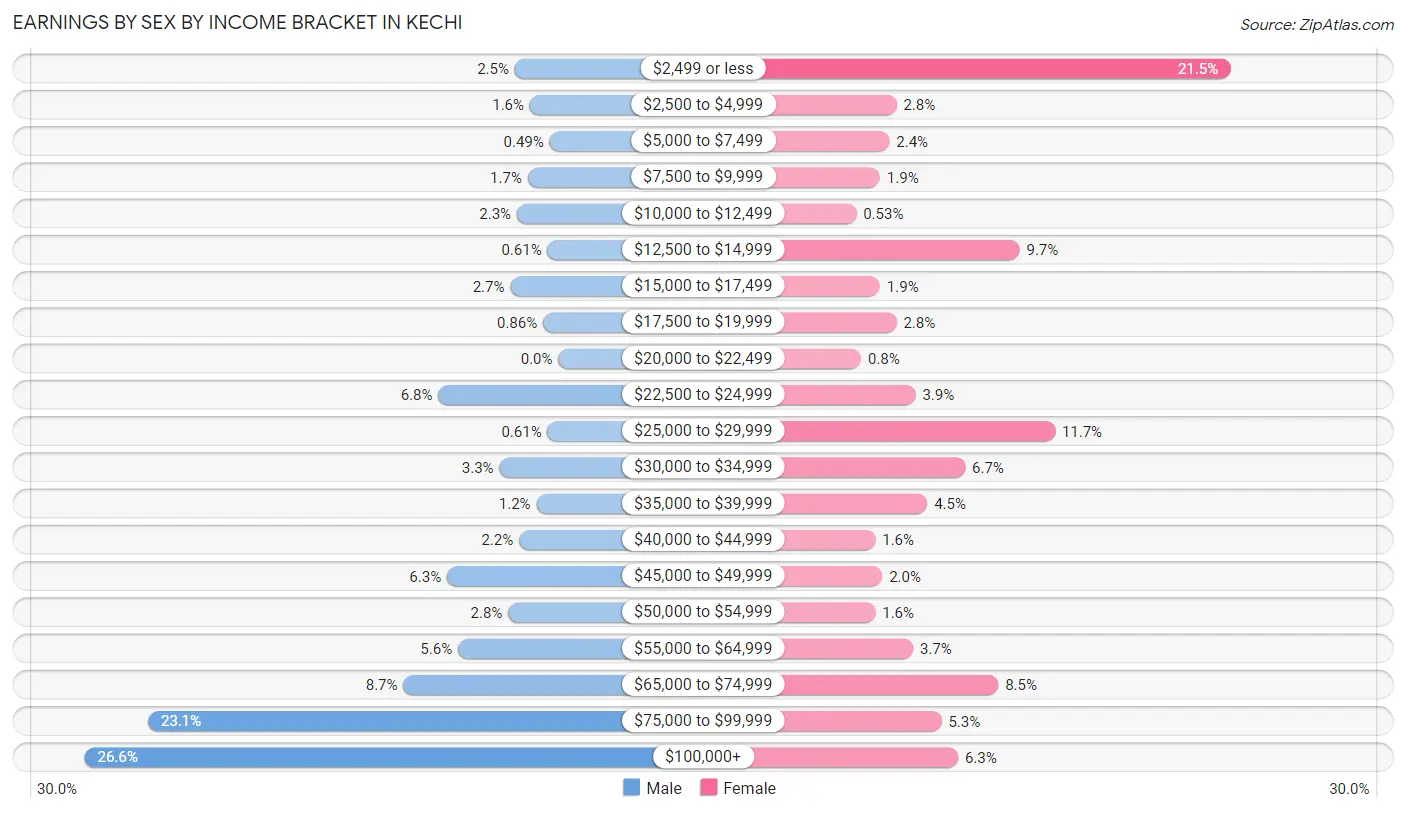
Earnings by Sex by Income Bracket in Kechi
The most common earnings brackets in Kechi are $100,000+ for men (217 | 26.6%) and $2,499 or less for women (162 | 21.5%).
| Income | Male | Female |
| $2,499 or less | 20 (2.5%) | 162 (21.5%) |
| $2,500 to $4,999 | 13 (1.6%) | 21 (2.8%) |
| $5,000 to $7,499 | 4 (0.5%) | 18 (2.4%) |
| $7,500 to $9,999 | 14 (1.7%) | 14 (1.9%) |
| $10,000 to $12,499 | 19 (2.3%) | 4 (0.5%) |
| $12,500 to $14,999 | 5 (0.6%) | 73 (9.7%) |
| $15,000 to $17,499 | 22 (2.7%) | 14 (1.9%) |
| $17,500 to $19,999 | 7 (0.9%) | 21 (2.8%) |
| $20,000 to $22,499 | 0 (0.0%) | 6 (0.8%) |
| $22,500 to $24,999 | 55 (6.8%) | 29 (3.9%) |
| $25,000 to $29,999 | 5 (0.6%) | 88 (11.7%) |
| $30,000 to $34,999 | 27 (3.3%) | 50 (6.7%) |
| $35,000 to $39,999 | 10 (1.2%) | 34 (4.5%) |
| $40,000 to $44,999 | 18 (2.2%) | 12 (1.6%) |
| $45,000 to $49,999 | 51 (6.3%) | 15 (2.0%) |
| $50,000 to $54,999 | 23 (2.8%) | 12 (1.6%) |
| $55,000 to $64,999 | 46 (5.6%) | 28 (3.7%) |
| $65,000 to $74,999 | 71 (8.7%) | 64 (8.5%) |
| $75,000 to $99,999 | 188 (23.1%) | 40 (5.3%) |
| $100,000+ | 217 (26.6%) | 47 (6.2%) |
| Total | 815 (100.0%) | 752 (100.0%) |
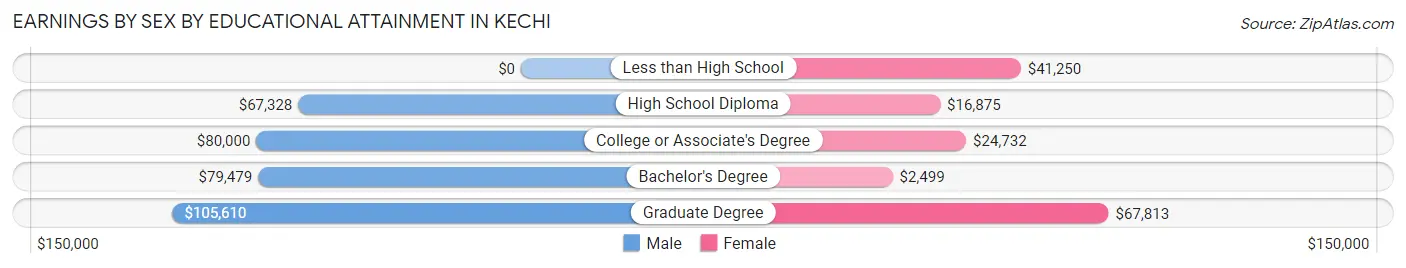
Earnings by Sex by Educational Attainment in Kechi
Average earnings in Kechi are $80,583 for men and $28,117 for women, a difference of 65.1%. Men with an educational attainment of graduate degree enjoy the highest average annual earnings of $105,610, while those with high school diploma education earn the least with $67,328. Women with an educational attainment of graduate degree earn the most with the average annual earnings of $67,813, while those with bachelor's degree education have the smallest earnings of $2,499.
| Educational Attainment | Male Income | Female Income |
| Less than High School | - | - |
| High School Diploma | $67,328 | $16,875 |
| College or Associate's Degree | $80,000 | $24,732 |
| Bachelor's Degree | $79,479 | $2,499 |
| Graduate Degree | $105,610 | $67,813 |
| Total | $80,583 | $28,117 |
Family Income in Kechi
Family Income Brackets in Kechi
According to the Kechi family income data, there are 208 families falling into the $100,000 to $149,999 income range, which is the most common income bracket and makes up 25.4% of all families.
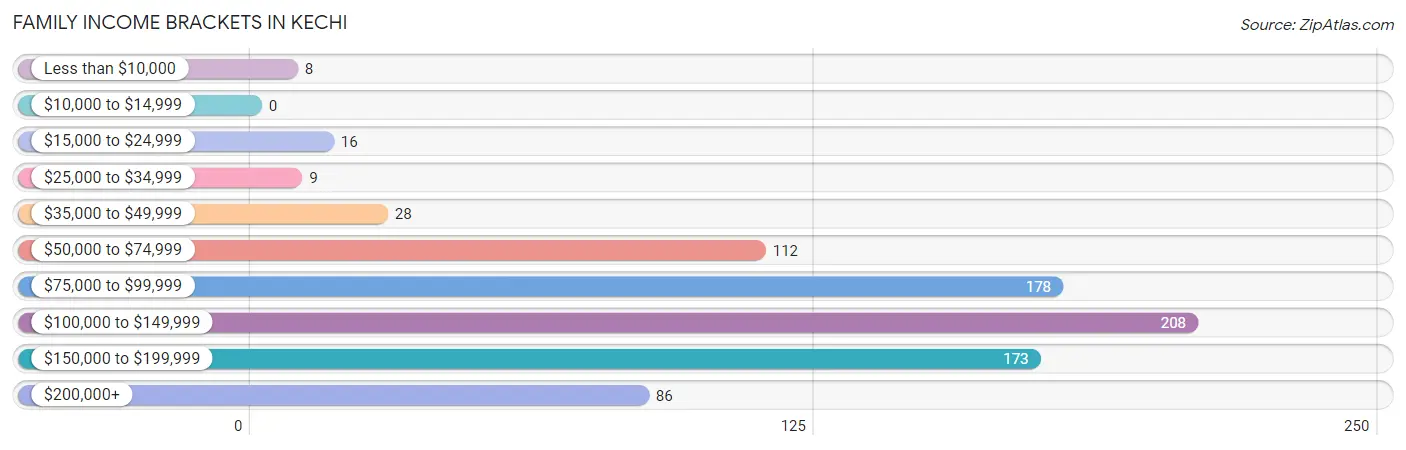
| Income Bracket | # Families | % Families |
| Less than $10,000 | 8 | 1.0% |
| $10,000 to $14,999 | 0 | 0.0% |
| $15,000 to $24,999 | 16 | 2.0% |
| $25,000 to $34,999 | 9 | 1.1% |
| $35,000 to $49,999 | 28 | 3.4% |
| $50,000 to $74,999 | 112 | 13.7% |
| $75,000 to $99,999 | 178 | 21.8% |
| $100,000 to $149,999 | 208 | 25.4% |
| $150,000 to $199,999 | 173 | 21.1% |
| $200,000+ | 86 | 10.5% |
Family Income by Famaliy Size in Kechi
6-person families (17 | 2.1%) account for the highest median family income in Kechi with $189,583 per family, while 3-person families (184 | 22.5%) have the highest median income of $45,625 per family member.
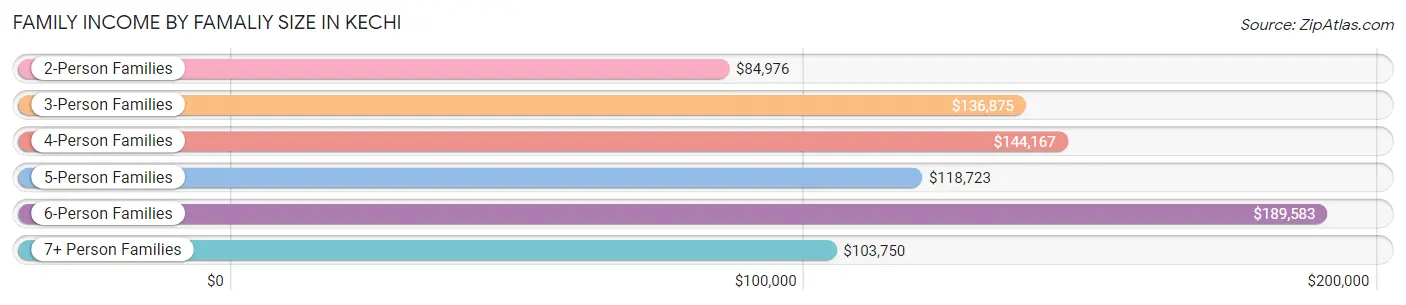
| Income Bracket | # Families | Median Income |
| 2-Person Families | 383 (46.8%) | $84,976 |
| 3-Person Families | 184 (22.5%) | $136,875 |
| 4-Person Families | 114 (13.9%) | $144,167 |
| 5-Person Families | 107 (13.1%) | $118,723 |
| 6-Person Families | 17 (2.1%) | $189,583 |
| 7+ Person Families | 13 (1.6%) | $103,750 |
| Total | 818 (100.0%) | $111,667 |
Family Income by Number of Earners in Kechi
The median family income in Kechi is $111,667, with families comprising 3+ earners (60) having the highest median family income of $164,063, while families with no earners (78) have the lowest median family income of $66,000, accounting for 7.3% and 9.5% of families, respectively.
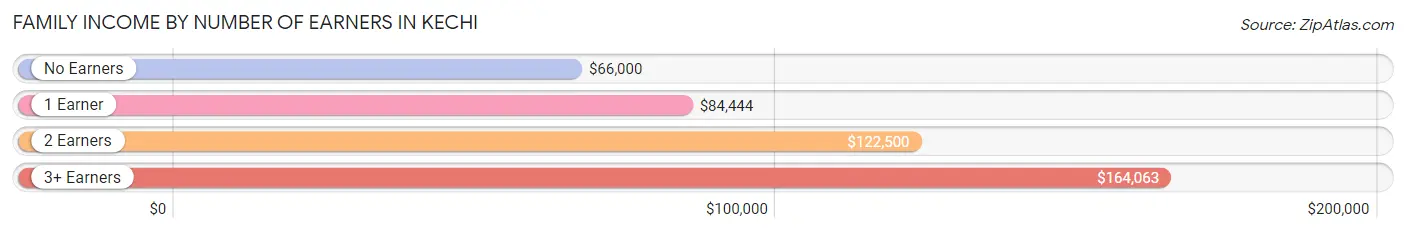
| Number of Earners | # Families | Median Income |
| No Earners | 78 (9.5%) | $66,000 |
| 1 Earner | 232 (28.4%) | $84,444 |
| 2 Earners | 448 (54.8%) | $122,500 |
| 3+ Earners | 60 (7.3%) | $164,063 |
| Total | 818 (100.0%) | $111,667 |
Household Income in Kechi
Household Income Brackets in Kechi
With 230 households falling in the category, the $100,000 to $149,999 income range is the most frequent in Kechi, accounting for 23.9% of all households. In contrast, only 14 households (1.5%) fall into the $10,000 to $14,999 income bracket, making it the least populous group.
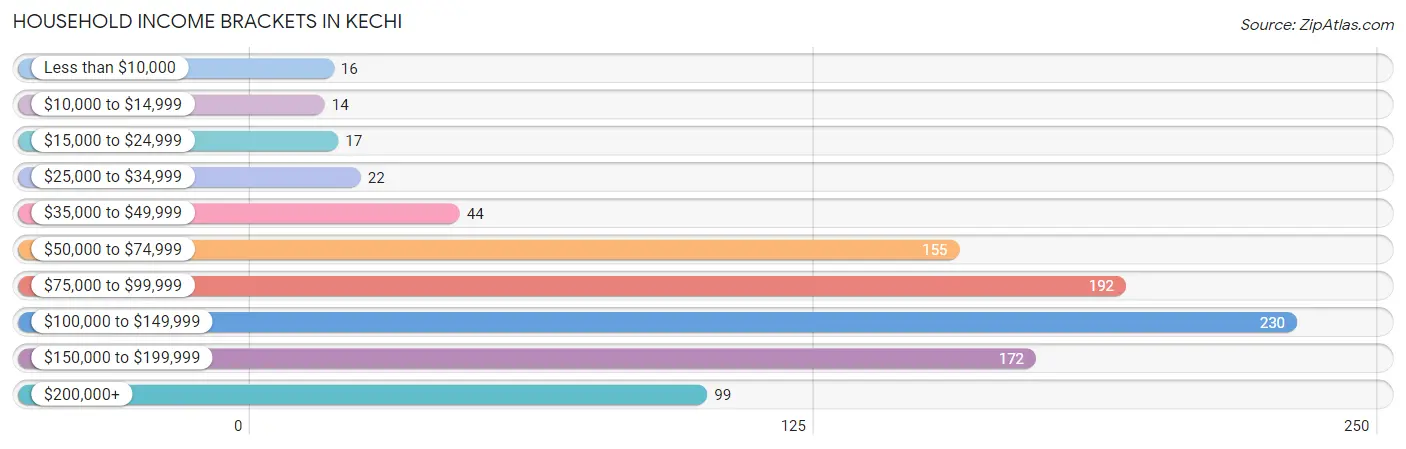
| Income Bracket | # Households | % Households |
| Less than $10,000 | 16 | 1.7% |
| $10,000 to $14,999 | 14 | 1.5% |
| $15,000 to $24,999 | 17 | 1.8% |
| $25,000 to $34,999 | 22 | 2.3% |
| $35,000 to $49,999 | 44 | 4.6% |
| $50,000 to $74,999 | 155 | 16.1% |
| $75,000 to $99,999 | 192 | 20.0% |
| $100,000 to $149,999 | 230 | 23.9% |
| $150,000 to $199,999 | 172 | 17.9% |
| $200,000+ | 99 | 10.3% |
Household Income by Householder Age in Kechi
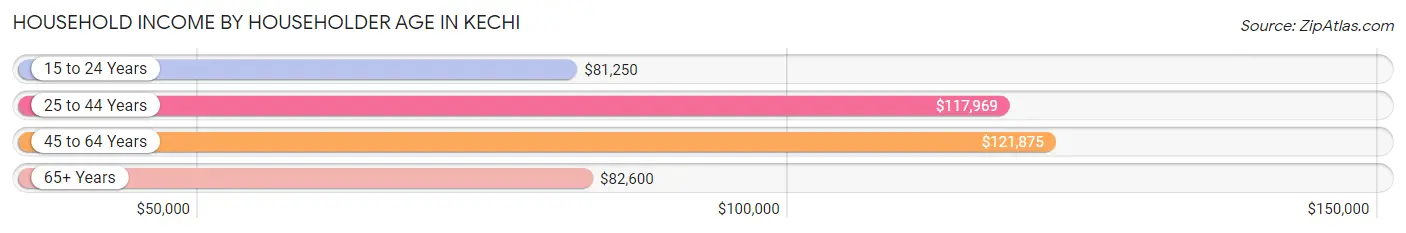
The median household income in Kechi is $103,625, with the highest median household income of $121,875 found in the 45 to 64 years age bracket for the primary householder. A total of 323 households (33.6%) fall into this category. Meanwhile, the 15 to 24 years age bracket for the primary householder has the lowest median household income of $81,250, with 13 households (1.3%) in this group.
| Income Bracket | # Households | Median Income |
| 15 to 24 Years | 13 (1.3%) | $81,250 |
| 25 to 44 Years | 387 (40.3%) | $117,969 |
| 45 to 64 Years | 323 (33.6%) | $121,875 |
| 65+ Years | 238 (24.8%) | $82,600 |
| Total | 961 (100.0%) | $103,625 |
Poverty in Kechi
Income Below Poverty by Sex and Age in Kechi
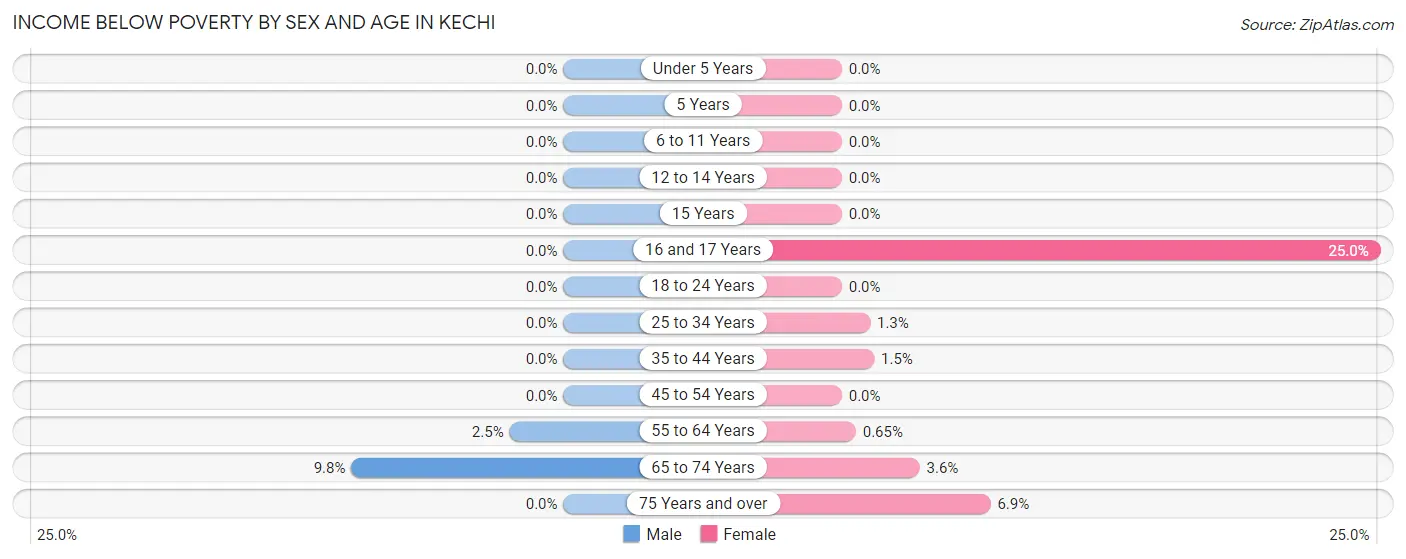
With 0.9% poverty level for males and 1.7% for females among the residents of Kechi, 65 to 74 year old males and 16 and 17 year old females are the most vulnerable to poverty, with 6 males (9.8%) and 3 females (25.0%) in their respective age groups living below the poverty level.
| Age Bracket | Male | Female |
| Under 5 Years | 0 (0.0%) | 0 (0.0%) |
| 5 Years | 0 (0.0%) | 0 (0.0%) |
| 6 to 11 Years | 0 (0.0%) | 0 (0.0%) |
| 12 to 14 Years | 0 (0.0%) | 0 (0.0%) |
| 15 Years | 0 (0.0%) | 0 (0.0%) |
| 16 and 17 Years | 0 (0.0%) | 3 (25.0%) |
| 18 to 24 Years | 0 (0.0%) | 0 (0.0%) |
| 25 to 34 Years | 0 (0.0%) | 2 (1.3%) |
| 35 to 44 Years | 0 (0.0%) | 4 (1.5%) |
| 45 to 54 Years | 0 (0.0%) | 0 (0.0%) |
| 55 to 64 Years | 5 (2.5%) | 1 (0.6%) |
| 65 to 74 Years | 6 (9.8%) | 7 (3.6%) |
| 75 Years and over | 0 (0.0%) | 12 (6.9%) |
| Total | 11 (0.9%) | 29 (1.7%) |
Income Above Poverty by Sex and Age in Kechi
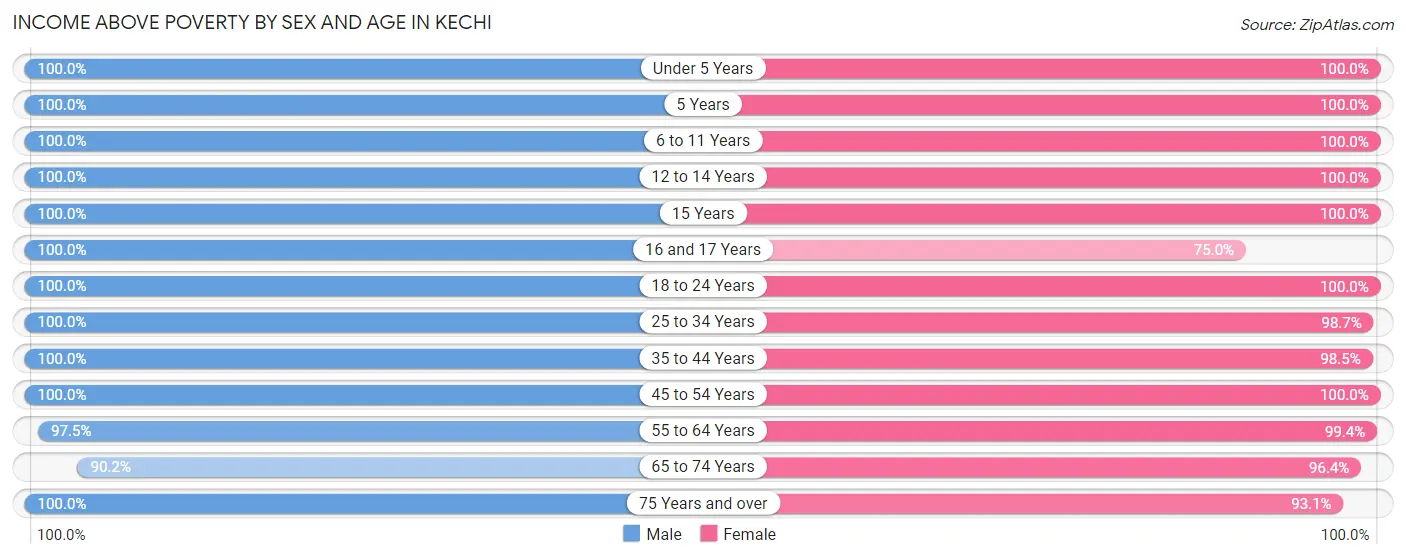
According to the poverty statistics in Kechi, males aged under 5 years and females aged under 5 years are the age groups that are most secure financially, with 100.0% of males and 100.0% of females in these age groups living above the poverty line.
| Age Bracket | Male | Female |
| Under 5 Years | 78 (100.0%) | 237 (100.0%) |
| 5 Years | 5 (100.0%) | 29 (100.0%) |
| 6 to 11 Years | 121 (100.0%) | 84 (100.0%) |
| 12 to 14 Years | 15 (100.0%) | 78 (100.0%) |
| 15 Years | 23 (100.0%) | 58 (100.0%) |
| 16 and 17 Years | 26 (100.0%) | 9 (75.0%) |
| 18 to 24 Years | 113 (100.0%) | 116 (100.0%) |
| 25 to 34 Years | 161 (100.0%) | 151 (98.7%) |
| 35 to 44 Years | 198 (100.0%) | 262 (98.5%) |
| 45 to 54 Years | 141 (100.0%) | 159 (100.0%) |
| 55 to 64 Years | 195 (97.5%) | 154 (99.4%) |
| 65 to 74 Years | 55 (90.2%) | 187 (96.4%) |
| 75 Years and over | 89 (100.0%) | 162 (93.1%) |
| Total | 1,220 (99.1%) | 1,686 (98.3%) |
Income Below Poverty Among Married-Couple Families in Kechi
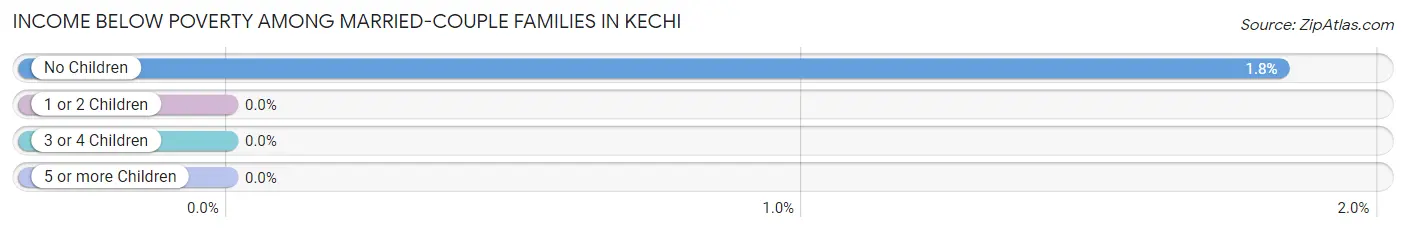
The poverty statistics for married-couple families in Kechi show that 1.1% or 8 of the total 751 families live below the poverty line. Families with no children have the highest poverty rate of 1.8%, comprising of 8 families. On the other hand, families with 1 or 2 children have the lowest poverty rate of 0.0%, which includes 0 families.
| Children | Above Poverty | Below Poverty |
| No Children | 430 (98.2%) | 8 (1.8%) |
| 1 or 2 Children | 236 (100.0%) | 0 (0.0%) |
| 3 or 4 Children | 68 (100.0%) | 0 (0.0%) |
| 5 or more Children | 9 (100.0%) | 0 (0.0%) |
| Total | 743 (98.9%) | 8 (1.1%) |
Income Below Poverty Among Single-Parent Households in Kechi
| Children | Single Father | Single Mother |
| No Children | 0 (0.0%) | 0 (0.0%) |
| 1 or 2 Children | 0 (0.0%) | 0 (0.0%) |
| 3 or 4 Children | 0 (0.0%) | 0 (0.0%) |
| 5 or more Children | 0 (0.0%) | 0 (0.0%) |
| Total | 0 (0.0%) | 0 (0.0%) |
Income Below Poverty Among Married-Couple vs Single-Parent Households in Kechi
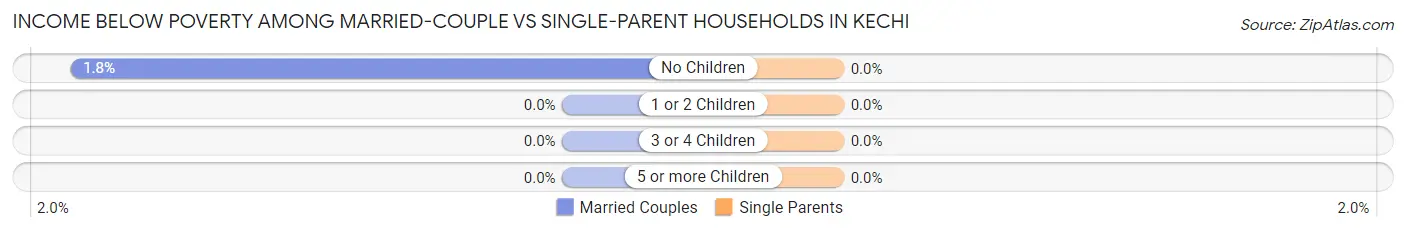
| Children | Married-Couple Families | Single-Parent Households |
| No Children | 8 (1.8%) | 0 (0.0%) |
| 1 or 2 Children | 0 (0.0%) | 0 (0.0%) |
| 3 or 4 Children | 0 (0.0%) | 0 (0.0%) |
| 5 or more Children | 0 (0.0%) | 0 (0.0%) |
| Total | 8 (1.1%) | 0 (0.0%) |
Race in Kechi
The most populous races in Kechi are White / Caucasian (2,183 | 74.0%), Asian (283 | 9.6%), and Black / African American (237 | 8.0%).
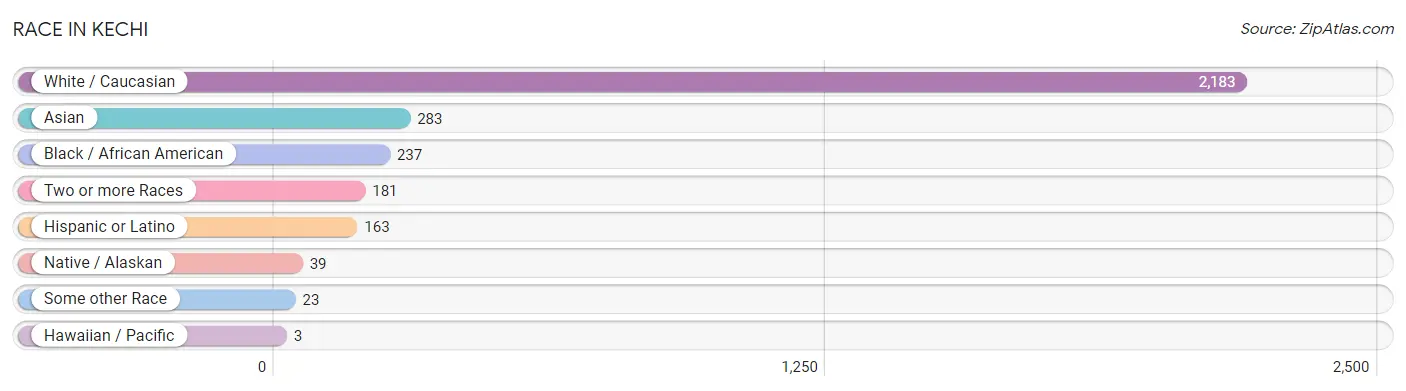
| Race | # Population | % Population |
| Asian | 283 | 9.6% |
| Black / African American | 237 | 8.0% |
| Hawaiian / Pacific | 3 | 0.1% |
| Hispanic or Latino | 163 | 5.5% |
| Native / Alaskan | 39 | 1.3% |
| White / Caucasian | 2,183 | 74.0% |
| Two or more Races | 181 | 6.1% |
| Some other Race | 23 | 0.8% |
| Total | 2,949 | 100.0% |
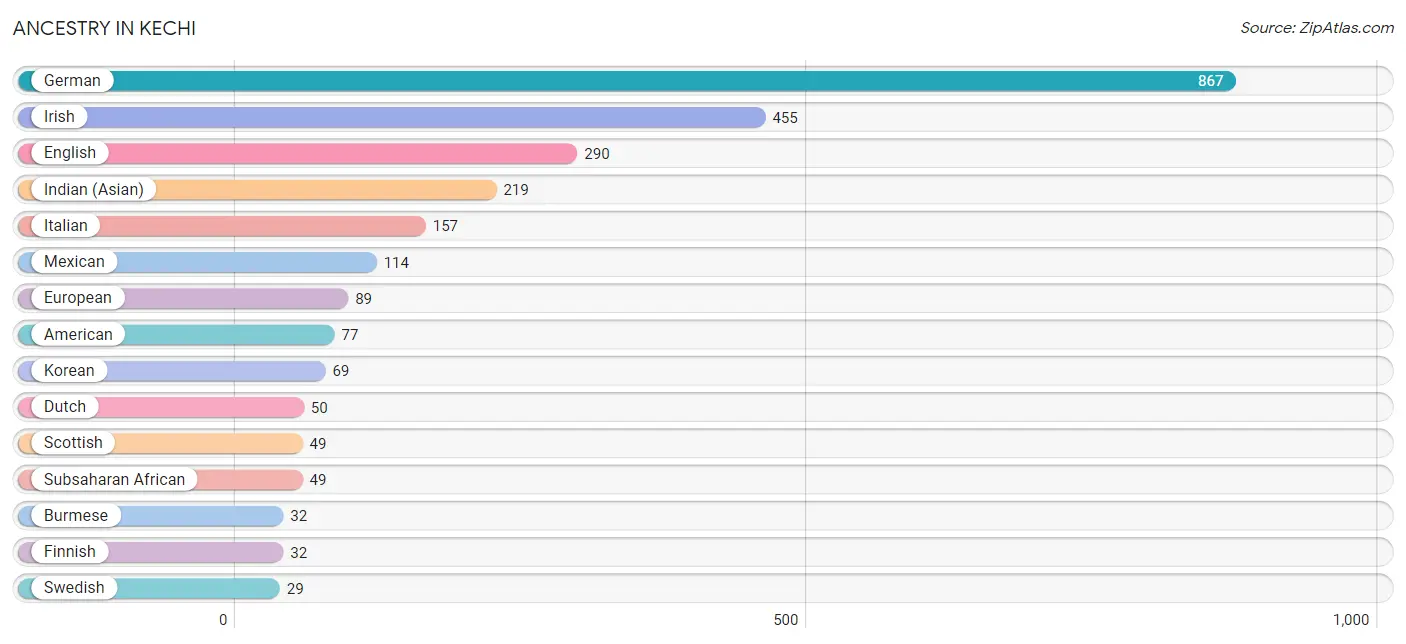
Ancestry in Kechi
The most populous ancestries reported in Kechi are German (867 | 29.4%), Irish (455 | 15.4%), English (290 | 9.8%), Indian (Asian) (219 | 7.4%), and Italian (157 | 5.3%), together accounting for 67.4% of all Kechi residents.
| Ancestry | # Population | % Population |
| African | 20 | 0.7% |
| American | 77 | 2.6% |
| Arab | 7 | 0.2% |
| Austrian | 21 | 0.7% |
| Bhutanese | 10 | 0.3% |
| British | 18 | 0.6% |
| Burmese | 32 | 1.1% |
| Central American | 16 | 0.5% |
| Cherokee | 14 | 0.5% |
| Chickasaw | 1 | 0.0% |
| Colombian | 2 | 0.1% |
| Creek | 3 | 0.1% |
| Danish | 3 | 0.1% |
| Delaware | 1 | 0.0% |
| Dutch | 50 | 1.7% |
| Eastern European | 11 | 0.4% |
| English | 290 | 9.8% |
| Ethiopian | 18 | 0.6% |
| European | 89 | 3.0% |
| Finnish | 32 | 1.1% |
| French | 17 | 0.6% |
| French Canadian | 7 | 0.2% |
| German | 867 | 29.4% |
| Greek | 4 | 0.1% |
| Indian (Asian) | 219 | 7.4% |
| Iranian | 4 | 0.1% |
| Iraqi | 7 | 0.2% |
| Irish | 455 | 15.4% |
| Italian | 157 | 5.3% |
| Kenyan | 11 | 0.4% |
| Korean | 69 | 2.3% |
| Mexican | 114 | 3.9% |
| Native Hawaiian | 12 | 0.4% |
| Navajo | 2 | 0.1% |
| Northern European | 3 | 0.1% |
| Norwegian | 23 | 0.8% |
| Pennsylvania German | 3 | 0.1% |
| Peruvian | 2 | 0.1% |
| Polish | 21 | 0.7% |
| Russian | 26 | 0.9% |
| Salvadoran | 16 | 0.5% |
| Scandinavian | 19 | 0.6% |
| Scotch-Irish | 21 | 0.7% |
| Scottish | 49 | 1.7% |
| Sioux | 1 | 0.0% |
| South American | 4 | 0.1% |
| Spaniard | 7 | 0.2% |
| Sri Lankan | 11 | 0.4% |
| Subsaharan African | 49 | 1.7% |
| Swedish | 29 | 1.0% |
| Swiss | 2 | 0.1% |
| Thai | 19 | 0.6% |
| Welsh | 4 | 0.1% | View All 53 Rows |
Immigrants in Kechi
The most numerous immigrant groups reported in Kechi came from Asia (99 | 3.4%), South Eastern Asia (86 | 2.9%), Indonesia (43 | 1.5%), Philippines (38 | 1.3%), and Latin America (28 | 0.9%), together accounting for 10.0% of all Kechi residents.
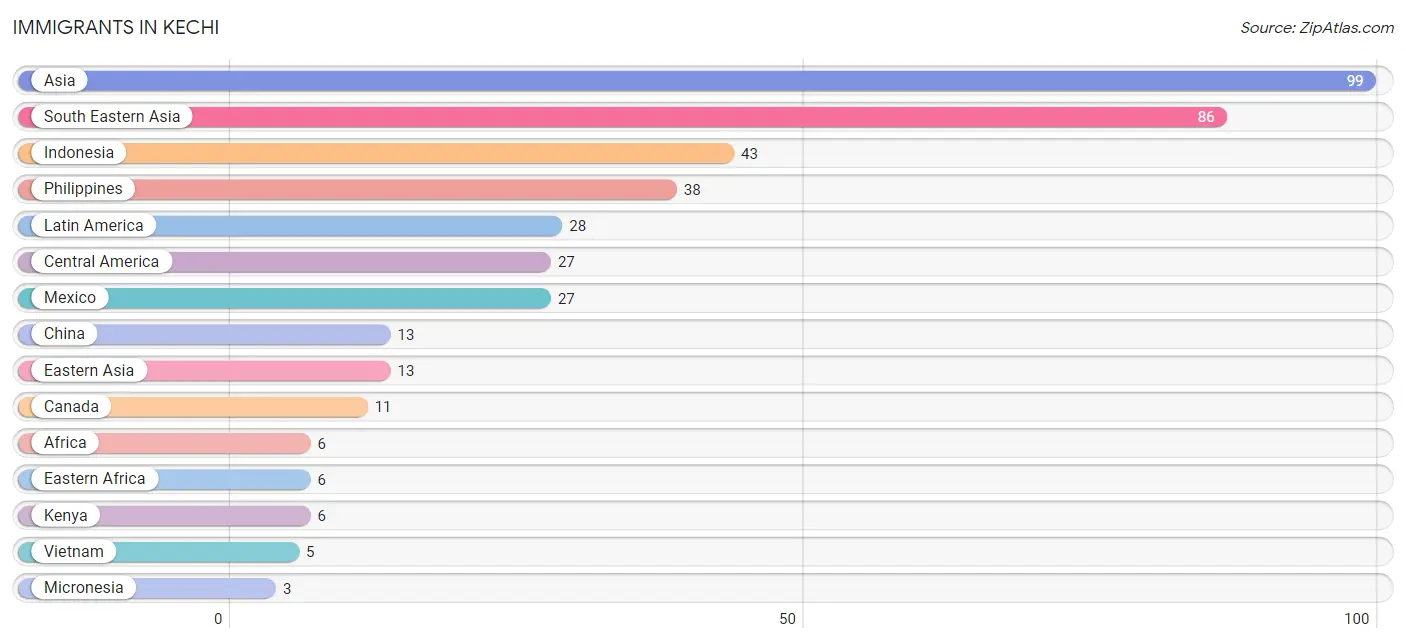
| Immigration Origin | # Population | % Population |
| Africa | 6 | 0.2% |
| Asia | 99 | 3.4% |
| Canada | 11 | 0.4% |
| Central America | 27 | 0.9% |
| China | 13 | 0.4% |
| Colombia | 1 | 0.0% |
| Eastern Africa | 6 | 0.2% |
| Eastern Asia | 13 | 0.4% |
| Europe | 2 | 0.1% |
| Indonesia | 43 | 1.5% |
| Kenya | 6 | 0.2% |
| Latin America | 28 | 0.9% |
| Mexico | 27 | 0.9% |
| Micronesia | 3 | 0.1% |
| Netherlands | 2 | 0.1% |
| Oceania | 3 | 0.1% |
| Philippines | 38 | 1.3% |
| South America | 1 | 0.0% |
| South Eastern Asia | 86 | 2.9% |
| Vietnam | 5 | 0.2% |
| Western Europe | 2 | 0.1% | View All 21 Rows |
Sex and Age in Kechi
Sex and Age in Kechi
The most populous age groups in Kechi are 40 to 44 Years (146 | 11.9%) for men and Under 5 Years (237 | 13.8%) for women.
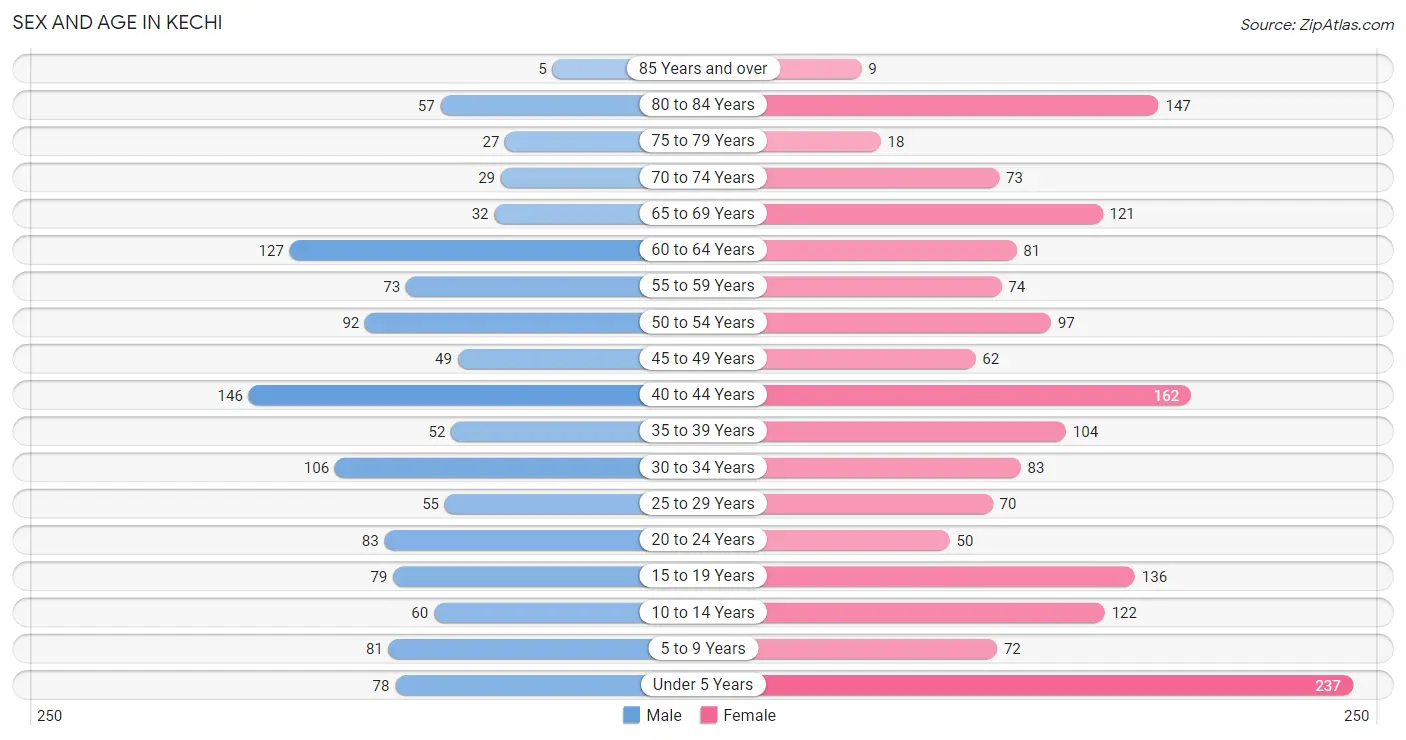
| Age Bracket | Male | Female |
| Under 5 Years | 78 (6.3%) | 237 (13.8%) |
| 5 to 9 Years | 81 (6.6%) | 72 (4.2%) |
| 10 to 14 Years | 60 (4.9%) | 122 (7.1%) |
| 15 to 19 Years | 79 (6.4%) | 136 (7.9%) |
| 20 to 24 Years | 83 (6.7%) | 50 (2.9%) |
| 25 to 29 Years | 55 (4.5%) | 70 (4.1%) |
| 30 to 34 Years | 106 (8.6%) | 83 (4.8%) |
| 35 to 39 Years | 52 (4.2%) | 104 (6.0%) |
| 40 to 44 Years | 146 (11.9%) | 162 (9.4%) |
| 45 to 49 Years | 49 (4.0%) | 62 (3.6%) |
| 50 to 54 Years | 92 (7.5%) | 97 (5.7%) |
| 55 to 59 Years | 73 (5.9%) | 74 (4.3%) |
| 60 to 64 Years | 127 (10.3%) | 81 (4.7%) |
| 65 to 69 Years | 32 (2.6%) | 121 (7.0%) |
| 70 to 74 Years | 29 (2.4%) | 73 (4.3%) |
| 75 to 79 Years | 27 (2.2%) | 18 (1.1%) |
| 80 to 84 Years | 57 (4.6%) | 147 (8.6%) |
| 85 Years and over | 5 (0.4%) | 9 (0.5%) |
| Total | 1,231 (100.0%) | 1,718 (100.0%) |
Families and Households in Kechi
Median Family Size in Kechi
The median family size in Kechi is 3.33 persons per family, with married-couple families (751 | 91.8%) accounting for the largest median family size of 3.42 persons per family. On the other hand, single male/father families (15 | 1.8%) represent the smallest median family size with 1.93 persons per family.
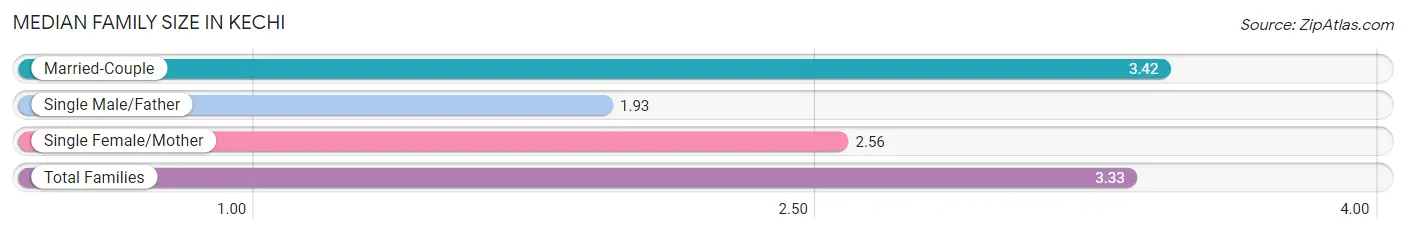
| Family Type | # Families | Family Size |
| Married-Couple | 751 (91.8%) | 3.42 |
| Single Male/Father | 15 (1.8%) | 1.93 |
| Single Female/Mother | 52 (6.4%) | 2.56 |
| Total Families | 818 (100.0%) | 3.33 |
Median Household Size in Kechi
The median household size in Kechi is 3.07 persons per household, with married-couple households (751 | 78.1%) accounting for the largest median household size of 3.43 persons per household. non-family households (143 | 14.9%) represent the smallest median household size with 1.44 persons per household.
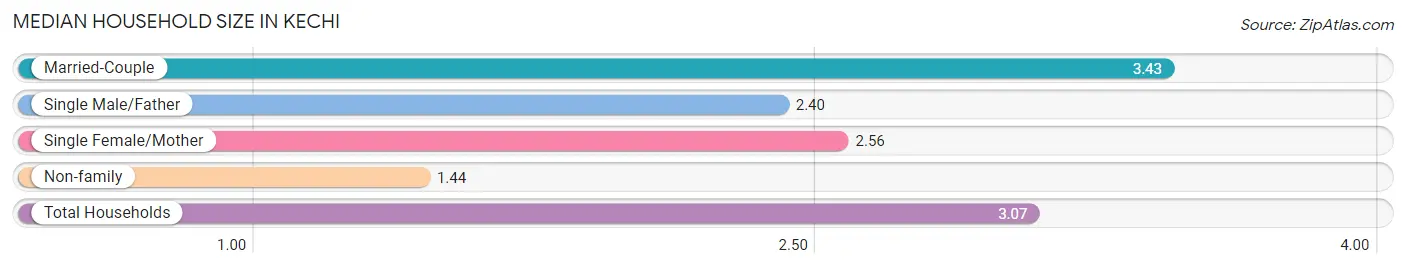
| Household Type | # Households | Household Size |
| Married-Couple | 751 (78.1%) | 3.43 |
| Single Male/Father | 15 (1.6%) | 2.40 |
| Single Female/Mother | 52 (5.4%) | 2.56 |
| Non-family | 143 (14.9%) | 1.44 |
| Total Households | 961 (100.0%) | 3.07 |
Household Size by Marriage Status in Kechi
Out of a total of 961 households in Kechi, 818 (85.1%) are family households, while 143 (14.9%) are nonfamily households. The most numerous type of family households are 2-person households, comprising 373, and the most common type of nonfamily households are 1-person households, comprising 119.
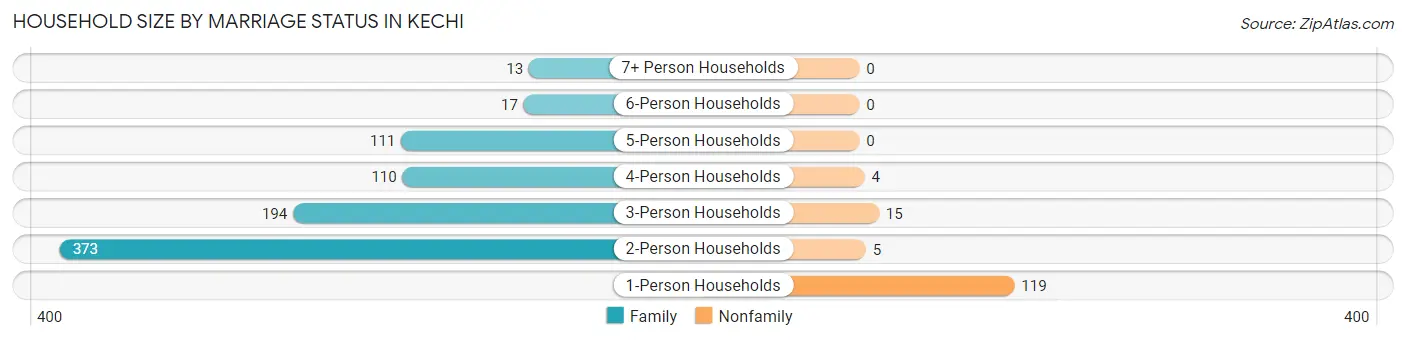
| Household Size | Family Households | Nonfamily Households |
| 1-Person Households | - | 119 (12.4%) |
| 2-Person Households | 373 (38.8%) | 5 (0.5%) |
| 3-Person Households | 194 (20.2%) | 15 (1.6%) |
| 4-Person Households | 110 (11.5%) | 4 (0.4%) |
| 5-Person Households | 111 (11.6%) | 0 (0.0%) |
| 6-Person Households | 17 (1.8%) | 0 (0.0%) |
| 7+ Person Households | 13 (1.3%) | 0 (0.0%) |
| Total | 818 (85.1%) | 143 (14.9%) |
Female Fertility in Kechi
Fertility by Age in Kechi
Average fertility rate in Kechi is 36.0 births per 1,000 women. Women in the age bracket of 20 to 34 years have the highest fertility rate with 74.0 births per 1,000 women. Women in the age bracket of 20 to 34 years acount for 60.0% of all women with births.
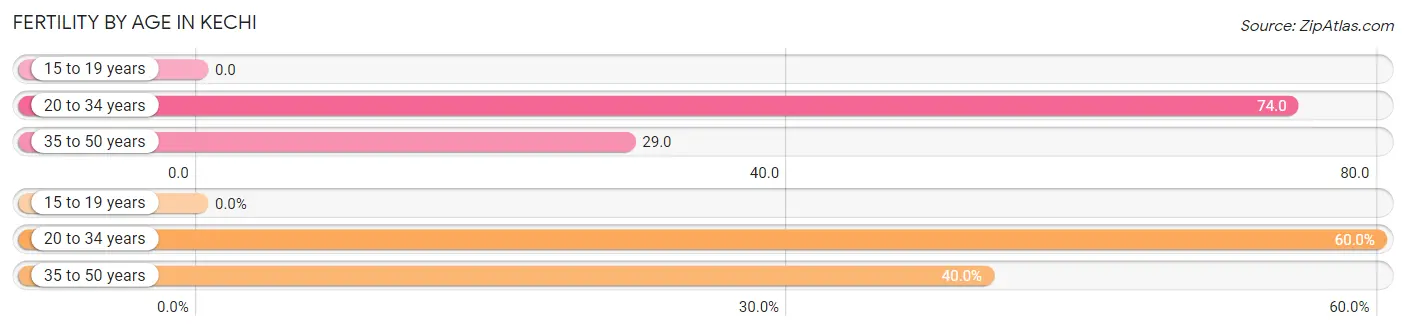
| Age Bracket | Women with Births | Births / 1,000 Women |
| 15 to 19 years | 0 (0.0%) | 0.0 |
| 20 to 34 years | 15 (60.0%) | 74.0 |
| 35 to 50 years | 10 (40.0%) | 29.0 |
| Total | 25 (100.0%) | 36.0 |
Fertility by Age by Marriage Status in Kechi
92.0% of women with births (25) in Kechi are married. The highest percentage of unmarried women with births falls into 35 to 50 years age bracket with 20.0% of them unmarried at the time of birth, while the lowest percentage of unmarried women with births belong to 20 to 34 years age bracket with 0.0% of them unmarried.
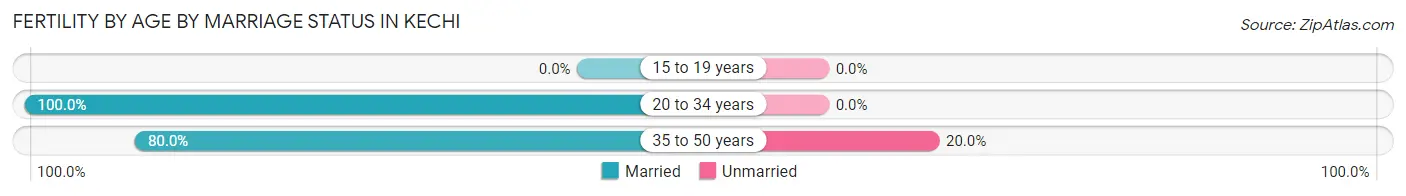
| Age Bracket | Married | Unmarried |
| 15 to 19 years | 0 (0.0%) | 0 (0.0%) |
| 20 to 34 years | 15 (100.0%) | 0 (0.0%) |
| 35 to 50 years | 8 (80.0%) | 2 (20.0%) |
| Total | 23 (92.0%) | 2 (8.0%) |
Fertility by Education in Kechi
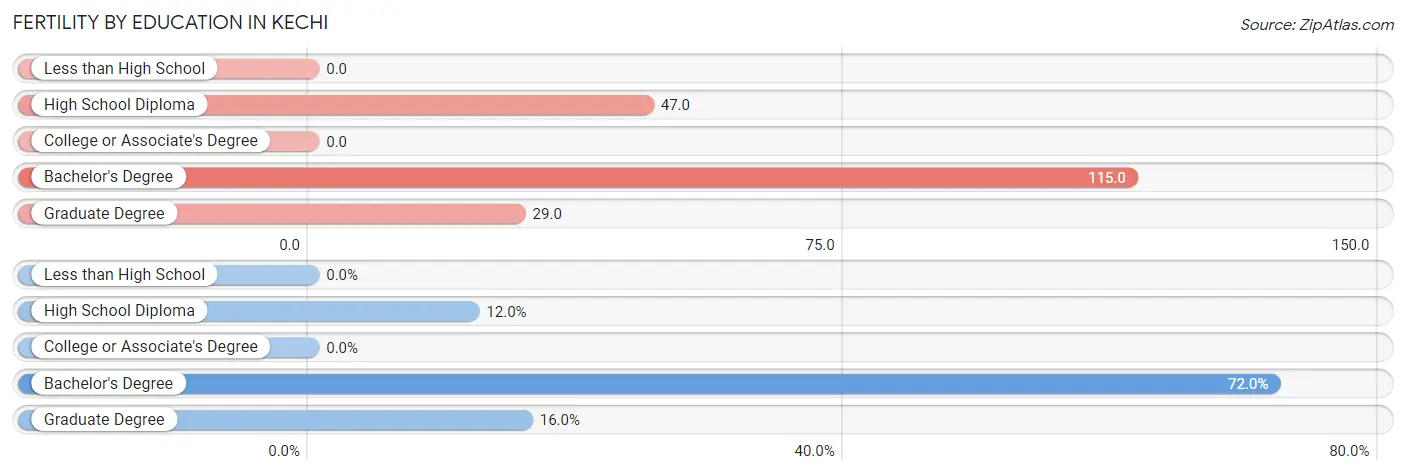
| Educational Attainment | Women with Births | Births / 1,000 Women |
| Less than High School | 0 (0.0%) | 0.0 |
| High School Diploma | 3 (12.0%) | 47.0 |
| College or Associate's Degree | 0 (0.0%) | 0.0 |
| Bachelor's Degree | 18 (72.0%) | 115.0 |
| Graduate Degree | 4 (16.0%) | 29.0 |
| Total | 25 (100.0%) | 36.0 |
Fertility by Education by Marriage Status in Kechi
8.0% of women with births in Kechi are unmarried. Women with the educational attainment of high school diploma are most likely to be married with 100.0% of them married at childbirth, while women with the educational attainment of bachelor's degree are least likely to be married with 11.1% of them unmarried at childbirth.
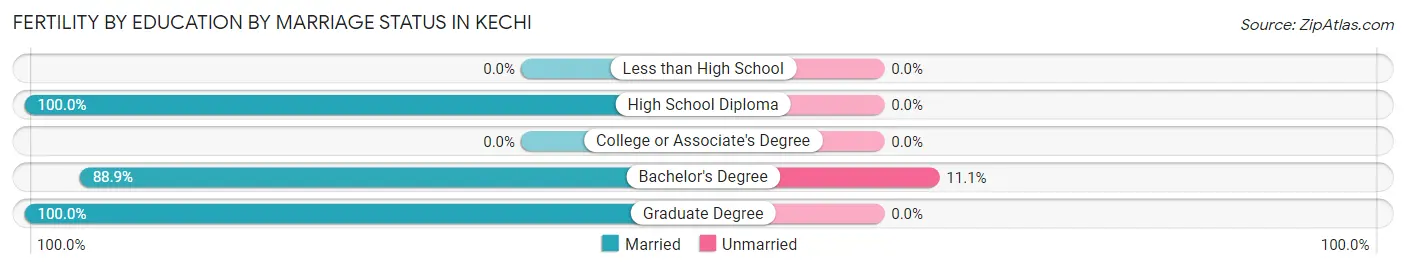
| Educational Attainment | Married | Unmarried |
| Less than High School | 0 (0.0%) | 0 (0.0%) |
| High School Diploma | 3 (100.0%) | 0 (0.0%) |
| College or Associate's Degree | 0 (0.0%) | 0 (0.0%) |
| Bachelor's Degree | 16 (88.9%) | 2 (11.1%) |
| Graduate Degree | 4 (100.0%) | 0 (0.0%) |
| Total | 23 (92.0%) | 2 (8.0%) |
Employment Characteristics in Kechi
Employment by Class of Employer in Kechi
Among the 1,468 employed individuals in Kechi, private company employees (925 | 63.0%), local government employees (249 | 17.0%), and not-for-profit organizations (80 | 5.4%) make up the most common classes of employment.
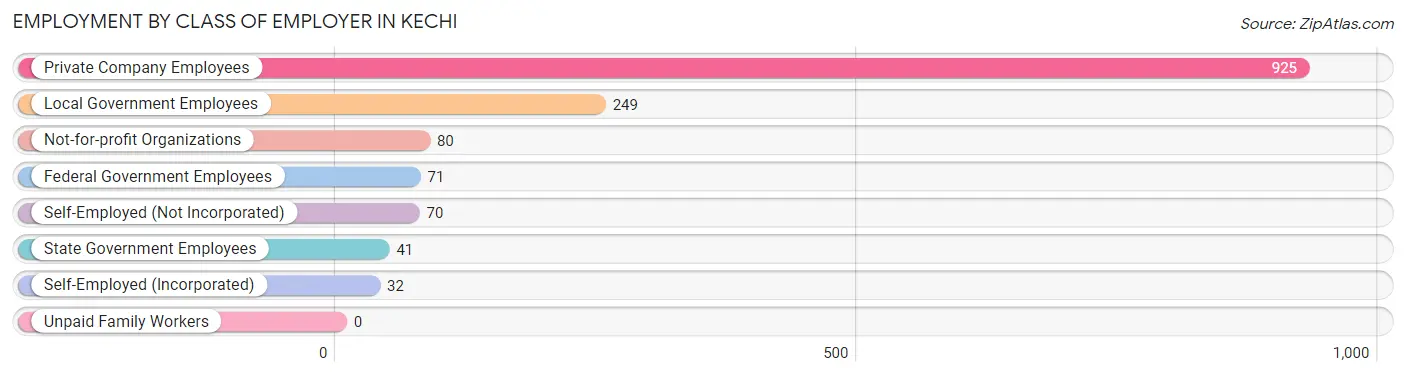
| Employer Class | # Employees | % Employees |
| Private Company Employees | 925 | 63.0% |
| Self-Employed (Incorporated) | 32 | 2.2% |
| Self-Employed (Not Incorporated) | 70 | 4.8% |
| Not-for-profit Organizations | 80 | 5.4% |
| Local Government Employees | 249 | 17.0% |
| State Government Employees | 41 | 2.8% |
| Federal Government Employees | 71 | 4.8% |
| Unpaid Family Workers | 0 | 0.0% |
| Total | 1,468 | 100.0% |
Employment Status by Age in Kechi
According to the labor force statistics for Kechi, out of the total population over 16 years of age (2,218), 68.0% or 1,508 individuals are in the labor force, with 1.3% or 20 of them unemployed. The age group with the highest labor force participation rate is 30 to 34 years, with 90.5% or 171 individuals in the labor force. Within the labor force, the 45 to 54 years age range has the highest percentage of unemployed individuals, with 4.6% or 11 of them being unemployed.
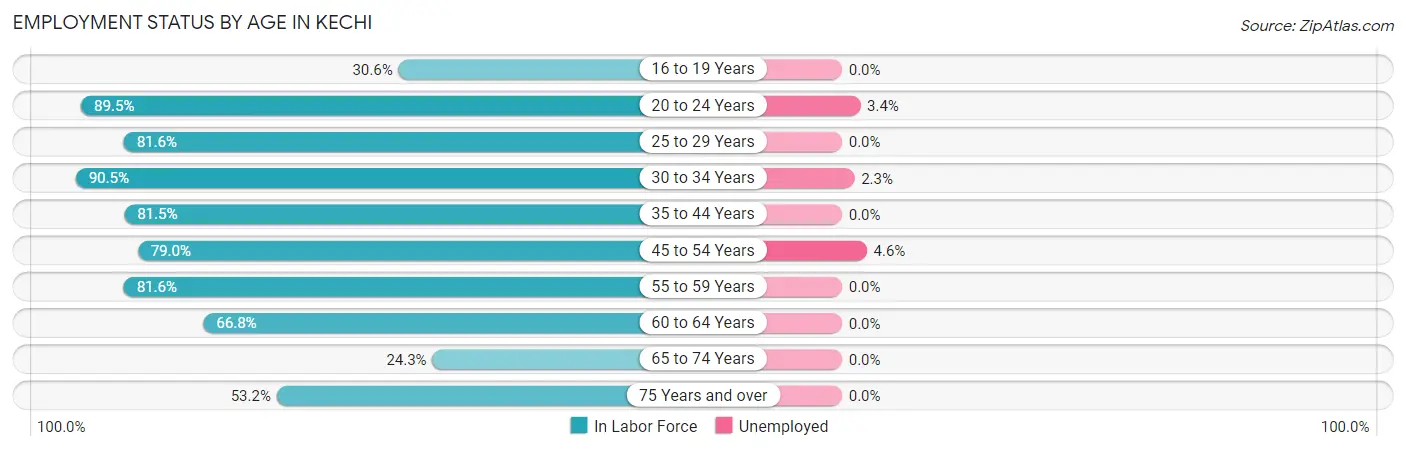
| Age Bracket | In Labor Force | Unemployed |
| 16 to 19 Years | 41 (30.6%) | 0 (0.0%) |
| 20 to 24 Years | 119 (89.5%) | 4 (3.4%) |
| 25 to 29 Years | 102 (81.6%) | 0 (0.0%) |
| 30 to 34 Years | 171 (90.5%) | 4 (2.3%) |
| 35 to 44 Years | 378 (81.5%) | 0 (0.0%) |
| 45 to 54 Years | 237 (79.0%) | 11 (4.6%) |
| 55 to 59 Years | 120 (81.6%) | 0 (0.0%) |
| 60 to 64 Years | 139 (66.8%) | 0 (0.0%) |
| 65 to 74 Years | 62 (24.3%) | 0 (0.0%) |
| 75 Years and over | 140 (53.2%) | 0 (0.0%) |
| Total | 1,508 (68.0%) | 20 (1.3%) |
Employment Status by Educational Attainment in Kechi
According to labor force statistics for Kechi, 80.0% of individuals (1,146) out of the total population between 25 and 64 years of age (1,433) are in the labor force, with 1.3% or 15 of them being unemployed. The group with the highest labor force participation rate are those with the educational attainment of bachelor's degree or higher, with 86.3% or 630 individuals in the labor force. Within the labor force, individuals with bachelor's degree or higher education have the highest percentage of unemployment, with 2.4% or 15 of them being unemployed.
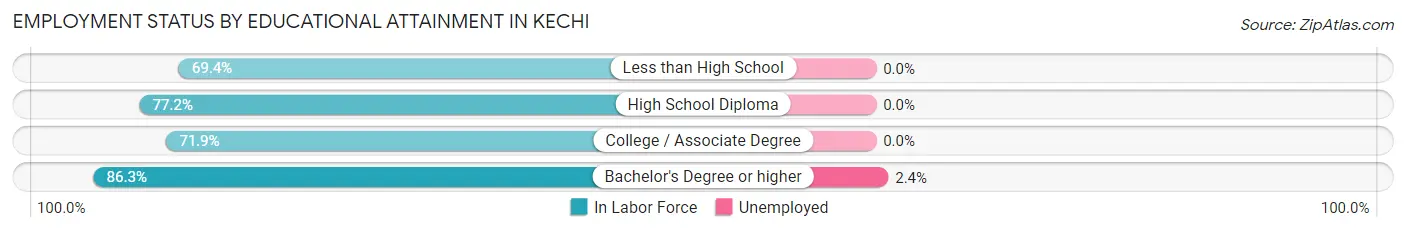
| Educational Attainment | In Labor Force | Unemployed |
| Less than High School | 43 (69.4%) | 0 (0.0%) |
| High School Diploma | 193 (77.2%) | 0 (0.0%) |
| College / Associate Degree | 281 (71.9%) | 0 (0.0%) |
| Bachelor's Degree or higher | 630 (86.3%) | 18 (2.4%) |
| Total | 1,146 (80.0%) | 19 (1.3%) |
Employment Occupations by Sex in Kechi
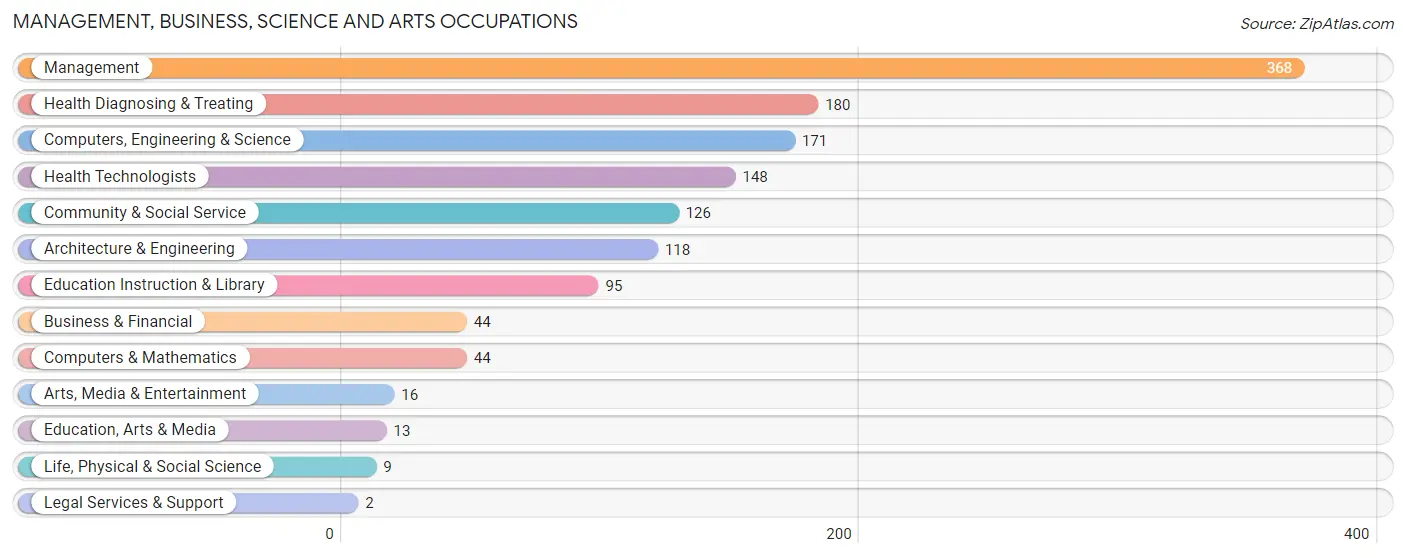
Management, Business, Science and Arts Occupations
The most common Management, Business, Science and Arts occupations in Kechi are Management (368 | 24.7%), Health Diagnosing & Treating (180 | 12.1%), Computers, Engineering & Science (171 | 11.5%), Health Technologists (148 | 9.9%), and Community & Social Service (126 | 8.5%).
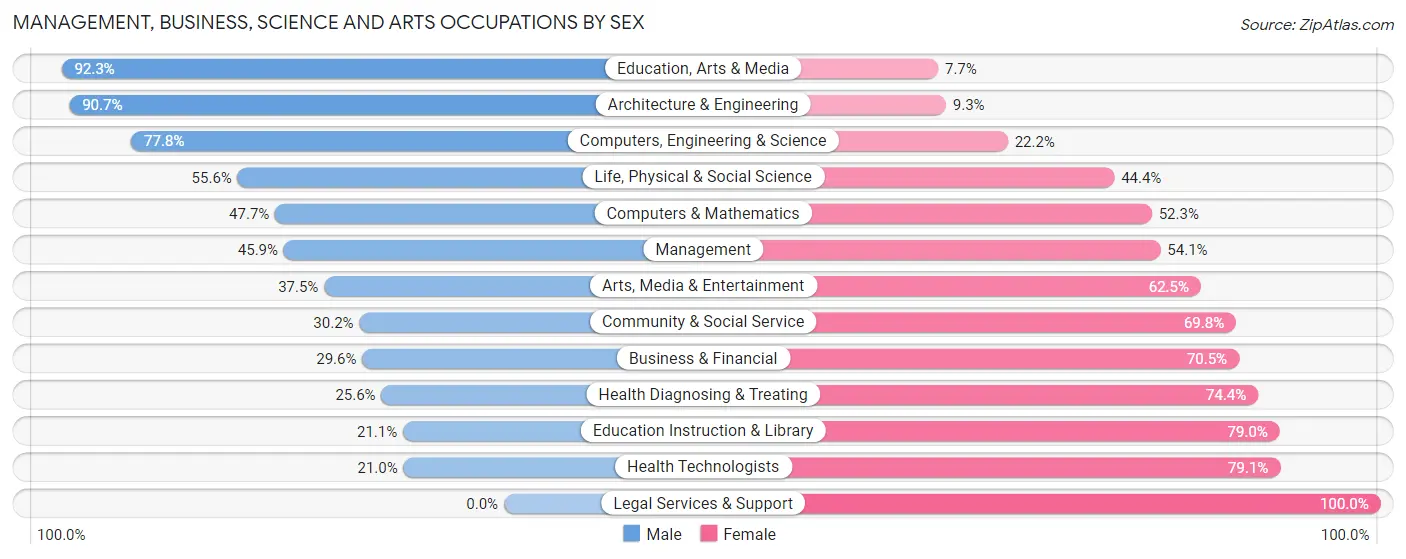
Management, Business, Science and Arts Occupations by Sex
Within the Management, Business, Science and Arts occupations in Kechi, the most male-oriented occupations are Education, Arts & Media (92.3%), Architecture & Engineering (90.7%), and Computers, Engineering & Science (77.8%), while the most female-oriented occupations are Legal Services & Support (100.0%), Health Technologists (79.0%), and Education Instruction & Library (78.9%).
| Occupation | Male | Female |
| Management | 169 (45.9%) | 199 (54.1%) |
| Business & Financial | 13 (29.5%) | 31 (70.5%) |
| Computers, Engineering & Science | 133 (77.8%) | 38 (22.2%) |
| Computers & Mathematics | 21 (47.7%) | 23 (52.3%) |
| Architecture & Engineering | 107 (90.7%) | 11 (9.3%) |
| Life, Physical & Social Science | 5 (55.6%) | 4 (44.4%) |
| Community & Social Service | 38 (30.2%) | 88 (69.8%) |
| Education, Arts & Media | 12 (92.3%) | 1 (7.7%) |
| Legal Services & Support | 0 (0.0%) | 2 (100.0%) |
| Education Instruction & Library | 20 (21.0%) | 75 (78.9%) |
| Arts, Media & Entertainment | 6 (37.5%) | 10 (62.5%) |
| Health Diagnosing & Treating | 46 (25.6%) | 134 (74.4%) |
| Health Technologists | 31 (20.9%) | 117 (79.0%) |
| Total (Category) | 399 (44.9%) | 490 (55.1%) |
| Total (Overall) | 793 (53.2%) | 697 (46.8%) |
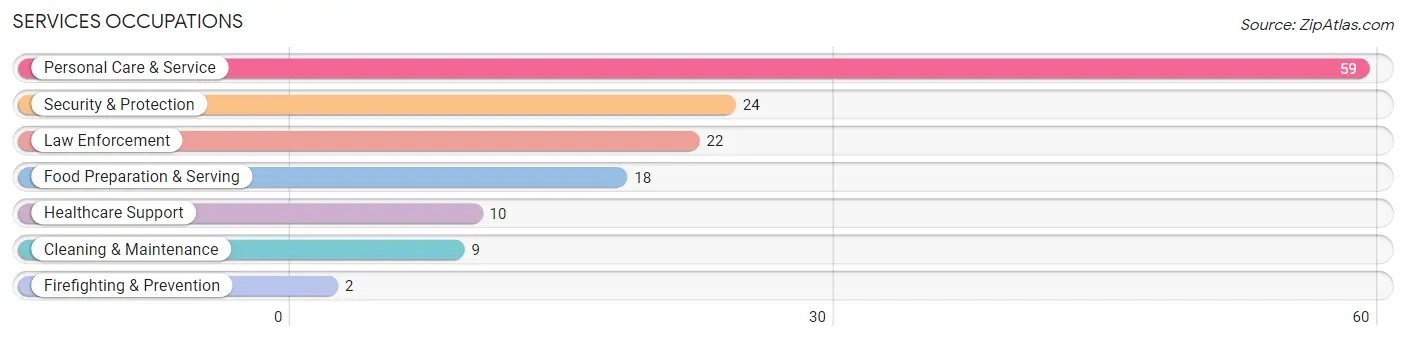
Services Occupations
The most common Services occupations in Kechi are Personal Care & Service (59 | 4.0%), Security & Protection (24 | 1.6%), Law Enforcement (22 | 1.5%), Food Preparation & Serving (18 | 1.2%), and Healthcare Support (10 | 0.7%).
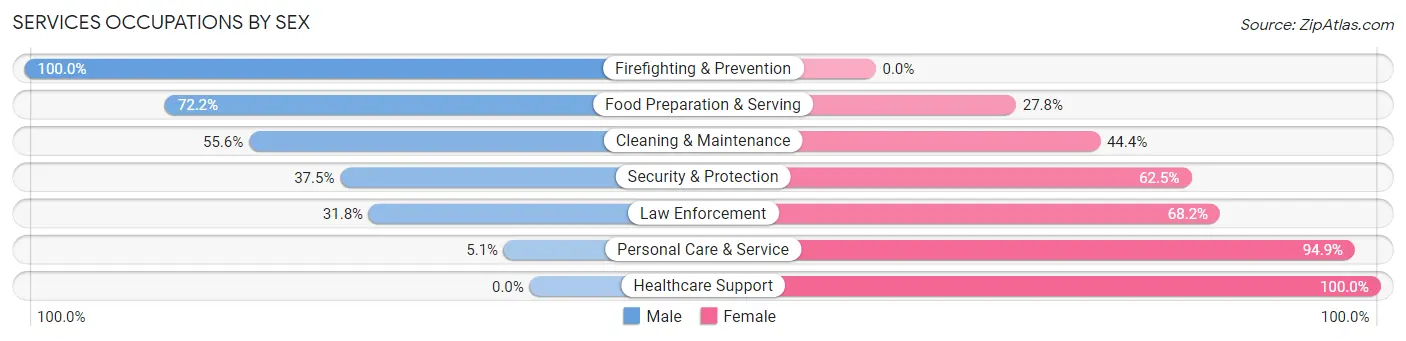
Services Occupations by Sex
Within the Services occupations in Kechi, the most male-oriented occupations are Firefighting & Prevention (100.0%), Food Preparation & Serving (72.2%), and Cleaning & Maintenance (55.6%), while the most female-oriented occupations are Healthcare Support (100.0%), Personal Care & Service (94.9%), and Law Enforcement (68.2%).
| Occupation | Male | Female |
| Healthcare Support | 0 (0.0%) | 10 (100.0%) |
| Security & Protection | 9 (37.5%) | 15 (62.5%) |
| Firefighting & Prevention | 2 (100.0%) | 0 (0.0%) |
| Law Enforcement | 7 (31.8%) | 15 (68.2%) |
| Food Preparation & Serving | 13 (72.2%) | 5 (27.8%) |
| Cleaning & Maintenance | 5 (55.6%) | 4 (44.4%) |
| Personal Care & Service | 3 (5.1%) | 56 (94.9%) |
| Total (Category) | 30 (25.0%) | 90 (75.0%) |
| Total (Overall) | 793 (53.2%) | 697 (46.8%) |
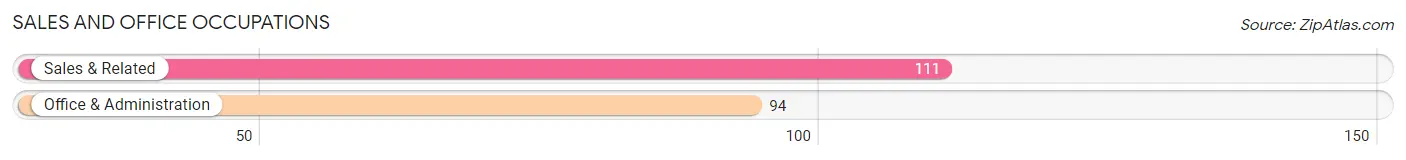
Sales and Office Occupations
The most common Sales and Office occupations in Kechi are Sales & Related (111 | 7.4%), and Office & Administration (94 | 6.3%).
Sales and Office Occupations by Sex
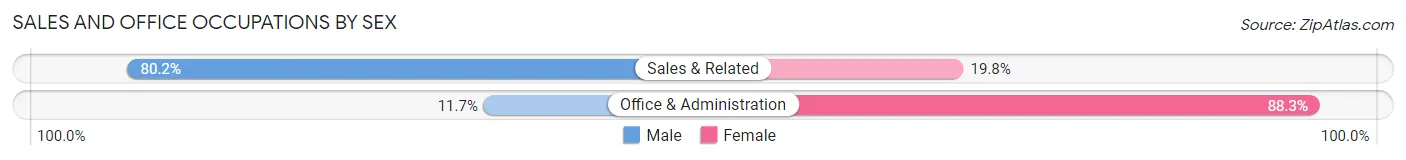
| Occupation | Male | Female |
| Sales & Related | 89 (80.2%) | 22 (19.8%) |
| Office & Administration | 11 (11.7%) | 83 (88.3%) |
| Total (Category) | 100 (48.8%) | 105 (51.2%) |
| Total (Overall) | 793 (53.2%) | 697 (46.8%) |
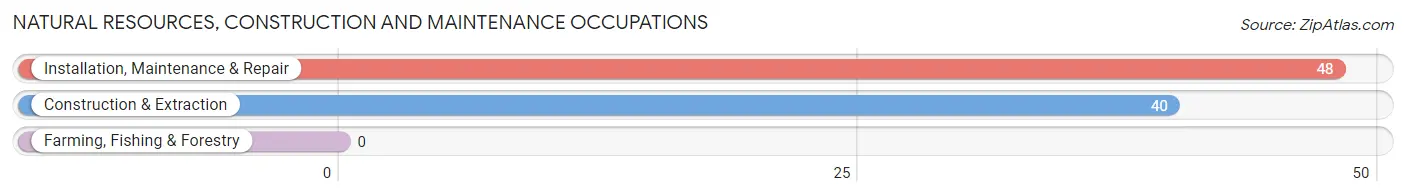
Natural Resources, Construction and Maintenance Occupations
The most common Natural Resources, Construction and Maintenance occupations in Kechi are Installation, Maintenance & Repair (48 | 3.2%), and Construction & Extraction (40 | 2.7%).
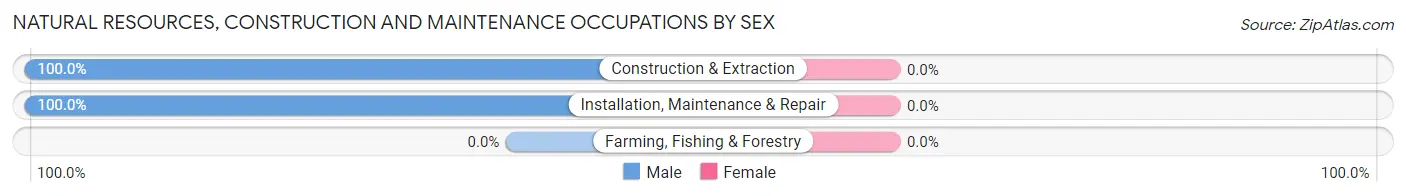
Natural Resources, Construction and Maintenance Occupations by Sex
| Occupation | Male | Female |
| Farming, Fishing & Forestry | 0 (0.0%) | 0 (0.0%) |
| Construction & Extraction | 40 (100.0%) | 0 (0.0%) |
| Installation, Maintenance & Repair | 48 (100.0%) | 0 (0.0%) |
| Total (Category) | 88 (100.0%) | 0 (0.0%) |
| Total (Overall) | 793 (53.2%) | 697 (46.8%) |
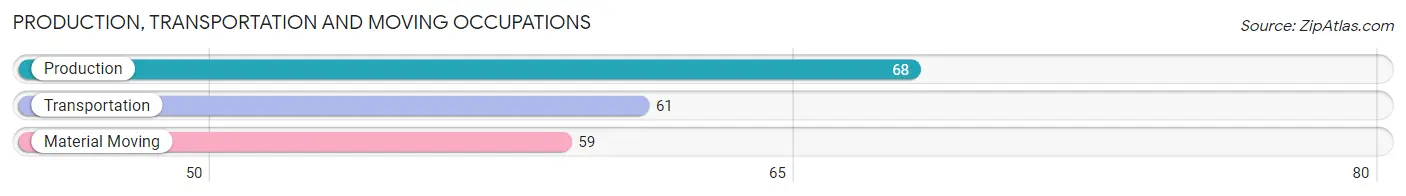
Production, Transportation and Moving Occupations
The most common Production, Transportation and Moving occupations in Kechi are Production (68 | 4.6%), Transportation (61 | 4.1%), and Material Moving (59 | 4.0%).
Production, Transportation and Moving Occupations by Sex
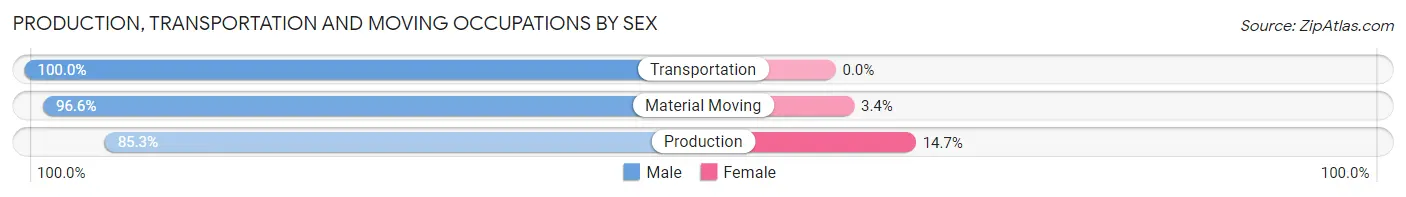
| Occupation | Male | Female |
| Production | 58 (85.3%) | 10 (14.7%) |
| Transportation | 61 (100.0%) | 0 (0.0%) |
| Material Moving | 57 (96.6%) | 2 (3.4%) |
| Total (Category) | 176 (93.6%) | 12 (6.4%) |
| Total (Overall) | 793 (53.2%) | 697 (46.8%) |
Employment Industries by Sex in Kechi
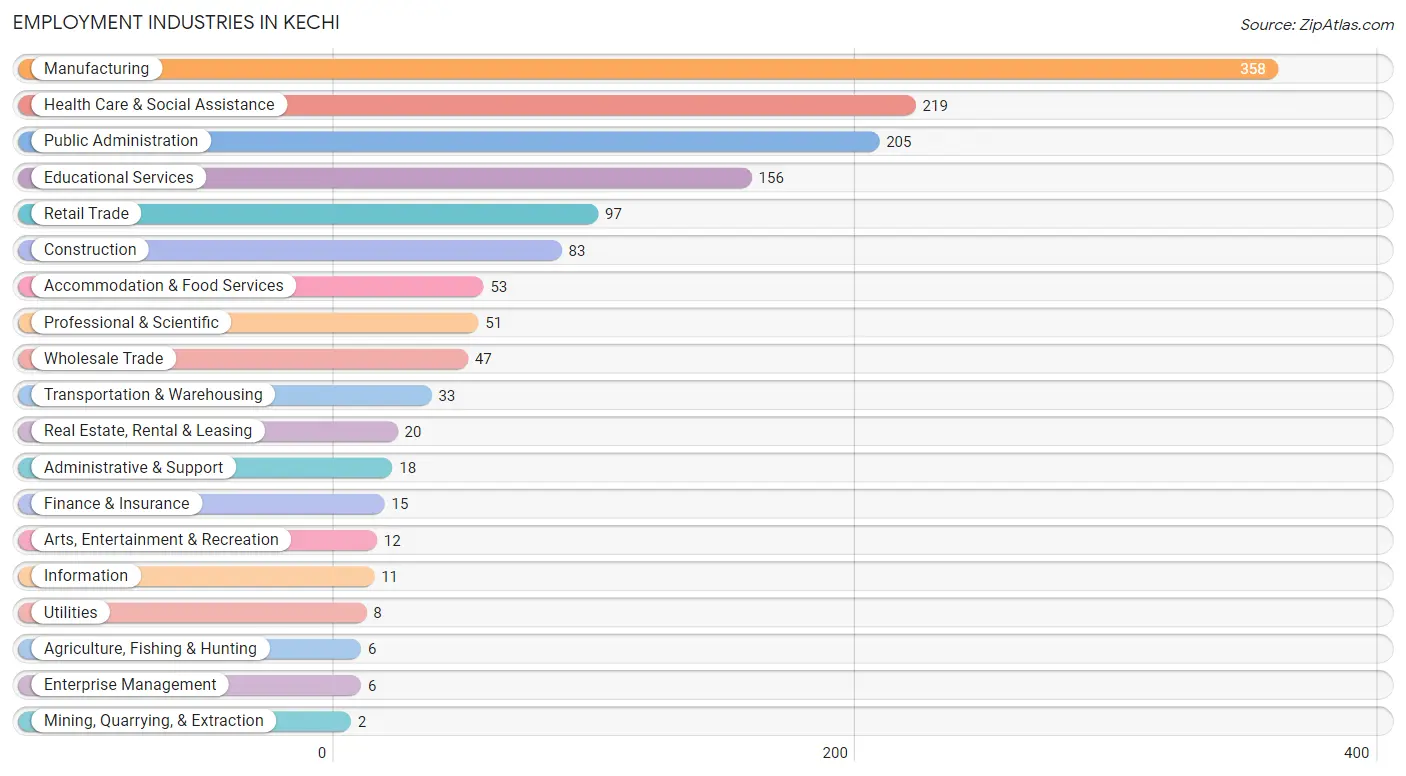
Employment Industries in Kechi
The major employment industries in Kechi include Manufacturing (358 | 24.0%), Health Care & Social Assistance (219 | 14.7%), Public Administration (205 | 13.8%), Educational Services (156 | 10.5%), and Retail Trade (97 | 6.5%).
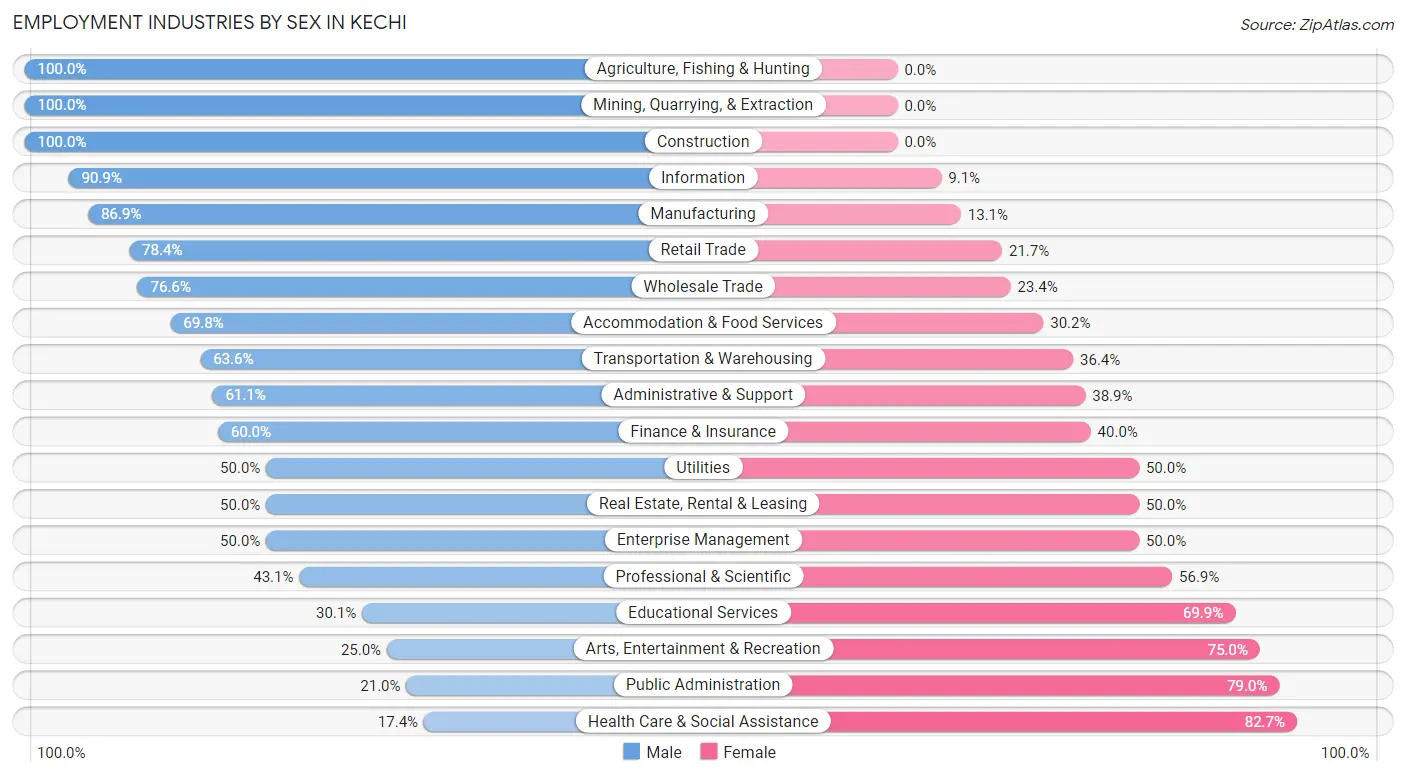
Employment Industries by Sex in Kechi
The Kechi industries that see more men than women are Agriculture, Fishing & Hunting (100.0%), Mining, Quarrying, & Extraction (100.0%), and Construction (100.0%), whereas the industries that tend to have a higher number of women are Health Care & Social Assistance (82.7%), Public Administration (79.0%), and Arts, Entertainment & Recreation (75.0%).
| Industry | Male | Female |
| Agriculture, Fishing & Hunting | 6 (100.0%) | 0 (0.0%) |
| Mining, Quarrying, & Extraction | 2 (100.0%) | 0 (0.0%) |
| Construction | 83 (100.0%) | 0 (0.0%) |
| Manufacturing | 311 (86.9%) | 47 (13.1%) |
| Wholesale Trade | 36 (76.6%) | 11 (23.4%) |
| Retail Trade | 76 (78.3%) | 21 (21.6%) |
| Transportation & Warehousing | 21 (63.6%) | 12 (36.4%) |
| Utilities | 4 (50.0%) | 4 (50.0%) |
| Information | 10 (90.9%) | 1 (9.1%) |
| Finance & Insurance | 9 (60.0%) | 6 (40.0%) |
| Real Estate, Rental & Leasing | 10 (50.0%) | 10 (50.0%) |
| Professional & Scientific | 22 (43.1%) | 29 (56.9%) |
| Enterprise Management | 3 (50.0%) | 3 (50.0%) |
| Administrative & Support | 11 (61.1%) | 7 (38.9%) |
| Educational Services | 47 (30.1%) | 109 (69.9%) |
| Health Care & Social Assistance | 38 (17.3%) | 181 (82.7%) |
| Arts, Entertainment & Recreation | 3 (25.0%) | 9 (75.0%) |
| Accommodation & Food Services | 37 (69.8%) | 16 (30.2%) |
| Public Administration | 43 (21.0%) | 162 (79.0%) |
| Total | 793 (53.2%) | 697 (46.8%) |
Education in Kechi
School Enrollment in Kechi
The most common levels of schooling among the 671 students in Kechi are high school (154 | 23.0%), elementary school (140 | 20.9%), and middle school (131 | 19.5%).
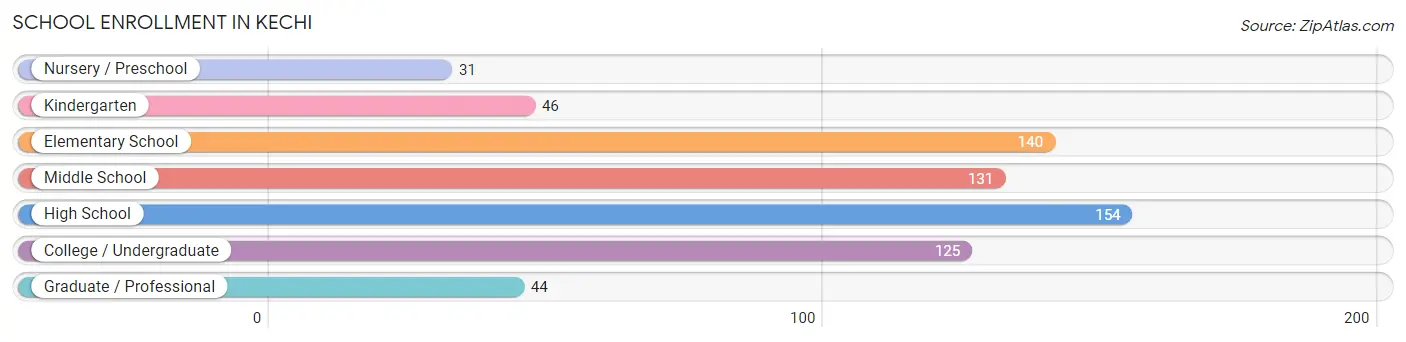
| School Level | # Students | % Students |
| Nursery / Preschool | 31 | 4.6% |
| Kindergarten | 46 | 6.9% |
| Elementary School | 140 | 20.9% |
| Middle School | 131 | 19.5% |
| High School | 154 | 23.0% |
| College / Undergraduate | 125 | 18.6% |
| Graduate / Professional | 44 | 6.6% |
| Total | 671 | 100.0% |
School Enrollment by Age by Funding Source in Kechi
Out of a total of 671 students who are enrolled in schools in Kechi, 159 (23.7%) attend a private institution, while the remaining 512 (76.3%) are enrolled in public schools. The age group of 3 to 4 year olds has the highest likelihood of being enrolled in private schools, with 11 (45.8% in the age bracket) enrolled. Conversely, the age group of 20 to 24 year olds has the lowest likelihood of being enrolled in a private school, with 36 (100.0% in the age bracket) attending a public institution.
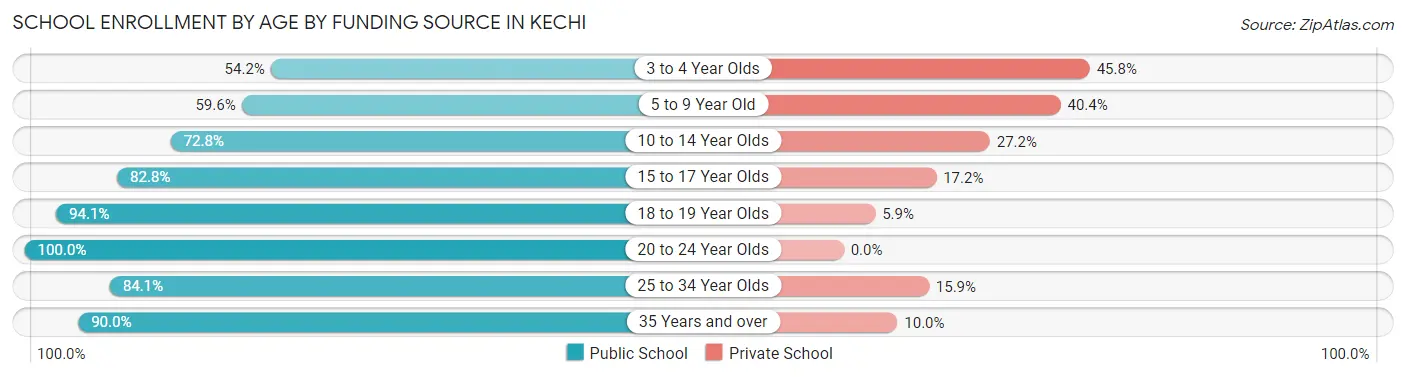
| Age Bracket | Public School | Private School |
| 3 to 4 Year Olds | 13 (54.2%) | 11 (45.8%) |
| 5 to 9 Year Old | 90 (59.6%) | 61 (40.4%) |
| 10 to 14 Year Olds | 131 (72.8%) | 49 (27.2%) |
| 15 to 17 Year Olds | 96 (82.8%) | 20 (17.2%) |
| 18 to 19 Year Olds | 48 (94.1%) | 3 (5.9%) |
| 20 to 24 Year Olds | 36 (100.0%) | 0 (0.0%) |
| 25 to 34 Year Olds | 53 (84.1%) | 10 (15.9%) |
| 35 Years and over | 45 (90.0%) | 5 (10.0%) |
| Total | 512 (76.3%) | 159 (23.7%) |
Educational Attainment by Field of Study in Kechi
Physical & health sciences (182 | 16.4%), business (177 | 16.0%), computers & mathematics (164 | 14.8%), education (146 | 13.2%), and science & technology (134 | 12.1%) are the most common fields of study among 1,109 individuals in Kechi who have obtained a bachelor's degree or higher.
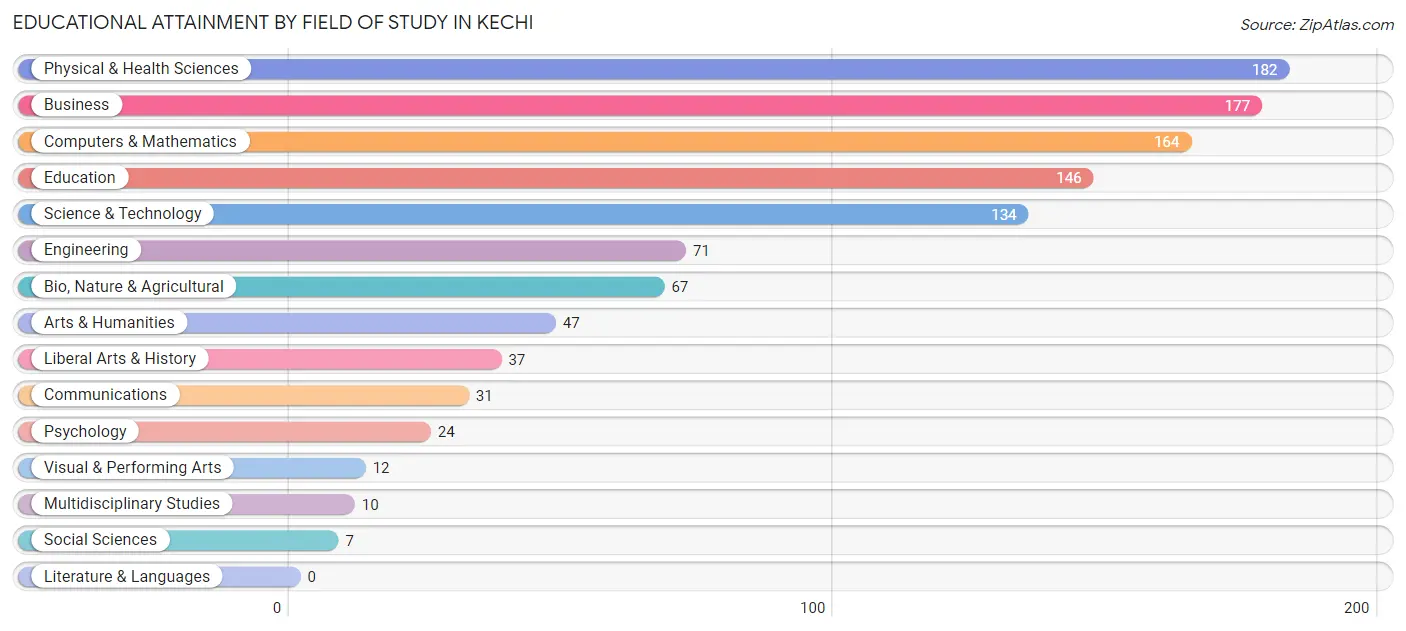
| Field of Study | # Graduates | % Graduates |
| Computers & Mathematics | 164 | 14.8% |
| Bio, Nature & Agricultural | 67 | 6.0% |
| Physical & Health Sciences | 182 | 16.4% |
| Psychology | 24 | 2.2% |
| Social Sciences | 7 | 0.6% |
| Engineering | 71 | 6.4% |
| Multidisciplinary Studies | 10 | 0.9% |
| Science & Technology | 134 | 12.1% |
| Business | 177 | 16.0% |
| Education | 146 | 13.2% |
| Literature & Languages | 0 | 0.0% |
| Liberal Arts & History | 37 | 3.3% |
| Visual & Performing Arts | 12 | 1.1% |
| Communications | 31 | 2.8% |
| Arts & Humanities | 47 | 4.2% |
| Total | 1,109 | 100.0% |
Transportation & Commute in Kechi
Vehicle Availability by Sex in Kechi
The most prevalent vehicle ownership categories in Kechi are males with 3 vehicles (315, accounting for 40.4%) and females with 3 vehicles (276, making up 45.7%).
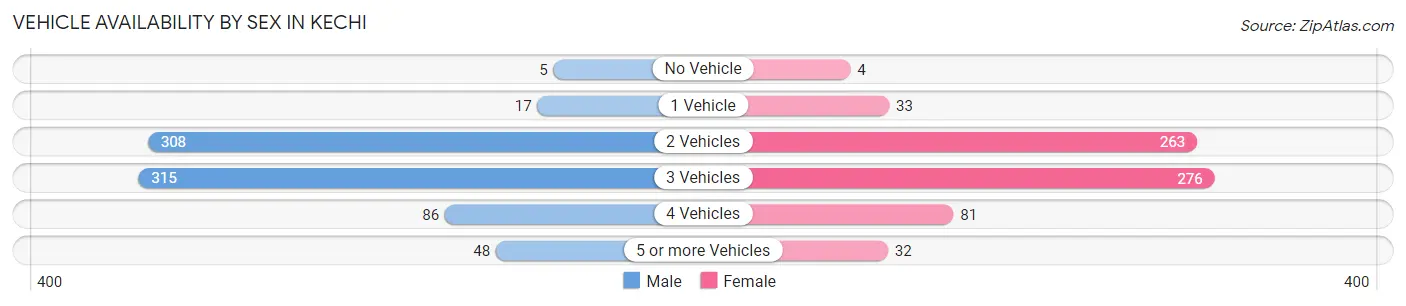
| Vehicles Available | Male | Female |
| No Vehicle | 5 (0.6%) | 4 (0.6%) |
| 1 Vehicle | 17 (2.2%) | 33 (4.8%) |
| 2 Vehicles | 308 (39.5%) | 263 (38.2%) |
| 3 Vehicles | 315 (40.4%) | 276 (40.1%) |
| 4 Vehicles | 86 (11.0%) | 81 (11.8%) |
| 5 or more Vehicles | 48 (6.2%) | 32 (4.6%) |
| Total | 779 (100.0%) | 689 (100.0%) |
Commute Time in Kechi
The most frequently occuring commute durations in Kechi are 20 to 24 minutes (447 commuters, 32.3%), 15 to 19 minutes (395 commuters, 28.6%), and 10 to 14 minutes (144 commuters, 10.4%).
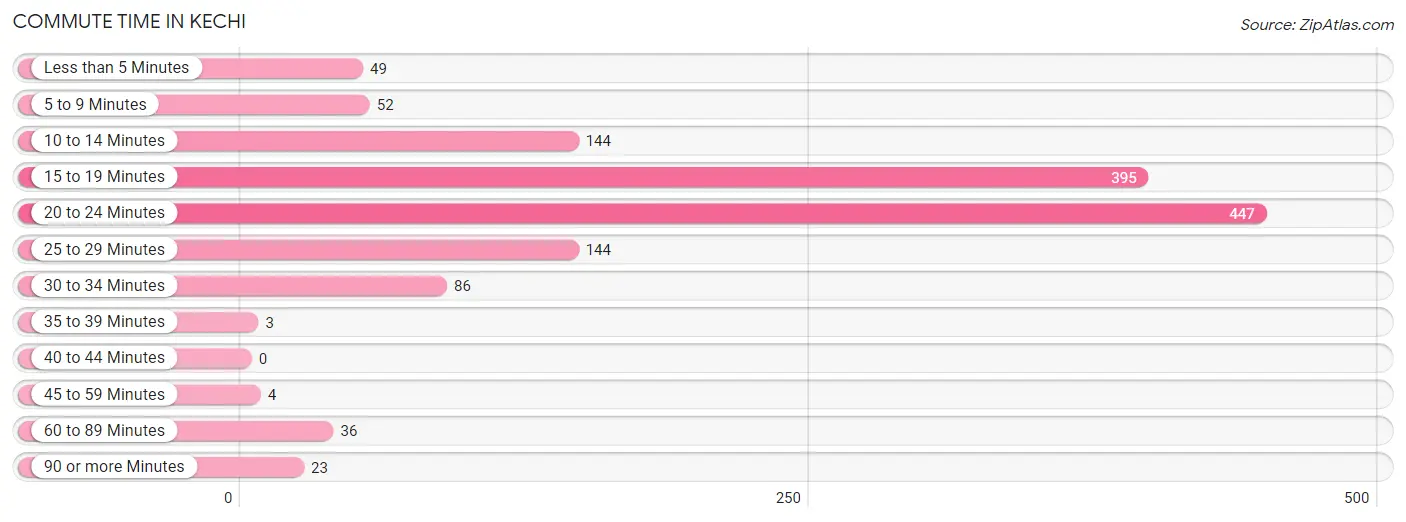
| Commute Time | # Commuters | % Commuters |
| Less than 5 Minutes | 49 | 3.5% |
| 5 to 9 Minutes | 52 | 3.8% |
| 10 to 14 Minutes | 144 | 10.4% |
| 15 to 19 Minutes | 395 | 28.6% |
| 20 to 24 Minutes | 447 | 32.3% |
| 25 to 29 Minutes | 144 | 10.4% |
| 30 to 34 Minutes | 86 | 6.2% |
| 35 to 39 Minutes | 3 | 0.2% |
| 40 to 44 Minutes | 0 | 0.0% |
| 45 to 59 Minutes | 4 | 0.3% |
| 60 to 89 Minutes | 36 | 2.6% |
| 90 or more Minutes | 23 | 1.7% |
Commute Time by Sex in Kechi
The most common commute times in Kechi are 20 to 24 minutes (283 commuters, 39.4%) for males and 15 to 19 minutes (295 commuters, 44.4%) for females.
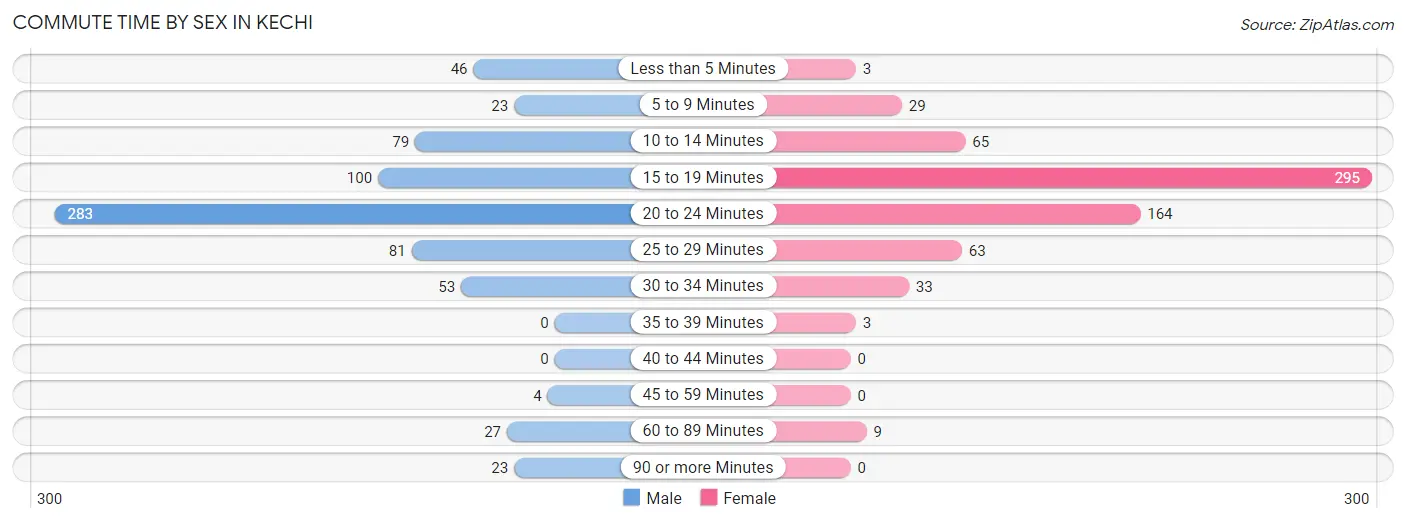
| Commute Time | Male | Female |
| Less than 5 Minutes | 46 (6.4%) | 3 (0.4%) |
| 5 to 9 Minutes | 23 (3.2%) | 29 (4.4%) |
| 10 to 14 Minutes | 79 (11.0%) | 65 (9.8%) |
| 15 to 19 Minutes | 100 (13.9%) | 295 (44.4%) |
| 20 to 24 Minutes | 283 (39.4%) | 164 (24.7%) |
| 25 to 29 Minutes | 81 (11.3%) | 63 (9.5%) |
| 30 to 34 Minutes | 53 (7.4%) | 33 (5.0%) |
| 35 to 39 Minutes | 0 (0.0%) | 3 (0.4%) |
| 40 to 44 Minutes | 0 (0.0%) | 0 (0.0%) |
| 45 to 59 Minutes | 4 (0.6%) | 0 (0.0%) |
| 60 to 89 Minutes | 27 (3.8%) | 9 (1.4%) |
| 90 or more Minutes | 23 (3.2%) | 0 (0.0%) |
Time of Departure to Work by Sex in Kechi
The most frequent times of departure to work in Kechi are 6:30 AM to 6:59 AM (117, 16.3%) for males and 4:00 PM to 11:59 PM (148, 22.3%) for females.
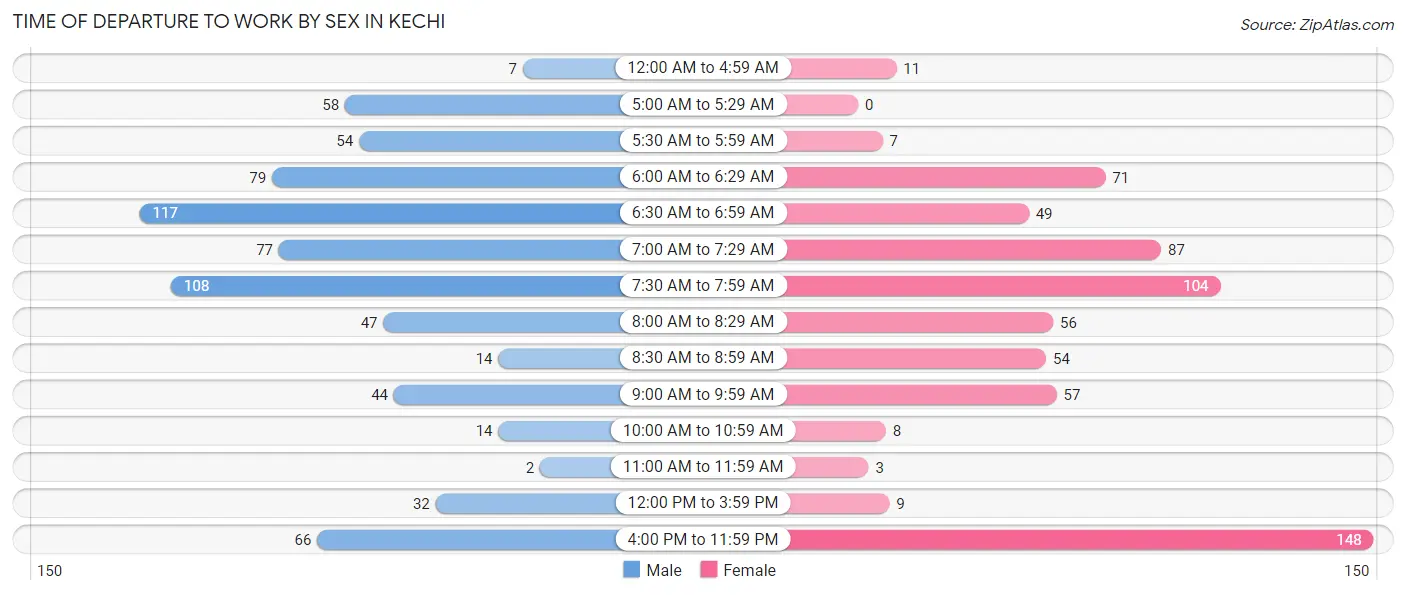
| Time of Departure | Male | Female |
| 12:00 AM to 4:59 AM | 7 (1.0%) | 11 (1.7%) |
| 5:00 AM to 5:29 AM | 58 (8.1%) | 0 (0.0%) |
| 5:30 AM to 5:59 AM | 54 (7.5%) | 7 (1.1%) |
| 6:00 AM to 6:29 AM | 79 (11.0%) | 71 (10.7%) |
| 6:30 AM to 6:59 AM | 117 (16.3%) | 49 (7.4%) |
| 7:00 AM to 7:29 AM | 77 (10.7%) | 87 (13.1%) |
| 7:30 AM to 7:59 AM | 108 (15.0%) | 104 (15.7%) |
| 8:00 AM to 8:29 AM | 47 (6.5%) | 56 (8.4%) |
| 8:30 AM to 8:59 AM | 14 (1.9%) | 54 (8.1%) |
| 9:00 AM to 9:59 AM | 44 (6.1%) | 57 (8.6%) |
| 10:00 AM to 10:59 AM | 14 (1.9%) | 8 (1.2%) |
| 11:00 AM to 11:59 AM | 2 (0.3%) | 3 (0.4%) |
| 12:00 PM to 3:59 PM | 32 (4.4%) | 9 (1.4%) |
| 4:00 PM to 11:59 PM | 66 (9.2%) | 148 (22.3%) |
| Total | 719 (100.0%) | 664 (100.0%) |
Housing Occupancy in Kechi
Occupancy by Ownership in Kechi
Of the total 961 dwellings in Kechi, owner-occupied units account for 751 (78.1%), while renter-occupied units make up 210 (21.8%).
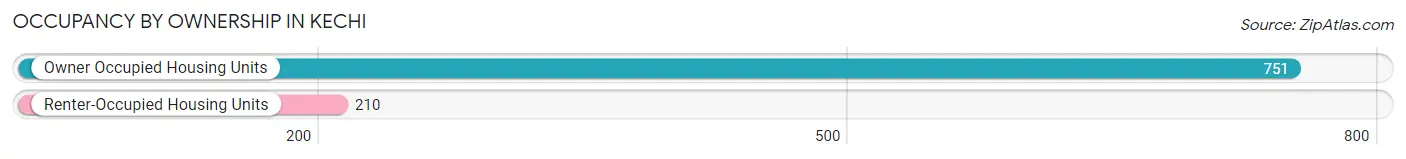
| Occupancy | # Housing Units | % Housing Units |
| Owner Occupied Housing Units | 751 | 78.1% |
| Renter-Occupied Housing Units | 210 | 21.8% |
| Total Occupied Housing Units | 961 | 100.0% |
Occupancy by Household Size in Kechi
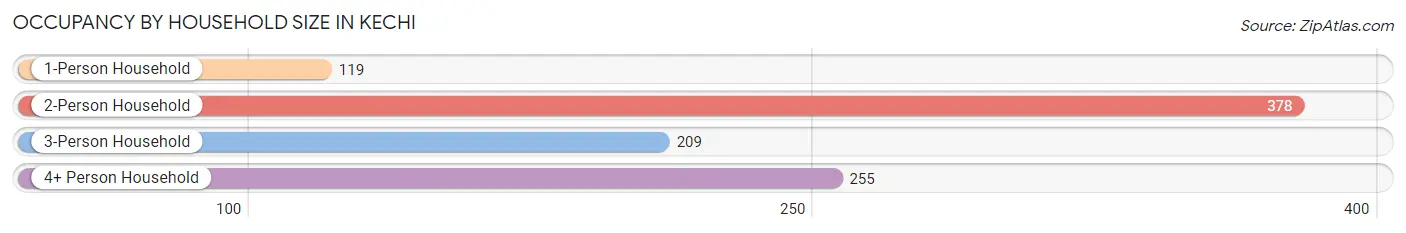
| Household Size | # Housing Units | % Housing Units |
| 1-Person Household | 119 | 12.4% |
| 2-Person Household | 378 | 39.3% |
| 3-Person Household | 209 | 21.7% |
| 4+ Person Household | 255 | 26.5% |
| Total Housing Units | 961 | 100.0% |
Occupancy by Ownership by Household Size in Kechi
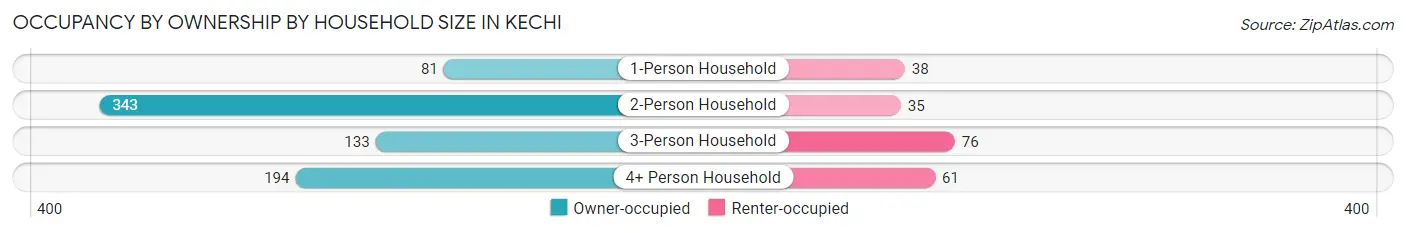
| Household Size | Owner-occupied | Renter-occupied |
| 1-Person Household | 81 (68.1%) | 38 (31.9%) |
| 2-Person Household | 343 (90.7%) | 35 (9.3%) |
| 3-Person Household | 133 (63.6%) | 76 (36.4%) |
| 4+ Person Household | 194 (76.1%) | 61 (23.9%) |
| Total Housing Units | 751 (78.1%) | 210 (21.8%) |
Occupancy by Educational Attainment in Kechi
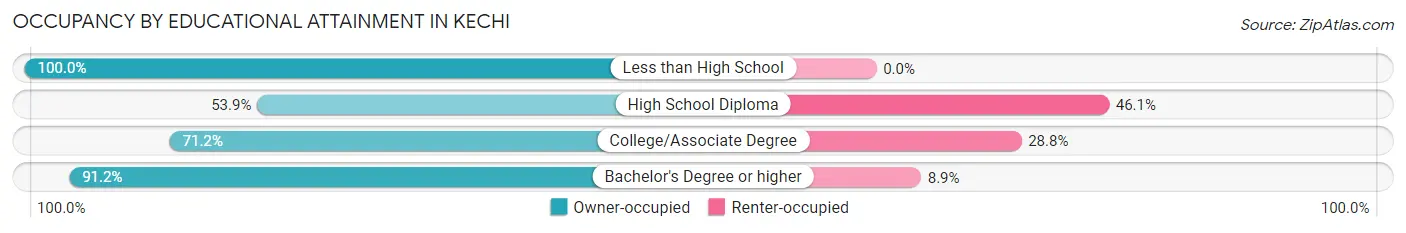
| Household Size | Owner-occupied | Renter-occupied |
| Less than High School | 19 (100.0%) | 0 (0.0%) |
| High School Diploma | 118 (53.9%) | 101 (46.1%) |
| College/Associate Degree | 161 (71.2%) | 65 (28.8%) |
| Bachelor's Degree or higher | 453 (91.1%) | 44 (8.8%) |
Occupancy by Age of Householder in Kechi
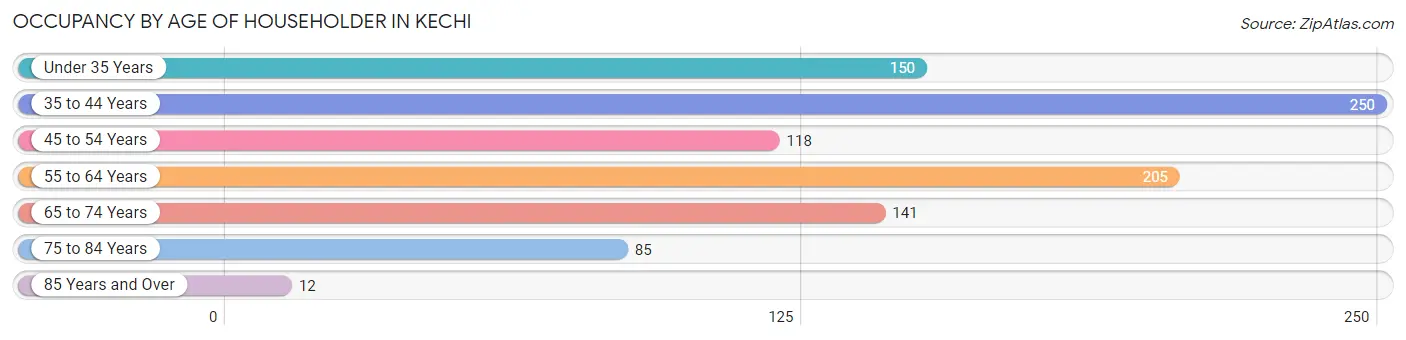
| Age Bracket | # Households | % Households |
| Under 35 Years | 150 | 15.6% |
| 35 to 44 Years | 250 | 26.0% |
| 45 to 54 Years | 118 | 12.3% |
| 55 to 64 Years | 205 | 21.3% |
| 65 to 74 Years | 141 | 14.7% |
| 75 to 84 Years | 85 | 8.8% |
| 85 Years and Over | 12 | 1.3% |
| Total | 961 | 100.0% |
Housing Finances in Kechi
Median Income by Occupancy in Kechi

| Occupancy Type | # Households | Median Income |
| Owner-Occupied | 751 (78.1%) | $111,146 |
| Renter-Occupied | 210 (21.8%) | $66,635 |
| Average | 961 (100.0%) | $103,625 |
Occupancy by Householder Income Bracket in Kechi
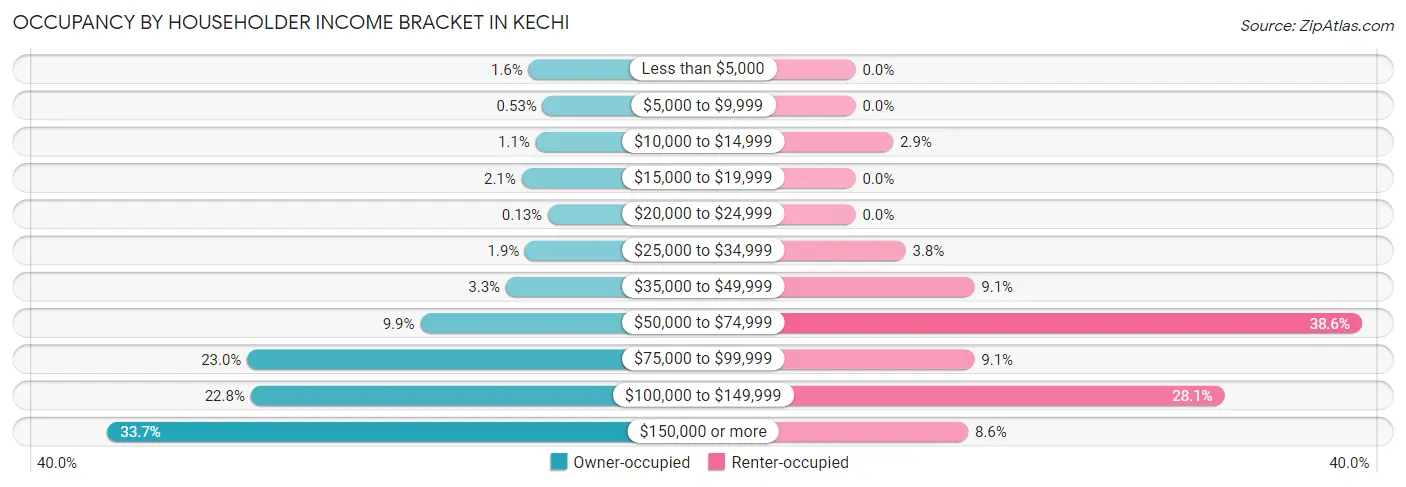
| Income Bracket | Owner-occupied | Renter-occupied |
| Less than $5,000 | 12 (1.6%) | 0 (0.0%) |
| $5,000 to $9,999 | 4 (0.5%) | 0 (0.0%) |
| $10,000 to $14,999 | 8 (1.1%) | 6 (2.9%) |
| $15,000 to $19,999 | 16 (2.1%) | 0 (0.0%) |
| $20,000 to $24,999 | 1 (0.1%) | 0 (0.0%) |
| $25,000 to $34,999 | 14 (1.9%) | 8 (3.8%) |
| $35,000 to $49,999 | 25 (3.3%) | 19 (9.0%) |
| $50,000 to $74,999 | 74 (9.9%) | 81 (38.6%) |
| $75,000 to $99,999 | 173 (23.0%) | 19 (9.0%) |
| $100,000 to $149,999 | 171 (22.8%) | 59 (28.1%) |
| $150,000 or more | 253 (33.7%) | 18 (8.6%) |
| Total | 751 (100.0%) | 210 (100.0%) |
Monthly Housing Cost Tiers in Kechi
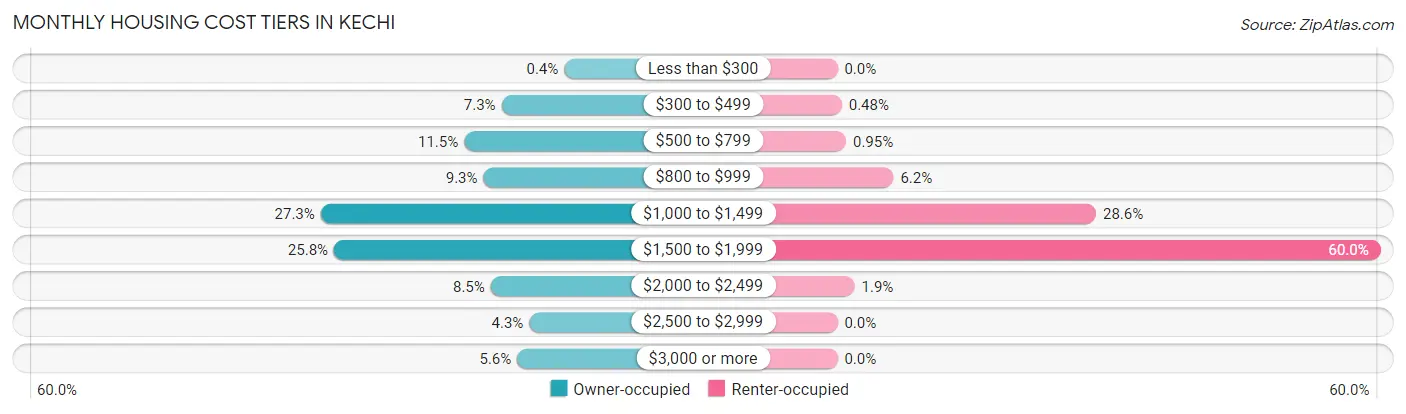
| Monthly Cost | Owner-occupied | Renter-occupied |
| Less than $300 | 3 (0.4%) | 0 (0.0%) |
| $300 to $499 | 55 (7.3%) | 1 (0.5%) |
| $500 to $799 | 86 (11.5%) | 2 (0.9%) |
| $800 to $999 | 70 (9.3%) | 13 (6.2%) |
| $1,000 to $1,499 | 205 (27.3%) | 60 (28.6%) |
| $1,500 to $1,999 | 194 (25.8%) | 126 (60.0%) |
| $2,000 to $2,499 | 64 (8.5%) | 4 (1.9%) |
| $2,500 to $2,999 | 32 (4.3%) | 0 (0.0%) |
| $3,000 or more | 42 (5.6%) | 0 (0.0%) |
| Total | 751 (100.0%) | 210 (100.0%) |
Physical Housing Characteristics in Kechi
Housing Structures in Kechi
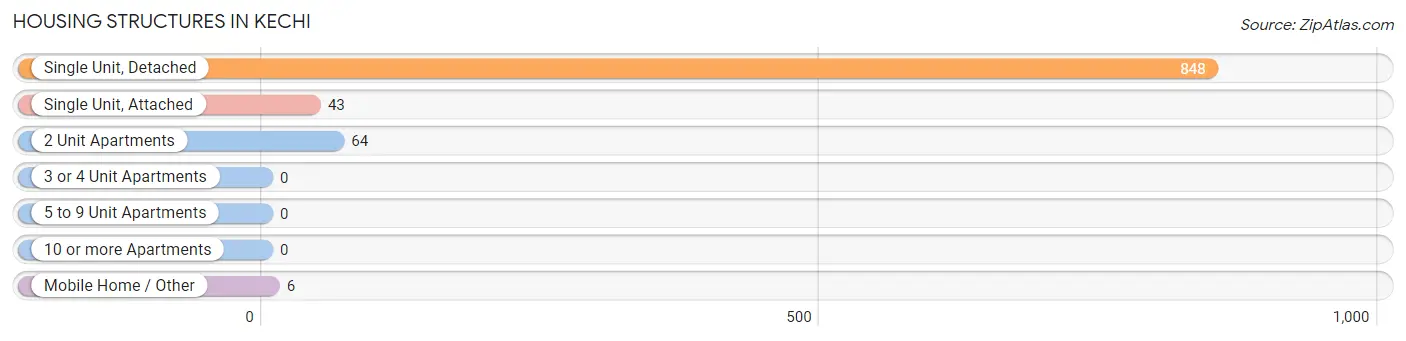
| Structure Type | # Housing Units | % Housing Units |
| Single Unit, Detached | 848 | 88.2% |
| Single Unit, Attached | 43 | 4.5% |
| 2 Unit Apartments | 64 | 6.7% |
| 3 or 4 Unit Apartments | 0 | 0.0% |
| 5 to 9 Unit Apartments | 0 | 0.0% |
| 10 or more Apartments | 0 | 0.0% |
| Mobile Home / Other | 6 | 0.6% |
| Total | 961 | 100.0% |
Housing Structures by Occupancy in Kechi
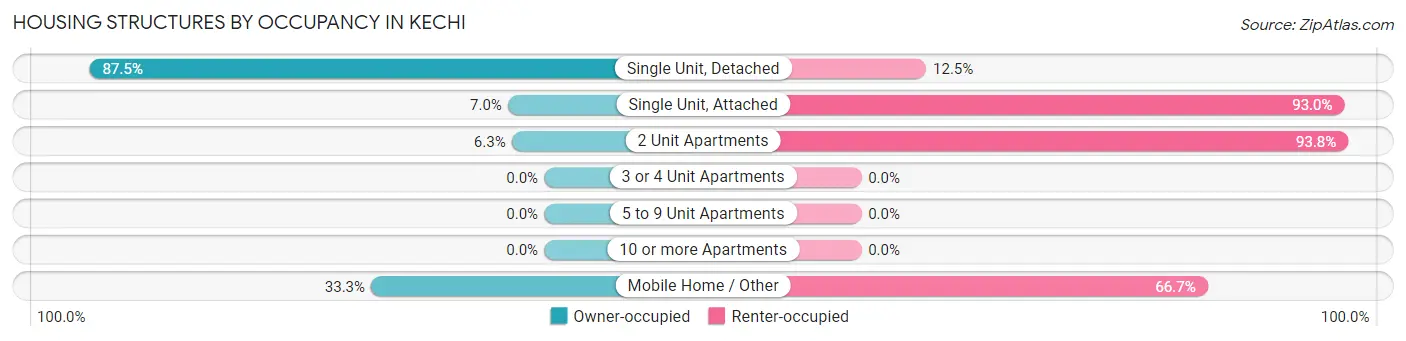
| Structure Type | Owner-occupied | Renter-occupied |
| Single Unit, Detached | 742 (87.5%) | 106 (12.5%) |
| Single Unit, Attached | 3 (7.0%) | 40 (93.0%) |
| 2 Unit Apartments | 4 (6.2%) | 60 (93.8%) |
| 3 or 4 Unit Apartments | 0 (0.0%) | 0 (0.0%) |
| 5 to 9 Unit Apartments | 0 (0.0%) | 0 (0.0%) |
| 10 or more Apartments | 0 (0.0%) | 0 (0.0%) |
| Mobile Home / Other | 2 (33.3%) | 4 (66.7%) |
| Total | 751 (78.1%) | 210 (21.8%) |
Housing Structures by Number of Rooms in Kechi
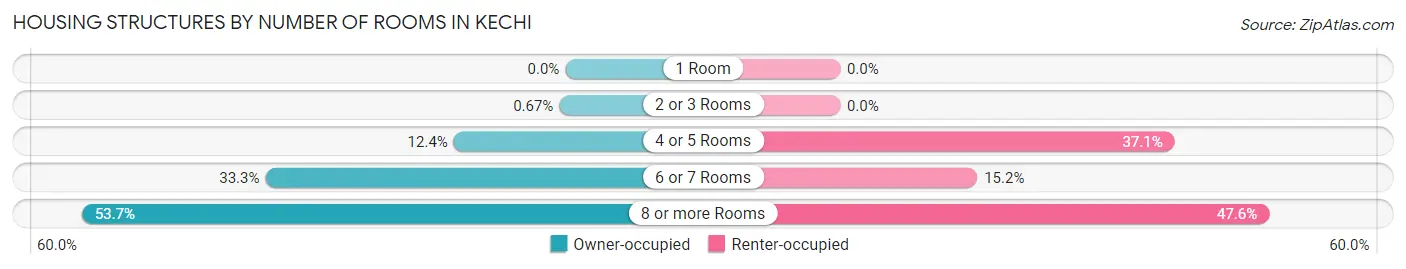
| Number of Rooms | Owner-occupied | Renter-occupied |
| 1 Room | 0 (0.0%) | 0 (0.0%) |
| 2 or 3 Rooms | 5 (0.7%) | 0 (0.0%) |
| 4 or 5 Rooms | 93 (12.4%) | 78 (37.1%) |
| 6 or 7 Rooms | 250 (33.3%) | 32 (15.2%) |
| 8 or more Rooms | 403 (53.7%) | 100 (47.6%) |
| Total | 751 (100.0%) | 210 (100.0%) |
Housing Structure by Heating Type in Kechi
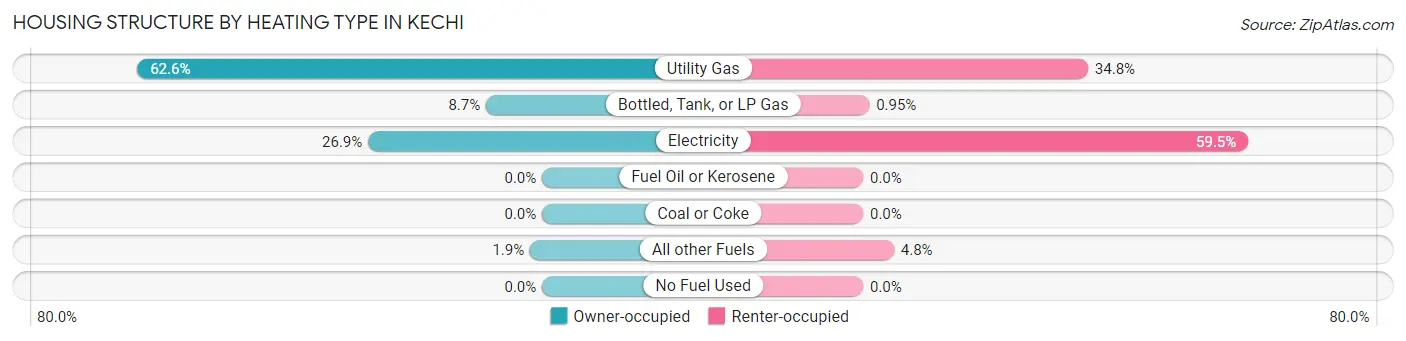
| Heating Type | Owner-occupied | Renter-occupied |
| Utility Gas | 470 (62.6%) | 73 (34.8%) |
| Bottled, Tank, or LP Gas | 65 (8.7%) | 2 (0.9%) |
| Electricity | 202 (26.9%) | 125 (59.5%) |
| Fuel Oil or Kerosene | 0 (0.0%) | 0 (0.0%) |
| Coal or Coke | 0 (0.0%) | 0 (0.0%) |
| All other Fuels | 14 (1.9%) | 10 (4.8%) |
| No Fuel Used | 0 (0.0%) | 0 (0.0%) |
| Total | 751 (100.0%) | 210 (100.0%) |
Household Vehicle Usage in Kechi
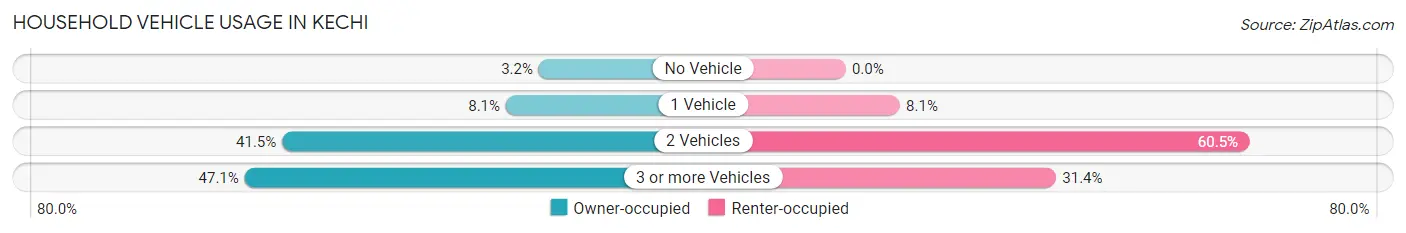
| Vehicles per Household | Owner-occupied | Renter-occupied |
| No Vehicle | 24 (3.2%) | 0 (0.0%) |
| 1 Vehicle | 61 (8.1%) | 17 (8.1%) |
| 2 Vehicles | 312 (41.5%) | 127 (60.5%) |
| 3 or more Vehicles | 354 (47.1%) | 66 (31.4%) |
| Total | 751 (100.0%) | 210 (100.0%) |
Real Estate & Mortgages in Kechi
Real Estate and Mortgage Overview in Kechi
| Characteristic | Without Mortgage | With Mortgage |
| Housing Units | 264 | 487 |
| Median Property Value | $260,300 | $246,700 |
| Median Household Income | $86,667 | $178 |
| Monthly Housing Costs | $833 | $42 |
| Real Estate Taxes | $3,500 | $5 |
Property Value by Mortgage Status in Kechi
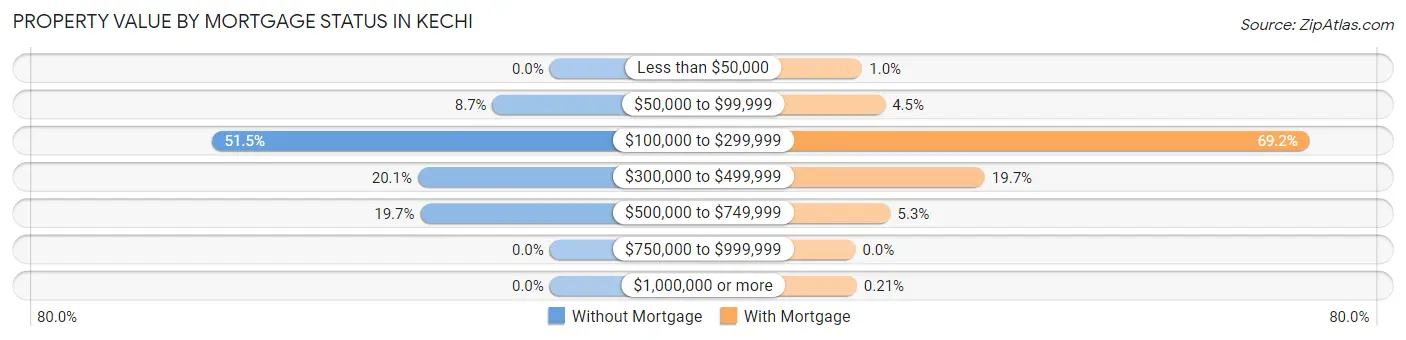
| Property Value | Without Mortgage | With Mortgage |
| Less than $50,000 | 0 (0.0%) | 5 (1.0%) |
| $50,000 to $99,999 | 23 (8.7%) | 22 (4.5%) |
| $100,000 to $299,999 | 136 (51.5%) | 337 (69.2%) |
| $300,000 to $499,999 | 53 (20.1%) | 96 (19.7%) |
| $500,000 to $749,999 | 52 (19.7%) | 26 (5.3%) |
| $750,000 to $999,999 | 0 (0.0%) | 0 (0.0%) |
| $1,000,000 or more | 0 (0.0%) | 1 (0.2%) |
| Total | 264 (100.0%) | 487 (100.0%) |
Household Income by Mortgage Status in Kechi
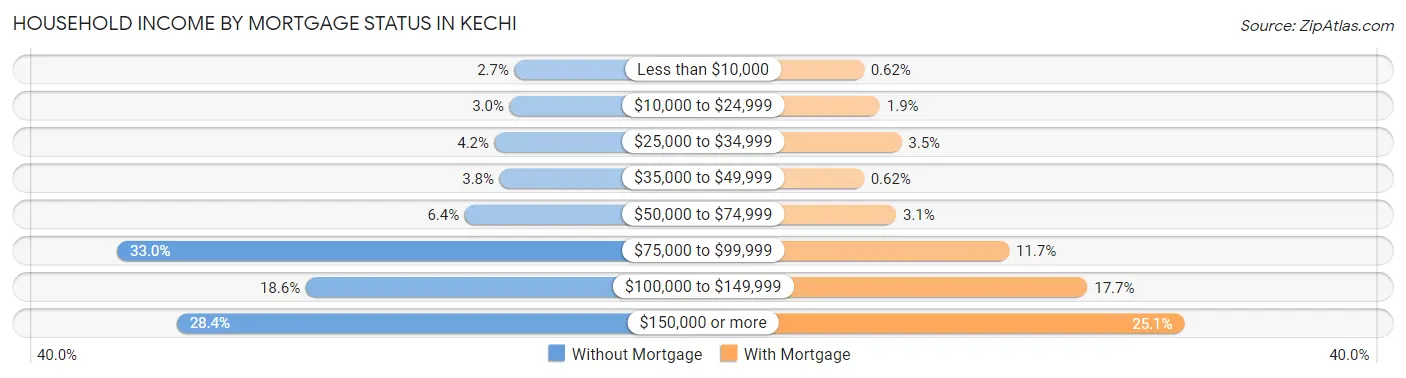
| Household Income | Without Mortgage | With Mortgage |
| Less than $10,000 | 7 (2.6%) | 3 (0.6%) |
| $10,000 to $24,999 | 8 (3.0%) | 9 (1.8%) |
| $25,000 to $34,999 | 11 (4.2%) | 17 (3.5%) |
| $35,000 to $49,999 | 10 (3.8%) | 3 (0.6%) |
| $50,000 to $74,999 | 17 (6.4%) | 15 (3.1%) |
| $75,000 to $99,999 | 87 (33.0%) | 57 (11.7%) |
| $100,000 to $149,999 | 49 (18.6%) | 86 (17.7%) |
| $150,000 or more | 75 (28.4%) | 122 (25.1%) |
| Total | 264 (100.0%) | 487 (100.0%) |
Property Value to Household Income Ratio in Kechi
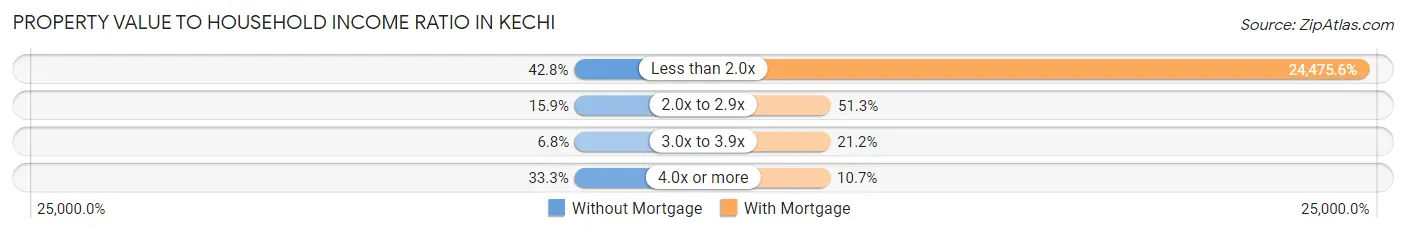
| Value-to-Income Ratio | Without Mortgage | With Mortgage |
| Less than 2.0x | 113 (42.8%) | 119,196 (24,475.6%) |
| 2.0x to 2.9x | 42 (15.9%) | 250 (51.3%) |
| 3.0x to 3.9x | 18 (6.8%) | 103 (21.1%) |
| 4.0x or more | 88 (33.3%) | 52 (10.7%) |
| Total | 264 (100.0%) | 487 (100.0%) |
Real Estate Taxes by Mortgage Status in Kechi
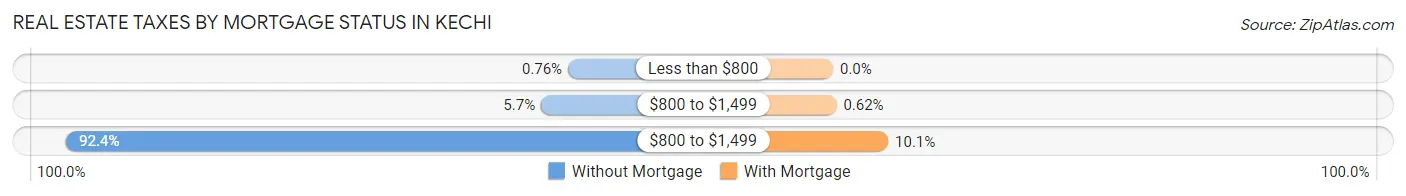
| Property Taxes | Without Mortgage | With Mortgage |
| Less than $800 | 2 (0.8%) | 0 (0.0%) |
| $800 to $1,499 | 15 (5.7%) | 3 (0.6%) |
| $800 to $1,499 | 244 (92.4%) | 49 (10.1%) |
| Total | 264 (100.0%) | 487 (100.0%) |
Health & Disability in Kechi
Health Insurance Coverage by Age in Kechi
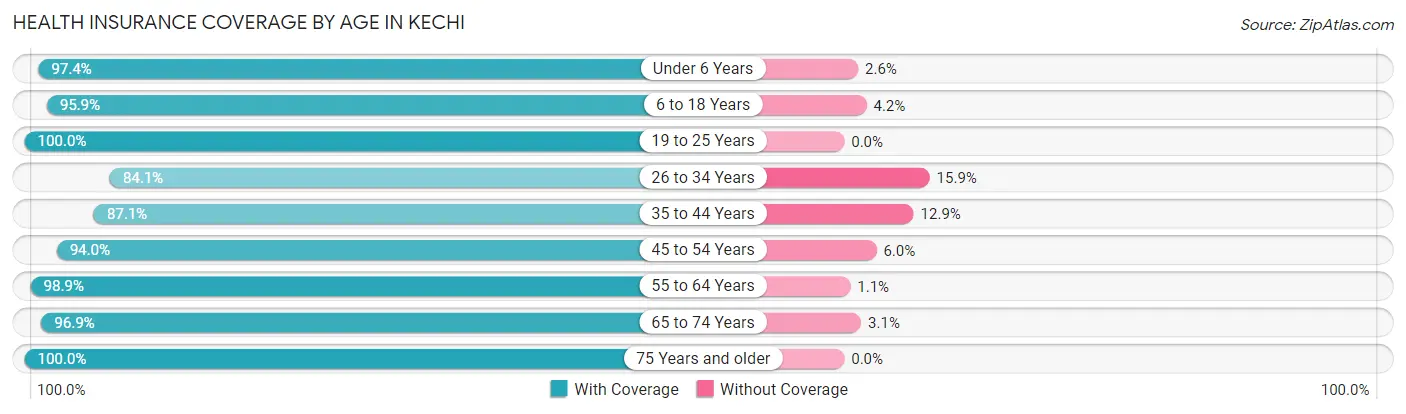
| Age Bracket | With Coverage | Without Coverage |
| Under 6 Years | 340 (97.4%) | 9 (2.6%) |
| 6 to 18 Years | 439 (95.9%) | 19 (4.2%) |
| 19 to 25 Years | 216 (100.0%) | 0 (0.0%) |
| 26 to 34 Years | 243 (84.1%) | 46 (15.9%) |
| 35 to 44 Years | 404 (87.1%) | 60 (12.9%) |
| 45 to 54 Years | 282 (94.0%) | 18 (6.0%) |
| 55 to 64 Years | 351 (98.9%) | 4 (1.1%) |
| 65 to 74 Years | 247 (96.9%) | 8 (3.1%) |
| 75 Years and older | 263 (100.0%) | 0 (0.0%) |
| Total | 2,785 (94.4%) | 164 (5.6%) |
Health Insurance Coverage by Citizenship Status in Kechi
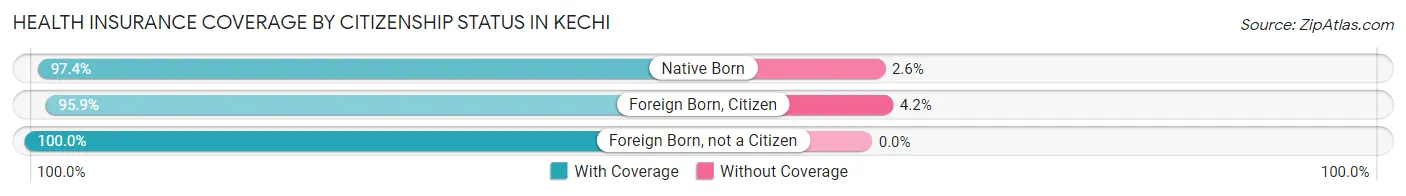
| Citizenship Status | With Coverage | Without Coverage |
| Native Born | 340 (97.4%) | 9 (2.6%) |
| Foreign Born, Citizen | 439 (95.9%) | 19 (4.2%) |
| Foreign Born, not a Citizen | 216 (100.0%) | 0 (0.0%) |
Health Insurance Coverage by Household Income in Kechi
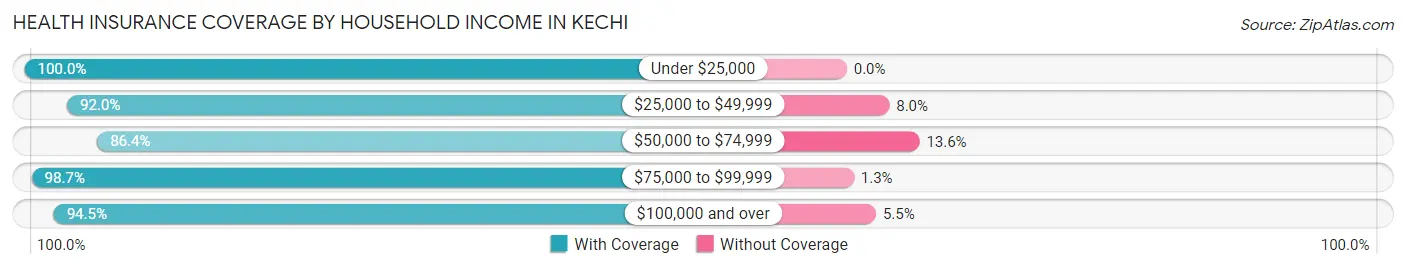
| Household Income | With Coverage | Without Coverage |
| Under $25,000 | 73 (100.0%) | 0 (0.0%) |
| $25,000 to $49,999 | 104 (92.0%) | 9 (8.0%) |
| $50,000 to $74,999 | 311 (86.4%) | 49 (13.6%) |
| $75,000 to $99,999 | 599 (98.7%) | 8 (1.3%) |
| $100,000 and over | 1,698 (94.5%) | 98 (5.5%) |
Public vs Private Health Insurance Coverage by Age in Kechi
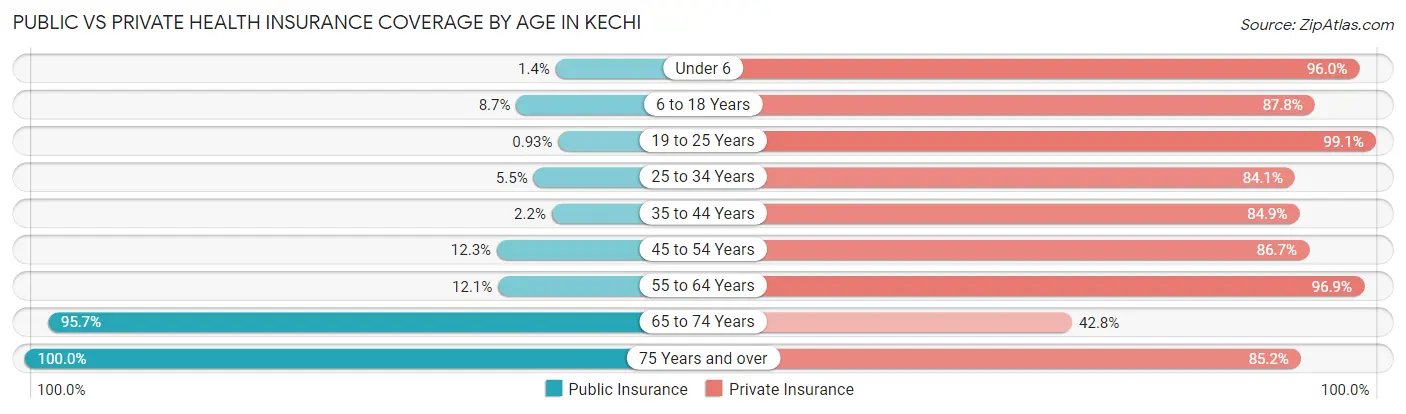
| Age Bracket | Public Insurance | Private Insurance |
| Under 6 | 5 (1.4%) | 335 (96.0%) |
| 6 to 18 Years | 40 (8.7%) | 402 (87.8%) |
| 19 to 25 Years | 2 (0.9%) | 214 (99.1%) |
| 25 to 34 Years | 16 (5.5%) | 243 (84.1%) |
| 35 to 44 Years | 10 (2.2%) | 394 (84.9%) |
| 45 to 54 Years | 37 (12.3%) | 260 (86.7%) |
| 55 to 64 Years | 43 (12.1%) | 344 (96.9%) |
| 65 to 74 Years | 244 (95.7%) | 109 (42.7%) |
| 75 Years and over | 263 (100.0%) | 224 (85.2%) |
| Total | 660 (22.4%) | 2,525 (85.6%) |
Disability Status by Sex by Age in Kechi
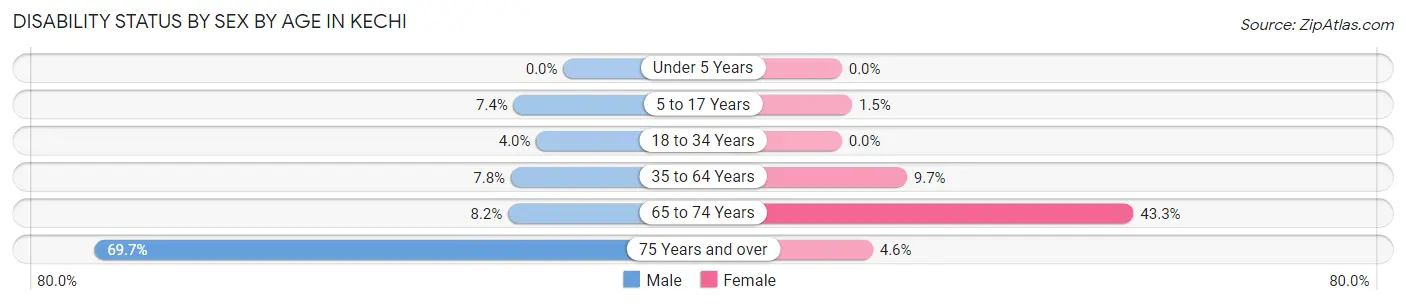
| Age Bracket | Male | Female |
| Under 5 Years | 0 (0.0%) | 0 (0.0%) |
| 5 to 17 Years | 14 (7.4%) | 4 (1.5%) |
| 18 to 34 Years | 11 (4.0%) | 0 (0.0%) |
| 35 to 64 Years | 42 (7.8%) | 56 (9.7%) |
| 65 to 74 Years | 5 (8.2%) | 84 (43.3%) |
| 75 Years and over | 62 (69.7%) | 8 (4.6%) |
Disability Class by Sex by Age in Kechi
Disability Class: Hearing Difficulty
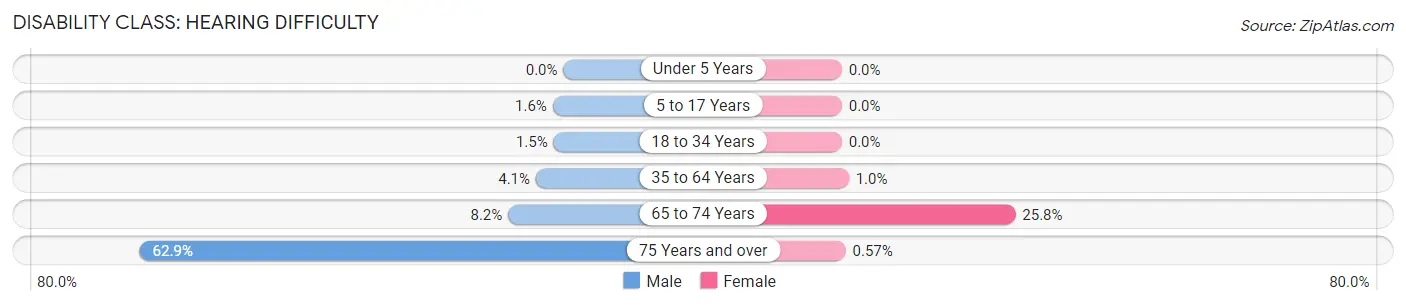
| Age Bracket | Male | Female |
| Under 5 Years | 0 (0.0%) | 0 (0.0%) |
| 5 to 17 Years | 3 (1.6%) | 0 (0.0%) |
| 18 to 34 Years | 4 (1.5%) | 0 (0.0%) |
| 35 to 64 Years | 22 (4.1%) | 6 (1.0%) |
| 65 to 74 Years | 5 (8.2%) | 50 (25.8%) |
| 75 Years and over | 56 (62.9%) | 1 (0.6%) |
Disability Class: Vision Difficulty
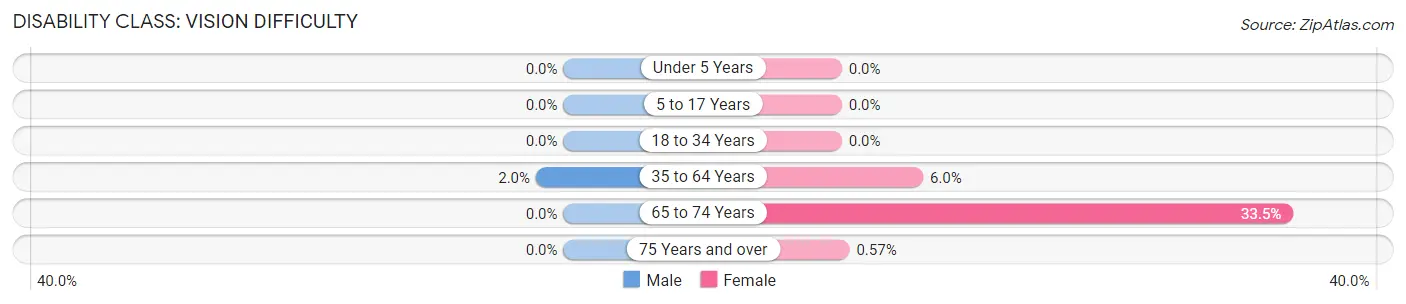
| Age Bracket | Male | Female |
| Under 5 Years | 0 (0.0%) | 0 (0.0%) |
| 5 to 17 Years | 0 (0.0%) | 0 (0.0%) |
| 18 to 34 Years | 0 (0.0%) | 0 (0.0%) |
| 35 to 64 Years | 11 (2.0%) | 35 (6.0%) |
| 65 to 74 Years | 0 (0.0%) | 65 (33.5%) |
| 75 Years and over | 0 (0.0%) | 1 (0.6%) |
Disability Class: Cognitive Difficulty
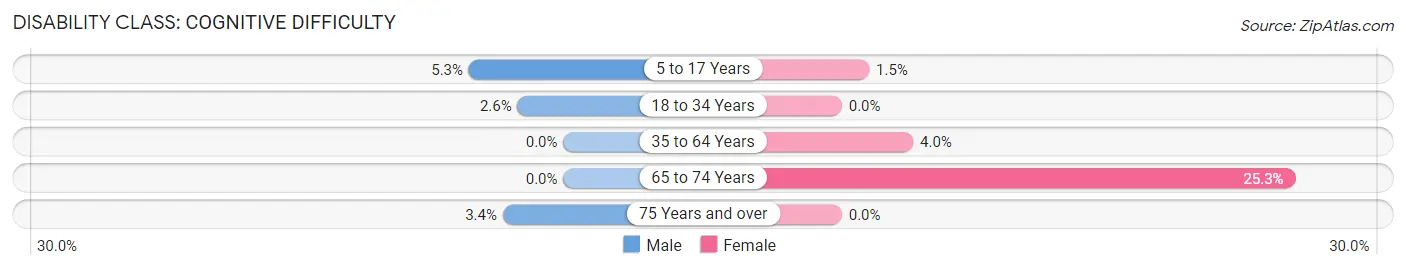
| Age Bracket | Male | Female |
| 5 to 17 Years | 10 (5.3%) | 4 (1.5%) |
| 18 to 34 Years | 7 (2.5%) | 0 (0.0%) |
| 35 to 64 Years | 0 (0.0%) | 23 (4.0%) |
| 65 to 74 Years | 0 (0.0%) | 49 (25.3%) |
| 75 Years and over | 3 (3.4%) | 0 (0.0%) |
Disability Class: Ambulatory Difficulty
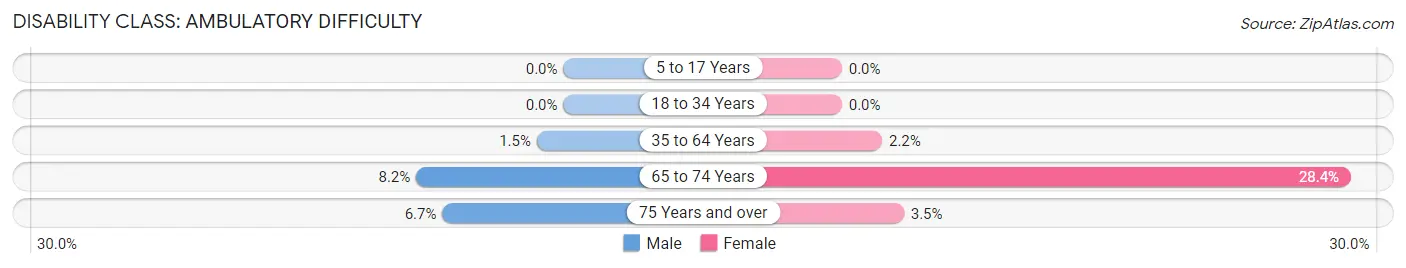
| Age Bracket | Male | Female |
| 5 to 17 Years | 0 (0.0%) | 0 (0.0%) |
| 18 to 34 Years | 0 (0.0%) | 0 (0.0%) |
| 35 to 64 Years | 8 (1.5%) | 13 (2.2%) |
| 65 to 74 Years | 5 (8.2%) | 55 (28.3%) |
| 75 Years and over | 6 (6.7%) | 6 (3.5%) |
Disability Class: Self-Care Difficulty
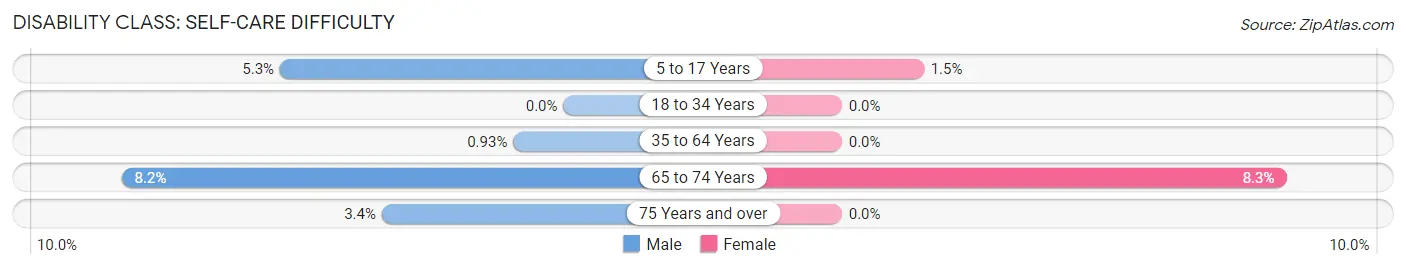
| Age Bracket | Male | Female |
| 5 to 17 Years | 10 (5.3%) | 4 (1.5%) |
| 18 to 34 Years | 0 (0.0%) | 0 (0.0%) |
| 35 to 64 Years | 5 (0.9%) | 0 (0.0%) |
| 65 to 74 Years | 5 (8.2%) | 16 (8.3%) |
| 75 Years and over | 3 (3.4%) | 0 (0.0%) |
Technology Access in Kechi
Computing Device Access in Kechi
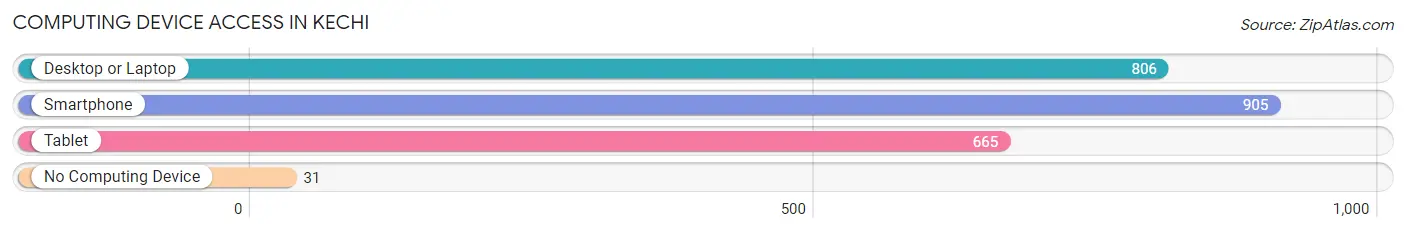
| Device Type | # Households | % Households |
| Desktop or Laptop | 806 | 83.9% |
| Smartphone | 905 | 94.2% |
| Tablet | 665 | 69.2% |
| No Computing Device | 31 | 3.2% |
| Total | 961 | 100.0% |
Internet Access in Kechi
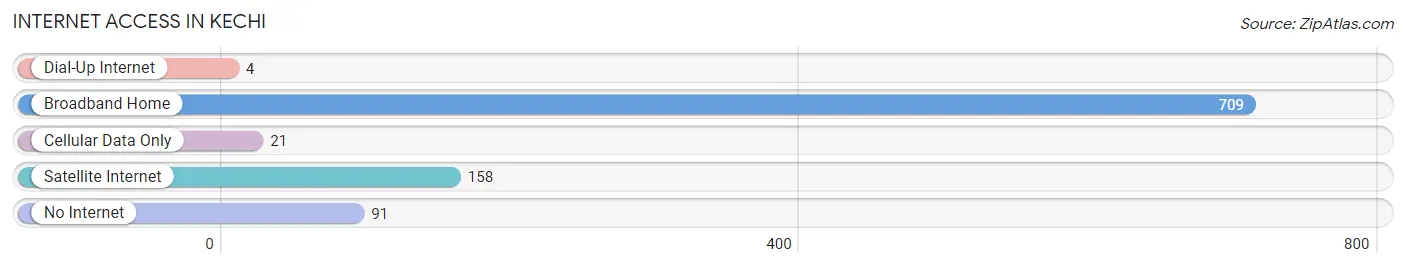
| Internet Type | # Households | % Households |
| Dial-Up Internet | 4 | 0.4% |
| Broadband Home | 709 | 73.8% |
| Cellular Data Only | 21 | 2.2% |
| Satellite Internet | 158 | 16.4% |
| No Internet | 91 | 9.5% |
| Total | 961 | 100.0% |
Kechi Summary
Kechi, Kansas is a small city located in Sedgwick County, Kansas. It is situated in the south-central part of the state, about 10 miles north of Wichita. The city has a population of approximately 4,000 people and is part of the Wichita metropolitan area.
History
Kechi was founded in 1887 by a group of settlers from the nearby town of El Dorado. The town was named after the Kechi Indians, who were the original inhabitants of the area. The town was incorporated in 1891 and was initially a farming community. In the early 1900s, the town began to grow and develop as a small industrial center. The town was home to several factories, including a flour mill, a brickyard, and a canning factory.
In the 1950s, Kechi began to experience a population boom as people moved to the area from other parts of the state. This growth was largely due to the development of the nearby McConnell Air Force Base. The base provided jobs and economic stability to the area, and the population of Kechi continued to grow throughout the 1960s and 1970s.
Geography
Kechi is located in south-central Kansas, about 10 miles north of Wichita. The city is situated in the Arkansas River Valley, which is part of the Great Plains region. The city is surrounded by rolling hills and grasslands, and the climate is generally mild and dry.
The city covers an area of approximately 4.5 square miles and is home to several parks and recreational areas. The city is also home to the Kechi Lake, which is a popular spot for fishing and boating.
Economy
Kechi’s economy is largely based on agriculture and manufacturing. The city is home to several factories, including a flour mill, a brickyard, and a canning factory. The city is also home to several small businesses, including restaurants, retail stores, and service providers.
The city is also home to McConnell Air Force Base, which provides jobs and economic stability to the area. The base is home to several military units, including the 22nd Air Refueling Wing and the 184th Intelligence Wing.
Demographics
As of the 2010 census, the population of Kechi was 4,039. The racial makeup of the city was 87.3% White, 5.2% African American, 0.7% Native American, 0.7% Asian, 0.1% Pacific Islander, and 4.9% from other races. The median household income was $45,938, and the median family income was $51,938.
Kechi is a small city with a diverse population. The city is home to a variety of cultures and religions, and the city is known for its friendly and welcoming atmosphere. The city is also home to several churches, including the First United Methodist Church, the First Presbyterian Church, and the Kechi Baptist Church.
Common Questions
What is Per Capita Income in Kechi?
Per Capita income in Kechi is $39,766.
What is the Median Family Income in Kechi?
Median Family Income in Kechi is $111,667.
What is the Median Household income in Kechi?
Median Household Income in Kechi is $103,625.
What is Income or Wage Gap in Kechi?
Income or Wage Gap in Kechi is 62.7%.
Women in Kechi earn 37.3 cents for every dollar earned by a man.
What is Inequality or Gini Index in Kechi?
Inequality or Gini Index in Kechi is 0.32.
What is the Total Population of Kechi?
Total Population of Kechi is 2,949.
What is the Total Male Population of Kechi?
Total Male Population of Kechi is 1,231.
What is the Total Female Population of Kechi?
Total Female Population of Kechi is 1,718.
What is the Ratio of Males per 100 Females in Kechi?
There are 71.65 Males per 100 Females in Kechi.
What is the Ratio of Females per 100 Males in Kechi?
There are 139.56 Females per 100 Males in Kechi.
What is the Median Population Age in Kechi?
Median Population Age in Kechi is 40.0 Years.
What is the Average Family Size in Kechi
Average Family Size in Kechi is 3.3 People.
What is the Average Household Size in Kechi
Average Household Size in Kechi is 3.1 People.
How Large is the Labor Force in Kechi?
There are 1,508 People in the Labor Forcein in Kechi.
What is the Percentage of People in the Labor Force in Kechi?
68.0% of People are in the Labor Force in Kechi.
What is the Unemployment Rate in Kechi?
Unemployment Rate in Kechi is 1.3%.