Russell, KS Map & Demographics
Russell Map
Russell Overview
$26,365
PER CAPITA INCOME
$63,154
AVG FAMILY INCOME
$44,942
AVG HOUSEHOLD INCOME
18.5%
WAGE / INCOME GAP [ % ]
81.5¢/ $1
WAGE / INCOME GAP [ $ ]
0.44
INEQUALITY / GINI INDEX
4,238
TOTAL POPULATION
2,087
MALE POPULATION
2,151
FEMALE POPULATION
97.02
MALES / 100 FEMALES
103.07
FEMALES / 100 MALES
42.1
MEDIAN AGE
2.9
AVG FAMILY SIZE
2.2
AVG HOUSEHOLD SIZE
2,064
LABOR FORCE [ PEOPLE ]
61.3%
PERCENT IN LABOR FORCE
3.2%
UNEMPLOYMENT RATE
Russell Zip Codes
Russell Area Codes
Income in Russell
Income Overview in Russell
Per Capita Income in Russell is $26,365, while median incomes of families and households are $63,154 and $44,942 respectively.
| Characteristic | Number | Measure |
| Per Capita Income | 4,238 | $26,365 |
| Median Family Income | 1,011 | $63,154 |
| Mean Family Income | 1,011 | $76,438 |
| Median Household Income | 1,886 | $44,942 |
| Mean Household Income | 1,886 | $57,362 |
| Income Deficit | 1,011 | $0 |
| Wage / Income Gap (%) | 4,238 | 18.46% |
| Wage / Income Gap ($) | 4,238 | 81.54¢ per $1 |
| Gini / Inequality Index | 4,238 | 0.44 |
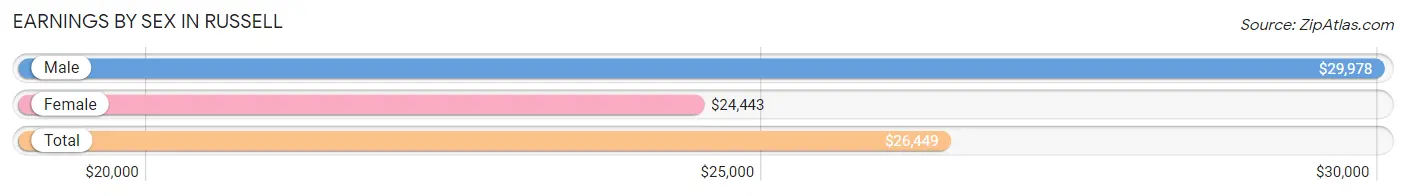
Earnings by Sex in Russell
Average Earnings in Russell are $26,449, $29,978 for men and $24,443 for women, a difference of 18.5%.
| Sex | Number | Average Earnings |
| Male | 1,127 (49.3%) | $29,978 |
| Female | 1,157 (50.7%) | $24,443 |
| Total | 2,284 (100.0%) | $26,449 |
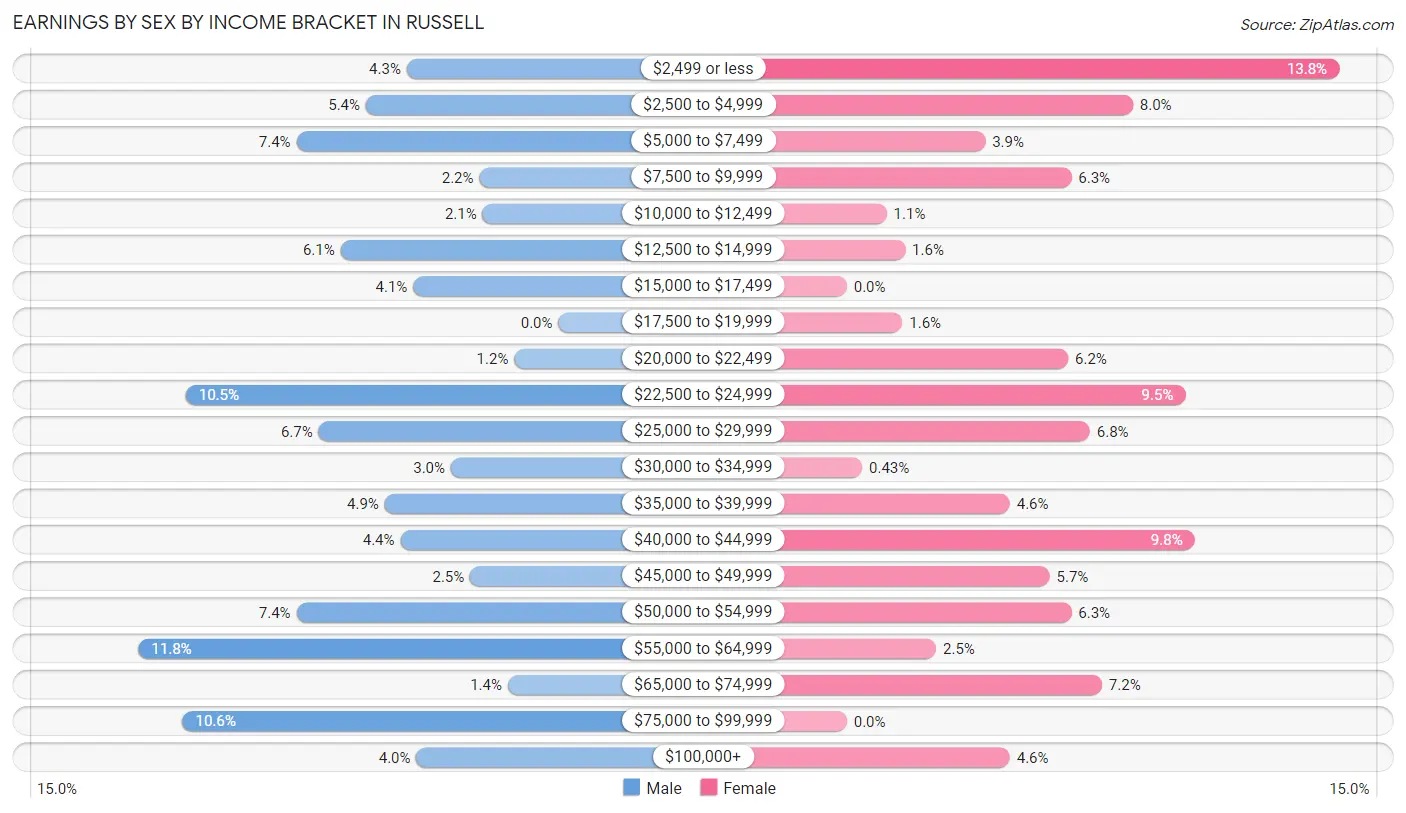
Earnings by Sex by Income Bracket in Russell
The most common earnings brackets in Russell are $55,000 to $64,999 for men (133 | 11.8%) and $2,499 or less for women (160 | 13.8%).
| Income | Male | Female |
| $2,499 or less | 48 (4.3%) | 160 (13.8%) |
| $2,500 to $4,999 | 61 (5.4%) | 93 (8.0%) |
| $5,000 to $7,499 | 83 (7.4%) | 45 (3.9%) |
| $7,500 to $9,999 | 25 (2.2%) | 73 (6.3%) |
| $10,000 to $12,499 | 24 (2.1%) | 13 (1.1%) |
| $12,500 to $14,999 | 69 (6.1%) | 19 (1.6%) |
| $15,000 to $17,499 | 46 (4.1%) | 0 (0.0%) |
| $17,500 to $19,999 | 0 (0.0%) | 18 (1.6%) |
| $20,000 to $22,499 | 14 (1.2%) | 72 (6.2%) |
| $22,500 to $24,999 | 118 (10.5%) | 110 (9.5%) |
| $25,000 to $29,999 | 76 (6.7%) | 79 (6.8%) |
| $30,000 to $34,999 | 34 (3.0%) | 5 (0.4%) |
| $35,000 to $39,999 | 55 (4.9%) | 53 (4.6%) |
| $40,000 to $44,999 | 50 (4.4%) | 113 (9.8%) |
| $45,000 to $49,999 | 28 (2.5%) | 66 (5.7%) |
| $50,000 to $54,999 | 83 (7.4%) | 73 (6.3%) |
| $55,000 to $64,999 | 133 (11.8%) | 29 (2.5%) |
| $65,000 to $74,999 | 16 (1.4%) | 83 (7.2%) |
| $75,000 to $99,999 | 119 (10.6%) | 0 (0.0%) |
| $100,000+ | 45 (4.0%) | 53 (4.6%) |
| Total | 1,127 (100.0%) | 1,157 (100.0%) |
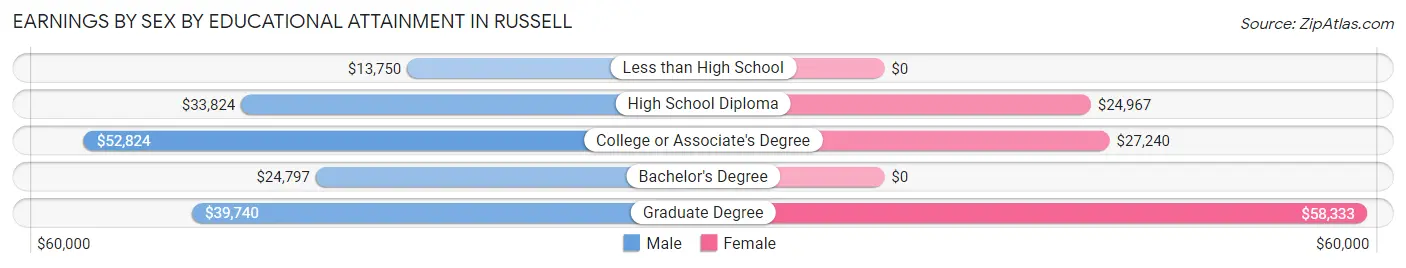
Earnings by Sex by Educational Attainment in Russell
Average earnings in Russell are $39,023 for men and $26,946 for women, a difference of 30.9%. Men with an educational attainment of college or associate's degree enjoy the highest average annual earnings of $52,824, while those with less than high school education earn the least with $13,750. Women with an educational attainment of graduate degree earn the most with the average annual earnings of $58,333, while those with high school diploma education have the smallest earnings of $24,967.
| Educational Attainment | Male Income | Female Income |
| Less than High School | $13,750 | $0 |
| High School Diploma | $33,824 | $24,967 |
| College or Associate's Degree | $52,824 | $27,240 |
| Bachelor's Degree | $24,797 | $0 |
| Graduate Degree | $39,740 | $58,333 |
| Total | $39,023 | $26,946 |
Family Income in Russell
Family Income Brackets in Russell
According to the Russell family income data, there are 363 families falling into the $50,000 to $74,999 income range, which is the most common income bracket and makes up 35.9% of all families. Conversely, the $150,000 to $199,999 income bracket is the least frequent group with only 5 families (0.5%) belonging to this category.
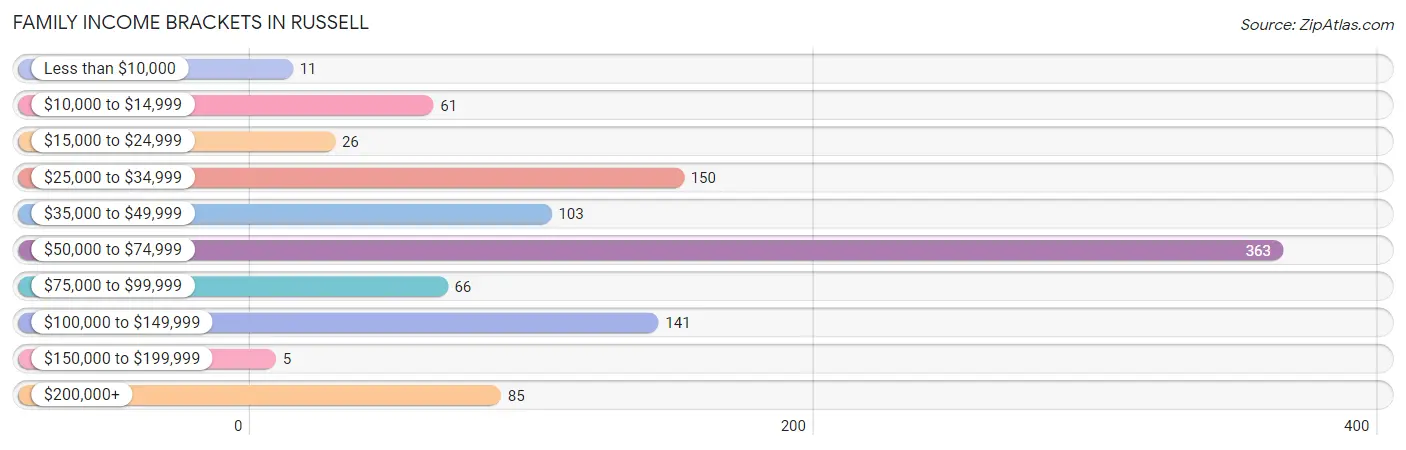
| Income Bracket | # Families | % Families |
| Less than $10,000 | 11 | 1.1% |
| $10,000 to $14,999 | 61 | 6.0% |
| $15,000 to $24,999 | 26 | 2.6% |
| $25,000 to $34,999 | 150 | 14.8% |
| $35,000 to $49,999 | 103 | 10.2% |
| $50,000 to $74,999 | 363 | 35.9% |
| $75,000 to $99,999 | 66 | 6.5% |
| $100,000 to $149,999 | 141 | 13.9% |
| $150,000 to $199,999 | 5 | 0.5% |
| $200,000+ | 85 | 8.4% |
Family Income by Famaliy Size in Russell
5-person families (31 | 3.1%) account for the highest median family income in Russell with $87,614 per family, while 2-person families (564 | 55.8%) have the highest median income of $31,474 per family member.
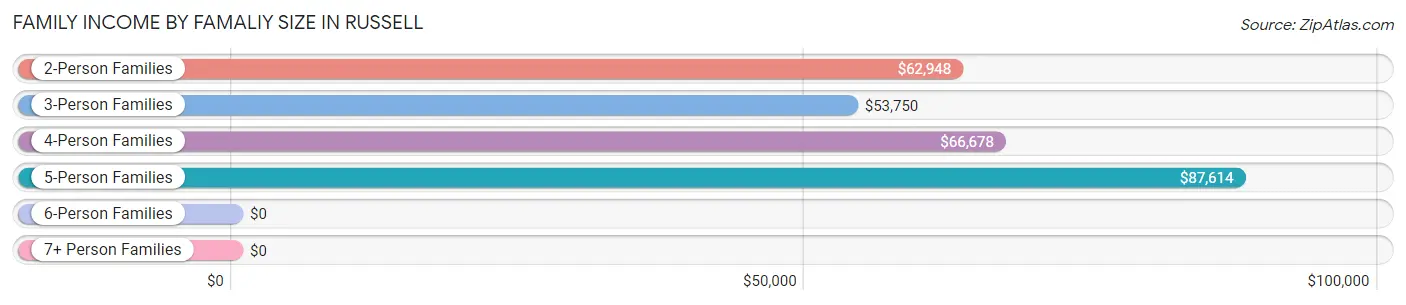
| Income Bracket | # Families | Median Income |
| 2-Person Families | 564 (55.8%) | $62,948 |
| 3-Person Families | 164 (16.2%) | $53,750 |
| 4-Person Families | 228 (22.6%) | $66,678 |
| 5-Person Families | 31 (3.1%) | $87,614 |
| 6-Person Families | 16 (1.6%) | $0 |
| 7+ Person Families | 8 (0.8%) | $0 |
| Total | 1,011 (100.0%) | $63,154 |
Family Income by Number of Earners in Russell
The median family income in Russell is $63,154, with families comprising 2 earners (457) having the highest median family income of $66,832, while families with no earners (128) have the lowest median family income of $35,000, accounting for 45.2% and 12.7% of families, respectively.
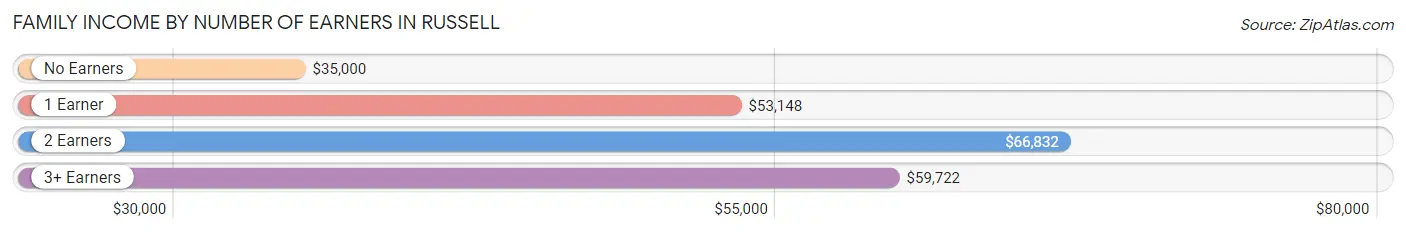
| Number of Earners | # Families | Median Income |
| No Earners | 128 (12.7%) | $35,000 |
| 1 Earner | 362 (35.8%) | $53,148 |
| 2 Earners | 457 (45.2%) | $66,832 |
| 3+ Earners | 64 (6.3%) | $59,722 |
| Total | 1,011 (100.0%) | $63,154 |
Household Income in Russell
Household Income Brackets in Russell
With 502 households falling in the category, the $50,000 to $74,999 income range is the most frequent in Russell, accounting for 26.6% of all households. In contrast, only 6 households (0.3%) fall into the $150,000 to $199,999 income bracket, making it the least populous group.
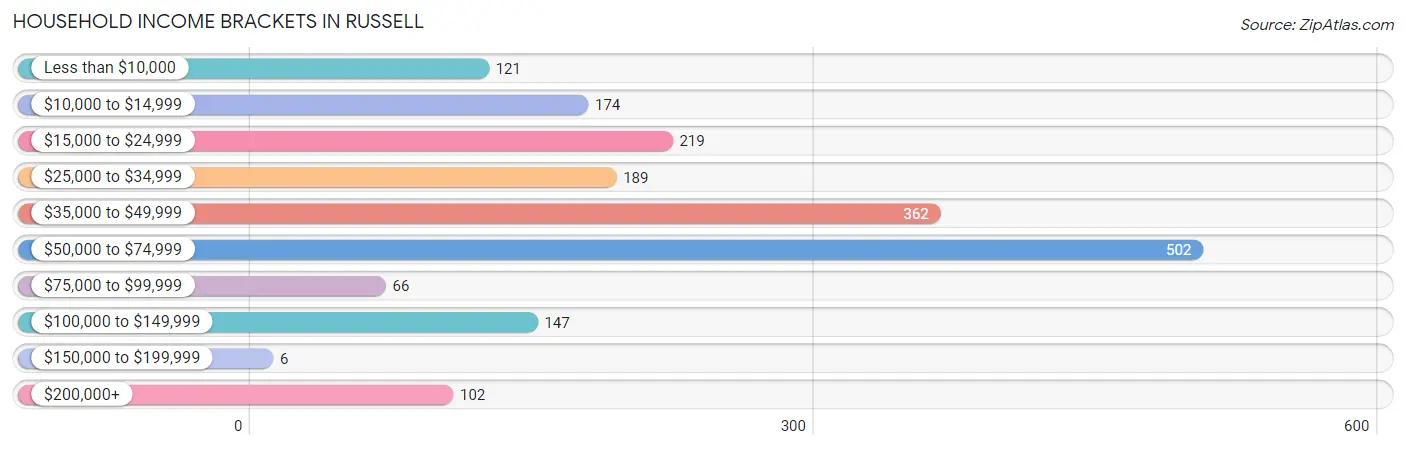
| Income Bracket | # Households | % Households |
| Less than $10,000 | 121 | 6.4% |
| $10,000 to $14,999 | 174 | 9.2% |
| $15,000 to $24,999 | 219 | 11.6% |
| $25,000 to $34,999 | 189 | 10.0% |
| $35,000 to $49,999 | 362 | 19.2% |
| $50,000 to $74,999 | 502 | 26.6% |
| $75,000 to $99,999 | 66 | 3.5% |
| $100,000 to $149,999 | 147 | 7.8% |
| $150,000 to $199,999 | 6 | 0.3% |
| $200,000+ | 102 | 5.4% |
Household Income by Householder Age in Russell
The median household income in Russell is $44,942, with the highest median household income of $55,035 found in the 45 to 64 years age bracket for the primary householder. A total of 527 households (27.9%) fall into this category. Meanwhile, the 15 to 24 years age bracket for the primary householder has the lowest median household income of $0, with 43 households (2.3%) in this group.
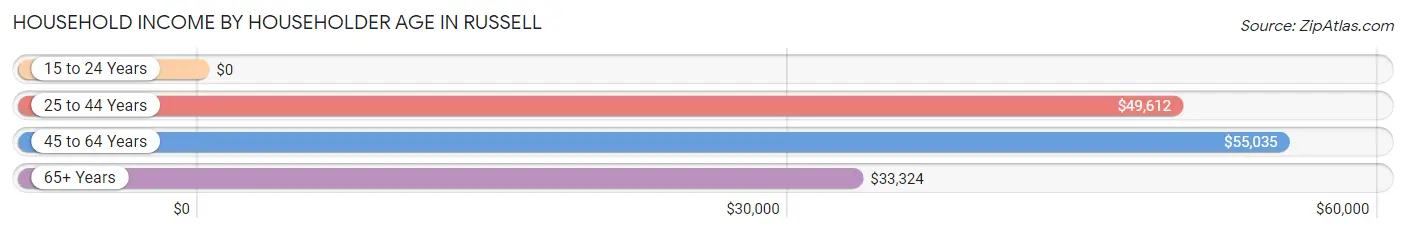
| Income Bracket | # Households | Median Income |
| 15 to 24 Years | 43 (2.3%) | $0 |
| 25 to 44 Years | 649 (34.4%) | $49,612 |
| 45 to 64 Years | 527 (27.9%) | $55,035 |
| 65+ Years | 667 (35.4%) | $33,324 |
| Total | 1,886 (100.0%) | $44,942 |
Poverty in Russell
Income Below Poverty by Sex and Age in Russell
With 26.9% poverty level for males and 17.5% for females among the residents of Russell, under 5 year old males and 5 year old females are the most vulnerable to poverty, with 123 males (89.1%) and 17 females (53.1%) in their respective age groups living below the poverty level.
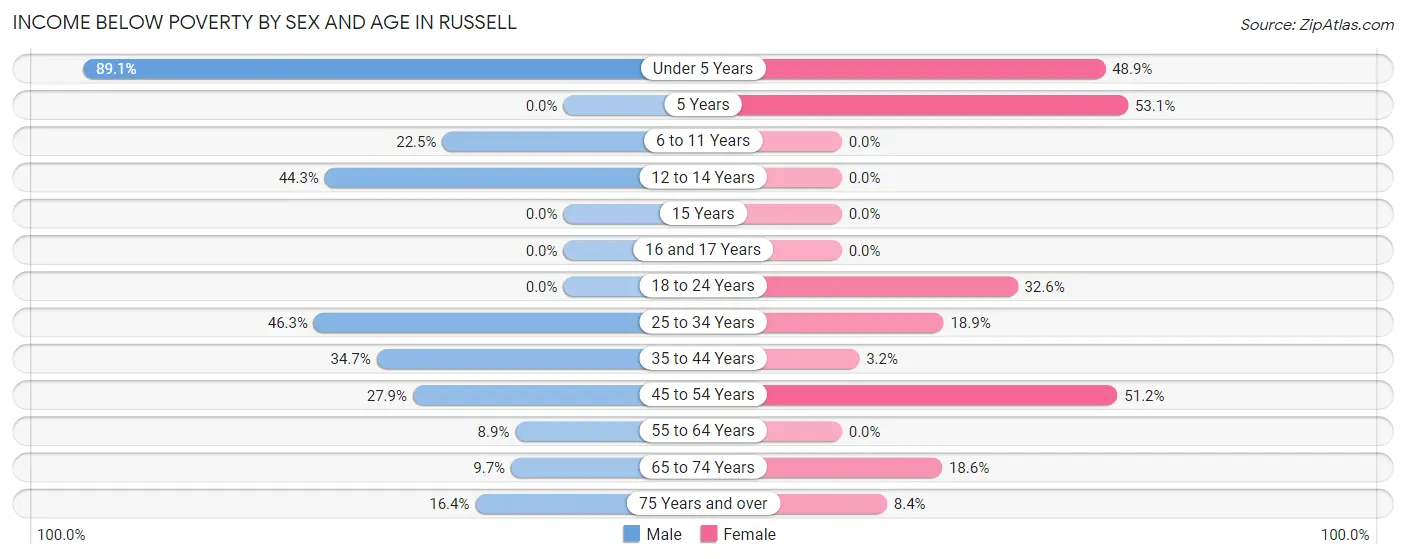
| Age Bracket | Male | Female |
| Under 5 Years | 123 (89.1%) | 88 (48.9%) |
| 5 Years | 0 (0.0%) | 17 (53.1%) |
| 6 to 11 Years | 40 (22.5%) | 0 (0.0%) |
| 12 to 14 Years | 35 (44.3%) | 0 (0.0%) |
| 15 Years | 0 (0.0%) | 0 (0.0%) |
| 16 and 17 Years | 0 (0.0%) | 0 (0.0%) |
| 18 to 24 Years | 0 (0.0%) | 15 (32.6%) |
| 25 to 34 Years | 107 (46.3%) | 47 (18.9%) |
| 35 to 44 Years | 104 (34.7%) | 8 (3.2%) |
| 45 to 54 Years | 57 (27.9%) | 111 (51.1%) |
| 55 to 64 Years | 30 (8.9%) | 0 (0.0%) |
| 65 to 74 Years | 18 (9.7%) | 53 (18.6%) |
| 75 Years and over | 26 (16.4%) | 23 (8.4%) |
| Total | 540 (26.9%) | 362 (17.5%) |
Income Above Poverty by Sex and Age in Russell
According to the poverty statistics in Russell, males aged 5 years and females aged 6 to 11 years are the age groups that are most secure financially, with 100.0% of males and 100.0% of females in these age groups living above the poverty line.
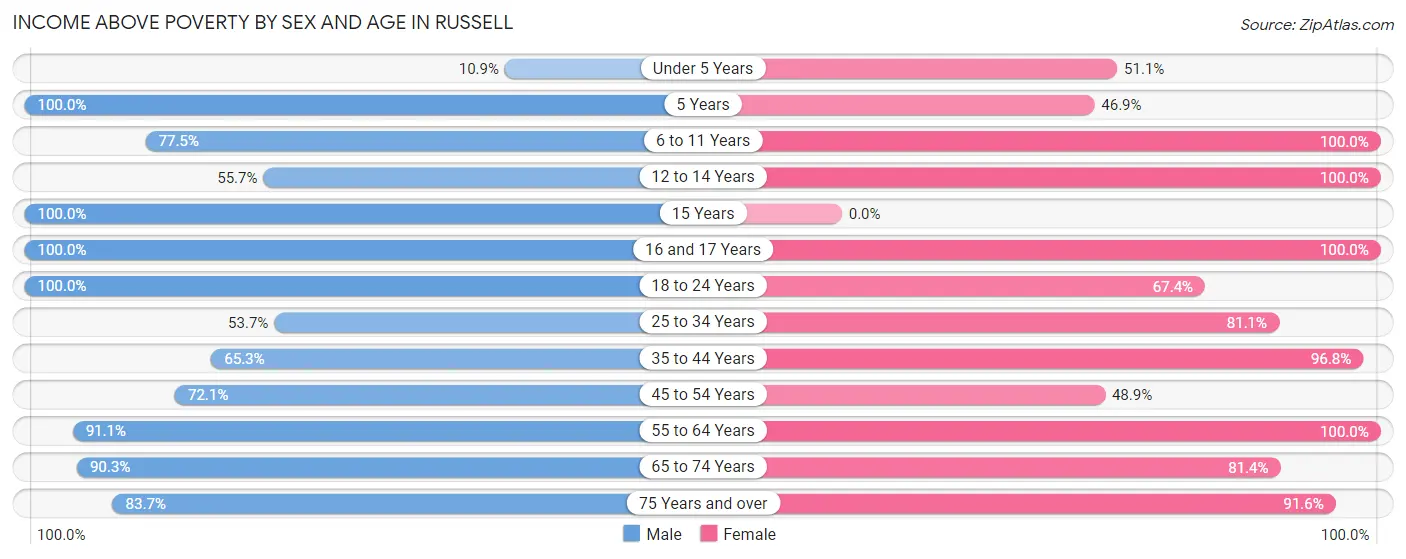
| Age Bracket | Male | Female |
| Under 5 Years | 15 (10.9%) | 92 (51.1%) |
| 5 Years | 35 (100.0%) | 15 (46.9%) |
| 6 to 11 Years | 138 (77.5%) | 124 (100.0%) |
| 12 to 14 Years | 44 (55.7%) | 25 (100.0%) |
| 15 Years | 29 (100.0%) | 0 (0.0%) |
| 16 and 17 Years | 30 (100.0%) | 123 (100.0%) |
| 18 to 24 Years | 106 (100.0%) | 31 (67.4%) |
| 25 to 34 Years | 124 (53.7%) | 202 (81.1%) |
| 35 to 44 Years | 196 (65.3%) | 239 (96.8%) |
| 45 to 54 Years | 147 (72.1%) | 106 (48.8%) |
| 55 to 64 Years | 306 (91.1%) | 268 (100.0%) |
| 65 to 74 Years | 167 (90.3%) | 232 (81.4%) |
| 75 Years and over | 133 (83.7%) | 252 (91.6%) |
| Total | 1,470 (73.1%) | 1,709 (82.5%) |
Income Below Poverty Among Married-Couple Families in Russell
The poverty statistics for married-couple families in Russell show that 6.8% or 50 of the total 738 families live below the poverty line. Families with 5 or more children have the highest poverty rate of 100.0%, comprising of 8 families. On the other hand, families with no children have the lowest poverty rate of 3.2%, which includes 17 families.
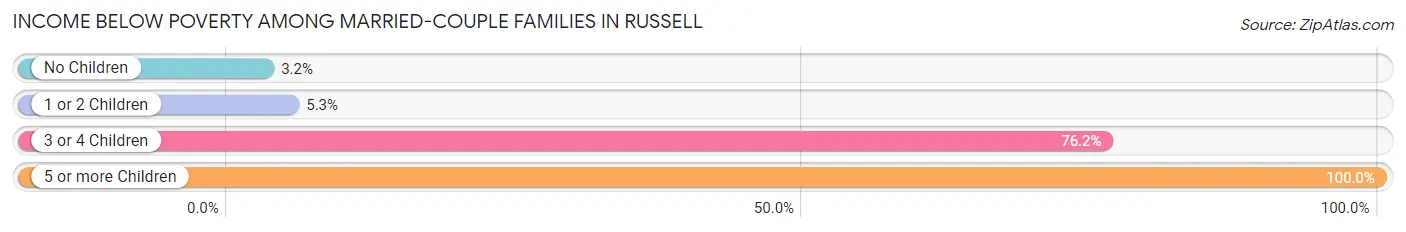
| Children | Above Poverty | Below Poverty |
| No Children | 523 (96.9%) | 17 (3.2%) |
| 1 or 2 Children | 160 (94.7%) | 9 (5.3%) |
| 3 or 4 Children | 5 (23.8%) | 16 (76.2%) |
| 5 or more Children | 0 (0.0%) | 8 (100.0%) |
| Total | 688 (93.2%) | 50 (6.8%) |
Income Below Poverty Among Single-Parent Households in Russell
According to the poverty data in Russell, 59.2% or 61 single-father households and 6.5% or 11 single-mother households are living below the poverty line. Among single-father households, those with 1 or 2 children have the highest poverty rate, with 61 households (74.4%) experiencing poverty. Likewise, among single-mother households, those with 3 or 4 children have the highest poverty rate, with 11 households (12.2%) falling below the poverty line.
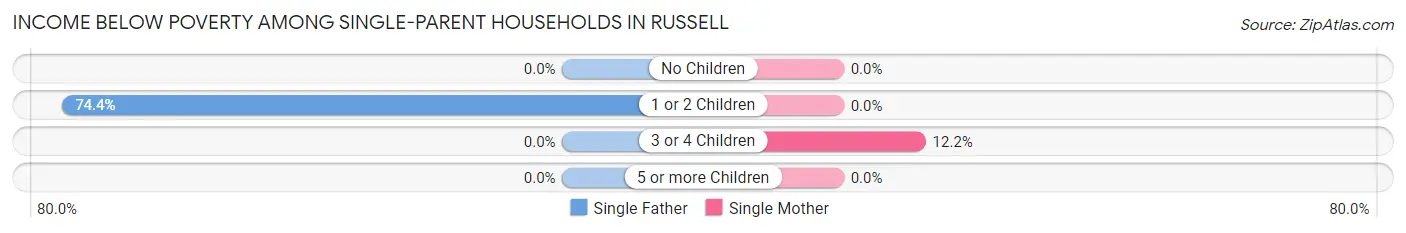
| Children | Single Father | Single Mother |
| No Children | 0 (0.0%) | 0 (0.0%) |
| 1 or 2 Children | 61 (74.4%) | 0 (0.0%) |
| 3 or 4 Children | 0 (0.0%) | 11 (12.2%) |
| 5 or more Children | 0 (0.0%) | 0 (0.0%) |
| Total | 61 (59.2%) | 11 (6.5%) |
Income Below Poverty Among Married-Couple vs Single-Parent Households in Russell
The poverty data for Russell shows that 50 of the married-couple family households (6.8%) and 72 of the single-parent households (26.4%) are living below the poverty level. Within the married-couple family households, those with 5 or more children have the highest poverty rate, with 8 households (100.0%) falling below the poverty line. Among the single-parent households, those with 1 or 2 children have the highest poverty rate, with 61 household (50.4%) living below poverty.
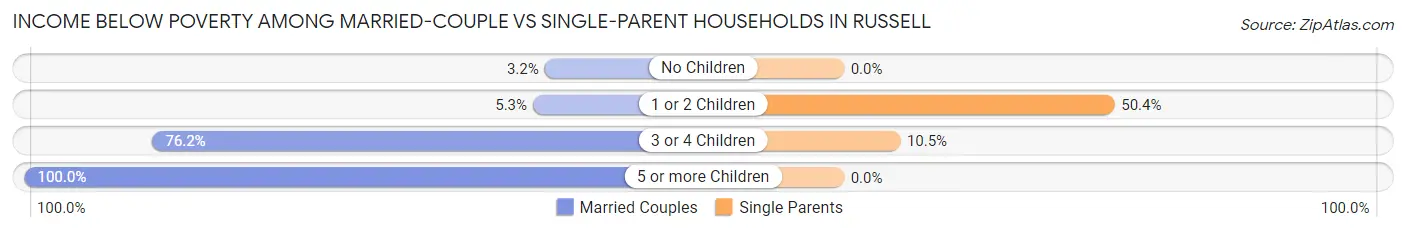
| Children | Married-Couple Families | Single-Parent Households |
| No Children | 17 (3.2%) | 0 (0.0%) |
| 1 or 2 Children | 9 (5.3%) | 61 (50.4%) |
| 3 or 4 Children | 16 (76.2%) | 11 (10.5%) |
| 5 or more Children | 8 (100.0%) | 0 (0.0%) |
| Total | 50 (6.8%) | 72 (26.4%) |
Race in Russell
The most populous races in Russell are White / Caucasian (3,747 | 88.4%), Two or more Races (291 | 6.9%), and Hispanic or Latino (269 | 6.4%).
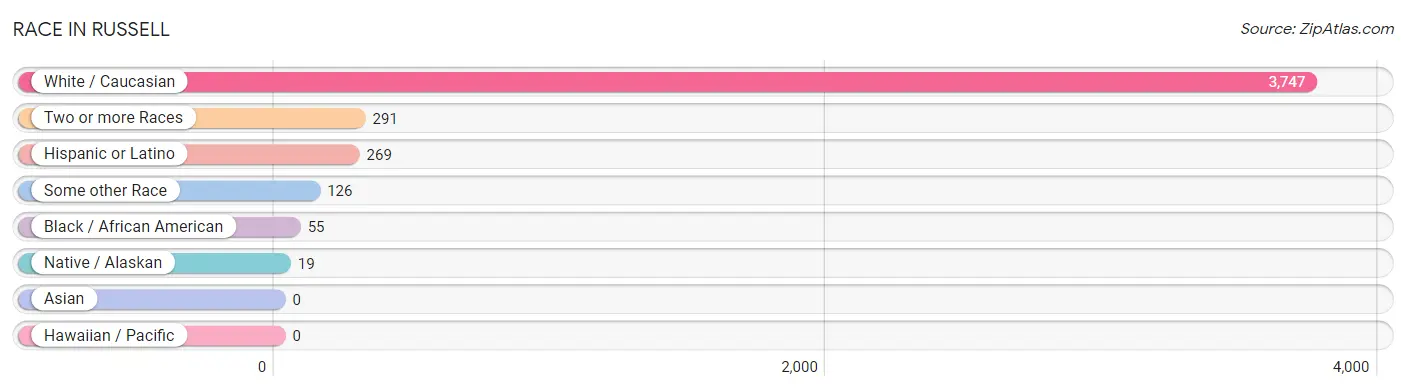
| Race | # Population | % Population |
| Asian | 0 | 0.0% |
| Black / African American | 55 | 1.3% |
| Hawaiian / Pacific | 0 | 0.0% |
| Hispanic or Latino | 269 | 6.4% |
| Native / Alaskan | 19 | 0.4% |
| White / Caucasian | 3,747 | 88.4% |
| Two or more Races | 291 | 6.9% |
| Some other Race | 126 | 3.0% |
| Total | 4,238 | 100.0% |
Ancestry in Russell
The most populous ancestries reported in Russell are German (1,580 | 37.3%), English (377 | 8.9%), Irish (285 | 6.7%), American (258 | 6.1%), and Mexican (177 | 4.2%), together accounting for 63.2% of all Russell residents.
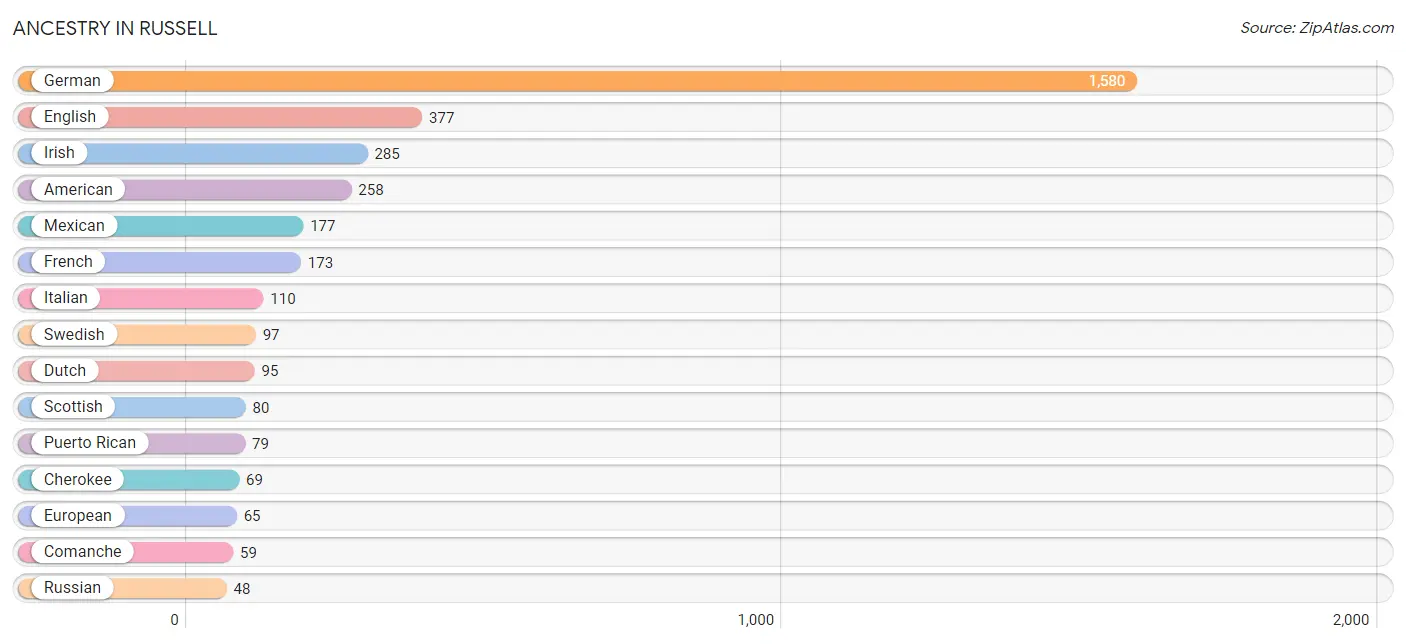
| Ancestry | # Population | % Population |
| American | 258 | 6.1% |
| Central American | 3 | 0.1% |
| Cherokee | 69 | 1.6% |
| Comanche | 59 | 1.4% |
| Czech | 42 | 1.0% |
| Czechoslovakian | 8 | 0.2% |
| Dutch | 95 | 2.2% |
| English | 377 | 8.9% |
| European | 65 | 1.5% |
| French | 173 | 4.1% |
| German | 1,580 | 37.3% |
| Honduran | 3 | 0.1% |
| Irish | 285 | 6.7% |
| Italian | 110 | 2.6% |
| Mexican | 177 | 4.2% |
| Polish | 13 | 0.3% |
| Puerto Rican | 79 | 1.9% |
| Russian | 48 | 1.1% |
| Scotch-Irish | 5 | 0.1% |
| Scottish | 80 | 1.9% |
| Spanish | 10 | 0.2% |
| Swedish | 97 | 2.3% |
| Swiss | 25 | 0.6% |
| Welsh | 24 | 0.6% | View All 24 Rows |
Immigrants in Russell
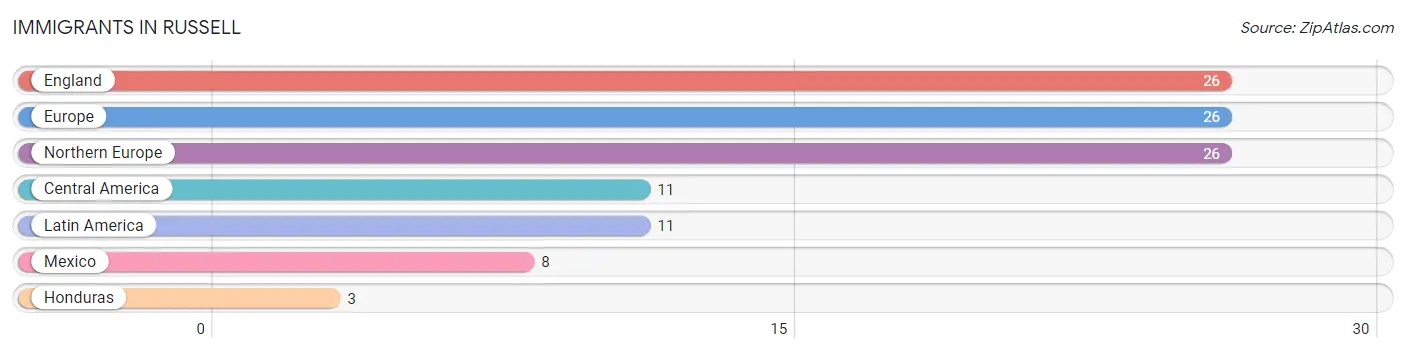
The most numerous immigrant groups reported in Russell came from England (26 | 0.6%), Europe (26 | 0.6%), Northern Europe (26 | 0.6%), Central America (11 | 0.3%), and Latin America (11 | 0.3%), together accounting for 2.4% of all Russell residents.
| Immigration Origin | # Population | % Population |
| Central America | 11 | 0.3% |
| England | 26 | 0.6% |
| Europe | 26 | 0.6% |
| Honduras | 3 | 0.1% |
| Latin America | 11 | 0.3% |
| Mexico | 8 | 0.2% |
| Northern Europe | 26 | 0.6% | View All 7 Rows |
Sex and Age in Russell
Sex and Age in Russell
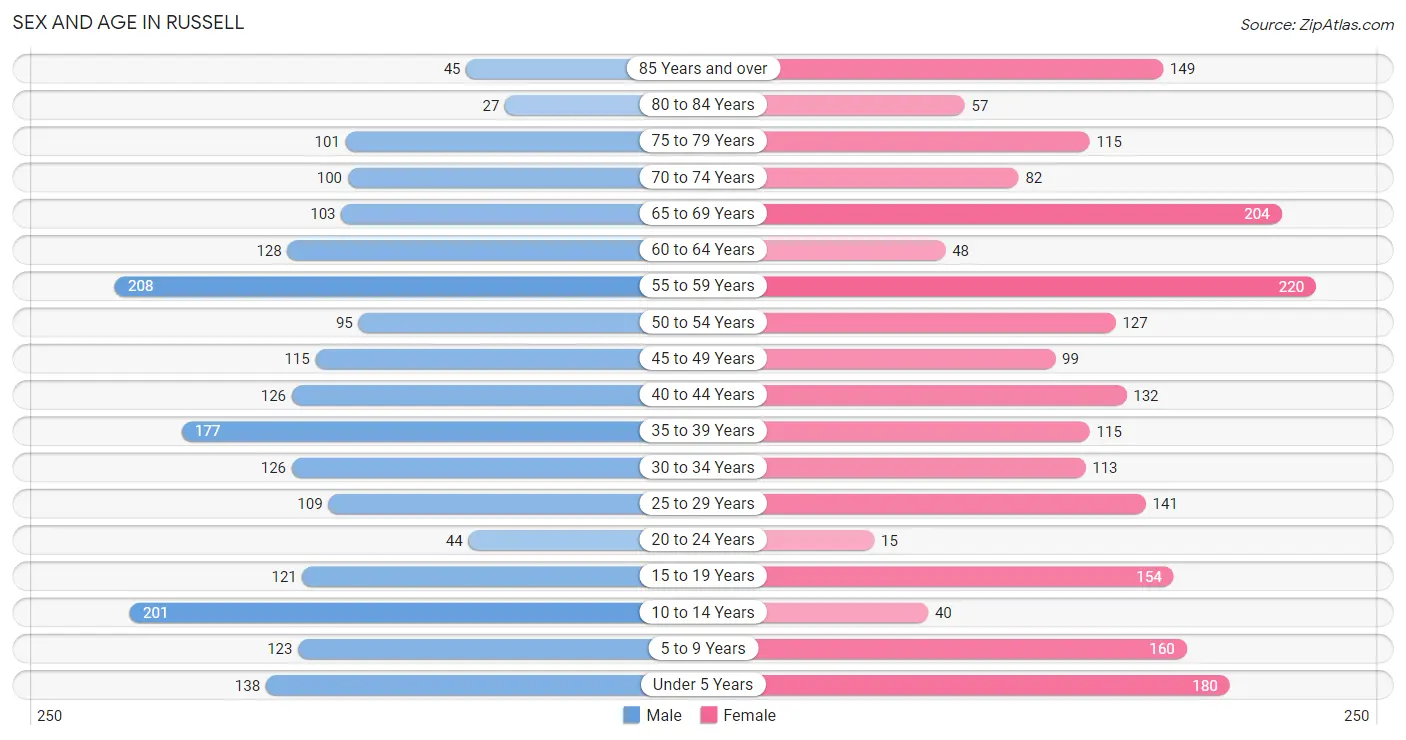
The most populous age groups in Russell are 55 to 59 Years (208 | 10.0%) for men and 55 to 59 Years (220 | 10.2%) for women.
| Age Bracket | Male | Female |
| Under 5 Years | 138 (6.6%) | 180 (8.4%) |
| 5 to 9 Years | 123 (5.9%) | 160 (7.4%) |
| 10 to 14 Years | 201 (9.6%) | 40 (1.9%) |
| 15 to 19 Years | 121 (5.8%) | 154 (7.2%) |
| 20 to 24 Years | 44 (2.1%) | 15 (0.7%) |
| 25 to 29 Years | 109 (5.2%) | 141 (6.6%) |
| 30 to 34 Years | 126 (6.0%) | 113 (5.2%) |
| 35 to 39 Years | 177 (8.5%) | 115 (5.3%) |
| 40 to 44 Years | 126 (6.0%) | 132 (6.1%) |
| 45 to 49 Years | 115 (5.5%) | 99 (4.6%) |
| 50 to 54 Years | 95 (4.5%) | 127 (5.9%) |
| 55 to 59 Years | 208 (10.0%) | 220 (10.2%) |
| 60 to 64 Years | 128 (6.1%) | 48 (2.2%) |
| 65 to 69 Years | 103 (4.9%) | 204 (9.5%) |
| 70 to 74 Years | 100 (4.8%) | 82 (3.8%) |
| 75 to 79 Years | 101 (4.8%) | 115 (5.3%) |
| 80 to 84 Years | 27 (1.3%) | 57 (2.6%) |
| 85 Years and over | 45 (2.2%) | 149 (6.9%) |
| Total | 2,087 (100.0%) | 2,151 (100.0%) |
Families and Households in Russell
Median Family Size in Russell
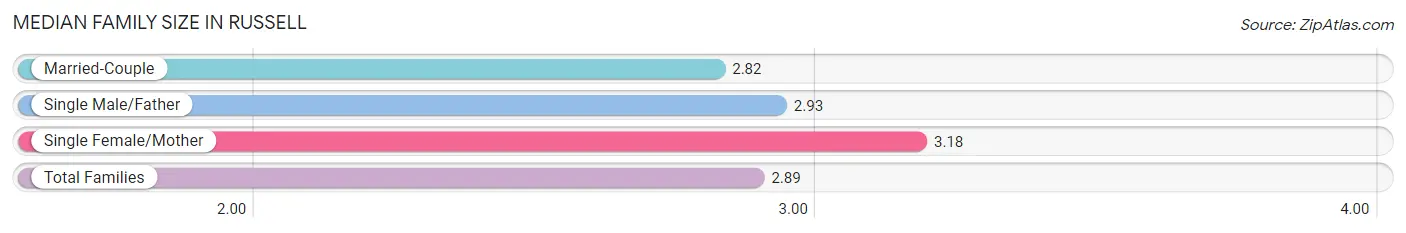
The median family size in Russell is 2.89 persons per family, with single female/mother families (170 | 16.8%) accounting for the largest median family size of 3.18 persons per family. On the other hand, married-couple families (738 | 73.0%) represent the smallest median family size with 2.82 persons per family.
| Family Type | # Families | Family Size |
| Married-Couple | 738 (73.0%) | 2.82 |
| Single Male/Father | 103 (10.2%) | 2.93 |
| Single Female/Mother | 170 (16.8%) | 3.18 |
| Total Families | 1,011 (100.0%) | 2.89 |
Median Household Size in Russell
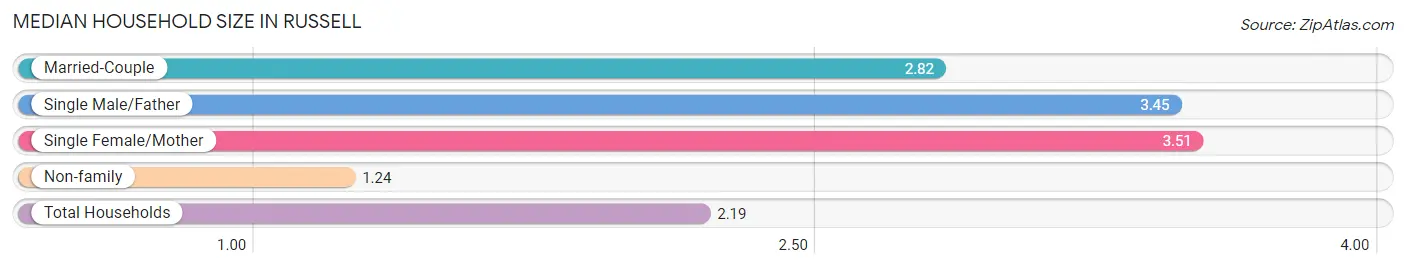
The median household size in Russell is 2.19 persons per household, with single female/mother households (170 | 9.0%) accounting for the largest median household size of 3.51 persons per household. non-family households (875 | 46.4%) represent the smallest median household size with 1.24 persons per household.
| Household Type | # Households | Household Size |
| Married-Couple | 738 (39.1%) | 2.82 |
| Single Male/Father | 103 (5.5%) | 3.45 |
| Single Female/Mother | 170 (9.0%) | 3.51 |
| Non-family | 875 (46.4%) | 1.24 |
| Total Households | 1,886 (100.0%) | 2.19 |
Household Size by Marriage Status in Russell
Out of a total of 1,886 households in Russell, 1,011 (53.6%) are family households, while 875 (46.4%) are nonfamily households. The most numerous type of family households are 2-person households, comprising 541, and the most common type of nonfamily households are 1-person households, comprising 774.
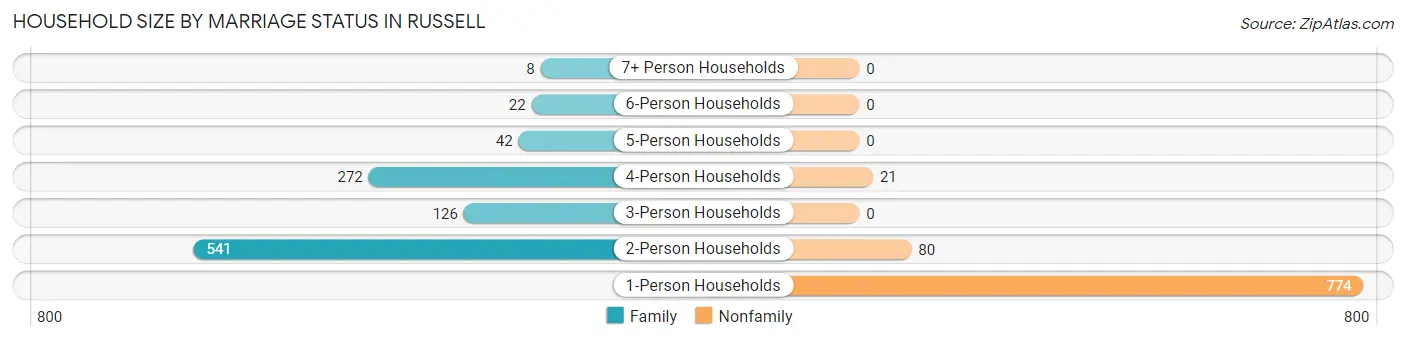
| Household Size | Family Households | Nonfamily Households |
| 1-Person Households | - | 774 (41.0%) |
| 2-Person Households | 541 (28.7%) | 80 (4.2%) |
| 3-Person Households | 126 (6.7%) | 0 (0.0%) |
| 4-Person Households | 272 (14.4%) | 21 (1.1%) |
| 5-Person Households | 42 (2.2%) | 0 (0.0%) |
| 6-Person Households | 22 (1.2%) | 0 (0.0%) |
| 7+ Person Households | 8 (0.4%) | 0 (0.0%) |
| Total | 1,011 (53.6%) | 875 (46.4%) |
Female Fertility in Russell
Fertility by Age in Russell
Average fertility rate in Russell is 14.0 births per 1,000 women. Women in the age bracket of 20 to 34 years have the highest fertility rate with 41.0 births per 1,000 women. Women in the age bracket of 20 to 34 years acount for 100.0% of all women with births.
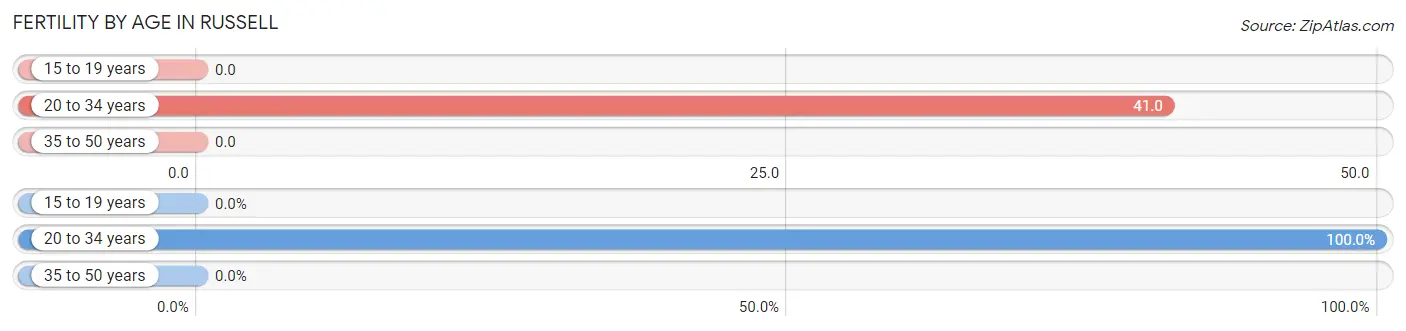
| Age Bracket | Women with Births | Births / 1,000 Women |
| 15 to 19 years | 0 (0.0%) | 0.0 |
| 20 to 34 years | 11 (100.0%) | 41.0 |
| 35 to 50 years | 0 (0.0%) | 0.0 |
| Total | 11 (100.0%) | 14.0 |
Fertility by Age by Marriage Status in Russell

| Age Bracket | Married | Unmarried |
| 15 to 19 years | 0 (0.0%) | 0 (0.0%) |
| 20 to 34 years | 11 (100.0%) | 0 (0.0%) |
| 35 to 50 years | 0 (0.0%) | 0 (0.0%) |
| Total | 11 (100.0%) | 0 (0.0%) |
Fertility by Education in Russell
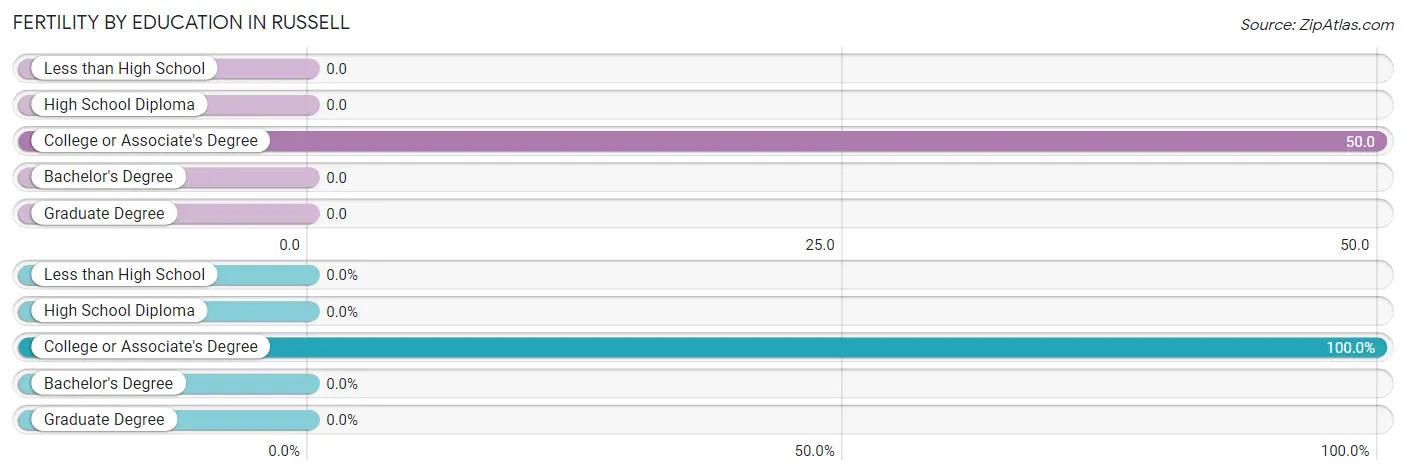
| Educational Attainment | Women with Births | Births / 1,000 Women |
| Less than High School | 0 (0.0%) | 0.0 |
| High School Diploma | 0 (0.0%) | 0.0 |
| College or Associate's Degree | 11 (100.0%) | 50.0 |
| Bachelor's Degree | 0 (0.0%) | 0.0 |
| Graduate Degree | 0 (0.0%) | 0.0 |
| Total | 11 (100.0%) | 14.0 |
Fertility by Education by Marriage Status in Russell
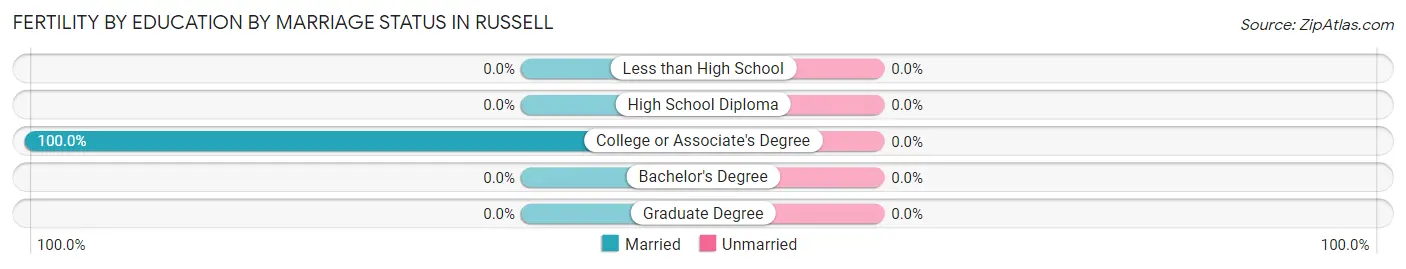
| Educational Attainment | Married | Unmarried |
| Less than High School | 0 (0.0%) | 0 (0.0%) |
| High School Diploma | 0 (0.0%) | 0 (0.0%) |
| College or Associate's Degree | 11 (100.0%) | 0 (0.0%) |
| Bachelor's Degree | 0 (0.0%) | 0 (0.0%) |
| Graduate Degree | 0 (0.0%) | 0 (0.0%) |
| Total | 11 (100.0%) | 0 (0.0%) |
Employment Characteristics in Russell
Employment by Class of Employer in Russell
Among the 1,936 employed individuals in Russell, private company employees (1,383 | 71.4%), self-employed (not incorporated) (197 | 10.2%), and not-for-profit organizations (152 | 7.9%) make up the most common classes of employment.
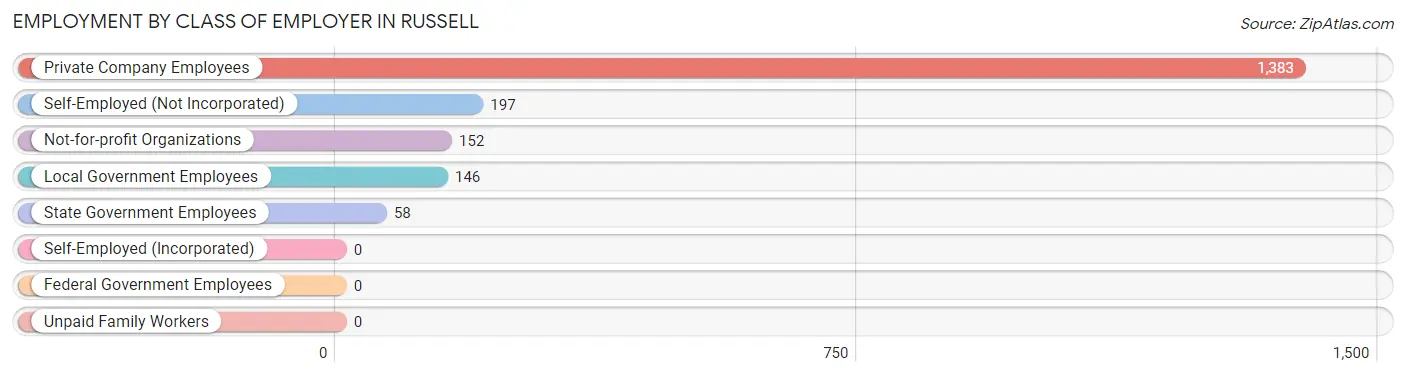
| Employer Class | # Employees | % Employees |
| Private Company Employees | 1,383 | 71.4% |
| Self-Employed (Incorporated) | 0 | 0.0% |
| Self-Employed (Not Incorporated) | 197 | 10.2% |
| Not-for-profit Organizations | 152 | 7.9% |
| Local Government Employees | 146 | 7.5% |
| State Government Employees | 58 | 3.0% |
| Federal Government Employees | 0 | 0.0% |
| Unpaid Family Workers | 0 | 0.0% |
| Total | 1,936 | 100.0% |
Employment Status by Age in Russell
According to the labor force statistics for Russell, out of the total population over 16 years of age (3,367), 61.3% or 2,064 individuals are in the labor force, with 3.2% or 66 of them unemployed. The age group with the highest labor force participation rate is 25 to 29 years, with 98.4% or 246 individuals in the labor force. Within the labor force, the 20 to 24 years age range has the highest percentage of unemployed individuals, with 25.0% or 11 of them being unemployed.
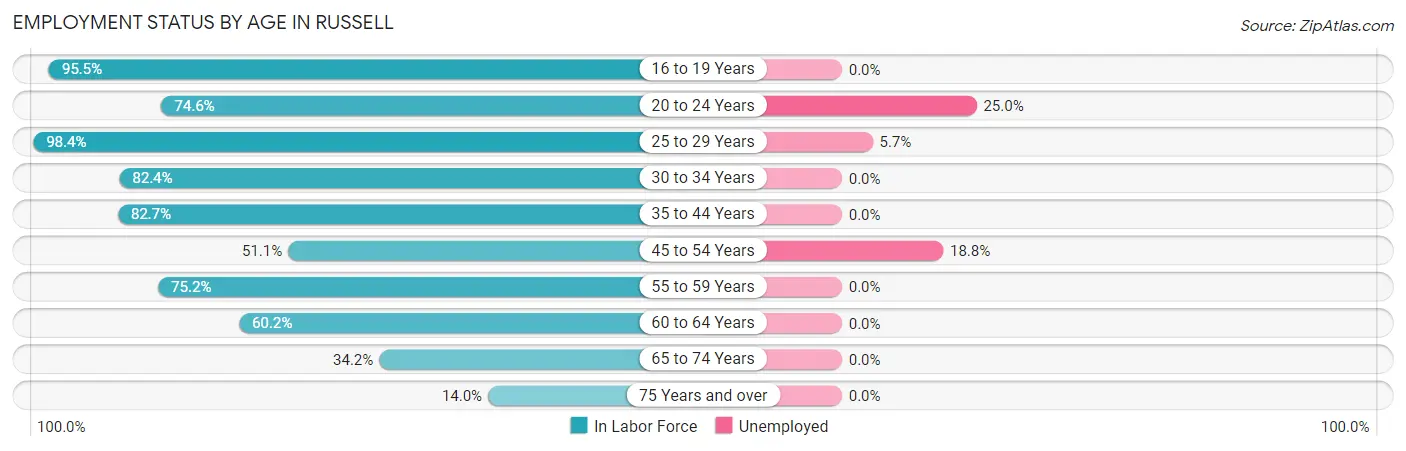
| Age Bracket | In Labor Force | Unemployed |
| 16 to 19 Years | 235 (95.5%) | 0 (0.0%) |
| 20 to 24 Years | 44 (74.6%) | 11 (25.0%) |
| 25 to 29 Years | 246 (98.4%) | 14 (5.7%) |
| 30 to 34 Years | 197 (82.4%) | 0 (0.0%) |
| 35 to 44 Years | 455 (82.7%) | 0 (0.0%) |
| 45 to 54 Years | 223 (51.1%) | 42 (18.8%) |
| 55 to 59 Years | 322 (75.2%) | 0 (0.0%) |
| 60 to 64 Years | 106 (60.2%) | 0 (0.0%) |
| 65 to 74 Years | 167 (34.2%) | 0 (0.0%) |
| 75 Years and over | 69 (14.0%) | 0 (0.0%) |
| Total | 2,064 (61.3%) | 66 (3.2%) |
Employment Status by Educational Attainment in Russell
According to labor force statistics for Russell, 74.5% of individuals (1,549) out of the total population between 25 and 64 years of age (2,079) are in the labor force, with 3.6% or 56 of them being unemployed. The group with the highest labor force participation rate are those with the educational attainment of bachelor's degree or higher, with 94.5% or 414 individuals in the labor force. Within the labor force, individuals with less than high school education have the highest percentage of unemployment, with 42.4% or 14 of them being unemployed.
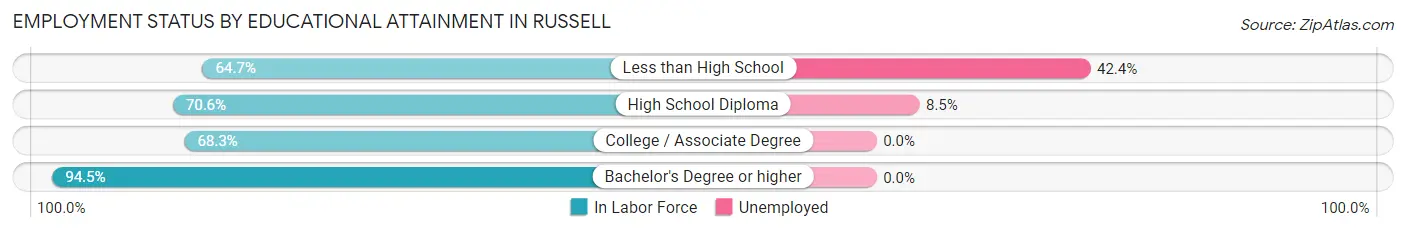
| Educational Attainment | In Labor Force | Unemployed |
| Less than High School | 33 (64.7%) | 22 (42.4%) |
| High School Diploma | 496 (70.6%) | 60 (8.5%) |
| College / Associate Degree | 606 (68.3%) | 0 (0.0%) |
| Bachelor's Degree or higher | 414 (94.5%) | 0 (0.0%) |
| Total | 1,549 (74.5%) | 75 (3.6%) |
Employment Occupations by Sex in Russell
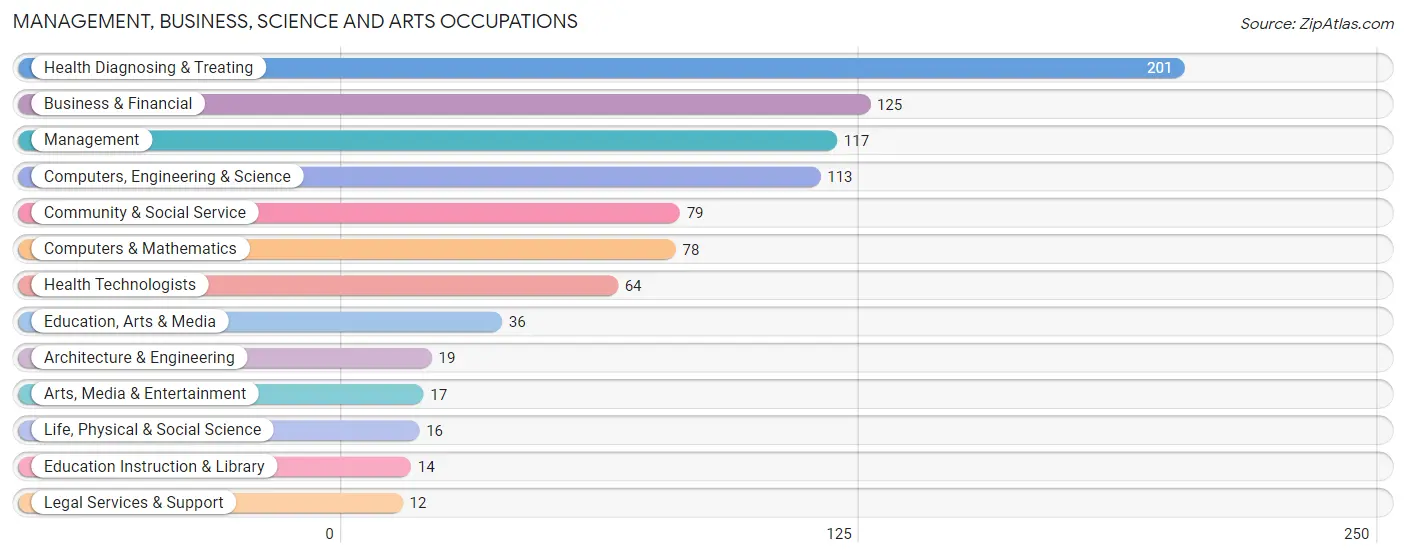
Management, Business, Science and Arts Occupations
The most common Management, Business, Science and Arts occupations in Russell are Health Diagnosing & Treating (201 | 10.1%), Business & Financial (125 | 6.3%), Management (117 | 5.9%), Computers, Engineering & Science (113 | 5.7%), and Community & Social Service (79 | 4.0%).
Management, Business, Science and Arts Occupations by Sex
Within the Management, Business, Science and Arts occupations in Russell, the most male-oriented occupations are Management (100.0%), Architecture & Engineering (100.0%), and Life, Physical & Social Science (100.0%), while the most female-oriented occupations are Health Diagnosing & Treating (93.0%), Business & Financial (83.2%), and Health Technologists (78.1%).
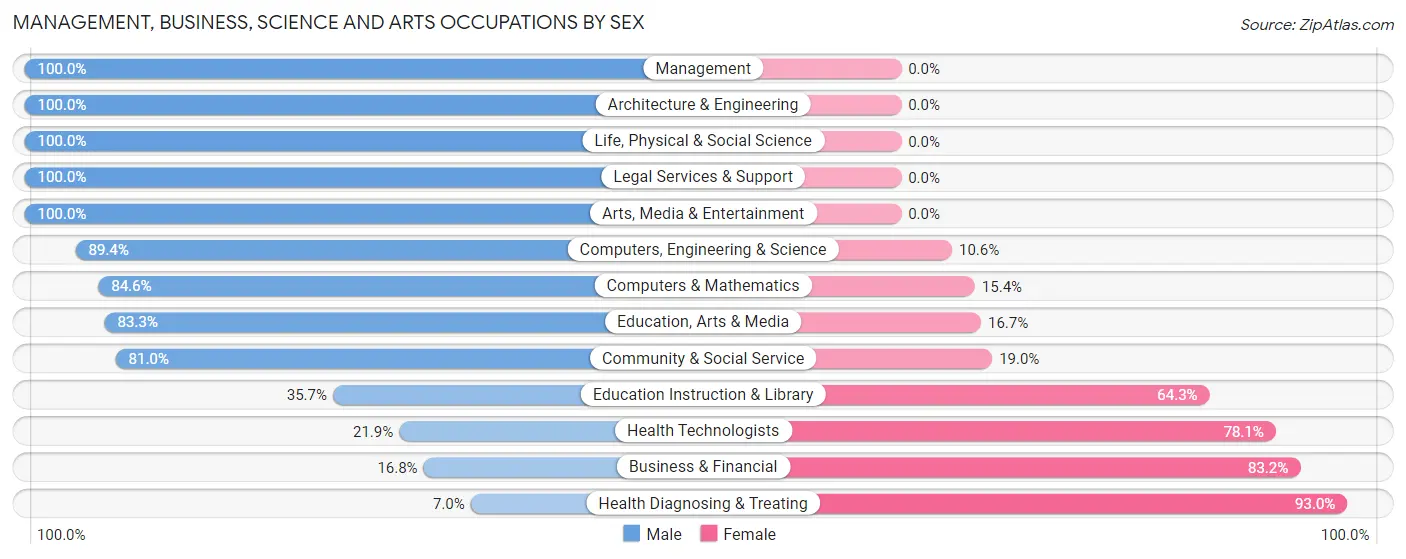
| Occupation | Male | Female |
| Management | 117 (100.0%) | 0 (0.0%) |
| Business & Financial | 21 (16.8%) | 104 (83.2%) |
| Computers, Engineering & Science | 101 (89.4%) | 12 (10.6%) |
| Computers & Mathematics | 66 (84.6%) | 12 (15.4%) |
| Architecture & Engineering | 19 (100.0%) | 0 (0.0%) |
| Life, Physical & Social Science | 16 (100.0%) | 0 (0.0%) |
| Community & Social Service | 64 (81.0%) | 15 (19.0%) |
| Education, Arts & Media | 30 (83.3%) | 6 (16.7%) |
| Legal Services & Support | 12 (100.0%) | 0 (0.0%) |
| Education Instruction & Library | 5 (35.7%) | 9 (64.3%) |
| Arts, Media & Entertainment | 17 (100.0%) | 0 (0.0%) |
| Health Diagnosing & Treating | 14 (7.0%) | 187 (93.0%) |
| Health Technologists | 14 (21.9%) | 50 (78.1%) |
| Total (Category) | 317 (49.9%) | 318 (50.1%) |
| Total (Overall) | 1,038 (52.0%) | 959 (48.0%) |
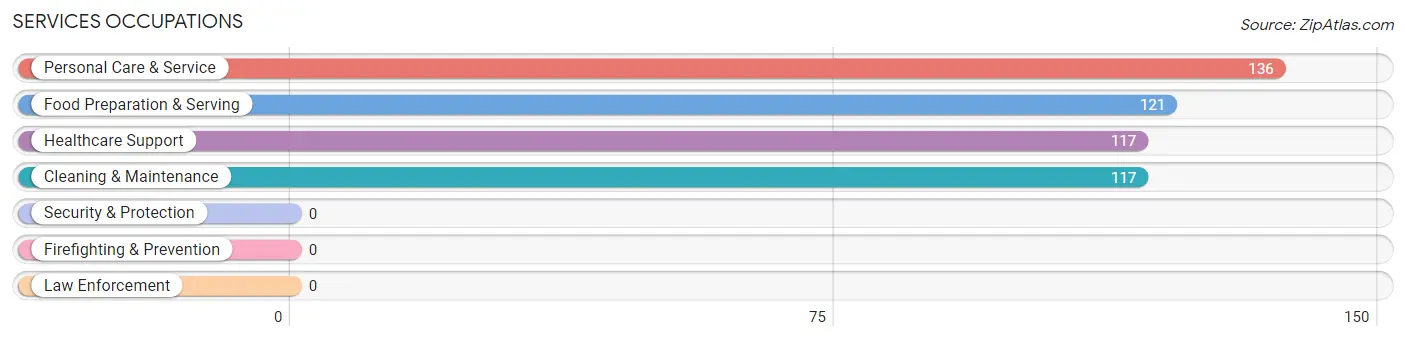
Services Occupations
The most common Services occupations in Russell are Personal Care & Service (136 | 6.8%), Food Preparation & Serving (121 | 6.1%), Healthcare Support (117 | 5.9%), and Cleaning & Maintenance (117 | 5.9%).
Services Occupations by Sex
Within the Services occupations in Russell, the most male-oriented occupations are Cleaning & Maintenance (100.0%), and Food Preparation & Serving (37.2%), while the most female-oriented occupations are Healthcare Support (100.0%), Personal Care & Service (100.0%), and Food Preparation & Serving (62.8%).
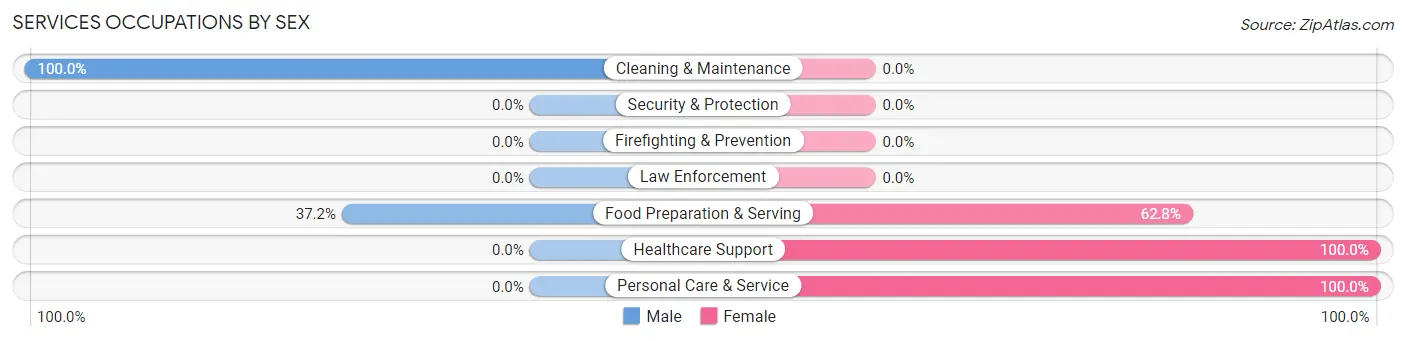
| Occupation | Male | Female |
| Healthcare Support | 0 (0.0%) | 117 (100.0%) |
| Security & Protection | 0 (0.0%) | 0 (0.0%) |
| Firefighting & Prevention | 0 (0.0%) | 0 (0.0%) |
| Law Enforcement | 0 (0.0%) | 0 (0.0%) |
| Food Preparation & Serving | 45 (37.2%) | 76 (62.8%) |
| Cleaning & Maintenance | 117 (100.0%) | 0 (0.0%) |
| Personal Care & Service | 0 (0.0%) | 136 (100.0%) |
| Total (Category) | 162 (33.0%) | 329 (67.0%) |
| Total (Overall) | 1,038 (52.0%) | 959 (48.0%) |
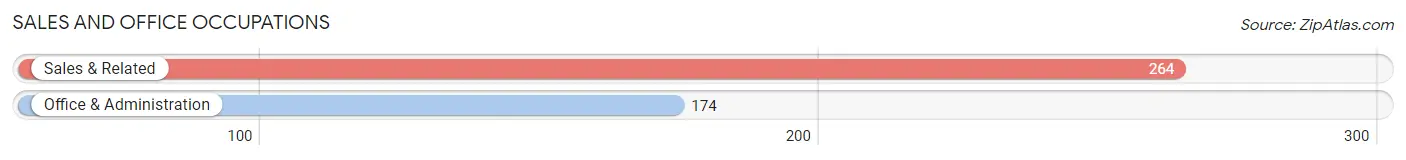
Sales and Office Occupations
The most common Sales and Office occupations in Russell are Sales & Related (264 | 13.2%), and Office & Administration (174 | 8.7%).
Sales and Office Occupations by Sex
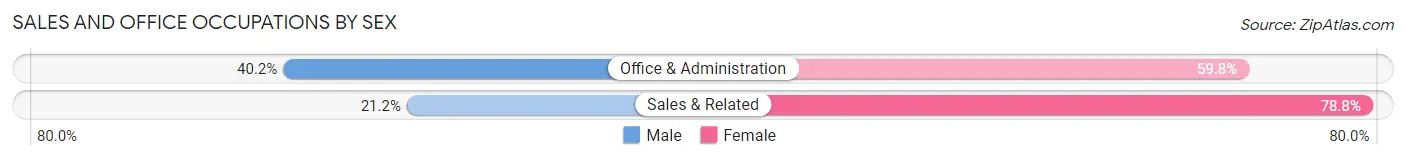
| Occupation | Male | Female |
| Sales & Related | 56 (21.2%) | 208 (78.8%) |
| Office & Administration | 70 (40.2%) | 104 (59.8%) |
| Total (Category) | 126 (28.8%) | 312 (71.2%) |
| Total (Overall) | 1,038 (52.0%) | 959 (48.0%) |
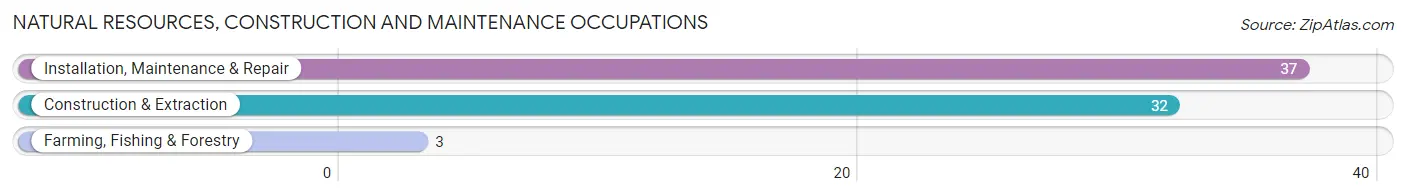
Natural Resources, Construction and Maintenance Occupations
The most common Natural Resources, Construction and Maintenance occupations in Russell are Installation, Maintenance & Repair (37 | 1.8%), Construction & Extraction (32 | 1.6%), and Farming, Fishing & Forestry (3 | 0.2%).
Natural Resources, Construction and Maintenance Occupations by Sex
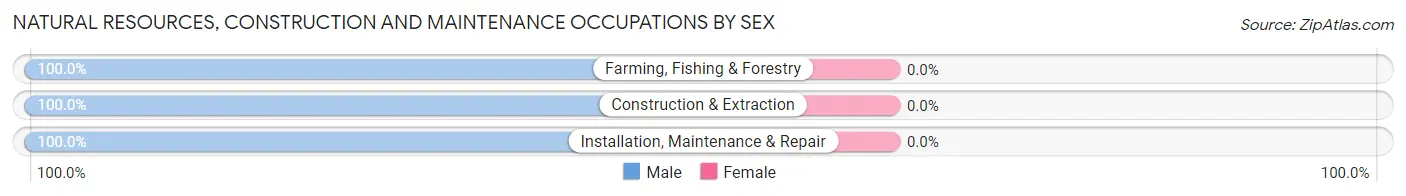
| Occupation | Male | Female |
| Farming, Fishing & Forestry | 3 (100.0%) | 0 (0.0%) |
| Construction & Extraction | 32 (100.0%) | 0 (0.0%) |
| Installation, Maintenance & Repair | 37 (100.0%) | 0 (0.0%) |
| Total (Category) | 72 (100.0%) | 0 (0.0%) |
| Total (Overall) | 1,038 (52.0%) | 959 (48.0%) |
Production, Transportation and Moving Occupations
The most common Production, Transportation and Moving occupations in Russell are Production (210 | 10.5%), Transportation (102 | 5.1%), and Material Moving (49 | 2.5%).
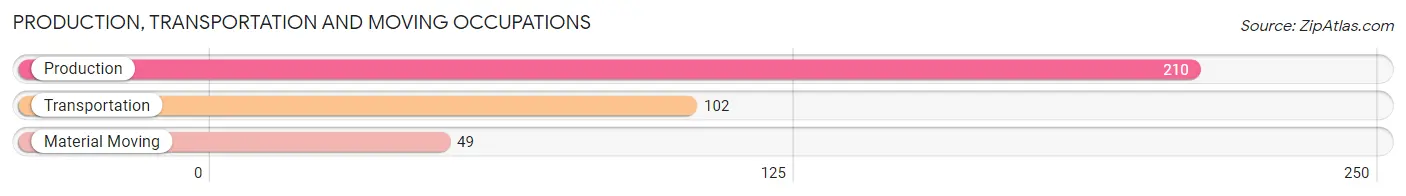
Production, Transportation and Moving Occupations by Sex
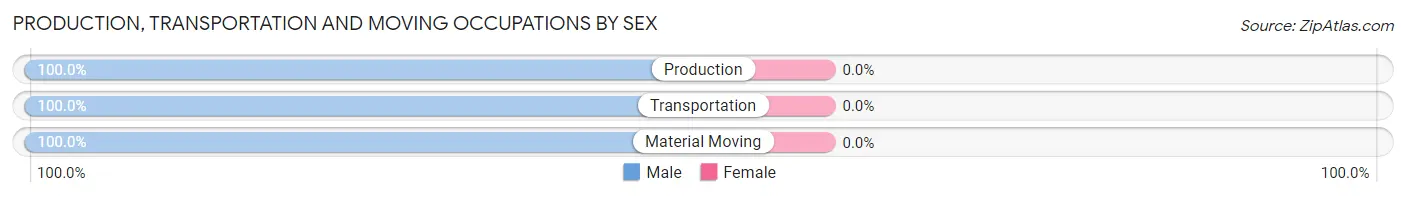
| Occupation | Male | Female |
| Production | 210 (100.0%) | 0 (0.0%) |
| Transportation | 102 (100.0%) | 0 (0.0%) |
| Material Moving | 49 (100.0%) | 0 (0.0%) |
| Total (Category) | 361 (100.0%) | 0 (0.0%) |
| Total (Overall) | 1,038 (52.0%) | 959 (48.0%) |
Employment Industries by Sex in Russell
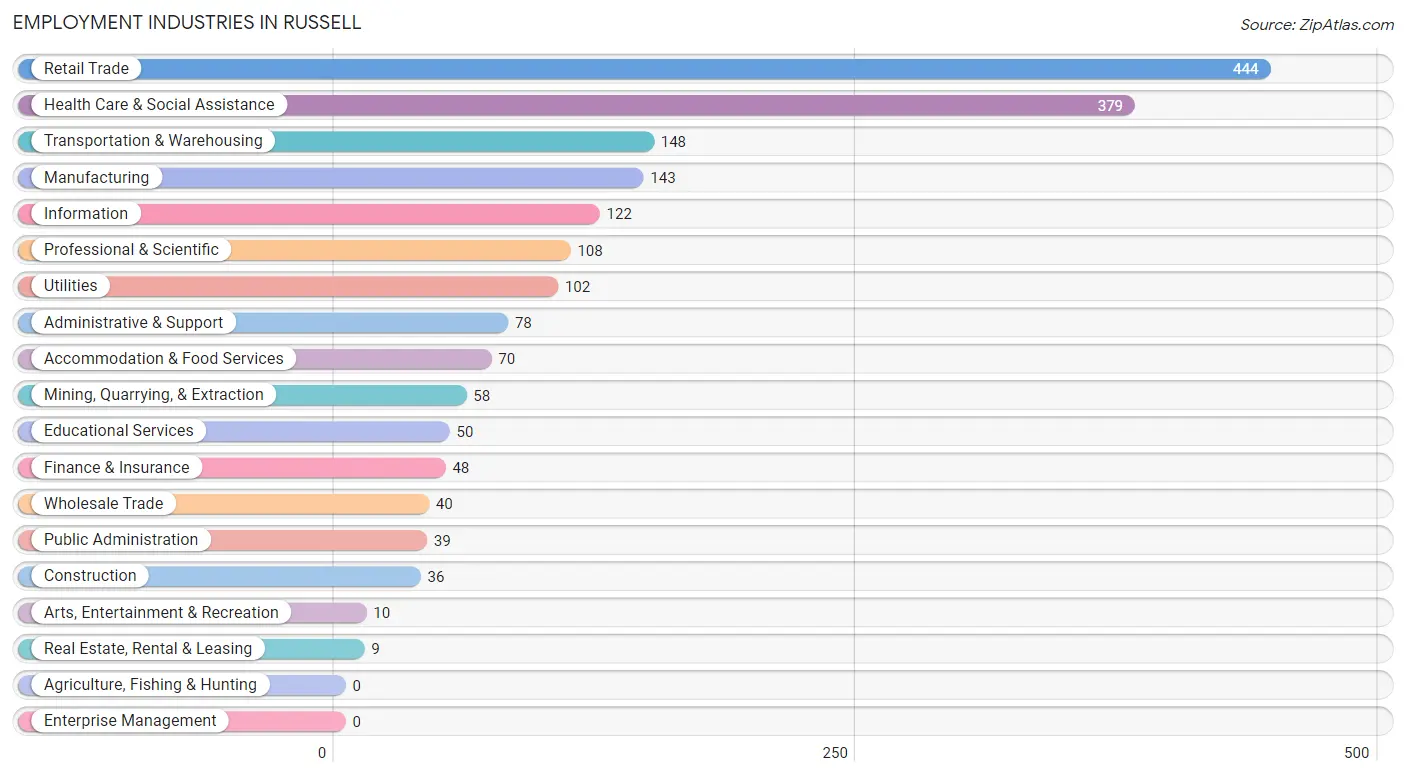
Employment Industries in Russell
The major employment industries in Russell include Retail Trade (444 | 22.2%), Health Care & Social Assistance (379 | 19.0%), Transportation & Warehousing (148 | 7.4%), Manufacturing (143 | 7.2%), and Information (122 | 6.1%).
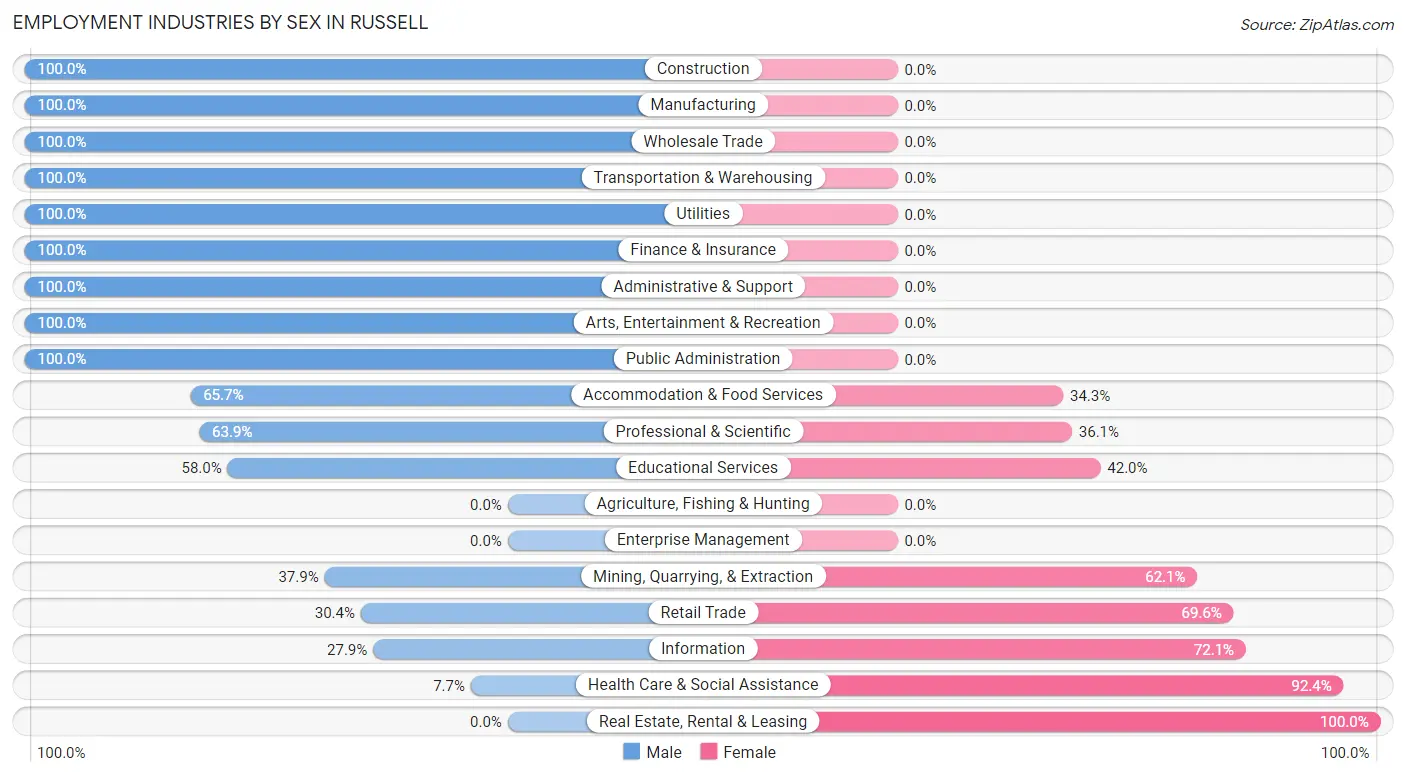
Employment Industries by Sex in Russell
The Russell industries that see more men than women are Construction (100.0%), Manufacturing (100.0%), and Wholesale Trade (100.0%), whereas the industries that tend to have a higher number of women are Real Estate, Rental & Leasing (100.0%), Health Care & Social Assistance (92.3%), and Information (72.1%).
| Industry | Male | Female |
| Agriculture, Fishing & Hunting | 0 (0.0%) | 0 (0.0%) |
| Mining, Quarrying, & Extraction | 22 (37.9%) | 36 (62.1%) |
| Construction | 36 (100.0%) | 0 (0.0%) |
| Manufacturing | 143 (100.0%) | 0 (0.0%) |
| Wholesale Trade | 40 (100.0%) | 0 (0.0%) |
| Retail Trade | 135 (30.4%) | 309 (69.6%) |
| Transportation & Warehousing | 148 (100.0%) | 0 (0.0%) |
| Utilities | 102 (100.0%) | 0 (0.0%) |
| Information | 34 (27.9%) | 88 (72.1%) |
| Finance & Insurance | 48 (100.0%) | 0 (0.0%) |
| Real Estate, Rental & Leasing | 0 (0.0%) | 9 (100.0%) |
| Professional & Scientific | 69 (63.9%) | 39 (36.1%) |
| Enterprise Management | 0 (0.0%) | 0 (0.0%) |
| Administrative & Support | 78 (100.0%) | 0 (0.0%) |
| Educational Services | 29 (58.0%) | 21 (42.0%) |
| Health Care & Social Assistance | 29 (7.6%) | 350 (92.3%) |
| Arts, Entertainment & Recreation | 10 (100.0%) | 0 (0.0%) |
| Accommodation & Food Services | 46 (65.7%) | 24 (34.3%) |
| Public Administration | 39 (100.0%) | 0 (0.0%) |
| Total | 1,038 (52.0%) | 959 (48.0%) |
Education in Russell
School Enrollment in Russell
The most common levels of schooling among the 870 students in Russell are middle school (249 | 28.6%), high school (203 | 23.3%), and elementary school (183 | 21.0%).

| School Level | # Students | % Students |
| Nursery / Preschool | 123 | 14.1% |
| Kindergarten | 71 | 8.2% |
| Elementary School | 183 | 21.0% |
| Middle School | 249 | 28.6% |
| High School | 203 | 23.3% |
| College / Undergraduate | 26 | 3.0% |
| Graduate / Professional | 15 | 1.7% |
| Total | 870 | 100.0% |
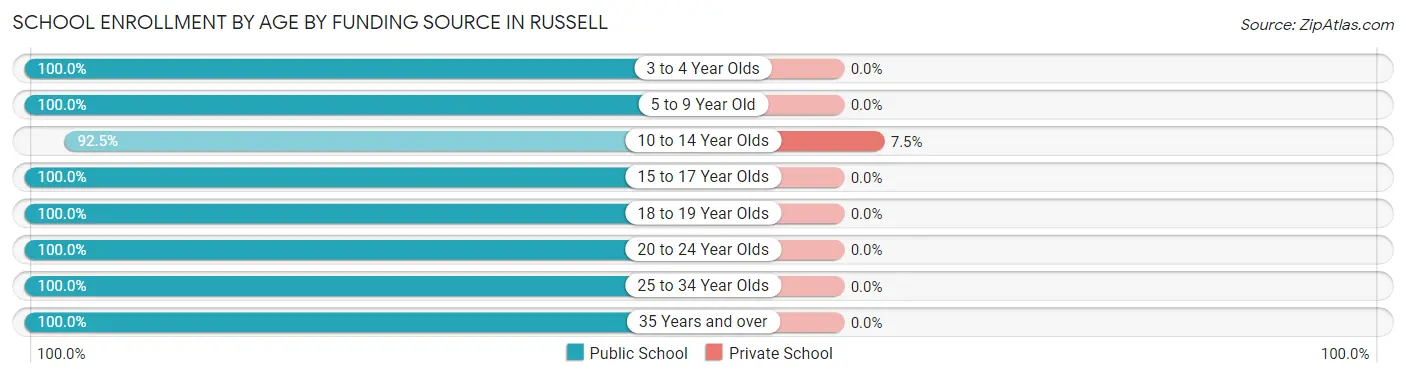
School Enrollment by Age by Funding Source in Russell
Out of a total of 870 students who are enrolled in schools in Russell, 18 (2.1%) attend a private institution, while the remaining 852 (97.9%) are enrolled in public schools. The age group of 10 to 14 year olds has the highest likelihood of being enrolled in private schools, with 18 (7.5% in the age bracket) enrolled. Conversely, the age group of 3 to 4 year olds has the lowest likelihood of being enrolled in a private school, with 92 (100.0% in the age bracket) attending a public institution.
| Age Bracket | Public School | Private School |
| 3 to 4 Year Olds | 92 (100.0%) | 0 (0.0%) |
| 5 to 9 Year Old | 283 (100.0%) | 0 (0.0%) |
| 10 to 14 Year Olds | 223 (92.5%) | 18 (7.5%) |
| 15 to 17 Year Olds | 182 (100.0%) | 0 (0.0%) |
| 18 to 19 Year Olds | 46 (100.0%) | 0 (0.0%) |
| 20 to 24 Year Olds | 11 (100.0%) | 0 (0.0%) |
| 25 to 34 Year Olds | 11 (100.0%) | 0 (0.0%) |
| 35 Years and over | 4 (100.0%) | 0 (0.0%) |
| Total | 852 (97.9%) | 18 (2.1%) |
Educational Attainment by Field of Study in Russell
Business (232 | 30.9%), education (149 | 19.8%), science & technology (69 | 9.2%), bio, nature & agricultural (50 | 6.7%), and social sciences (39 | 5.2%) are the most common fields of study among 751 individuals in Russell who have obtained a bachelor's degree or higher.
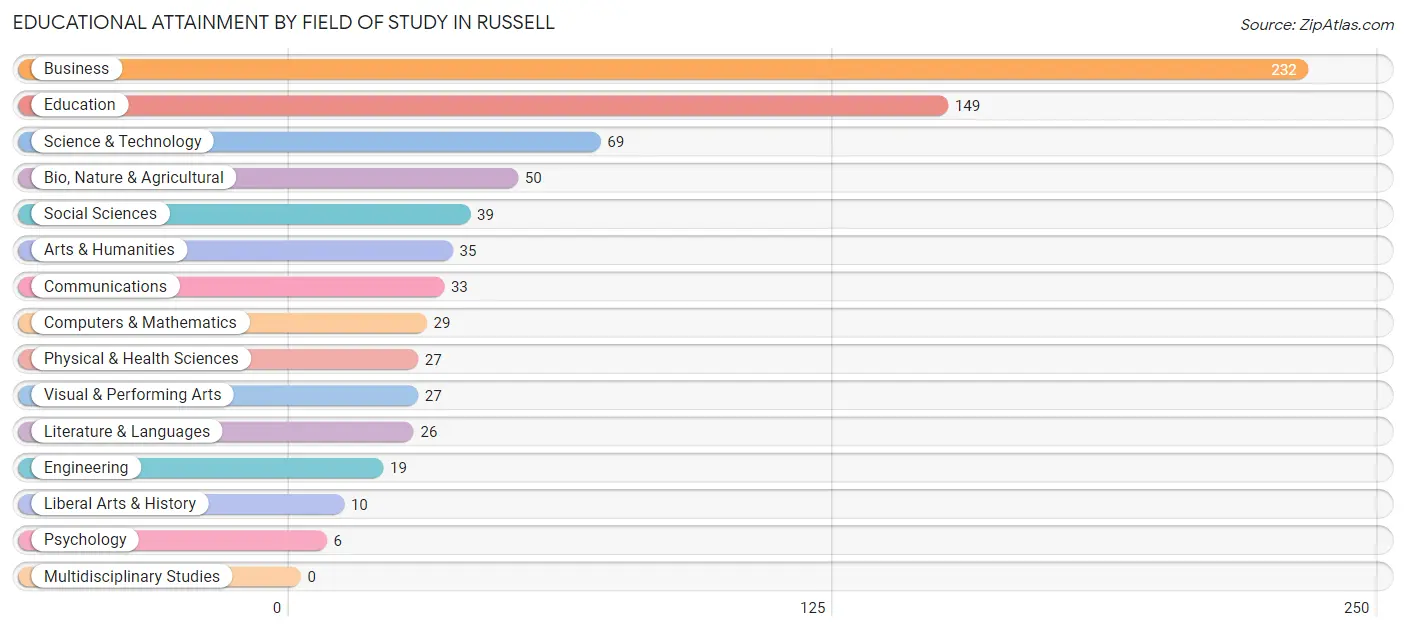
| Field of Study | # Graduates | % Graduates |
| Computers & Mathematics | 29 | 3.9% |
| Bio, Nature & Agricultural | 50 | 6.7% |
| Physical & Health Sciences | 27 | 3.6% |
| Psychology | 6 | 0.8% |
| Social Sciences | 39 | 5.2% |
| Engineering | 19 | 2.5% |
| Multidisciplinary Studies | 0 | 0.0% |
| Science & Technology | 69 | 9.2% |
| Business | 232 | 30.9% |
| Education | 149 | 19.8% |
| Literature & Languages | 26 | 3.5% |
| Liberal Arts & History | 10 | 1.3% |
| Visual & Performing Arts | 27 | 3.6% |
| Communications | 33 | 4.4% |
| Arts & Humanities | 35 | 4.7% |
| Total | 751 | 100.0% |
Transportation & Commute in Russell
Vehicle Availability by Sex in Russell
The most prevalent vehicle ownership categories in Russell are males with 2 vehicles (517, accounting for 53.4%) and females with 2 vehicles (271, making up 53.9%).
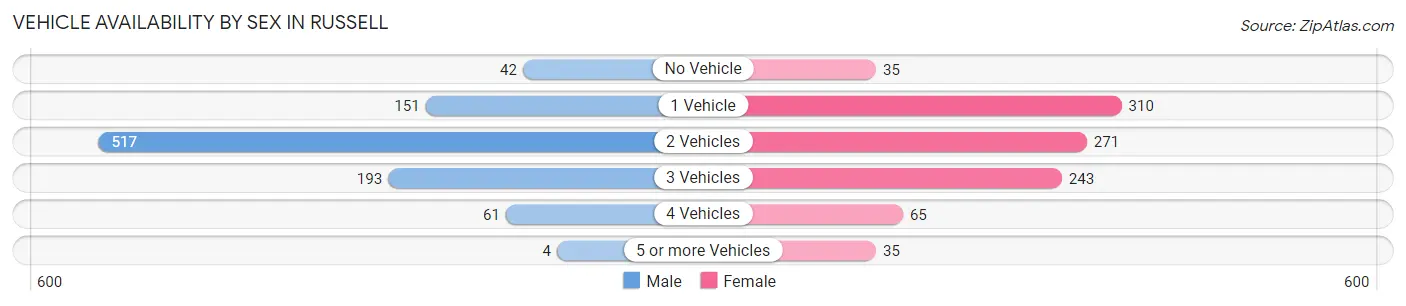
| Vehicles Available | Male | Female |
| No Vehicle | 42 (4.3%) | 35 (3.6%) |
| 1 Vehicle | 151 (15.6%) | 310 (32.3%) |
| 2 Vehicles | 517 (53.4%) | 271 (28.3%) |
| 3 Vehicles | 193 (19.9%) | 243 (25.3%) |
| 4 Vehicles | 61 (6.3%) | 65 (6.8%) |
| 5 or more Vehicles | 4 (0.4%) | 35 (3.6%) |
| Total | 968 (100.0%) | 959 (100.0%) |
Commute Time in Russell
The most frequently occuring commute durations in Russell are 5 to 9 minutes (739 commuters, 41.7%), 10 to 14 minutes (378 commuters, 21.3%), and 30 to 34 minutes (224 commuters, 12.6%).
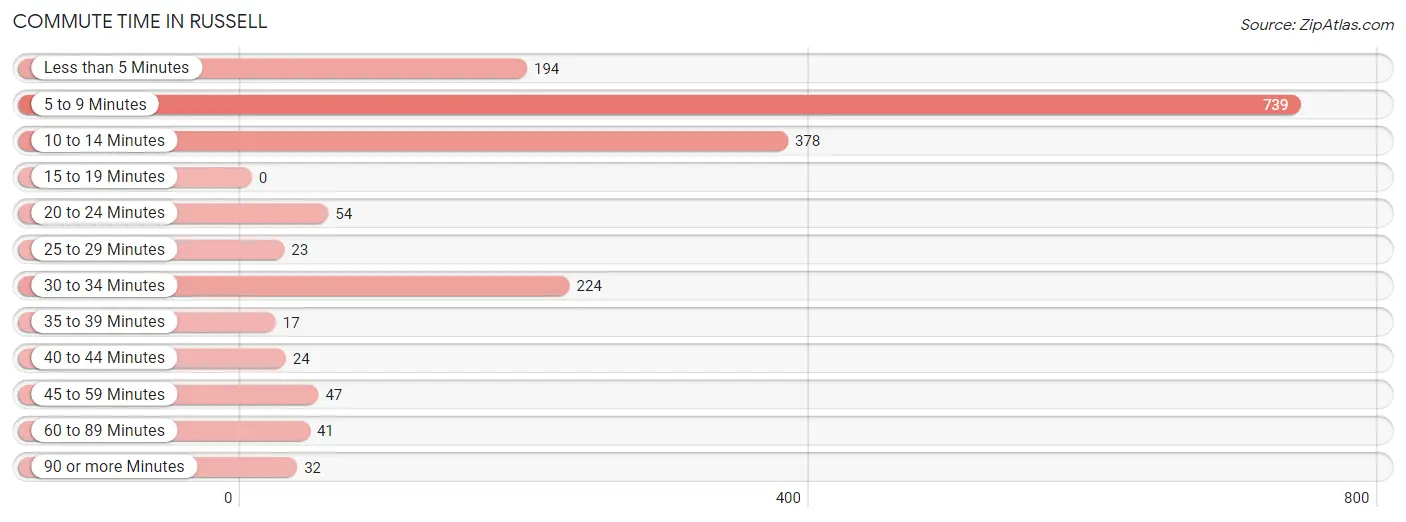
| Commute Time | # Commuters | % Commuters |
| Less than 5 Minutes | 194 | 10.9% |
| 5 to 9 Minutes | 739 | 41.7% |
| 10 to 14 Minutes | 378 | 21.3% |
| 15 to 19 Minutes | 0 | 0.0% |
| 20 to 24 Minutes | 54 | 3.0% |
| 25 to 29 Minutes | 23 | 1.3% |
| 30 to 34 Minutes | 224 | 12.6% |
| 35 to 39 Minutes | 17 | 1.0% |
| 40 to 44 Minutes | 24 | 1.3% |
| 45 to 59 Minutes | 47 | 2.6% |
| 60 to 89 Minutes | 41 | 2.3% |
| 90 or more Minutes | 32 | 1.8% |
Commute Time by Sex in Russell
The most common commute times in Russell are 10 to 14 minutes (260 commuters, 27.1%) for males and 5 to 9 minutes (544 commuters, 66.9%) for females.
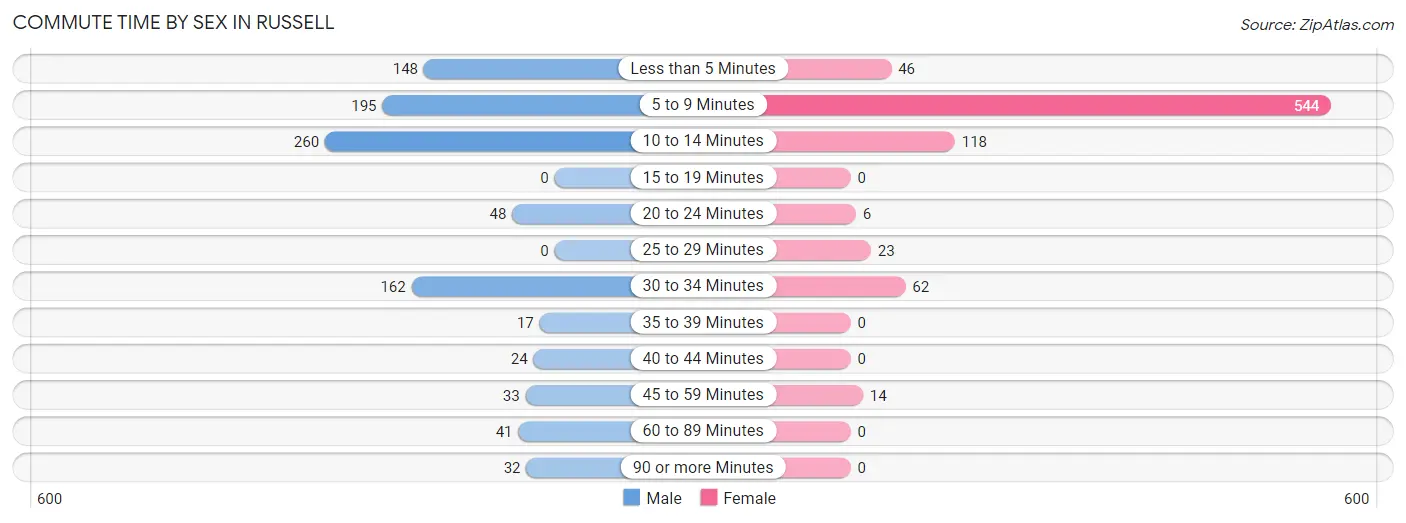
| Commute Time | Male | Female |
| Less than 5 Minutes | 148 (15.4%) | 46 (5.7%) |
| 5 to 9 Minutes | 195 (20.3%) | 544 (66.9%) |
| 10 to 14 Minutes | 260 (27.1%) | 118 (14.5%) |
| 15 to 19 Minutes | 0 (0.0%) | 0 (0.0%) |
| 20 to 24 Minutes | 48 (5.0%) | 6 (0.7%) |
| 25 to 29 Minutes | 0 (0.0%) | 23 (2.8%) |
| 30 to 34 Minutes | 162 (16.9%) | 62 (7.6%) |
| 35 to 39 Minutes | 17 (1.8%) | 0 (0.0%) |
| 40 to 44 Minutes | 24 (2.5%) | 0 (0.0%) |
| 45 to 59 Minutes | 33 (3.4%) | 14 (1.7%) |
| 60 to 89 Minutes | 41 (4.3%) | 0 (0.0%) |
| 90 or more Minutes | 32 (3.3%) | 0 (0.0%) |
Time of Departure to Work by Sex in Russell
The most frequent times of departure to work in Russell are 7:30 AM to 7:59 AM (308, 32.1%) for males and 12:00 PM to 3:59 PM (150, 18.4%) for females.
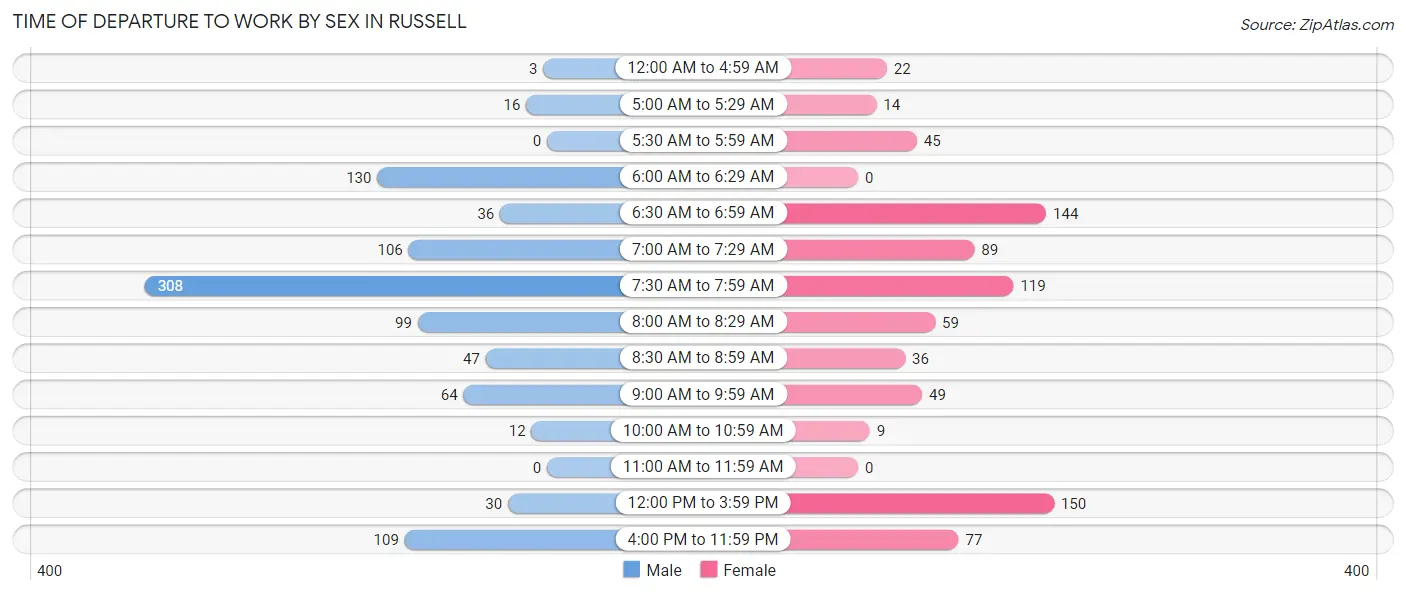
| Time of Departure | Male | Female |
| 12:00 AM to 4:59 AM | 3 (0.3%) | 22 (2.7%) |
| 5:00 AM to 5:29 AM | 16 (1.7%) | 14 (1.7%) |
| 5:30 AM to 5:59 AM | 0 (0.0%) | 45 (5.5%) |
| 6:00 AM to 6:29 AM | 130 (13.5%) | 0 (0.0%) |
| 6:30 AM to 6:59 AM | 36 (3.7%) | 144 (17.7%) |
| 7:00 AM to 7:29 AM | 106 (11.0%) | 89 (11.0%) |
| 7:30 AM to 7:59 AM | 308 (32.1%) | 119 (14.6%) |
| 8:00 AM to 8:29 AM | 99 (10.3%) | 59 (7.3%) |
| 8:30 AM to 8:59 AM | 47 (4.9%) | 36 (4.4%) |
| 9:00 AM to 9:59 AM | 64 (6.7%) | 49 (6.0%) |
| 10:00 AM to 10:59 AM | 12 (1.3%) | 9 (1.1%) |
| 11:00 AM to 11:59 AM | 0 (0.0%) | 0 (0.0%) |
| 12:00 PM to 3:59 PM | 30 (3.1%) | 150 (18.4%) |
| 4:00 PM to 11:59 PM | 109 (11.4%) | 77 (9.5%) |
| Total | 960 (100.0%) | 813 (100.0%) |
Housing Occupancy in Russell
Occupancy by Ownership in Russell
Of the total 1,886 dwellings in Russell, owner-occupied units account for 1,341 (71.1%), while renter-occupied units make up 545 (28.9%).
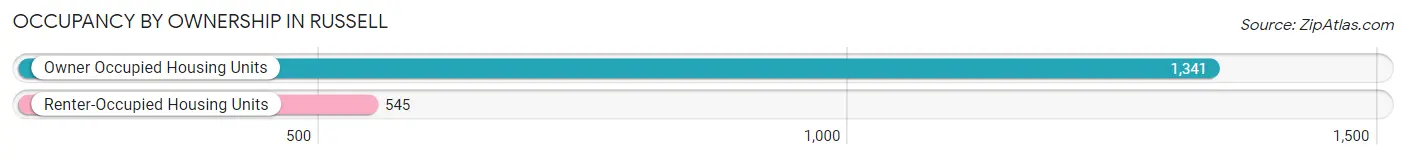
| Occupancy | # Housing Units | % Housing Units |
| Owner Occupied Housing Units | 1,341 | 71.1% |
| Renter-Occupied Housing Units | 545 | 28.9% |
| Total Occupied Housing Units | 1,886 | 100.0% |
Occupancy by Household Size in Russell
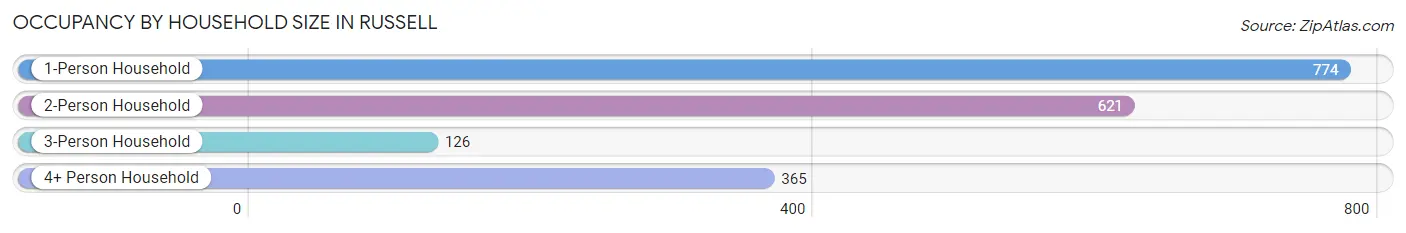
| Household Size | # Housing Units | % Housing Units |
| 1-Person Household | 774 | 41.0% |
| 2-Person Household | 621 | 32.9% |
| 3-Person Household | 126 | 6.7% |
| 4+ Person Household | 365 | 19.4% |
| Total Housing Units | 1,886 | 100.0% |
Occupancy by Ownership by Household Size in Russell
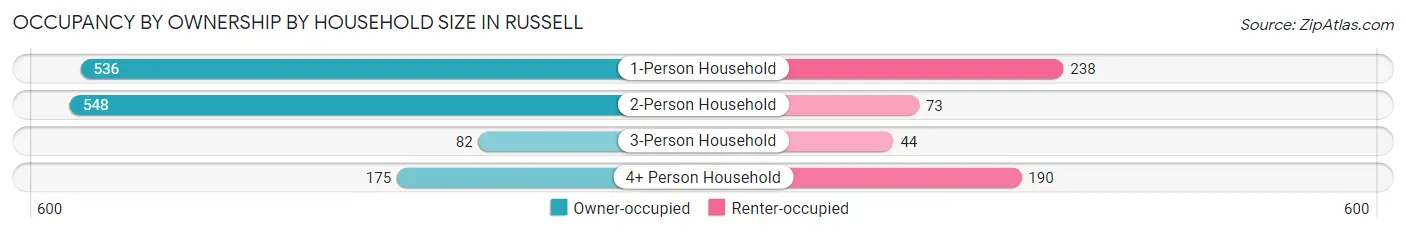
| Household Size | Owner-occupied | Renter-occupied |
| 1-Person Household | 536 (69.3%) | 238 (30.7%) |
| 2-Person Household | 548 (88.2%) | 73 (11.8%) |
| 3-Person Household | 82 (65.1%) | 44 (34.9%) |
| 4+ Person Household | 175 (47.9%) | 190 (52.0%) |
| Total Housing Units | 1,341 (71.1%) | 545 (28.9%) |
Occupancy by Educational Attainment in Russell
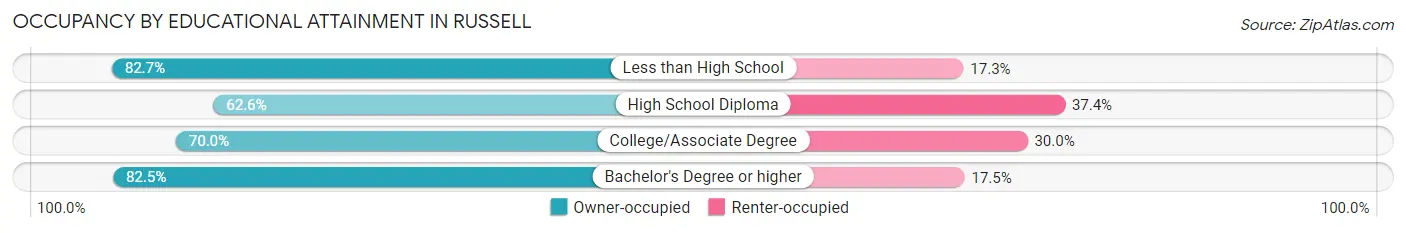
| Household Size | Owner-occupied | Renter-occupied |
| Less than High School | 153 (82.7%) | 32 (17.3%) |
| High School Diploma | 448 (62.6%) | 268 (37.4%) |
| College/Associate Degree | 406 (70.0%) | 174 (30.0%) |
| Bachelor's Degree or higher | 334 (82.5%) | 71 (17.5%) |
Occupancy by Age of Householder in Russell
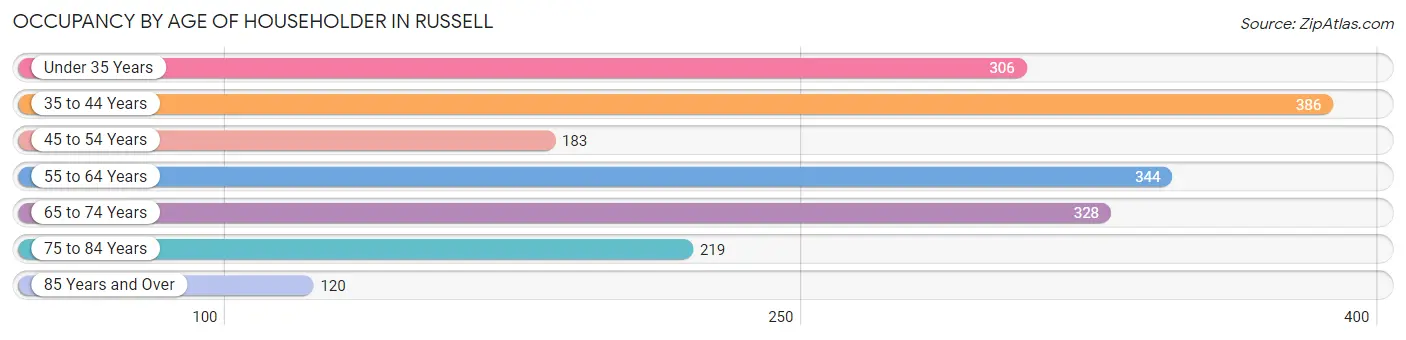
| Age Bracket | # Households | % Households |
| Under 35 Years | 306 | 16.2% |
| 35 to 44 Years | 386 | 20.5% |
| 45 to 54 Years | 183 | 9.7% |
| 55 to 64 Years | 344 | 18.2% |
| 65 to 74 Years | 328 | 17.4% |
| 75 to 84 Years | 219 | 11.6% |
| 85 Years and Over | 120 | 6.4% |
| Total | 1,886 | 100.0% |
Housing Finances in Russell
Median Income by Occupancy in Russell
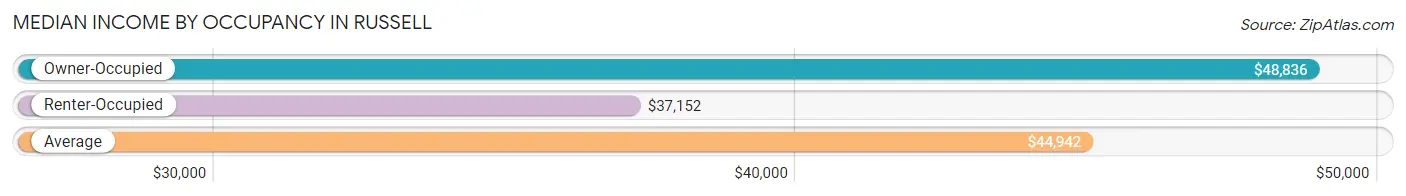
| Occupancy Type | # Households | Median Income |
| Owner-Occupied | 1,341 (71.1%) | $48,836 |
| Renter-Occupied | 545 (28.9%) | $37,152 |
| Average | 1,886 (100.0%) | $44,942 |
Occupancy by Householder Income Bracket in Russell
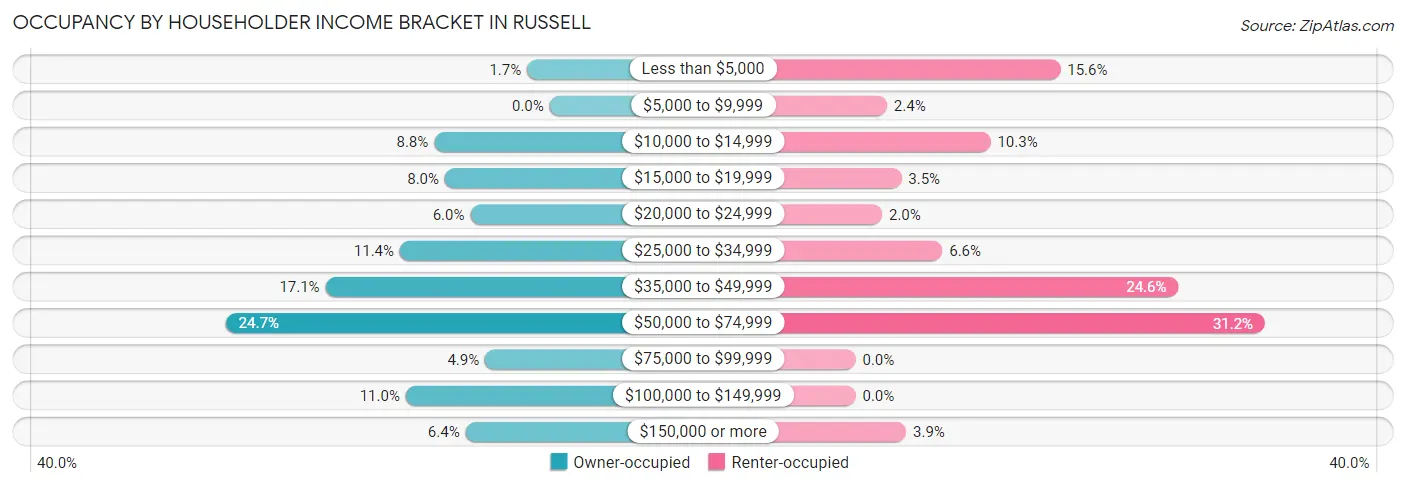
| Income Bracket | Owner-occupied | Renter-occupied |
| Less than $5,000 | 23 (1.7%) | 85 (15.6%) |
| $5,000 to $9,999 | 0 (0.0%) | 13 (2.4%) |
| $10,000 to $14,999 | 118 (8.8%) | 56 (10.3%) |
| $15,000 to $19,999 | 107 (8.0%) | 19 (3.5%) |
| $20,000 to $24,999 | 81 (6.0%) | 11 (2.0%) |
| $25,000 to $34,999 | 153 (11.4%) | 36 (6.6%) |
| $35,000 to $49,999 | 229 (17.1%) | 134 (24.6%) |
| $50,000 to $74,999 | 331 (24.7%) | 170 (31.2%) |
| $75,000 to $99,999 | 66 (4.9%) | 0 (0.0%) |
| $100,000 to $149,999 | 147 (11.0%) | 0 (0.0%) |
| $150,000 or more | 86 (6.4%) | 21 (3.8%) |
| Total | 1,341 (100.0%) | 545 (100.0%) |
Monthly Housing Cost Tiers in Russell
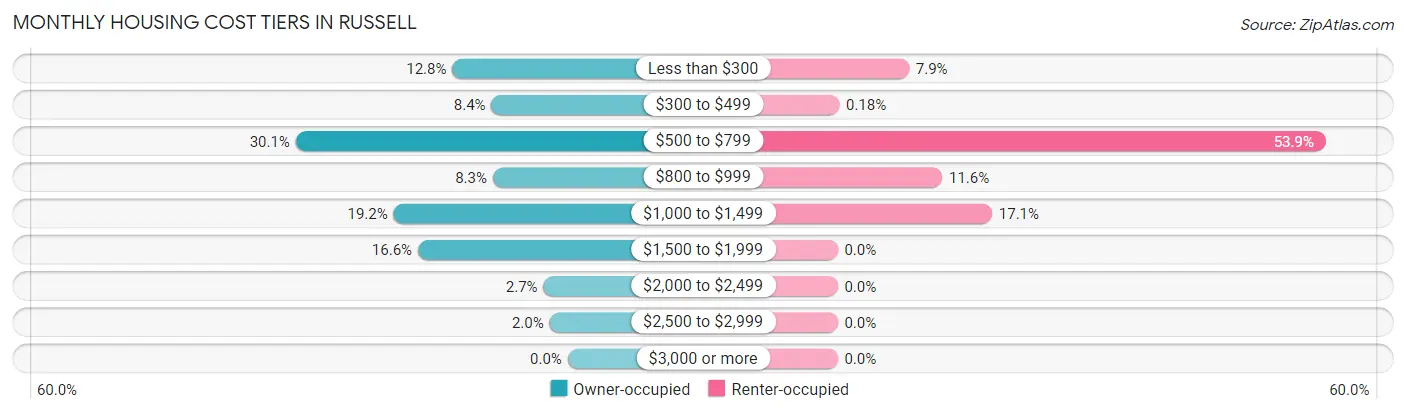
| Monthly Cost | Owner-occupied | Renter-occupied |
| Less than $300 | 171 (12.8%) | 43 (7.9%) |
| $300 to $499 | 113 (8.4%) | 1 (0.2%) |
| $500 to $799 | 403 (30.0%) | 294 (53.9%) |
| $800 to $999 | 111 (8.3%) | 63 (11.6%) |
| $1,000 to $1,499 | 258 (19.2%) | 93 (17.1%) |
| $1,500 to $1,999 | 222 (16.6%) | 0 (0.0%) |
| $2,000 to $2,499 | 36 (2.7%) | 0 (0.0%) |
| $2,500 to $2,999 | 27 (2.0%) | 0 (0.0%) |
| $3,000 or more | 0 (0.0%) | 0 (0.0%) |
| Total | 1,341 (100.0%) | 545 (100.0%) |
Physical Housing Characteristics in Russell
Housing Structures in Russell
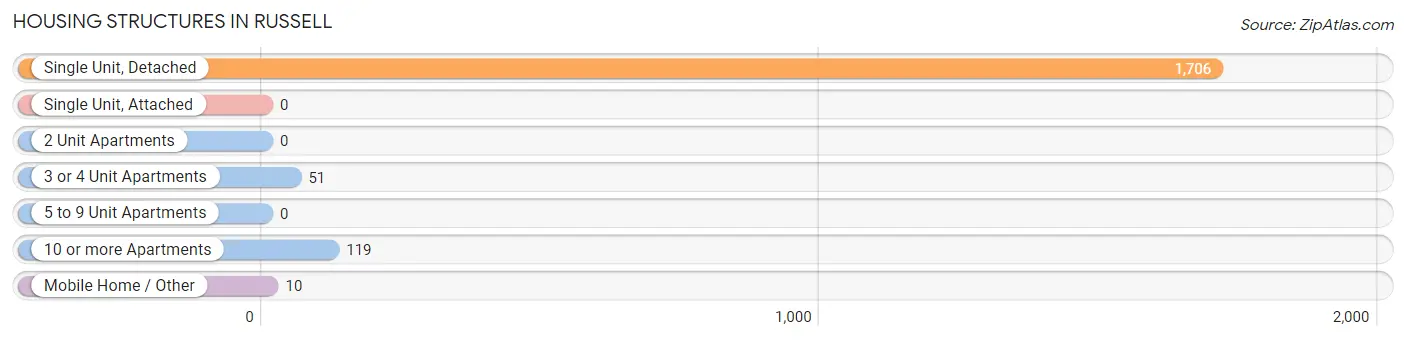
| Structure Type | # Housing Units | % Housing Units |
| Single Unit, Detached | 1,706 | 90.5% |
| Single Unit, Attached | 0 | 0.0% |
| 2 Unit Apartments | 0 | 0.0% |
| 3 or 4 Unit Apartments | 51 | 2.7% |
| 5 to 9 Unit Apartments | 0 | 0.0% |
| 10 or more Apartments | 119 | 6.3% |
| Mobile Home / Other | 10 | 0.5% |
| Total | 1,886 | 100.0% |
Housing Structures by Occupancy in Russell
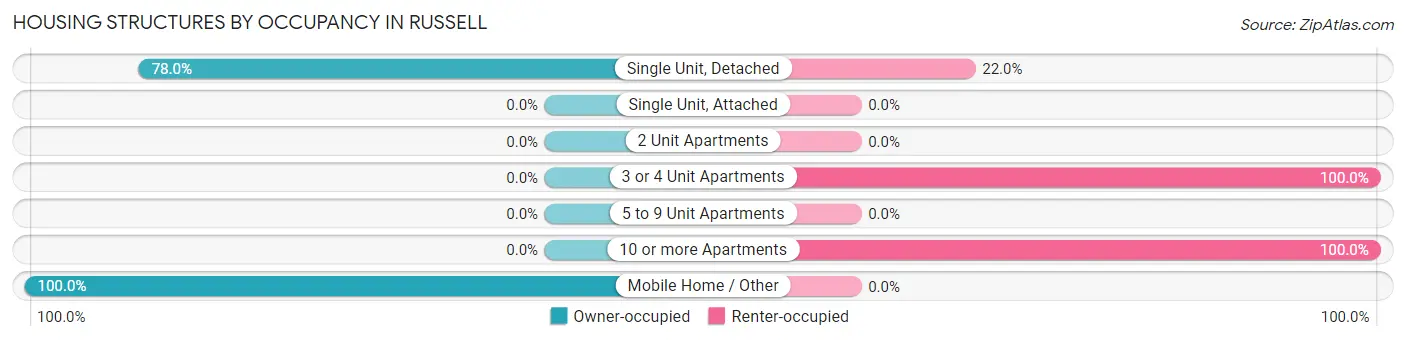
| Structure Type | Owner-occupied | Renter-occupied |
| Single Unit, Detached | 1,331 (78.0%) | 375 (22.0%) |
| Single Unit, Attached | 0 (0.0%) | 0 (0.0%) |
| 2 Unit Apartments | 0 (0.0%) | 0 (0.0%) |
| 3 or 4 Unit Apartments | 0 (0.0%) | 51 (100.0%) |
| 5 to 9 Unit Apartments | 0 (0.0%) | 0 (0.0%) |
| 10 or more Apartments | 0 (0.0%) | 119 (100.0%) |
| Mobile Home / Other | 10 (100.0%) | 0 (0.0%) |
| Total | 1,341 (71.1%) | 545 (28.9%) |
Housing Structures by Number of Rooms in Russell
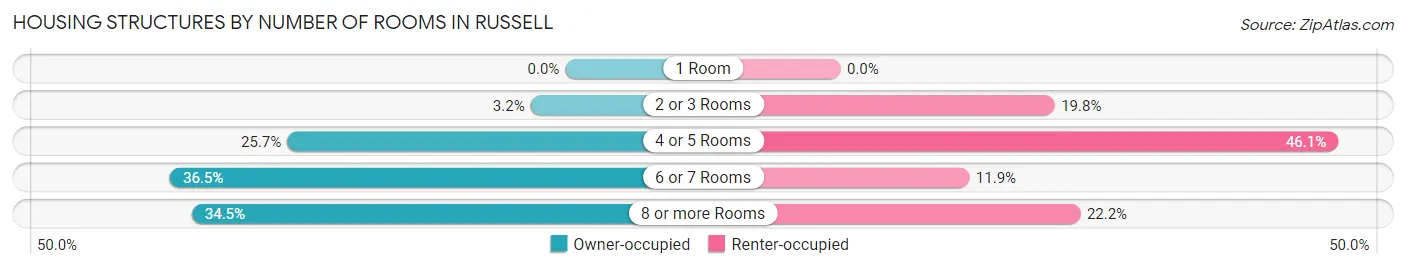
| Number of Rooms | Owner-occupied | Renter-occupied |
| 1 Room | 0 (0.0%) | 0 (0.0%) |
| 2 or 3 Rooms | 43 (3.2%) | 108 (19.8%) |
| 4 or 5 Rooms | 345 (25.7%) | 251 (46.1%) |
| 6 or 7 Rooms | 490 (36.5%) | 65 (11.9%) |
| 8 or more Rooms | 463 (34.5%) | 121 (22.2%) |
| Total | 1,341 (100.0%) | 545 (100.0%) |
Housing Structure by Heating Type in Russell
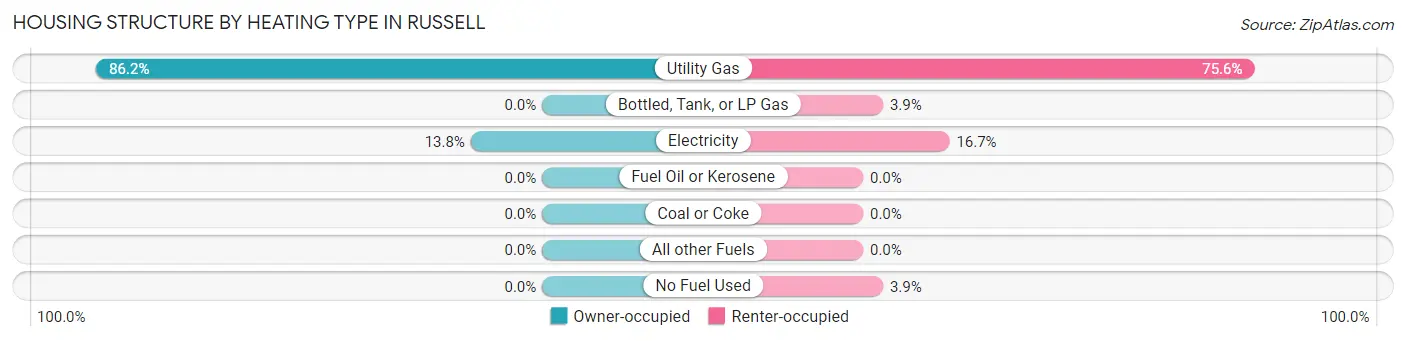
| Heating Type | Owner-occupied | Renter-occupied |
| Utility Gas | 1,156 (86.2%) | 412 (75.6%) |
| Bottled, Tank, or LP Gas | 0 (0.0%) | 21 (3.8%) |
| Electricity | 185 (13.8%) | 91 (16.7%) |
| Fuel Oil or Kerosene | 0 (0.0%) | 0 (0.0%) |
| Coal or Coke | 0 (0.0%) | 0 (0.0%) |
| All other Fuels | 0 (0.0%) | 0 (0.0%) |
| No Fuel Used | 0 (0.0%) | 21 (3.8%) |
| Total | 1,341 (100.0%) | 545 (100.0%) |
Household Vehicle Usage in Russell
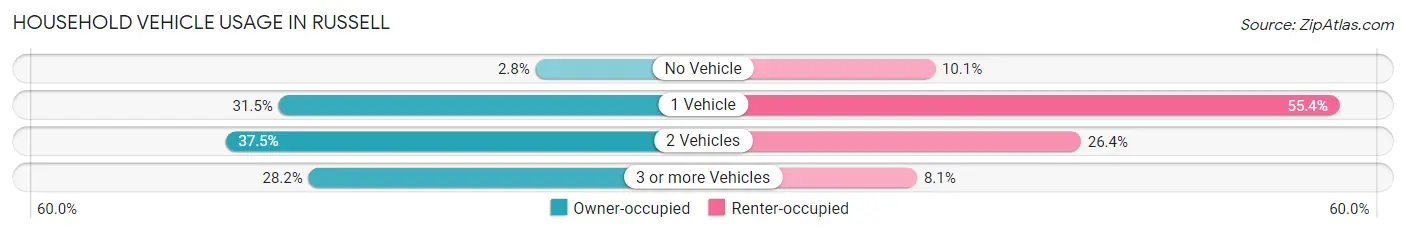
| Vehicles per Household | Owner-occupied | Renter-occupied |
| No Vehicle | 37 (2.8%) | 55 (10.1%) |
| 1 Vehicle | 423 (31.5%) | 302 (55.4%) |
| 2 Vehicles | 503 (37.5%) | 144 (26.4%) |
| 3 or more Vehicles | 378 (28.2%) | 44 (8.1%) |
| Total | 1,341 (100.0%) | 545 (100.0%) |
Real Estate & Mortgages in Russell
Real Estate and Mortgage Overview in Russell
| Characteristic | Without Mortgage | With Mortgage |
| Housing Units | 727 | 614 |
| Median Property Value | $84,000 | $142,100 |
| Median Household Income | $42,309 | $69 |
| Monthly Housing Costs | $546 | $0 |
| Real Estate Taxes | $1,867 | $0 |
Property Value by Mortgage Status in Russell
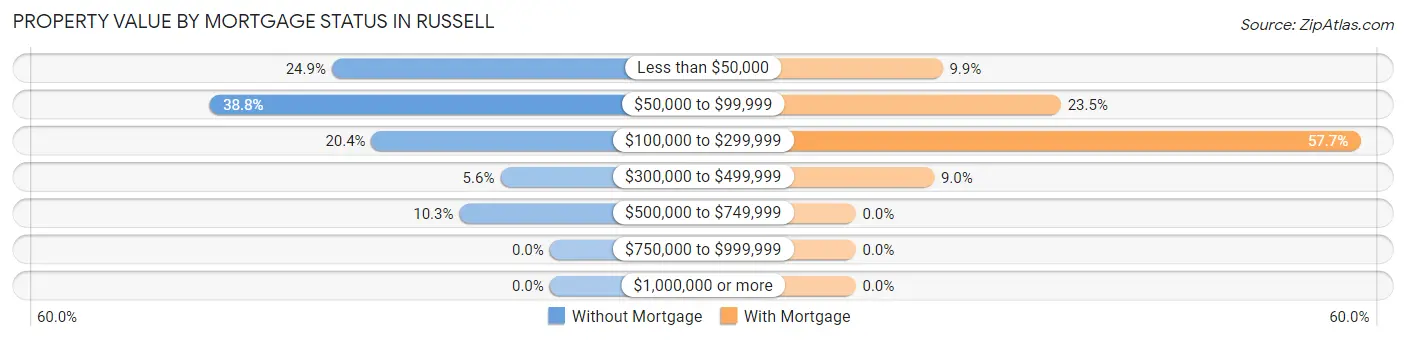
| Property Value | Without Mortgage | With Mortgage |
| Less than $50,000 | 181 (24.9%) | 61 (9.9%) |
| $50,000 to $99,999 | 282 (38.8%) | 144 (23.4%) |
| $100,000 to $299,999 | 148 (20.4%) | 354 (57.7%) |
| $300,000 to $499,999 | 41 (5.6%) | 55 (9.0%) |
| $500,000 to $749,999 | 75 (10.3%) | 0 (0.0%) |
| $750,000 to $999,999 | 0 (0.0%) | 0 (0.0%) |
| $1,000,000 or more | 0 (0.0%) | 0 (0.0%) |
| Total | 727 (100.0%) | 614 (100.0%) |
Household Income by Mortgage Status in Russell
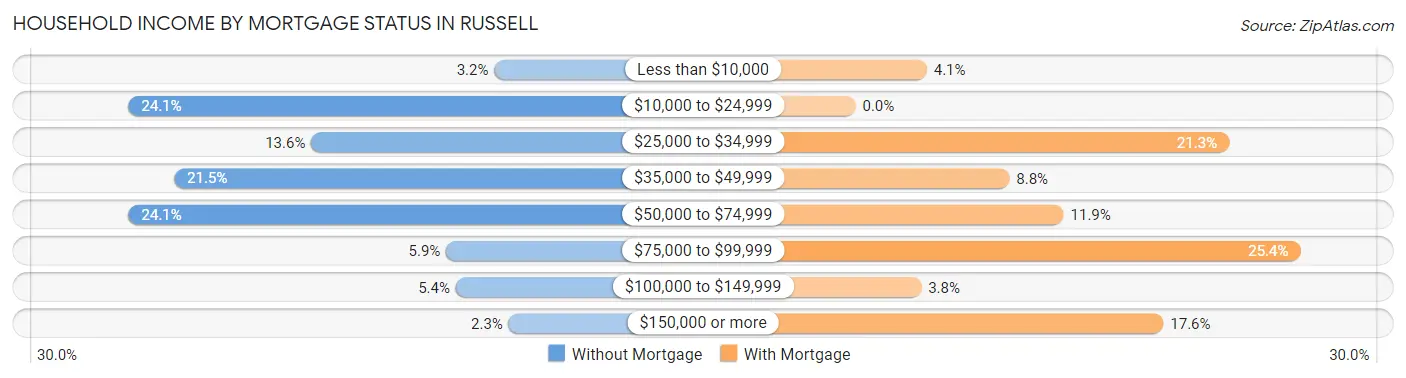
| Household Income | Without Mortgage | With Mortgage |
| Less than $10,000 | 23 (3.2%) | 25 (4.1%) |
| $10,000 to $24,999 | 175 (24.1%) | 0 (0.0%) |
| $25,000 to $34,999 | 99 (13.6%) | 131 (21.3%) |
| $35,000 to $49,999 | 156 (21.5%) | 54 (8.8%) |
| $50,000 to $74,999 | 175 (24.1%) | 73 (11.9%) |
| $75,000 to $99,999 | 43 (5.9%) | 156 (25.4%) |
| $100,000 to $149,999 | 39 (5.4%) | 23 (3.7%) |
| $150,000 or more | 17 (2.3%) | 108 (17.6%) |
| Total | 727 (100.0%) | 614 (100.0%) |
Property Value to Household Income Ratio in Russell
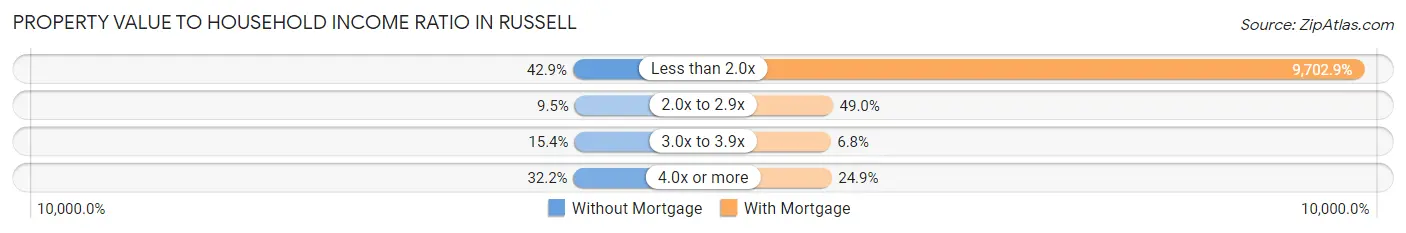
| Value-to-Income Ratio | Without Mortgage | With Mortgage |
| Less than 2.0x | 312 (42.9%) | 59,576 (9,702.9%) |
| 2.0x to 2.9x | 69 (9.5%) | 301 (49.0%) |
| 3.0x to 3.9x | 112 (15.4%) | 42 (6.8%) |
| 4.0x or more | 234 (32.2%) | 153 (24.9%) |
| Total | 727 (100.0%) | 614 (100.0%) |
Real Estate Taxes by Mortgage Status in Russell
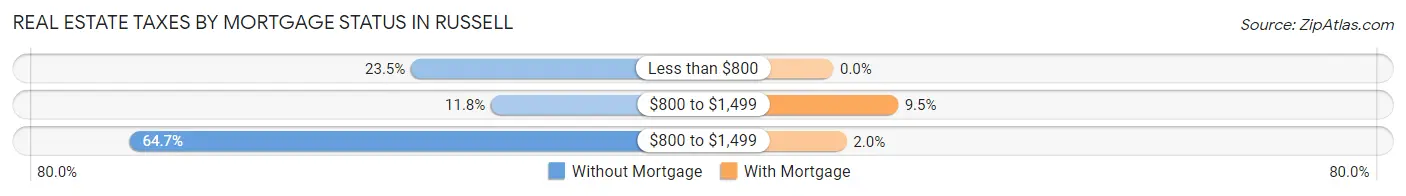
| Property Taxes | Without Mortgage | With Mortgage |
| Less than $800 | 171 (23.5%) | 0 (0.0%) |
| $800 to $1,499 | 86 (11.8%) | 58 (9.5%) |
| $800 to $1,499 | 470 (64.6%) | 12 (1.9%) |
| Total | 727 (100.0%) | 614 (100.0%) |
Health & Disability in Russell
Health Insurance Coverage by Age in Russell
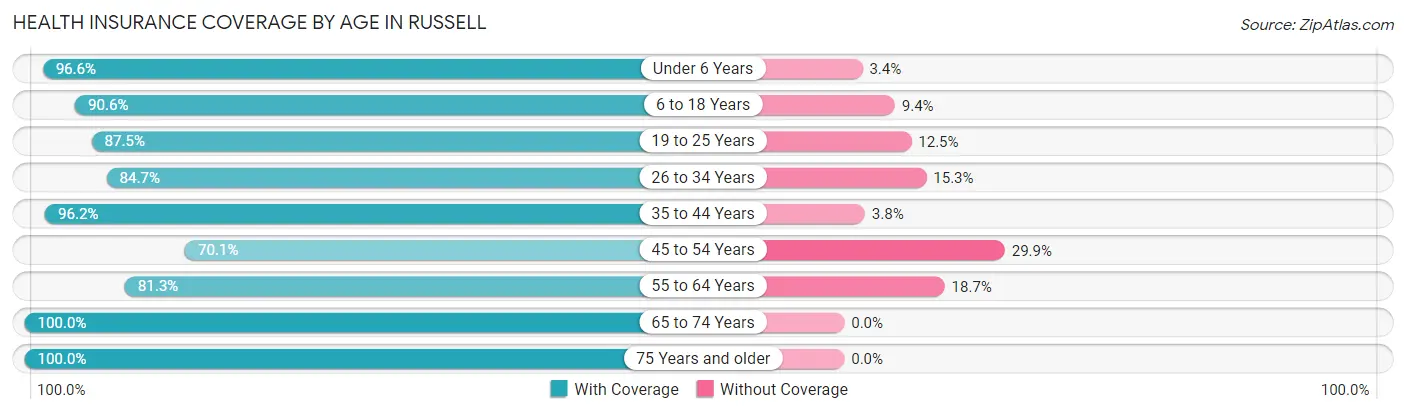
| Age Bracket | With Coverage | Without Coverage |
| Under 6 Years | 372 (96.6%) | 13 (3.4%) |
| 6 to 18 Years | 663 (90.6%) | 69 (9.4%) |
| 19 to 25 Years | 77 (87.5%) | 11 (12.5%) |
| 26 to 34 Years | 382 (84.7%) | 69 (15.3%) |
| 35 to 44 Years | 526 (96.2%) | 21 (3.8%) |
| 45 to 54 Years | 295 (70.1%) | 126 (29.9%) |
| 55 to 64 Years | 491 (81.3%) | 113 (18.7%) |
| 65 to 74 Years | 470 (100.0%) | 0 (0.0%) |
| 75 Years and older | 434 (100.0%) | 0 (0.0%) |
| Total | 3,710 (89.8%) | 422 (10.2%) |
Health Insurance Coverage by Citizenship Status in Russell
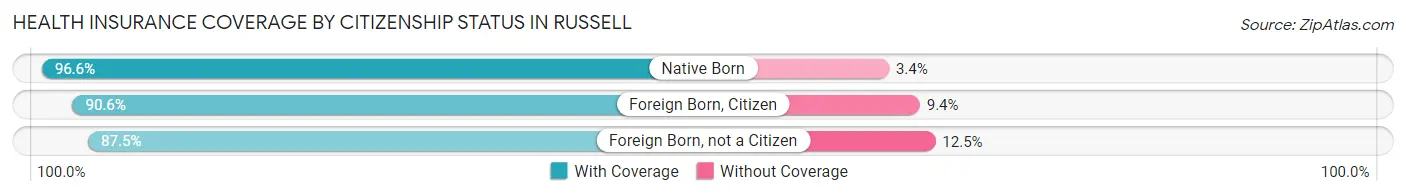
| Citizenship Status | With Coverage | Without Coverage |
| Native Born | 372 (96.6%) | 13 (3.4%) |
| Foreign Born, Citizen | 663 (90.6%) | 69 (9.4%) |
| Foreign Born, not a Citizen | 77 (87.5%) | 11 (12.5%) |
Health Insurance Coverage by Household Income in Russell
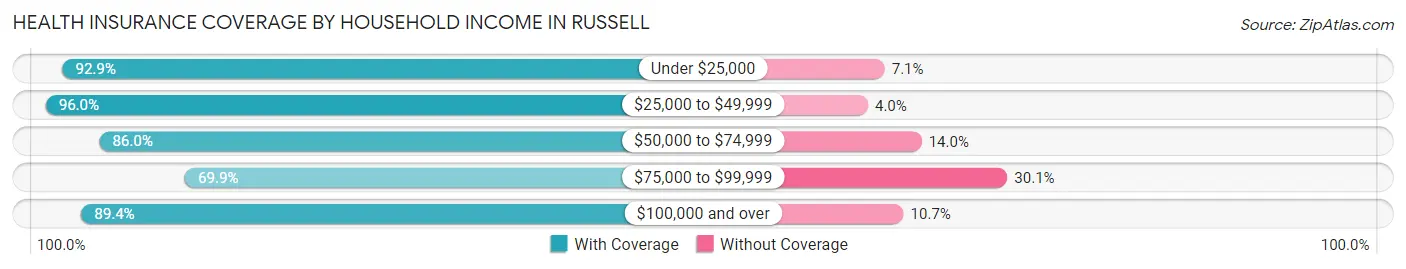
| Household Income | With Coverage | Without Coverage |
| Under $25,000 | 626 (92.9%) | 48 (7.1%) |
| $25,000 to $49,999 | 1,134 (96.0%) | 47 (4.0%) |
| $50,000 to $74,999 | 1,084 (86.0%) | 177 (14.0%) |
| $75,000 to $99,999 | 151 (69.9%) | 65 (30.1%) |
| $100,000 and over | 705 (89.3%) | 84 (10.6%) |
Public vs Private Health Insurance Coverage by Age in Russell
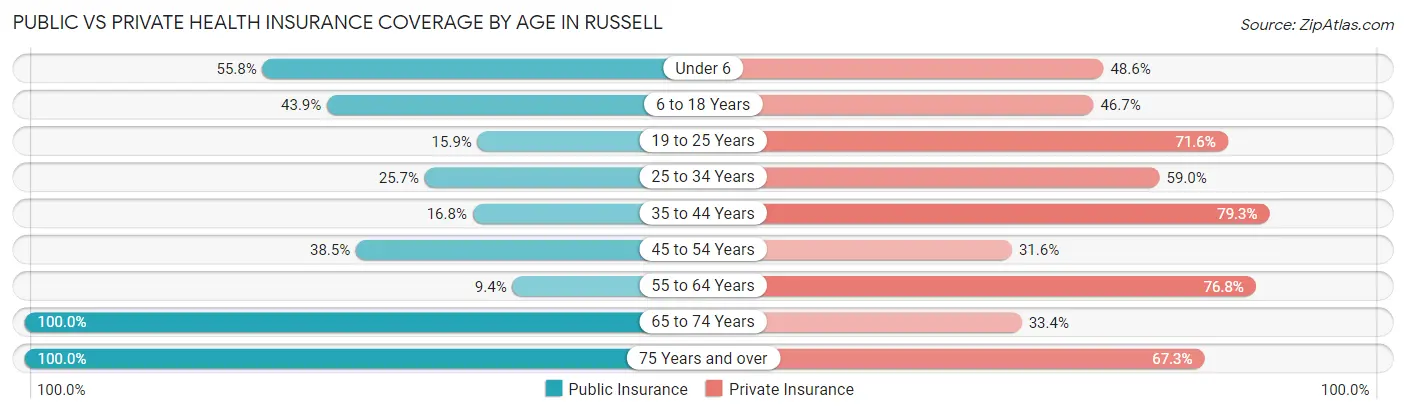
| Age Bracket | Public Insurance | Private Insurance |
| Under 6 | 215 (55.8%) | 187 (48.6%) |
| 6 to 18 Years | 321 (43.9%) | 342 (46.7%) |
| 19 to 25 Years | 14 (15.9%) | 63 (71.6%) |
| 25 to 34 Years | 116 (25.7%) | 266 (59.0%) |
| 35 to 44 Years | 92 (16.8%) | 434 (79.3%) |
| 45 to 54 Years | 162 (38.5%) | 133 (31.6%) |
| 55 to 64 Years | 57 (9.4%) | 464 (76.8%) |
| 65 to 74 Years | 470 (100.0%) | 157 (33.4%) |
| 75 Years and over | 434 (100.0%) | 292 (67.3%) |
| Total | 1,881 (45.5%) | 2,338 (56.6%) |
Disability Status by Sex by Age in Russell
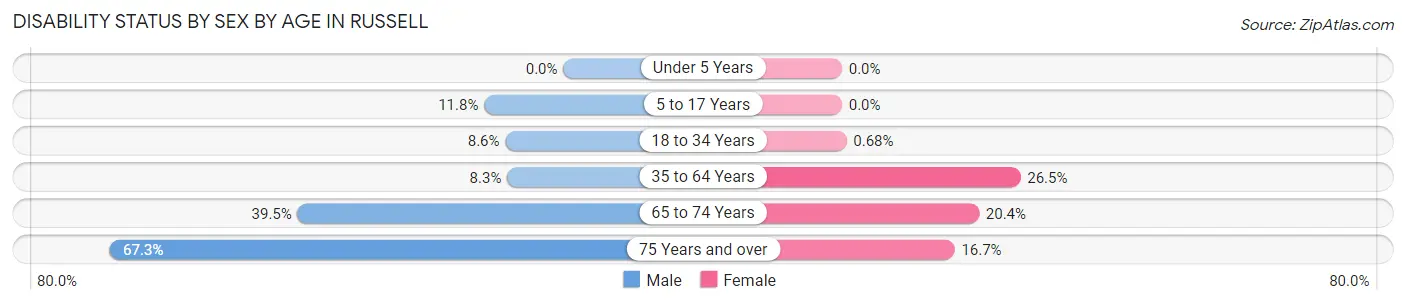
| Age Bracket | Male | Female |
| Under 5 Years | 0 (0.0%) | 0 (0.0%) |
| 5 to 17 Years | 45 (11.7%) | 0 (0.0%) |
| 18 to 34 Years | 29 (8.6%) | 2 (0.7%) |
| 35 to 64 Years | 70 (8.3%) | 194 (26.5%) |
| 65 to 74 Years | 73 (39.5%) | 58 (20.3%) |
| 75 Years and over | 107 (67.3%) | 46 (16.7%) |
Disability Class by Sex by Age in Russell
Disability Class: Hearing Difficulty
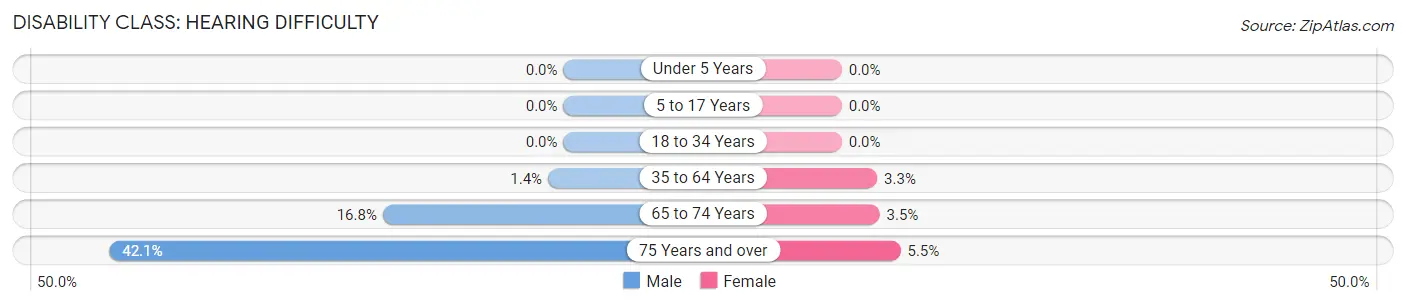
| Age Bracket | Male | Female |
| Under 5 Years | 0 (0.0%) | 0 (0.0%) |
| 5 to 17 Years | 0 (0.0%) | 0 (0.0%) |
| 18 to 34 Years | 0 (0.0%) | 0 (0.0%) |
| 35 to 64 Years | 12 (1.4%) | 24 (3.3%) |
| 65 to 74 Years | 31 (16.8%) | 10 (3.5%) |
| 75 Years and over | 67 (42.1%) | 15 (5.4%) |
Disability Class: Vision Difficulty
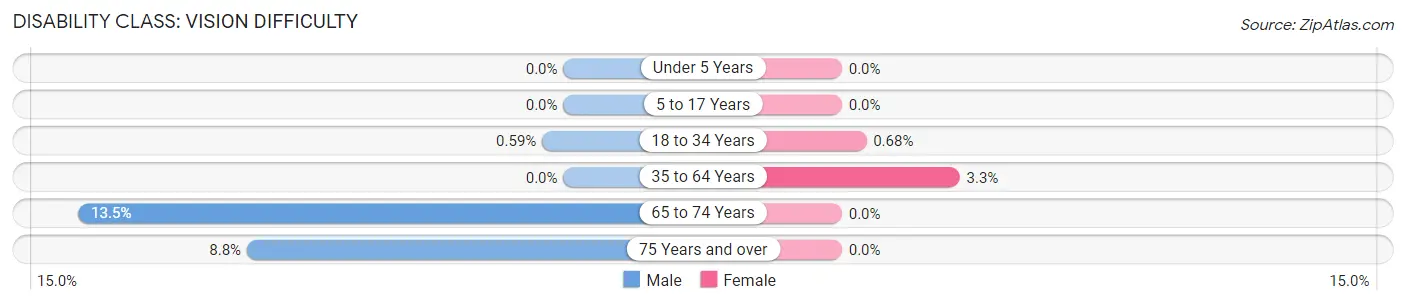
| Age Bracket | Male | Female |
| Under 5 Years | 0 (0.0%) | 0 (0.0%) |
| 5 to 17 Years | 0 (0.0%) | 0 (0.0%) |
| 18 to 34 Years | 2 (0.6%) | 2 (0.7%) |
| 35 to 64 Years | 0 (0.0%) | 24 (3.3%) |
| 65 to 74 Years | 25 (13.5%) | 0 (0.0%) |
| 75 Years and over | 14 (8.8%) | 0 (0.0%) |
Disability Class: Cognitive Difficulty
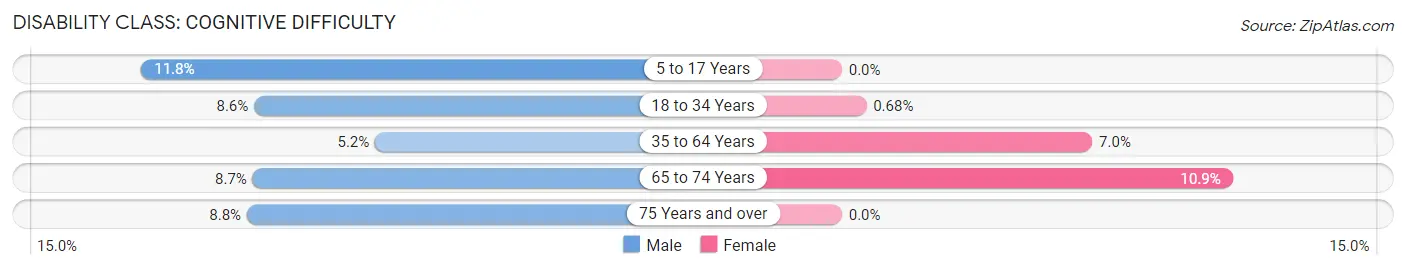
| Age Bracket | Male | Female |
| 5 to 17 Years | 45 (11.7%) | 0 (0.0%) |
| 18 to 34 Years | 29 (8.6%) | 2 (0.7%) |
| 35 to 64 Years | 44 (5.2%) | 51 (7.0%) |
| 65 to 74 Years | 16 (8.6%) | 31 (10.9%) |
| 75 Years and over | 14 (8.8%) | 0 (0.0%) |
Disability Class: Ambulatory Difficulty
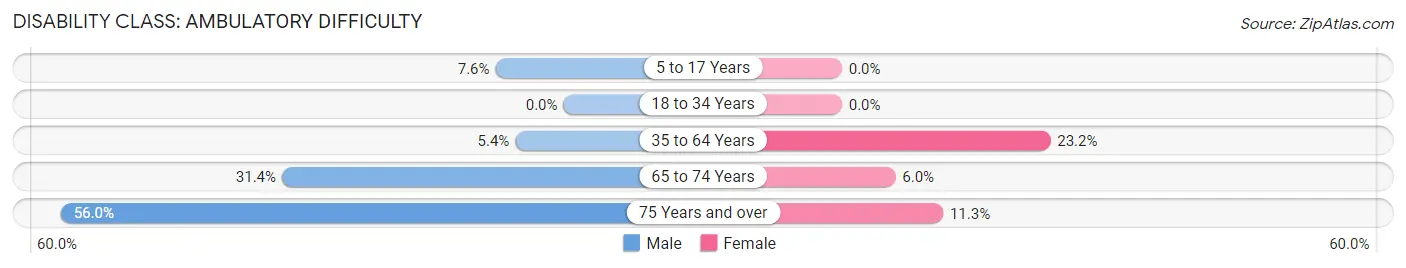
| Age Bracket | Male | Female |
| 5 to 17 Years | 29 (7.6%) | 0 (0.0%) |
| 18 to 34 Years | 0 (0.0%) | 0 (0.0%) |
| 35 to 64 Years | 45 (5.4%) | 170 (23.2%) |
| 65 to 74 Years | 58 (31.4%) | 17 (6.0%) |
| 75 Years and over | 89 (56.0%) | 31 (11.3%) |
Disability Class: Self-Care Difficulty
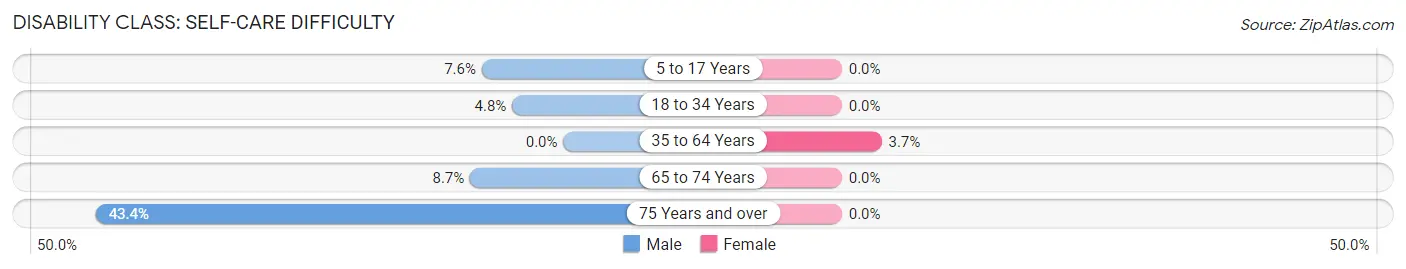
| Age Bracket | Male | Female |
| 5 to 17 Years | 29 (7.6%) | 0 (0.0%) |
| 18 to 34 Years | 16 (4.8%) | 0 (0.0%) |
| 35 to 64 Years | 0 (0.0%) | 27 (3.7%) |
| 65 to 74 Years | 16 (8.6%) | 0 (0.0%) |
| 75 Years and over | 69 (43.4%) | 0 (0.0%) |
Technology Access in Russell
Computing Device Access in Russell
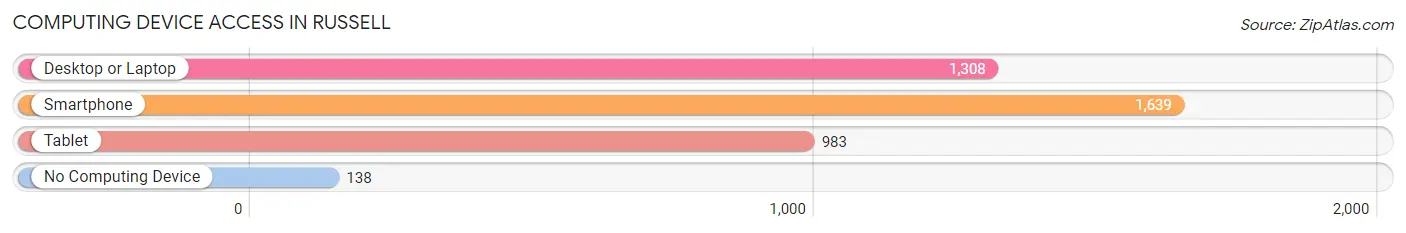
| Device Type | # Households | % Households |
| Desktop or Laptop | 1,308 | 69.4% |
| Smartphone | 1,639 | 86.9% |
| Tablet | 983 | 52.1% |
| No Computing Device | 138 | 7.3% |
| Total | 1,886 | 100.0% |
Internet Access in Russell
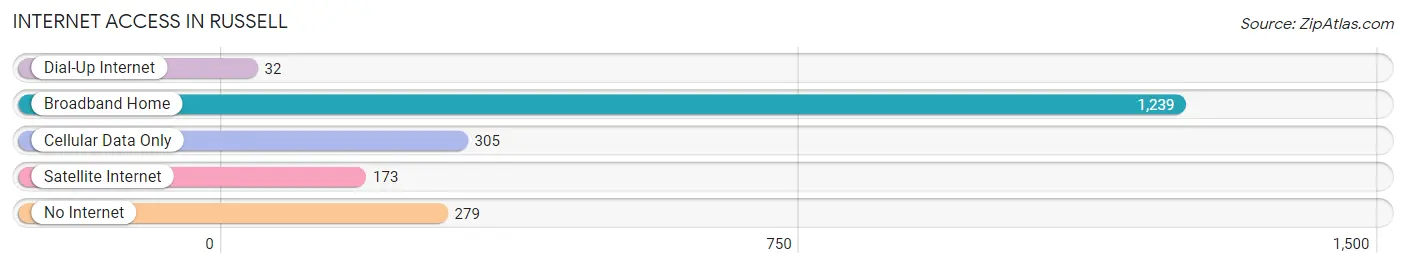
| Internet Type | # Households | % Households |
| Dial-Up Internet | 32 | 1.7% |
| Broadband Home | 1,239 | 65.7% |
| Cellular Data Only | 305 | 16.2% |
| Satellite Internet | 173 | 9.2% |
| No Internet | 279 | 14.8% |
| Total | 1,886 | 100.0% |
Russell Summary
Russell, Kansas is a small city located in Russell County in the north-central part of the state. It is the county seat and the largest city in the county. The city is situated on the Smoky Hill River and is surrounded by rolling hills and prairies. The population of Russell was estimated to be 3,845 in 2019.
History
The area that is now Russell was first settled in 1871 by a group of German immigrants. The town was originally called Grasshopper Falls, but was later renamed Russell in honor of a local settler, William Russell. The city was incorporated in 1872 and quickly became a center of commerce and industry. The first railroad line was built in 1879, connecting Russell to the rest of the state.
In the early 1900s, Russell was a thriving agricultural center, with a variety of crops being grown in the area. The city also had a number of businesses, including a flour mill, a creamery, and a brickyard.
Geography
Russell is located in north-central Kansas, about 50 miles north of Wichita. The city is situated on the Smoky Hill River and is surrounded by rolling hills and prairies. The climate is semi-arid, with hot summers and cold winters.
Economy
The economy of Russell is largely based on agriculture and manufacturing. The city is home to several large agricultural operations, including a feedlot, a dairy, and a hog farm. The city also has a number of manufacturing businesses, including a plastics plant, a metal fabrication plant, and a machine shop.
Demographics
As of the 2019 census, the population of Russell was estimated to be 3,845. The racial makeup of the city was 94.3% White, 0.7% African American, 0.3% Native American, 0.2% Asian, 0.1% Pacific Islander, and 4.4% from other races. The median household income was $41,944, and the median family income was $50,944.
Conclusion
Russell, Kansas is a small city located in Russell County in the north-central part of the state. It is the county seat and the largest city in the county. The city is situated on the Smoky Hill River and is surrounded by rolling hills and prairies. The population of Russell was estimated to be 3,845 in 2019. The economy of Russell is largely based on agriculture and manufacturing, and the city has a diverse racial makeup. Russell is a great place to live and work, and it offers a variety of opportunities for those looking to make a home in the area.
Common Questions
What is Per Capita Income in Russell?
Per Capita income in Russell is $26,365.
What is the Median Family Income in Russell?
Median Family Income in Russell is $63,154.
What is the Median Household income in Russell?
Median Household Income in Russell is $44,942.
What is Income or Wage Gap in Russell?
Income or Wage Gap in Russell is 18.5%.
Women in Russell earn 81.5 cents for every dollar earned by a man.
What is Inequality or Gini Index in Russell?
Inequality or Gini Index in Russell is 0.44.
What is the Total Population of Russell?
Total Population of Russell is 4,238.
What is the Total Male Population of Russell?
Total Male Population of Russell is 2,087.
What is the Total Female Population of Russell?
Total Female Population of Russell is 2,151.
What is the Ratio of Males per 100 Females in Russell?
There are 97.02 Males per 100 Females in Russell.
What is the Ratio of Females per 100 Males in Russell?
There are 103.07 Females per 100 Males in Russell.
What is the Median Population Age in Russell?
Median Population Age in Russell is 42.1 Years.
What is the Average Family Size in Russell
Average Family Size in Russell is 2.9 People.
What is the Average Household Size in Russell
Average Household Size in Russell is 2.2 People.
How Large is the Labor Force in Russell?
There are 2,064 People in the Labor Forcein in Russell.
What is the Percentage of People in the Labor Force in Russell?
61.3% of People are in the Labor Force in Russell.
What is the Unemployment Rate in Russell?
Unemployment Rate in Russell is 3.2%.