Topeka, KS Map & Demographics
Topeka Map
Topeka Overview
$32,176
PER CAPITA INCOME
$74,579
AVG FAMILY INCOME
$54,052
AVG HOUSEHOLD INCOME
19.8%
WAGE / INCOME GAP [ % ]
80.2¢/ $1
WAGE / INCOME GAP [ $ ]
$10,153
FAMILY INCOME DEFICIT
0.45
INEQUALITY / GINI INDEX
126,431
TOTAL POPULATION
60,905
MALE POPULATION
65,526
FEMALE POPULATION
92.95
MALES / 100 FEMALES
107.59
FEMALES / 100 MALES
37.9
MEDIAN AGE
3.0
AVG FAMILY SIZE
2.2
AVG HOUSEHOLD SIZE
62,689
LABOR FORCE [ PEOPLE ]
61.8%
PERCENT IN LABOR FORCE
5.0%
UNEMPLOYMENT RATE
Topeka Zip Codes
Topeka Area Codes
Income in Topeka
Income Overview in Topeka
Per Capita Income in Topeka is $32,176, while median incomes of families and households are $74,579 and $54,052 respectively.
| Characteristic | Number | Measure |
| Per Capita Income | 126,431 | $32,176 |
| Median Family Income | 29,469 | $74,579 |
| Mean Family Income | 29,469 | $91,782 |
| Median Household Income | 54,278 | $54,052 |
| Mean Household Income | 54,278 | $72,948 |
| Income Deficit | 29,469 | $10,153 |
| Wage / Income Gap (%) | 126,431 | 19.81% |
| Wage / Income Gap ($) | 126,431 | 80.19¢ per $1 |
| Gini / Inequality Index | 126,431 | 0.45 |
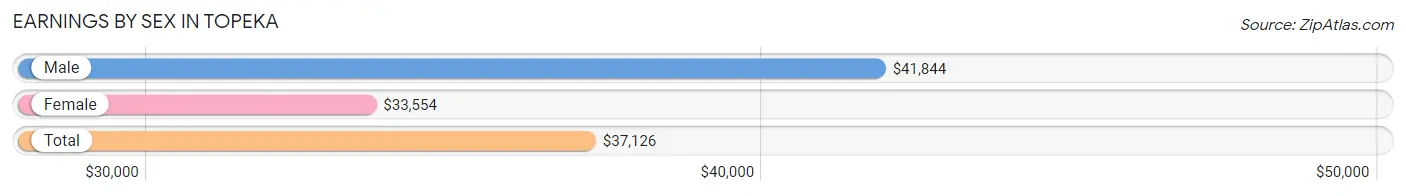
Earnings by Sex in Topeka
Average Earnings in Topeka are $37,126, $41,844 for men and $33,554 for women, a difference of 19.8%.
| Sex | Number | Average Earnings |
| Male | 32,820 (50.1%) | $41,844 |
| Female | 32,680 (49.9%) | $33,554 |
| Total | 65,500 (100.0%) | $37,126 |
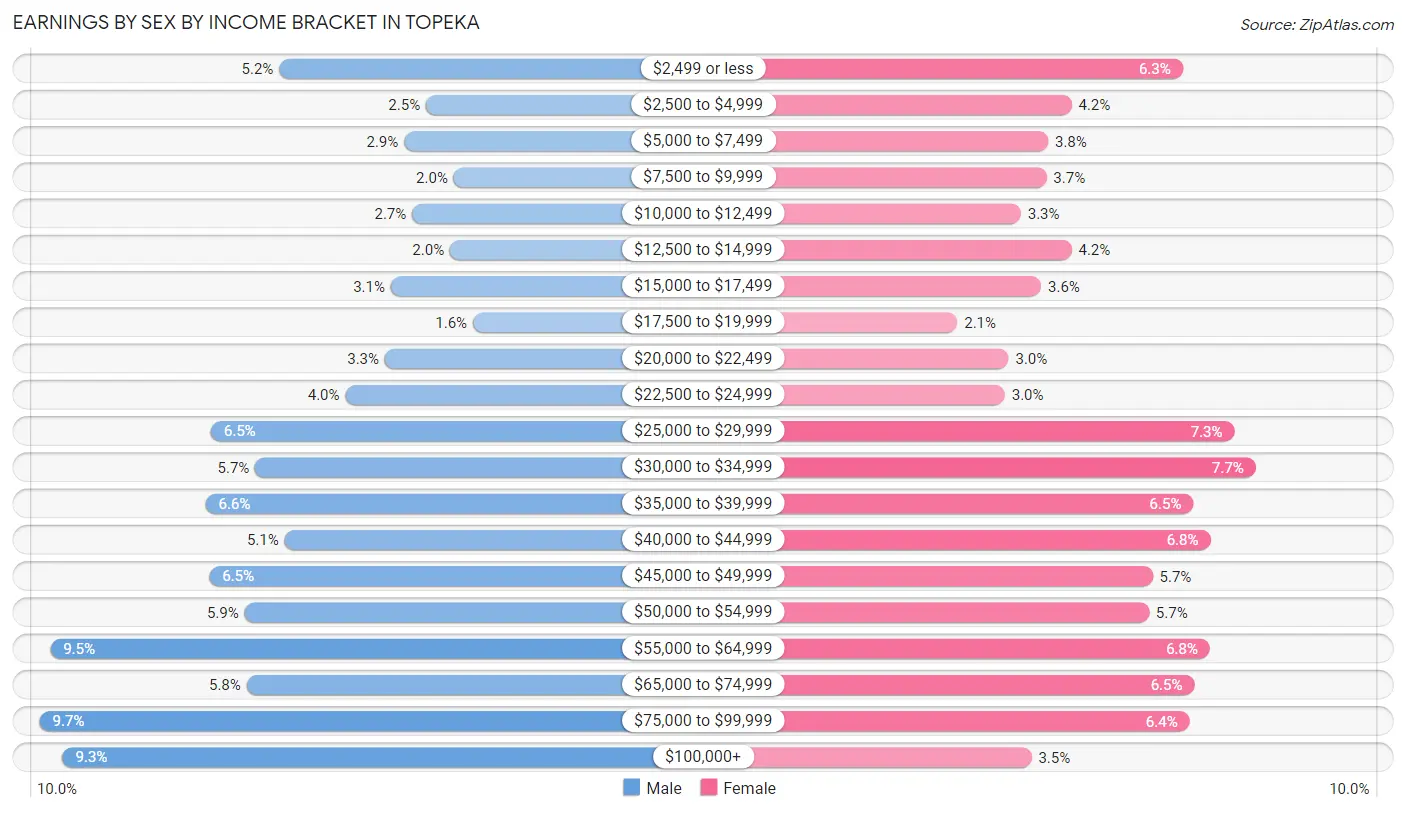
Earnings by Sex by Income Bracket in Topeka
The most common earnings brackets in Topeka are $75,000 to $99,999 for men (3,190 | 9.7%) and $30,000 to $34,999 for women (2,502 | 7.7%).
| Income | Male | Female |
| $2,499 or less | 1,716 (5.2%) | 2,055 (6.3%) |
| $2,500 to $4,999 | 815 (2.5%) | 1,377 (4.2%) |
| $5,000 to $7,499 | 947 (2.9%) | 1,233 (3.8%) |
| $7,500 to $9,999 | 642 (2.0%) | 1,223 (3.7%) |
| $10,000 to $12,499 | 898 (2.7%) | 1,067 (3.3%) |
| $12,500 to $14,999 | 665 (2.0%) | 1,375 (4.2%) |
| $15,000 to $17,499 | 1,031 (3.1%) | 1,191 (3.6%) |
| $17,500 to $19,999 | 524 (1.6%) | 678 (2.1%) |
| $20,000 to $22,499 | 1,067 (3.3%) | 990 (3.0%) |
| $22,500 to $24,999 | 1,309 (4.0%) | 967 (3.0%) |
| $25,000 to $29,999 | 2,135 (6.5%) | 2,372 (7.3%) |
| $30,000 to $34,999 | 1,863 (5.7%) | 2,502 (7.7%) |
| $35,000 to $39,999 | 2,168 (6.6%) | 2,121 (6.5%) |
| $40,000 to $44,999 | 1,684 (5.1%) | 2,225 (6.8%) |
| $45,000 to $49,999 | 2,146 (6.5%) | 1,874 (5.7%) |
| $50,000 to $54,999 | 1,929 (5.9%) | 1,851 (5.7%) |
| $55,000 to $64,999 | 3,123 (9.5%) | 2,223 (6.8%) |
| $65,000 to $74,999 | 1,918 (5.8%) | 2,128 (6.5%) |
| $75,000 to $99,999 | 3,190 (9.7%) | 2,098 (6.4%) |
| $100,000+ | 3,050 (9.3%) | 1,130 (3.5%) |
| Total | 32,820 (100.0%) | 32,680 (100.0%) |
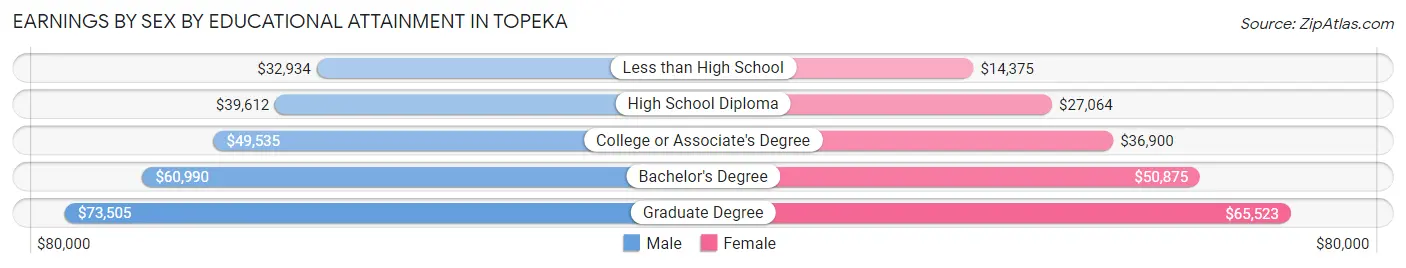
Earnings by Sex by Educational Attainment in Topeka
Average earnings in Topeka are $48,270 for men and $38,689 for women, a difference of 19.9%. Men with an educational attainment of graduate degree enjoy the highest average annual earnings of $73,505, while those with less than high school education earn the least with $32,934. Women with an educational attainment of graduate degree earn the most with the average annual earnings of $65,523, while those with less than high school education have the smallest earnings of $14,375.
| Educational Attainment | Male Income | Female Income |
| Less than High School | $32,934 | $14,375 |
| High School Diploma | $39,612 | $27,064 |
| College or Associate's Degree | $49,535 | $36,900 |
| Bachelor's Degree | $60,990 | $50,875 |
| Graduate Degree | $73,505 | $65,523 |
| Total | $48,270 | $38,689 |
Family Income in Topeka
Family Income Brackets in Topeka
According to the Topeka family income data, there are 6,100 families falling into the $100,000 to $149,999 income range, which is the most common income bracket and makes up 20.7% of all families. Conversely, the $10,000 to $14,999 income bracket is the least frequent group with only 589 families (2.0%) belonging to this category.
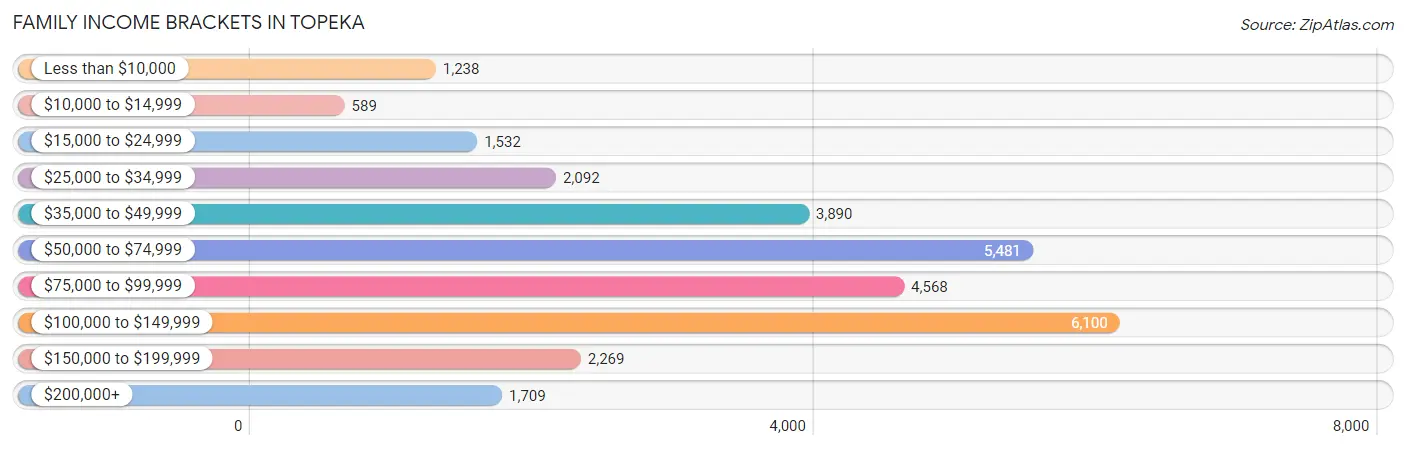
| Income Bracket | # Families | % Families |
| Less than $10,000 | 1,238 | 4.2% |
| $10,000 to $14,999 | 589 | 2.0% |
| $15,000 to $24,999 | 1,532 | 5.2% |
| $25,000 to $34,999 | 2,092 | 7.1% |
| $35,000 to $49,999 | 3,890 | 13.2% |
| $50,000 to $74,999 | 5,481 | 18.6% |
| $75,000 to $99,999 | 4,568 | 15.5% |
| $100,000 to $149,999 | 6,100 | 20.7% |
| $150,000 to $199,999 | 2,269 | 7.7% |
| $200,000+ | 1,709 | 5.8% |
Family Income by Famaliy Size in Topeka
6-person families (676 | 2.3%) account for the highest median family income in Topeka with $120,245 per family, while 2-person families (14,727 | 50.0%) have the highest median income of $35,114 per family member.
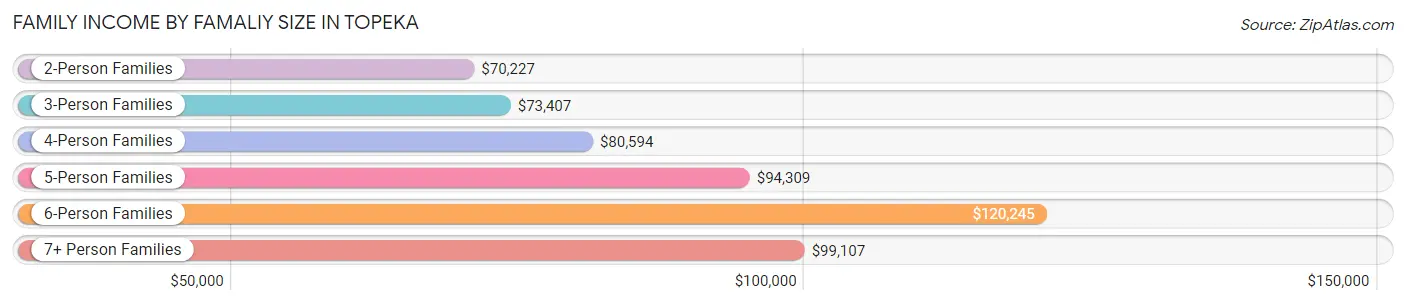
| Income Bracket | # Families | Median Income |
| 2-Person Families | 14,727 (50.0%) | $70,227 |
| 3-Person Families | 6,640 (22.5%) | $73,407 |
| 4-Person Families | 4,874 (16.5%) | $80,594 |
| 5-Person Families | 2,299 (7.8%) | $94,309 |
| 6-Person Families | 676 (2.3%) | $120,245 |
| 7+ Person Families | 253 (0.9%) | $99,107 |
| Total | 29,469 (100.0%) | $74,579 |
Family Income by Number of Earners in Topeka
The median family income in Topeka is $74,579, with families comprising 3+ earners (2,436) having the highest median family income of $127,347, while families with 1 earner (10,062) have the lowest median family income of $48,713, accounting for 8.3% and 34.1% of families, respectively.
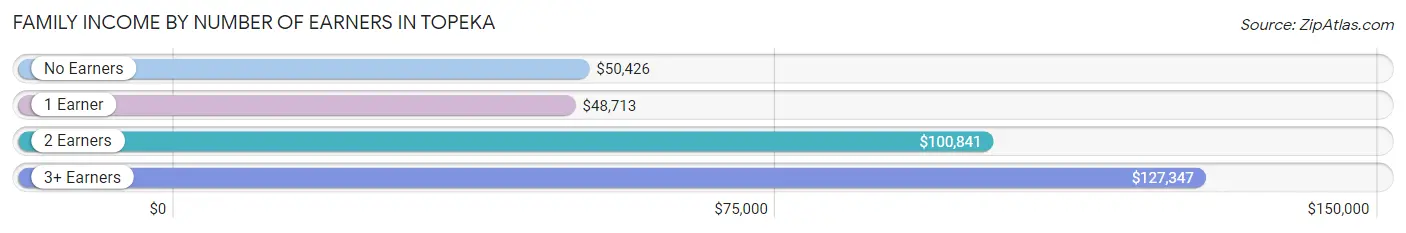
| Number of Earners | # Families | Median Income |
| No Earners | 4,478 (15.2%) | $50,426 |
| 1 Earner | 10,062 (34.1%) | $48,713 |
| 2 Earners | 12,493 (42.4%) | $100,841 |
| 3+ Earners | 2,436 (8.3%) | $127,347 |
| Total | 29,469 (100.0%) | $74,579 |
Household Income in Topeka
Household Income Brackets in Topeka
With 10,313 households falling in the category, the $50,000 to $74,999 income range is the most frequent in Topeka, accounting for 19.0% of all households. In contrast, only 2,063 households (3.8%) fall into the $200,000+ income bracket, making it the least populous group.
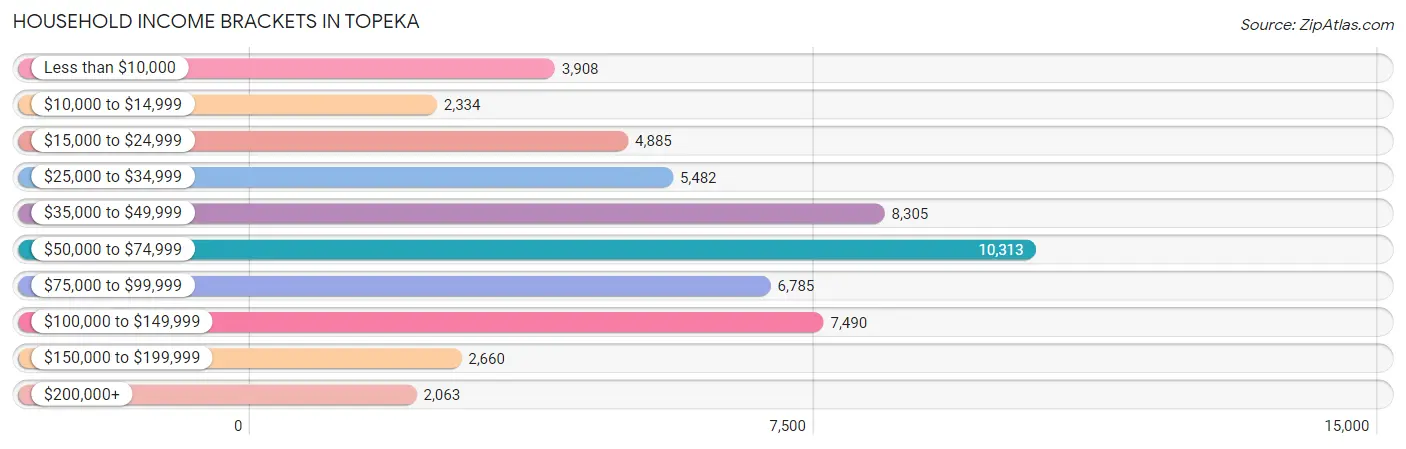
| Income Bracket | # Households | % Households |
| Less than $10,000 | 3,908 | 7.2% |
| $10,000 to $14,999 | 2,334 | 4.3% |
| $15,000 to $24,999 | 4,885 | 9.0% |
| $25,000 to $34,999 | 5,482 | 10.1% |
| $35,000 to $49,999 | 8,305 | 15.3% |
| $50,000 to $74,999 | 10,313 | 19.0% |
| $75,000 to $99,999 | 6,785 | 12.5% |
| $100,000 to $149,999 | 7,490 | 13.8% |
| $150,000 to $199,999 | 2,660 | 4.9% |
| $200,000+ | 2,063 | 3.8% |
Household Income by Householder Age in Topeka
The median household income in Topeka is $54,052, with the highest median household income of $64,834 found in the 25 to 44 years age bracket for the primary householder. A total of 16,774 households (30.9%) fall into this category. Meanwhile, the 15 to 24 years age bracket for the primary householder has the lowest median household income of $36,716, with 3,927 households (7.2%) in this group.
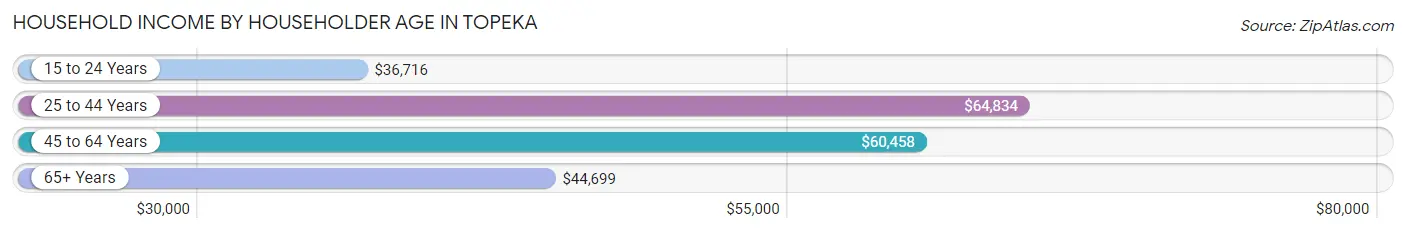
| Income Bracket | # Households | Median Income |
| 15 to 24 Years | 3,927 (7.2%) | $36,716 |
| 25 to 44 Years | 16,774 (30.9%) | $64,834 |
| 45 to 64 Years | 18,111 (33.4%) | $60,458 |
| 65+ Years | 15,466 (28.5%) | $44,699 |
| Total | 54,278 (100.0%) | $54,052 |
Poverty in Topeka
Income Below Poverty by Sex and Age in Topeka
With 14.5% poverty level for males and 17.5% for females among the residents of Topeka, 16 and 17 year old males and 18 to 24 year old females are the most vulnerable to poverty, with 369 males (23.9%) and 1,843 females (29.9%) in their respective age groups living below the poverty level.
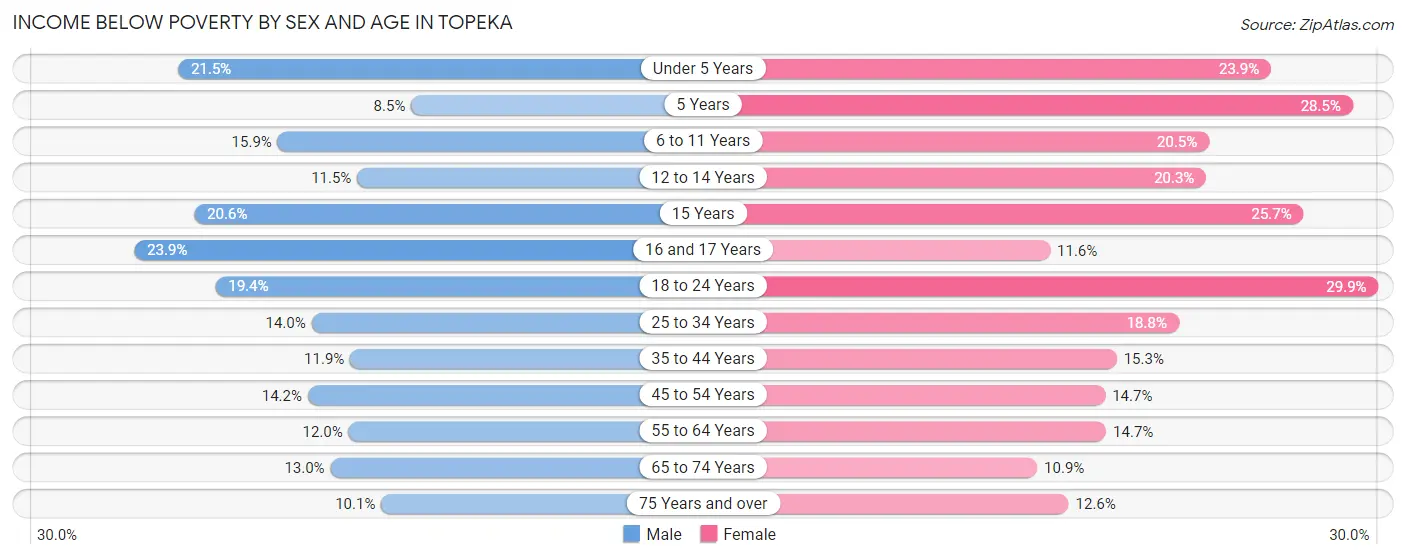
| Age Bracket | Male | Female |
| Under 5 Years | 848 (21.5%) | 847 (23.9%) |
| 5 Years | 85 (8.5%) | 208 (28.4%) |
| 6 to 11 Years | 789 (15.9%) | 939 (20.4%) |
| 12 to 14 Years | 232 (11.5%) | 469 (20.3%) |
| 15 Years | 140 (20.6%) | 145 (25.7%) |
| 16 and 17 Years | 369 (23.9%) | 201 (11.6%) |
| 18 to 24 Years | 1,135 (19.4%) | 1,843 (29.9%) |
| 25 to 34 Years | 1,133 (14.0%) | 1,472 (18.8%) |
| 35 to 44 Years | 931 (11.9%) | 1,197 (15.3%) |
| 45 to 54 Years | 944 (14.2%) | 986 (14.7%) |
| 55 to 64 Years | 874 (12.0%) | 1,272 (14.7%) |
| 65 to 74 Years | 713 (13.0%) | 731 (10.9%) |
| 75 Years and over | 366 (10.1%) | 742 (12.6%) |
| Total | 8,559 (14.5%) | 11,052 (17.5%) |
Income Above Poverty by Sex and Age in Topeka
According to the poverty statistics in Topeka, males aged 5 years and females aged 65 to 74 years are the age groups that are most secure financially, with 91.5% of males and 89.1% of females in these age groups living above the poverty line.
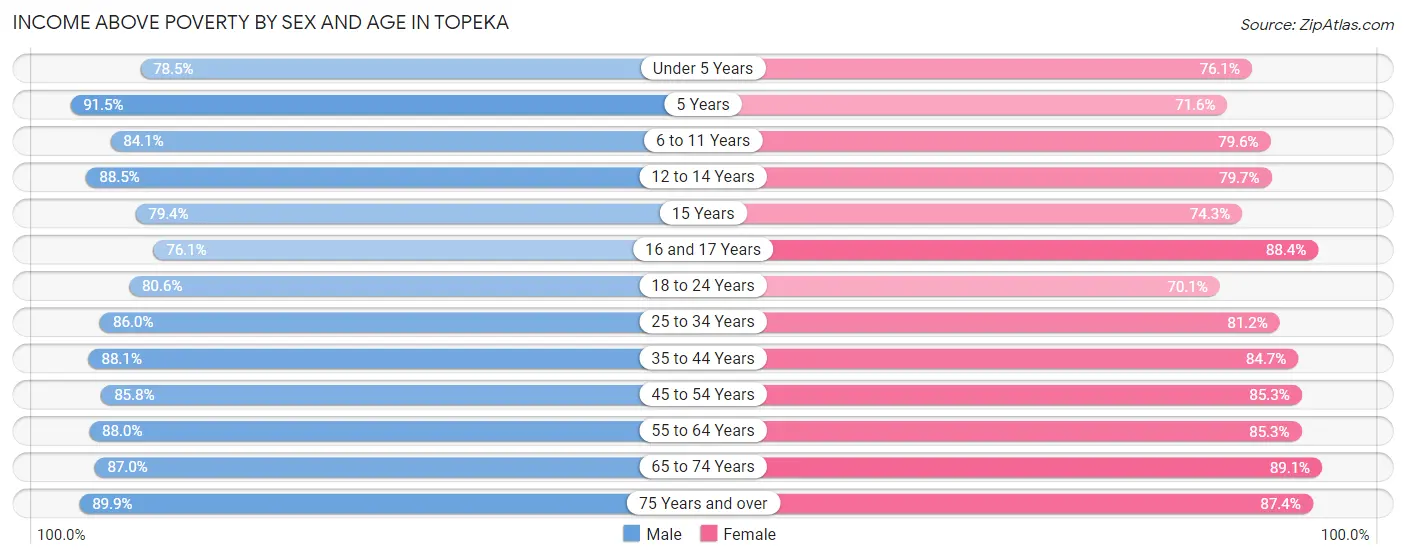
| Age Bracket | Male | Female |
| Under 5 Years | 3,104 (78.5%) | 2,697 (76.1%) |
| 5 Years | 919 (91.5%) | 523 (71.6%) |
| 6 to 11 Years | 4,171 (84.1%) | 3,653 (79.5%) |
| 12 to 14 Years | 1,789 (88.5%) | 1,842 (79.7%) |
| 15 Years | 541 (79.4%) | 419 (74.3%) |
| 16 and 17 Years | 1,175 (76.1%) | 1,532 (88.4%) |
| 18 to 24 Years | 4,721 (80.6%) | 4,324 (70.1%) |
| 25 to 34 Years | 6,949 (86.0%) | 6,373 (81.2%) |
| 35 to 44 Years | 6,913 (88.1%) | 6,622 (84.7%) |
| 45 to 54 Years | 5,688 (85.8%) | 5,735 (85.3%) |
| 55 to 64 Years | 6,435 (88.0%) | 7,370 (85.3%) |
| 65 to 74 Years | 4,786 (87.0%) | 5,987 (89.1%) |
| 75 Years and over | 3,242 (89.9%) | 5,131 (87.4%) |
| Total | 50,433 (85.5%) | 52,208 (82.5%) |
Income Below Poverty Among Married-Couple Families in Topeka
The poverty statistics for married-couple families in Topeka show that 4.7% or 906 of the total 19,447 families live below the poverty line. Families with 3 or 4 children have the highest poverty rate of 7.6%, comprising of 125 families. On the other hand, families with 5 or more children have the lowest poverty rate of 0.0%, which includes 0 families.
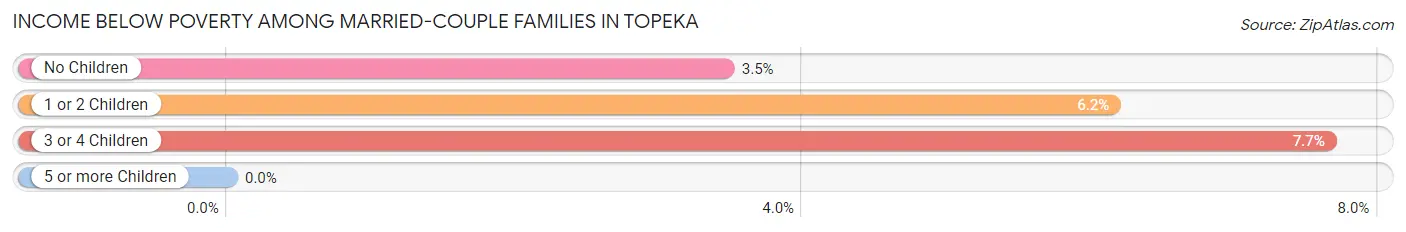
| Children | Above Poverty | Below Poverty |
| No Children | 11,087 (96.5%) | 397 (3.5%) |
| 1 or 2 Children | 5,862 (93.9%) | 384 (6.1%) |
| 3 or 4 Children | 1,510 (92.3%) | 125 (7.6%) |
| 5 or more Children | 82 (100.0%) | 0 (0.0%) |
| Total | 18,541 (95.3%) | 906 (4.7%) |
Income Below Poverty Among Single-Parent Households in Topeka
According to the poverty data in Topeka, 14.2% or 377 single-father households and 27.7% or 2,046 single-mother households are living below the poverty line. Among single-father households, those with 5 or more children have the highest poverty rate, with 12 households (100.0%) experiencing poverty. Likewise, among single-mother households, those with 5 or more children have the highest poverty rate, with 19 households (42.2%) falling below the poverty line.
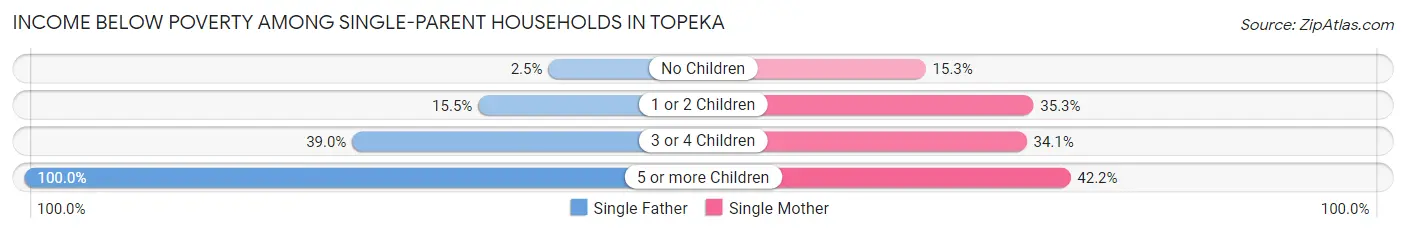
| Children | Single Father | Single Mother |
| No Children | 22 (2.5%) | 418 (15.3%) |
| 1 or 2 Children | 221 (15.5%) | 1,266 (35.3%) |
| 3 or 4 Children | 122 (39.0%) | 343 (34.1%) |
| 5 or more Children | 12 (100.0%) | 19 (42.2%) |
| Total | 377 (14.2%) | 2,046 (27.7%) |
Income Below Poverty Among Married-Couple vs Single-Parent Households in Topeka
The poverty data for Topeka shows that 906 of the married-couple family households (4.7%) and 2,423 of the single-parent households (24.2%) are living below the poverty level. Within the married-couple family households, those with 3 or 4 children have the highest poverty rate, with 125 households (7.6%) falling below the poverty line. Among the single-parent households, those with 5 or more children have the highest poverty rate, with 31 household (54.4%) living below poverty.
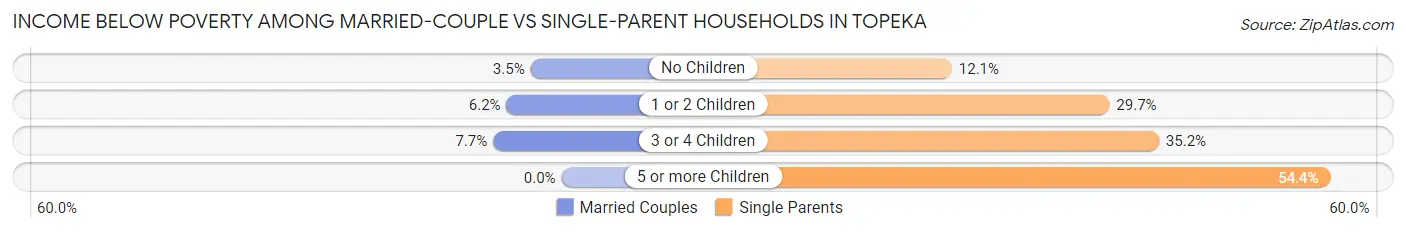
| Children | Married-Couple Families | Single-Parent Households |
| No Children | 397 (3.5%) | 440 (12.1%) |
| 1 or 2 Children | 384 (6.1%) | 1,487 (29.7%) |
| 3 or 4 Children | 125 (7.6%) | 465 (35.2%) |
| 5 or more Children | 0 (0.0%) | 31 (54.4%) |
| Total | 906 (4.7%) | 2,423 (24.2%) |
Race in Topeka
The most populous races in Topeka are White / Caucasian (92,347 | 73.0%), Hispanic or Latino (20,694 | 16.4%), and Black / African American (12,891 | 10.2%).
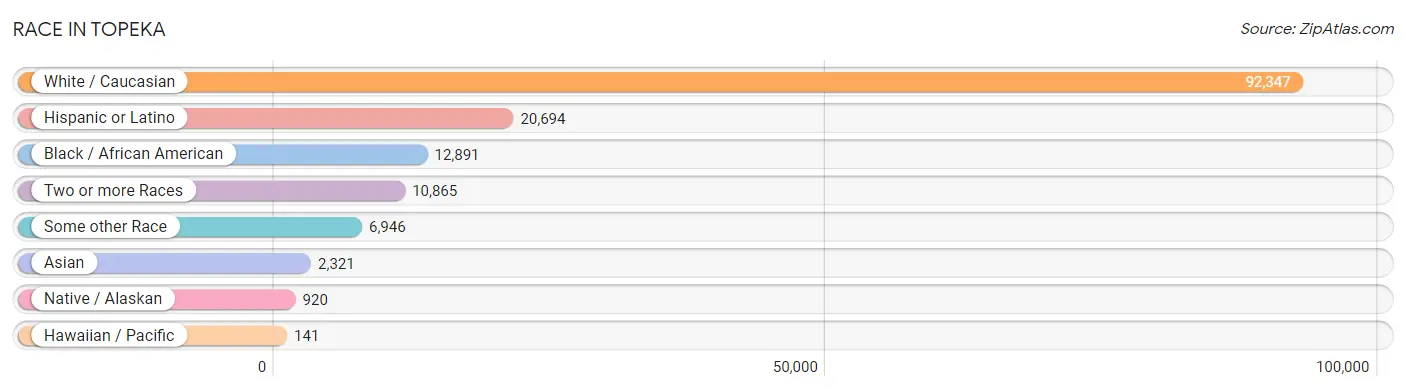
| Race | # Population | % Population |
| Asian | 2,321 | 1.8% |
| Black / African American | 12,891 | 10.2% |
| Hawaiian / Pacific | 141 | 0.1% |
| Hispanic or Latino | 20,694 | 16.4% |
| Native / Alaskan | 920 | 0.7% |
| White / Caucasian | 92,347 | 73.0% |
| Two or more Races | 10,865 | 8.6% |
| Some other Race | 6,946 | 5.5% |
| Total | 126,431 | 100.0% |
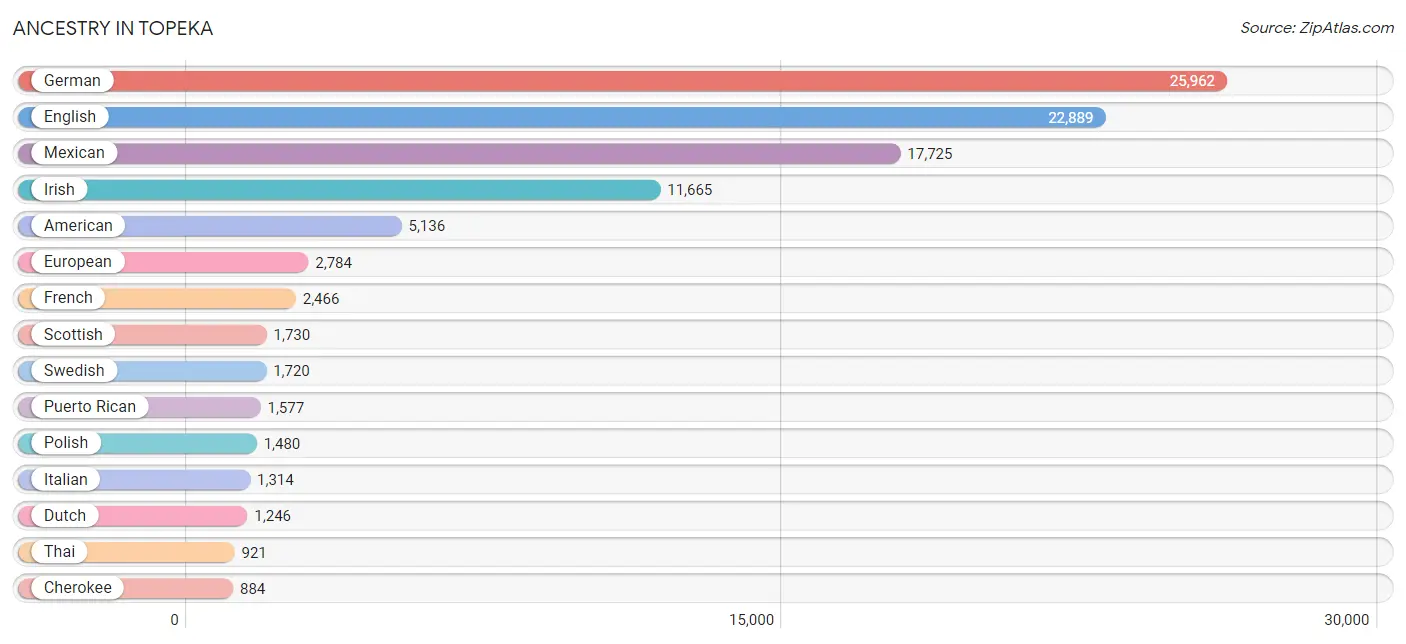
Ancestry in Topeka
The most populous ancestries reported in Topeka are German (25,962 | 20.5%), English (22,889 | 18.1%), Mexican (17,725 | 14.0%), Irish (11,665 | 9.2%), and American (5,136 | 4.1%), together accounting for 65.9% of all Topeka residents.
| Ancestry | # Population | % Population |
| African | 494 | 0.4% |
| Albanian | 12 | 0.0% |
| Alsatian | 1 | 0.0% |
| American | 5,136 | 4.1% |
| Apache | 64 | 0.1% |
| Arab | 73 | 0.1% |
| Argentinean | 15 | 0.0% |
| Armenian | 36 | 0.0% |
| Austrian | 172 | 0.1% |
| Belgian | 44 | 0.0% |
| Bhutanese | 390 | 0.3% |
| Blackfeet | 106 | 0.1% |
| Brazilian | 77 | 0.1% |
| British | 777 | 0.6% |
| Burmese | 373 | 0.3% |
| Canadian | 51 | 0.0% |
| Central American | 246 | 0.2% |
| Central American Indian | 54 | 0.0% |
| Cherokee | 884 | 0.7% |
| Cheyenne | 18 | 0.0% |
| Chickasaw | 21 | 0.0% |
| Chilean | 9 | 0.0% |
| Chippewa | 155 | 0.1% |
| Choctaw | 45 | 0.0% |
| Colombian | 62 | 0.1% |
| Comanche | 32 | 0.0% |
| Costa Rican | 14 | 0.0% |
| Creek | 23 | 0.0% |
| Croatian | 136 | 0.1% |
| Cuban | 238 | 0.2% |
| Czech | 510 | 0.4% |
| Czechoslovakian | 137 | 0.1% |
| Danish | 535 | 0.4% |
| Delaware | 100 | 0.1% |
| Dominican | 67 | 0.1% |
| Dutch | 1,246 | 1.0% |
| Eastern European | 186 | 0.2% |
| Ecuadorian | 22 | 0.0% |
| English | 22,889 | 18.1% |
| European | 2,784 | 2.2% |
| Finnish | 73 | 0.1% |
| French | 2,466 | 1.9% |
| French Canadian | 188 | 0.2% |
| German | 25,962 | 20.5% |
| German Russian | 59 | 0.1% |
| Ghanaian | 26 | 0.0% |
| Greek | 115 | 0.1% |
| Guamanian / Chamorro | 2 | 0.0% |
| Guatemalan | 155 | 0.1% |
| Haitian | 15 | 0.0% |
| Hungarian | 92 | 0.1% |
| Indian (Asian) | 507 | 0.4% |
| Indonesian | 4 | 0.0% |
| Inupiat | 11 | 0.0% |
| Iranian | 9 | 0.0% |
| Irish | 11,665 | 9.2% |
| Italian | 1,314 | 1.0% |
| Jamaican | 51 | 0.0% |
| Japanese | 30 | 0.0% |
| Jordanian | 10 | 0.0% |
| Kenyan | 93 | 0.1% |
| Korean | 563 | 0.4% |
| Laotian | 7 | 0.0% |
| Latvian | 16 | 0.0% |
| Lebanese | 42 | 0.0% |
| Lithuanian | 130 | 0.1% |
| Macedonian | 34 | 0.0% |
| Malaysian | 50 | 0.0% |
| Mexican | 17,725 | 14.0% |
| Mexican American Indian | 128 | 0.1% |
| Native Hawaiian | 102 | 0.1% |
| Navajo | 79 | 0.1% |
| New Zealander | 20 | 0.0% |
| Nicaraguan | 31 | 0.0% |
| Nigerian | 63 | 0.1% |
| Northern European | 210 | 0.2% |
| Norwegian | 755 | 0.6% |
| Osage | 87 | 0.1% |
| Pakistani | 23 | 0.0% |
| Palestinian | 8 | 0.0% |
| Panamanian | 8 | 0.0% |
| Paraguayan | 4 | 0.0% |
| Pennsylvania German | 19 | 0.0% |
| Peruvian | 16 | 0.0% |
| Pima | 4 | 0.0% |
| Polish | 1,480 | 1.2% |
| Portuguese | 322 | 0.3% |
| Potawatomi | 532 | 0.4% |
| Puerto Rican | 1,577 | 1.3% |
| Romanian | 43 | 0.0% |
| Russian | 292 | 0.2% |
| Salvadoran | 38 | 0.0% |
| Samoan | 40 | 0.0% |
| Scandinavian | 272 | 0.2% |
| Scotch-Irish | 697 | 0.5% |
| Scottish | 1,730 | 1.4% |
| Shoshone | 18 | 0.0% |
| Sioux | 58 | 0.1% |
| Slovak | 81 | 0.1% |
| South American | 157 | 0.1% |
| South American Indian | 57 | 0.1% |
| Spaniard | 153 | 0.1% |
| Spanish | 189 | 0.2% |
| Sri Lankan | 222 | 0.2% |
| Subsaharan African | 681 | 0.5% |
| Swedish | 1,720 | 1.4% |
| Swiss | 484 | 0.4% |
| Syrian | 13 | 0.0% |
| Thai | 921 | 0.7% |
| Tohono O'Odham | 4 | 0.0% |
| Tongan | 10 | 0.0% |
| Ukrainian | 188 | 0.2% |
| Venezuelan | 29 | 0.0% |
| Vietnamese | 51 | 0.0% |
| Welsh | 639 | 0.5% |
| Yaqui | 35 | 0.0% |
| Yugoslavian | 13 | 0.0% | View All 117 Rows |
Immigrants in Topeka
The most numerous immigrant groups reported in Topeka came from Latin America (4,454 | 3.5%), Central America (4,219 | 3.3%), Mexico (4,090 | 3.2%), Asia (1,700 | 1.3%), and South Central Asia (706 | 0.6%), together accounting for 12.0% of all Topeka residents.
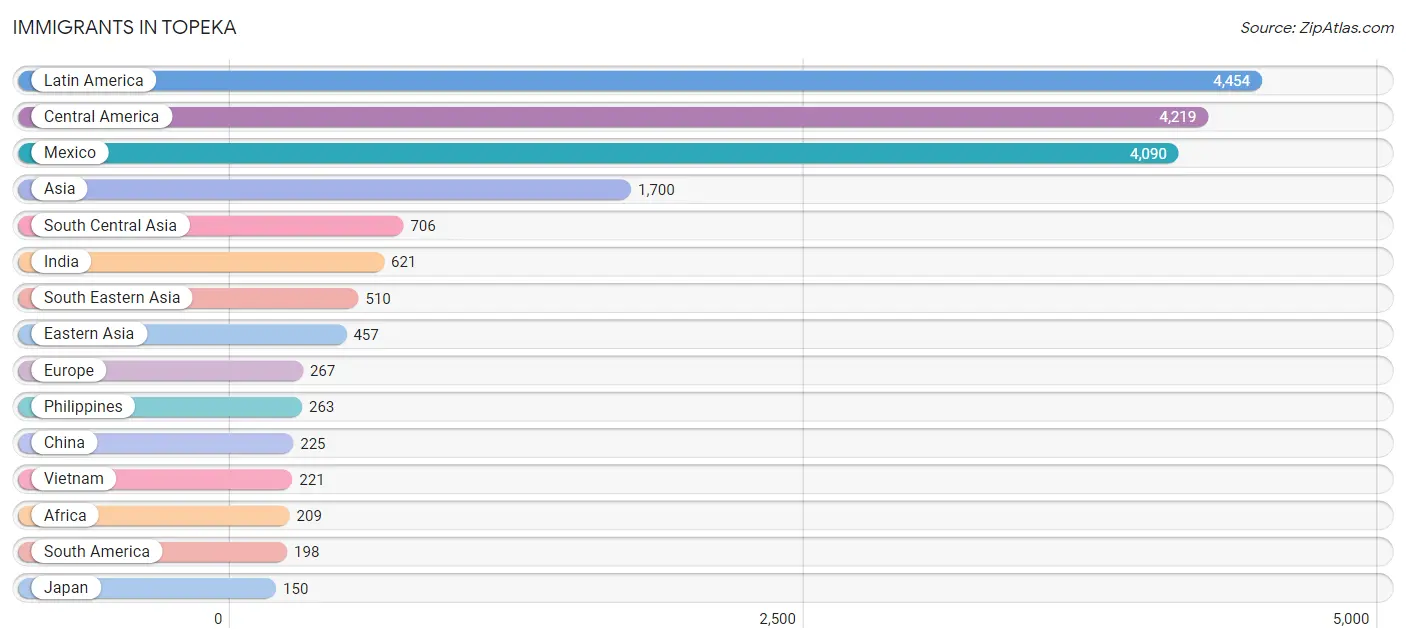
| Immigration Origin | # Population | % Population |
| Africa | 209 | 0.2% |
| Argentina | 15 | 0.0% |
| Asia | 1,700 | 1.3% |
| Azores | 10 | 0.0% |
| Bahamas | 1 | 0.0% |
| Bangladesh | 51 | 0.0% |
| Brazil | 120 | 0.1% |
| Cameroon | 40 | 0.0% |
| Canada | 108 | 0.1% |
| Caribbean | 37 | 0.0% |
| Central America | 4,219 | 3.3% |
| China | 225 | 0.2% |
| Colombia | 25 | 0.0% |
| Costa Rica | 14 | 0.0% |
| Dominican Republic | 14 | 0.0% |
| Eastern Africa | 94 | 0.1% |
| Eastern Asia | 457 | 0.4% |
| Eastern Europe | 48 | 0.0% |
| Ecuador | 11 | 0.0% |
| El Salvador | 29 | 0.0% |
| England | 28 | 0.0% |
| Europe | 267 | 0.2% |
| Germany | 85 | 0.1% |
| Ghana | 26 | 0.0% |
| Guatemala | 86 | 0.1% |
| Haiti | 15 | 0.0% |
| Hong Kong | 46 | 0.0% |
| India | 621 | 0.5% |
| Italy | 31 | 0.0% |
| Jamaica | 7 | 0.0% |
| Japan | 150 | 0.1% |
| Kazakhstan | 17 | 0.0% |
| Kenya | 34 | 0.0% |
| Korea | 82 | 0.1% |
| Laos | 16 | 0.0% |
| Latin America | 4,454 | 3.5% |
| Lebanon | 16 | 0.0% |
| Mexico | 4,090 | 3.2% |
| Micronesia | 76 | 0.1% |
| Middle Africa | 40 | 0.0% |
| Netherlands | 32 | 0.0% |
| Nigeria | 49 | 0.0% |
| Northern Europe | 61 | 0.1% |
| Oceania | 96 | 0.1% |
| Pakistan | 6 | 0.0% |
| Philippines | 263 | 0.2% |
| Poland | 8 | 0.0% |
| Portugal | 10 | 0.0% |
| South America | 198 | 0.2% |
| South Central Asia | 706 | 0.6% |
| South Eastern Asia | 510 | 0.4% |
| Southern Europe | 41 | 0.0% |
| Taiwan | 16 | 0.0% |
| Thailand | 10 | 0.0% |
| Ukraine | 22 | 0.0% |
| Uzbekistan | 11 | 0.0% |
| Venezuela | 19 | 0.0% |
| Vietnam | 221 | 0.2% |
| Western Africa | 75 | 0.1% |
| Western Asia | 27 | 0.0% |
| Western Europe | 117 | 0.1% |
| Zimbabwe | 55 | 0.0% | View All 62 Rows |
Sex and Age in Topeka
Sex and Age in Topeka
The most populous age groups in Topeka are 20 to 24 Years (4,571 | 7.5%) for men and 20 to 24 Years (4,787 | 7.3%) for women.
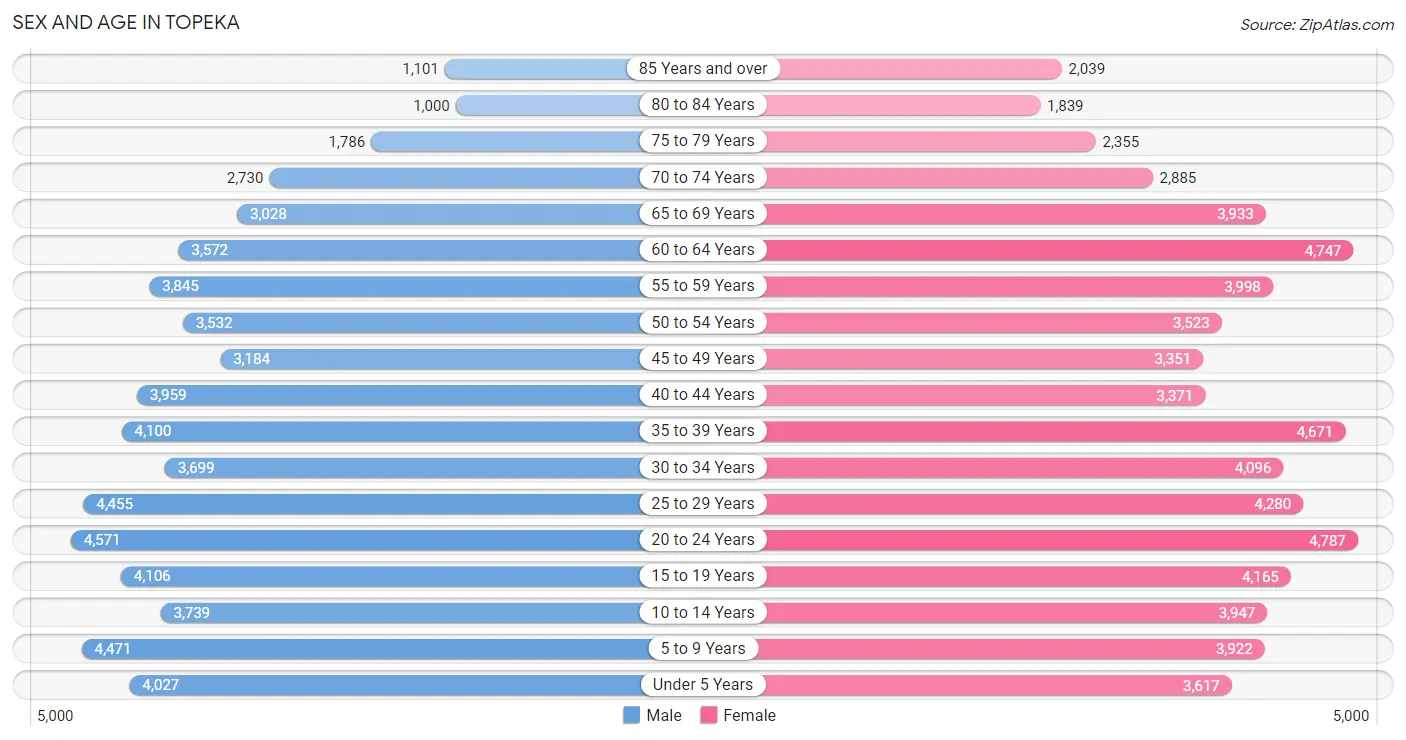
| Age Bracket | Male | Female |
| Under 5 Years | 4,027 (6.6%) | 3,617 (5.5%) |
| 5 to 9 Years | 4,471 (7.3%) | 3,922 (6.0%) |
| 10 to 14 Years | 3,739 (6.1%) | 3,947 (6.0%) |
| 15 to 19 Years | 4,106 (6.7%) | 4,165 (6.4%) |
| 20 to 24 Years | 4,571 (7.5%) | 4,787 (7.3%) |
| 25 to 29 Years | 4,455 (7.3%) | 4,280 (6.5%) |
| 30 to 34 Years | 3,699 (6.1%) | 4,096 (6.2%) |
| 35 to 39 Years | 4,100 (6.7%) | 4,671 (7.1%) |
| 40 to 44 Years | 3,959 (6.5%) | 3,371 (5.1%) |
| 45 to 49 Years | 3,184 (5.2%) | 3,351 (5.1%) |
| 50 to 54 Years | 3,532 (5.8%) | 3,523 (5.4%) |
| 55 to 59 Years | 3,845 (6.3%) | 3,998 (6.1%) |
| 60 to 64 Years | 3,572 (5.9%) | 4,747 (7.2%) |
| 65 to 69 Years | 3,028 (5.0%) | 3,933 (6.0%) |
| 70 to 74 Years | 2,730 (4.5%) | 2,885 (4.4%) |
| 75 to 79 Years | 1,786 (2.9%) | 2,355 (3.6%) |
| 80 to 84 Years | 1,000 (1.6%) | 1,839 (2.8%) |
| 85 Years and over | 1,101 (1.8%) | 2,039 (3.1%) |
| Total | 60,905 (100.0%) | 65,526 (100.0%) |
Families and Households in Topeka
Median Family Size in Topeka
The median family size in Topeka is 3.00 persons per family, with married-couple families (19,447 | 66.0%) accounting for the largest median family size of 3.09 persons per family. On the other hand, single female/mother families (7,375 | 25.0%) represent the smallest median family size with 2.82 persons per family.
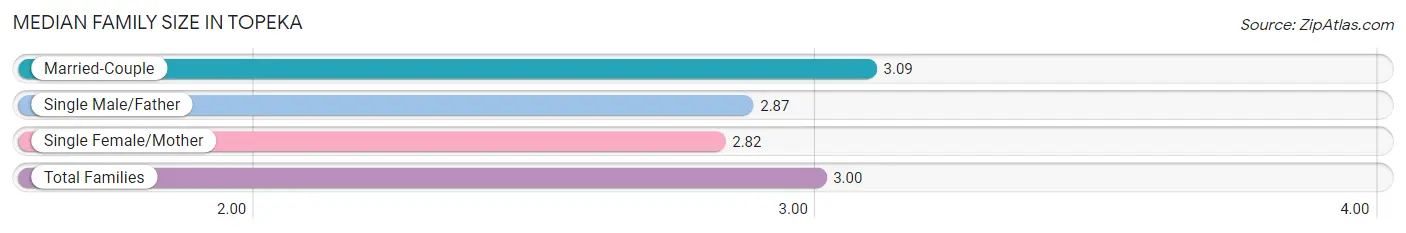
| Family Type | # Families | Family Size |
| Married-Couple | 19,447 (66.0%) | 3.09 |
| Single Male/Father | 2,647 (9.0%) | 2.87 |
| Single Female/Mother | 7,375 (25.0%) | 2.82 |
| Total Families | 29,469 (100.0%) | 3.00 |
Median Household Size in Topeka
The median household size in Topeka is 2.24 persons per household, with single male/father households (2,647 | 4.9%) accounting for the largest median household size of 3.19 persons per household. non-family households (24,809 | 45.7%) represent the smallest median household size with 1.21 persons per household.
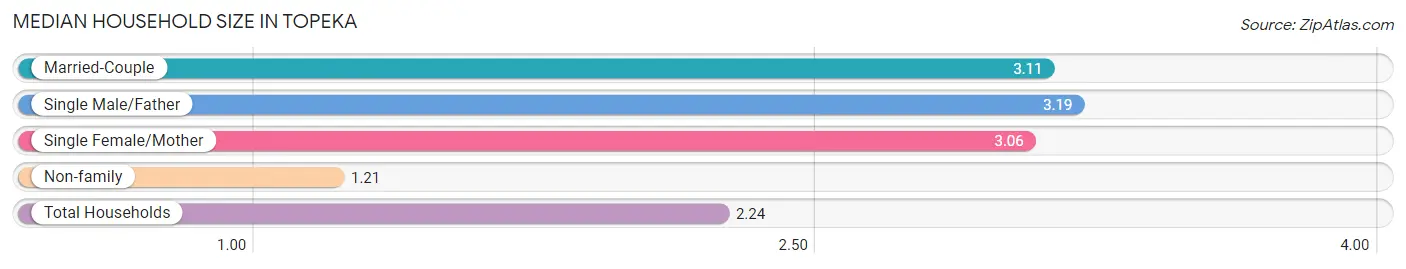
| Household Type | # Households | Household Size |
| Married-Couple | 19,447 (35.8%) | 3.11 |
| Single Male/Father | 2,647 (4.9%) | 3.19 |
| Single Female/Mother | 7,375 (13.6%) | 3.06 |
| Non-family | 24,809 (45.7%) | 1.21 |
| Total Households | 54,278 (100.0%) | 2.24 |
Household Size by Marriage Status in Topeka
Out of a total of 54,278 households in Topeka, 29,469 (54.3%) are family households, while 24,809 (45.7%) are nonfamily households. The most numerous type of family households are 2-person households, comprising 13,950, and the most common type of nonfamily households are 1-person households, comprising 20,858.
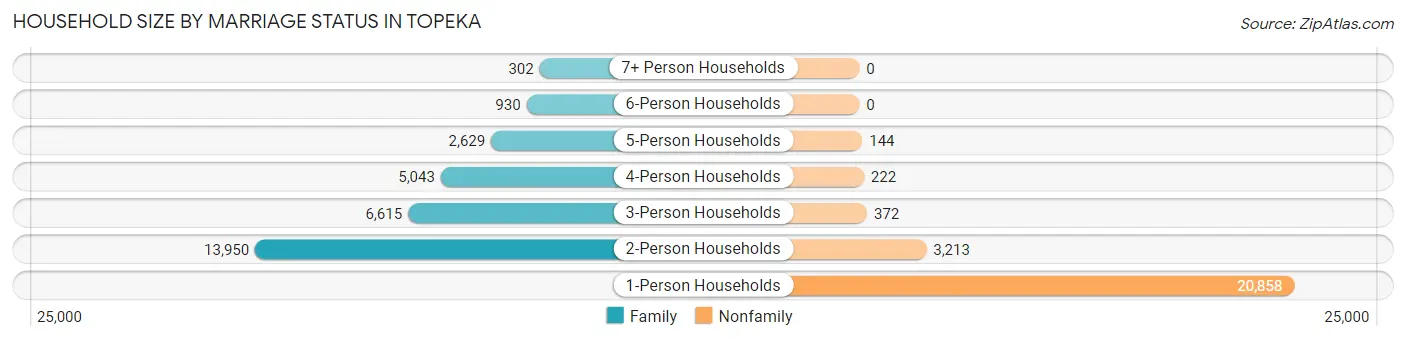
| Household Size | Family Households | Nonfamily Households |
| 1-Person Households | - | 20,858 (38.4%) |
| 2-Person Households | 13,950 (25.7%) | 3,213 (5.9%) |
| 3-Person Households | 6,615 (12.2%) | 372 (0.7%) |
| 4-Person Households | 5,043 (9.3%) | 222 (0.4%) |
| 5-Person Households | 2,629 (4.8%) | 144 (0.3%) |
| 6-Person Households | 930 (1.7%) | 0 (0.0%) |
| 7+ Person Households | 302 (0.6%) | 0 (0.0%) |
| Total | 29,469 (54.3%) | 24,809 (45.7%) |
Female Fertility in Topeka
Fertility by Age in Topeka
Average fertility rate in Topeka is 56.0 births per 1,000 women. Women in the age bracket of 20 to 34 years have the highest fertility rate with 100.0 births per 1,000 women. Women in the age bracket of 20 to 34 years acount for 79.9% of all women with births.
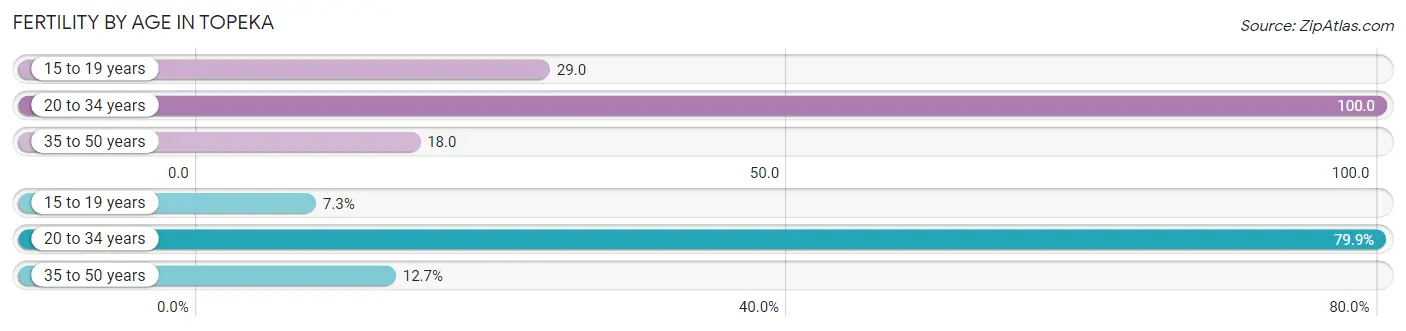
| Age Bracket | Women with Births | Births / 1,000 Women |
| 15 to 19 years | 120 (7.3%) | 29.0 |
| 20 to 34 years | 1,311 (79.9%) | 100.0 |
| 35 to 50 years | 209 (12.7%) | 18.0 |
| Total | 1,640 (100.0%) | 56.0 |
Fertility by Age by Marriage Status in Topeka
53.4% of women with births (1,640) in Topeka are married. The highest percentage of unmarried women with births falls into 20 to 34 years age bracket with 50.2% of them unmarried at the time of birth, while the lowest percentage of unmarried women with births belong to 15 to 19 years age bracket with 23.3% of them unmarried.
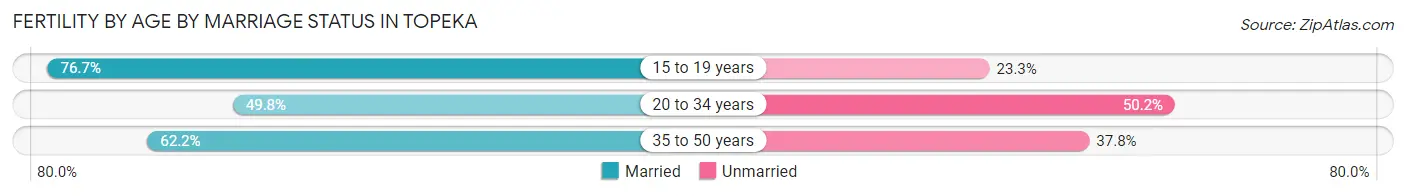
| Age Bracket | Married | Unmarried |
| 15 to 19 years | 92 (76.7%) | 28 (23.3%) |
| 20 to 34 years | 653 (49.8%) | 658 (50.2%) |
| 35 to 50 years | 130 (62.2%) | 79 (37.8%) |
| Total | 876 (53.4%) | 764 (46.6%) |
Fertility by Education in Topeka
Average fertility rate in Topeka is 56.0 births per 1,000 women. Women with the education attainment of high school diploma have the highest fertility rate of 89.0 births per 1,000 women, while women with the education attainment of less than high school have the lowest fertility at 32.0 births per 1,000 women. Women with the education attainment of high school diploma represent 42.1% of all women with births.
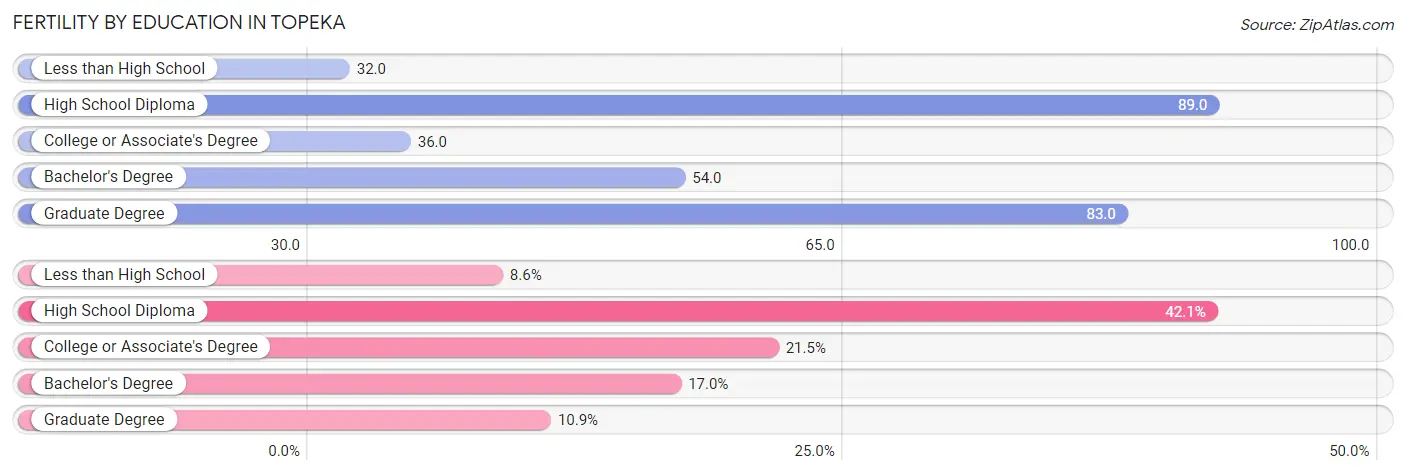
| Educational Attainment | Women with Births | Births / 1,000 Women |
| Less than High School | 141 (8.6%) | 32.0 |
| High School Diploma | 690 (42.1%) | 89.0 |
| College or Associate's Degree | 353 (21.5%) | 36.0 |
| Bachelor's Degree | 278 (17.0%) | 54.0 |
| Graduate Degree | 178 (10.8%) | 83.0 |
| Total | 1,640 (100.0%) | 56.0 |
Fertility by Education by Marriage Status in Topeka
46.6% of women with births in Topeka are unmarried. Women with the educational attainment of graduate degree are most likely to be married with 80.9% of them married at childbirth, while women with the educational attainment of college or associate's degree are least likely to be married with 65.2% of them unmarried at childbirth.
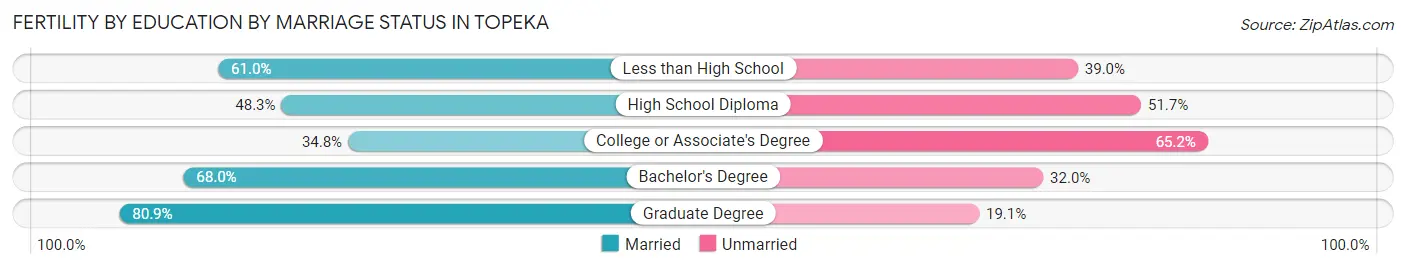
| Educational Attainment | Married | Unmarried |
| Less than High School | 86 (61.0%) | 55 (39.0%) |
| High School Diploma | 333 (48.3%) | 357 (51.7%) |
| College or Associate's Degree | 123 (34.8%) | 230 (65.2%) |
| Bachelor's Degree | 189 (68.0%) | 89 (32.0%) |
| Graduate Degree | 144 (80.9%) | 34 (19.1%) |
| Total | 876 (53.4%) | 764 (46.6%) |
Employment Characteristics in Topeka
Employment by Class of Employer in Topeka
Among the 58,724 employed individuals in Topeka, private company employees (36,273 | 61.8%), not-for-profit organizations (6,472 | 11.0%), and state government employees (5,124 | 8.7%) make up the most common classes of employment.
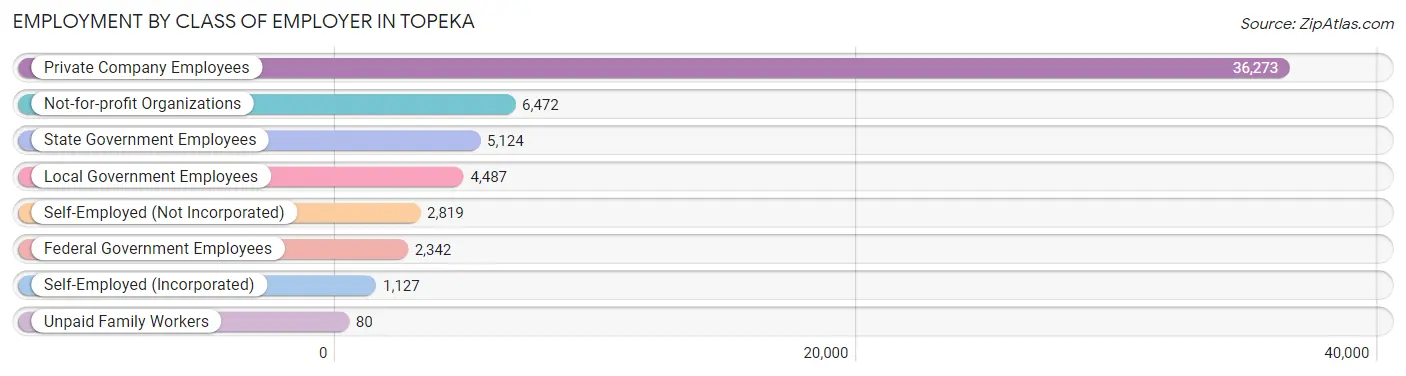
| Employer Class | # Employees | % Employees |
| Private Company Employees | 36,273 | 61.8% |
| Self-Employed (Incorporated) | 1,127 | 1.9% |
| Self-Employed (Not Incorporated) | 2,819 | 4.8% |
| Not-for-profit Organizations | 6,472 | 11.0% |
| Local Government Employees | 4,487 | 7.6% |
| State Government Employees | 5,124 | 8.7% |
| Federal Government Employees | 2,342 | 4.0% |
| Unpaid Family Workers | 80 | 0.1% |
| Total | 58,724 | 100.0% |
Employment Status by Age in Topeka
According to the labor force statistics for Topeka, out of the total population over 16 years of age (101,439), 61.8% or 62,689 individuals are in the labor force, with 5.0% or 3,134 of them unemployed. The age group with the highest labor force participation rate is 35 to 44 years, with 83.1% or 13,380 individuals in the labor force. Within the labor force, the 16 to 19 years age range has the highest percentage of unemployed individuals, with 12.2% or 449 of them being unemployed.
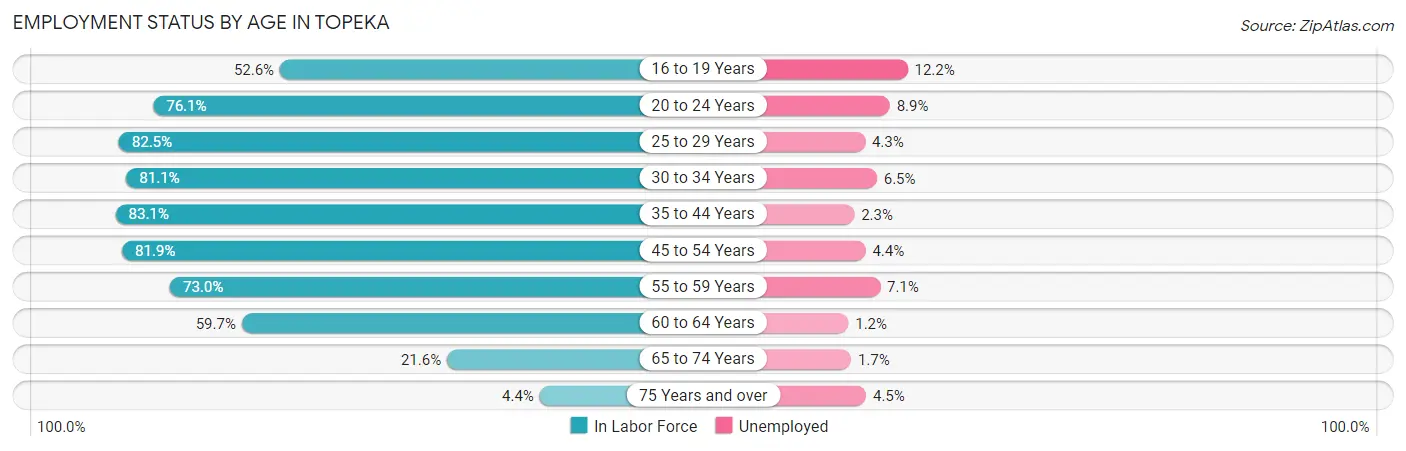
| Age Bracket | In Labor Force | Unemployed |
| 16 to 19 Years | 3,683 (52.6%) | 449 (12.2%) |
| 20 to 24 Years | 7,121 (76.1%) | 634 (8.9%) |
| 25 to 29 Years | 7,206 (82.5%) | 310 (4.3%) |
| 30 to 34 Years | 6,322 (81.1%) | 411 (6.5%) |
| 35 to 44 Years | 13,380 (83.1%) | 308 (2.3%) |
| 45 to 54 Years | 11,130 (81.9%) | 490 (4.4%) |
| 55 to 59 Years | 5,725 (73.0%) | 406 (7.1%) |
| 60 to 64 Years | 4,966 (59.7%) | 60 (1.2%) |
| 65 to 74 Years | 2,716 (21.6%) | 46 (1.7%) |
| 75 Years and over | 445 (4.4%) | 20 (4.5%) |
| Total | 62,689 (61.8%) | 3,134 (5.0%) |
Employment Status by Educational Attainment in Topeka
According to labor force statistics for Topeka, 78.1% of individuals (48,721) out of the total population between 25 and 64 years of age (62,383) are in the labor force, with 4.1% or 1,998 of them being unemployed. The group with the highest labor force participation rate are those with the educational attainment of bachelor's degree or higher, with 89.2% or 15,753 individuals in the labor force. Within the labor force, individuals with less than high school education have the highest percentage of unemployment, with 10.3% or 350 of them being unemployed.
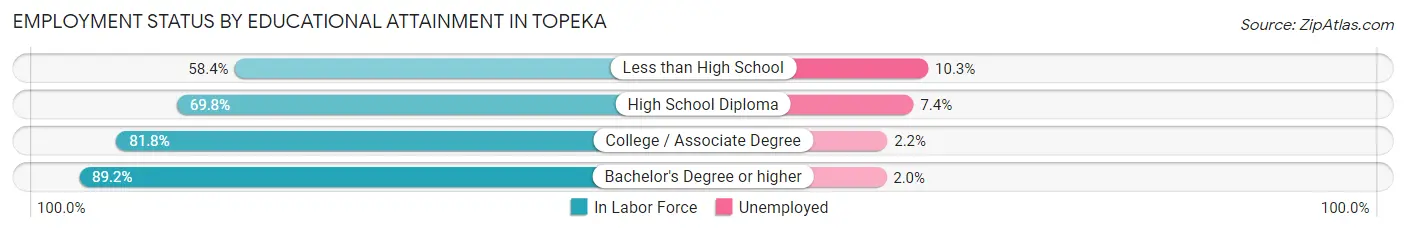
| Educational Attainment | In Labor Force | Unemployed |
| Less than High School | 3,397 (58.4%) | 599 (10.3%) |
| High School Diploma | 13,066 (69.8%) | 1,385 (7.4%) |
| College / Associate Degree | 16,514 (81.8%) | 444 (2.2%) |
| Bachelor's Degree or higher | 15,753 (89.2%) | 353 (2.0%) |
| Total | 48,721 (78.1%) | 2,558 (4.1%) |
Employment Occupations by Sex in Topeka
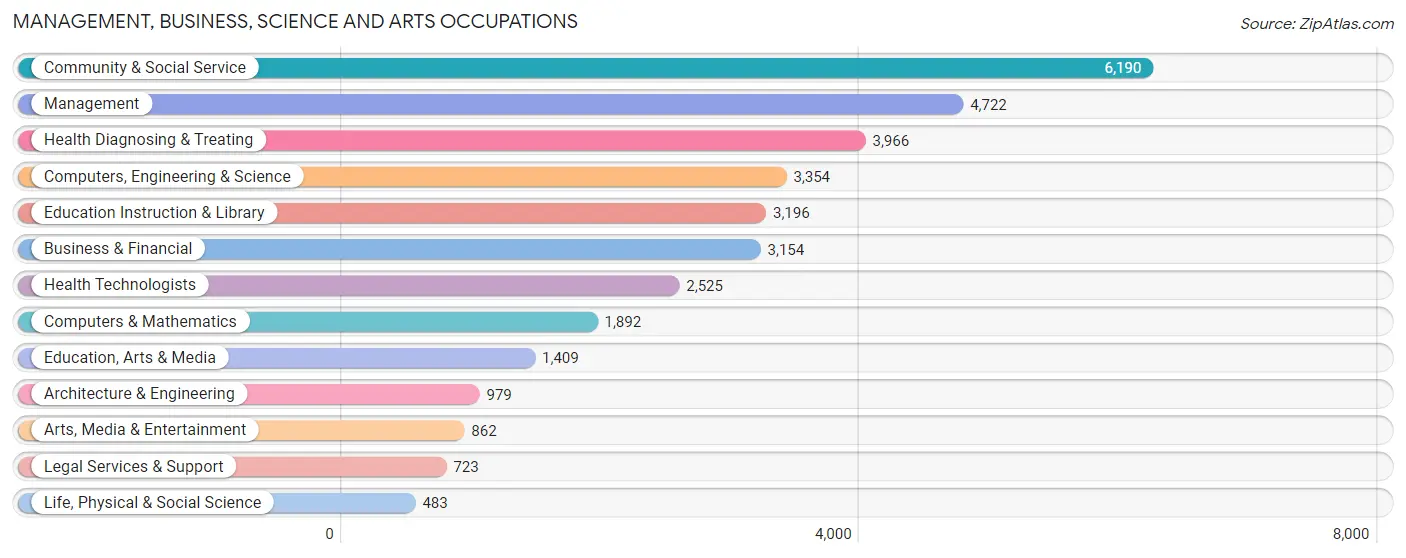
Management, Business, Science and Arts Occupations
The most common Management, Business, Science and Arts occupations in Topeka are Community & Social Service (6,190 | 10.4%), Management (4,722 | 8.0%), Health Diagnosing & Treating (3,966 | 6.7%), Computers, Engineering & Science (3,354 | 5.7%), and Education Instruction & Library (3,196 | 5.4%).
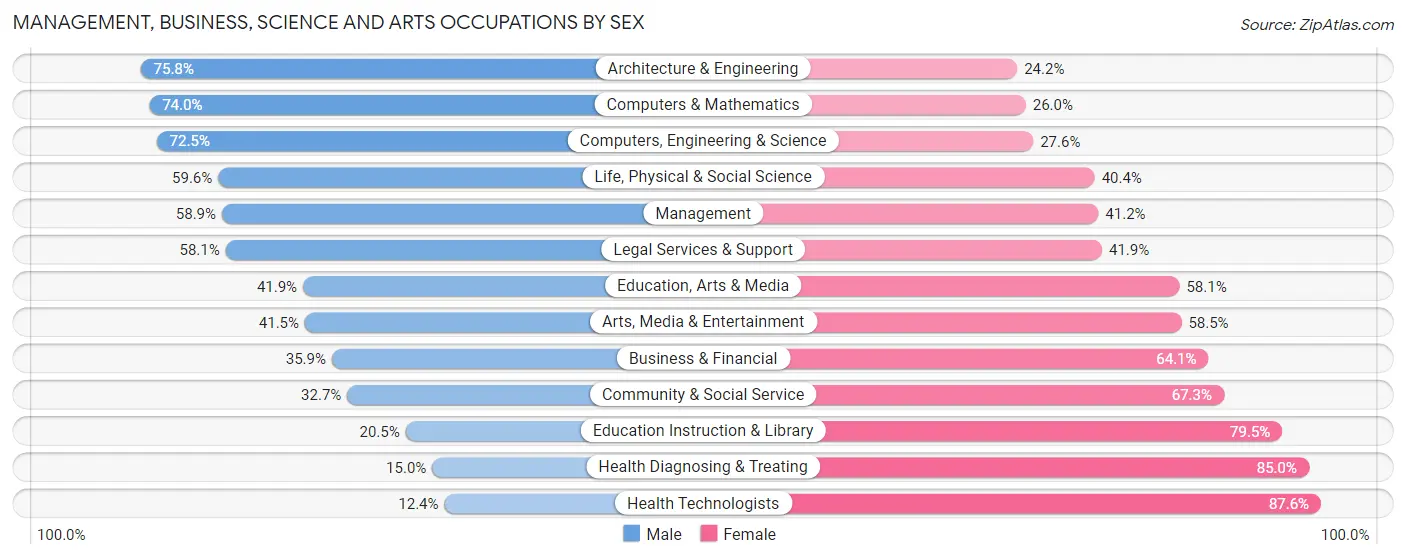
Management, Business, Science and Arts Occupations by Sex
Within the Management, Business, Science and Arts occupations in Topeka, the most male-oriented occupations are Architecture & Engineering (75.8%), Computers & Mathematics (74.0%), and Computers, Engineering & Science (72.5%), while the most female-oriented occupations are Health Technologists (87.6%), Health Diagnosing & Treating (85.0%), and Education Instruction & Library (79.5%).
| Occupation | Male | Female |
| Management | 2,779 (58.9%) | 1,943 (41.1%) |
| Business & Financial | 1,133 (35.9%) | 2,021 (64.1%) |
| Computers, Engineering & Science | 2,430 (72.5%) | 924 (27.6%) |
| Computers & Mathematics | 1,400 (74.0%) | 492 (26.0%) |
| Architecture & Engineering | 742 (75.8%) | 237 (24.2%) |
| Life, Physical & Social Science | 288 (59.6%) | 195 (40.4%) |
| Community & Social Service | 2,025 (32.7%) | 4,165 (67.3%) |
| Education, Arts & Media | 591 (41.9%) | 818 (58.1%) |
| Legal Services & Support | 420 (58.1%) | 303 (41.9%) |
| Education Instruction & Library | 656 (20.5%) | 2,540 (79.5%) |
| Arts, Media & Entertainment | 358 (41.5%) | 504 (58.5%) |
| Health Diagnosing & Treating | 594 (15.0%) | 3,372 (85.0%) |
| Health Technologists | 314 (12.4%) | 2,211 (87.6%) |
| Total (Category) | 8,961 (41.9%) | 12,425 (58.1%) |
| Total (Overall) | 30,008 (50.6%) | 29,327 (49.4%) |
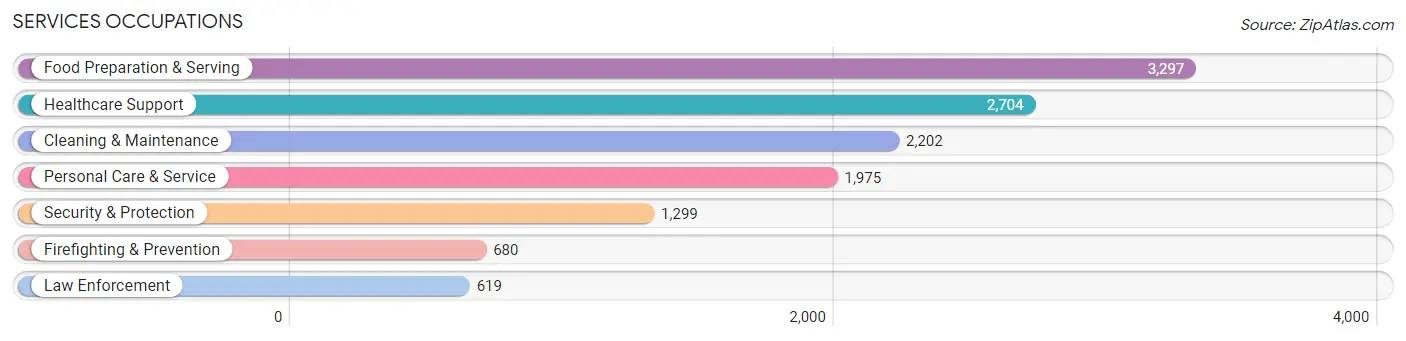
Services Occupations
The most common Services occupations in Topeka are Food Preparation & Serving (3,297 | 5.6%), Healthcare Support (2,704 | 4.6%), Cleaning & Maintenance (2,202 | 3.7%), Personal Care & Service (1,975 | 3.3%), and Security & Protection (1,299 | 2.2%).
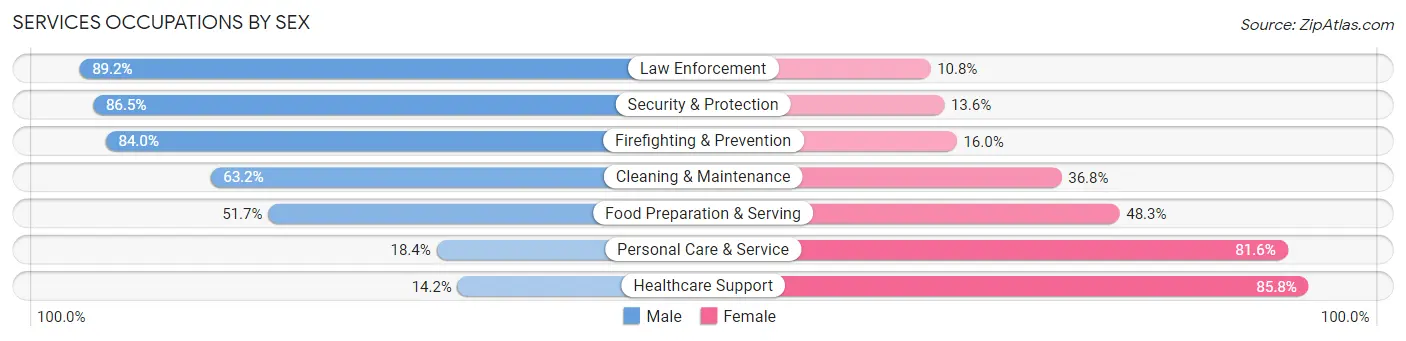
Services Occupations by Sex
Within the Services occupations in Topeka, the most male-oriented occupations are Law Enforcement (89.2%), Security & Protection (86.5%), and Firefighting & Prevention (84.0%), while the most female-oriented occupations are Healthcare Support (85.8%), Personal Care & Service (81.6%), and Food Preparation & Serving (48.3%).
| Occupation | Male | Female |
| Healthcare Support | 385 (14.2%) | 2,319 (85.8%) |
| Security & Protection | 1,123 (86.5%) | 176 (13.6%) |
| Firefighting & Prevention | 571 (84.0%) | 109 (16.0%) |
| Law Enforcement | 552 (89.2%) | 67 (10.8%) |
| Food Preparation & Serving | 1,706 (51.7%) | 1,591 (48.3%) |
| Cleaning & Maintenance | 1,392 (63.2%) | 810 (36.8%) |
| Personal Care & Service | 364 (18.4%) | 1,611 (81.6%) |
| Total (Category) | 4,970 (43.3%) | 6,507 (56.7%) |
| Total (Overall) | 30,008 (50.6%) | 29,327 (49.4%) |
Sales and Office Occupations
The most common Sales and Office occupations in Topeka are Office & Administration (7,285 | 12.3%), and Sales & Related (4,970 | 8.4%).

Sales and Office Occupations by Sex
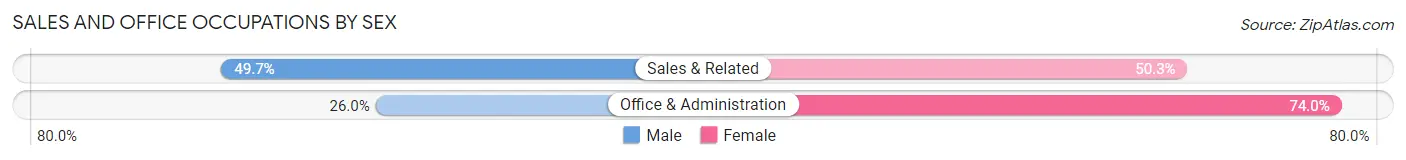
| Occupation | Male | Female |
| Sales & Related | 2,471 (49.7%) | 2,499 (50.3%) |
| Office & Administration | 1,895 (26.0%) | 5,390 (74.0%) |
| Total (Category) | 4,366 (35.6%) | 7,889 (64.4%) |
| Total (Overall) | 30,008 (50.6%) | 29,327 (49.4%) |
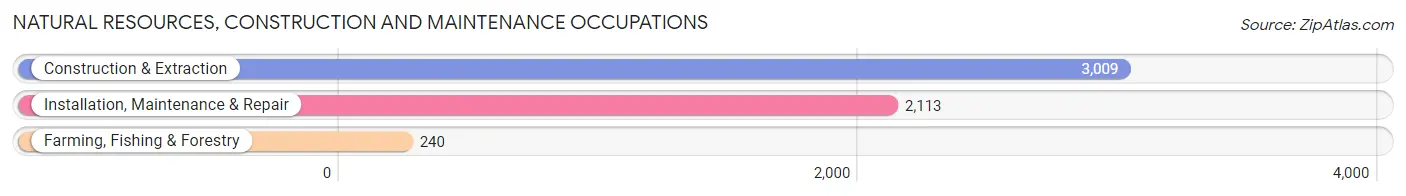
Natural Resources, Construction and Maintenance Occupations
The most common Natural Resources, Construction and Maintenance occupations in Topeka are Construction & Extraction (3,009 | 5.1%), Installation, Maintenance & Repair (2,113 | 3.6%), and Farming, Fishing & Forestry (240 | 0.4%).
Natural Resources, Construction and Maintenance Occupations by Sex
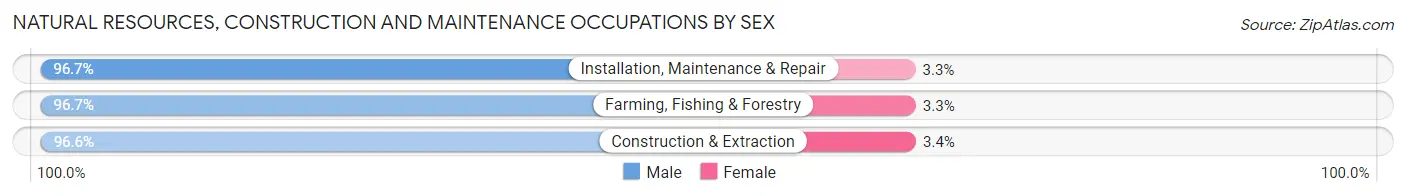
| Occupation | Male | Female |
| Farming, Fishing & Forestry | 232 (96.7%) | 8 (3.3%) |
| Construction & Extraction | 2,908 (96.6%) | 101 (3.4%) |
| Installation, Maintenance & Repair | 2,044 (96.7%) | 69 (3.3%) |
| Total (Category) | 5,184 (96.7%) | 178 (3.3%) |
| Total (Overall) | 30,008 (50.6%) | 29,327 (49.4%) |
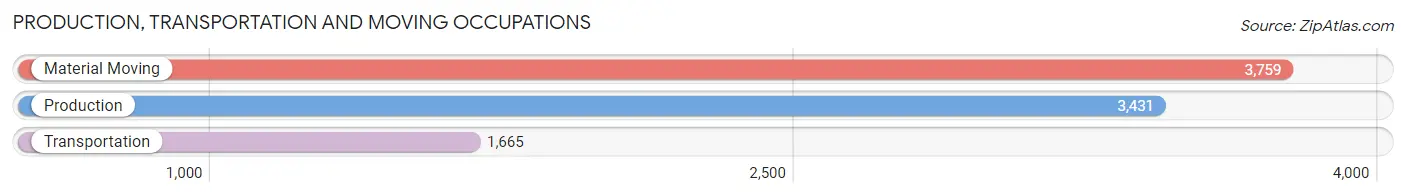
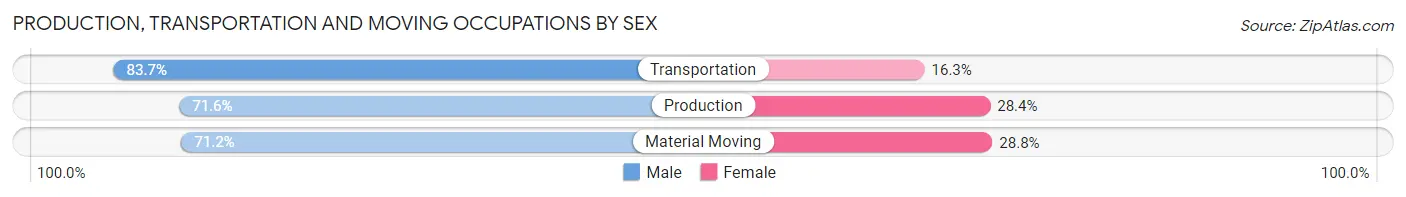
Production, Transportation and Moving Occupations
The most common Production, Transportation and Moving occupations in Topeka are Material Moving (3,759 | 6.3%), Production (3,431 | 5.8%), and Transportation (1,665 | 2.8%).
Production, Transportation and Moving Occupations by Sex
| Occupation | Male | Female |
| Production | 2,457 (71.6%) | 974 (28.4%) |
| Transportation | 1,393 (83.7%) | 272 (16.3%) |
| Material Moving | 2,677 (71.2%) | 1,082 (28.8%) |
| Total (Category) | 6,527 (73.7%) | 2,328 (26.3%) |
| Total (Overall) | 30,008 (50.6%) | 29,327 (49.4%) |
Employment Industries by Sex in Topeka
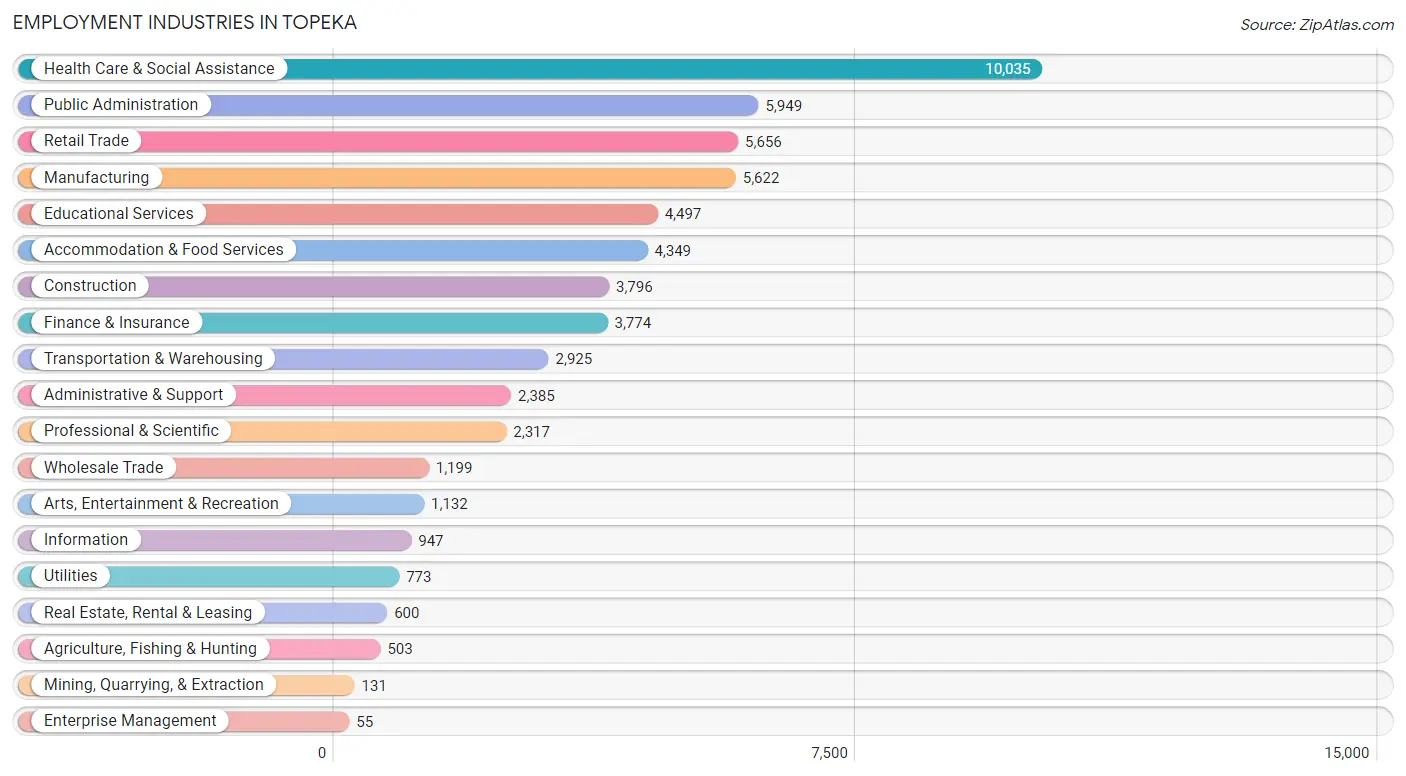
Employment Industries in Topeka
The major employment industries in Topeka include Health Care & Social Assistance (10,035 | 16.9%), Public Administration (5,949 | 10.0%), Retail Trade (5,656 | 9.5%), Manufacturing (5,622 | 9.5%), and Educational Services (4,497 | 7.6%).
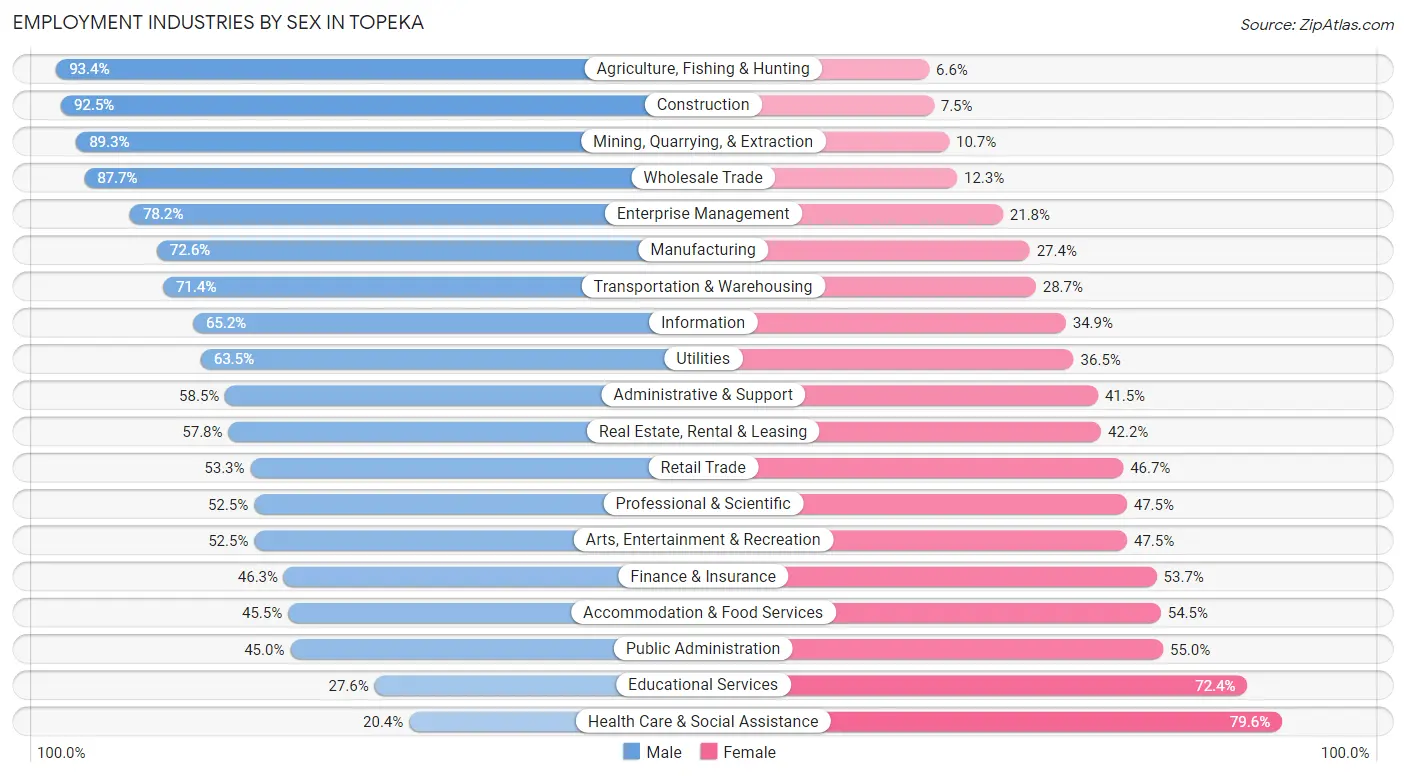
Employment Industries by Sex in Topeka
The Topeka industries that see more men than women are Agriculture, Fishing & Hunting (93.4%), Construction (92.5%), and Mining, Quarrying, & Extraction (89.3%), whereas the industries that tend to have a higher number of women are Health Care & Social Assistance (79.6%), Educational Services (72.4%), and Public Administration (55.0%).
| Industry | Male | Female |
| Agriculture, Fishing & Hunting | 470 (93.4%) | 33 (6.6%) |
| Mining, Quarrying, & Extraction | 117 (89.3%) | 14 (10.7%) |
| Construction | 3,510 (92.5%) | 286 (7.5%) |
| Manufacturing | 4,082 (72.6%) | 1,540 (27.4%) |
| Wholesale Trade | 1,051 (87.7%) | 148 (12.3%) |
| Retail Trade | 3,013 (53.3%) | 2,643 (46.7%) |
| Transportation & Warehousing | 2,087 (71.4%) | 838 (28.6%) |
| Utilities | 491 (63.5%) | 282 (36.5%) |
| Information | 617 (65.1%) | 330 (34.8%) |
| Finance & Insurance | 1,749 (46.3%) | 2,025 (53.7%) |
| Real Estate, Rental & Leasing | 347 (57.8%) | 253 (42.2%) |
| Professional & Scientific | 1,217 (52.5%) | 1,100 (47.5%) |
| Enterprise Management | 43 (78.2%) | 12 (21.8%) |
| Administrative & Support | 1,395 (58.5%) | 990 (41.5%) |
| Educational Services | 1,240 (27.6%) | 3,257 (72.4%) |
| Health Care & Social Assistance | 2,048 (20.4%) | 7,987 (79.6%) |
| Arts, Entertainment & Recreation | 594 (52.5%) | 538 (47.5%) |
| Accommodation & Food Services | 1,978 (45.5%) | 2,371 (54.5%) |
| Public Administration | 2,678 (45.0%) | 3,271 (55.0%) |
| Total | 30,008 (50.6%) | 29,327 (49.4%) |
Education in Topeka
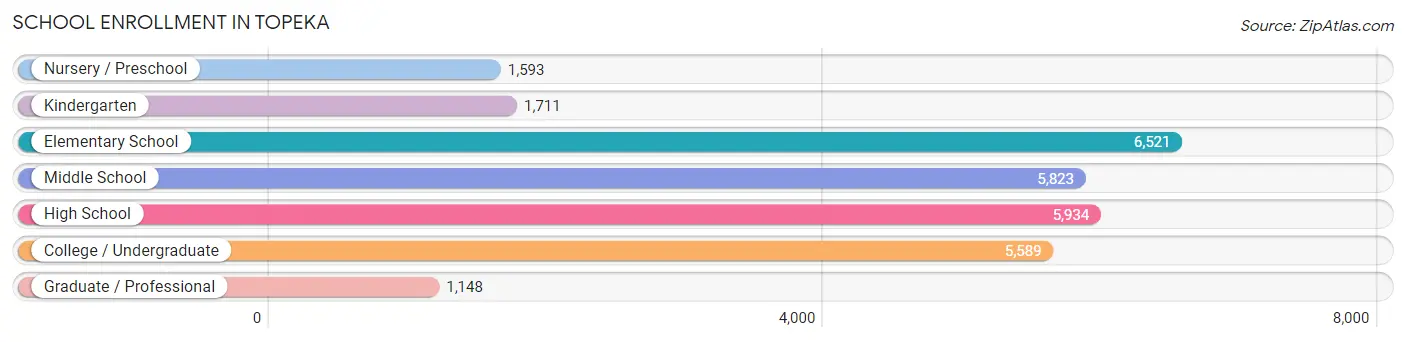
School Enrollment in Topeka
The most common levels of schooling among the 28,319 students in Topeka are elementary school (6,521 | 23.0%), high school (5,934 | 20.9%), and middle school (5,823 | 20.6%).
| School Level | # Students | % Students |
| Nursery / Preschool | 1,593 | 5.6% |
| Kindergarten | 1,711 | 6.0% |
| Elementary School | 6,521 | 23.0% |
| Middle School | 5,823 | 20.6% |
| High School | 5,934 | 20.9% |
| College / Undergraduate | 5,589 | 19.7% |
| Graduate / Professional | 1,148 | 4.1% |
| Total | 28,319 | 100.0% |
School Enrollment by Age by Funding Source in Topeka
Out of a total of 28,319 students who are enrolled in schools in Topeka, 3,285 (11.6%) attend a private institution, while the remaining 25,034 (88.4%) are enrolled in public schools. The age group of 3 to 4 year olds has the highest likelihood of being enrolled in private schools, with 433 (33.4% in the age bracket) enrolled. Conversely, the age group of 18 to 19 year olds has the lowest likelihood of being enrolled in a private school, with 1,841 (93.2% in the age bracket) attending a public institution.
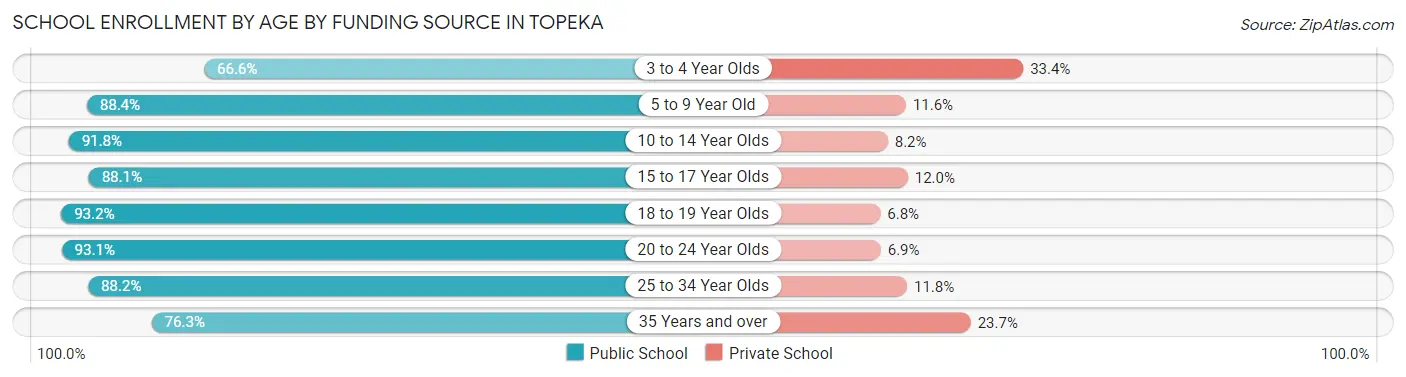
| Age Bracket | Public School | Private School |
| 3 to 4 Year Olds | 862 (66.6%) | 433 (33.4%) |
| 5 to 9 Year Old | 6,734 (88.4%) | 884 (11.6%) |
| 10 to 14 Year Olds | 6,646 (91.8%) | 595 (8.2%) |
| 15 to 17 Year Olds | 3,965 (88.0%) | 538 (11.9%) |
| 18 to 19 Year Olds | 1,841 (93.2%) | 135 (6.8%) |
| 20 to 24 Year Olds | 2,656 (93.1%) | 197 (6.9%) |
| 25 to 34 Year Olds | 1,202 (88.2%) | 161 (11.8%) |
| 35 Years and over | 1,122 (76.3%) | 348 (23.7%) |
| Total | 25,034 (88.4%) | 3,285 (11.6%) |
Educational Attainment by Field of Study in Topeka
Business (5,384 | 20.3%), education (4,468 | 16.8%), science & technology (3,168 | 11.9%), arts & humanities (2,347 | 8.8%), and social sciences (1,711 | 6.5%) are the most common fields of study among 26,535 individuals in Topeka who have obtained a bachelor's degree or higher.
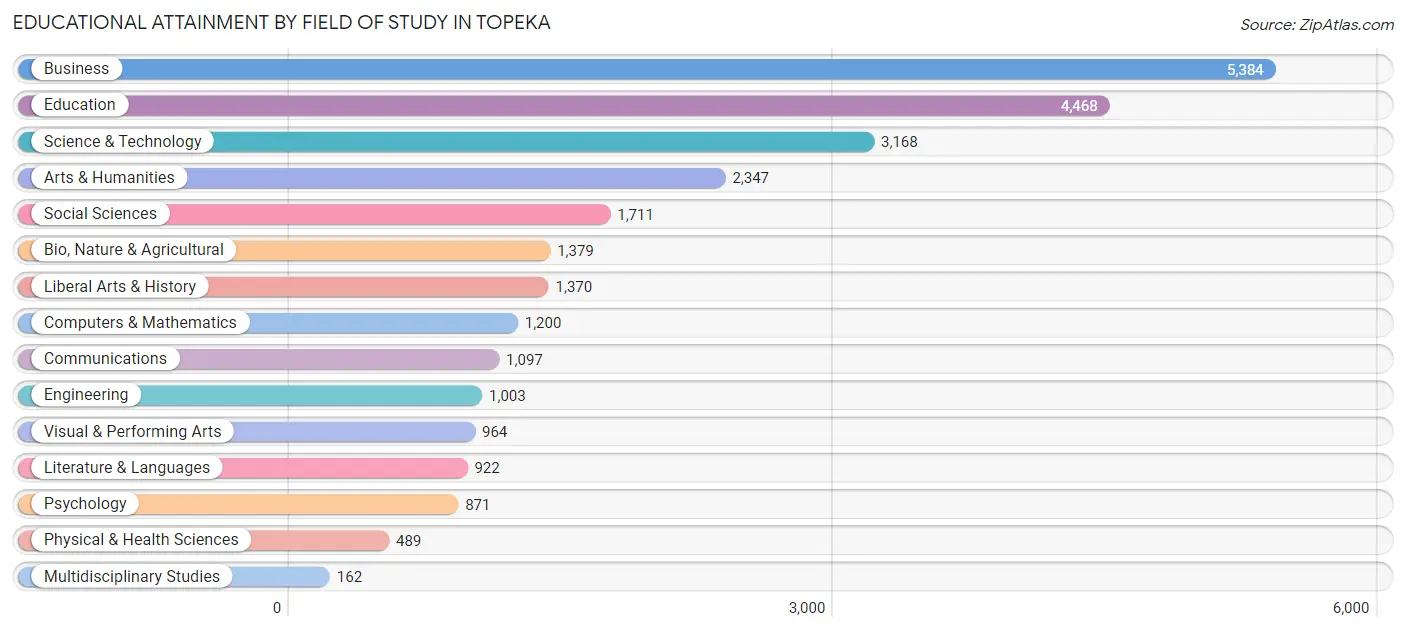
| Field of Study | # Graduates | % Graduates |
| Computers & Mathematics | 1,200 | 4.5% |
| Bio, Nature & Agricultural | 1,379 | 5.2% |
| Physical & Health Sciences | 489 | 1.8% |
| Psychology | 871 | 3.3% |
| Social Sciences | 1,711 | 6.5% |
| Engineering | 1,003 | 3.8% |
| Multidisciplinary Studies | 162 | 0.6% |
| Science & Technology | 3,168 | 11.9% |
| Business | 5,384 | 20.3% |
| Education | 4,468 | 16.8% |
| Literature & Languages | 922 | 3.5% |
| Liberal Arts & History | 1,370 | 5.2% |
| Visual & Performing Arts | 964 | 3.6% |
| Communications | 1,097 | 4.1% |
| Arts & Humanities | 2,347 | 8.8% |
| Total | 26,535 | 100.0% |
Transportation & Commute in Topeka
Vehicle Availability by Sex in Topeka
The most prevalent vehicle ownership categories in Topeka are males with 2 vehicles (13,438, accounting for 45.4%) and females with 2 vehicles (12,138, making up 47.0%).
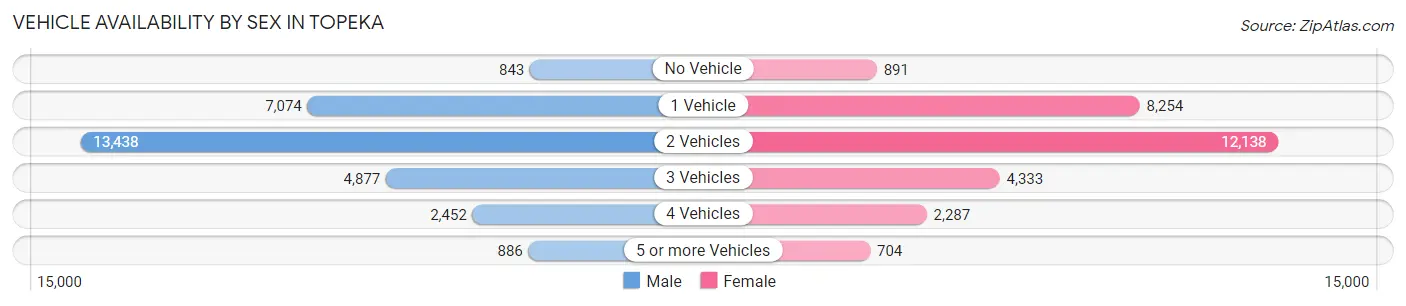
| Vehicles Available | Male | Female |
| No Vehicle | 843 (2.9%) | 891 (3.1%) |
| 1 Vehicle | 7,074 (23.9%) | 8,254 (28.8%) |
| 2 Vehicles | 13,438 (45.4%) | 12,138 (42.4%) |
| 3 Vehicles | 4,877 (16.5%) | 4,333 (15.1%) |
| 4 Vehicles | 2,452 (8.3%) | 2,287 (8.0%) |
| 5 or more Vehicles | 886 (3.0%) | 704 (2.5%) |
| Total | 29,570 (100.0%) | 28,607 (100.0%) |
Commute Time in Topeka
The most frequently occuring commute durations in Topeka are 15 to 19 minutes (14,879 commuters, 27.7%), 10 to 14 minutes (14,105 commuters, 26.3%), and 5 to 9 minutes (7,894 commuters, 14.7%).
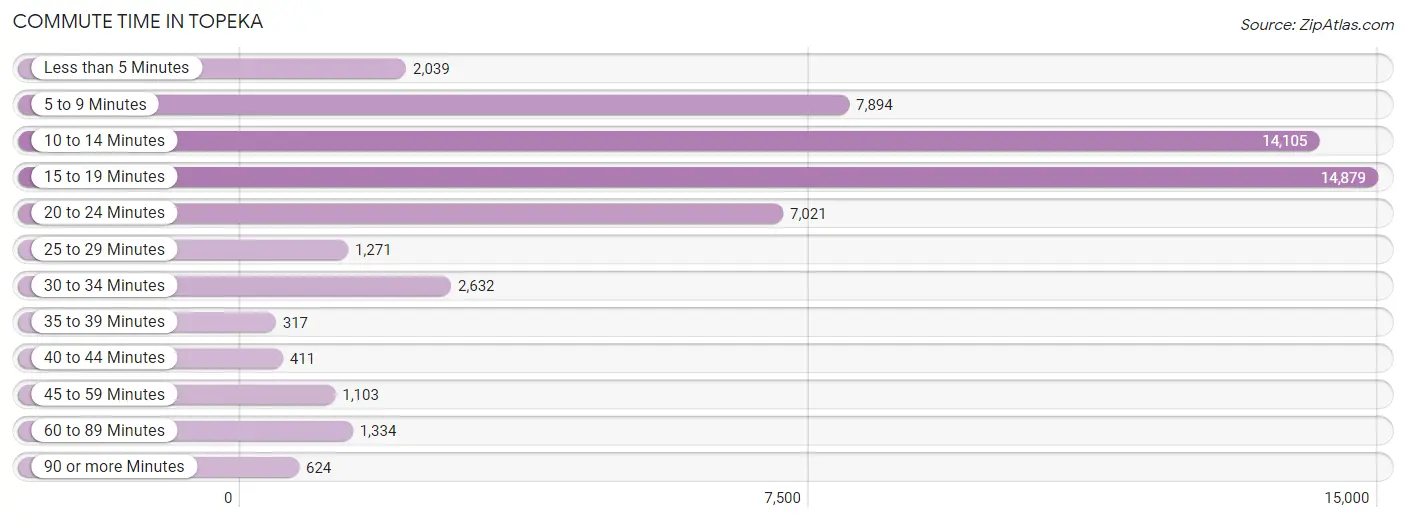
| Commute Time | # Commuters | % Commuters |
| Less than 5 Minutes | 2,039 | 3.8% |
| 5 to 9 Minutes | 7,894 | 14.7% |
| 10 to 14 Minutes | 14,105 | 26.3% |
| 15 to 19 Minutes | 14,879 | 27.7% |
| 20 to 24 Minutes | 7,021 | 13.1% |
| 25 to 29 Minutes | 1,271 | 2.4% |
| 30 to 34 Minutes | 2,632 | 4.9% |
| 35 to 39 Minutes | 317 | 0.6% |
| 40 to 44 Minutes | 411 | 0.8% |
| 45 to 59 Minutes | 1,103 | 2.1% |
| 60 to 89 Minutes | 1,334 | 2.5% |
| 90 or more Minutes | 624 | 1.2% |
Commute Time by Sex in Topeka
The most common commute times in Topeka are 15 to 19 minutes (7,933 commuters, 28.9%) for males and 10 to 14 minutes (7,014 commuters, 26.8%) for females.
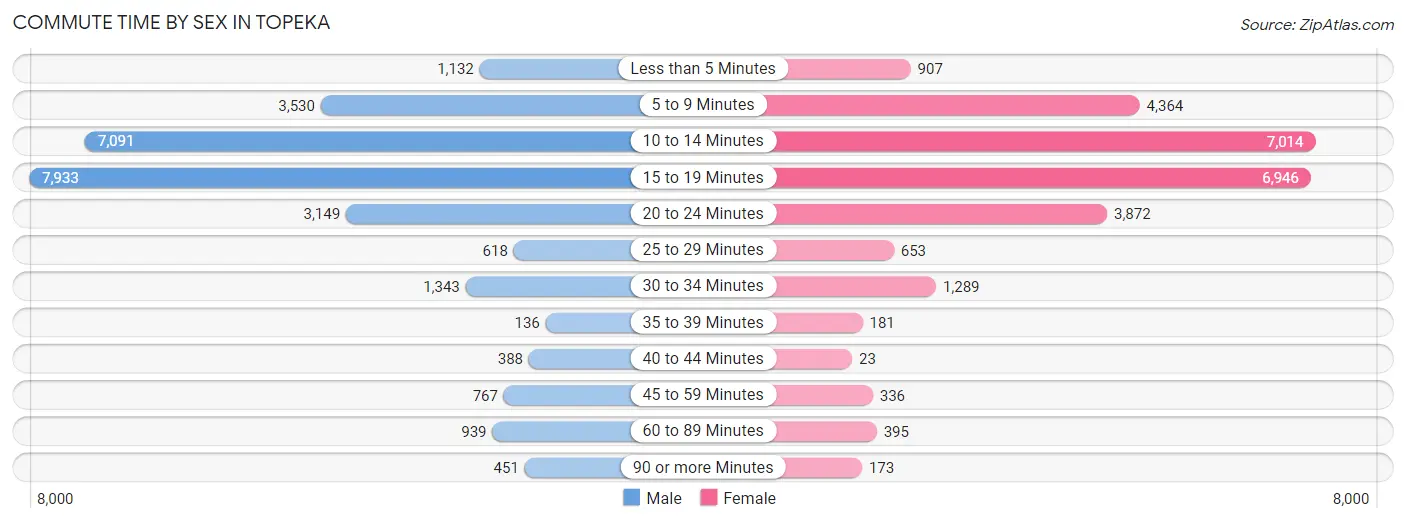
| Commute Time | Male | Female |
| Less than 5 Minutes | 1,132 (4.1%) | 907 (3.5%) |
| 5 to 9 Minutes | 3,530 (12.9%) | 4,364 (16.7%) |
| 10 to 14 Minutes | 7,091 (25.8%) | 7,014 (26.8%) |
| 15 to 19 Minutes | 7,933 (28.9%) | 6,946 (26.6%) |
| 20 to 24 Minutes | 3,149 (11.5%) | 3,872 (14.8%) |
| 25 to 29 Minutes | 618 (2.2%) | 653 (2.5%) |
| 30 to 34 Minutes | 1,343 (4.9%) | 1,289 (4.9%) |
| 35 to 39 Minutes | 136 (0.5%) | 181 (0.7%) |
| 40 to 44 Minutes | 388 (1.4%) | 23 (0.1%) |
| 45 to 59 Minutes | 767 (2.8%) | 336 (1.3%) |
| 60 to 89 Minutes | 939 (3.4%) | 395 (1.5%) |
| 90 or more Minutes | 451 (1.6%) | 173 (0.7%) |
Time of Departure to Work by Sex in Topeka
The most frequent times of departure to work in Topeka are 7:30 AM to 7:59 AM (5,643, 20.5%) for males and 7:30 AM to 7:59 AM (7,226, 27.6%) for females.
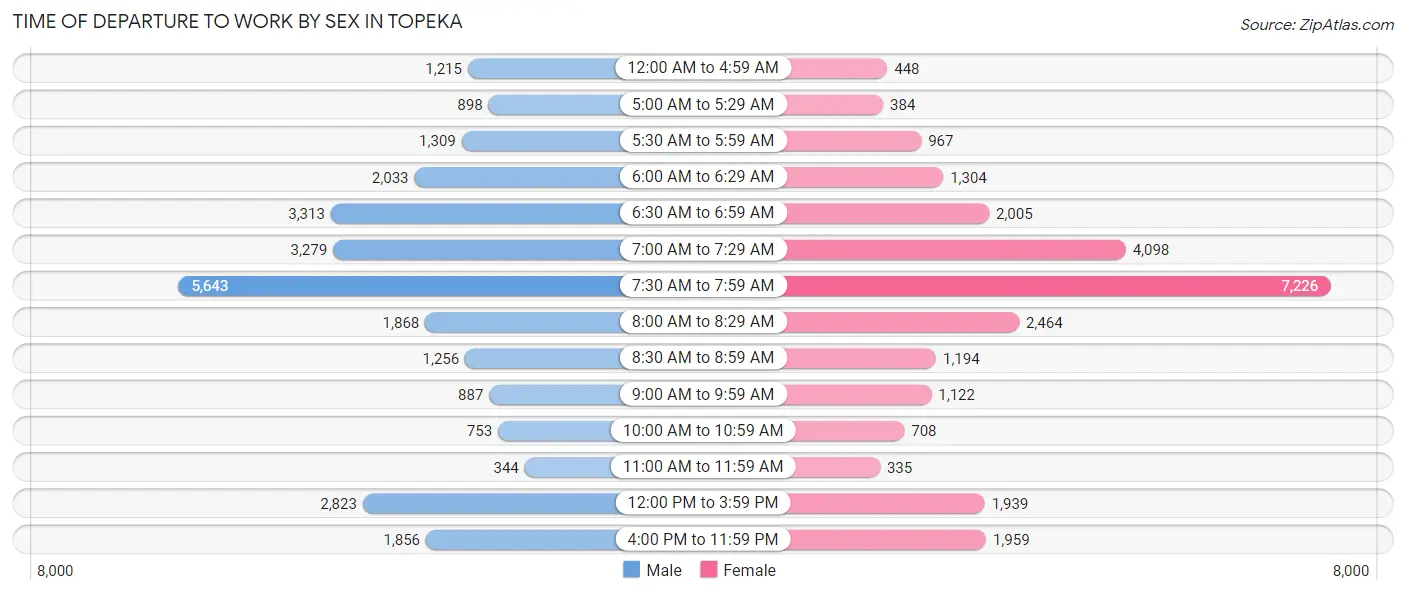
| Time of Departure | Male | Female |
| 12:00 AM to 4:59 AM | 1,215 (4.4%) | 448 (1.7%) |
| 5:00 AM to 5:29 AM | 898 (3.3%) | 384 (1.5%) |
| 5:30 AM to 5:59 AM | 1,309 (4.8%) | 967 (3.7%) |
| 6:00 AM to 6:29 AM | 2,033 (7.4%) | 1,304 (5.0%) |
| 6:30 AM to 6:59 AM | 3,313 (12.1%) | 2,005 (7.7%) |
| 7:00 AM to 7:29 AM | 3,279 (11.9%) | 4,098 (15.7%) |
| 7:30 AM to 7:59 AM | 5,643 (20.5%) | 7,226 (27.6%) |
| 8:00 AM to 8:29 AM | 1,868 (6.8%) | 2,464 (9.4%) |
| 8:30 AM to 8:59 AM | 1,256 (4.6%) | 1,194 (4.6%) |
| 9:00 AM to 9:59 AM | 887 (3.2%) | 1,122 (4.3%) |
| 10:00 AM to 10:59 AM | 753 (2.7%) | 708 (2.7%) |
| 11:00 AM to 11:59 AM | 344 (1.3%) | 335 (1.3%) |
| 12:00 PM to 3:59 PM | 2,823 (10.3%) | 1,939 (7.4%) |
| 4:00 PM to 11:59 PM | 1,856 (6.8%) | 1,959 (7.5%) |
| Total | 27,477 (100.0%) | 26,153 (100.0%) |
Housing Occupancy in Topeka
Occupancy by Ownership in Topeka
Of the total 54,278 dwellings in Topeka, owner-occupied units account for 32,039 (59.0%), while renter-occupied units make up 22,239 (41.0%).
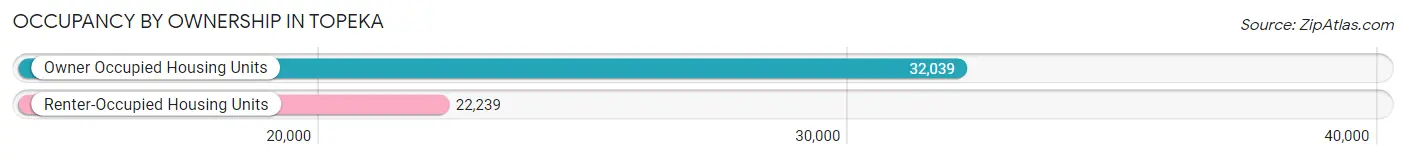
| Occupancy | # Housing Units | % Housing Units |
| Owner Occupied Housing Units | 32,039 | 59.0% |
| Renter-Occupied Housing Units | 22,239 | 41.0% |
| Total Occupied Housing Units | 54,278 | 100.0% |
Occupancy by Household Size in Topeka
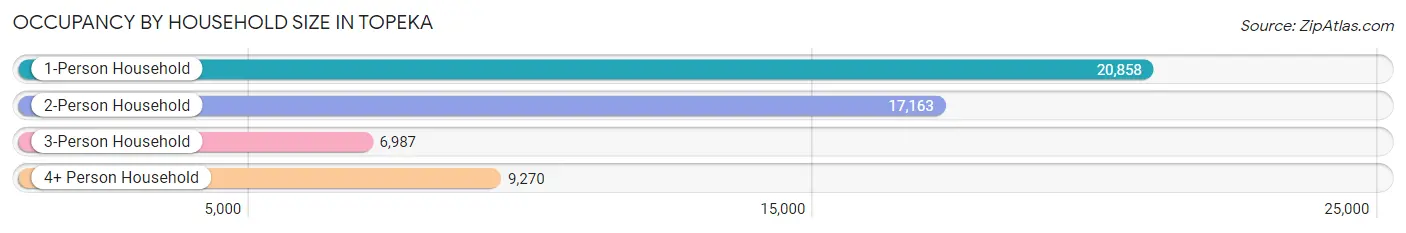
| Household Size | # Housing Units | % Housing Units |
| 1-Person Household | 20,858 | 38.4% |
| 2-Person Household | 17,163 | 31.6% |
| 3-Person Household | 6,987 | 12.9% |
| 4+ Person Household | 9,270 | 17.1% |
| Total Housing Units | 54,278 | 100.0% |
Occupancy by Ownership by Household Size in Topeka
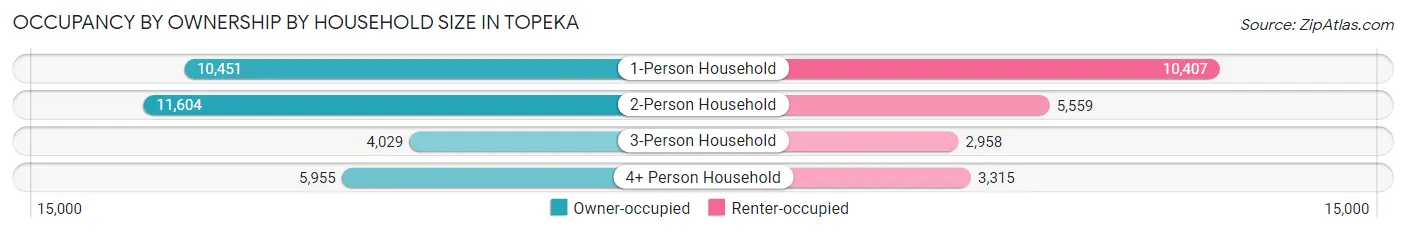
| Household Size | Owner-occupied | Renter-occupied |
| 1-Person Household | 10,451 (50.1%) | 10,407 (49.9%) |
| 2-Person Household | 11,604 (67.6%) | 5,559 (32.4%) |
| 3-Person Household | 4,029 (57.7%) | 2,958 (42.3%) |
| 4+ Person Household | 5,955 (64.2%) | 3,315 (35.8%) |
| Total Housing Units | 32,039 (59.0%) | 22,239 (41.0%) |
Occupancy by Educational Attainment in Topeka
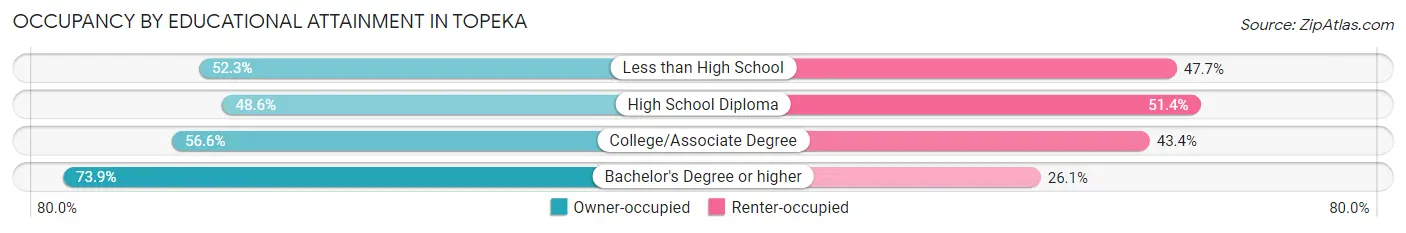
| Household Size | Owner-occupied | Renter-occupied |
| Less than High School | 2,049 (52.3%) | 1,867 (47.7%) |
| High School Diploma | 7,977 (48.6%) | 8,442 (51.4%) |
| College/Associate Degree | 10,043 (56.6%) | 7,701 (43.4%) |
| Bachelor's Degree or higher | 11,970 (73.9%) | 4,229 (26.1%) |
Occupancy by Age of Householder in Topeka
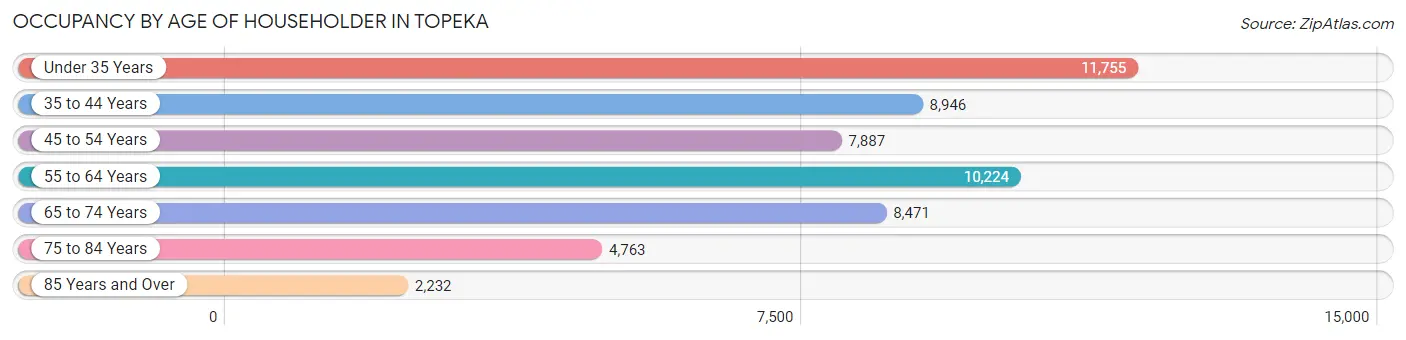
| Age Bracket | # Households | % Households |
| Under 35 Years | 11,755 | 21.7% |
| 35 to 44 Years | 8,946 | 16.5% |
| 45 to 54 Years | 7,887 | 14.5% |
| 55 to 64 Years | 10,224 | 18.8% |
| 65 to 74 Years | 8,471 | 15.6% |
| 75 to 84 Years | 4,763 | 8.8% |
| 85 Years and Over | 2,232 | 4.1% |
| Total | 54,278 | 100.0% |
Housing Finances in Topeka
Median Income by Occupancy in Topeka
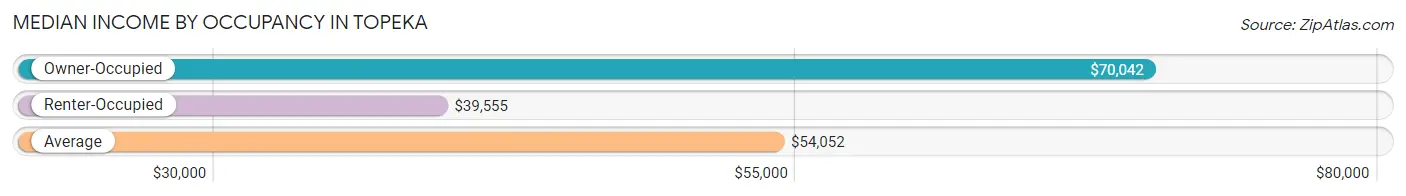
| Occupancy Type | # Households | Median Income |
| Owner-Occupied | 32,039 (59.0%) | $70,042 |
| Renter-Occupied | 22,239 (41.0%) | $39,555 |
| Average | 54,278 (100.0%) | $54,052 |
Occupancy by Householder Income Bracket in Topeka
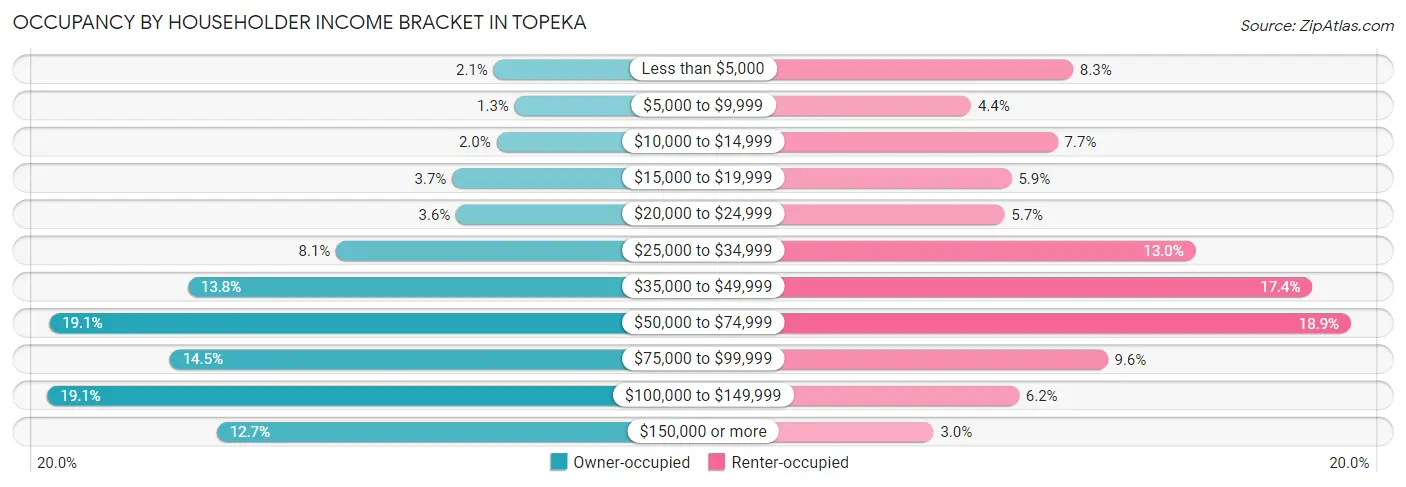
| Income Bracket | Owner-occupied | Renter-occupied |
| Less than $5,000 | 683 (2.1%) | 1,841 (8.3%) |
| $5,000 to $9,999 | 425 (1.3%) | 979 (4.4%) |
| $10,000 to $14,999 | 647 (2.0%) | 1,712 (7.7%) |
| $15,000 to $19,999 | 1,190 (3.7%) | 1,322 (5.9%) |
| $20,000 to $24,999 | 1,140 (3.6%) | 1,260 (5.7%) |
| $25,000 to $34,999 | 2,606 (8.1%) | 2,881 (13.0%) |
| $35,000 to $49,999 | 4,414 (13.8%) | 3,870 (17.4%) |
| $50,000 to $74,999 | 6,106 (19.1%) | 4,196 (18.9%) |
| $75,000 to $99,999 | 4,636 (14.5%) | 2,134 (9.6%) |
| $100,000 to $149,999 | 6,129 (19.1%) | 1,383 (6.2%) |
| $150,000 or more | 4,063 (12.7%) | 661 (3.0%) |
| Total | 32,039 (100.0%) | 22,239 (100.0%) |
Monthly Housing Cost Tiers in Topeka
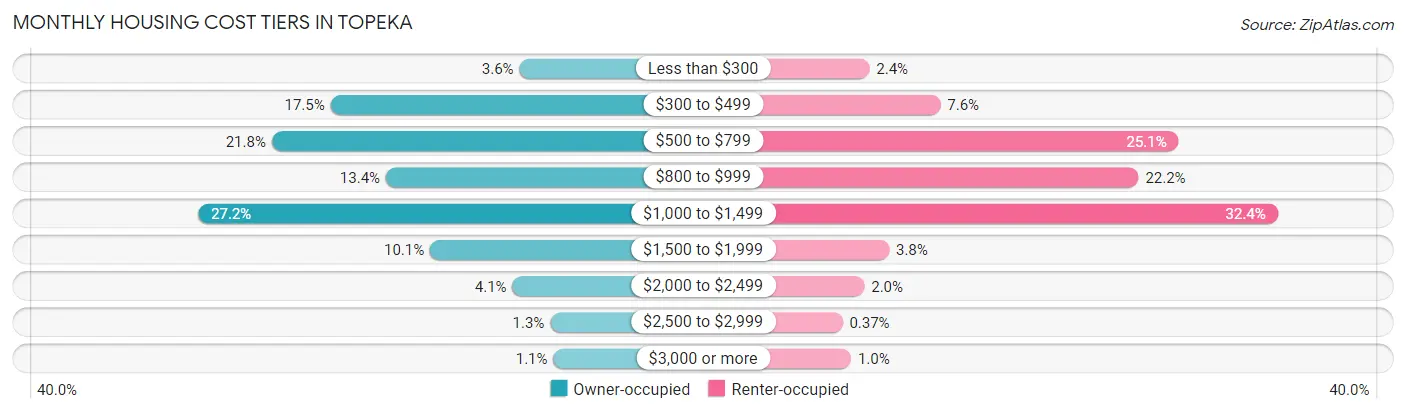
| Monthly Cost | Owner-occupied | Renter-occupied |
| Less than $300 | 1,142 (3.6%) | 522 (2.4%) |
| $300 to $499 | 5,597 (17.5%) | 1,686 (7.6%) |
| $500 to $799 | 6,984 (21.8%) | 5,586 (25.1%) |
| $800 to $999 | 4,289 (13.4%) | 4,930 (22.2%) |
| $1,000 to $1,499 | 8,723 (27.2%) | 7,210 (32.4%) |
| $1,500 to $1,999 | 3,249 (10.1%) | 846 (3.8%) |
| $2,000 to $2,499 | 1,303 (4.1%) | 441 (2.0%) |
| $2,500 to $2,999 | 413 (1.3%) | 83 (0.4%) |
| $3,000 or more | 339 (1.1%) | 223 (1.0%) |
| Total | 32,039 (100.0%) | 22,239 (100.0%) |
Physical Housing Characteristics in Topeka
Housing Structures in Topeka
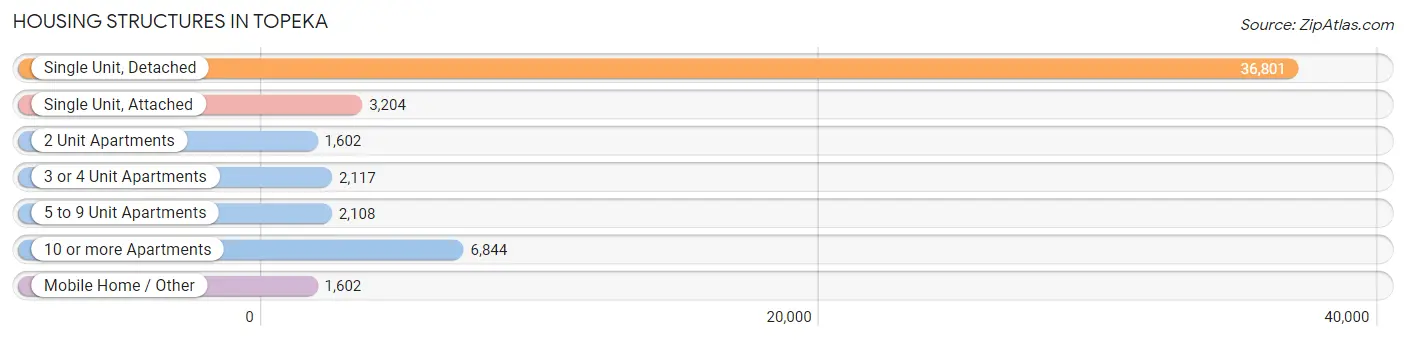
| Structure Type | # Housing Units | % Housing Units |
| Single Unit, Detached | 36,801 | 67.8% |
| Single Unit, Attached | 3,204 | 5.9% |
| 2 Unit Apartments | 1,602 | 2.9% |
| 3 or 4 Unit Apartments | 2,117 | 3.9% |
| 5 to 9 Unit Apartments | 2,108 | 3.9% |
| 10 or more Apartments | 6,844 | 12.6% |
| Mobile Home / Other | 1,602 | 2.9% |
| Total | 54,278 | 100.0% |
Housing Structures by Occupancy in Topeka
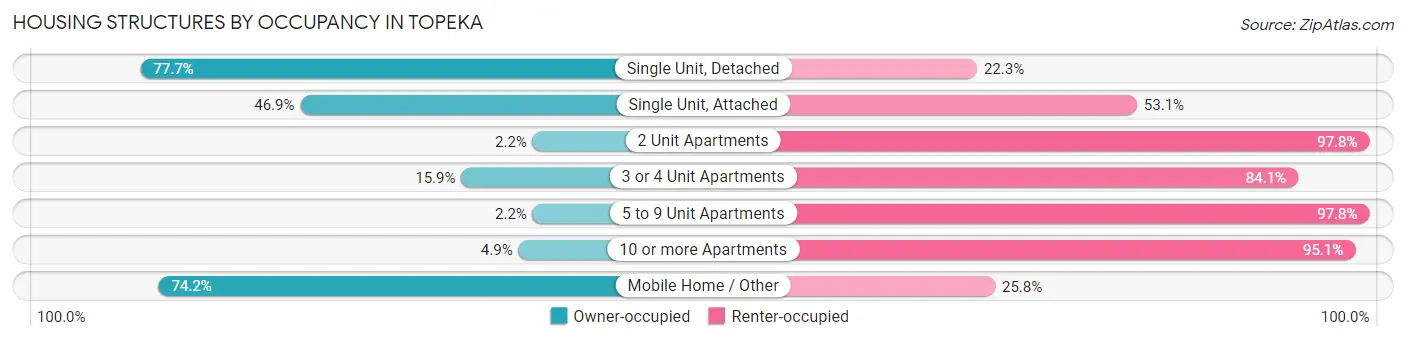
| Structure Type | Owner-occupied | Renter-occupied |
| Single Unit, Detached | 28,593 (77.7%) | 8,208 (22.3%) |
| Single Unit, Attached | 1,503 (46.9%) | 1,701 (53.1%) |
| 2 Unit Apartments | 35 (2.2%) | 1,567 (97.8%) |
| 3 or 4 Unit Apartments | 337 (15.9%) | 1,780 (84.1%) |
| 5 to 9 Unit Apartments | 46 (2.2%) | 2,062 (97.8%) |
| 10 or more Apartments | 336 (4.9%) | 6,508 (95.1%) |
| Mobile Home / Other | 1,189 (74.2%) | 413 (25.8%) |
| Total | 32,039 (59.0%) | 22,239 (41.0%) |
Housing Structures by Number of Rooms in Topeka
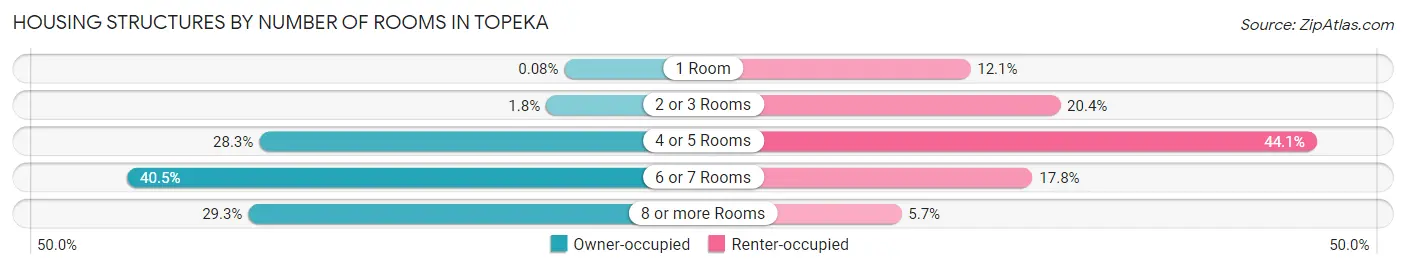
| Number of Rooms | Owner-occupied | Renter-occupied |
| 1 Room | 27 (0.1%) | 2,683 (12.1%) |
| 2 or 3 Rooms | 570 (1.8%) | 4,531 (20.4%) |
| 4 or 5 Rooms | 9,070 (28.3%) | 9,802 (44.1%) |
| 6 or 7 Rooms | 12,978 (40.5%) | 3,959 (17.8%) |
| 8 or more Rooms | 9,394 (29.3%) | 1,264 (5.7%) |
| Total | 32,039 (100.0%) | 22,239 (100.0%) |
Housing Structure by Heating Type in Topeka
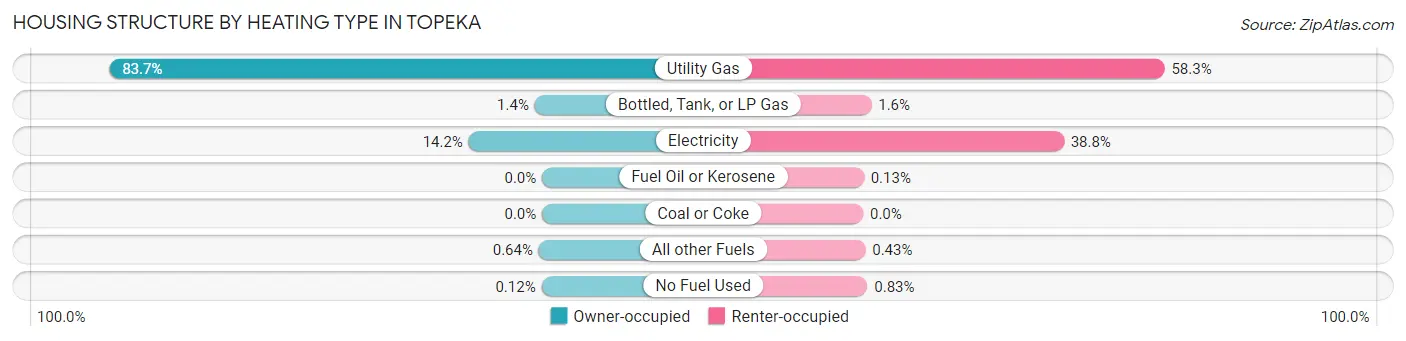
| Heating Type | Owner-occupied | Renter-occupied |
| Utility Gas | 26,800 (83.7%) | 12,954 (58.3%) |
| Bottled, Tank, or LP Gas | 454 (1.4%) | 353 (1.6%) |
| Electricity | 4,542 (14.2%) | 8,623 (38.8%) |
| Fuel Oil or Kerosene | 0 (0.0%) | 30 (0.1%) |
| Coal or Coke | 0 (0.0%) | 0 (0.0%) |
| All other Fuels | 205 (0.6%) | 95 (0.4%) |
| No Fuel Used | 38 (0.1%) | 184 (0.8%) |
| Total | 32,039 (100.0%) | 22,239 (100.0%) |
Household Vehicle Usage in Topeka
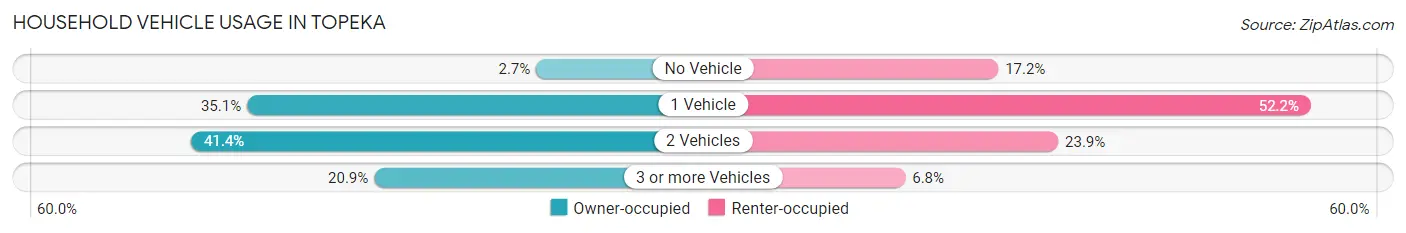
| Vehicles per Household | Owner-occupied | Renter-occupied |
| No Vehicle | 866 (2.7%) | 3,819 (17.2%) |
| 1 Vehicle | 11,242 (35.1%) | 11,605 (52.2%) |
| 2 Vehicles | 13,251 (41.4%) | 5,311 (23.9%) |
| 3 or more Vehicles | 6,680 (20.8%) | 1,504 (6.8%) |
| Total | 32,039 (100.0%) | 22,239 (100.0%) |
Real Estate & Mortgages in Topeka
Real Estate and Mortgage Overview in Topeka
| Characteristic | Without Mortgage | With Mortgage |
| Housing Units | 14,171 | 17,868 |
| Median Property Value | $103,300 | $135,500 |
| Median Household Income | $51,784 | $2,784 |
| Monthly Housing Costs | $521 | $280 |
| Real Estate Taxes | $1,703 | $423 |
Property Value by Mortgage Status in Topeka
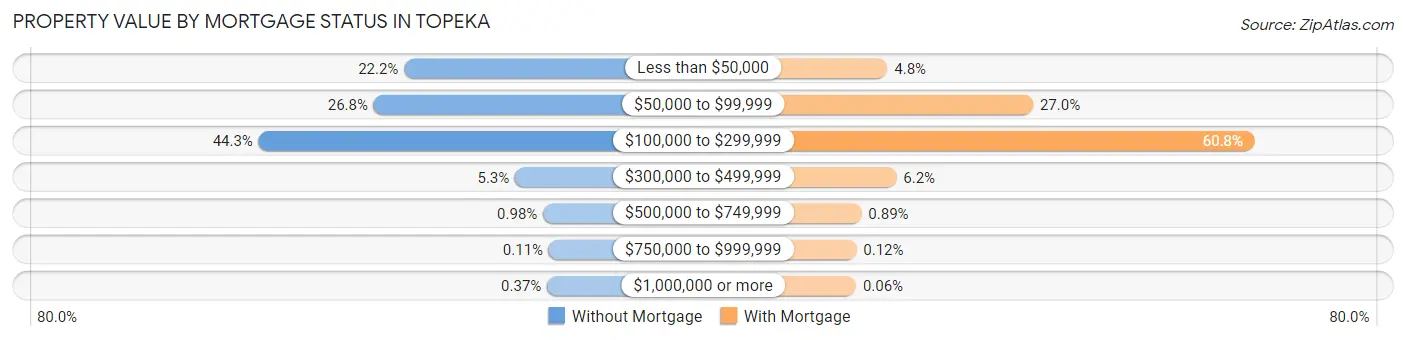
| Property Value | Without Mortgage | With Mortgage |
| Less than $50,000 | 3,140 (22.2%) | 864 (4.8%) |
| $50,000 to $99,999 | 3,797 (26.8%) | 4,831 (27.0%) |
| $100,000 to $299,999 | 6,282 (44.3%) | 10,871 (60.8%) |
| $300,000 to $499,999 | 744 (5.2%) | 1,112 (6.2%) |
| $500,000 to $749,999 | 139 (1.0%) | 159 (0.9%) |
| $750,000 to $999,999 | 16 (0.1%) | 21 (0.1%) |
| $1,000,000 or more | 53 (0.4%) | 10 (0.1%) |
| Total | 14,171 (100.0%) | 17,868 (100.0%) |
Household Income by Mortgage Status in Topeka
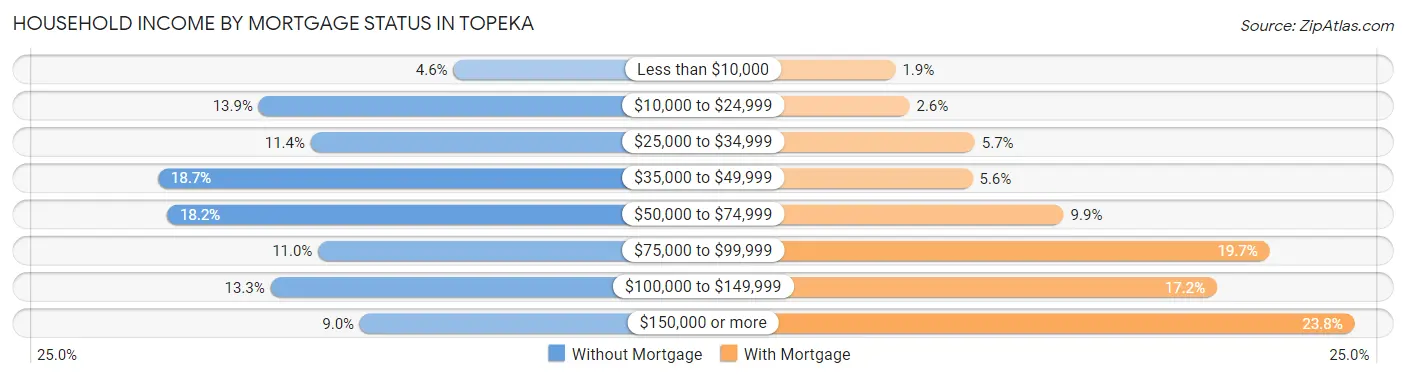
| Household Income | Without Mortgage | With Mortgage |
| Less than $10,000 | 649 (4.6%) | 340 (1.9%) |
| $10,000 to $24,999 | 1,962 (13.9%) | 459 (2.6%) |
| $25,000 to $34,999 | 1,611 (11.4%) | 1,015 (5.7%) |
| $35,000 to $49,999 | 2,643 (18.6%) | 995 (5.6%) |
| $50,000 to $74,999 | 2,582 (18.2%) | 1,771 (9.9%) |
| $75,000 to $99,999 | 1,561 (11.0%) | 3,524 (19.7%) |
| $100,000 to $149,999 | 1,884 (13.3%) | 3,075 (17.2%) |
| $150,000 or more | 1,279 (9.0%) | 4,245 (23.8%) |
| Total | 14,171 (100.0%) | 17,868 (100.0%) |
Property Value to Household Income Ratio in Topeka
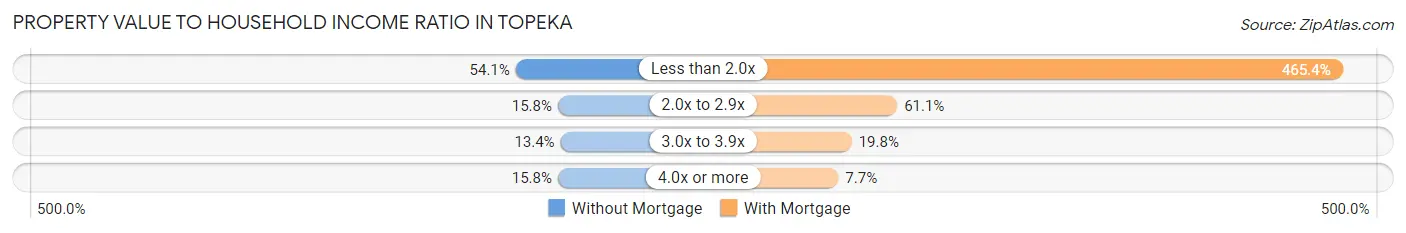
| Value-to-Income Ratio | Without Mortgage | With Mortgage |
| Less than 2.0x | 7,671 (54.1%) | 83,162 (465.4%) |
| 2.0x to 2.9x | 2,244 (15.8%) | 10,916 (61.1%) |
| 3.0x to 3.9x | 1,902 (13.4%) | 3,541 (19.8%) |
| 4.0x or more | 2,242 (15.8%) | 1,380 (7.7%) |
| Total | 14,171 (100.0%) | 17,868 (100.0%) |
Real Estate Taxes by Mortgage Status in Topeka
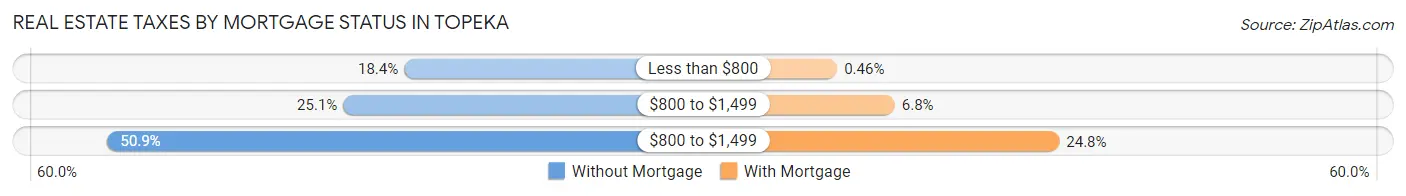
| Property Taxes | Without Mortgage | With Mortgage |
| Less than $800 | 2,610 (18.4%) | 82 (0.5%) |
| $800 to $1,499 | 3,555 (25.1%) | 1,210 (6.8%) |
| $800 to $1,499 | 7,216 (50.9%) | 4,432 (24.8%) |
| Total | 14,171 (100.0%) | 17,868 (100.0%) |
Health & Disability in Topeka
Health Insurance Coverage by Age in Topeka
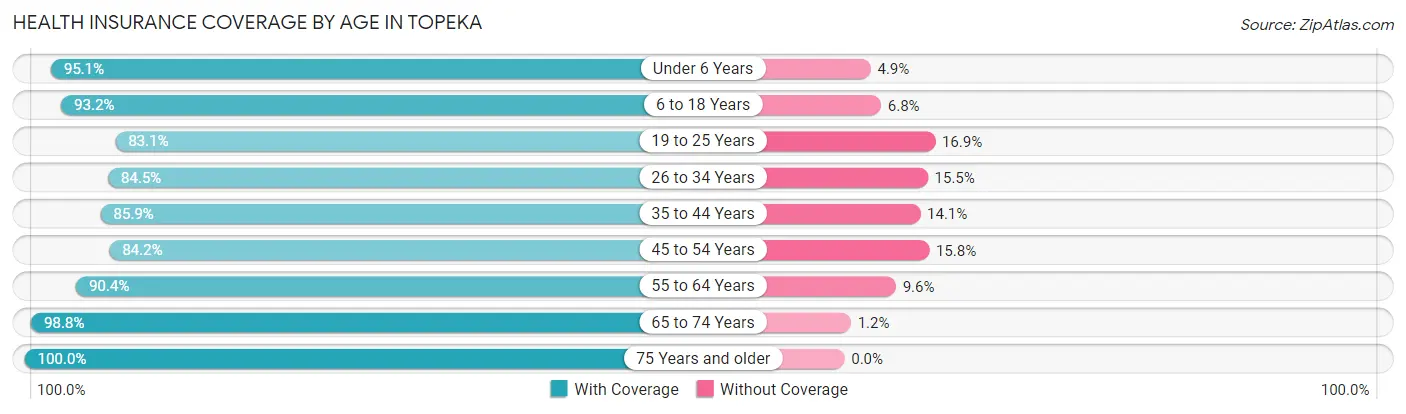
| Age Bracket | With Coverage | Without Coverage |
| Under 6 Years | 8,961 (95.1%) | 461 (4.9%) |
| 6 to 18 Years | 18,960 (93.2%) | 1,387 (6.8%) |
| 19 to 25 Years | 10,550 (83.1%) | 2,147 (16.9%) |
| 26 to 34 Years | 12,096 (84.5%) | 2,225 (15.5%) |
| 35 to 44 Years | 13,415 (85.9%) | 2,209 (14.1%) |
| 45 to 54 Years | 11,207 (84.2%) | 2,102 (15.8%) |
| 55 to 64 Years | 14,421 (90.4%) | 1,530 (9.6%) |
| 65 to 74 Years | 12,071 (98.8%) | 146 (1.2%) |
| 75 Years and older | 9,481 (100.0%) | 0 (0.0%) |
| Total | 111,162 (90.1%) | 12,207 (9.9%) |
Health Insurance Coverage by Citizenship Status in Topeka
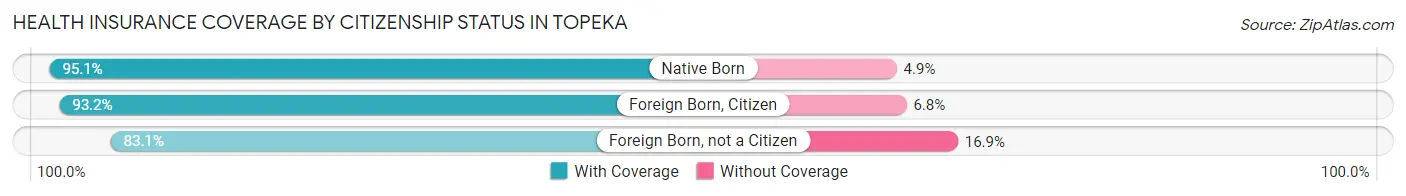
| Citizenship Status | With Coverage | Without Coverage |
| Native Born | 8,961 (95.1%) | 461 (4.9%) |
| Foreign Born, Citizen | 18,960 (93.2%) | 1,387 (6.8%) |
| Foreign Born, not a Citizen | 10,550 (83.1%) | 2,147 (16.9%) |
Health Insurance Coverage by Household Income in Topeka
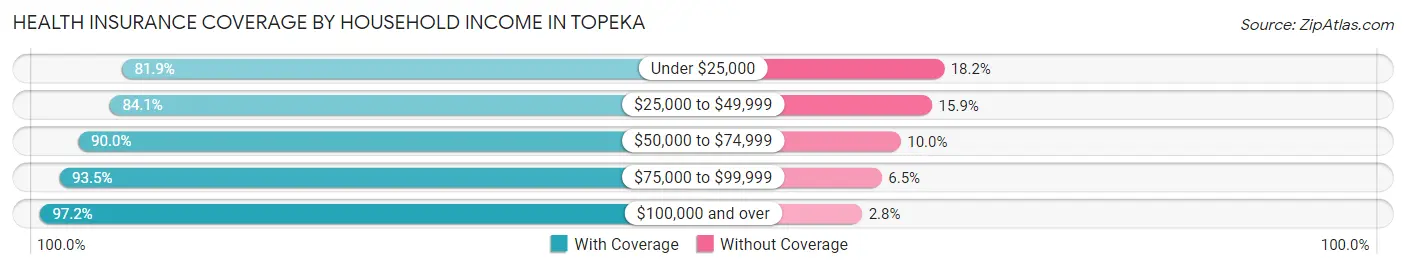
| Household Income | With Coverage | Without Coverage |
| Under $25,000 | 14,656 (81.9%) | 3,250 (18.1%) |
| $25,000 to $49,999 | 21,737 (84.1%) | 4,111 (15.9%) |
| $50,000 to $74,999 | 19,799 (90.0%) | 2,205 (10.0%) |
| $75,000 to $99,999 | 17,010 (93.5%) | 1,178 (6.5%) |
| $100,000 and over | 36,148 (97.2%) | 1,039 (2.8%) |
Public vs Private Health Insurance Coverage by Age in Topeka
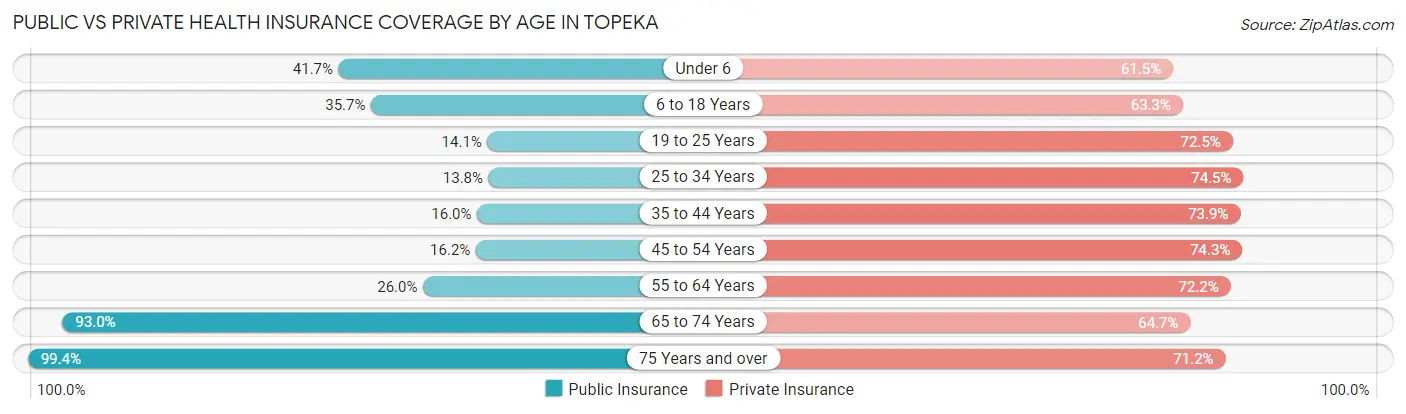
| Age Bracket | Public Insurance | Private Insurance |
| Under 6 | 3,926 (41.7%) | 5,793 (61.5%) |
| 6 to 18 Years | 7,254 (35.6%) | 12,877 (63.3%) |
| 19 to 25 Years | 1,784 (14.1%) | 9,210 (72.5%) |
| 25 to 34 Years | 1,981 (13.8%) | 10,674 (74.5%) |
| 35 to 44 Years | 2,493 (16.0%) | 11,553 (73.9%) |
| 45 to 54 Years | 2,153 (16.2%) | 9,891 (74.3%) |
| 55 to 64 Years | 4,148 (26.0%) | 11,511 (72.2%) |
| 65 to 74 Years | 11,359 (93.0%) | 7,903 (64.7%) |
| 75 Years and over | 9,425 (99.4%) | 6,750 (71.2%) |
| Total | 44,523 (36.1%) | 86,162 (69.8%) |
Disability Status by Sex by Age in Topeka
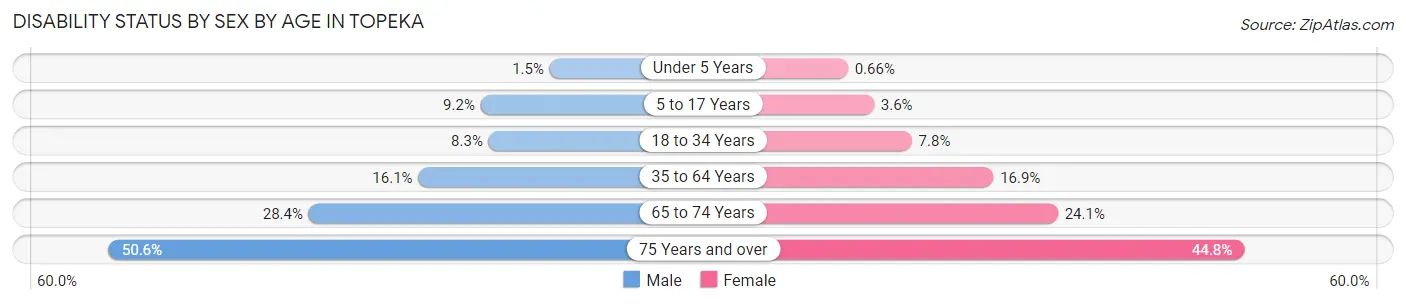
| Age Bracket | Male | Female |
| Under 5 Years | 61 (1.5%) | 24 (0.7%) |
| 5 to 17 Years | 959 (9.2%) | 363 (3.6%) |
| 18 to 34 Years | 1,179 (8.3%) | 1,117 (7.8%) |
| 35 to 64 Years | 3,505 (16.1%) | 3,906 (16.9%) |
| 65 to 74 Years | 1,559 (28.3%) | 1,616 (24.0%) |
| 75 Years and over | 1,826 (50.6%) | 2,631 (44.8%) |
Disability Class by Sex by Age in Topeka
Disability Class: Hearing Difficulty
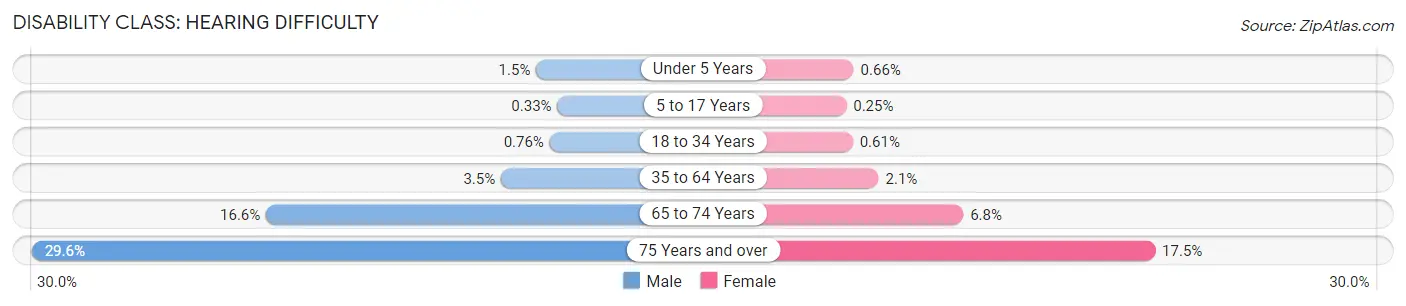
| Age Bracket | Male | Female |
| Under 5 Years | 61 (1.5%) | 24 (0.7%) |
| 5 to 17 Years | 34 (0.3%) | 25 (0.3%) |
| 18 to 34 Years | 108 (0.8%) | 87 (0.6%) |
| 35 to 64 Years | 754 (3.5%) | 475 (2.1%) |
| 65 to 74 Years | 910 (16.6%) | 454 (6.8%) |
| 75 Years and over | 1,068 (29.6%) | 1,025 (17.4%) |
Disability Class: Vision Difficulty
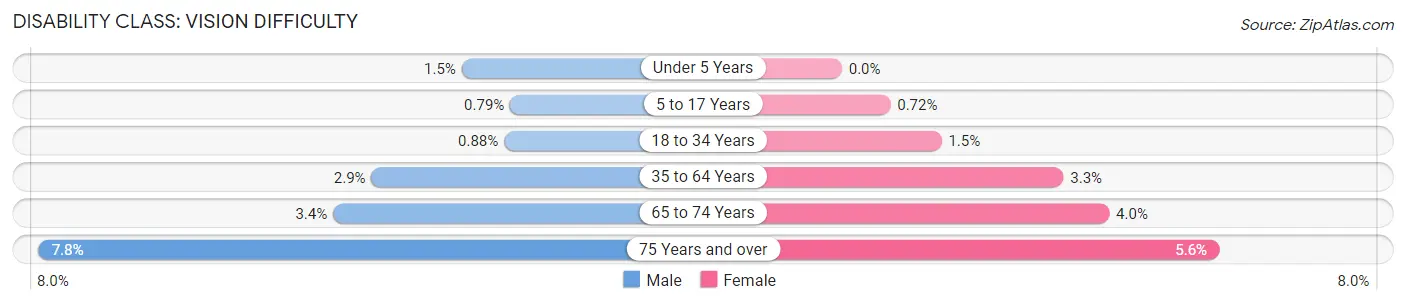
| Age Bracket | Male | Female |
| Under 5 Years | 61 (1.5%) | 0 (0.0%) |
| 5 to 17 Years | 82 (0.8%) | 73 (0.7%) |
| 18 to 34 Years | 125 (0.9%) | 213 (1.5%) |
| 35 to 64 Years | 618 (2.9%) | 762 (3.3%) |
| 65 to 74 Years | 188 (3.4%) | 267 (4.0%) |
| 75 Years and over | 281 (7.8%) | 329 (5.6%) |
Disability Class: Cognitive Difficulty
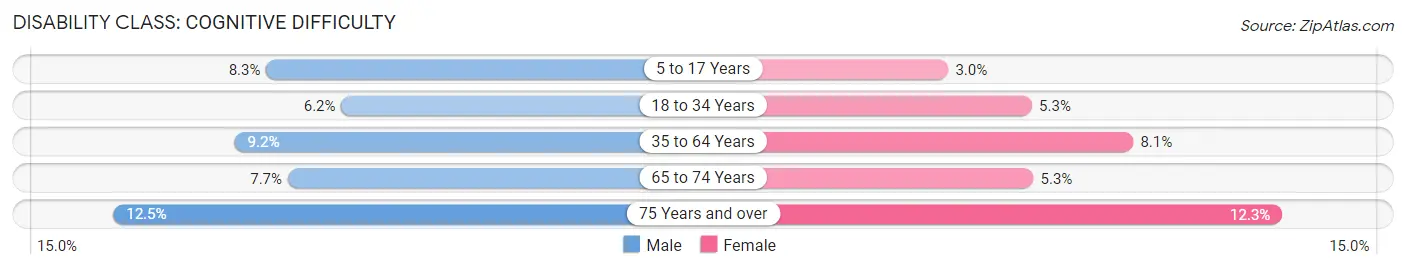
| Age Bracket | Male | Female |
| 5 to 17 Years | 862 (8.3%) | 302 (3.0%) |
| 18 to 34 Years | 877 (6.2%) | 761 (5.3%) |
| 35 to 64 Years | 1,986 (9.1%) | 1,881 (8.1%) |
| 65 to 74 Years | 422 (7.7%) | 359 (5.3%) |
| 75 Years and over | 452 (12.5%) | 720 (12.3%) |
Disability Class: Ambulatory Difficulty
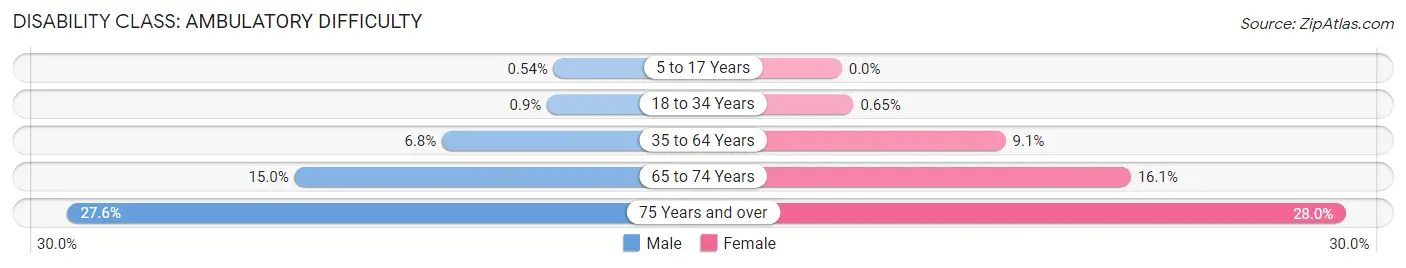
| Age Bracket | Male | Female |
| 5 to 17 Years | 56 (0.5%) | 0 (0.0%) |
| 18 to 34 Years | 128 (0.9%) | 94 (0.6%) |
| 35 to 64 Years | 1,465 (6.8%) | 2,114 (9.1%) |
| 65 to 74 Years | 823 (15.0%) | 1,081 (16.1%) |
| 75 Years and over | 996 (27.6%) | 1,646 (28.0%) |
Disability Class: Self-Care Difficulty
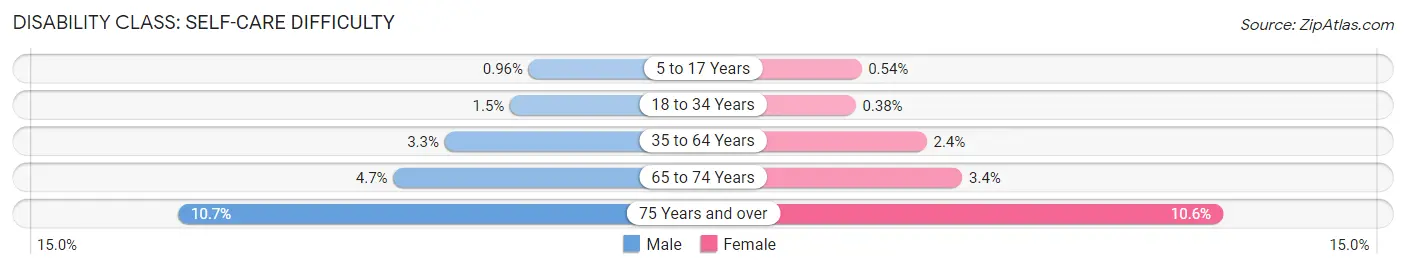
| Age Bracket | Male | Female |
| 5 to 17 Years | 100 (1.0%) | 55 (0.5%) |
| 18 to 34 Years | 210 (1.5%) | 54 (0.4%) |
| 35 to 64 Years | 717 (3.3%) | 548 (2.4%) |
| 65 to 74 Years | 260 (4.7%) | 225 (3.4%) |
| 75 Years and over | 387 (10.7%) | 623 (10.6%) |
Technology Access in Topeka
Computing Device Access in Topeka
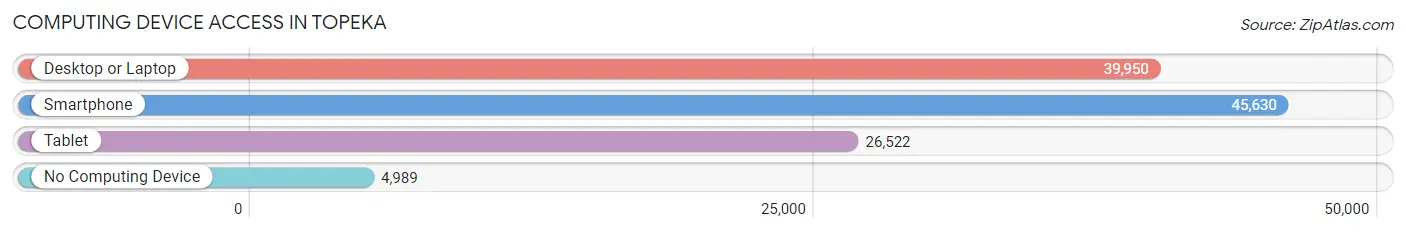
| Device Type | # Households | % Households |
| Desktop or Laptop | 39,950 | 73.6% |
| Smartphone | 45,630 | 84.1% |
| Tablet | 26,522 | 48.9% |
| No Computing Device | 4,989 | 9.2% |
| Total | 54,278 | 100.0% |
Internet Access in Topeka
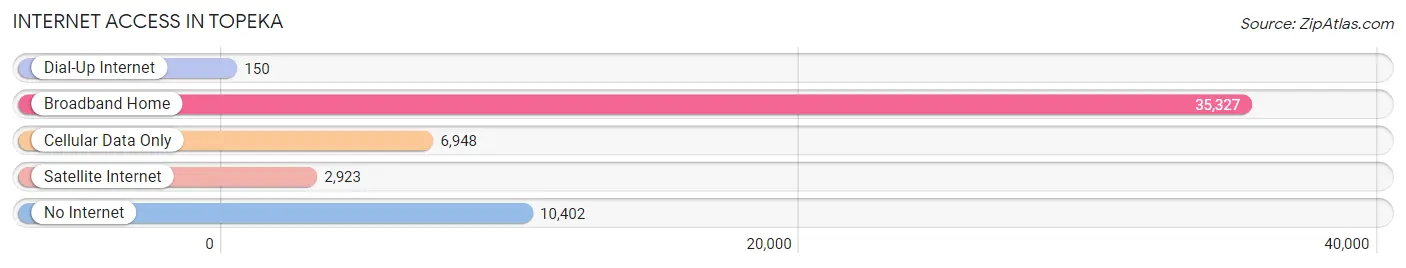
| Internet Type | # Households | % Households |
| Dial-Up Internet | 150 | 0.3% |
| Broadband Home | 35,327 | 65.1% |
| Cellular Data Only | 6,948 | 12.8% |
| Satellite Internet | 2,923 | 5.4% |
| No Internet | 10,402 | 19.2% |
| Total | 54,278 | 100.0% |
Topeka Summary
Topeka, Kansas is the capital of the state and the county seat of Shawnee County. It is located along the Kansas River in the northeastern part of the state. The city has a population of 127,473, making it the third-largest city in the state.
Topeka is located in the heart of the Great Plains, and is part of the Central Plains region. The city is situated on a broad, flat plain, with the Kansas River running through the center of the city. The city is surrounded by rolling hills and wooded areas, and is located near several lakes and reservoirs.
Topeka has a humid continental climate, with hot, humid summers and cold, dry winters. The average annual temperature is 54°F, and the average annual precipitation is 36 inches.
Topeka's economy is largely based on government, education, and health care. The city is home to the state government, as well as several state universities and colleges. The city is also home to several large hospitals and medical centers. The city is also home to several large manufacturing companies, including Goodyear Tire and Rubber Company, Frito-Lay, and Hallmark Cards.
Topeka's population is diverse, with a mix of races and ethnicities. The city is home to a large African American population, as well as a large Hispanic population. The city also has a large Native American population, as well as a growing Asian population.
Topeka is a vibrant city, with a variety of cultural attractions and activities. The city is home to several museums, including the Kansas Museum of History, the Topeka Zoo, and the Combat Air Museum. The city also has several parks and recreational areas, including Gage Park, Lake Shawnee, and the Topeka Riverfront Park. The city also has several performing arts venues, including the Topeka Performing Arts Center and the Topeka Civic Theater.
Topeka is a great place to live, work, and play. The city has a strong economy, a diverse population, and a variety of cultural attractions. The city is a great place to raise a family, and offers a variety of educational and recreational opportunities.
Common Questions
What is Per Capita Income in Topeka?
Per Capita income in Topeka is $32,176.
What is the Median Family Income in Topeka?
Median Family Income in Topeka is $74,579.
What is the Median Household income in Topeka?
Median Household Income in Topeka is $54,052.
What is Income or Wage Gap in Topeka?
Income or Wage Gap in Topeka is 19.8%.
Women in Topeka earn 80.2 cents for every dollar earned by a man.
What is Family Income Deficit in Topeka?
Family Income Deficit in Topeka is $10,153.
Families that are below poverty line in Topeka earn $10,153 less on average than the poverty threshold level.
What is Inequality or Gini Index in Topeka?
Inequality or Gini Index in Topeka is 0.45.
What is the Total Population of Topeka?
Total Population of Topeka is 126,431.
What is the Total Male Population of Topeka?
Total Male Population of Topeka is 60,905.
What is the Total Female Population of Topeka?
Total Female Population of Topeka is 65,526.
What is the Ratio of Males per 100 Females in Topeka?
There are 92.95 Males per 100 Females in Topeka.
What is the Ratio of Females per 100 Males in Topeka?
There are 107.59 Females per 100 Males in Topeka.
What is the Median Population Age in Topeka?
Median Population Age in Topeka is 37.9 Years.
What is the Average Family Size in Topeka
Average Family Size in Topeka is 3.0 People.
What is the Average Household Size in Topeka
Average Household Size in Topeka is 2.2 People.
How Large is the Labor Force in Topeka?
There are 62,689 People in the Labor Forcein in Topeka.
What is the Percentage of People in the Labor Force in Topeka?
61.8% of People are in the Labor Force in Topeka.
What is the Unemployment Rate in Topeka?
Unemployment Rate in Topeka is 5.0%.