Lenexa, KS Map & Demographics
Lenexa Map
Lenexa Overview
$55,718
PER CAPITA INCOME
$124,293
AVG FAMILY INCOME
$101,074
AVG HOUSEHOLD INCOME
26.5%
WAGE / INCOME GAP [ % ]
73.5¢/ $1
WAGE / INCOME GAP [ $ ]
0.44
INEQUALITY / GINI INDEX
57,497
TOTAL POPULATION
28,945
MALE POPULATION
28,552
FEMALE POPULATION
101.38
MALES / 100 FEMALES
98.64
FEMALES / 100 MALES
38.0
MEDIAN AGE
2.9
AVG FAMILY SIZE
2.4
AVG HOUSEHOLD SIZE
34,292
LABOR FORCE [ PEOPLE ]
73.8%
PERCENT IN LABOR FORCE
2.6%
UNEMPLOYMENT RATE
Lenexa Area Codes
Income in Lenexa
Income Overview in Lenexa
Per Capita Income in Lenexa is $55,718, while median incomes of families and households are $124,293 and $101,074 respectively.
| Characteristic | Number | Measure |
| Per Capita Income | 57,497 | $55,718 |
| Median Family Income | 15,652 | $124,293 |
| Mean Family Income | 15,652 | $154,089 |
| Median Household Income | 24,199 | $101,074 |
| Mean Household Income | 24,199 | $130,760 |
| Income Deficit | 15,652 | $0 |
| Wage / Income Gap (%) | 57,497 | 26.53% |
| Wage / Income Gap ($) | 57,497 | 73.47¢ per $1 |
| Gini / Inequality Index | 57,497 | 0.44 |
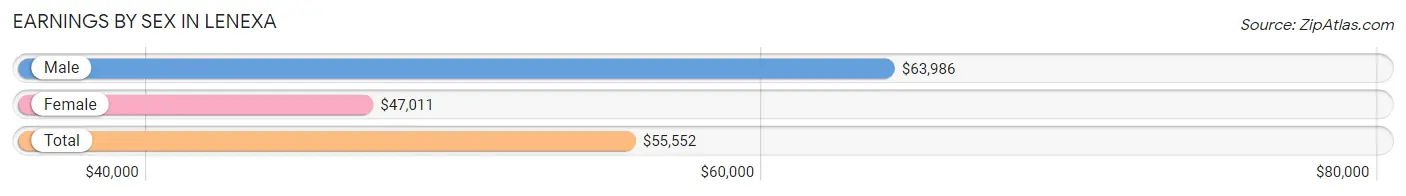
Earnings by Sex in Lenexa
Average Earnings in Lenexa are $55,552, $63,986 for men and $47,011 for women, a difference of 26.5%.
| Sex | Number | Average Earnings |
| Male | 18,755 (52.4%) | $63,986 |
| Female | 17,030 (47.6%) | $47,011 |
| Total | 35,785 (100.0%) | $55,552 |
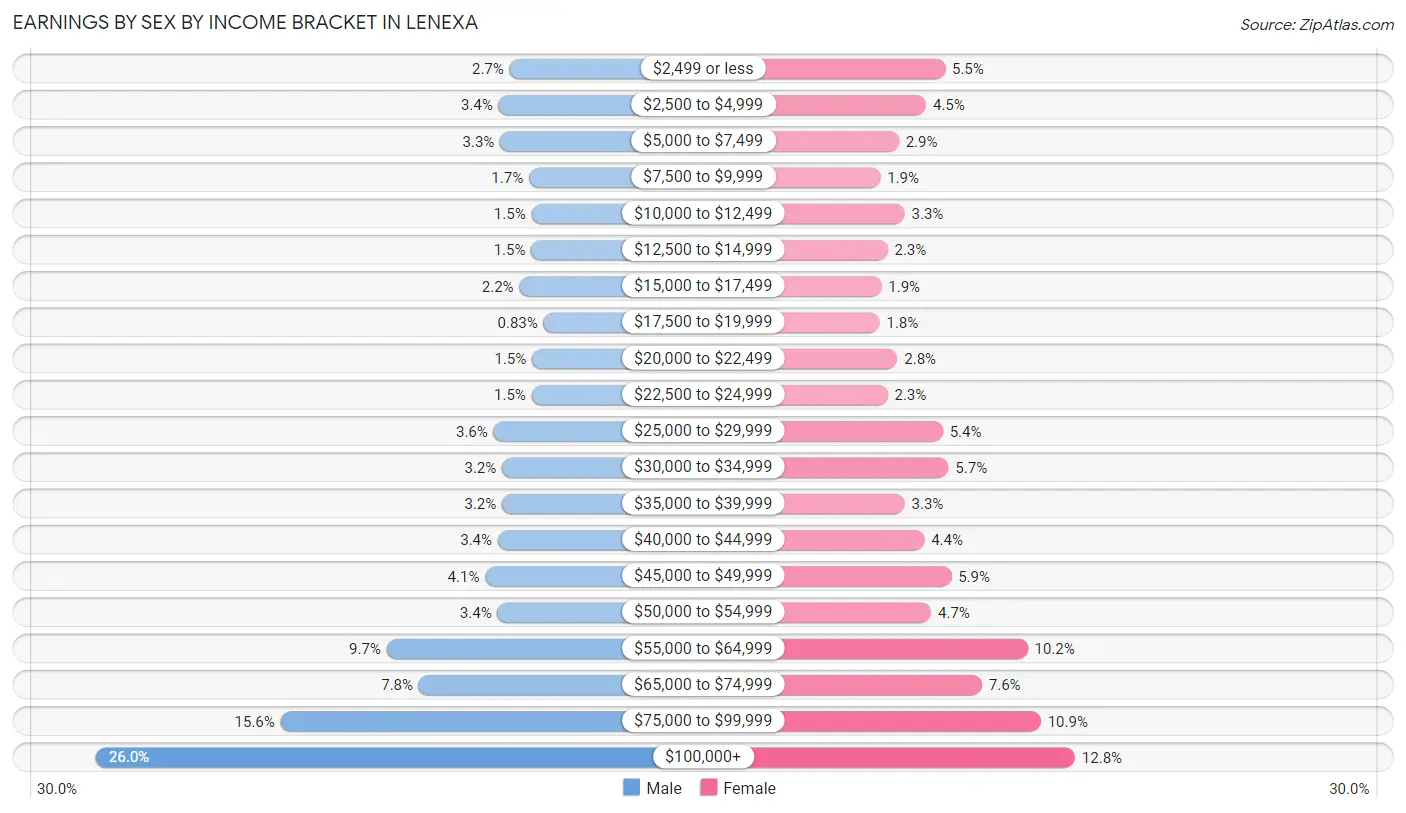
Earnings by Sex by Income Bracket in Lenexa
The most common earnings brackets in Lenexa are $100,000+ for men (4,874 | 26.0%) and $100,000+ for women (2,184 | 12.8%).
| Income | Male | Female |
| $2,499 or less | 514 (2.7%) | 940 (5.5%) |
| $2,500 to $4,999 | 630 (3.4%) | 758 (4.4%) |
| $5,000 to $7,499 | 613 (3.3%) | 497 (2.9%) |
| $7,500 to $9,999 | 309 (1.7%) | 320 (1.9%) |
| $10,000 to $12,499 | 284 (1.5%) | 553 (3.3%) |
| $12,500 to $14,999 | 285 (1.5%) | 390 (2.3%) |
| $15,000 to $17,499 | 410 (2.2%) | 331 (1.9%) |
| $17,500 to $19,999 | 155 (0.8%) | 313 (1.8%) |
| $20,000 to $22,499 | 278 (1.5%) | 483 (2.8%) |
| $22,500 to $24,999 | 281 (1.5%) | 390 (2.3%) |
| $25,000 to $29,999 | 682 (3.6%) | 918 (5.4%) |
| $30,000 to $34,999 | 592 (3.2%) | 973 (5.7%) |
| $35,000 to $39,999 | 592 (3.2%) | 554 (3.3%) |
| $40,000 to $44,999 | 637 (3.4%) | 741 (4.3%) |
| $45,000 to $49,999 | 770 (4.1%) | 1,000 (5.9%) |
| $50,000 to $54,999 | 641 (3.4%) | 807 (4.7%) |
| $55,000 to $64,999 | 1,810 (9.7%) | 1,730 (10.2%) |
| $65,000 to $74,999 | 1,471 (7.8%) | 1,292 (7.6%) |
| $75,000 to $99,999 | 2,927 (15.6%) | 1,856 (10.9%) |
| $100,000+ | 4,874 (26.0%) | 2,184 (12.8%) |
| Total | 18,755 (100.0%) | 17,030 (100.0%) |
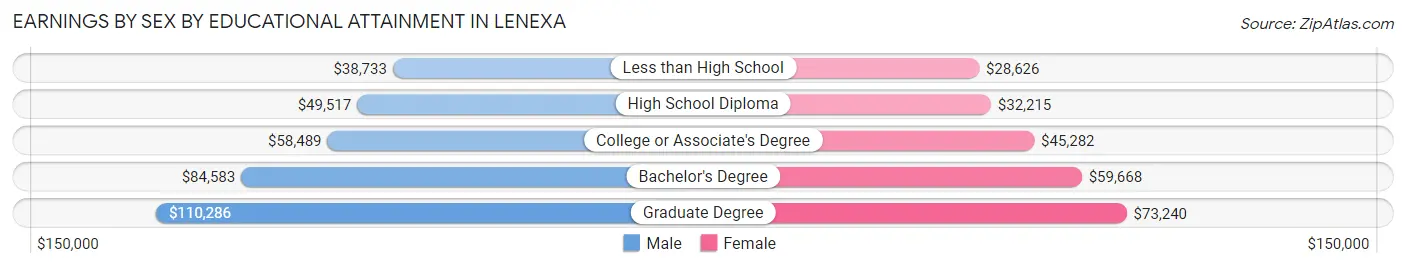
Earnings by Sex by Educational Attainment in Lenexa
Average earnings in Lenexa are $72,266 for men and $52,776 for women, a difference of 27.0%. Men with an educational attainment of graduate degree enjoy the highest average annual earnings of $110,286, while those with less than high school education earn the least with $38,733. Women with an educational attainment of graduate degree earn the most with the average annual earnings of $73,240, while those with less than high school education have the smallest earnings of $28,626.
| Educational Attainment | Male Income | Female Income |
| Less than High School | $38,733 | $28,626 |
| High School Diploma | $49,517 | $32,215 |
| College or Associate's Degree | $58,489 | $45,282 |
| Bachelor's Degree | $84,583 | $59,668 |
| Graduate Degree | $110,286 | $73,240 |
| Total | $72,266 | $52,776 |
Family Income in Lenexa
Family Income Brackets in Lenexa
According to the Lenexa family income data, there are 4,116 families falling into the $100,000 to $149,999 income range, which is the most common income bracket and makes up 26.3% of all families. Conversely, the $10,000 to $14,999 income bracket is the least frequent group with only 172 families (1.1%) belonging to this category.
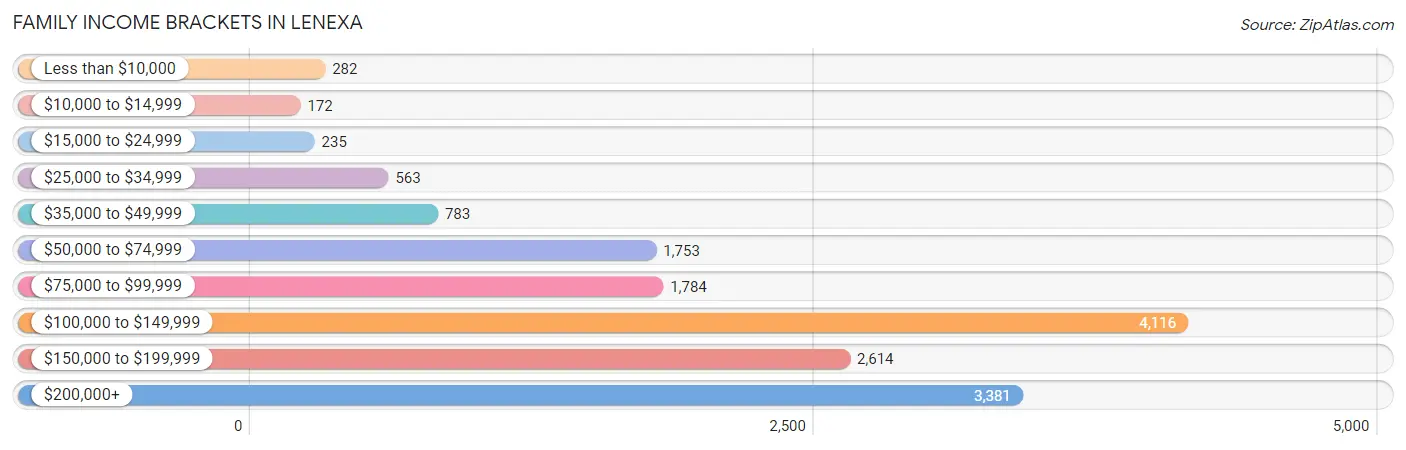
| Income Bracket | # Families | % Families |
| Less than $10,000 | 282 | 1.8% |
| $10,000 to $14,999 | 172 | 1.1% |
| $15,000 to $24,999 | 235 | 1.5% |
| $25,000 to $34,999 | 563 | 3.6% |
| $35,000 to $49,999 | 783 | 5.0% |
| $50,000 to $74,999 | 1,753 | 11.2% |
| $75,000 to $99,999 | 1,784 | 11.4% |
| $100,000 to $149,999 | 4,116 | 26.3% |
| $150,000 to $199,999 | 2,614 | 16.7% |
| $200,000+ | 3,381 | 21.6% |
Family Income by Famaliy Size in Lenexa
7+ person families (71 | 0.4%) account for the highest median family income in Lenexa with $229,844 per family, while 2-person families (8,210 | 52.4%) have the highest median income of $53,722 per family member.
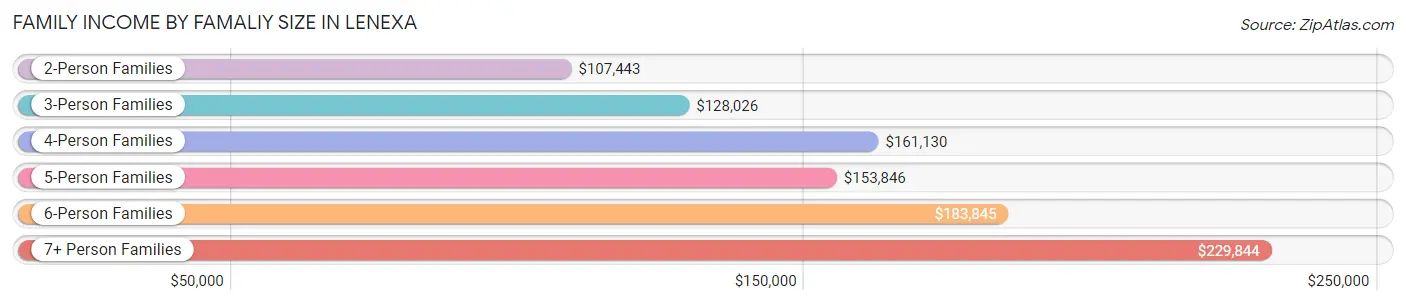
| Income Bracket | # Families | Median Income |
| 2-Person Families | 8,210 (52.4%) | $107,443 |
| 3-Person Families | 3,176 (20.3%) | $128,026 |
| 4-Person Families | 2,760 (17.6%) | $161,130 |
| 5-Person Families | 1,108 (7.1%) | $153,846 |
| 6-Person Families | 327 (2.1%) | $183,845 |
| 7+ Person Families | 71 (0.4%) | $229,844 |
| Total | 15,652 (100.0%) | $124,293 |
Family Income by Number of Earners in Lenexa
The median family income in Lenexa is $124,293, with families comprising 3+ earners (1,876) having the highest median family income of $193,024, while families with no earners (2,274) have the lowest median family income of $86,771, accounting for 12.0% and 14.5% of families, respectively.
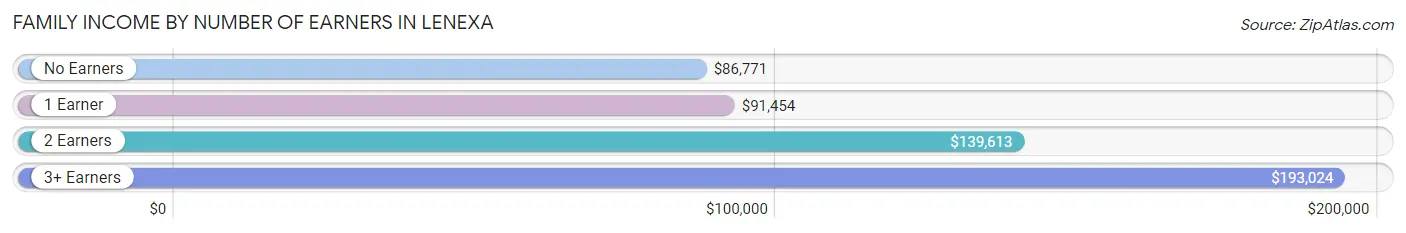
| Number of Earners | # Families | Median Income |
| No Earners | 2,274 (14.5%) | $86,771 |
| 1 Earner | 3,467 (22.2%) | $91,454 |
| 2 Earners | 8,035 (51.3%) | $139,613 |
| 3+ Earners | 1,876 (12.0%) | $193,024 |
| Total | 15,652 (100.0%) | $124,293 |
Household Income in Lenexa
Household Income Brackets in Lenexa
With 5,517 households falling in the category, the $100,000 to $149,999 income range is the most frequent in Lenexa, accounting for 22.8% of all households. In contrast, only 387 households (1.6%) fall into the $10,000 to $14,999 income bracket, making it the least populous group.
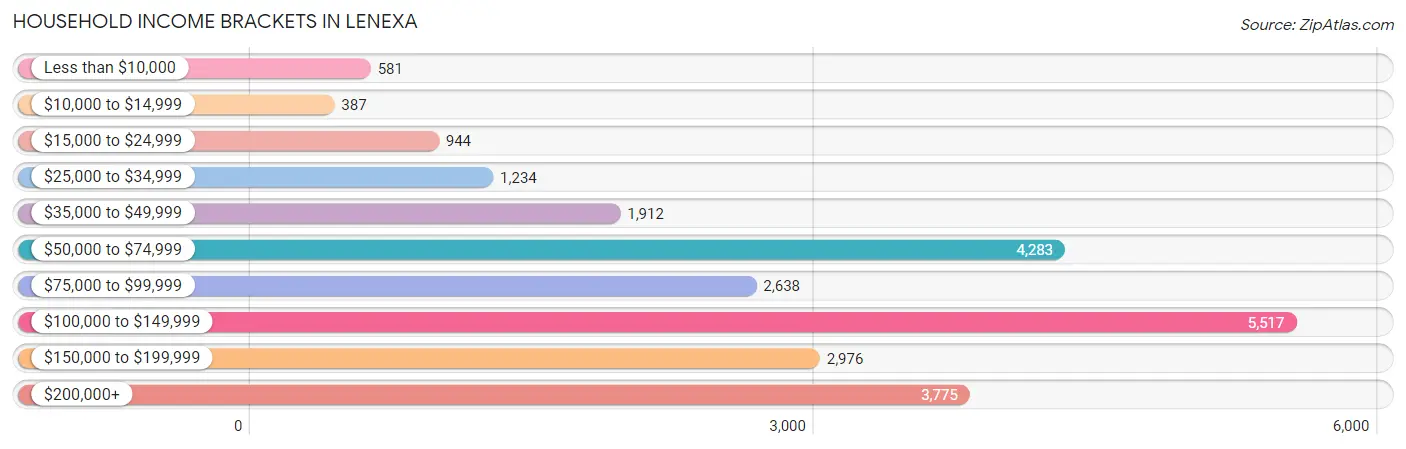
| Income Bracket | # Households | % Households |
| Less than $10,000 | 581 | 2.4% |
| $10,000 to $14,999 | 387 | 1.6% |
| $15,000 to $24,999 | 944 | 3.9% |
| $25,000 to $34,999 | 1,234 | 5.1% |
| $35,000 to $49,999 | 1,912 | 7.9% |
| $50,000 to $74,999 | 4,283 | 17.7% |
| $75,000 to $99,999 | 2,638 | 10.9% |
| $100,000 to $149,999 | 5,517 | 22.8% |
| $150,000 to $199,999 | 2,976 | 12.3% |
| $200,000+ | 3,775 | 15.6% |
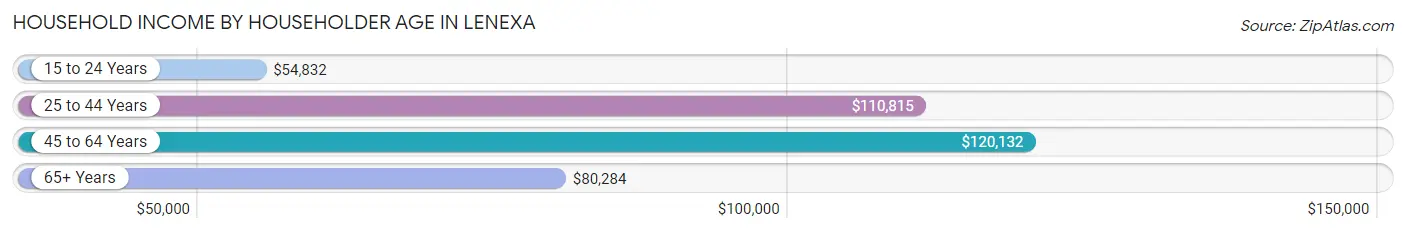
Household Income by Householder Age in Lenexa
The median household income in Lenexa is $101,074, with the highest median household income of $120,132 found in the 45 to 64 years age bracket for the primary householder. A total of 8,289 households (34.3%) fall into this category. Meanwhile, the 15 to 24 years age bracket for the primary householder has the lowest median household income of $54,832, with 1,555 households (6.4%) in this group.
| Income Bracket | # Households | Median Income |
| 15 to 24 Years | 1,555 (6.4%) | $54,832 |
| 25 to 44 Years | 8,820 (36.4%) | $110,815 |
| 45 to 64 Years | 8,289 (34.3%) | $120,132 |
| 65+ Years | 5,535 (22.9%) | $80,284 |
| Total | 24,199 (100.0%) | $101,074 |
Poverty in Lenexa
Income Below Poverty by Sex and Age in Lenexa
With 4.3% poverty level for males and 7.4% for females among the residents of Lenexa, 15 year old males and 18 to 24 year old females are the most vulnerable to poverty, with 106 males (23.3%) and 708 females (25.6%) in their respective age groups living below the poverty level.
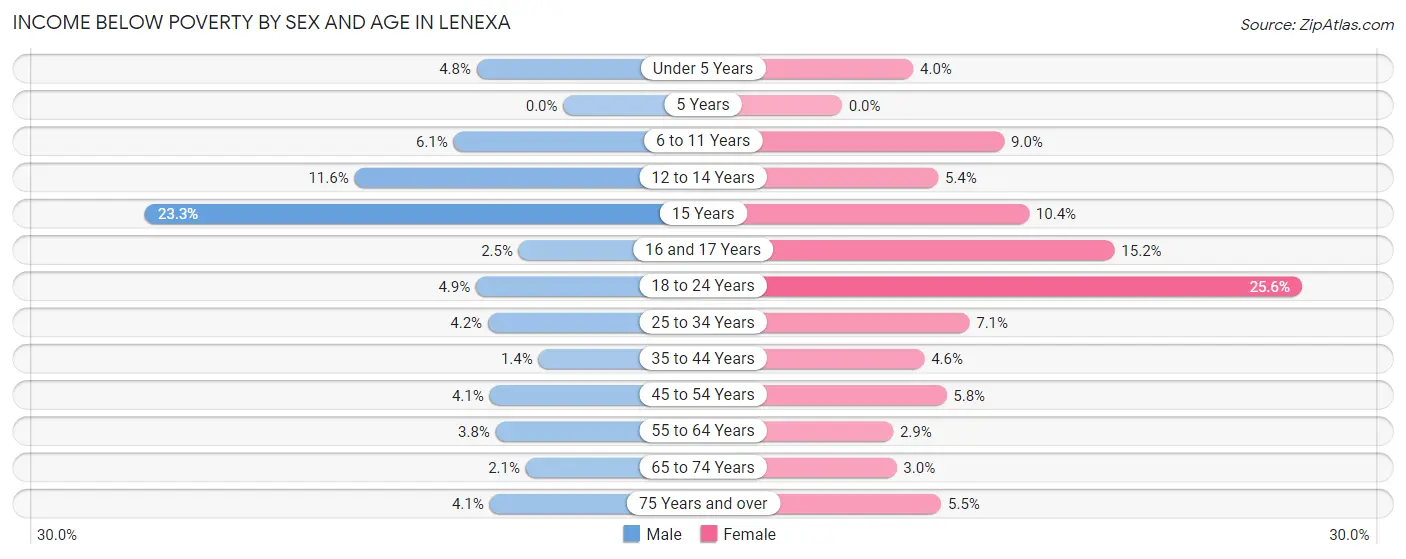
| Age Bracket | Male | Female |
| Under 5 Years | 80 (4.8%) | 63 (4.0%) |
| 5 Years | 0 (0.0%) | 0 (0.0%) |
| 6 to 11 Years | 140 (6.1%) | 194 (9.0%) |
| 12 to 14 Years | 130 (11.6%) | 48 (5.4%) |
| 15 Years | 106 (23.3%) | 27 (10.4%) |
| 16 and 17 Years | 20 (2.5%) | 97 (15.2%) |
| 18 to 24 Years | 125 (4.9%) | 708 (25.6%) |
| 25 to 34 Years | 190 (4.2%) | 285 (7.1%) |
| 35 to 44 Years | 59 (1.4%) | 170 (4.6%) |
| 45 to 54 Years | 142 (4.1%) | 205 (5.8%) |
| 55 to 64 Years | 131 (3.8%) | 105 (2.9%) |
| 65 to 74 Years | 50 (2.1%) | 99 (3.0%) |
| 75 Years and over | 56 (4.1%) | 89 (5.5%) |
| Total | 1,229 (4.3%) | 2,090 (7.4%) |
Income Above Poverty by Sex and Age in Lenexa
According to the poverty statistics in Lenexa, males aged 5 years and females aged 5 years are the age groups that are most secure financially, with 100.0% of males and 100.0% of females in these age groups living above the poverty line.
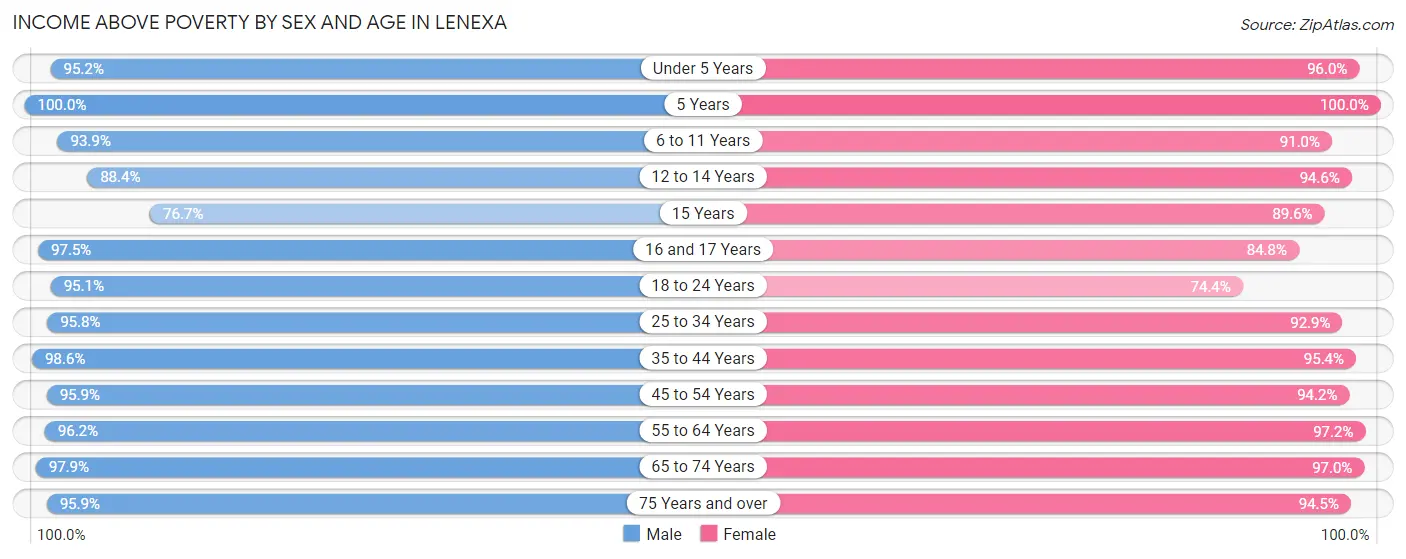
| Age Bracket | Male | Female |
| Under 5 Years | 1,580 (95.2%) | 1,522 (96.0%) |
| 5 Years | 289 (100.0%) | 196 (100.0%) |
| 6 to 11 Years | 2,150 (93.9%) | 1,952 (91.0%) |
| 12 to 14 Years | 988 (88.4%) | 848 (94.6%) |
| 15 Years | 349 (76.7%) | 232 (89.6%) |
| 16 and 17 Years | 788 (97.5%) | 542 (84.8%) |
| 18 to 24 Years | 2,447 (95.1%) | 2,057 (74.4%) |
| 25 to 34 Years | 4,334 (95.8%) | 3,731 (92.9%) |
| 35 to 44 Years | 4,226 (98.6%) | 3,535 (95.4%) |
| 45 to 54 Years | 3,309 (95.9%) | 3,317 (94.2%) |
| 55 to 64 Years | 3,348 (96.2%) | 3,584 (97.2%) |
| 65 to 74 Years | 2,344 (97.9%) | 3,156 (97.0%) |
| 75 Years and over | 1,308 (95.9%) | 1,521 (94.5%) |
| Total | 27,460 (95.7%) | 26,193 (92.6%) |
Income Below Poverty Among Married-Couple Families in Lenexa
The poverty statistics for married-couple families in Lenexa show that 1.5% or 193 of the total 12,704 families live below the poverty line. Families with 1 or 2 children have the highest poverty rate of 3.6%, comprising of 140 families. On the other hand, families with 5 or more children have the lowest poverty rate of 0.0%, which includes 0 families.
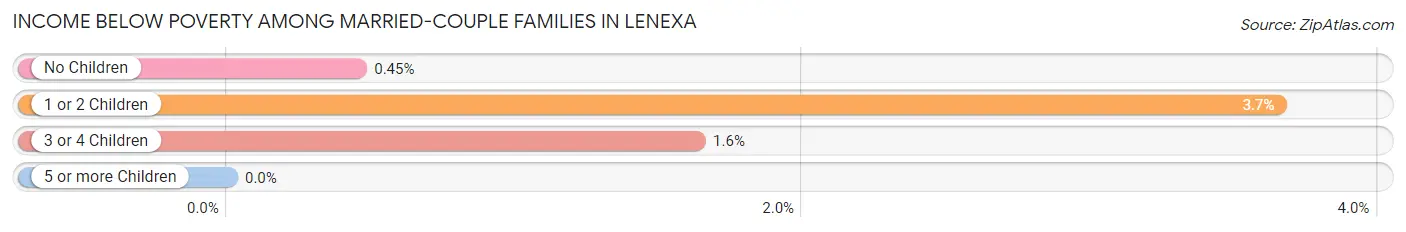
| Children | Above Poverty | Below Poverty |
| No Children | 7,718 (99.6%) | 35 (0.4%) |
| 1 or 2 Children | 3,695 (96.4%) | 140 (3.6%) |
| 3 or 4 Children | 1,089 (98.4%) | 18 (1.6%) |
| 5 or more Children | 9 (100.0%) | 0 (0.0%) |
| Total | 12,511 (98.5%) | 193 (1.5%) |
Income Below Poverty Among Single-Parent Households in Lenexa
According to the poverty data in Lenexa, 1.4% or 15 single-father households and 21.8% or 409 single-mother households are living below the poverty line. Among single-father households, those with 1 or 2 children have the highest poverty rate, with 15 households (2.7%) experiencing poverty. Likewise, among single-mother households, those with 3 or 4 children have the highest poverty rate, with 101 households (62.7%) falling below the poverty line.
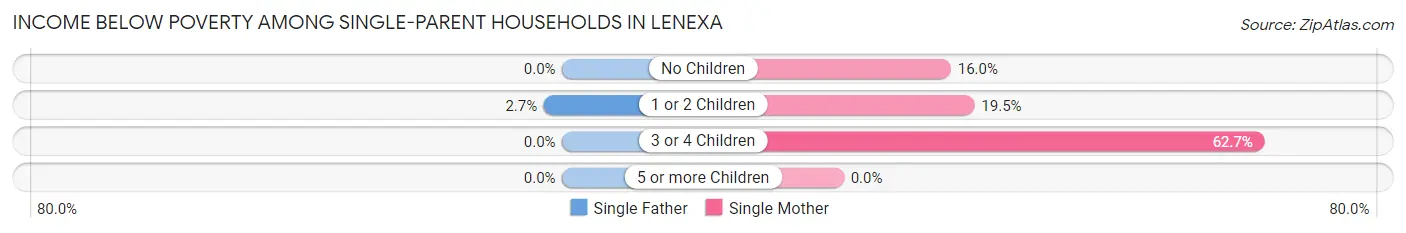
| Children | Single Father | Single Mother |
| No Children | 0 (0.0%) | 120 (16.0%) |
| 1 or 2 Children | 15 (2.7%) | 188 (19.5%) |
| 3 or 4 Children | 0 (0.0%) | 101 (62.7%) |
| 5 or more Children | 0 (0.0%) | 0 (0.0%) |
| Total | 15 (1.4%) | 409 (21.8%) |
Income Below Poverty Among Married-Couple vs Single-Parent Households in Lenexa
The poverty data for Lenexa shows that 193 of the married-couple family households (1.5%) and 424 of the single-parent households (14.4%) are living below the poverty level. Within the married-couple family households, those with 1 or 2 children have the highest poverty rate, with 140 households (3.6%) falling below the poverty line. Among the single-parent households, those with 3 or 4 children have the highest poverty rate, with 101 household (55.2%) living below poverty.
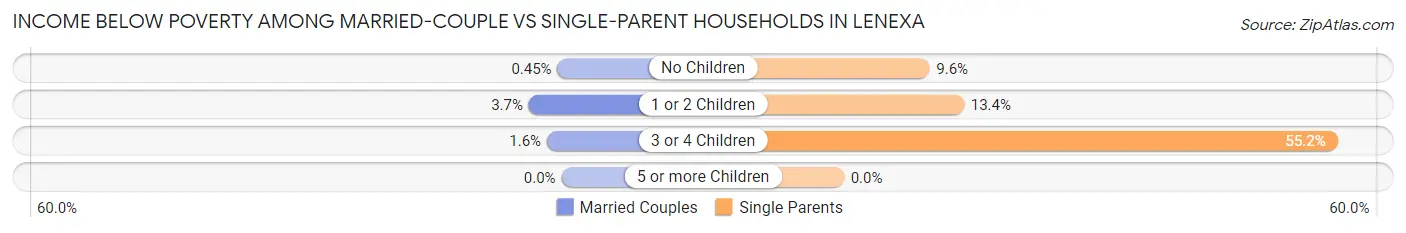
| Children | Married-Couple Families | Single-Parent Households |
| No Children | 35 (0.4%) | 120 (9.6%) |
| 1 or 2 Children | 140 (3.6%) | 203 (13.4%) |
| 3 or 4 Children | 18 (1.6%) | 101 (55.2%) |
| 5 or more Children | 0 (0.0%) | 0 (0.0%) |
| Total | 193 (1.5%) | 424 (14.4%) |
Race in Lenexa
The most populous races in Lenexa are White / Caucasian (45,644 | 79.4%), Hispanic or Latino (5,462 | 9.5%), and Two or more Races (3,964 | 6.9%).
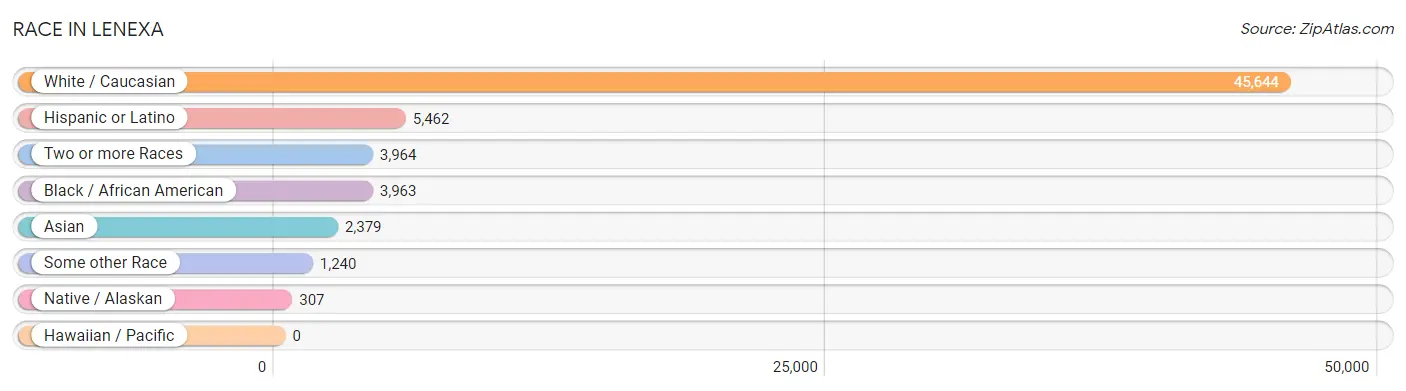
| Race | # Population | % Population |
| Asian | 2,379 | 4.1% |
| Black / African American | 3,963 | 6.9% |
| Hawaiian / Pacific | 0 | 0.0% |
| Hispanic or Latino | 5,462 | 9.5% |
| Native / Alaskan | 307 | 0.5% |
| White / Caucasian | 45,644 | 79.4% |
| Two or more Races | 3,964 | 6.9% |
| Some other Race | 1,240 | 2.2% |
| Total | 57,497 | 100.0% |
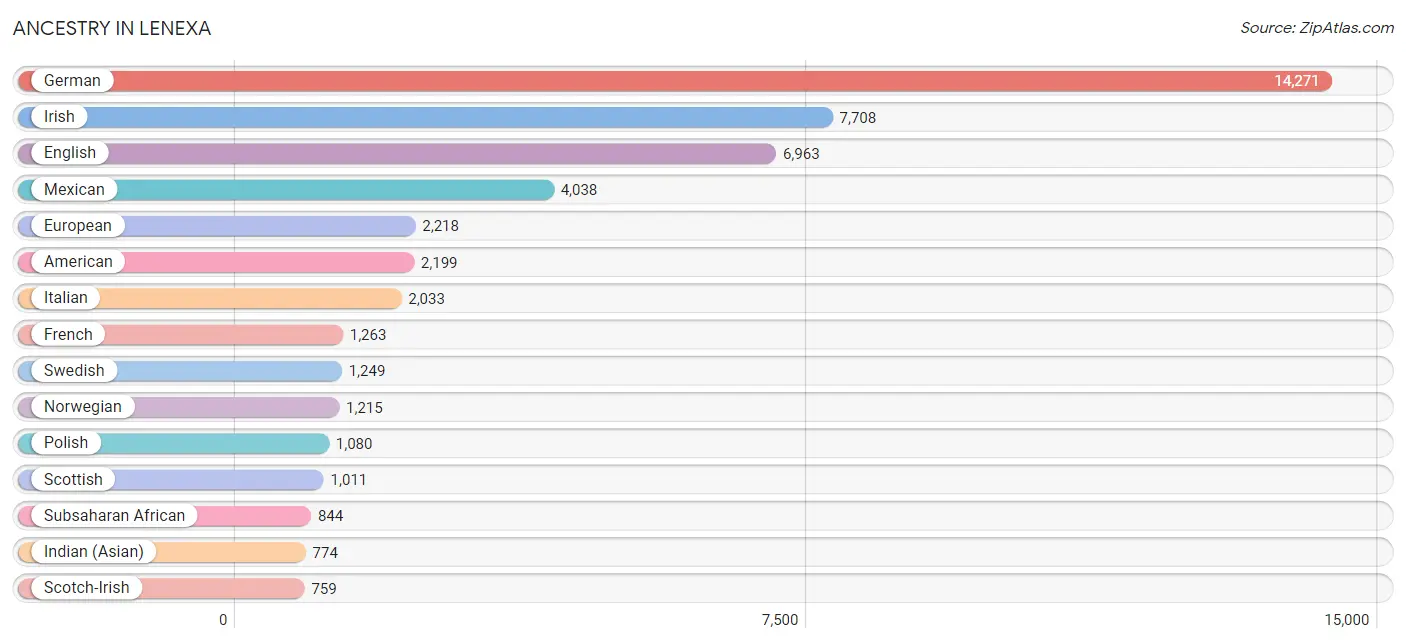
Ancestry in Lenexa
The most populous ancestries reported in Lenexa are German (14,271 | 24.8%), Irish (7,708 | 13.4%), English (6,963 | 12.1%), Mexican (4,038 | 7.0%), and European (2,218 | 3.9%), together accounting for 61.2% of all Lenexa residents.
| Ancestry | # Population | % Population |
| Afghan | 51 | 0.1% |
| African | 234 | 0.4% |
| Alaska Native | 30 | 0.1% |
| American | 2,199 | 3.8% |
| Apache | 5 | 0.0% |
| Arab | 342 | 0.6% |
| Argentinean | 140 | 0.2% |
| Australian | 4 | 0.0% |
| Austrian | 112 | 0.2% |
| Belgian | 448 | 0.8% |
| Bhutanese | 134 | 0.2% |
| Blackfeet | 6 | 0.0% |
| Brazilian | 83 | 0.1% |
| British | 438 | 0.8% |
| Bulgarian | 13 | 0.0% |
| Burmese | 240 | 0.4% |
| Canadian | 38 | 0.1% |
| Celtic | 28 | 0.1% |
| Central American | 609 | 1.1% |
| Central American Indian | 26 | 0.1% |
| Cherokee | 212 | 0.4% |
| Chickasaw | 11 | 0.0% |
| Chinese | 7 | 0.0% |
| Chippewa | 6 | 0.0% |
| Choctaw | 117 | 0.2% |
| Colombian | 142 | 0.3% |
| Creek | 31 | 0.1% |
| Croatian | 308 | 0.5% |
| Cuban | 31 | 0.1% |
| Czech | 551 | 1.0% |
| Czechoslovakian | 53 | 0.1% |
| Danish | 406 | 0.7% |
| Delaware | 6 | 0.0% |
| Dutch | 606 | 1.1% |
| Eastern European | 241 | 0.4% |
| English | 6,963 | 12.1% |
| Estonian | 11 | 0.0% |
| Ethiopian | 132 | 0.2% |
| European | 2,218 | 3.9% |
| Filipino | 29 | 0.1% |
| Finnish | 2 | 0.0% |
| French | 1,263 | 2.2% |
| French Canadian | 153 | 0.3% |
| German | 14,271 | 24.8% |
| German Russian | 11 | 0.0% |
| Ghanaian | 20 | 0.0% |
| Greek | 82 | 0.1% |
| Guamanian / Chamorro | 15 | 0.0% |
| Guatemalan | 280 | 0.5% |
| Honduran | 211 | 0.4% |
| Hopi | 20 | 0.0% |
| Hungarian | 164 | 0.3% |
| Indian (Asian) | 774 | 1.3% |
| Iranian | 55 | 0.1% |
| Irish | 7,708 | 13.4% |
| Iroquois | 23 | 0.0% |
| Italian | 2,033 | 3.5% |
| Jamaican | 65 | 0.1% |
| Kenyan | 220 | 0.4% |
| Kiowa | 12 | 0.0% |
| Korean | 176 | 0.3% |
| Laotian | 47 | 0.1% |
| Lebanese | 148 | 0.3% |
| Lithuanian | 42 | 0.1% |
| Luxembourger | 50 | 0.1% |
| Malaysian | 331 | 0.6% |
| Mexican | 4,038 | 7.0% |
| Mexican American Indian | 90 | 0.2% |
| Mongolian | 32 | 0.1% |
| New Zealander | 43 | 0.1% |
| Nicaraguan | 8 | 0.0% |
| Nigerian | 226 | 0.4% |
| Northern European | 147 | 0.3% |
| Norwegian | 1,215 | 2.1% |
| Ottawa | 2 | 0.0% |
| Pakistani | 53 | 0.1% |
| Palestinian | 45 | 0.1% |
| Paraguayan | 21 | 0.0% |
| Pennsylvania German | 19 | 0.0% |
| Peruvian | 30 | 0.1% |
| Polish | 1,080 | 1.9% |
| Portuguese | 23 | 0.0% |
| Potawatomi | 2 | 0.0% |
| Pueblo | 15 | 0.0% |
| Puerto Rican | 61 | 0.1% |
| Romanian | 43 | 0.1% |
| Russian | 135 | 0.2% |
| Salvadoran | 83 | 0.1% |
| Samoan | 53 | 0.1% |
| Scandinavian | 273 | 0.5% |
| Scotch-Irish | 759 | 1.3% |
| Scottish | 1,011 | 1.8% |
| Serbian | 12 | 0.0% |
| Sioux | 12 | 0.0% |
| Slavic | 24 | 0.0% |
| Slovak | 77 | 0.1% |
| Slovene | 2 | 0.0% |
| South American | 430 | 0.7% |
| Spaniard | 64 | 0.1% |
| Spanish | 130 | 0.2% |
| Spanish American | 15 | 0.0% |
| Sri Lankan | 428 | 0.7% |
| Subsaharan African | 844 | 1.5% |
| Swedish | 1,249 | 2.2% |
| Swiss | 329 | 0.6% |
| Syrian | 16 | 0.0% |
| Thai | 745 | 1.3% |
| Turkish | 45 | 0.1% |
| Ukrainian | 176 | 0.3% |
| Venezuelan | 80 | 0.1% |
| Welsh | 604 | 1.1% |
| Yugoslavian | 63 | 0.1% | View All 112 Rows |
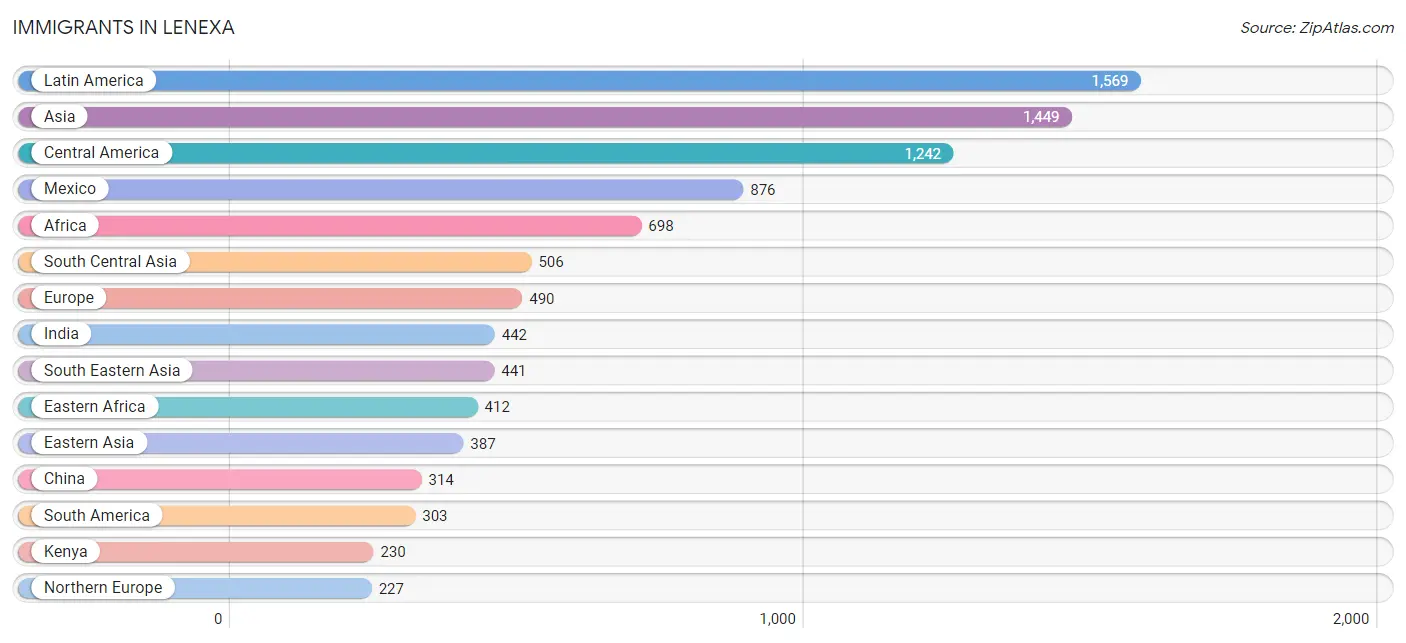
Immigrants in Lenexa
The most numerous immigrant groups reported in Lenexa came from Latin America (1,569 | 2.7%), Asia (1,449 | 2.5%), Central America (1,242 | 2.2%), Mexico (876 | 1.5%), and Africa (698 | 1.2%), together accounting for 10.1% of all Lenexa residents.
| Immigration Origin | # Population | % Population |
| Africa | 698 | 1.2% |
| Argentina | 16 | 0.0% |
| Asia | 1,449 | 2.5% |
| Australia | 1 | 0.0% |
| Brazil | 115 | 0.2% |
| Cameroon | 21 | 0.0% |
| Canada | 46 | 0.1% |
| Caribbean | 24 | 0.0% |
| Central America | 1,242 | 2.2% |
| China | 314 | 0.5% |
| Colombia | 47 | 0.1% |
| Cuba | 24 | 0.0% |
| Czechoslovakia | 8 | 0.0% |
| Eastern Africa | 412 | 0.7% |
| Eastern Asia | 387 | 0.7% |
| Eastern Europe | 158 | 0.3% |
| El Salvador | 34 | 0.1% |
| England | 153 | 0.3% |
| Ethiopia | 182 | 0.3% |
| Europe | 490 | 0.9% |
| France | 15 | 0.0% |
| Germany | 90 | 0.2% |
| Ghana | 40 | 0.1% |
| Guatemala | 206 | 0.4% |
| Honduras | 118 | 0.2% |
| Hungary | 34 | 0.1% |
| India | 442 | 0.8% |
| Indonesia | 9 | 0.0% |
| Iran | 34 | 0.1% |
| Iraq | 78 | 0.1% |
| Ireland | 16 | 0.0% |
| Japan | 11 | 0.0% |
| Kazakhstan | 11 | 0.0% |
| Kenya | 230 | 0.4% |
| Korea | 62 | 0.1% |
| Kuwait | 21 | 0.0% |
| Laos | 75 | 0.1% |
| Latin America | 1,569 | 2.7% |
| Malaysia | 27 | 0.1% |
| Mexico | 876 | 1.5% |
| Middle Africa | 21 | 0.0% |
| Nicaragua | 8 | 0.0% |
| Nigeria | 147 | 0.3% |
| Northern Africa | 78 | 0.1% |
| Northern Europe | 227 | 0.4% |
| Oceania | 23 | 0.0% |
| Pakistan | 5 | 0.0% |
| Peru | 7 | 0.0% |
| Philippines | 69 | 0.1% |
| Romania | 15 | 0.0% |
| Russia | 30 | 0.1% |
| Scotland | 7 | 0.0% |
| South America | 303 | 0.5% |
| South Central Asia | 506 | 0.9% |
| South Eastern Asia | 441 | 0.8% |
| Sri Lanka | 14 | 0.0% |
| Taiwan | 119 | 0.2% |
| Thailand | 66 | 0.1% |
| Turkey | 16 | 0.0% |
| Ukraine | 45 | 0.1% |
| Venezuela | 97 | 0.2% |
| Vietnam | 195 | 0.3% |
| Western Africa | 187 | 0.3% |
| Western Asia | 115 | 0.2% |
| Western Europe | 105 | 0.2% | View All 65 Rows |
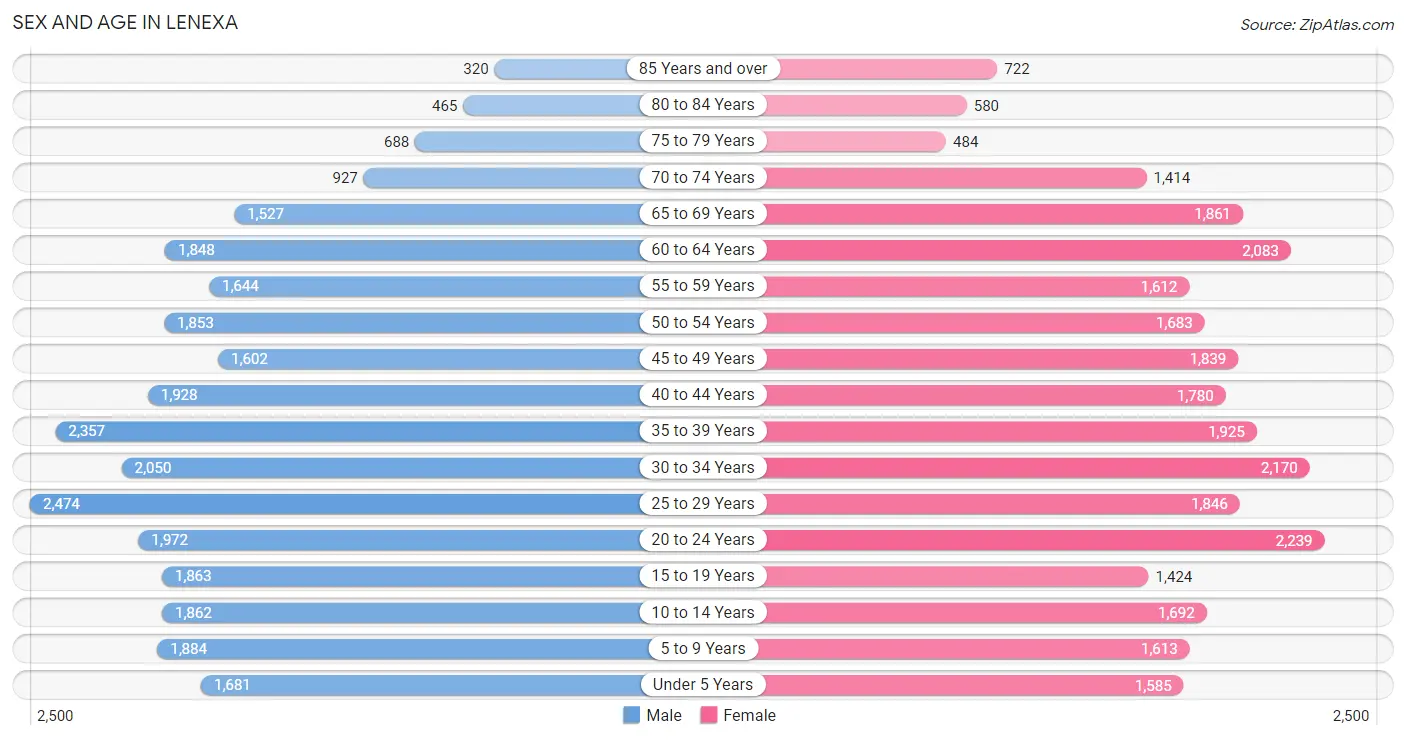
Sex and Age in Lenexa
Sex and Age in Lenexa
The most populous age groups in Lenexa are 25 to 29 Years (2,474 | 8.6%) for men and 20 to 24 Years (2,239 | 7.8%) for women.
| Age Bracket | Male | Female |
| Under 5 Years | 1,681 (5.8%) | 1,585 (5.6%) |
| 5 to 9 Years | 1,884 (6.5%) | 1,613 (5.7%) |
| 10 to 14 Years | 1,862 (6.4%) | 1,692 (5.9%) |
| 15 to 19 Years | 1,863 (6.4%) | 1,424 (5.0%) |
| 20 to 24 Years | 1,972 (6.8%) | 2,239 (7.8%) |
| 25 to 29 Years | 2,474 (8.6%) | 1,846 (6.5%) |
| 30 to 34 Years | 2,050 (7.1%) | 2,170 (7.6%) |
| 35 to 39 Years | 2,357 (8.1%) | 1,925 (6.7%) |
| 40 to 44 Years | 1,928 (6.7%) | 1,780 (6.2%) |
| 45 to 49 Years | 1,602 (5.5%) | 1,839 (6.4%) |
| 50 to 54 Years | 1,853 (6.4%) | 1,683 (5.9%) |
| 55 to 59 Years | 1,644 (5.7%) | 1,612 (5.7%) |
| 60 to 64 Years | 1,848 (6.4%) | 2,083 (7.3%) |
| 65 to 69 Years | 1,527 (5.3%) | 1,861 (6.5%) |
| 70 to 74 Years | 927 (3.2%) | 1,414 (5.0%) |
| 75 to 79 Years | 688 (2.4%) | 484 (1.7%) |
| 80 to 84 Years | 465 (1.6%) | 580 (2.0%) |
| 85 Years and over | 320 (1.1%) | 722 (2.5%) |
| Total | 28,945 (100.0%) | 28,552 (100.0%) |
Families and Households in Lenexa
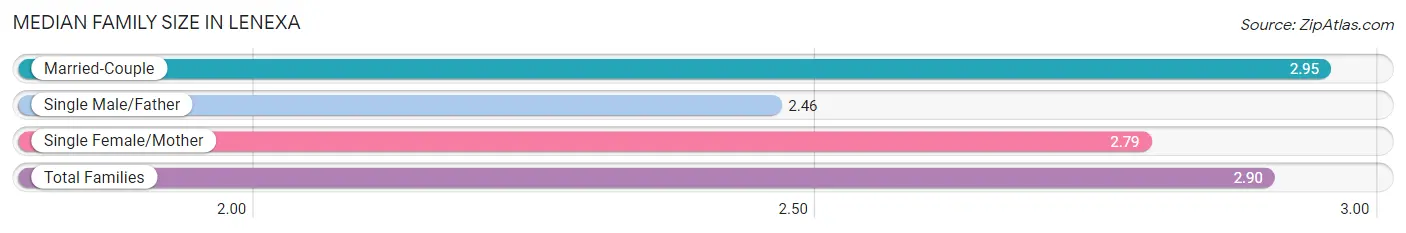
Median Family Size in Lenexa
The median family size in Lenexa is 2.90 persons per family, with married-couple families (12,704 | 81.2%) accounting for the largest median family size of 2.95 persons per family. On the other hand, single male/father families (1,070 | 6.8%) represent the smallest median family size with 2.46 persons per family.
| Family Type | # Families | Family Size |
| Married-Couple | 12,704 (81.2%) | 2.95 |
| Single Male/Father | 1,070 (6.8%) | 2.46 |
| Single Female/Mother | 1,878 (12.0%) | 2.79 |
| Total Families | 15,652 (100.0%) | 2.90 |
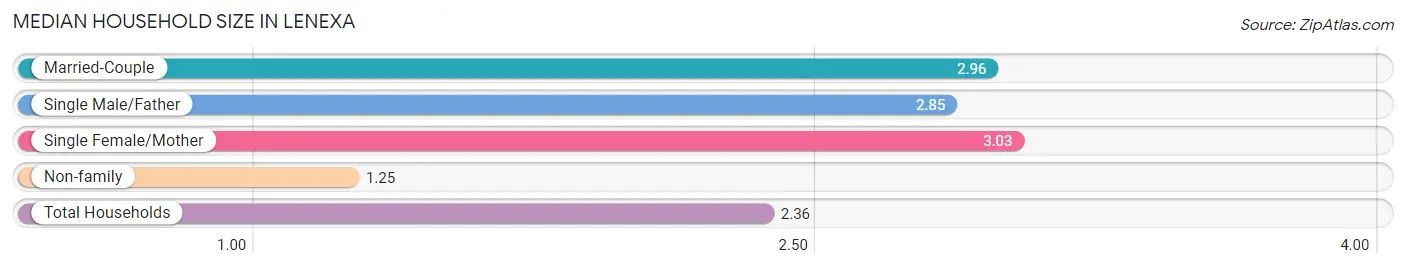
Median Household Size in Lenexa
The median household size in Lenexa is 2.36 persons per household, with single female/mother households (1,878 | 7.8%) accounting for the largest median household size of 3.03 persons per household. non-family households (8,547 | 35.3%) represent the smallest median household size with 1.25 persons per household.
| Household Type | # Households | Household Size |
| Married-Couple | 12,704 (52.5%) | 2.96 |
| Single Male/Father | 1,070 (4.4%) | 2.85 |
| Single Female/Mother | 1,878 (7.8%) | 3.03 |
| Non-family | 8,547 (35.3%) | 1.25 |
| Total Households | 24,199 (100.0%) | 2.36 |
Household Size by Marriage Status in Lenexa
Out of a total of 24,199 households in Lenexa, 15,652 (64.7%) are family households, while 8,547 (35.3%) are nonfamily households. The most numerous type of family households are 2-person households, comprising 7,729, and the most common type of nonfamily households are 1-person households, comprising 6,843.
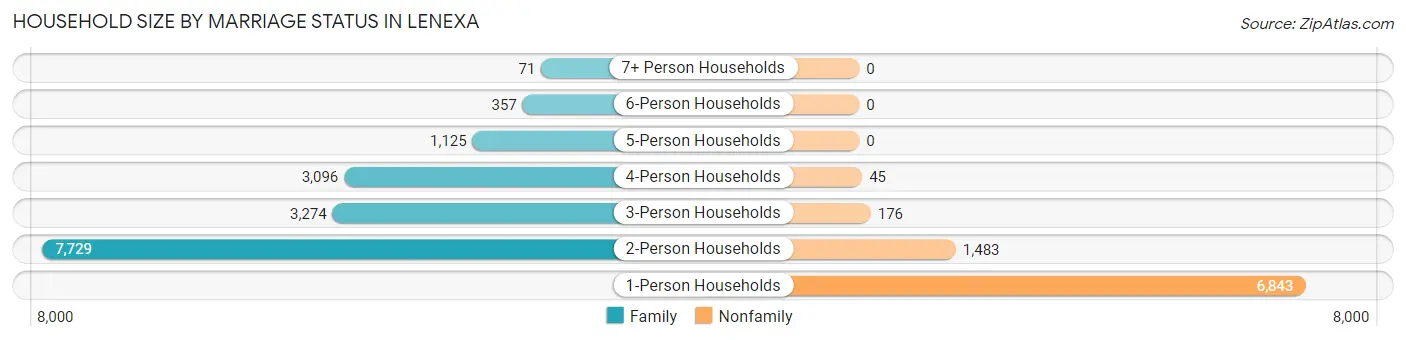
| Household Size | Family Households | Nonfamily Households |
| 1-Person Households | - | 6,843 (28.3%) |
| 2-Person Households | 7,729 (31.9%) | 1,483 (6.1%) |
| 3-Person Households | 3,274 (13.5%) | 176 (0.7%) |
| 4-Person Households | 3,096 (12.8%) | 45 (0.2%) |
| 5-Person Households | 1,125 (4.6%) | 0 (0.0%) |
| 6-Person Households | 357 (1.5%) | 0 (0.0%) |
| 7+ Person Households | 71 (0.3%) | 0 (0.0%) |
| Total | 15,652 (64.7%) | 8,547 (35.3%) |
Female Fertility in Lenexa
Fertility by Age in Lenexa
Average fertility rate in Lenexa is 60.0 births per 1,000 women. Women in the age bracket of 20 to 34 years have the highest fertility rate with 94.0 births per 1,000 women. Women in the age bracket of 20 to 34 years acount for 71.9% of all women with births.
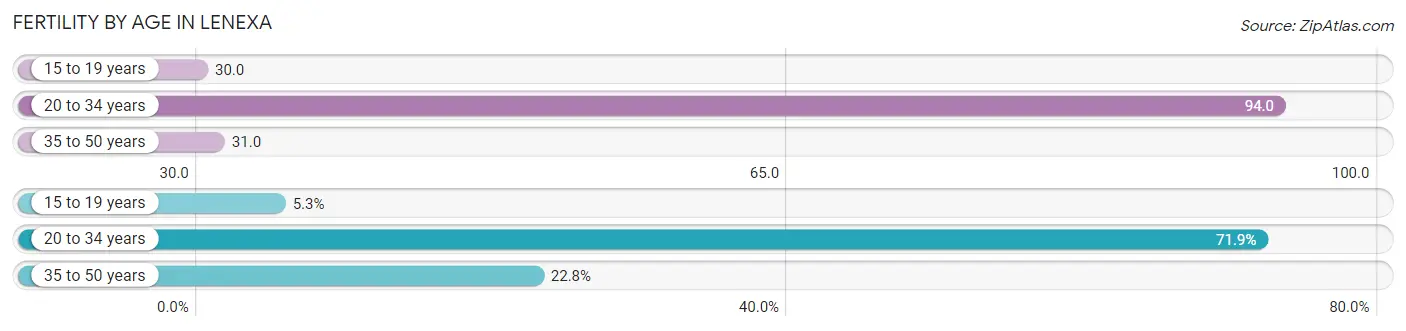
| Age Bracket | Women with Births | Births / 1,000 Women |
| 15 to 19 years | 43 (5.3%) | 30.0 |
| 20 to 34 years | 587 (71.9%) | 94.0 |
| 35 to 50 years | 186 (22.8%) | 31.0 |
| Total | 816 (100.0%) | 60.0 |
Fertility by Age by Marriage Status in Lenexa
85.2% of women with births (816) in Lenexa are married. The highest percentage of unmarried women with births falls into 15 to 19 years age bracket with 100.0% of them unmarried at the time of birth, while the lowest percentage of unmarried women with births belong to 35 to 50 years age bracket with 6.5% of them unmarried.
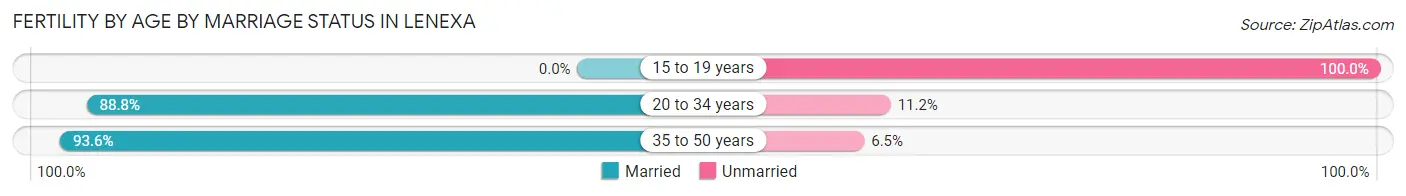
| Age Bracket | Married | Unmarried |
| 15 to 19 years | 0 (0.0%) | 43 (100.0%) |
| 20 to 34 years | 521 (88.8%) | 66 (11.2%) |
| 35 to 50 years | 174 (93.5%) | 12 (6.5%) |
| Total | 695 (85.2%) | 121 (14.8%) |
Fertility by Education in Lenexa
Average fertility rate in Lenexa is 60.0 births per 1,000 women. Women with the education attainment of graduate degree have the highest fertility rate of 78.0 births per 1,000 women, while women with the education attainment of less than high school have the lowest fertility at 23.0 births per 1,000 women. Women with the education attainment of bachelor's degree represent 34.2% of all women with births.
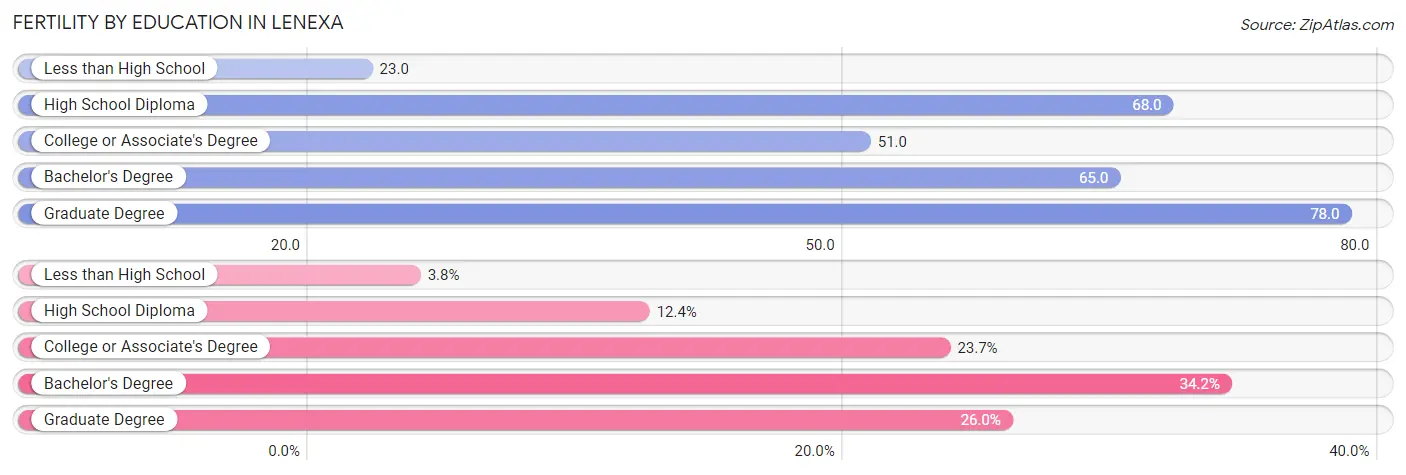
| Educational Attainment | Women with Births | Births / 1,000 Women |
| Less than High School | 31 (3.8%) | 23.0 |
| High School Diploma | 101 (12.4%) | 68.0 |
| College or Associate's Degree | 193 (23.6%) | 51.0 |
| Bachelor's Degree | 279 (34.2%) | 65.0 |
| Graduate Degree | 212 (26.0%) | 78.0 |
| Total | 816 (100.0%) | 60.0 |
Fertility by Education by Marriage Status in Lenexa
14.8% of women with births in Lenexa are unmarried. Women with the educational attainment of bachelor's degree are most likely to be married with 93.9% of them married at childbirth, while women with the educational attainment of high school diploma are least likely to be married with 60.4% of them unmarried at childbirth.
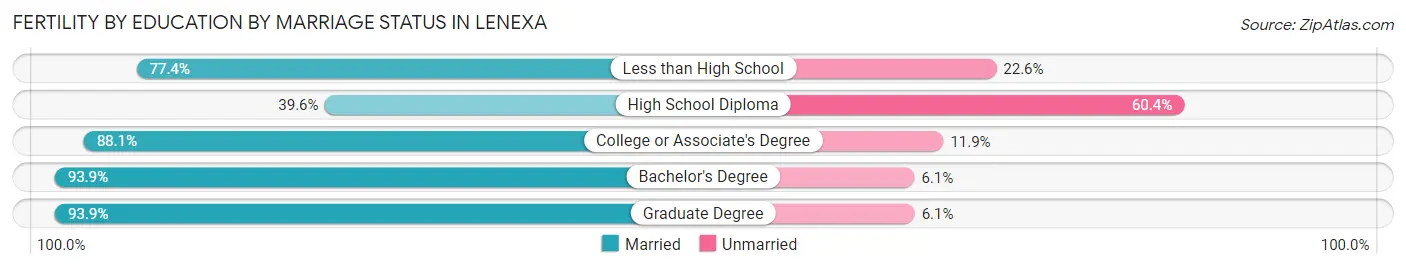
| Educational Attainment | Married | Unmarried |
| Less than High School | 24 (77.4%) | 7 (22.6%) |
| High School Diploma | 40 (39.6%) | 61 (60.4%) |
| College or Associate's Degree | 170 (88.1%) | 23 (11.9%) |
| Bachelor's Degree | 262 (93.9%) | 17 (6.1%) |
| Graduate Degree | 199 (93.9%) | 13 (6.1%) |
| Total | 695 (85.2%) | 121 (14.8%) |
Employment Characteristics in Lenexa
Employment by Class of Employer in Lenexa
Among the 33,031 employed individuals in Lenexa, private company employees (23,850 | 72.2%), not-for-profit organizations (2,432 | 7.4%), and local government employees (1,961 | 5.9%) make up the most common classes of employment.
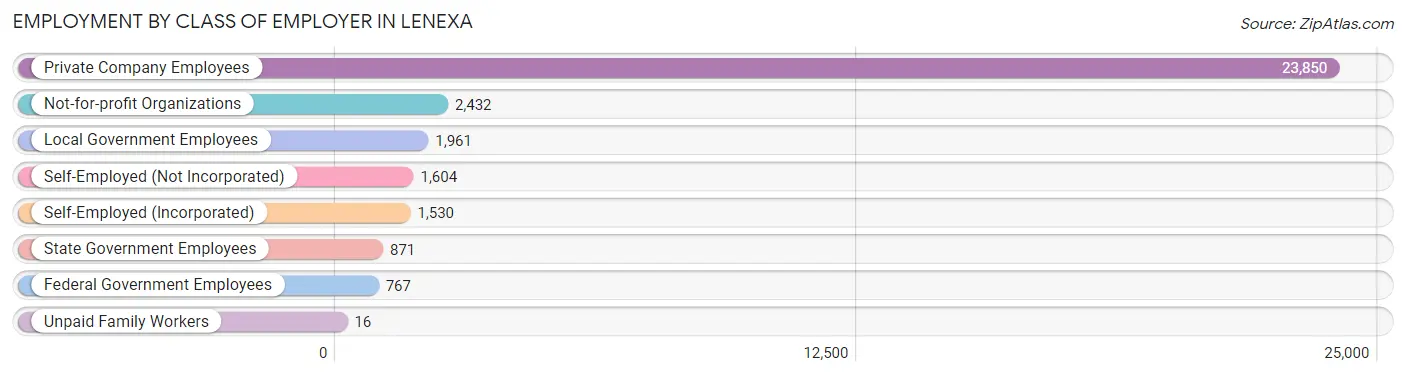
| Employer Class | # Employees | % Employees |
| Private Company Employees | 23,850 | 72.2% |
| Self-Employed (Incorporated) | 1,530 | 4.6% |
| Self-Employed (Not Incorporated) | 1,604 | 4.9% |
| Not-for-profit Organizations | 2,432 | 7.4% |
| Local Government Employees | 1,961 | 5.9% |
| State Government Employees | 871 | 2.6% |
| Federal Government Employees | 767 | 2.3% |
| Unpaid Family Workers | 16 | 0.1% |
| Total | 33,031 | 100.0% |
Employment Status by Age in Lenexa
According to the labor force statistics for Lenexa, out of the total population over 16 years of age (46,466), 73.8% or 34,292 individuals are in the labor force, with 2.6% or 892 of them unemployed. The age group with the highest labor force participation rate is 35 to 44 years, with 92.6% or 7,399 individuals in the labor force. Within the labor force, the 16 to 19 years age range has the highest percentage of unemployed individuals, with 9.7% or 142 of them being unemployed.
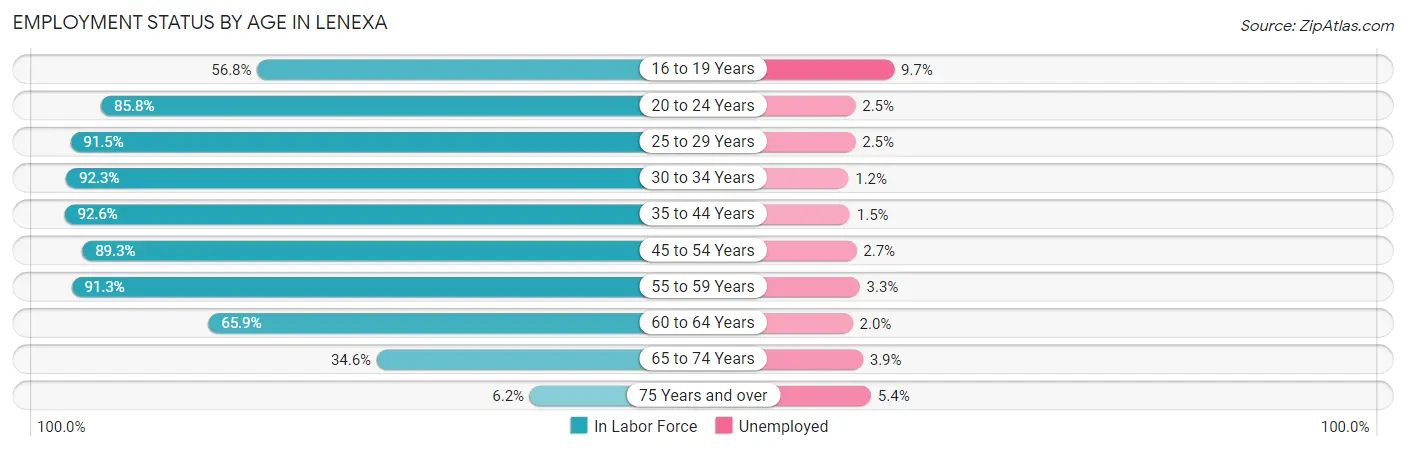
| Age Bracket | In Labor Force | Unemployed |
| 16 to 19 Years | 1,461 (56.8%) | 142 (9.7%) |
| 20 to 24 Years | 3,613 (85.8%) | 90 (2.5%) |
| 25 to 29 Years | 3,953 (91.5%) | 99 (2.5%) |
| 30 to 34 Years | 3,895 (92.3%) | 47 (1.2%) |
| 35 to 44 Years | 7,399 (92.6%) | 111 (1.5%) |
| 45 to 54 Years | 6,230 (89.3%) | 168 (2.7%) |
| 55 to 59 Years | 2,973 (91.3%) | 98 (3.3%) |
| 60 to 64 Years | 2,591 (65.9%) | 52 (2.0%) |
| 65 to 74 Years | 1,982 (34.6%) | 77 (3.9%) |
| 75 Years and over | 202 (6.2%) | 11 (5.4%) |
| Total | 34,292 (73.8%) | 892 (2.6%) |
Employment Status by Educational Attainment in Lenexa
According to labor force statistics for Lenexa, 88.1% of individuals (27,041) out of the total population between 25 and 64 years of age (30,694) are in the labor force, with 2.1% or 568 of them being unemployed. The group with the highest labor force participation rate are those with the educational attainment of bachelor's degree or higher, with 90.0% or 15,968 individuals in the labor force. Within the labor force, individuals with high school diploma education have the highest percentage of unemployment, with 5.2% or 170 of them being unemployed.
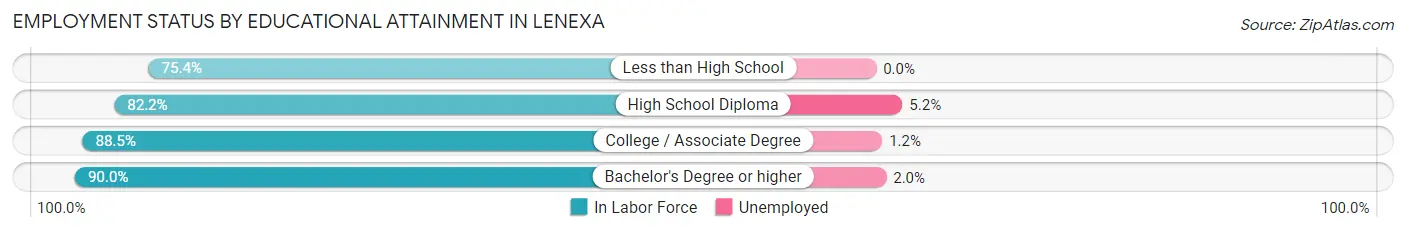
| Educational Attainment | In Labor Force | Unemployed |
| Less than High School | 723 (75.4%) | 0 (0.0%) |
| High School Diploma | 3,273 (82.2%) | 207 (5.2%) |
| College / Associate Degree | 7,090 (88.5%) | 96 (1.2%) |
| Bachelor's Degree or higher | 15,968 (90.0%) | 355 (2.0%) |
| Total | 27,041 (88.1%) | 645 (2.1%) |
Employment Occupations by Sex in Lenexa
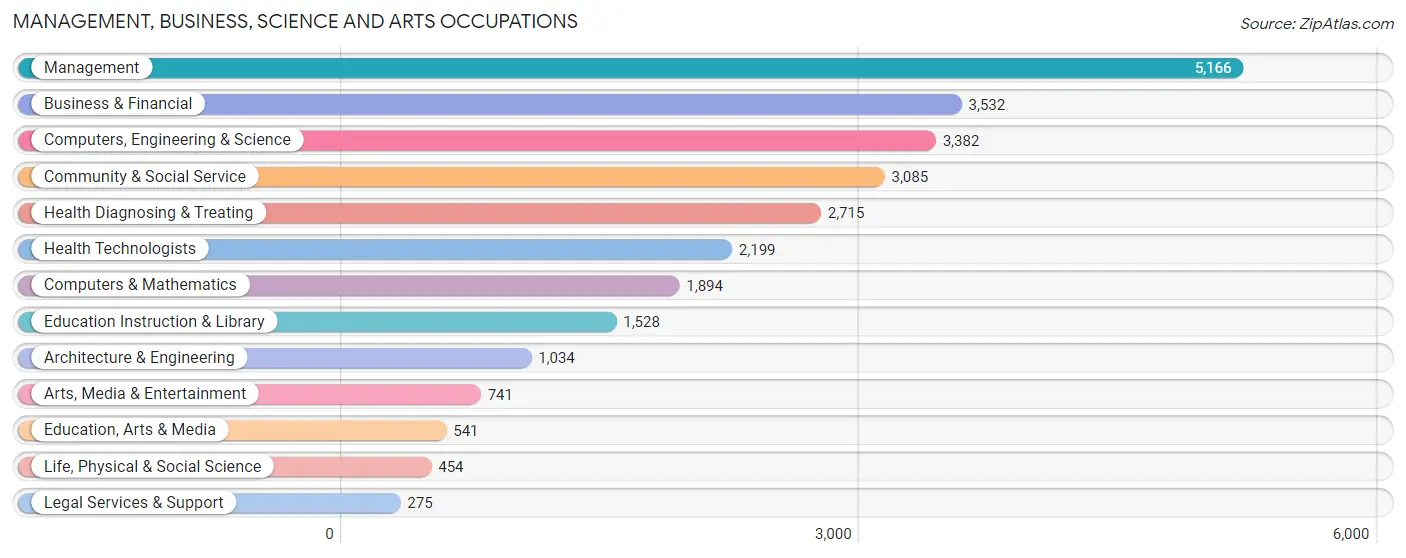
Management, Business, Science and Arts Occupations
The most common Management, Business, Science and Arts occupations in Lenexa are Management (5,166 | 15.5%), Business & Financial (3,532 | 10.6%), Computers, Engineering & Science (3,382 | 10.1%), Community & Social Service (3,085 | 9.2%), and Health Diagnosing & Treating (2,715 | 8.1%).
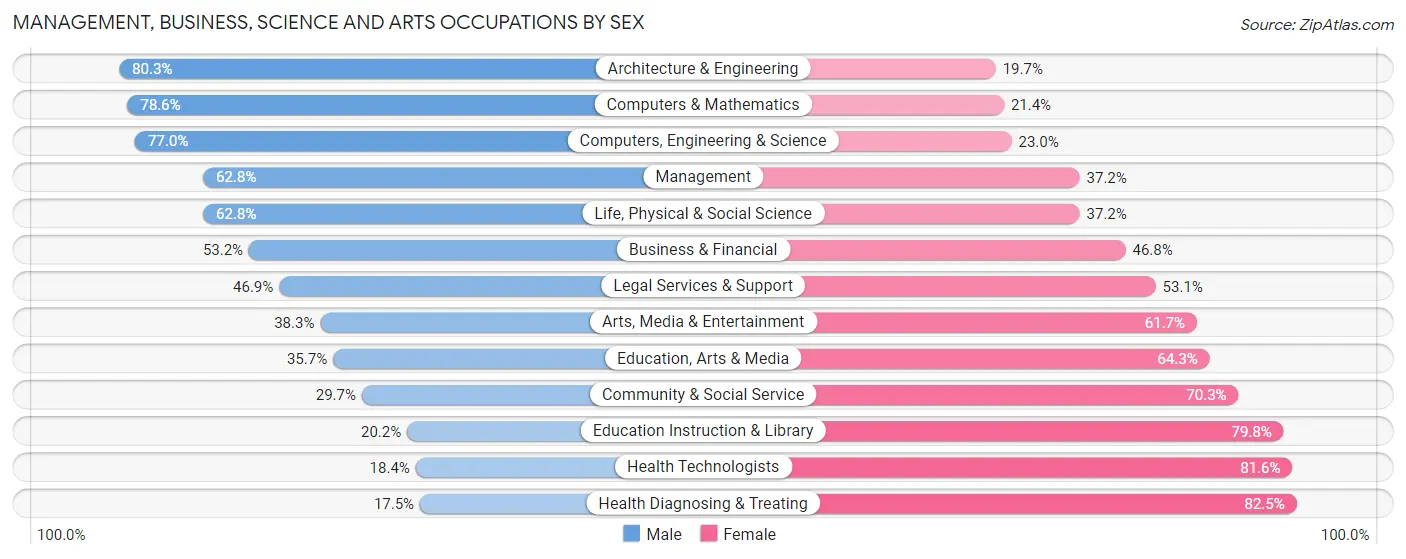
Management, Business, Science and Arts Occupations by Sex
Within the Management, Business, Science and Arts occupations in Lenexa, the most male-oriented occupations are Architecture & Engineering (80.3%), Computers & Mathematics (78.6%), and Computers, Engineering & Science (77.0%), while the most female-oriented occupations are Health Diagnosing & Treating (82.5%), Health Technologists (81.6%), and Education Instruction & Library (79.8%).
| Occupation | Male | Female |
| Management | 3,243 (62.8%) | 1,923 (37.2%) |
| Business & Financial | 1,879 (53.2%) | 1,653 (46.8%) |
| Computers, Engineering & Science | 2,603 (77.0%) | 779 (23.0%) |
| Computers & Mathematics | 1,488 (78.6%) | 406 (21.4%) |
| Architecture & Engineering | 830 (80.3%) | 204 (19.7%) |
| Life, Physical & Social Science | 285 (62.8%) | 169 (37.2%) |
| Community & Social Service | 915 (29.7%) | 2,170 (70.3%) |
| Education, Arts & Media | 193 (35.7%) | 348 (64.3%) |
| Legal Services & Support | 129 (46.9%) | 146 (53.1%) |
| Education Instruction & Library | 309 (20.2%) | 1,219 (79.8%) |
| Arts, Media & Entertainment | 284 (38.3%) | 457 (61.7%) |
| Health Diagnosing & Treating | 476 (17.5%) | 2,239 (82.5%) |
| Health Technologists | 405 (18.4%) | 1,794 (81.6%) |
| Total (Category) | 9,116 (51.0%) | 8,764 (49.0%) |
| Total (Overall) | 17,486 (52.4%) | 15,868 (47.6%) |
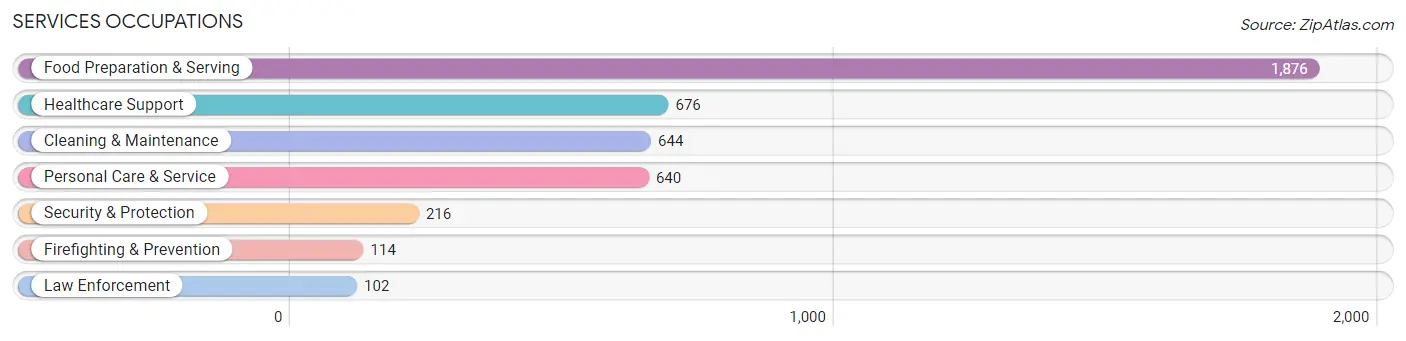
Services Occupations
The most common Services occupations in Lenexa are Food Preparation & Serving (1,876 | 5.6%), Healthcare Support (676 | 2.0%), Cleaning & Maintenance (644 | 1.9%), Personal Care & Service (640 | 1.9%), and Security & Protection (216 | 0.6%).
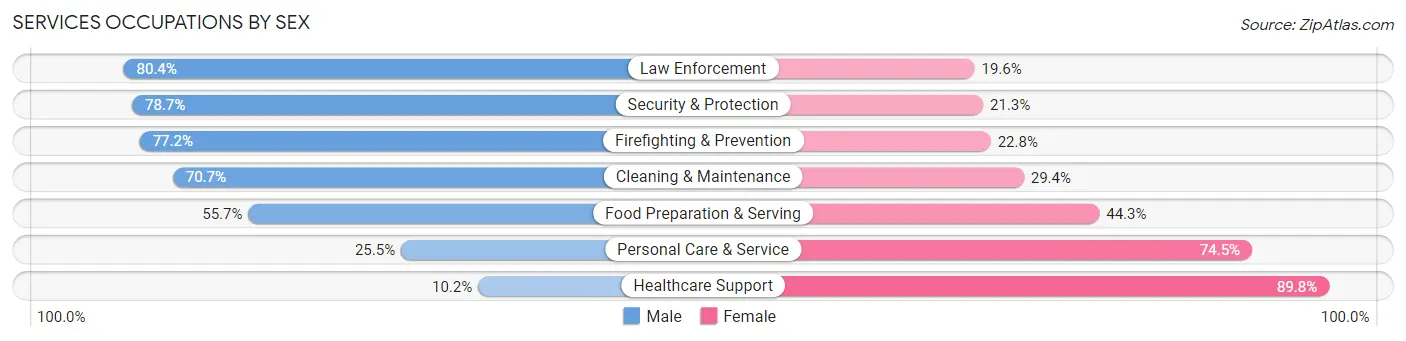
Services Occupations by Sex
Within the Services occupations in Lenexa, the most male-oriented occupations are Law Enforcement (80.4%), Security & Protection (78.7%), and Firefighting & Prevention (77.2%), while the most female-oriented occupations are Healthcare Support (89.8%), Personal Care & Service (74.5%), and Food Preparation & Serving (44.3%).
| Occupation | Male | Female |
| Healthcare Support | 69 (10.2%) | 607 (89.8%) |
| Security & Protection | 170 (78.7%) | 46 (21.3%) |
| Firefighting & Prevention | 88 (77.2%) | 26 (22.8%) |
| Law Enforcement | 82 (80.4%) | 20 (19.6%) |
| Food Preparation & Serving | 1,045 (55.7%) | 831 (44.3%) |
| Cleaning & Maintenance | 455 (70.7%) | 189 (29.3%) |
| Personal Care & Service | 163 (25.5%) | 477 (74.5%) |
| Total (Category) | 1,902 (46.9%) | 2,150 (53.1%) |
| Total (Overall) | 17,486 (52.4%) | 15,868 (47.6%) |
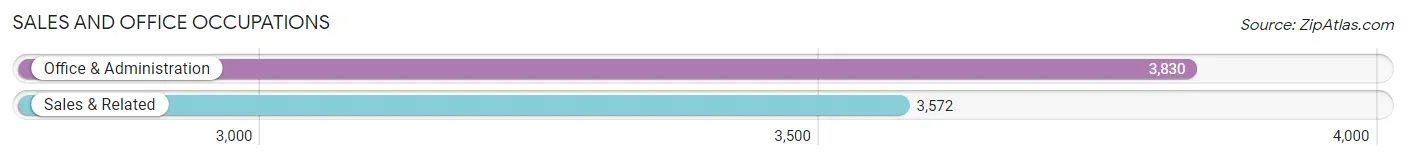
Sales and Office Occupations
The most common Sales and Office occupations in Lenexa are Office & Administration (3,830 | 11.5%), and Sales & Related (3,572 | 10.7%).
Sales and Office Occupations by Sex
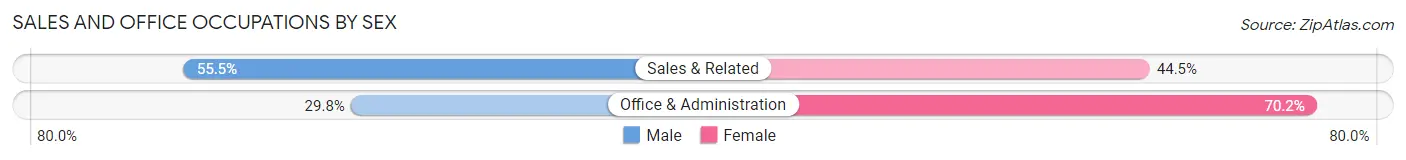
| Occupation | Male | Female |
| Sales & Related | 1,982 (55.5%) | 1,590 (44.5%) |
| Office & Administration | 1,143 (29.8%) | 2,687 (70.2%) |
| Total (Category) | 3,125 (42.2%) | 4,277 (57.8%) |
| Total (Overall) | 17,486 (52.4%) | 15,868 (47.6%) |
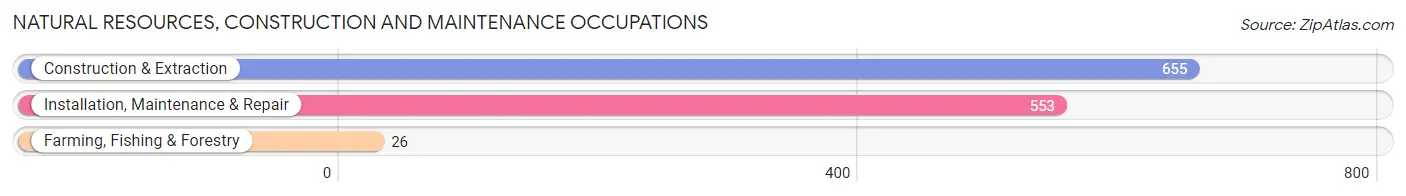
Natural Resources, Construction and Maintenance Occupations
The most common Natural Resources, Construction and Maintenance occupations in Lenexa are Construction & Extraction (655 | 2.0%), Installation, Maintenance & Repair (553 | 1.7%), and Farming, Fishing & Forestry (26 | 0.1%).
Natural Resources, Construction and Maintenance Occupations by Sex
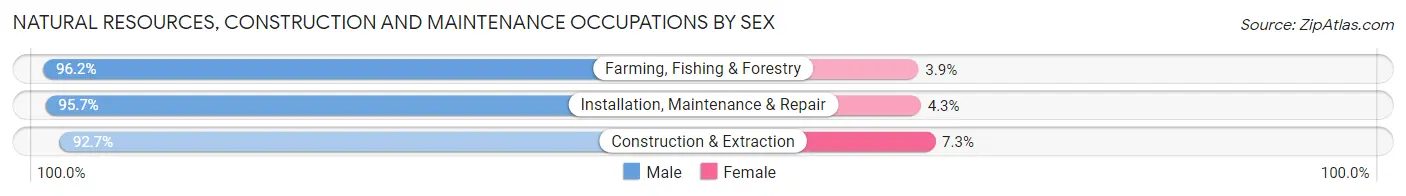
| Occupation | Male | Female |
| Farming, Fishing & Forestry | 25 (96.2%) | 1 (3.8%) |
| Construction & Extraction | 607 (92.7%) | 48 (7.3%) |
| Installation, Maintenance & Repair | 529 (95.7%) | 24 (4.3%) |
| Total (Category) | 1,161 (94.1%) | 73 (5.9%) |
| Total (Overall) | 17,486 (52.4%) | 15,868 (47.6%) |
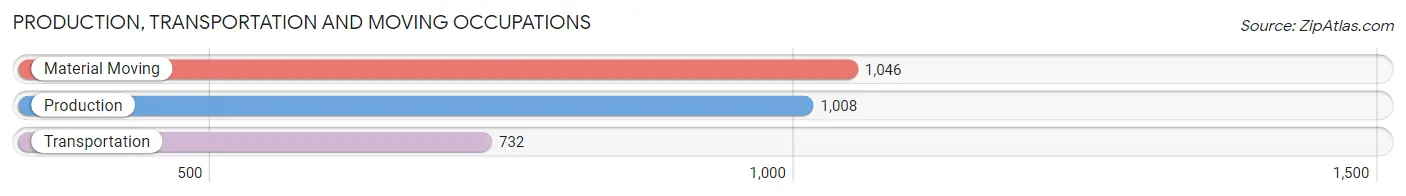
Production, Transportation and Moving Occupations
The most common Production, Transportation and Moving occupations in Lenexa are Material Moving (1,046 | 3.1%), Production (1,008 | 3.0%), and Transportation (732 | 2.2%).
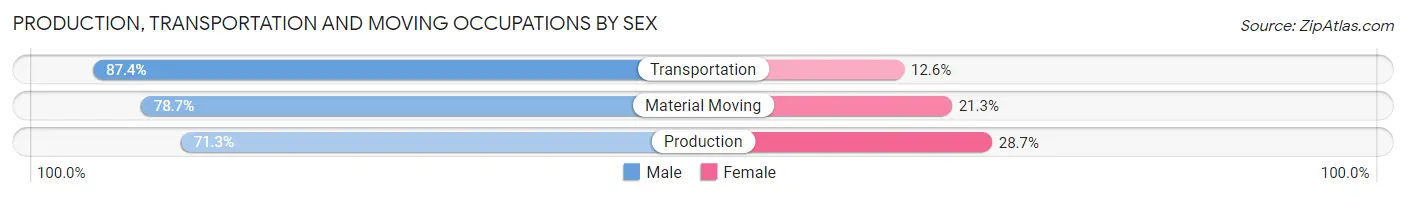
Production, Transportation and Moving Occupations by Sex
| Occupation | Male | Female |
| Production | 719 (71.3%) | 289 (28.7%) |
| Transportation | 640 (87.4%) | 92 (12.6%) |
| Material Moving | 823 (78.7%) | 223 (21.3%) |
| Total (Category) | 2,182 (78.3%) | 604 (21.7%) |
| Total (Overall) | 17,486 (52.4%) | 15,868 (47.6%) |
Employment Industries by Sex in Lenexa
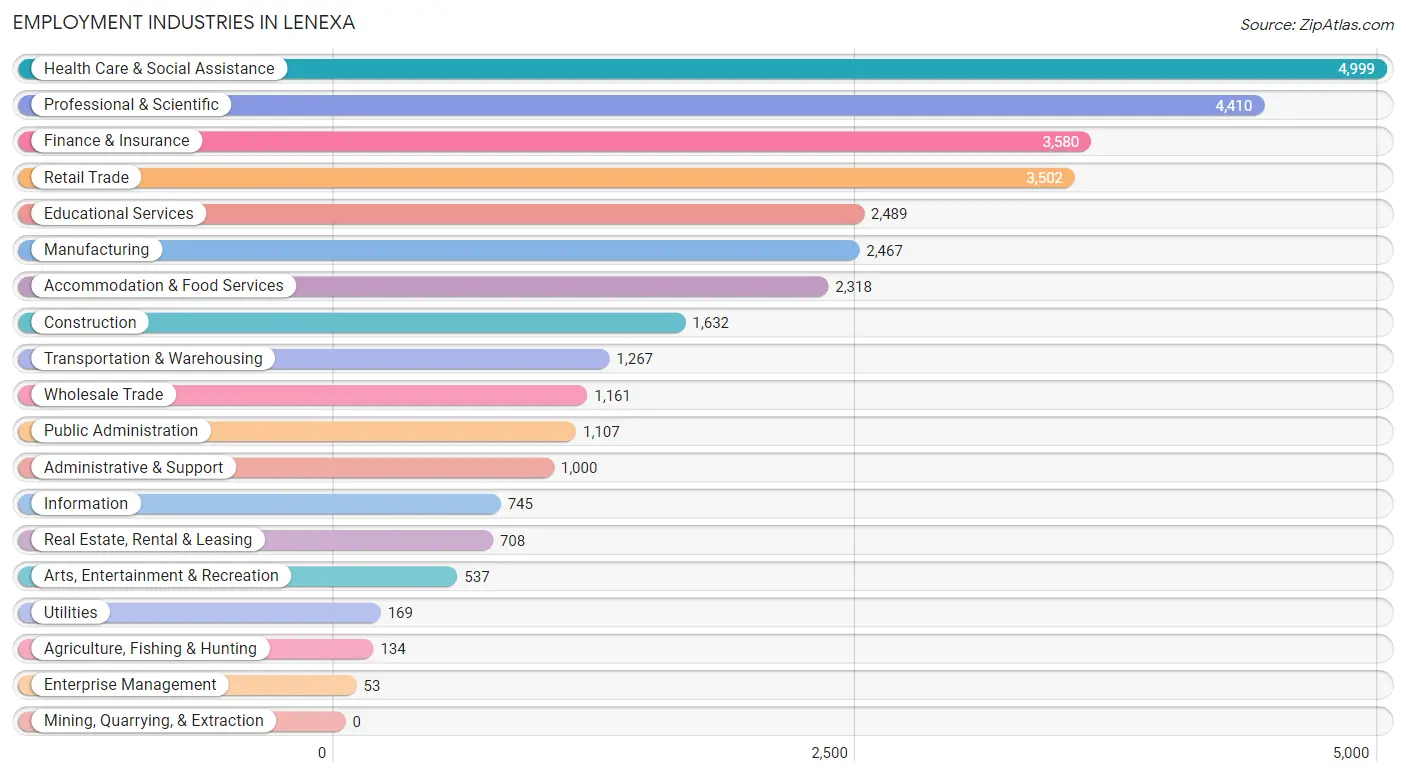
Employment Industries in Lenexa
The major employment industries in Lenexa include Health Care & Social Assistance (4,999 | 15.0%), Professional & Scientific (4,410 | 13.2%), Finance & Insurance (3,580 | 10.7%), Retail Trade (3,502 | 10.5%), and Educational Services (2,489 | 7.5%).
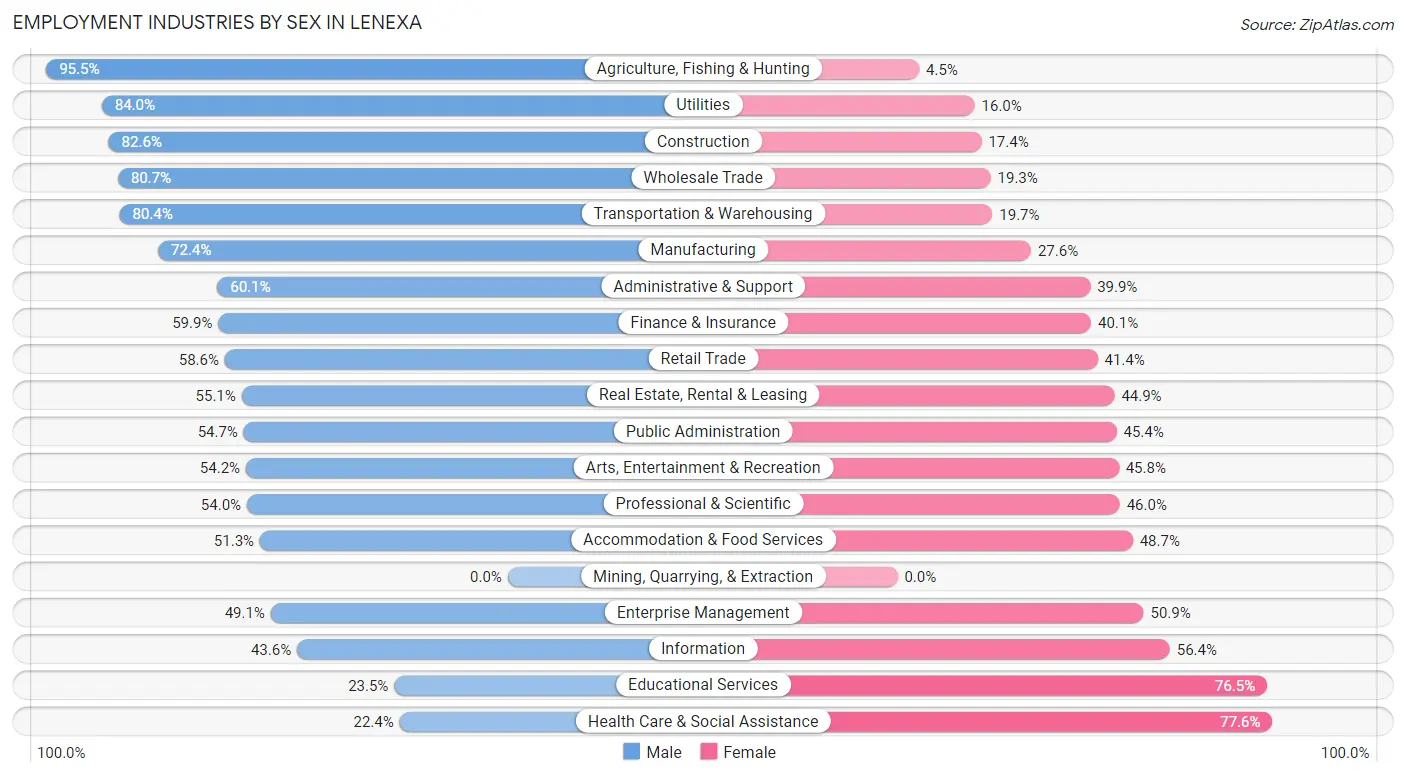
Employment Industries by Sex in Lenexa
The Lenexa industries that see more men than women are Agriculture, Fishing & Hunting (95.5%), Utilities (84.0%), and Construction (82.6%), whereas the industries that tend to have a higher number of women are Health Care & Social Assistance (77.6%), Educational Services (76.5%), and Information (56.4%).
| Industry | Male | Female |
| Agriculture, Fishing & Hunting | 128 (95.5%) | 6 (4.5%) |
| Mining, Quarrying, & Extraction | 0 (0.0%) | 0 (0.0%) |
| Construction | 1,348 (82.6%) | 284 (17.4%) |
| Manufacturing | 1,785 (72.4%) | 682 (27.6%) |
| Wholesale Trade | 937 (80.7%) | 224 (19.3%) |
| Retail Trade | 2,051 (58.6%) | 1,451 (41.4%) |
| Transportation & Warehousing | 1,018 (80.3%) | 249 (19.7%) |
| Utilities | 142 (84.0%) | 27 (16.0%) |
| Information | 325 (43.6%) | 420 (56.4%) |
| Finance & Insurance | 2,145 (59.9%) | 1,435 (40.1%) |
| Real Estate, Rental & Leasing | 390 (55.1%) | 318 (44.9%) |
| Professional & Scientific | 2,381 (54.0%) | 2,029 (46.0%) |
| Enterprise Management | 26 (49.1%) | 27 (50.9%) |
| Administrative & Support | 601 (60.1%) | 399 (39.9%) |
| Educational Services | 585 (23.5%) | 1,904 (76.5%) |
| Health Care & Social Assistance | 1,120 (22.4%) | 3,879 (77.6%) |
| Arts, Entertainment & Recreation | 291 (54.2%) | 246 (45.8%) |
| Accommodation & Food Services | 1,189 (51.3%) | 1,129 (48.7%) |
| Public Administration | 605 (54.6%) | 502 (45.4%) |
| Total | 17,486 (52.4%) | 15,868 (47.6%) |
Education in Lenexa
School Enrollment in Lenexa
The most common levels of schooling among the 13,582 students in Lenexa are elementary school (2,977 | 21.9%), high school (2,963 | 21.8%), and middle school (2,731 | 20.1%).
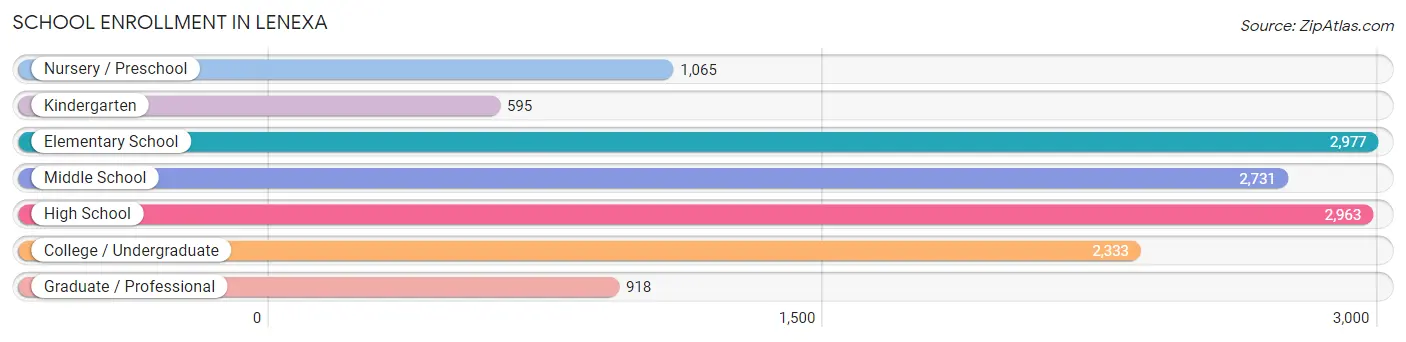
| School Level | # Students | % Students |
| Nursery / Preschool | 1,065 | 7.8% |
| Kindergarten | 595 | 4.4% |
| Elementary School | 2,977 | 21.9% |
| Middle School | 2,731 | 20.1% |
| High School | 2,963 | 21.8% |
| College / Undergraduate | 2,333 | 17.2% |
| Graduate / Professional | 918 | 6.8% |
| Total | 13,582 | 100.0% |
School Enrollment by Age by Funding Source in Lenexa
Out of a total of 13,582 students who are enrolled in schools in Lenexa, 2,676 (19.7%) attend a private institution, while the remaining 10,906 (80.3%) are enrolled in public schools. The age group of 3 to 4 year olds has the highest likelihood of being enrolled in private schools, with 484 (55.2% in the age bracket) enrolled. Conversely, the age group of 15 to 17 year olds has the lowest likelihood of being enrolled in a private school, with 1,990 (93.0% in the age bracket) attending a public institution.
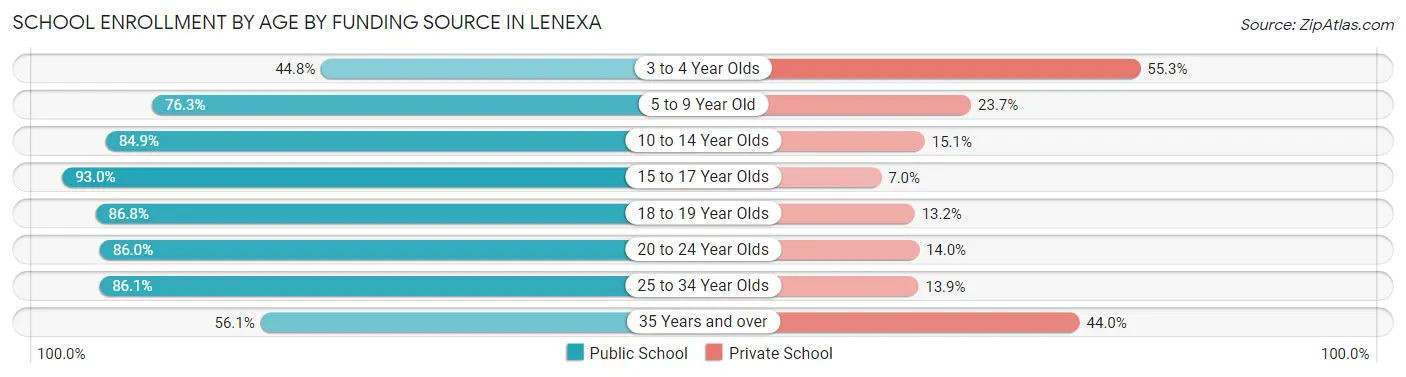
| Age Bracket | Public School | Private School |
| 3 to 4 Year Olds | 392 (44.8%) | 484 (55.2%) |
| 5 to 9 Year Old | 2,515 (76.3%) | 783 (23.7%) |
| 10 to 14 Year Olds | 2,927 (84.9%) | 521 (15.1%) |
| 15 to 17 Year Olds | 1,990 (93.0%) | 150 (7.0%) |
| 18 to 19 Year Olds | 748 (86.8%) | 114 (13.2%) |
| 20 to 24 Year Olds | 1,073 (86.0%) | 175 (14.0%) |
| 25 to 34 Year Olds | 867 (86.1%) | 140 (13.9%) |
| 35 Years and over | 394 (56.0%) | 309 (44.0%) |
| Total | 10,906 (80.3%) | 2,676 (19.7%) |
Educational Attainment by Field of Study in Lenexa
Business (6,600 | 27.6%), education (2,469 | 10.3%), science & technology (2,409 | 10.1%), engineering (1,922 | 8.0%), and arts & humanities (1,463 | 6.1%) are the most common fields of study among 23,922 individuals in Lenexa who have obtained a bachelor's degree or higher.
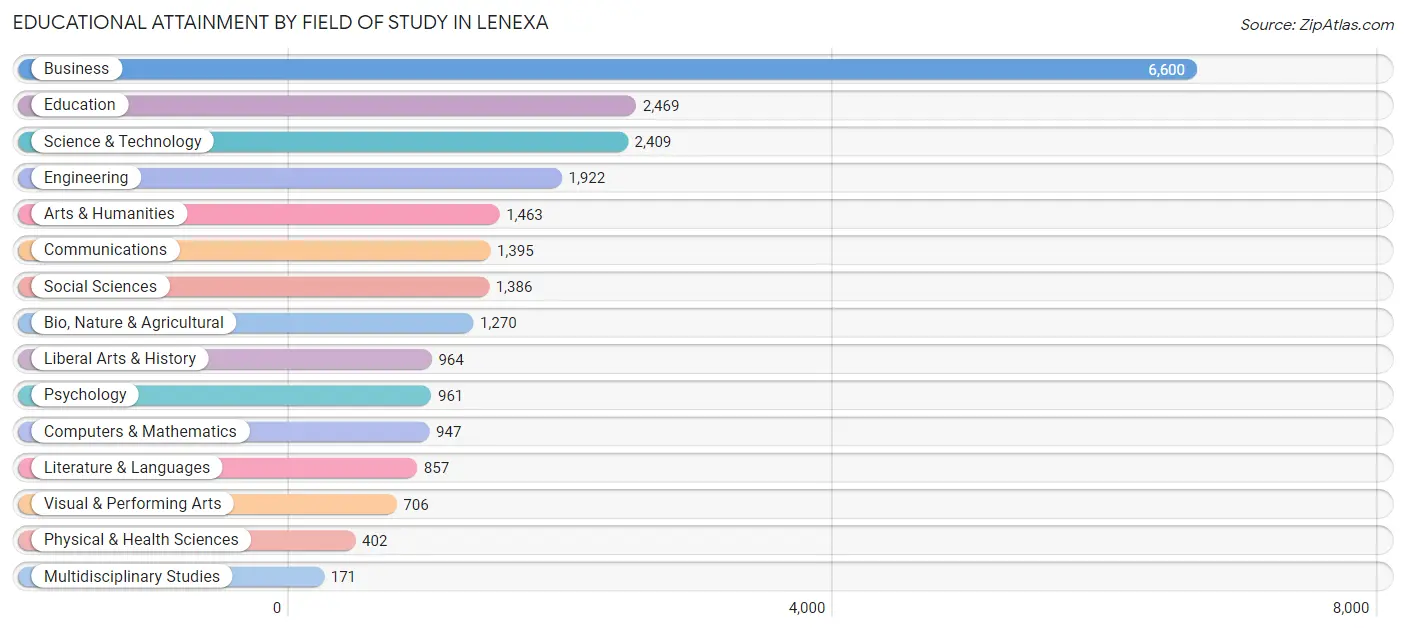
| Field of Study | # Graduates | % Graduates |
| Computers & Mathematics | 947 | 4.0% |
| Bio, Nature & Agricultural | 1,270 | 5.3% |
| Physical & Health Sciences | 402 | 1.7% |
| Psychology | 961 | 4.0% |
| Social Sciences | 1,386 | 5.8% |
| Engineering | 1,922 | 8.0% |
| Multidisciplinary Studies | 171 | 0.7% |
| Science & Technology | 2,409 | 10.1% |
| Business | 6,600 | 27.6% |
| Education | 2,469 | 10.3% |
| Literature & Languages | 857 | 3.6% |
| Liberal Arts & History | 964 | 4.0% |
| Visual & Performing Arts | 706 | 2.9% |
| Communications | 1,395 | 5.8% |
| Arts & Humanities | 1,463 | 6.1% |
| Total | 23,922 | 100.0% |
Transportation & Commute in Lenexa
Vehicle Availability by Sex in Lenexa
The most prevalent vehicle ownership categories in Lenexa are males with 2 vehicles (8,537, accounting for 49.1%) and females with 2 vehicles (7,516, making up 54.6%).
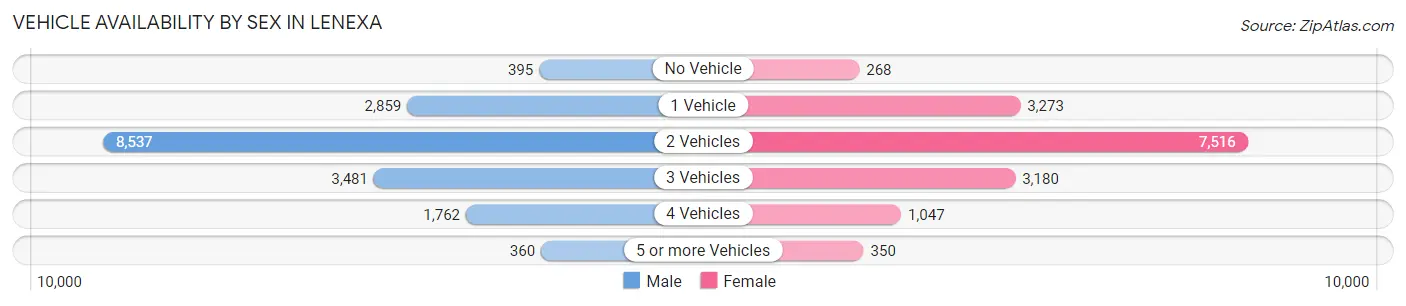
| Vehicles Available | Male | Female |
| No Vehicle | 395 (2.3%) | 268 (1.7%) |
| 1 Vehicle | 2,859 (16.4%) | 3,273 (20.9%) |
| 2 Vehicles | 8,537 (49.1%) | 7,516 (48.1%) |
| 3 Vehicles | 3,481 (20.0%) | 3,180 (20.3%) |
| 4 Vehicles | 1,762 (10.1%) | 1,047 (6.7%) |
| 5 or more Vehicles | 360 (2.1%) | 350 (2.2%) |
| Total | 17,394 (100.0%) | 15,634 (100.0%) |
Commute Time in Lenexa
The most frequently occuring commute durations in Lenexa are 15 to 19 minutes (5,553 commuters, 20.6%), 20 to 24 minutes (5,146 commuters, 19.1%), and 10 to 14 minutes (4,695 commuters, 17.5%).
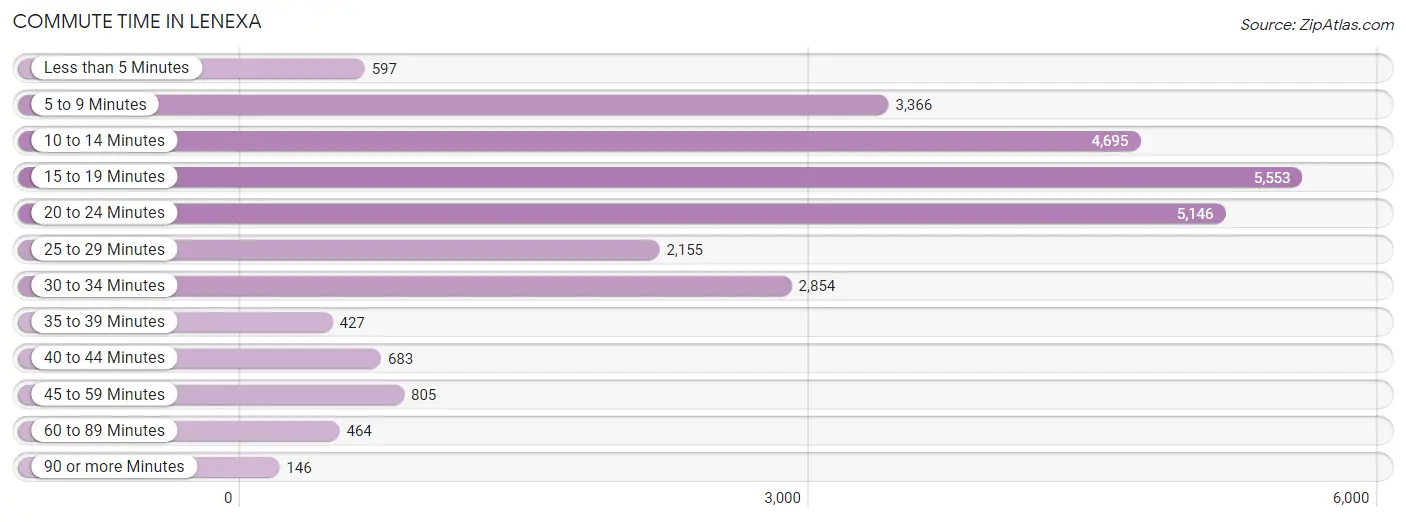
| Commute Time | # Commuters | % Commuters |
| Less than 5 Minutes | 597 | 2.2% |
| 5 to 9 Minutes | 3,366 | 12.5% |
| 10 to 14 Minutes | 4,695 | 17.5% |
| 15 to 19 Minutes | 5,553 | 20.6% |
| 20 to 24 Minutes | 5,146 | 19.1% |
| 25 to 29 Minutes | 2,155 | 8.0% |
| 30 to 34 Minutes | 2,854 | 10.6% |
| 35 to 39 Minutes | 427 | 1.6% |
| 40 to 44 Minutes | 683 | 2.5% |
| 45 to 59 Minutes | 805 | 3.0% |
| 60 to 89 Minutes | 464 | 1.7% |
| 90 or more Minutes | 146 | 0.5% |
Commute Time by Sex in Lenexa
The most common commute times in Lenexa are 15 to 19 minutes (2,867 commuters, 20.5%) for males and 15 to 19 minutes (2,686 commuters, 20.8%) for females.
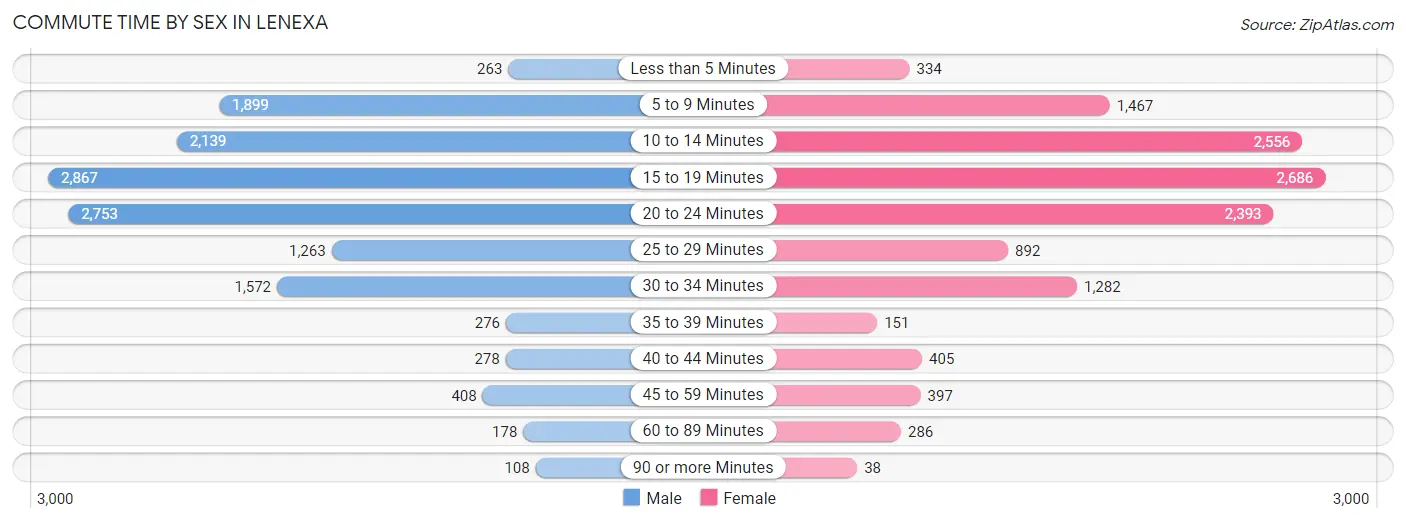
| Commute Time | Male | Female |
| Less than 5 Minutes | 263 (1.9%) | 334 (2.6%) |
| 5 to 9 Minutes | 1,899 (13.6%) | 1,467 (11.4%) |
| 10 to 14 Minutes | 2,139 (15.3%) | 2,556 (19.8%) |
| 15 to 19 Minutes | 2,867 (20.5%) | 2,686 (20.8%) |
| 20 to 24 Minutes | 2,753 (19.7%) | 2,393 (18.6%) |
| 25 to 29 Minutes | 1,263 (9.0%) | 892 (6.9%) |
| 30 to 34 Minutes | 1,572 (11.2%) | 1,282 (10.0%) |
| 35 to 39 Minutes | 276 (2.0%) | 151 (1.2%) |
| 40 to 44 Minutes | 278 (2.0%) | 405 (3.1%) |
| 45 to 59 Minutes | 408 (2.9%) | 397 (3.1%) |
| 60 to 89 Minutes | 178 (1.3%) | 286 (2.2%) |
| 90 or more Minutes | 108 (0.8%) | 38 (0.3%) |
Time of Departure to Work by Sex in Lenexa
The most frequent times of departure to work in Lenexa are 7:00 AM to 7:29 AM (2,538, 18.1%) for males and 7:30 AM to 7:59 AM (2,461, 19.1%) for females.
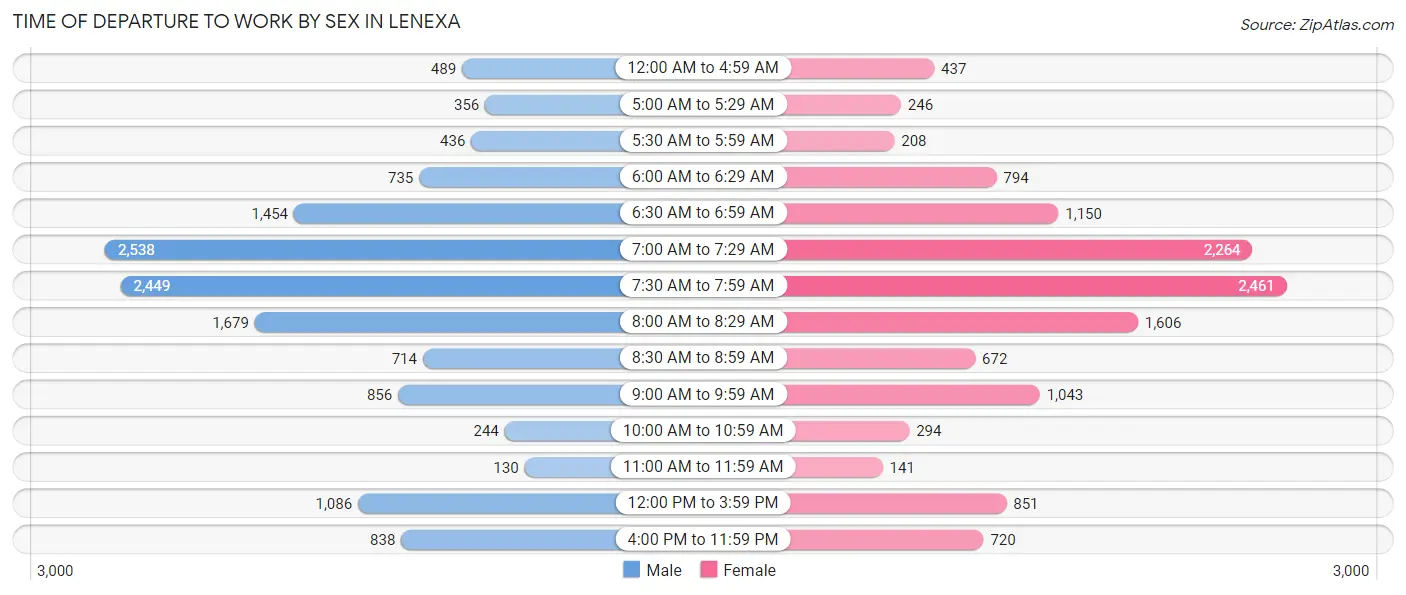
| Time of Departure | Male | Female |
| 12:00 AM to 4:59 AM | 489 (3.5%) | 437 (3.4%) |
| 5:00 AM to 5:29 AM | 356 (2.5%) | 246 (1.9%) |
| 5:30 AM to 5:59 AM | 436 (3.1%) | 208 (1.6%) |
| 6:00 AM to 6:29 AM | 735 (5.2%) | 794 (6.2%) |
| 6:30 AM to 6:59 AM | 1,454 (10.4%) | 1,150 (8.9%) |
| 7:00 AM to 7:29 AM | 2,538 (18.1%) | 2,264 (17.6%) |
| 7:30 AM to 7:59 AM | 2,449 (17.5%) | 2,461 (19.1%) |
| 8:00 AM to 8:29 AM | 1,679 (12.0%) | 1,606 (12.5%) |
| 8:30 AM to 8:59 AM | 714 (5.1%) | 672 (5.2%) |
| 9:00 AM to 9:59 AM | 856 (6.1%) | 1,043 (8.1%) |
| 10:00 AM to 10:59 AM | 244 (1.7%) | 294 (2.3%) |
| 11:00 AM to 11:59 AM | 130 (0.9%) | 141 (1.1%) |
| 12:00 PM to 3:59 PM | 1,086 (7.7%) | 851 (6.6%) |
| 4:00 PM to 11:59 PM | 838 (6.0%) | 720 (5.6%) |
| Total | 14,004 (100.0%) | 12,887 (100.0%) |
Housing Occupancy in Lenexa
Occupancy by Ownership in Lenexa
Of the total 24,199 dwellings in Lenexa, owner-occupied units account for 13,851 (57.2%), while renter-occupied units make up 10,348 (42.8%).
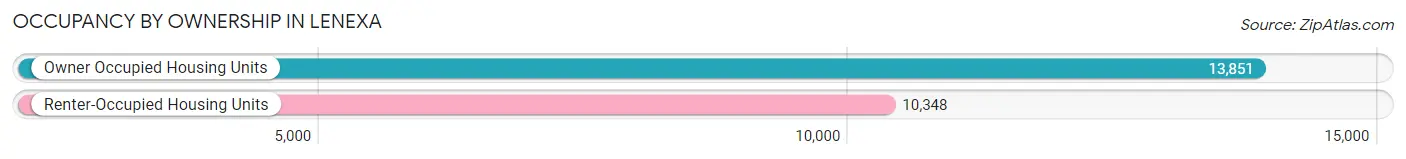
| Occupancy | # Housing Units | % Housing Units |
| Owner Occupied Housing Units | 13,851 | 57.2% |
| Renter-Occupied Housing Units | 10,348 | 42.8% |
| Total Occupied Housing Units | 24,199 | 100.0% |
Occupancy by Household Size in Lenexa
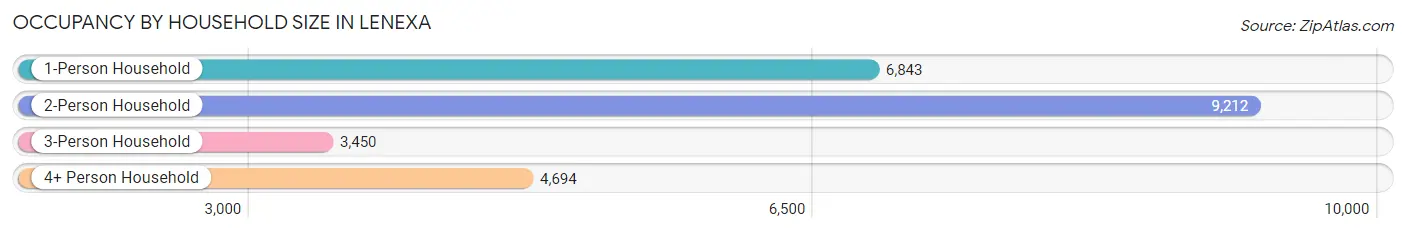
| Household Size | # Housing Units | % Housing Units |
| 1-Person Household | 6,843 | 28.3% |
| 2-Person Household | 9,212 | 38.1% |
| 3-Person Household | 3,450 | 14.3% |
| 4+ Person Household | 4,694 | 19.4% |
| Total Housing Units | 24,199 | 100.0% |
Occupancy by Ownership by Household Size in Lenexa
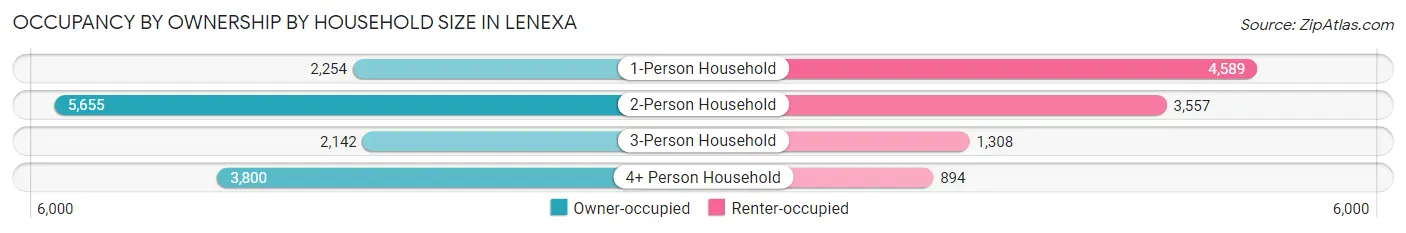
| Household Size | Owner-occupied | Renter-occupied |
| 1-Person Household | 2,254 (32.9%) | 4,589 (67.1%) |
| 2-Person Household | 5,655 (61.4%) | 3,557 (38.6%) |
| 3-Person Household | 2,142 (62.1%) | 1,308 (37.9%) |
| 4+ Person Household | 3,800 (80.9%) | 894 (19.1%) |
| Total Housing Units | 13,851 (57.2%) | 10,348 (42.8%) |
Occupancy by Educational Attainment in Lenexa
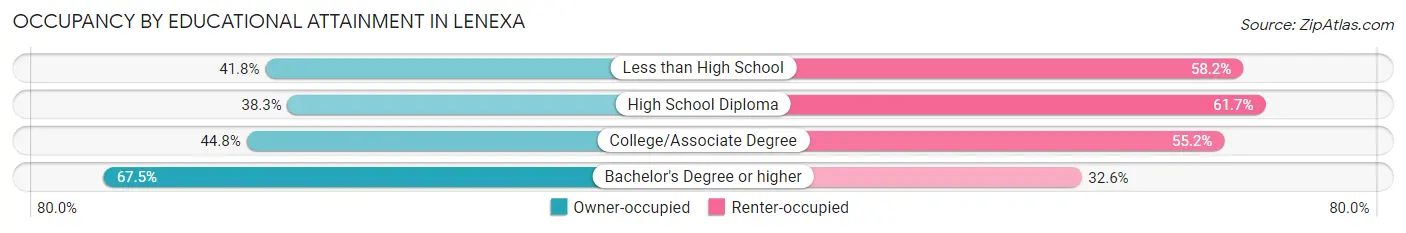
| Household Size | Owner-occupied | Renter-occupied |
| Less than High School | 161 (41.8%) | 224 (58.2%) |
| High School Diploma | 1,018 (38.3%) | 1,641 (61.7%) |
| College/Associate Degree | 3,161 (44.8%) | 3,893 (55.2%) |
| Bachelor's Degree or higher | 9,511 (67.4%) | 4,590 (32.6%) |
Occupancy by Age of Householder in Lenexa
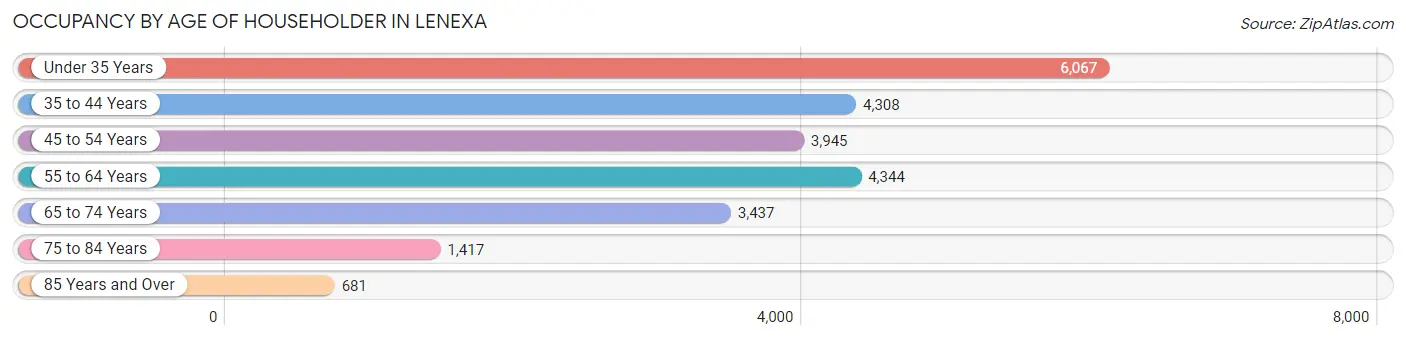
| Age Bracket | # Households | % Households |
| Under 35 Years | 6,067 | 25.1% |
| 35 to 44 Years | 4,308 | 17.8% |
| 45 to 54 Years | 3,945 | 16.3% |
| 55 to 64 Years | 4,344 | 17.9% |
| 65 to 74 Years | 3,437 | 14.2% |
| 75 to 84 Years | 1,417 | 5.9% |
| 85 Years and Over | 681 | 2.8% |
| Total | 24,199 | 100.0% |
Housing Finances in Lenexa
Median Income by Occupancy in Lenexa
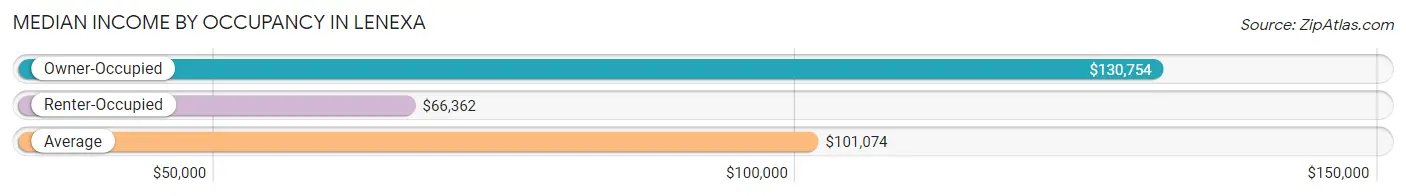
| Occupancy Type | # Households | Median Income |
| Owner-Occupied | 13,851 (57.2%) | $130,754 |
| Renter-Occupied | 10,348 (42.8%) | $66,362 |
| Average | 24,199 (100.0%) | $101,074 |
Occupancy by Householder Income Bracket in Lenexa
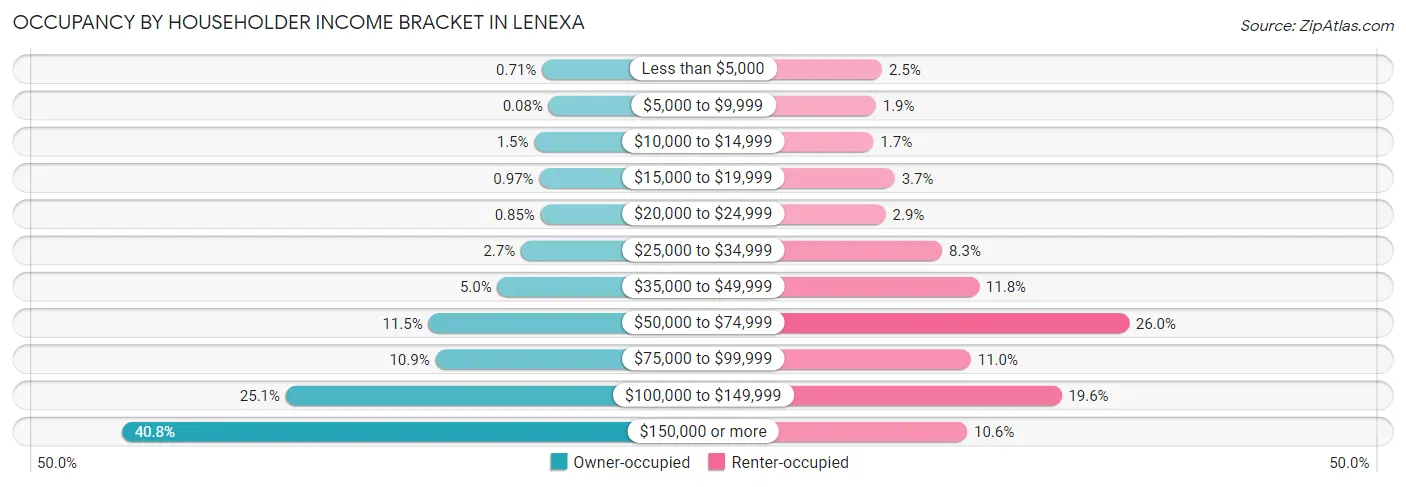
| Income Bracket | Owner-occupied | Renter-occupied |
| Less than $5,000 | 98 (0.7%) | 262 (2.5%) |
| $5,000 to $9,999 | 11 (0.1%) | 200 (1.9%) |
| $10,000 to $14,999 | 201 (1.5%) | 176 (1.7%) |
| $15,000 to $19,999 | 134 (1.0%) | 386 (3.7%) |
| $20,000 to $24,999 | 118 (0.9%) | 296 (2.9%) |
| $25,000 to $34,999 | 377 (2.7%) | 854 (8.3%) |
| $35,000 to $49,999 | 687 (5.0%) | 1,216 (11.7%) |
| $50,000 to $74,999 | 1,595 (11.5%) | 2,694 (26.0%) |
| $75,000 to $99,999 | 1,506 (10.9%) | 1,136 (11.0%) |
| $100,000 to $149,999 | 3,480 (25.1%) | 2,029 (19.6%) |
| $150,000 or more | 5,644 (40.7%) | 1,099 (10.6%) |
| Total | 13,851 (100.0%) | 10,348 (100.0%) |
Monthly Housing Cost Tiers in Lenexa
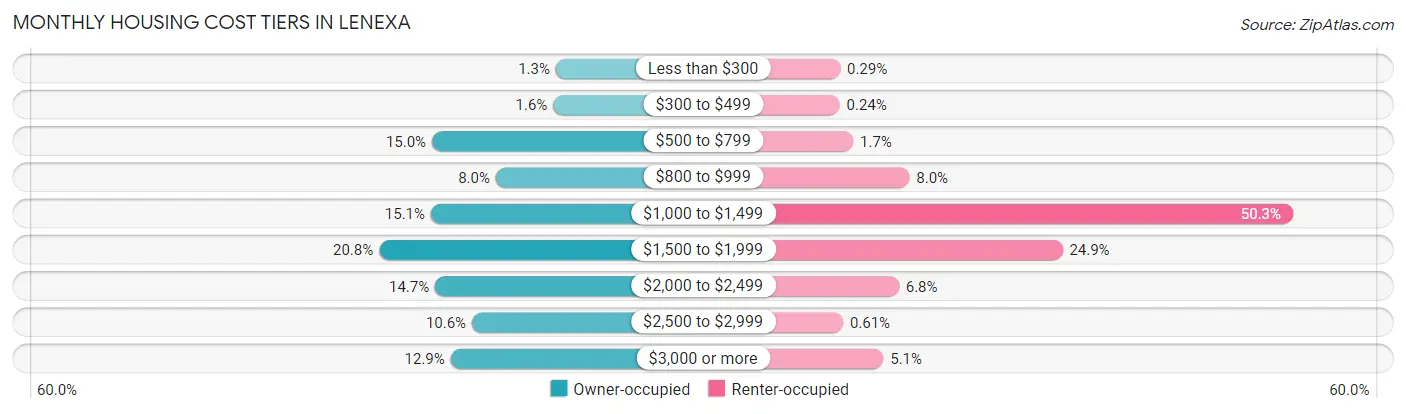
| Monthly Cost | Owner-occupied | Renter-occupied |
| Less than $300 | 183 (1.3%) | 30 (0.3%) |
| $300 to $499 | 223 (1.6%) | 25 (0.2%) |
| $500 to $799 | 2,077 (15.0%) | 179 (1.7%) |
| $800 to $999 | 1,101 (8.0%) | 823 (8.0%) |
| $1,000 to $1,499 | 2,094 (15.1%) | 5,206 (50.3%) |
| $1,500 to $1,999 | 2,886 (20.8%) | 2,572 (24.9%) |
| $2,000 to $2,499 | 2,030 (14.7%) | 702 (6.8%) |
| $2,500 to $2,999 | 1,465 (10.6%) | 63 (0.6%) |
| $3,000 or more | 1,792 (12.9%) | 525 (5.1%) |
| Total | 13,851 (100.0%) | 10,348 (100.0%) |
Physical Housing Characteristics in Lenexa
Housing Structures in Lenexa
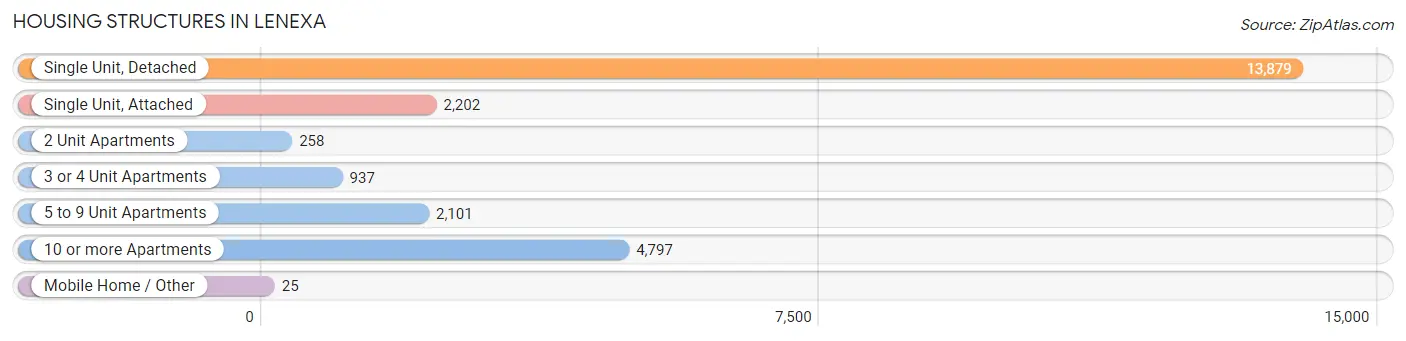
| Structure Type | # Housing Units | % Housing Units |
| Single Unit, Detached | 13,879 | 57.4% |
| Single Unit, Attached | 2,202 | 9.1% |
| 2 Unit Apartments | 258 | 1.1% |
| 3 or 4 Unit Apartments | 937 | 3.9% |
| 5 to 9 Unit Apartments | 2,101 | 8.7% |
| 10 or more Apartments | 4,797 | 19.8% |
| Mobile Home / Other | 25 | 0.1% |
| Total | 24,199 | 100.0% |
Housing Structures by Occupancy in Lenexa
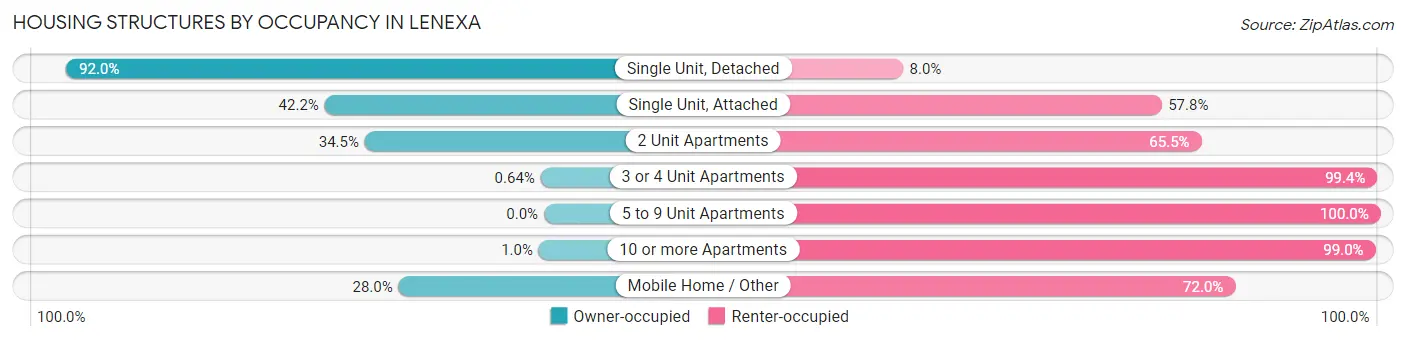
| Structure Type | Owner-occupied | Renter-occupied |
| Single Unit, Detached | 12,771 (92.0%) | 1,108 (8.0%) |
| Single Unit, Attached | 930 (42.2%) | 1,272 (57.8%) |
| 2 Unit Apartments | 89 (34.5%) | 169 (65.5%) |
| 3 or 4 Unit Apartments | 6 (0.6%) | 931 (99.4%) |
| 5 to 9 Unit Apartments | 0 (0.0%) | 2,101 (100.0%) |
| 10 or more Apartments | 48 (1.0%) | 4,749 (99.0%) |
| Mobile Home / Other | 7 (28.0%) | 18 (72.0%) |
| Total | 13,851 (57.2%) | 10,348 (42.8%) |
Housing Structures by Number of Rooms in Lenexa
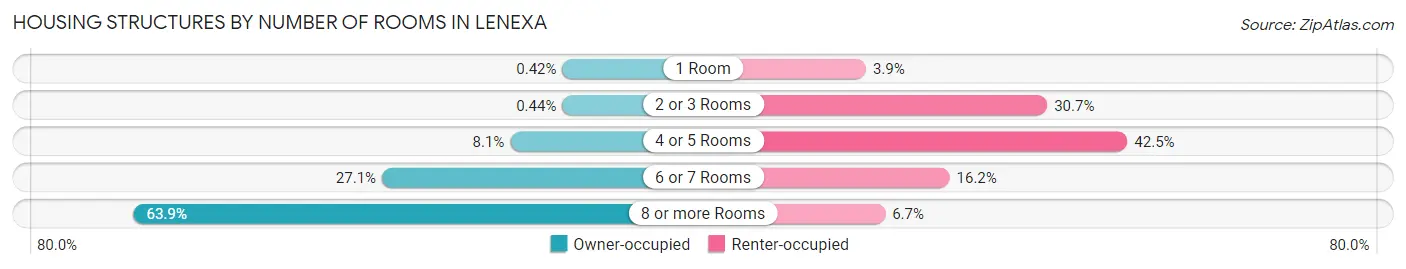
| Number of Rooms | Owner-occupied | Renter-occupied |
| 1 Room | 58 (0.4%) | 399 (3.9%) |
| 2 or 3 Rooms | 61 (0.4%) | 3,175 (30.7%) |
| 4 or 5 Rooms | 1,128 (8.1%) | 4,402 (42.5%) |
| 6 or 7 Rooms | 3,758 (27.1%) | 1,679 (16.2%) |
| 8 or more Rooms | 8,846 (63.9%) | 693 (6.7%) |
| Total | 13,851 (100.0%) | 10,348 (100.0%) |
Housing Structure by Heating Type in Lenexa
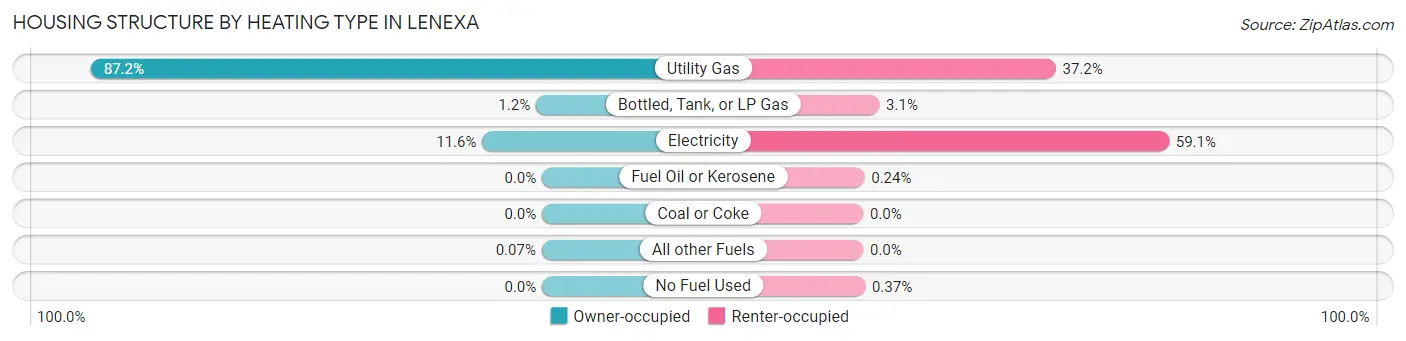
| Heating Type | Owner-occupied | Renter-occupied |
| Utility Gas | 12,078 (87.2%) | 3,849 (37.2%) |
| Bottled, Tank, or LP Gas | 163 (1.2%) | 322 (3.1%) |
| Electricity | 1,600 (11.6%) | 6,114 (59.1%) |
| Fuel Oil or Kerosene | 0 (0.0%) | 25 (0.2%) |
| Coal or Coke | 0 (0.0%) | 0 (0.0%) |
| All other Fuels | 10 (0.1%) | 0 (0.0%) |
| No Fuel Used | 0 (0.0%) | 38 (0.4%) |
| Total | 13,851 (100.0%) | 10,348 (100.0%) |
Household Vehicle Usage in Lenexa
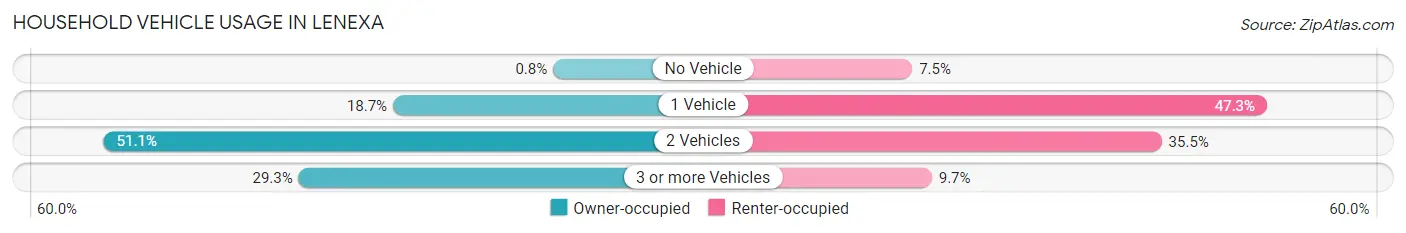
| Vehicles per Household | Owner-occupied | Renter-occupied |
| No Vehicle | 111 (0.8%) | 780 (7.5%) |
| 1 Vehicle | 2,596 (18.7%) | 4,890 (47.3%) |
| 2 Vehicles | 7,084 (51.1%) | 3,671 (35.5%) |
| 3 or more Vehicles | 4,060 (29.3%) | 1,007 (9.7%) |
| Total | 13,851 (100.0%) | 10,348 (100.0%) |
Real Estate & Mortgages in Lenexa
Real Estate and Mortgage Overview in Lenexa
| Characteristic | Without Mortgage | With Mortgage |
| Housing Units | 4,518 | 9,333 |
| Median Property Value | $337,800 | $353,900 |
| Median Household Income | $96,957 | $4,442 |
| Monthly Housing Costs | $785 | $1,781 |
| Real Estate Taxes | $4,147 | $123 |
Property Value by Mortgage Status in Lenexa
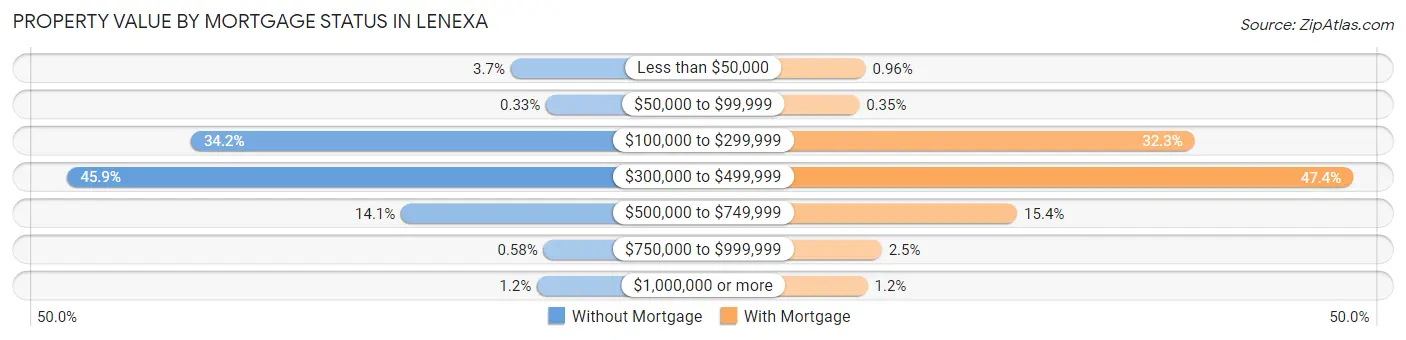
| Property Value | Without Mortgage | With Mortgage |
| Less than $50,000 | 167 (3.7%) | 90 (1.0%) |
| $50,000 to $99,999 | 15 (0.3%) | 33 (0.4%) |
| $100,000 to $299,999 | 1,543 (34.2%) | 3,013 (32.3%) |
| $300,000 to $499,999 | 2,074 (45.9%) | 4,422 (47.4%) |
| $500,000 to $749,999 | 639 (14.1%) | 1,436 (15.4%) |
| $750,000 to $999,999 | 26 (0.6%) | 232 (2.5%) |
| $1,000,000 or more | 54 (1.2%) | 107 (1.1%) |
| Total | 4,518 (100.0%) | 9,333 (100.0%) |
Household Income by Mortgage Status in Lenexa
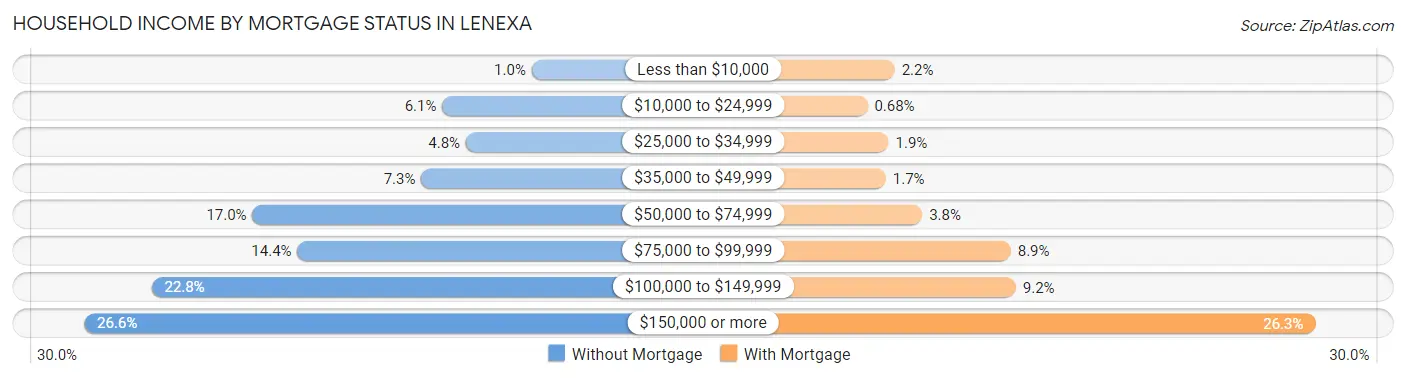
| Household Income | Without Mortgage | With Mortgage |
| Less than $10,000 | 46 (1.0%) | 209 (2.2%) |
| $10,000 to $24,999 | 277 (6.1%) | 63 (0.7%) |
| $25,000 to $34,999 | 216 (4.8%) | 176 (1.9%) |
| $35,000 to $49,999 | 331 (7.3%) | 161 (1.7%) |
| $50,000 to $74,999 | 767 (17.0%) | 356 (3.8%) |
| $75,000 to $99,999 | 651 (14.4%) | 828 (8.9%) |
| $100,000 to $149,999 | 1,028 (22.8%) | 855 (9.2%) |
| $150,000 or more | 1,202 (26.6%) | 2,452 (26.3%) |
| Total | 4,518 (100.0%) | 9,333 (100.0%) |
Property Value to Household Income Ratio in Lenexa
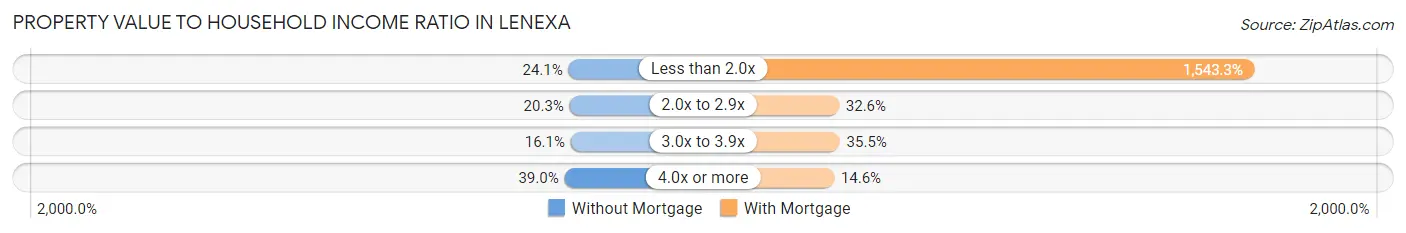
| Value-to-Income Ratio | Without Mortgage | With Mortgage |
| Less than 2.0x | 1,090 (24.1%) | 144,033 (1,543.3%) |
| 2.0x to 2.9x | 915 (20.3%) | 3,038 (32.6%) |
| 3.0x to 3.9x | 727 (16.1%) | 3,310 (35.5%) |
| 4.0x or more | 1,763 (39.0%) | 1,358 (14.5%) |
| Total | 4,518 (100.0%) | 9,333 (100.0%) |
Real Estate Taxes by Mortgage Status in Lenexa
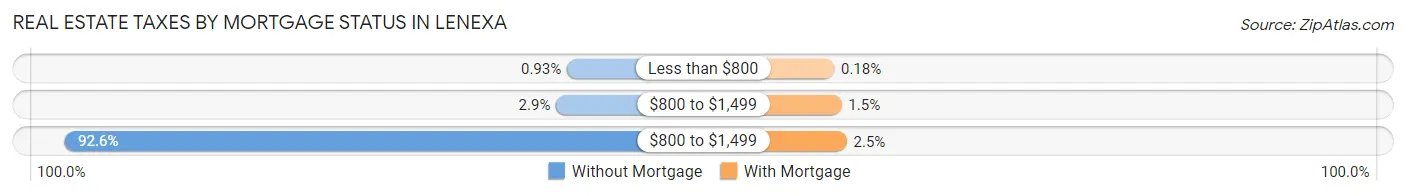
| Property Taxes | Without Mortgage | With Mortgage |
| Less than $800 | 42 (0.9%) | 17 (0.2%) |
| $800 to $1,499 | 131 (2.9%) | 143 (1.5%) |
| $800 to $1,499 | 4,184 (92.6%) | 231 (2.5%) |
| Total | 4,518 (100.0%) | 9,333 (100.0%) |
Health & Disability in Lenexa
Health Insurance Coverage by Age in Lenexa
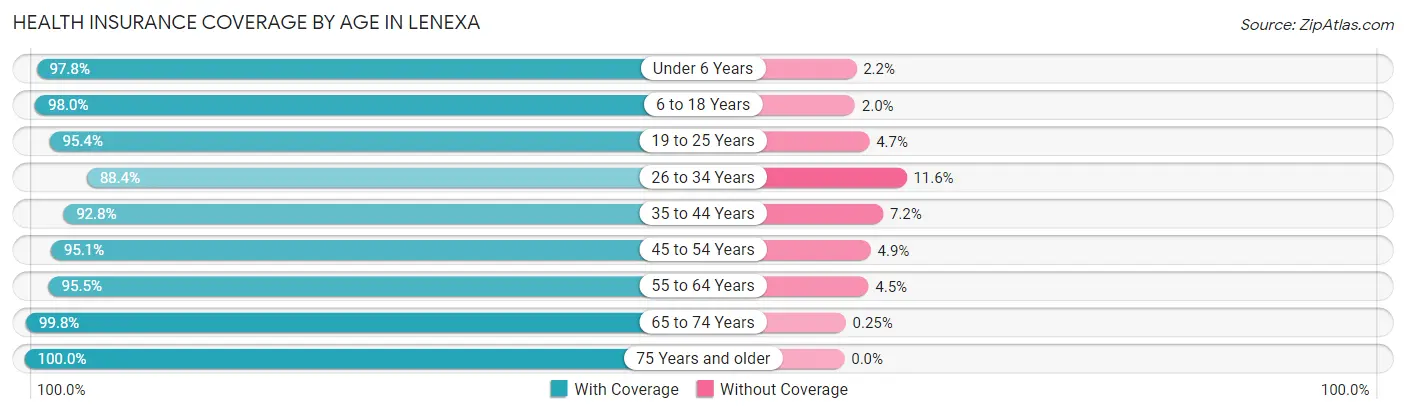
| Age Bracket | With Coverage | Without Coverage |
| Under 6 Years | 3,694 (97.8%) | 84 (2.2%) |
| 6 to 18 Years | 9,471 (98.0%) | 190 (2.0%) |
| 19 to 25 Years | 5,087 (95.4%) | 248 (4.6%) |
| 26 to 34 Years | 6,688 (88.4%) | 877 (11.6%) |
| 35 to 44 Years | 7,376 (92.8%) | 573 (7.2%) |
| 45 to 54 Years | 6,631 (95.1%) | 342 (4.9%) |
| 55 to 64 Years | 6,846 (95.5%) | 322 (4.5%) |
| 65 to 74 Years | 5,635 (99.8%) | 14 (0.3%) |
| 75 Years and older | 2,974 (100.0%) | 0 (0.0%) |
| Total | 54,402 (95.4%) | 2,650 (4.6%) |
Health Insurance Coverage by Citizenship Status in Lenexa
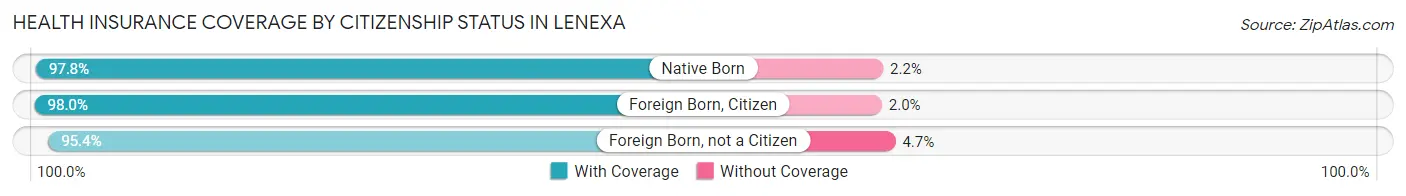
| Citizenship Status | With Coverage | Without Coverage |
| Native Born | 3,694 (97.8%) | 84 (2.2%) |
| Foreign Born, Citizen | 9,471 (98.0%) | 190 (2.0%) |
| Foreign Born, not a Citizen | 5,087 (95.4%) | 248 (4.6%) |
Health Insurance Coverage by Household Income in Lenexa
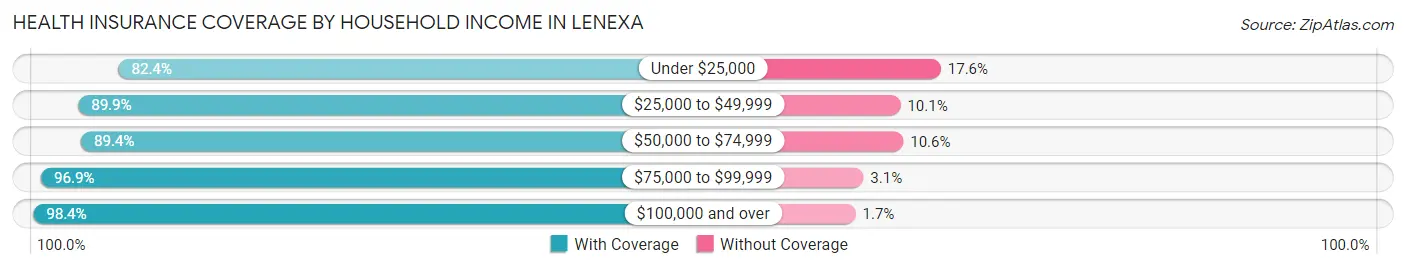
| Household Income | With Coverage | Without Coverage |
| Under $25,000 | 2,469 (82.4%) | 528 (17.6%) |
| $25,000 to $49,999 | 4,763 (89.9%) | 533 (10.1%) |
| $50,000 to $74,999 | 6,801 (89.4%) | 805 (10.6%) |
| $75,000 to $99,999 | 5,579 (96.9%) | 179 (3.1%) |
| $100,000 and over | 34,742 (98.4%) | 583 (1.7%) |
Public vs Private Health Insurance Coverage by Age in Lenexa
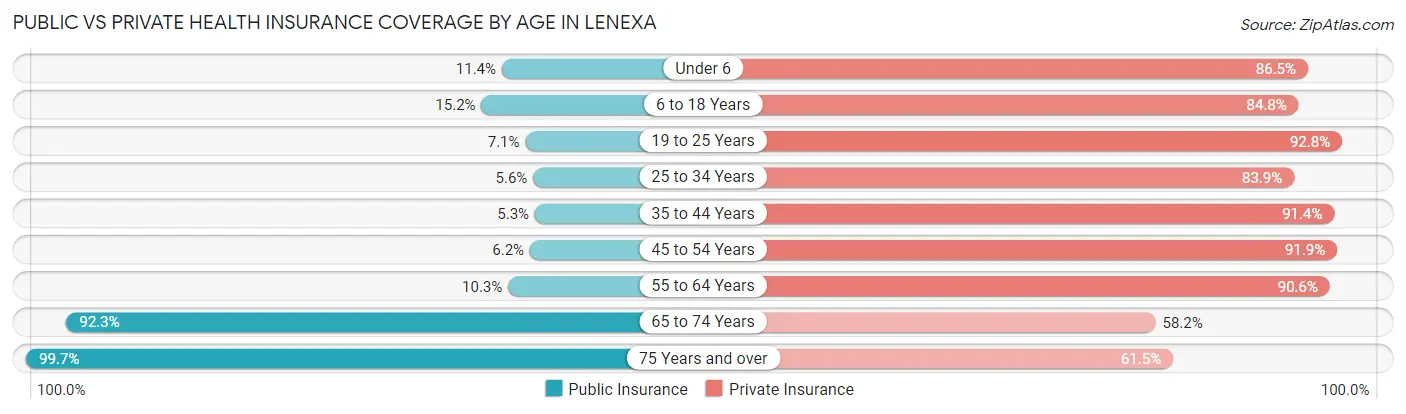
| Age Bracket | Public Insurance | Private Insurance |
| Under 6 | 431 (11.4%) | 3,268 (86.5%) |
| 6 to 18 Years | 1,469 (15.2%) | 8,192 (84.8%) |
| 19 to 25 Years | 376 (7.0%) | 4,953 (92.8%) |
| 25 to 34 Years | 424 (5.6%) | 6,349 (83.9%) |
| 35 to 44 Years | 419 (5.3%) | 7,265 (91.4%) |
| 45 to 54 Years | 433 (6.2%) | 6,410 (91.9%) |
| 55 to 64 Years | 735 (10.2%) | 6,492 (90.6%) |
| 65 to 74 Years | 5,212 (92.3%) | 3,290 (58.2%) |
| 75 Years and over | 2,966 (99.7%) | 1,828 (61.5%) |
| Total | 12,465 (21.8%) | 48,047 (84.2%) |
Disability Status by Sex by Age in Lenexa
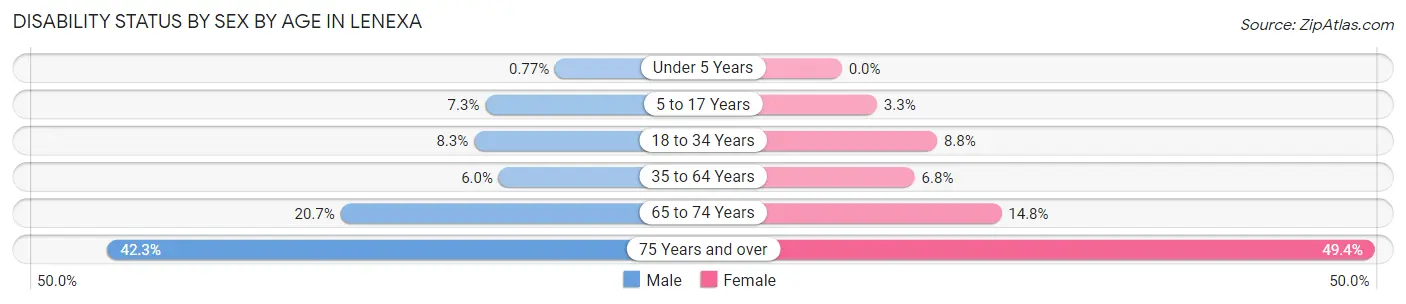
| Age Bracket | Male | Female |
| Under 5 Years | 13 (0.8%) | 0 (0.0%) |
| 5 to 17 Years | 363 (7.2%) | 137 (3.3%) |
| 18 to 34 Years | 587 (8.3%) | 599 (8.8%) |
| 35 to 64 Years | 669 (6.0%) | 738 (6.8%) |
| 65 to 74 Years | 495 (20.7%) | 482 (14.8%) |
| 75 Years and over | 577 (42.3%) | 796 (49.4%) |
Disability Class by Sex by Age in Lenexa
Disability Class: Hearing Difficulty
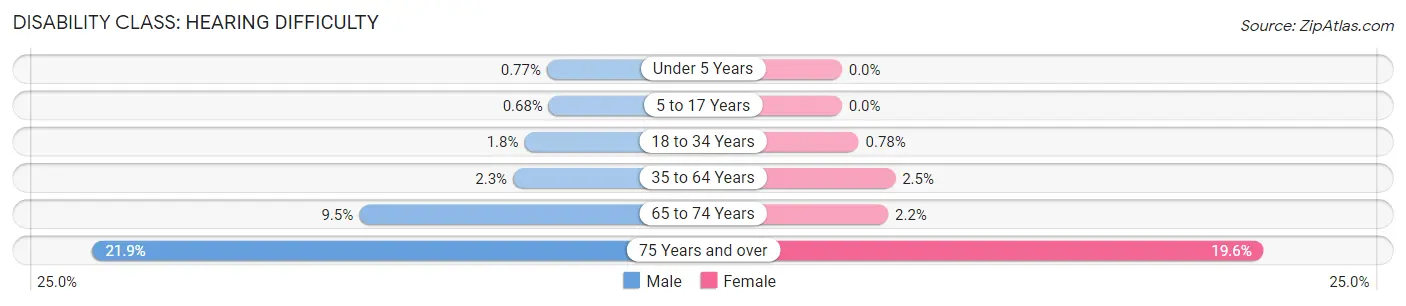
| Age Bracket | Male | Female |
| Under 5 Years | 13 (0.8%) | 0 (0.0%) |
| 5 to 17 Years | 34 (0.7%) | 0 (0.0%) |
| 18 to 34 Years | 128 (1.8%) | 53 (0.8%) |
| 35 to 64 Years | 262 (2.3%) | 271 (2.5%) |
| 65 to 74 Years | 227 (9.5%) | 70 (2.1%) |
| 75 Years and over | 298 (21.8%) | 315 (19.6%) |
Disability Class: Vision Difficulty
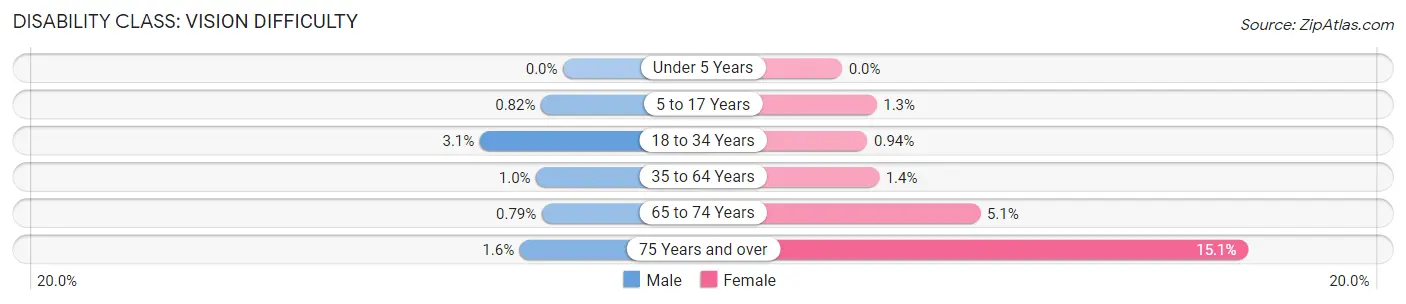
| Age Bracket | Male | Female |
| Under 5 Years | 0 (0.0%) | 0 (0.0%) |
| 5 to 17 Years | 41 (0.8%) | 54 (1.3%) |
| 18 to 34 Years | 219 (3.1%) | 64 (0.9%) |
| 35 to 64 Years | 112 (1.0%) | 150 (1.4%) |
| 65 to 74 Years | 19 (0.8%) | 167 (5.1%) |
| 75 Years and over | 22 (1.6%) | 243 (15.1%) |
Disability Class: Cognitive Difficulty
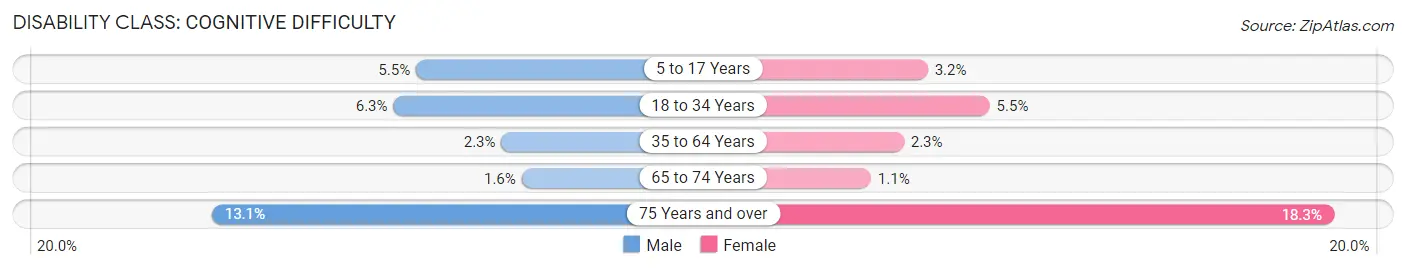
| Age Bracket | Male | Female |
| 5 to 17 Years | 274 (5.5%) | 134 (3.2%) |
| 18 to 34 Years | 447 (6.3%) | 372 (5.5%) |
| 35 to 64 Years | 257 (2.3%) | 251 (2.3%) |
| 65 to 74 Years | 37 (1.5%) | 35 (1.1%) |
| 75 Years and over | 178 (13.1%) | 294 (18.3%) |
Disability Class: Ambulatory Difficulty
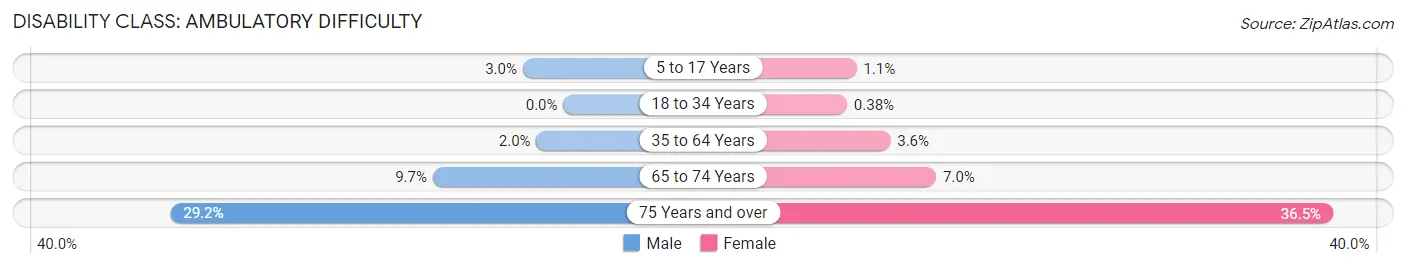
| Age Bracket | Male | Female |
| 5 to 17 Years | 151 (3.0%) | 46 (1.1%) |
| 18 to 34 Years | 0 (0.0%) | 26 (0.4%) |
| 35 to 64 Years | 223 (2.0%) | 393 (3.6%) |
| 65 to 74 Years | 232 (9.7%) | 228 (7.0%) |
| 75 Years and over | 398 (29.2%) | 587 (36.5%) |
Disability Class: Self-Care Difficulty
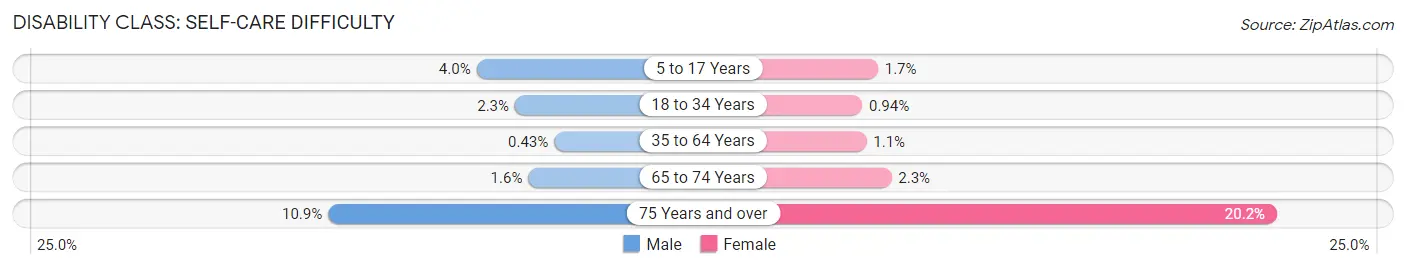
| Age Bracket | Male | Female |
| 5 to 17 Years | 202 (4.0%) | 70 (1.7%) |
| 18 to 34 Years | 159 (2.2%) | 64 (0.9%) |
| 35 to 64 Years | 48 (0.4%) | 124 (1.1%) |
| 65 to 74 Years | 39 (1.6%) | 75 (2.3%) |
| 75 Years and over | 149 (10.9%) | 325 (20.2%) |
Technology Access in Lenexa
Computing Device Access in Lenexa
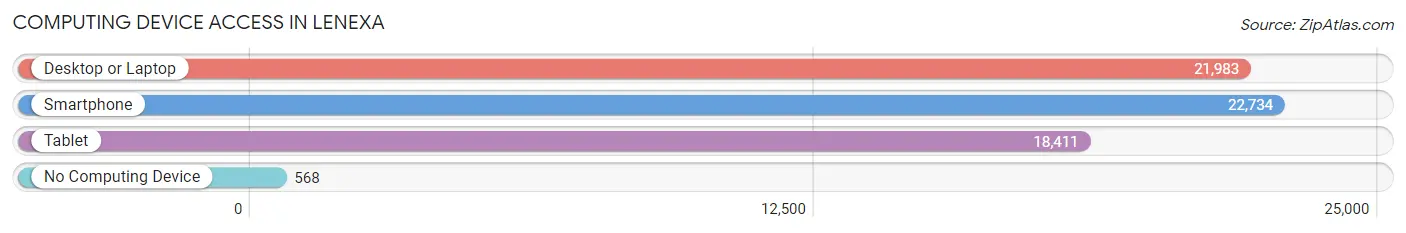
| Device Type | # Households | % Households |
| Desktop or Laptop | 21,983 | 90.8% |
| Smartphone | 22,734 | 94.0% |
| Tablet | 18,411 | 76.1% |
| No Computing Device | 568 | 2.4% |
| Total | 24,199 | 100.0% |
Internet Access in Lenexa
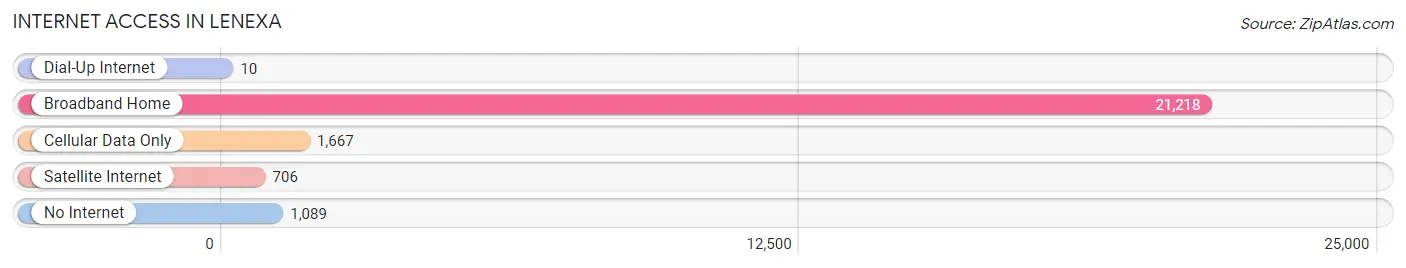
| Internet Type | # Households | % Households |
| Dial-Up Internet | 10 | 0.0% |
| Broadband Home | 21,218 | 87.7% |
| Cellular Data Only | 1,667 | 6.9% |
| Satellite Internet | 706 | 2.9% |
| No Internet | 1,089 | 4.5% |
| Total | 24,199 | 100.0% |
Lenexa Summary
Lenexa, Kansas is a city located in Johnson County, Kansas, United States. It is a suburb of Kansas City, Missouri, and is part of the Kansas City metropolitan area. As of the 2010 census, the city population was 48,190. It is the 9th largest city in Kansas.
History
Lenexa was founded in 1869 by William B. Strang Jr., a native of Ohio. He named the city after his mother, Lena Strang. The city was incorporated in 1879.
In the late 19th century, Lenexa was a small farming community. The city was known for its production of wheat, corn, and other crops. In the early 20th century, Lenexa began to grow rapidly as the Kansas City metropolitan area expanded. The city was home to several large manufacturing plants, including the Lenexa Manufacturing Company, which produced farm equipment.
Geography
Lenexa is located in Johnson County, Kansas, at the intersection of Interstate 35 and Interstate 435. The city is situated on the banks of the Kansas River. The city covers an area of 24.3 square miles, of which 24.2 square miles is land and 0.1 square miles is water.
Lenexa is located in the humid continental climate zone, with hot, humid summers and cold, dry winters. The average annual temperature is 54.2°F, and the average annual precipitation is 37.3 inches.
Economy
Lenexa is a major economic center in the Kansas City metropolitan area. The city is home to several large companies, including Garmin, Honeywell, and Sprint. The city is also home to several large shopping centers, including Oak Park Mall and Town Center Plaza.
Lenexa is home to several large employers, including Garmin, Honeywell, and Sprint. The city is also home to several large shopping centers, including Oak Park Mall and Town Center Plaza.
Demographics
As of the 2010 census, there were 48,190 people, 19,845 households, and 12,845 families living in the city. The population density was 1,988.3 people per square mile. The racial makeup of the city was 79.2% White, 8.3% African American, 0.4% Native American, 5.2% Asian, 0.1% Pacific Islander, 3.2% from other races, and 3.6% from two or more races. Hispanic or Latino of any race were 8.3% of the population.
The median income for a household in the city was $63,945, and the median income for a family was $76,945. The per capita income for the city was $30,945. About 4.2% of families and 6.2% of the population were below the poverty line, including 8.2% of those under age 18 and 4.2% of those age 65 or over.
Common Questions
What is Per Capita Income in Lenexa?
Per Capita income in Lenexa is $55,718.
What is the Median Family Income in Lenexa?
Median Family Income in Lenexa is $124,293.
What is the Median Household income in Lenexa?
Median Household Income in Lenexa is $101,074.
What is Income or Wage Gap in Lenexa?
Income or Wage Gap in Lenexa is 26.5%.
Women in Lenexa earn 73.5 cents for every dollar earned by a man.
What is Inequality or Gini Index in Lenexa?
Inequality or Gini Index in Lenexa is 0.44.
What is the Total Population of Lenexa?
Total Population of Lenexa is 57,497.
What is the Total Male Population of Lenexa?
Total Male Population of Lenexa is 28,945.
What is the Total Female Population of Lenexa?
Total Female Population of Lenexa is 28,552.
What is the Ratio of Males per 100 Females in Lenexa?
There are 101.38 Males per 100 Females in Lenexa.
What is the Ratio of Females per 100 Males in Lenexa?
There are 98.64 Females per 100 Males in Lenexa.
What is the Median Population Age in Lenexa?
Median Population Age in Lenexa is 38.0 Years.
What is the Average Family Size in Lenexa
Average Family Size in Lenexa is 2.9 People.
What is the Average Household Size in Lenexa
Average Household Size in Lenexa is 2.4 People.
How Large is the Labor Force in Lenexa?
There are 34,292 People in the Labor Forcein in Lenexa.
What is the Percentage of People in the Labor Force in Lenexa?
73.8% of People are in the Labor Force in Lenexa.
What is the Unemployment Rate in Lenexa?
Unemployment Rate in Lenexa is 2.6%.