Cities with the Highest Percentage of Population Employed in Computer & Mathematics in Pennsylvania
RELATED REPORTS & OPTIONS
Computer & Mathematics
Pennsylvania
Compare Cities
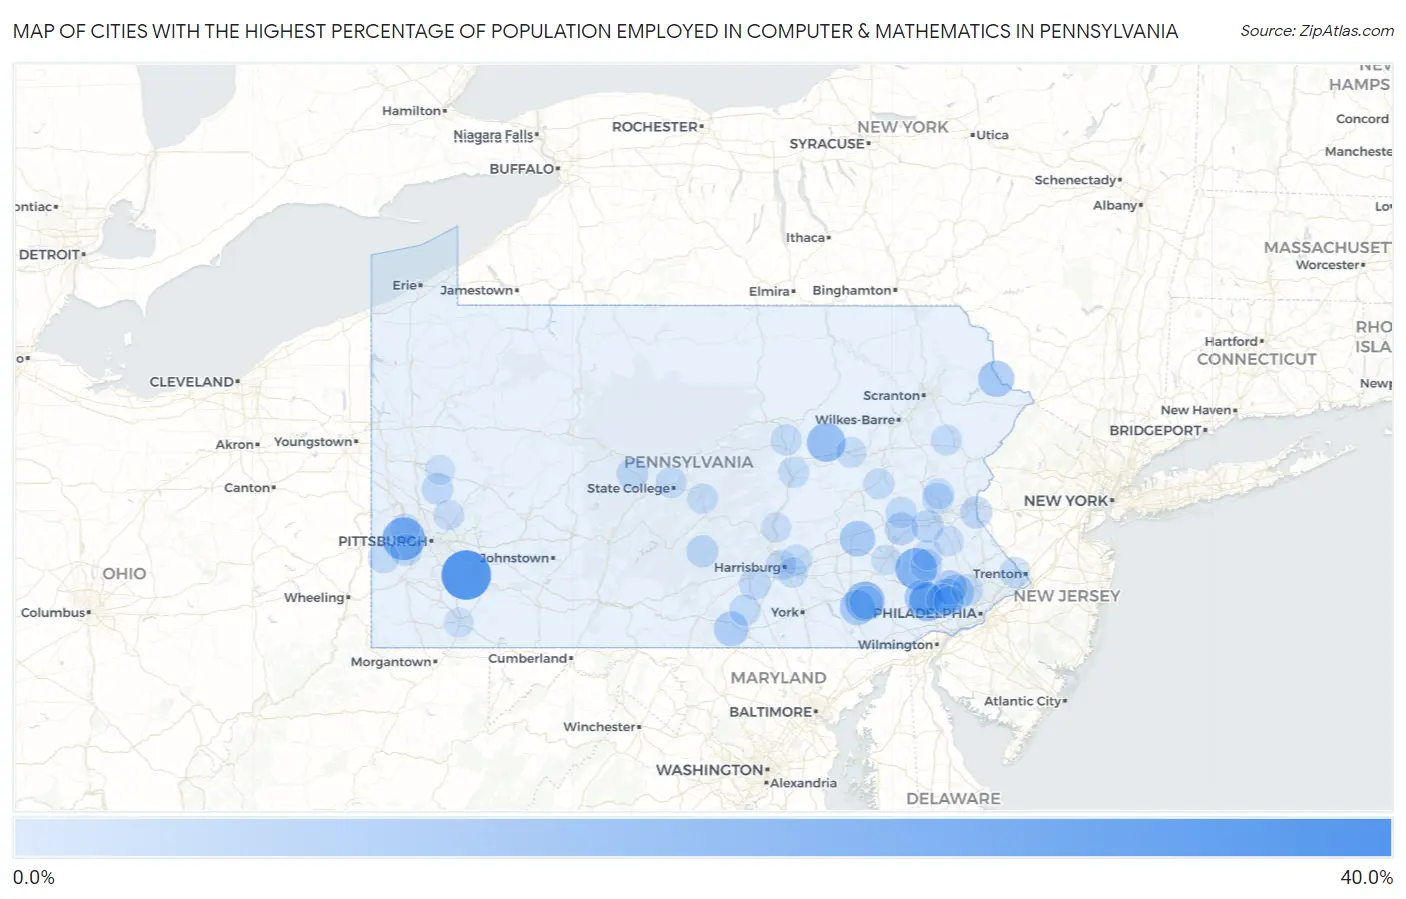
Map of Cities with the Highest Percentage of Population Employed in Computer & Mathematics in Pennsylvania
0.0%
40.0%
Cities with the Highest Percentage of Population Employed in Computer & Mathematics in Pennsylvania
| City | % Employed | vs State | vs National | |
| 1. | Culp | 37.0% | 3.3%(+33.8)#1 | 3.5%(+33.5)#43 |
| 2. | Fort Fetter | 35.0% | 3.3%(+31.7)#2 | 3.5%(+31.5)#50 |
| 3. | Yukon | 34.4% | 3.3%(+31.1)#3 | 3.5%(+30.9)#54 |
| 4. | Curryville | 30.0% | 3.3%(+26.7)#4 | 3.5%(+26.5)#69 |
| 5. | Enlow | 24.9% | 3.3%(+21.6)#5 | 3.5%(+21.4)#104 |
| 6. | Douglassville | 23.1% | 3.3%(+19.8)#6 | 3.5%(+19.6)#118 |
| 7. | Bird In Hand | 20.3% | 3.3%(+17.0)#7 | 3.5%(+16.8)#164 |
| 8. | Eyers Grove | 19.0% | 3.3%(+15.8)#8 | 3.5%(+15.5)#187 |
| 9. | Wall Borough | 18.3% | 3.3%(+15.0)#9 | 3.5%(+14.8)#203 |
| 10. | Exton | 17.6% | 3.3%(+14.4)#10 | 3.5%(+14.1)#216 |
| 11. | Frazer | 17.0% | 3.3%(+13.7)#11 | 3.5%(+13.5)#235 |
| 12. | Driftwood Borough | 16.7% | 3.3%(+13.4)#12 | 3.5%(+13.1)#245 |
| 13. | Masthope | 15.8% | 3.3%(+12.5)#13 | 3.5%(+12.3)#279 |
| 14. | Juniata Gap | 15.7% | 3.3%(+12.4)#14 | 3.5%(+12.2)#284 |
| 15. | New Buffalo Borough | 15.4% | 3.3%(+12.1)#15 | 3.5%(+11.9)#294 |
| 16. | Eagleview | 15.1% | 3.3%(+11.8)#16 | 3.5%(+11.5)#311 |
| 17. | Rehrersburg | 15.0% | 3.3%(+11.7)#17 | 3.5%(+11.4)#320 |
| 18. | King Of Prussia | 14.7% | 3.3%(+11.5)#18 | 3.5%(+11.2)#328 |
| 19. | Lampeter | 14.7% | 3.3%(+11.4)#19 | 3.5%(+11.2)#330 |
| 20. | Malvern Borough | 14.3% | 3.3%(+11.0)#20 | 3.5%(+10.8)#353 |
| 21. | Chesterbrook | 14.2% | 3.3%(+11.0)#21 | 3.5%(+10.7)#358 |
| 22. | Orrtanna | 13.6% | 3.3%(+10.4)#22 | 3.5%(+10.1)#387 |
| 23. | Camp Hill Borough | 13.5% | 3.3%(+10.2)#23 | 3.5%(+9.97)#393 |
| 24. | Audubon | 13.2% | 3.3%(+9.97)#24 | 3.5%(+9.72)#414 |
| 25. | Eagleville Cdp Centre County | 12.6% | 3.3%(+9.31)#25 | 3.5%(+9.06)#455 |
| 26. | Lionville | 12.2% | 3.3%(+8.91)#26 | 3.5%(+8.66)#480 |
| 27. | Ronks | 12.1% | 3.3%(+8.87)#27 | 3.5%(+8.62)#484 |
| 28. | Friendsville Borough | 11.5% | 3.3%(+8.18)#28 | 3.5%(+7.93)#545 |
| 29. | Virginville | 11.3% | 3.3%(+8.01)#29 | 3.5%(+7.76)#562 |
| 30. | Emsworth Borough | 11.0% | 3.3%(+7.73)#30 | 3.5%(+7.48)#591 |
| 31. | Whitaker Borough | 11.0% | 3.3%(+7.71)#31 | 3.5%(+7.46)#593 |
| 32. | Paoli | 11.0% | 3.3%(+7.70)#32 | 3.5%(+7.45)#594 |
| 33. | Breinigsville | 10.8% | 3.3%(+7.55)#33 | 3.5%(+7.31)#615 |
| 34. | Raubsville | 10.3% | 3.3%(+7.05)#34 | 3.5%(+6.80)#678 |
| 35. | Sturgeon | 10.2% | 3.3%(+6.95)#35 | 3.5%(+6.70)#692 |
| 36. | East Waterford | 10.2% | 3.3%(+6.89)#36 | 3.5%(+6.64)#704 |
| 37. | Boiling Springs | 10.0% | 3.3%(+6.71)#37 | 3.5%(+6.46)#739 |
| 38. | Liberty Borough Allegheny County | 10.0% | 3.3%(+6.68)#38 | 3.5%(+6.43)#742 |
| 39. | Halfway House | 9.9% | 3.3%(+6.60)#39 | 3.5%(+6.35)#752 |
| 40. | South Philipsburg | 9.9% | 3.3%(+6.60)#40 | 3.5%(+6.35)#753 |
| 41. | Avalon Borough | 9.8% | 3.3%(+6.52)#41 | 3.5%(+6.28)#770 |
| 42. | West Sunbury Borough | 9.6% | 3.3%(+6.37)#42 | 3.5%(+6.12)#802 |
| 43. | Nixon | 9.6% | 3.3%(+6.32)#43 | 3.5%(+6.07)#814 |
| 44. | Cross Creek | 9.6% | 3.3%(+6.29)#44 | 3.5%(+6.04)#821 |
| 45. | Kempton | 9.5% | 3.3%(+6.25)#45 | 3.5%(+6.00)#830 |
| 46. | Plymouth Meeting | 9.5% | 3.3%(+6.24)#46 | 3.5%(+6.00)#831 |
| 47. | Coalport Borough | 9.5% | 3.3%(+6.18)#47 | 3.5%(+5.93)#844 |
| 48. | Gilberton Borough | 9.3% | 3.3%(+6.06)#48 | 3.5%(+5.81)#869 |
| 49. | Cheltenham | 9.3% | 3.3%(+6.04)#49 | 3.5%(+5.79)#872 |
| 50. | Aspers | 9.2% | 3.3%(+5.94)#50 | 3.5%(+5.70)#892 |
| 51. | Toftrees | 9.0% | 3.3%(+5.77)#51 | 3.5%(+5.52)#932 |
| 52. | Pughtown | 9.0% | 3.3%(+5.74)#52 | 3.5%(+5.49)#940 |
| 53. | Dewart | 9.0% | 3.3%(+5.71)#53 | 3.5%(+5.46)#944 |
| 54. | Churchill Borough | 9.0% | 3.3%(+5.69)#54 | 3.5%(+5.44)#946 |
| 55. | Laurys Station | 8.9% | 3.3%(+5.62)#55 | 3.5%(+5.37)#958 |
| 56. | Woodside | 8.9% | 3.3%(+5.58)#56 | 3.5%(+5.34)#966 |
| 57. | Kapp Heights | 8.8% | 3.3%(+5.55)#57 | 3.5%(+5.30)#974 |
| 58. | Dilworthtown | 8.8% | 3.3%(+5.54)#58 | 3.5%(+5.29)#978 |
| 59. | Paxtonia | 8.8% | 3.3%(+5.53)#59 | 3.5%(+5.28)#982 |
| 60. | Cherryville | 8.8% | 3.3%(+5.49)#60 | 3.5%(+5.24)#987 |
| 61. | Sadsburyville | 8.8% | 3.3%(+5.49)#61 | 3.5%(+5.24)#989 |
| 62. | Clintonville Borough | 8.7% | 3.3%(+5.46)#62 | 3.5%(+5.21)#998 |
| 63. | Grier City | 8.7% | 3.3%(+5.42)#63 | 3.5%(+5.17)#1,009 |
| 64. | Pocono Pines | 8.7% | 3.3%(+5.40)#64 | 3.5%(+5.15)#1,012 |
| 65. | St. Davids | 8.6% | 3.3%(+5.37)#65 | 3.5%(+5.12)#1,023 |
| 66. | Aspinwall Borough | 8.6% | 3.3%(+5.30)#66 | 3.5%(+5.05)#1,042 |
| 67. | New Berlinville | 8.5% | 3.3%(+5.22)#67 | 3.5%(+4.98)#1,059 |
| 68. | Mifflinville | 8.4% | 3.3%(+5.15)#68 | 3.5%(+4.90)#1,082 |
| 69. | Potlicker Flats | 8.4% | 3.3%(+5.13)#69 | 3.5%(+4.89)#1,086 |
| 70. | Glenmoore | 8.4% | 3.3%(+5.13)#70 | 3.5%(+4.88)#1,087 |
| 71. | Larke | 8.3% | 3.3%(+5.06)#71 | 3.5%(+4.81)#1,108 |
| 72. | Russellton | 8.3% | 3.3%(+5.04)#72 | 3.5%(+4.80)#1,114 |
| 73. | West Fairview | 8.3% | 3.3%(+5.00)#73 | 3.5%(+4.75)#1,121 |
| 74. | Franklin Park Borough | 8.2% | 3.3%(+4.92)#74 | 3.5%(+4.67)#1,145 |
| 75. | Fairview Borough | 8.2% | 3.3%(+4.92)#75 | 3.5%(+4.67)#1,147 |
| 76. | Confluence Borough | 8.2% | 3.3%(+4.90)#76 | 3.5%(+4.65)#1,154 |
| 77. | Bryn Athyn Borough | 8.2% | 3.3%(+4.88)#77 | 3.5%(+4.63)#1,165 |
| 78. | Bressler | 8.1% | 3.3%(+4.82)#78 | 3.5%(+4.57)#1,179 |
| 79. | Lenkerville | 8.1% | 3.3%(+4.78)#79 | 3.5%(+4.53)#1,199 |
| 80. | Spinnerstown | 8.0% | 3.3%(+4.72)#80 | 3.5%(+4.47)#1,224 |
| 81. | Glen Rock Borough | 8.0% | 3.3%(+4.71)#81 | 3.5%(+4.46)#1,228 |
| 82. | Carnot Moon | 7.9% | 3.3%(+4.66)#82 | 3.5%(+4.41)#1,249 |
| 83. | Chadds Ford | 7.9% | 3.3%(+4.62)#83 | 3.5%(+4.37)#1,265 |
| 84. | Morea | 7.8% | 3.3%(+4.57)#84 | 3.5%(+4.32)#1,285 |
| 85. | Lincoln Park | 7.8% | 3.3%(+4.52)#85 | 3.5%(+4.28)#1,299 |
| 86. | Phoenixville Borough | 7.8% | 3.3%(+4.52)#86 | 3.5%(+4.27)#1,303 |
| 87. | Pennsbury Village Borough | 7.8% | 3.3%(+4.51)#87 | 3.5%(+4.26)#1,305 |
| 88. | Berwyn | 7.7% | 3.3%(+4.44)#88 | 3.5%(+4.20)#1,321 |
| 89. | New Brighton Borough | 7.7% | 3.3%(+4.44)#89 | 3.5%(+4.20)#1,322 |
| 90. | Ben Avon Borough | 7.7% | 3.3%(+4.43)#90 | 3.5%(+4.18)#1,330 |
| 91. | Conshohocken Borough | 7.7% | 3.3%(+4.43)#91 | 3.5%(+4.18)#1,331 |
| 92. | Jacobus Borough | 7.7% | 3.3%(+4.40)#92 | 3.5%(+4.15)#1,345 |
| 93. | Shippensburg Borough | 7.6% | 3.3%(+4.35)#93 | 3.5%(+4.10)#1,361 |
| 94. | Shanor Northvue | 7.6% | 3.3%(+4.30)#94 | 3.5%(+4.06)#1,375 |
| 95. | South Uniontown | 7.6% | 3.3%(+4.28)#95 | 3.5%(+4.03)#1,389 |
| 96. | Lehighton Borough | 7.5% | 3.3%(+4.21)#96 | 3.5%(+3.96)#1,409 |
| 97. | Trappe Borough | 7.5% | 3.3%(+4.18)#97 | 3.5%(+3.93)#1,419 |
| 98. | Lykens Borough | 7.4% | 3.3%(+4.14)#98 | 3.5%(+3.90)#1,431 |
| 99. | Edgewood Borough | 7.4% | 3.3%(+4.11)#99 | 3.5%(+3.87)#1,440 |
| 100. | Mount Oliver Borough | 7.3% | 3.3%(+4.06)#100 | 3.5%(+3.81)#1,461 |
Common Questions
What are the Top 10 Cities with the Highest Percentage of Population Employed in Computer & Mathematics in Pennsylvania?
Top 10 Cities with the Highest Percentage of Population Employed in Computer & Mathematics in Pennsylvania are:
#1
34.4%
#2
24.9%
#3
23.1%
#4
20.3%
#5
19.0%
#6
17.6%
#7
15.8%
#8
15.1%
#9
15.0%
#10
14.7%
What city has the Highest Percentage of Population Employed in Computer & Mathematics in Pennsylvania?
Yukon has the Highest Percentage of Population Employed in Computer & Mathematics in Pennsylvania with 34.4%.
What is the Percentage of Population Employed in Computer & Mathematics in the State of Pennsylvania?
Percentage of Population Employed in Computer & Mathematics in Pennsylvania is 3.3%.
What is the Percentage of Population Employed in Computer & Mathematics in the United States?
Percentage of Population Employed in Computer & Mathematics in the United States is 3.5%.