Silver Lake, KS Map & Demographics
Silver Lake Map
Silver Lake Overview
$33,218
PER CAPITA INCOME
$67,031
AVG FAMILY INCOME
$54,799
AVG HOUSEHOLD INCOME
13.2%
WAGE / INCOME GAP [ % ]
86.8¢/ $1
WAGE / INCOME GAP [ $ ]
0.36
INEQUALITY / GINI INDEX
1,446
TOTAL POPULATION
771
MALE POPULATION
675
FEMALE POPULATION
114.22
MALES / 100 FEMALES
87.55
FEMALES / 100 MALES
39.5
MEDIAN AGE
2.7
AVG FAMILY SIZE
2.2
AVG HOUSEHOLD SIZE
663
LABOR FORCE [ PEOPLE ]
62.1%
PERCENT IN LABOR FORCE
2.4%
UNEMPLOYMENT RATE
Silver Lake Zip Codes
Silver Lake Area Codes
Income in Silver Lake
Income Overview in Silver Lake
Per Capita Income in Silver Lake is $33,218, while median incomes of families and households are $67,031 and $54,799 respectively.
| Characteristic | Number | Measure |
| Per Capita Income | 1,446 | $33,218 |
| Median Family Income | 451 | $67,031 |
| Mean Family Income | 451 | $88,246 |
| Median Household Income | 642 | $54,799 |
| Mean Household Income | 642 | $78,254 |
| Income Deficit | 451 | $0 |
| Wage / Income Gap (%) | 1,446 | 13.24% |
| Wage / Income Gap ($) | 1,446 | 86.76¢ per $1 |
| Gini / Inequality Index | 1,446 | 0.36 |
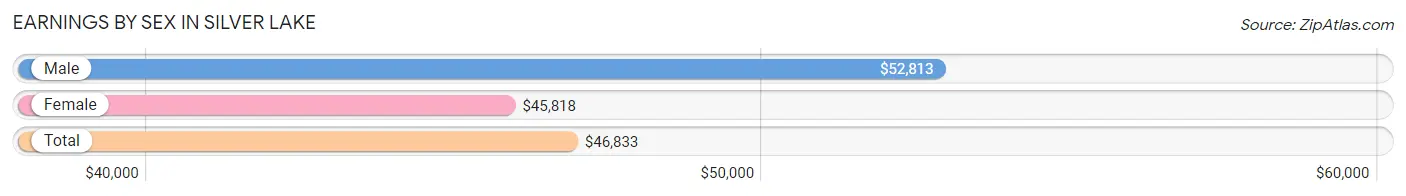
Earnings by Sex in Silver Lake
Average Earnings in Silver Lake are $46,833, $52,813 for men and $45,818 for women, a difference of 13.2%.
| Sex | Number | Average Earnings |
| Male | 302 (44.8%) | $52,813 |
| Female | 372 (55.2%) | $45,818 |
| Total | 674 (100.0%) | $46,833 |
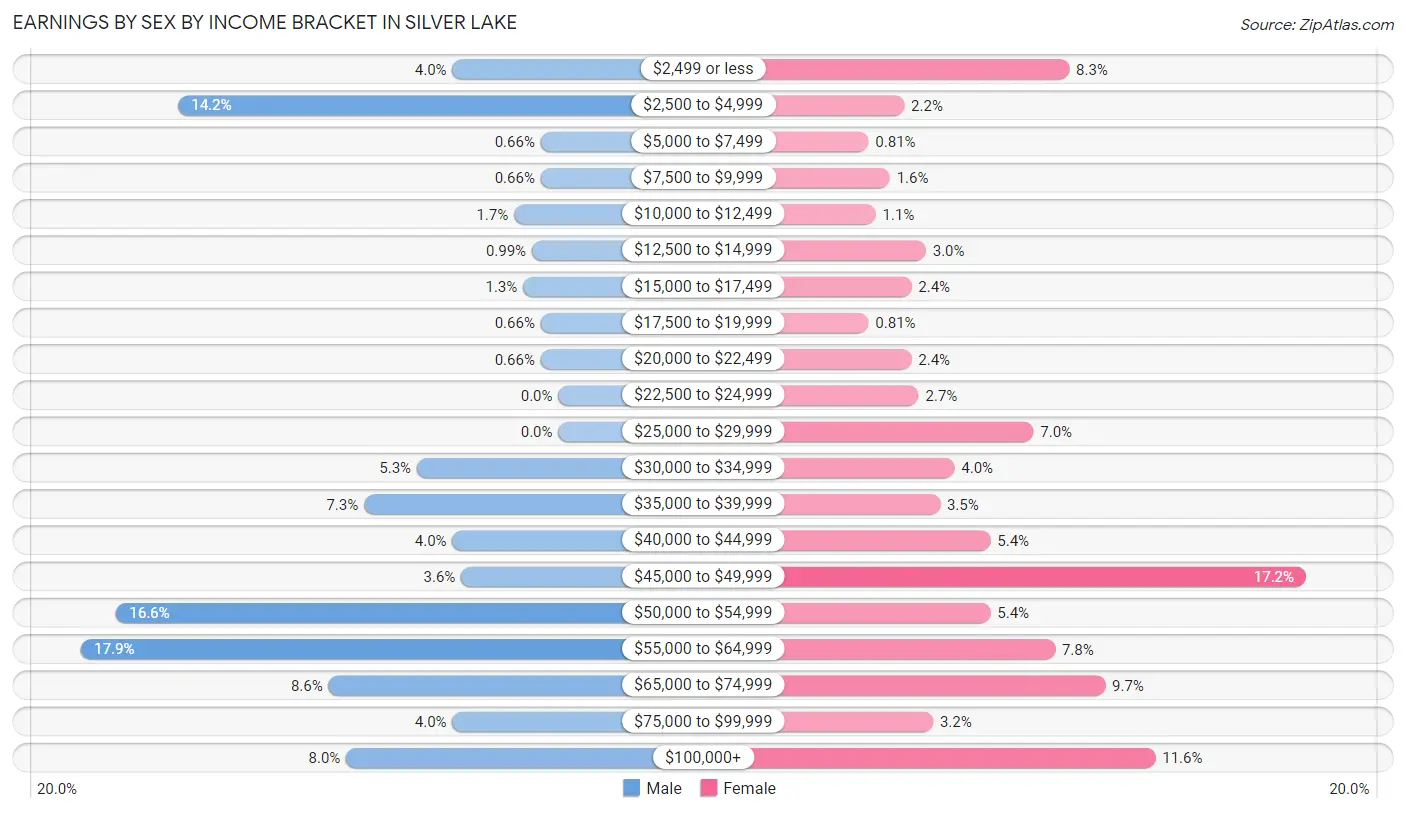
Earnings by Sex by Income Bracket in Silver Lake
The most common earnings brackets in Silver Lake are $55,000 to $64,999 for men (54 | 17.9%) and $45,000 to $49,999 for women (64 | 17.2%).
| Income | Male | Female |
| $2,499 or less | 12 (4.0%) | 31 (8.3%) |
| $2,500 to $4,999 | 43 (14.2%) | 8 (2.1%) |
| $5,000 to $7,499 | 2 (0.7%) | 3 (0.8%) |
| $7,500 to $9,999 | 2 (0.7%) | 6 (1.6%) |
| $10,000 to $12,499 | 5 (1.7%) | 4 (1.1%) |
| $12,500 to $14,999 | 3 (1.0%) | 11 (3.0%) |
| $15,000 to $17,499 | 4 (1.3%) | 9 (2.4%) |
| $17,500 to $19,999 | 2 (0.7%) | 3 (0.8%) |
| $20,000 to $22,499 | 2 (0.7%) | 9 (2.4%) |
| $22,500 to $24,999 | 0 (0.0%) | 10 (2.7%) |
| $25,000 to $29,999 | 0 (0.0%) | 26 (7.0%) |
| $30,000 to $34,999 | 16 (5.3%) | 15 (4.0%) |
| $35,000 to $39,999 | 22 (7.3%) | 13 (3.5%) |
| $40,000 to $44,999 | 12 (4.0%) | 20 (5.4%) |
| $45,000 to $49,999 | 11 (3.6%) | 64 (17.2%) |
| $50,000 to $54,999 | 50 (16.6%) | 20 (5.4%) |
| $55,000 to $64,999 | 54 (17.9%) | 29 (7.8%) |
| $65,000 to $74,999 | 26 (8.6%) | 36 (9.7%) |
| $75,000 to $99,999 | 12 (4.0%) | 12 (3.2%) |
| $100,000+ | 24 (8.0%) | 43 (11.6%) |
| Total | 302 (100.0%) | 372 (100.0%) |
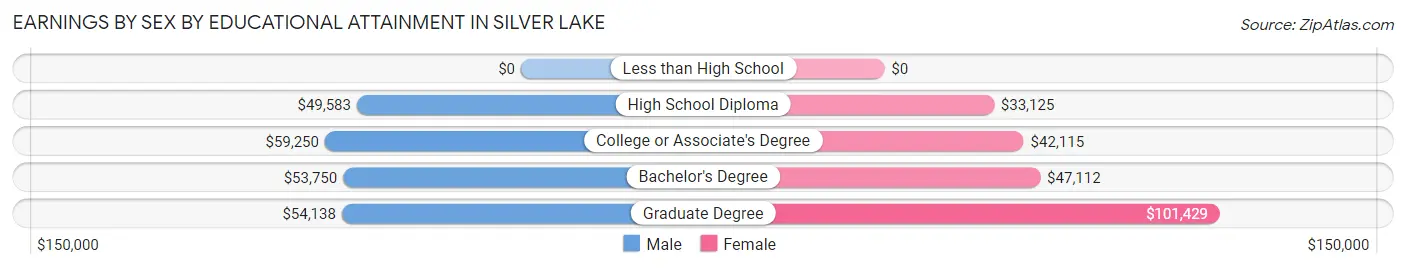
Earnings by Sex by Educational Attainment in Silver Lake
Average earnings in Silver Lake are $54,406 for men and $46,727 for women, a difference of 14.1%. Men with an educational attainment of college or associate's degree enjoy the highest average annual earnings of $59,250, while those with high school diploma education earn the least with $49,583. Women with an educational attainment of graduate degree earn the most with the average annual earnings of $101,429, while those with high school diploma education have the smallest earnings of $33,125.
| Educational Attainment | Male Income | Female Income |
| Less than High School | - | - |
| High School Diploma | $49,583 | $33,125 |
| College or Associate's Degree | $59,250 | $42,115 |
| Bachelor's Degree | $53,750 | $47,112 |
| Graduate Degree | $54,138 | $101,429 |
| Total | $54,406 | $46,727 |
Family Income in Silver Lake
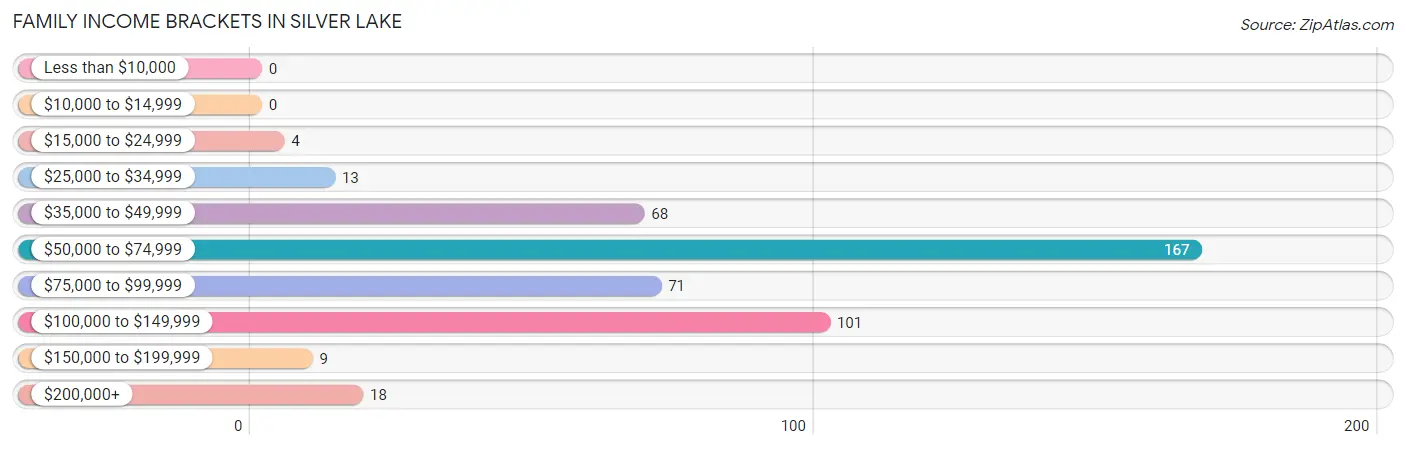
Family Income Brackets in Silver Lake
According to the Silver Lake family income data, there are 167 families falling into the $50,000 to $74,999 income range, which is the most common income bracket and makes up 37.0% of all families.
| Income Bracket | # Families | % Families |
| Less than $10,000 | 0 | 0.0% |
| $10,000 to $14,999 | 0 | 0.0% |
| $15,000 to $24,999 | 4 | 0.9% |
| $25,000 to $34,999 | 13 | 2.9% |
| $35,000 to $49,999 | 68 | 15.1% |
| $50,000 to $74,999 | 167 | 37.0% |
| $75,000 to $99,999 | 71 | 15.7% |
| $100,000 to $149,999 | 101 | 22.4% |
| $150,000 to $199,999 | 9 | 2.0% |
| $200,000+ | 18 | 4.0% |
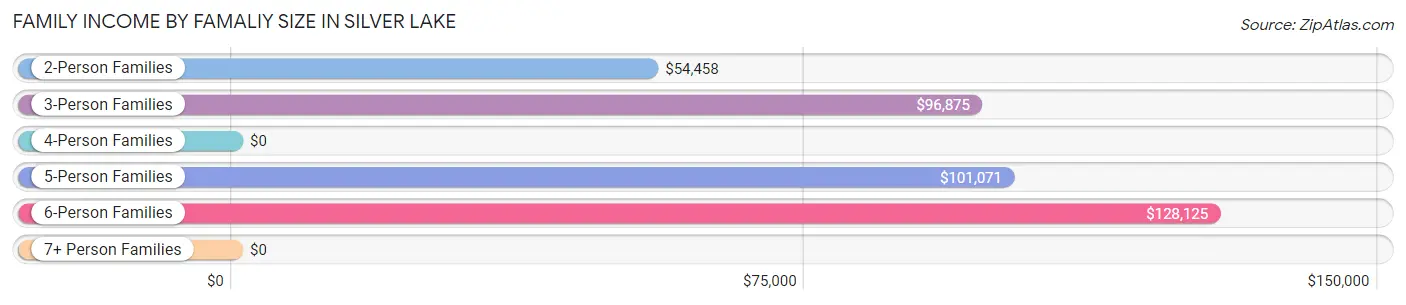
Family Income by Famaliy Size in Silver Lake
6-person families (14 | 3.1%) account for the highest median family income in Silver Lake with $128,125 per family, while 3-person families (31 | 6.9%) have the highest median income of $32,292 per family member.
| Income Bracket | # Families | Median Income |
| 2-Person Families | 263 (58.3%) | $54,458 |
| 3-Person Families | 31 (6.9%) | $96,875 |
| 4-Person Families | 81 (18.0%) | $0 |
| 5-Person Families | 62 (13.8%) | $101,071 |
| 6-Person Families | 14 (3.1%) | $128,125 |
| 7+ Person Families | 0 (0.0%) | $0 |
| Total | 451 (100.0%) | $67,031 |
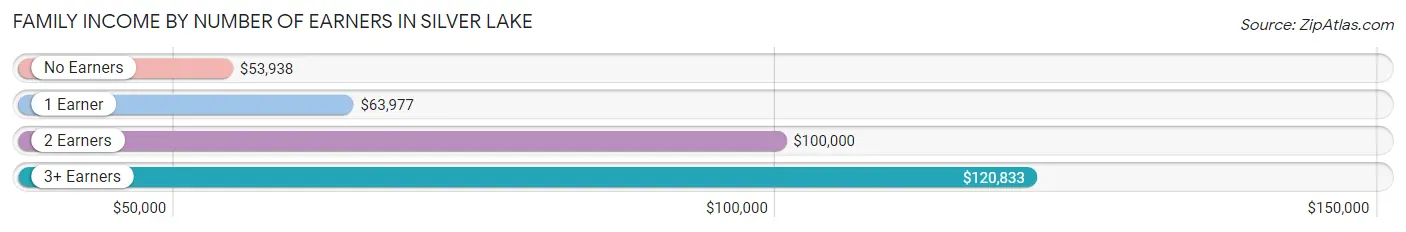
Family Income by Number of Earners in Silver Lake
The median family income in Silver Lake is $67,031, with families comprising 3+ earners (46) having the highest median family income of $120,833, while families with no earners (174) have the lowest median family income of $53,938, accounting for 10.2% and 38.6% of families, respectively.
| Number of Earners | # Families | Median Income |
| No Earners | 174 (38.6%) | $53,938 |
| 1 Earner | 91 (20.2%) | $63,977 |
| 2 Earners | 140 (31.0%) | $100,000 |
| 3+ Earners | 46 (10.2%) | $120,833 |
| Total | 451 (100.0%) | $67,031 |
Household Income in Silver Lake
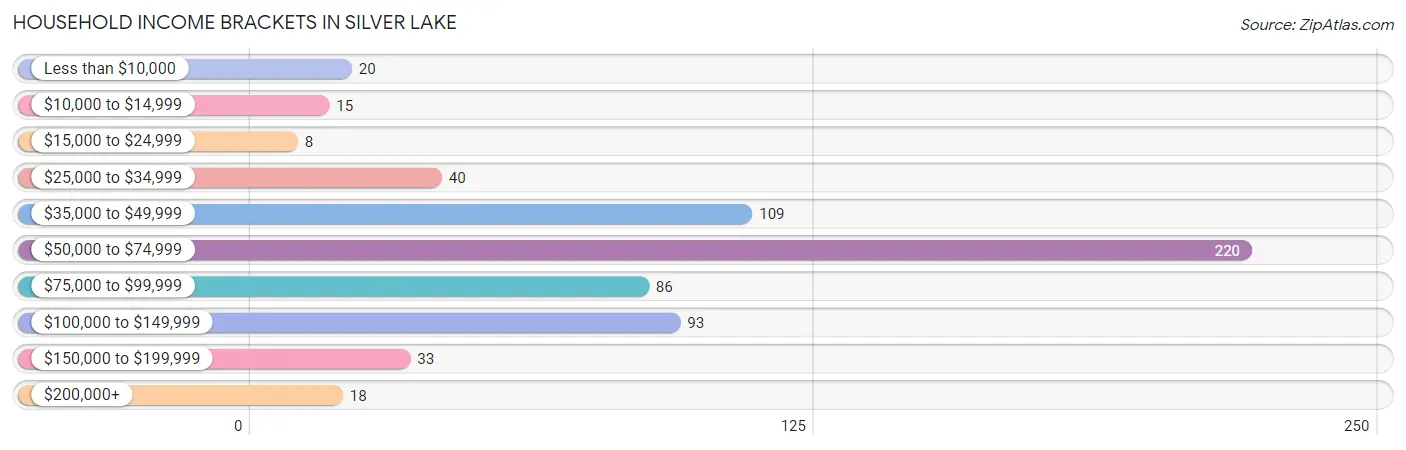
Household Income Brackets in Silver Lake
With 220 households falling in the category, the $50,000 to $74,999 income range is the most frequent in Silver Lake, accounting for 34.3% of all households. In contrast, only 8 households (1.3%) fall into the $15,000 to $24,999 income bracket, making it the least populous group.
| Income Bracket | # Households | % Households |
| Less than $10,000 | 20 | 3.1% |
| $10,000 to $14,999 | 15 | 2.3% |
| $15,000 to $24,999 | 8 | 1.2% |
| $25,000 to $34,999 | 40 | 6.2% |
| $35,000 to $49,999 | 109 | 17.0% |
| $50,000 to $74,999 | 220 | 34.3% |
| $75,000 to $99,999 | 86 | 13.4% |
| $100,000 to $149,999 | 93 | 14.5% |
| $150,000 to $199,999 | 33 | 5.1% |
| $200,000+ | 18 | 2.8% |
Household Income by Householder Age in Silver Lake
The median household income in Silver Lake is $54,799, with the highest median household income of $80,870 found in the 25 to 44 years age bracket for the primary householder. A total of 214 households (33.3%) fall into this category. Meanwhile, the 15 to 24 years age bracket for the primary householder has the lowest median household income of $0, with 20 households (3.1%) in this group.
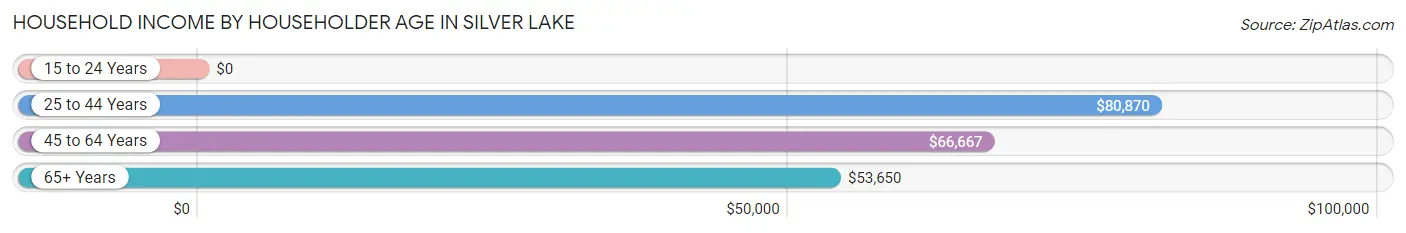
| Income Bracket | # Households | Median Income |
| 15 to 24 Years | 20 (3.1%) | $0 |
| 25 to 44 Years | 214 (33.3%) | $80,870 |
| 45 to 64 Years | 138 (21.5%) | $66,667 |
| 65+ Years | 270 (42.1%) | $53,650 |
| Total | 642 (100.0%) | $54,799 |
Poverty in Silver Lake
Income Below Poverty by Sex and Age in Silver Lake
With 5.2% poverty level for males and 3.3% for females among the residents of Silver Lake, under 5 year old males and 25 to 34 year old females are the most vulnerable to poverty, with 6 males (24.0%) and 10 females (22.2%) in their respective age groups living below the poverty level.
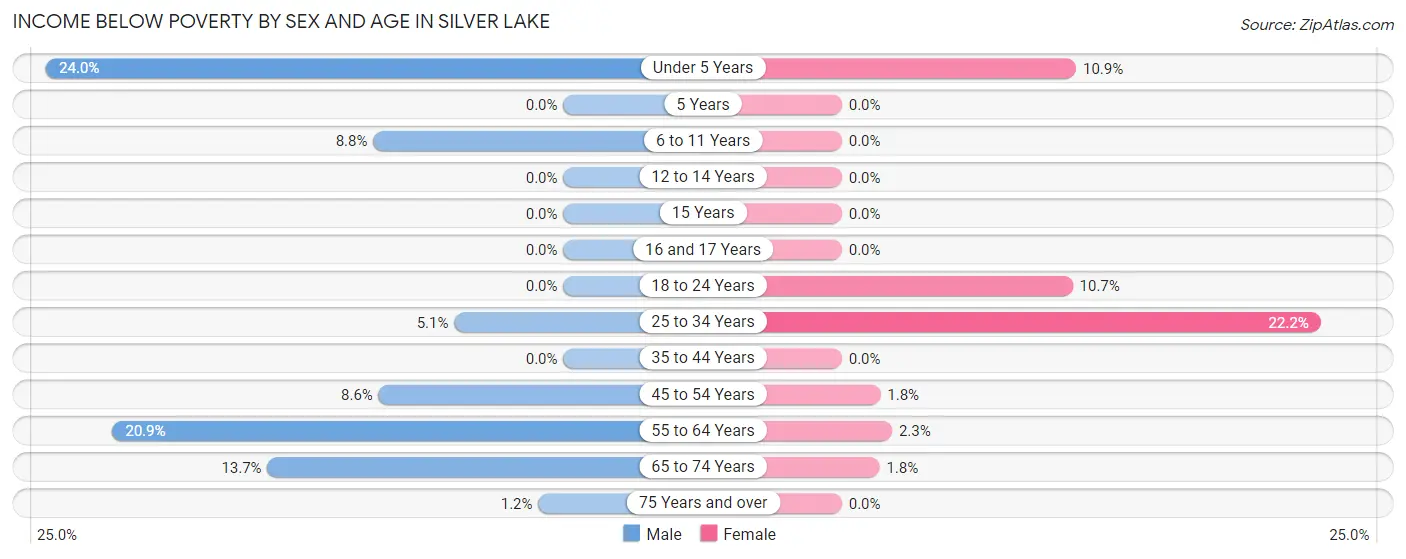
| Age Bracket | Male | Female |
| Under 5 Years | 6 (24.0%) | 5 (10.9%) |
| 5 Years | 0 (0.0%) | 0 (0.0%) |
| 6 to 11 Years | 9 (8.8%) | 0 (0.0%) |
| 12 to 14 Years | 0 (0.0%) | 0 (0.0%) |
| 15 Years | 0 (0.0%) | 0 (0.0%) |
| 16 and 17 Years | 0 (0.0%) | 0 (0.0%) |
| 18 to 24 Years | 0 (0.0%) | 3 (10.7%) |
| 25 to 34 Years | 4 (5.1%) | 10 (22.2%) |
| 35 to 44 Years | 0 (0.0%) | 0 (0.0%) |
| 45 to 54 Years | 3 (8.6%) | 2 (1.8%) |
| 55 to 64 Years | 9 (20.9%) | 1 (2.3%) |
| 65 to 74 Years | 7 (13.7%) | 1 (1.8%) |
| 75 Years and over | 2 (1.2%) | 0 (0.0%) |
| Total | 40 (5.2%) | 22 (3.3%) |
Income Above Poverty by Sex and Age in Silver Lake
According to the poverty statistics in Silver Lake, males aged 5 years and females aged 5 years are the age groups that are most secure financially, with 100.0% of males and 100.0% of females in these age groups living above the poverty line.
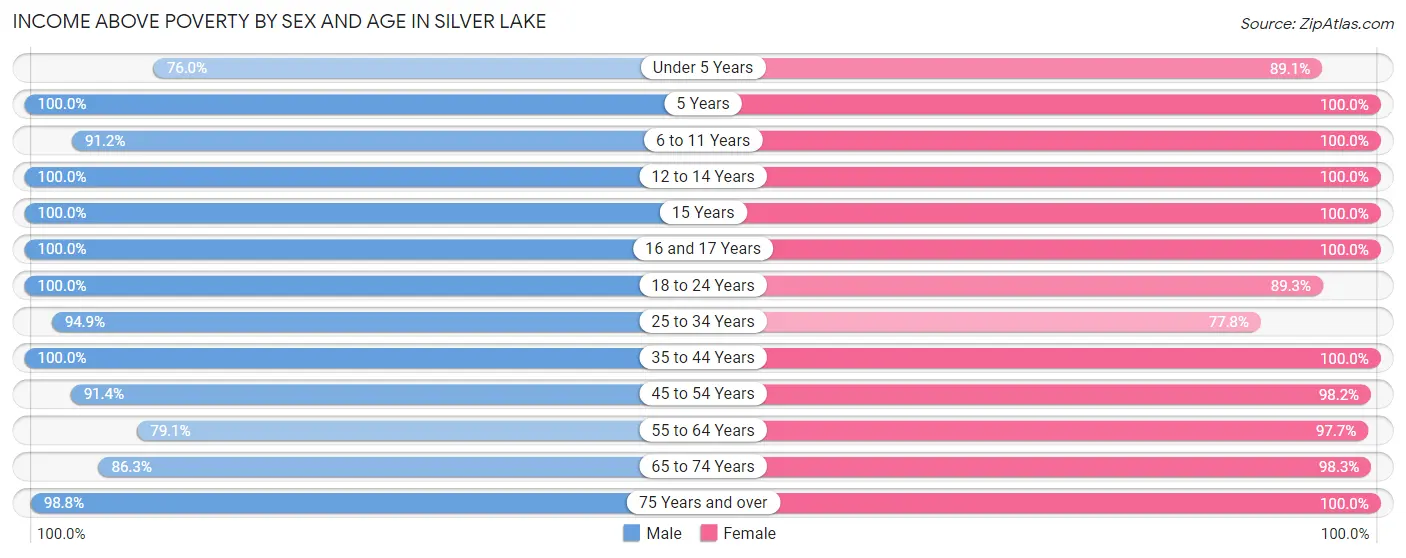
| Age Bracket | Male | Female |
| Under 5 Years | 19 (76.0%) | 41 (89.1%) |
| 5 Years | 8 (100.0%) | 8 (100.0%) |
| 6 to 11 Years | 93 (91.2%) | 61 (100.0%) |
| 12 to 14 Years | 30 (100.0%) | 43 (100.0%) |
| 15 Years | 33 (100.0%) | 22 (100.0%) |
| 16 and 17 Years | 21 (100.0%) | 28 (100.0%) |
| 18 to 24 Years | 85 (100.0%) | 25 (89.3%) |
| 25 to 34 Years | 75 (94.9%) | 35 (77.8%) |
| 35 to 44 Years | 86 (100.0%) | 115 (100.0%) |
| 45 to 54 Years | 32 (91.4%) | 110 (98.2%) |
| 55 to 64 Years | 34 (79.1%) | 42 (97.7%) |
| 65 to 74 Years | 44 (86.3%) | 56 (98.3%) |
| 75 Years and over | 171 (98.8%) | 67 (100.0%) |
| Total | 731 (94.8%) | 653 (96.7%) |
Income Below Poverty Among Married-Couple Families in Silver Lake
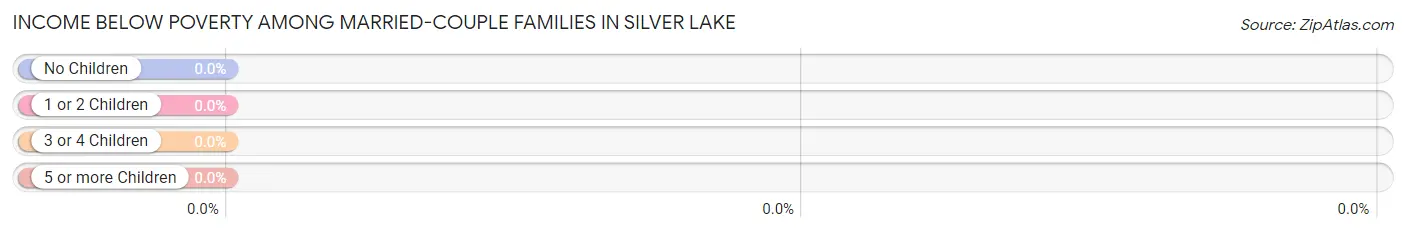
| Children | Above Poverty | Below Poverty |
| No Children | 264 (100.0%) | 0 (0.0%) |
| 1 or 2 Children | 38 (100.0%) | 0 (0.0%) |
| 3 or 4 Children | 61 (100.0%) | 0 (0.0%) |
| 5 or more Children | 0 (0.0%) | 0 (0.0%) |
| Total | 363 (100.0%) | 0 (0.0%) |
Income Below Poverty Among Single-Parent Households in Silver Lake
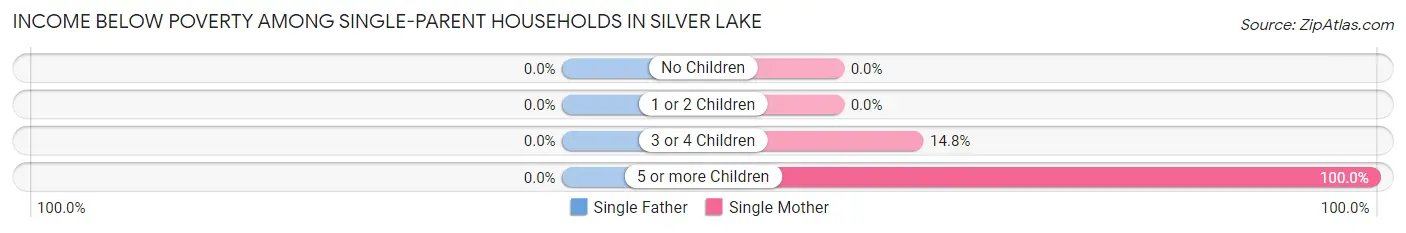
| Children | Single Father | Single Mother |
| No Children | 0 (0.0%) | 0 (0.0%) |
| 1 or 2 Children | 0 (0.0%) | 0 (0.0%) |
| 3 or 4 Children | 0 (0.0%) | 4 (14.8%) |
| 5 or more Children | 0 (0.0%) | 2 (100.0%) |
| Total | 0 (0.0%) | 6 (8.2%) |
Income Below Poverty Among Married-Couple vs Single-Parent Households in Silver Lake
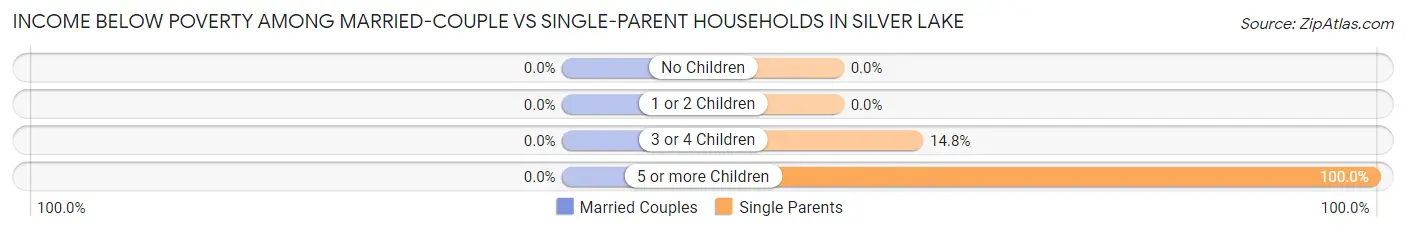
| Children | Married-Couple Families | Single-Parent Households |
| No Children | 0 (0.0%) | 0 (0.0%) |
| 1 or 2 Children | 0 (0.0%) | 0 (0.0%) |
| 3 or 4 Children | 0 (0.0%) | 4 (14.8%) |
| 5 or more Children | 0 (0.0%) | 2 (100.0%) |
| Total | 0 (0.0%) | 6 (6.8%) |
Race in Silver Lake
The most populous races in Silver Lake are White / Caucasian (1,393 | 96.3%), Hispanic or Latino (55 | 3.8%), and Two or more Races (36 | 2.5%).
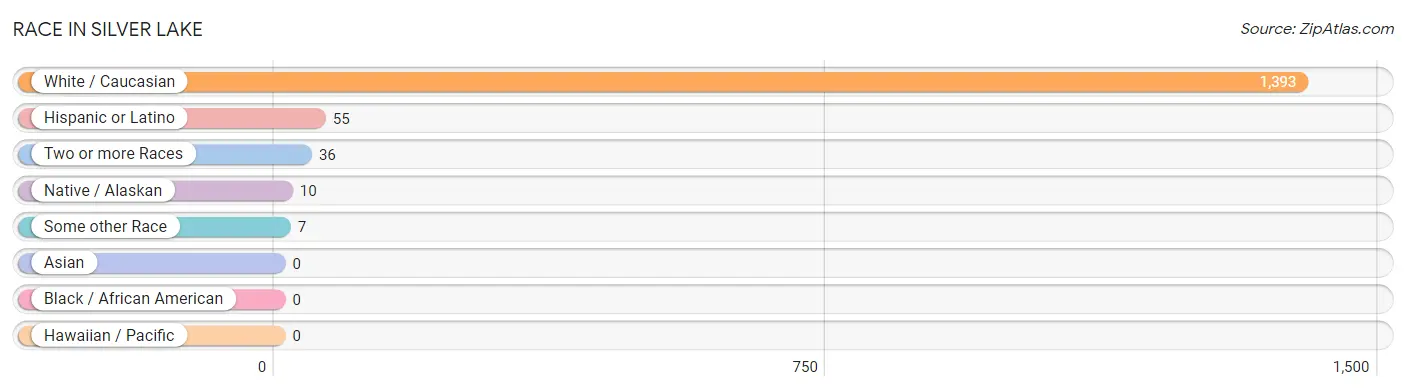
| Race | # Population | % Population |
| Asian | 0 | 0.0% |
| Black / African American | 0 | 0.0% |
| Hawaiian / Pacific | 0 | 0.0% |
| Hispanic or Latino | 55 | 3.8% |
| Native / Alaskan | 10 | 0.7% |
| White / Caucasian | 1,393 | 96.3% |
| Two or more Races | 36 | 2.5% |
| Some other Race | 7 | 0.5% |
| Total | 1,446 | 100.0% |
Ancestry in Silver Lake
The most populous ancestries reported in Silver Lake are German (376 | 26.0%), English (187 | 12.9%), Irish (146 | 10.1%), American (96 | 6.6%), and Italian (62 | 4.3%), together accounting for 60.0% of all Silver Lake residents.
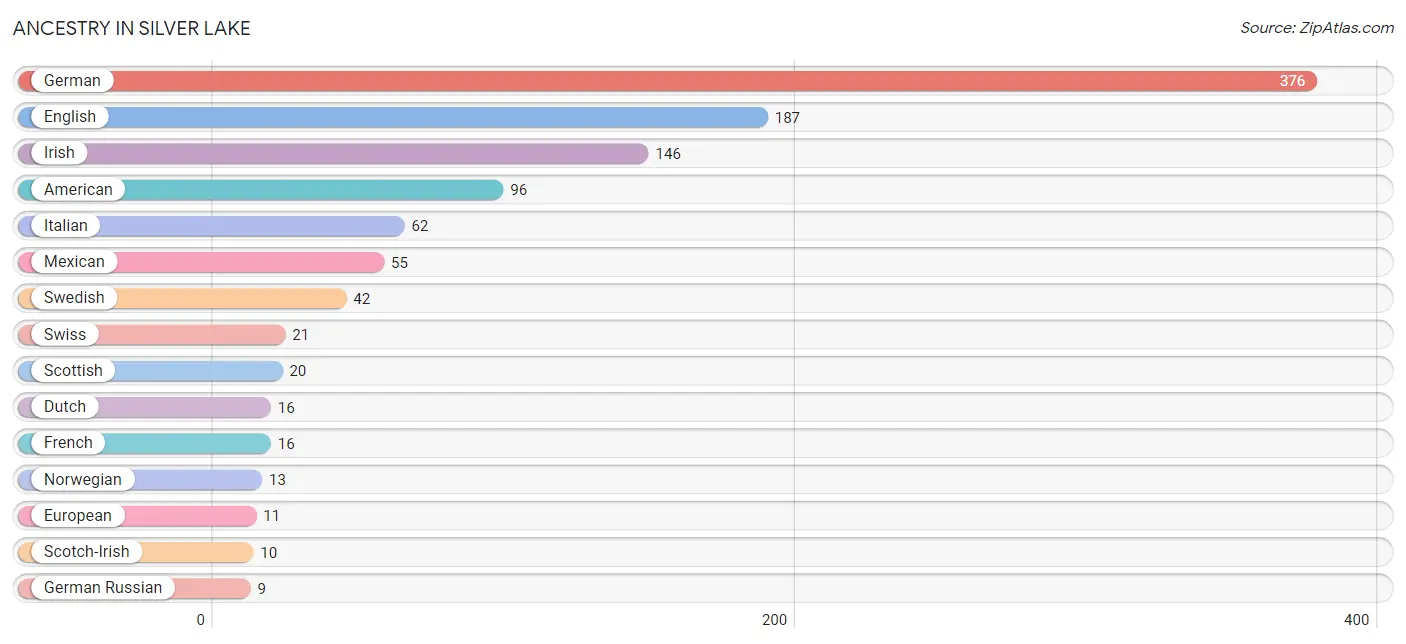
| Ancestry | # Population | % Population |
| American | 96 | 6.6% |
| Austrian | 7 | 0.5% |
| British | 2 | 0.1% |
| Czech | 1 | 0.1% |
| Czechoslovakian | 7 | 0.5% |
| Dutch | 16 | 1.1% |
| Dutch West Indian | 2 | 0.1% |
| Eastern European | 2 | 0.1% |
| English | 187 | 12.9% |
| European | 11 | 0.8% |
| French | 16 | 1.1% |
| French Canadian | 4 | 0.3% |
| German | 376 | 26.0% |
| German Russian | 9 | 0.6% |
| Irish | 146 | 10.1% |
| Italian | 62 | 4.3% |
| Mexican | 55 | 3.8% |
| Mexican American Indian | 4 | 0.3% |
| Nigerian | 1 | 0.1% |
| Northern European | 1 | 0.1% |
| Norwegian | 13 | 0.9% |
| Polish | 2 | 0.1% |
| Potawatomi | 8 | 0.5% |
| Russian | 8 | 0.5% |
| Scotch-Irish | 10 | 0.7% |
| Scottish | 20 | 1.4% |
| Subsaharan African | 1 | 0.1% |
| Swedish | 42 | 2.9% |
| Swiss | 21 | 1.5% |
| Welsh | 6 | 0.4% | View All 30 Rows |
Immigrants in Silver Lake

| Immigration Origin | # Population | % Population | View All 0 Rows |
Sex and Age in Silver Lake
Sex and Age in Silver Lake
The most populous age groups in Silver Lake are 85 Years and over (120 | 15.6%) for men and 10 to 14 Years (74 | 11.0%) for women.
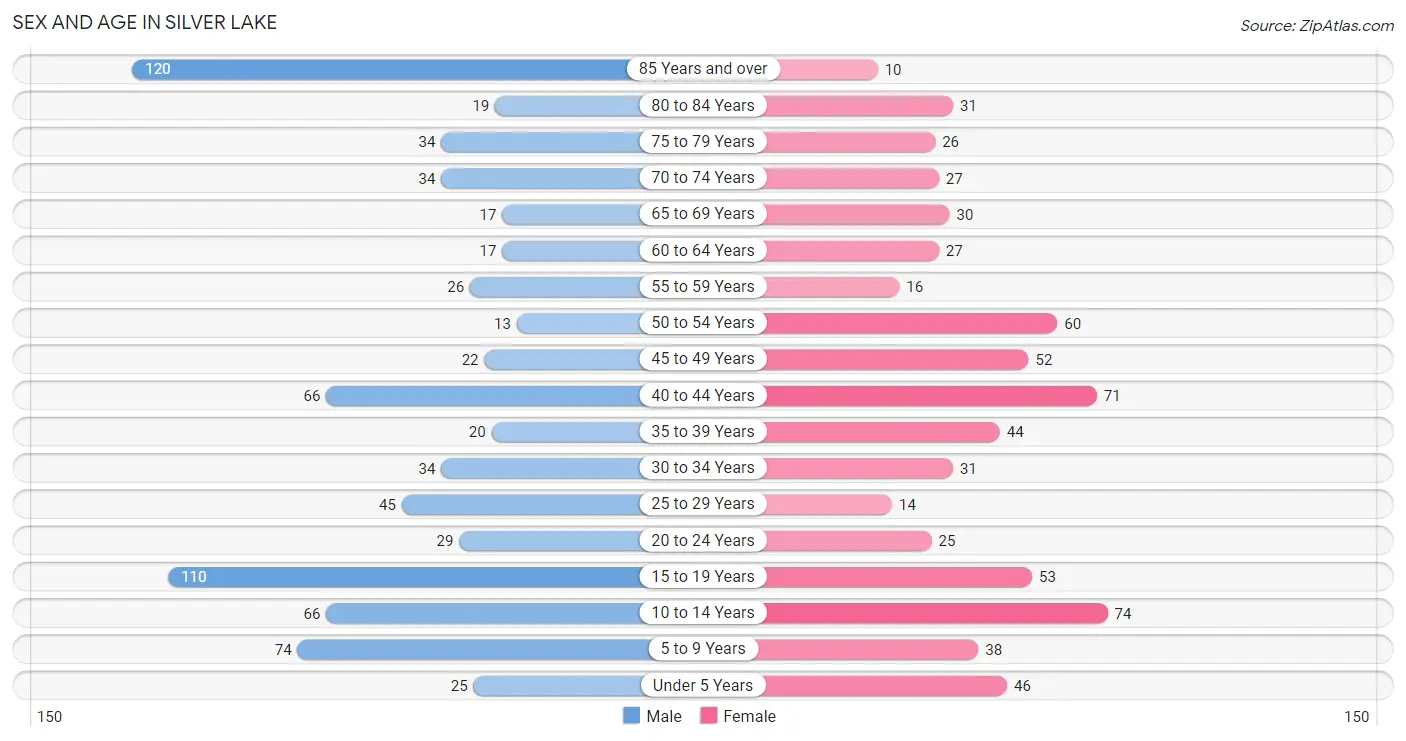
| Age Bracket | Male | Female |
| Under 5 Years | 25 (3.2%) | 46 (6.8%) |
| 5 to 9 Years | 74 (9.6%) | 38 (5.6%) |
| 10 to 14 Years | 66 (8.6%) | 74 (11.0%) |
| 15 to 19 Years | 110 (14.3%) | 53 (7.9%) |
| 20 to 24 Years | 29 (3.8%) | 25 (3.7%) |
| 25 to 29 Years | 45 (5.8%) | 14 (2.1%) |
| 30 to 34 Years | 34 (4.4%) | 31 (4.6%) |
| 35 to 39 Years | 20 (2.6%) | 44 (6.5%) |
| 40 to 44 Years | 66 (8.6%) | 71 (10.5%) |
| 45 to 49 Years | 22 (2.9%) | 52 (7.7%) |
| 50 to 54 Years | 13 (1.7%) | 60 (8.9%) |
| 55 to 59 Years | 26 (3.4%) | 16 (2.4%) |
| 60 to 64 Years | 17 (2.2%) | 27 (4.0%) |
| 65 to 69 Years | 17 (2.2%) | 30 (4.4%) |
| 70 to 74 Years | 34 (4.4%) | 27 (4.0%) |
| 75 to 79 Years | 34 (4.4%) | 26 (3.8%) |
| 80 to 84 Years | 19 (2.5%) | 31 (4.6%) |
| 85 Years and over | 120 (15.6%) | 10 (1.5%) |
| Total | 771 (100.0%) | 675 (100.0%) |
Families and Households in Silver Lake
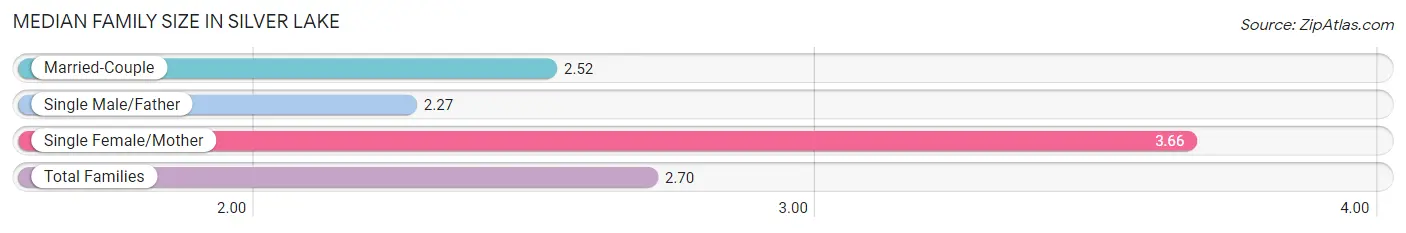
Median Family Size in Silver Lake
The median family size in Silver Lake is 2.70 persons per family, with single female/mother families (73 | 16.2%) accounting for the largest median family size of 3.66 persons per family. On the other hand, single male/father families (15 | 3.3%) represent the smallest median family size with 2.27 persons per family.
| Family Type | # Families | Family Size |
| Married-Couple | 363 (80.5%) | 2.52 |
| Single Male/Father | 15 (3.3%) | 2.27 |
| Single Female/Mother | 73 (16.2%) | 3.66 |
| Total Families | 451 (100.0%) | 2.70 |
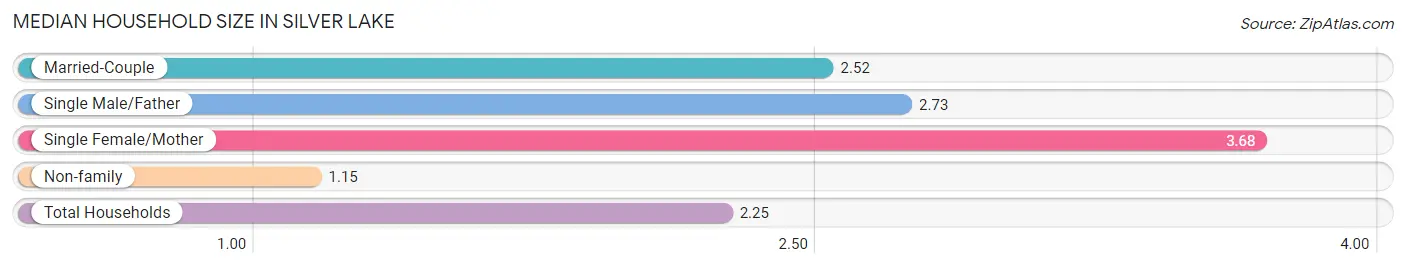
Median Household Size in Silver Lake
The median household size in Silver Lake is 2.25 persons per household, with single female/mother households (73 | 11.4%) accounting for the largest median household size of 3.68 persons per household. non-family households (191 | 29.7%) represent the smallest median household size with 1.15 persons per household.
| Household Type | # Households | Household Size |
| Married-Couple | 363 (56.5%) | 2.52 |
| Single Male/Father | 15 (2.3%) | 2.73 |
| Single Female/Mother | 73 (11.4%) | 3.68 |
| Non-family | 191 (29.7%) | 1.15 |
| Total Households | 642 (100.0%) | 2.25 |
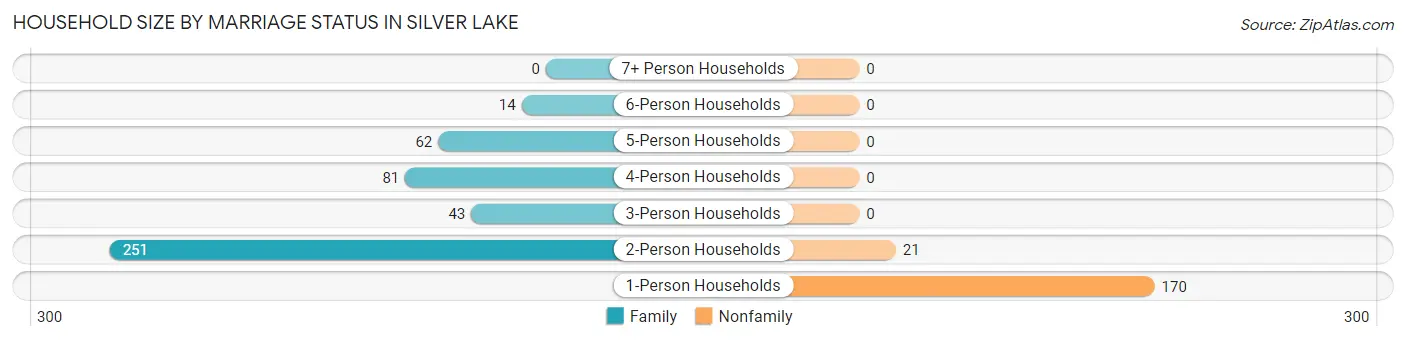
Household Size by Marriage Status in Silver Lake
Out of a total of 642 households in Silver Lake, 451 (70.3%) are family households, while 191 (29.7%) are nonfamily households. The most numerous type of family households are 2-person households, comprising 251, and the most common type of nonfamily households are 1-person households, comprising 170.
| Household Size | Family Households | Nonfamily Households |
| 1-Person Households | - | 170 (26.5%) |
| 2-Person Households | 251 (39.1%) | 21 (3.3%) |
| 3-Person Households | 43 (6.7%) | 0 (0.0%) |
| 4-Person Households | 81 (12.6%) | 0 (0.0%) |
| 5-Person Households | 62 (9.7%) | 0 (0.0%) |
| 6-Person Households | 14 (2.2%) | 0 (0.0%) |
| 7+ Person Households | 0 (0.0%) | 0 (0.0%) |
| Total | 451 (70.3%) | 191 (29.7%) |
Female Fertility in Silver Lake
Fertility by Age in Silver Lake
Average fertility rate in Silver Lake is 66.0 births per 1,000 women. Women in the age bracket of 20 to 34 years have the highest fertility rate with 200.0 births per 1,000 women. Women in the age bracket of 20 to 34 years acount for 73.7% of all women with births.
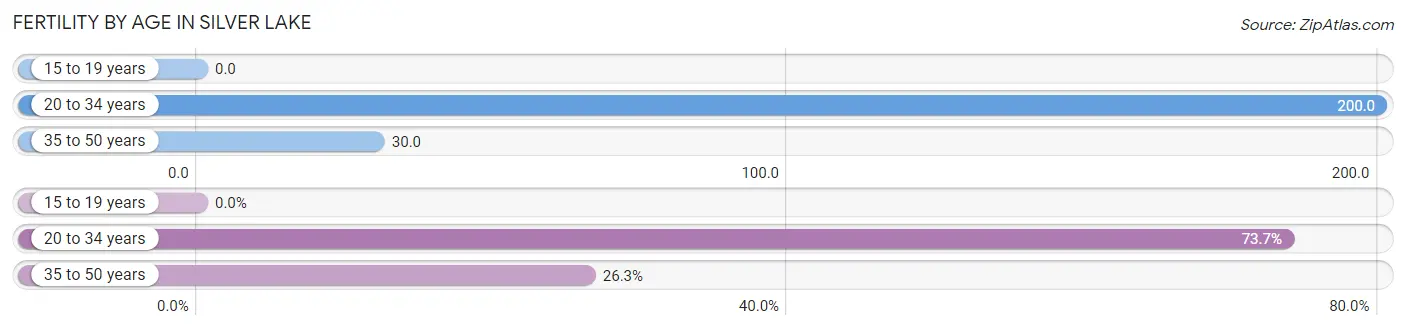
| Age Bracket | Women with Births | Births / 1,000 Women |
| 15 to 19 years | 0 (0.0%) | 0.0 |
| 20 to 34 years | 14 (73.7%) | 200.0 |
| 35 to 50 years | 5 (26.3%) | 30.0 |
| Total | 19 (100.0%) | 66.0 |
Fertility by Age by Marriage Status in Silver Lake
52.6% of women with births (19) in Silver Lake are married. The highest percentage of unmarried women with births falls into 20 to 34 years age bracket with 64.3% of them unmarried at the time of birth, while the lowest percentage of unmarried women with births belong to 35 to 50 years age bracket with 0.0% of them unmarried.
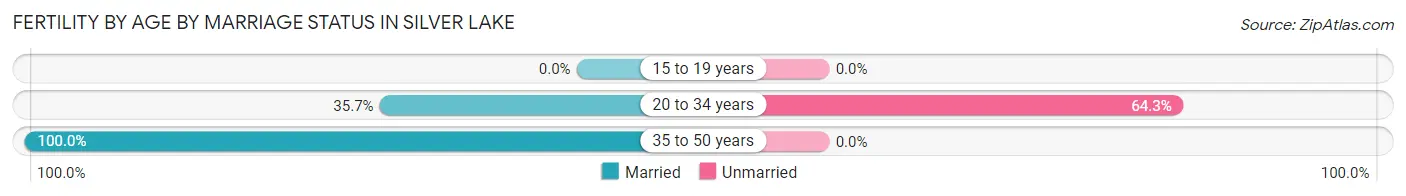
| Age Bracket | Married | Unmarried |
| 15 to 19 years | 0 (0.0%) | 0 (0.0%) |
| 20 to 34 years | 5 (35.7%) | 9 (64.3%) |
| 35 to 50 years | 5 (100.0%) | 0 (0.0%) |
| Total | 10 (52.6%) | 9 (47.4%) |
Fertility by Education in Silver Lake
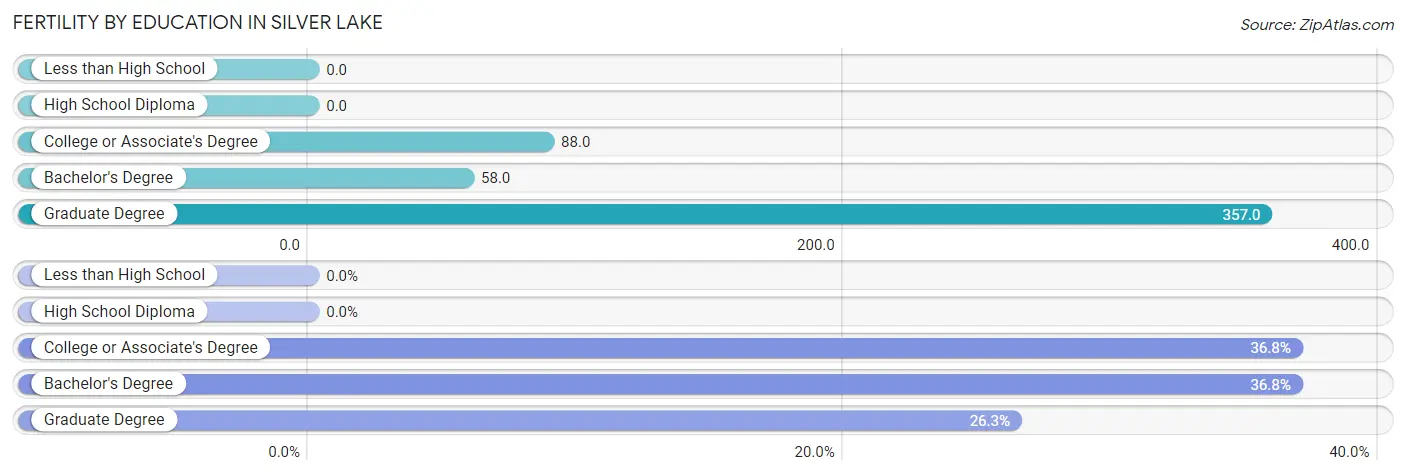
| Educational Attainment | Women with Births | Births / 1,000 Women |
| Less than High School | 0 (0.0%) | 0.0 |
| High School Diploma | 0 (0.0%) | 0.0 |
| College or Associate's Degree | 7 (36.8%) | 88.0 |
| Bachelor's Degree | 7 (36.8%) | 58.0 |
| Graduate Degree | 5 (26.3%) | 357.0 |
| Total | 19 (100.0%) | 66.0 |
Fertility by Education by Marriage Status in Silver Lake
47.4% of women with births in Silver Lake are unmarried. Women with the educational attainment of graduate degree are most likely to be married with 100.0% of them married at childbirth, while women with the educational attainment of bachelor's degree are least likely to be married with 100.0% of them unmarried at childbirth.
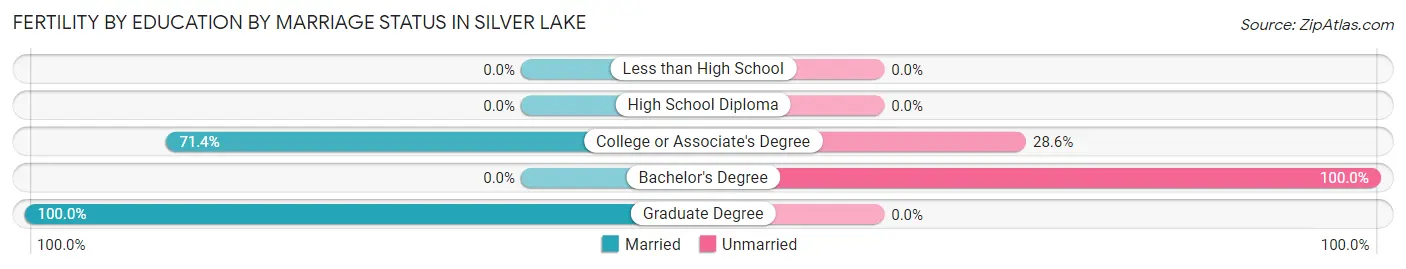
| Educational Attainment | Married | Unmarried |
| Less than High School | 0 (0.0%) | 0 (0.0%) |
| High School Diploma | 0 (0.0%) | 0 (0.0%) |
| College or Associate's Degree | 5 (71.4%) | 2 (28.6%) |
| Bachelor's Degree | 0 (0.0%) | 7 (100.0%) |
| Graduate Degree | 5 (100.0%) | 0 (0.0%) |
| Total | 10 (52.6%) | 9 (47.4%) |
Employment Characteristics in Silver Lake
Employment by Class of Employer in Silver Lake
Among the 641 employed individuals in Silver Lake, private company employees (394 | 61.5%), local government employees (123 | 19.2%), and state government employees (43 | 6.7%) make up the most common classes of employment.
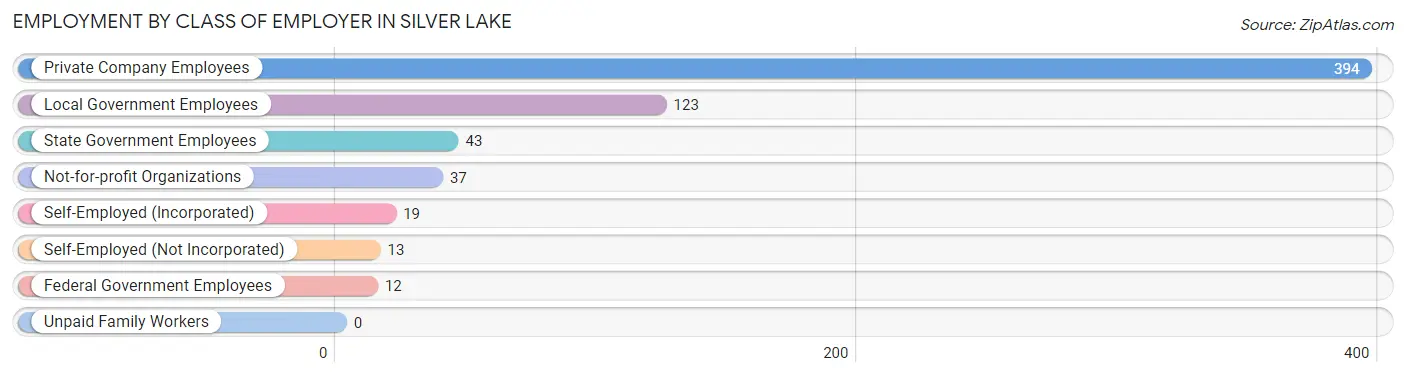
| Employer Class | # Employees | % Employees |
| Private Company Employees | 394 | 61.5% |
| Self-Employed (Incorporated) | 19 | 3.0% |
| Self-Employed (Not Incorporated) | 13 | 2.0% |
| Not-for-profit Organizations | 37 | 5.8% |
| Local Government Employees | 123 | 19.2% |
| State Government Employees | 43 | 6.7% |
| Federal Government Employees | 12 | 1.9% |
| Unpaid Family Workers | 0 | 0.0% |
| Total | 641 | 100.0% |
Employment Status by Age in Silver Lake
According to the labor force statistics for Silver Lake, out of the total population over 16 years of age (1,068), 62.1% or 663 individuals are in the labor force, with 2.4% or 16 of them unemployed. The age group with the highest labor force participation rate is 45 to 54 years, with 98.0% or 144 individuals in the labor force. Within the labor force, the 16 to 19 years age range has the highest percentage of unemployed individuals, with 15.6% or 12 of them being unemployed.
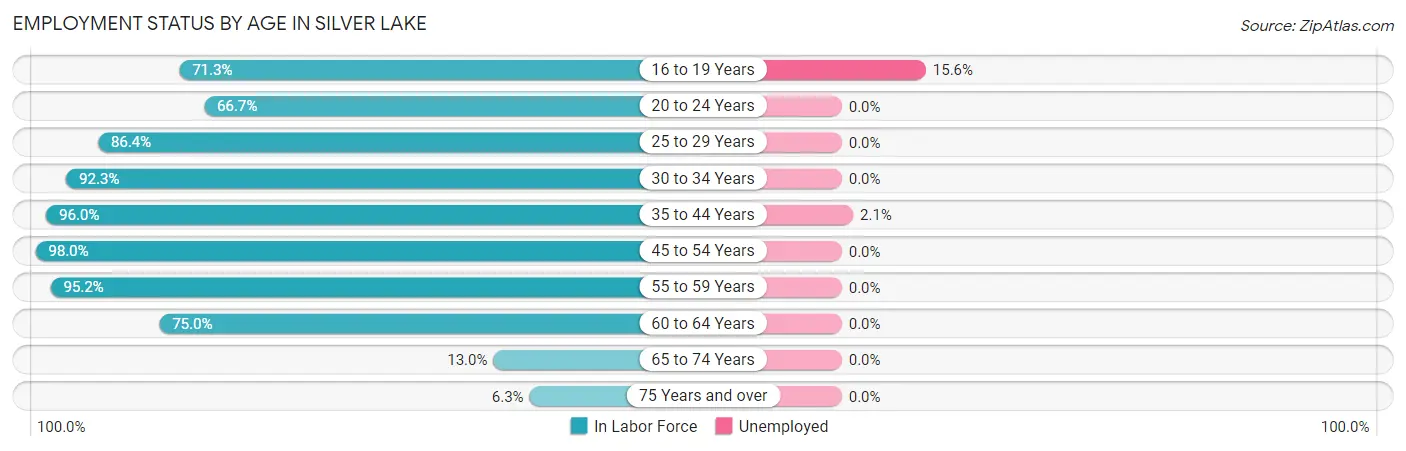
| Age Bracket | In Labor Force | Unemployed |
| 16 to 19 Years | 77 (71.3%) | 12 (15.6%) |
| 20 to 24 Years | 36 (66.7%) | 0 (0.0%) |
| 25 to 29 Years | 51 (86.4%) | 0 (0.0%) |
| 30 to 34 Years | 60 (92.3%) | 0 (0.0%) |
| 35 to 44 Years | 193 (96.0%) | 4 (2.1%) |
| 45 to 54 Years | 144 (98.0%) | 0 (0.0%) |
| 55 to 59 Years | 40 (95.2%) | 0 (0.0%) |
| 60 to 64 Years | 33 (75.0%) | 0 (0.0%) |
| 65 to 74 Years | 14 (13.0%) | 0 (0.0%) |
| 75 Years and over | 15 (6.3%) | 0 (0.0%) |
| Total | 663 (62.1%) | 16 (2.4%) |
Employment Status by Educational Attainment in Silver Lake
According to labor force statistics for Silver Lake, 93.4% of individuals (521) out of the total population between 25 and 64 years of age (558) are in the labor force, with 0.8% or 4 of them being unemployed. The group with the highest labor force participation rate are those with the educational attainment of less than high school, with 100.0% or 3 individuals in the labor force. Within the labor force, individuals with college / associate degree education have the highest percentage of unemployment, with 2.4% or 4 of them being unemployed.
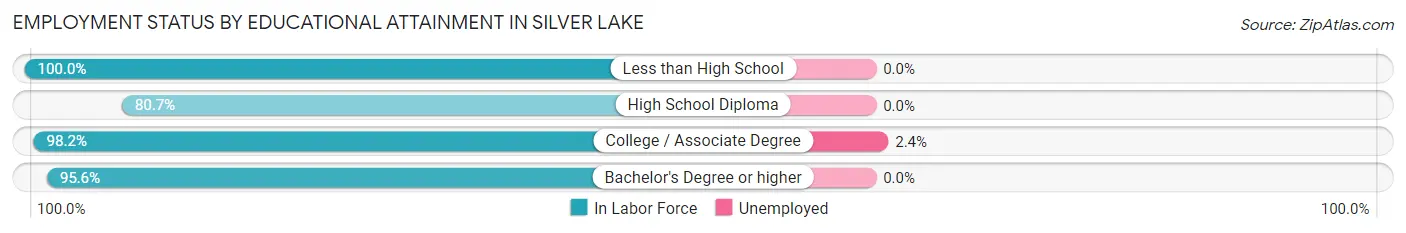
| Educational Attainment | In Labor Force | Unemployed |
| Less than High School | 3 (100.0%) | 0 (0.0%) |
| High School Diploma | 92 (80.7%) | 0 (0.0%) |
| College / Associate Degree | 166 (98.2%) | 4 (2.4%) |
| Bachelor's Degree or higher | 260 (95.6%) | 0 (0.0%) |
| Total | 521 (93.4%) | 4 (0.8%) |
Employment Occupations by Sex in Silver Lake
Management, Business, Science and Arts Occupations
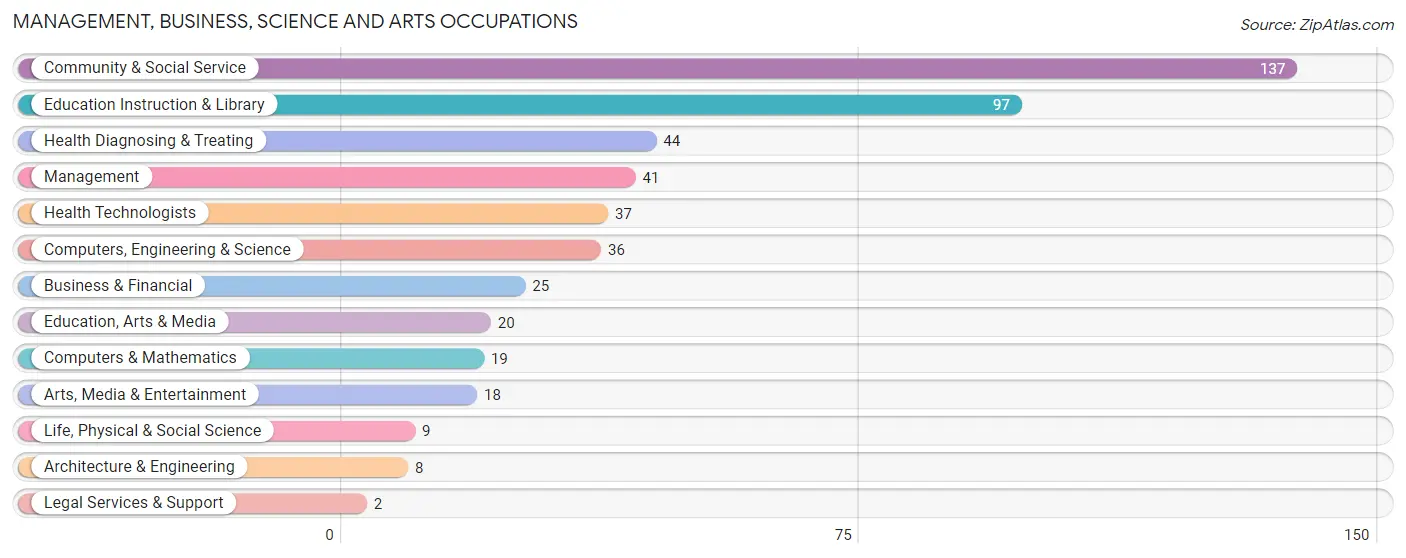
The most common Management, Business, Science and Arts occupations in Silver Lake are Community & Social Service (137 | 21.4%), Education Instruction & Library (97 | 15.1%), Health Diagnosing & Treating (44 | 6.9%), Management (41 | 6.4%), and Health Technologists (37 | 5.8%).
Management, Business, Science and Arts Occupations by Sex
Within the Management, Business, Science and Arts occupations in Silver Lake, the most male-oriented occupations are Life, Physical & Social Science (66.7%), Computers, Engineering & Science (63.9%), and Computers & Mathematics (63.2%), while the most female-oriented occupations are Education, Arts & Media (100.0%), Legal Services & Support (100.0%), and Health Technologists (100.0%).
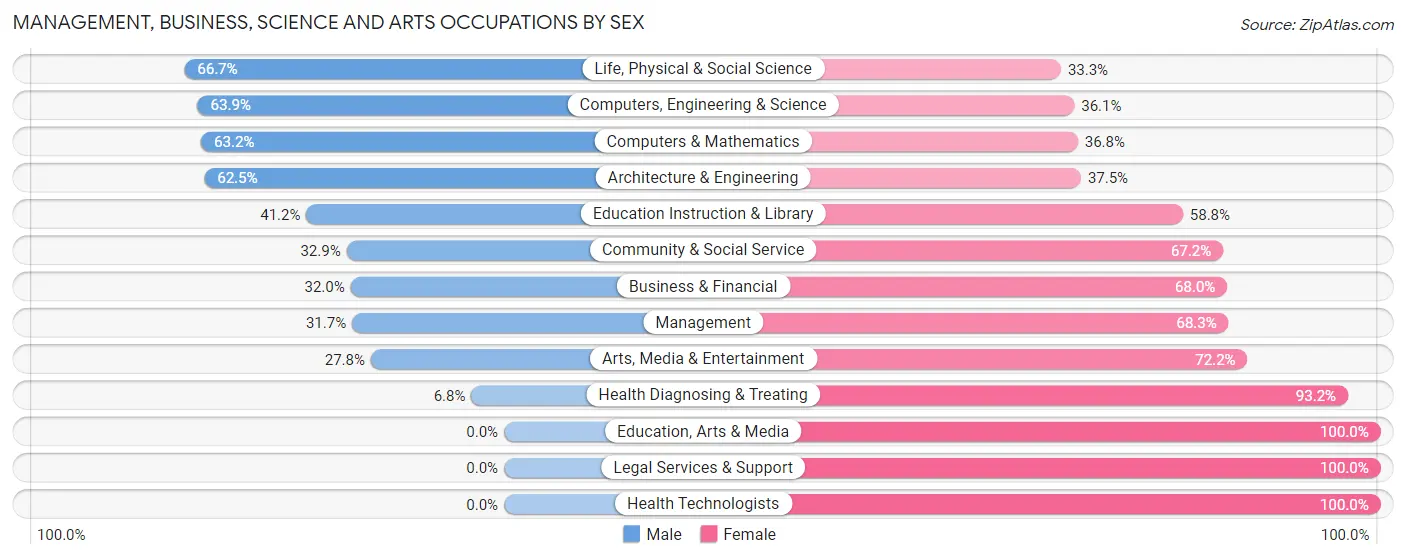
| Occupation | Male | Female |
| Management | 13 (31.7%) | 28 (68.3%) |
| Business & Financial | 8 (32.0%) | 17 (68.0%) |
| Computers, Engineering & Science | 23 (63.9%) | 13 (36.1%) |
| Computers & Mathematics | 12 (63.2%) | 7 (36.8%) |
| Architecture & Engineering | 5 (62.5%) | 3 (37.5%) |
| Life, Physical & Social Science | 6 (66.7%) | 3 (33.3%) |
| Community & Social Service | 45 (32.9%) | 92 (67.1%) |
| Education, Arts & Media | 0 (0.0%) | 20 (100.0%) |
| Legal Services & Support | 0 (0.0%) | 2 (100.0%) |
| Education Instruction & Library | 40 (41.2%) | 57 (58.8%) |
| Arts, Media & Entertainment | 5 (27.8%) | 13 (72.2%) |
| Health Diagnosing & Treating | 3 (6.8%) | 41 (93.2%) |
| Health Technologists | 0 (0.0%) | 37 (100.0%) |
| Total (Category) | 92 (32.5%) | 191 (67.5%) |
| Total (Overall) | 283 (44.2%) | 358 (55.8%) |
Services Occupations
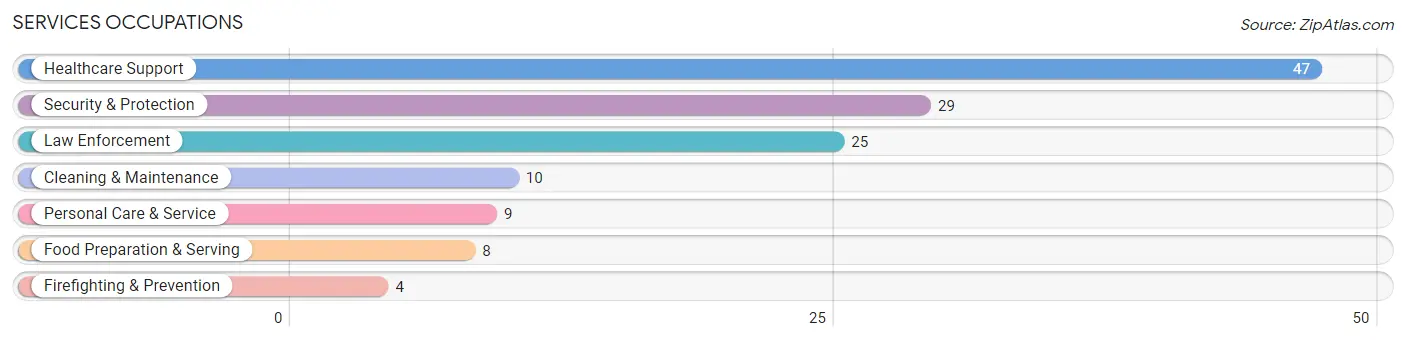
The most common Services occupations in Silver Lake are Healthcare Support (47 | 7.3%), Security & Protection (29 | 4.5%), Law Enforcement (25 | 3.9%), Cleaning & Maintenance (10 | 1.6%), and Personal Care & Service (9 | 1.4%).
Services Occupations by Sex
Within the Services occupations in Silver Lake, the most male-oriented occupations are Firefighting & Prevention (100.0%), Healthcare Support (85.1%), and Food Preparation & Serving (75.0%), while the most female-oriented occupations are Personal Care & Service (100.0%), Law Enforcement (92.0%), and Security & Protection (79.3%).
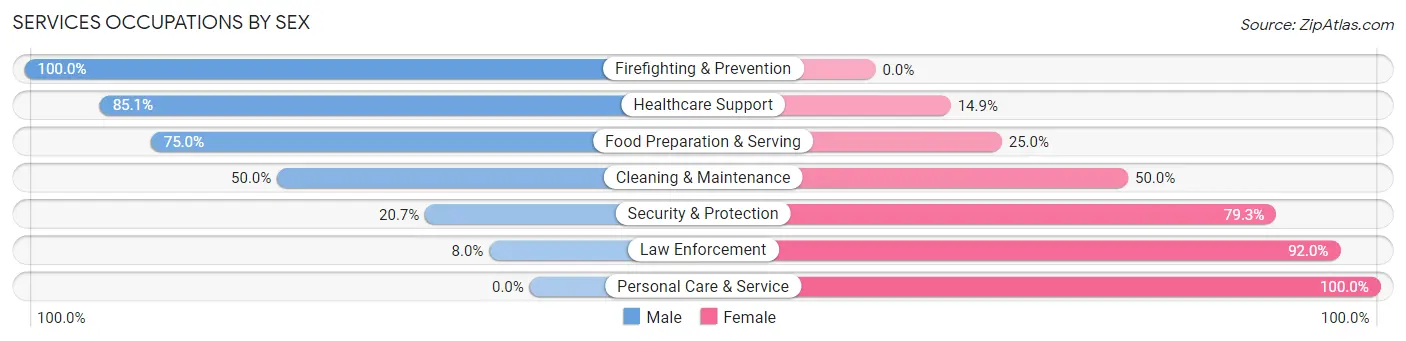
| Occupation | Male | Female |
| Healthcare Support | 40 (85.1%) | 7 (14.9%) |
| Security & Protection | 6 (20.7%) | 23 (79.3%) |
| Firefighting & Prevention | 4 (100.0%) | 0 (0.0%) |
| Law Enforcement | 2 (8.0%) | 23 (92.0%) |
| Food Preparation & Serving | 6 (75.0%) | 2 (25.0%) |
| Cleaning & Maintenance | 5 (50.0%) | 5 (50.0%) |
| Personal Care & Service | 0 (0.0%) | 9 (100.0%) |
| Total (Category) | 57 (55.3%) | 46 (44.7%) |
| Total (Overall) | 283 (44.2%) | 358 (55.8%) |
Sales and Office Occupations
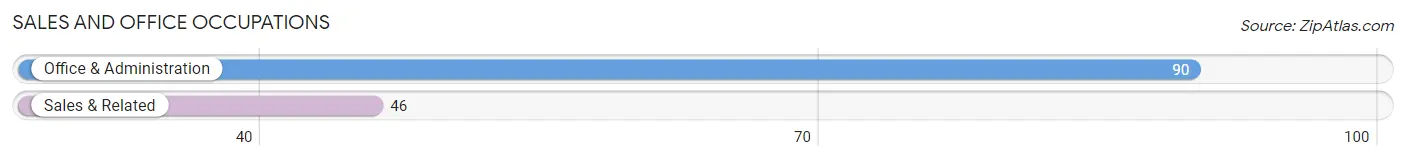
The most common Sales and Office occupations in Silver Lake are Office & Administration (90 | 14.0%), and Sales & Related (46 | 7.2%).
Sales and Office Occupations by Sex
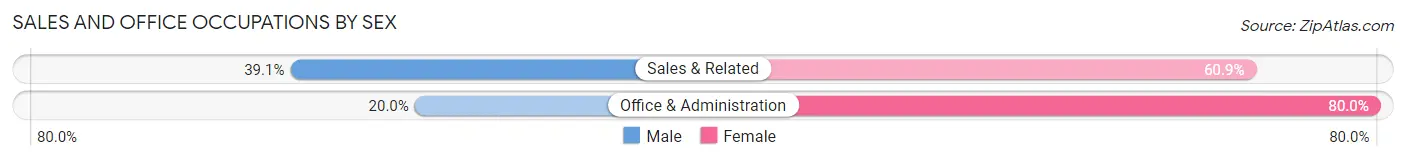
| Occupation | Male | Female |
| Sales & Related | 18 (39.1%) | 28 (60.9%) |
| Office & Administration | 18 (20.0%) | 72 (80.0%) |
| Total (Category) | 36 (26.5%) | 100 (73.5%) |
| Total (Overall) | 283 (44.2%) | 358 (55.8%) |
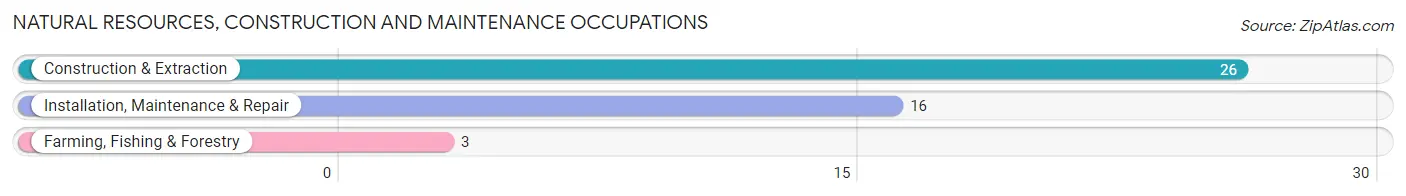
Natural Resources, Construction and Maintenance Occupations
The most common Natural Resources, Construction and Maintenance occupations in Silver Lake are Construction & Extraction (26 | 4.1%), Installation, Maintenance & Repair (16 | 2.5%), and Farming, Fishing & Forestry (3 | 0.5%).
Natural Resources, Construction and Maintenance Occupations by Sex
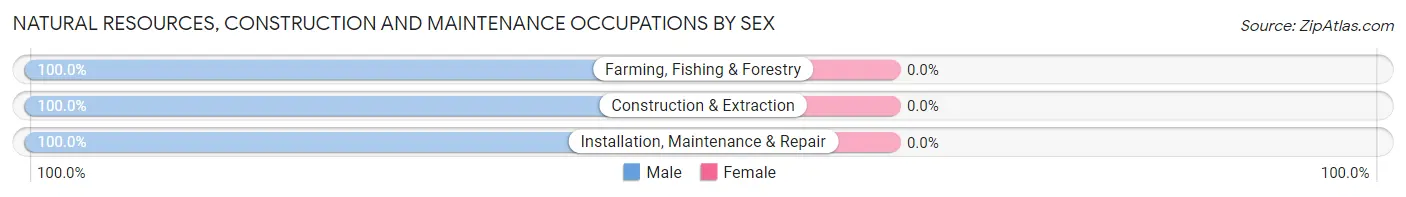
| Occupation | Male | Female |
| Farming, Fishing & Forestry | 3 (100.0%) | 0 (0.0%) |
| Construction & Extraction | 26 (100.0%) | 0 (0.0%) |
| Installation, Maintenance & Repair | 16 (100.0%) | 0 (0.0%) |
| Total (Category) | 45 (100.0%) | 0 (0.0%) |
| Total (Overall) | 283 (44.2%) | 358 (55.8%) |
Production, Transportation and Moving Occupations
The most common Production, Transportation and Moving occupations in Silver Lake are Production (34 | 5.3%), Material Moving (22 | 3.4%), and Transportation (18 | 2.8%).
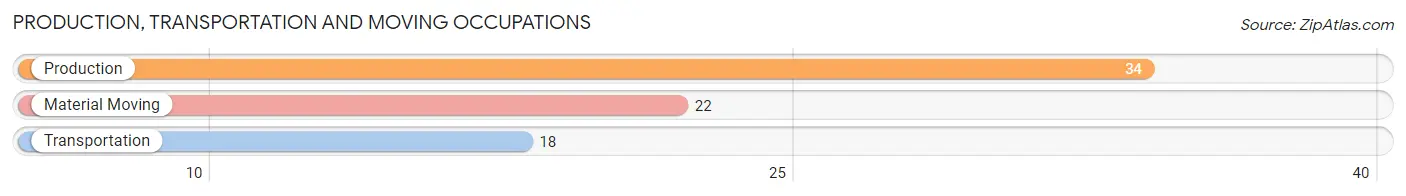
Production, Transportation and Moving Occupations by Sex
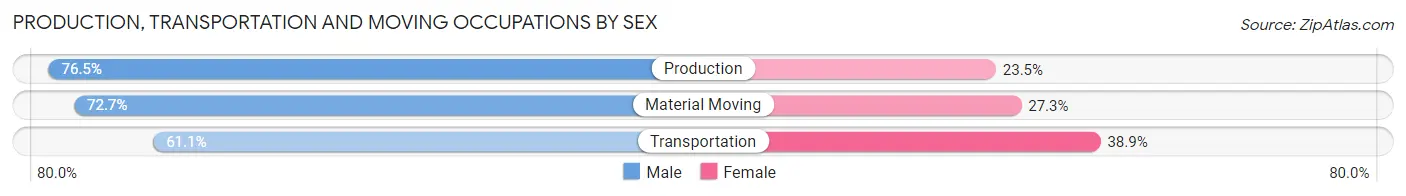
| Occupation | Male | Female |
| Production | 26 (76.5%) | 8 (23.5%) |
| Transportation | 11 (61.1%) | 7 (38.9%) |
| Material Moving | 16 (72.7%) | 6 (27.3%) |
| Total (Category) | 53 (71.6%) | 21 (28.4%) |
| Total (Overall) | 283 (44.2%) | 358 (55.8%) |
Employment Industries by Sex in Silver Lake
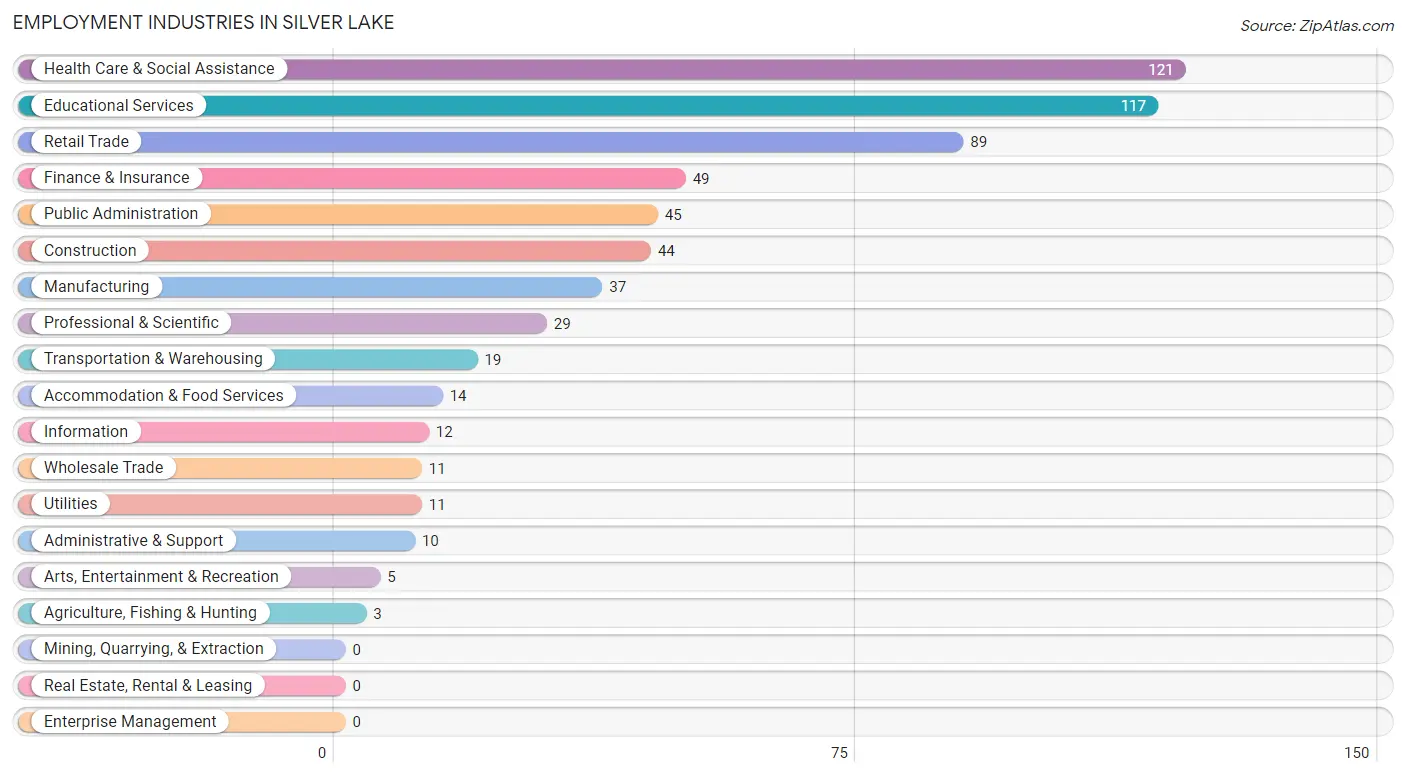
Employment Industries in Silver Lake
The major employment industries in Silver Lake include Health Care & Social Assistance (121 | 18.9%), Educational Services (117 | 18.2%), Retail Trade (89 | 13.9%), Finance & Insurance (49 | 7.6%), and Public Administration (45 | 7.0%).
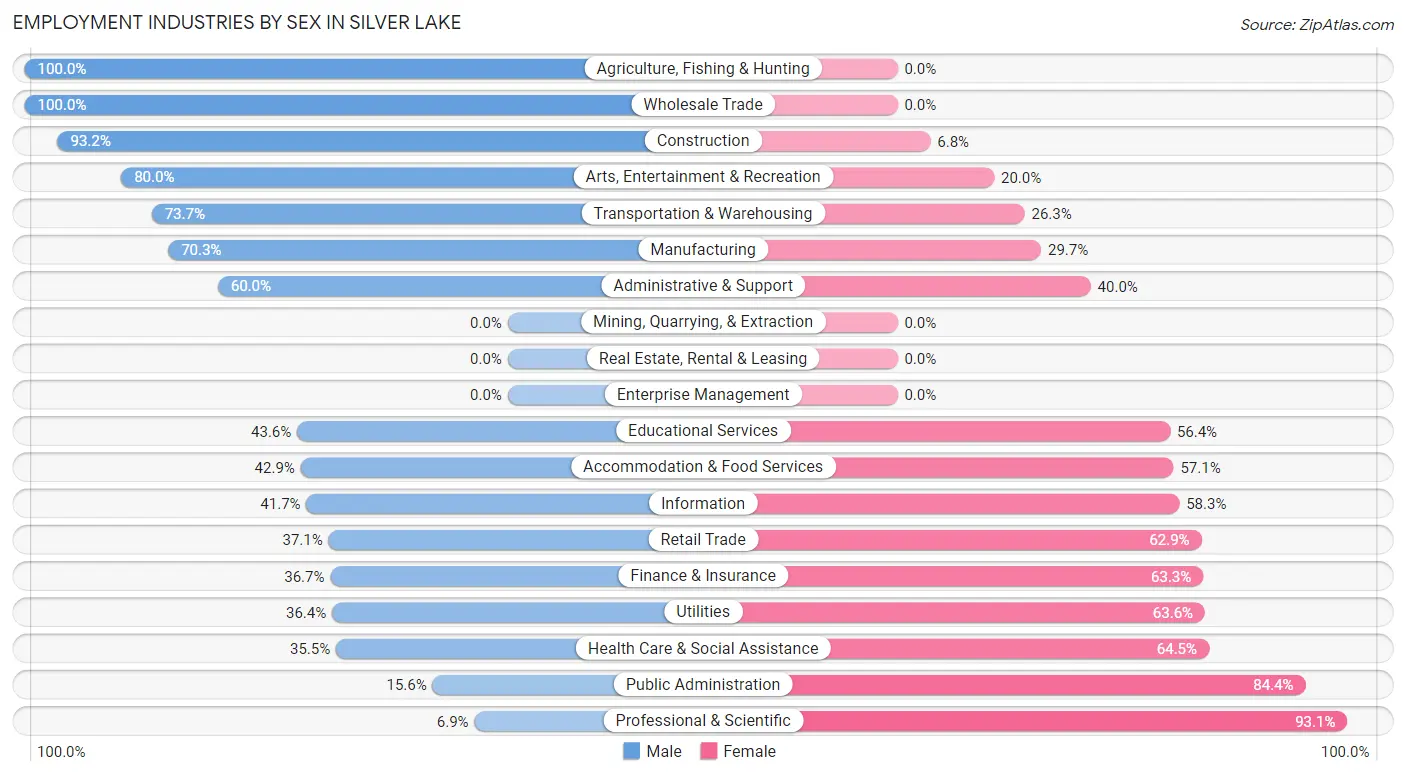
Employment Industries by Sex in Silver Lake
The Silver Lake industries that see more men than women are Agriculture, Fishing & Hunting (100.0%), Wholesale Trade (100.0%), and Construction (93.2%), whereas the industries that tend to have a higher number of women are Professional & Scientific (93.1%), Public Administration (84.4%), and Health Care & Social Assistance (64.5%).
| Industry | Male | Female |
| Agriculture, Fishing & Hunting | 3 (100.0%) | 0 (0.0%) |
| Mining, Quarrying, & Extraction | 0 (0.0%) | 0 (0.0%) |
| Construction | 41 (93.2%) | 3 (6.8%) |
| Manufacturing | 26 (70.3%) | 11 (29.7%) |
| Wholesale Trade | 11 (100.0%) | 0 (0.0%) |
| Retail Trade | 33 (37.1%) | 56 (62.9%) |
| Transportation & Warehousing | 14 (73.7%) | 5 (26.3%) |
| Utilities | 4 (36.4%) | 7 (63.6%) |
| Information | 5 (41.7%) | 7 (58.3%) |
| Finance & Insurance | 18 (36.7%) | 31 (63.3%) |
| Real Estate, Rental & Leasing | 0 (0.0%) | 0 (0.0%) |
| Professional & Scientific | 2 (6.9%) | 27 (93.1%) |
| Enterprise Management | 0 (0.0%) | 0 (0.0%) |
| Administrative & Support | 6 (60.0%) | 4 (40.0%) |
| Educational Services | 51 (43.6%) | 66 (56.4%) |
| Health Care & Social Assistance | 43 (35.5%) | 78 (64.5%) |
| Arts, Entertainment & Recreation | 4 (80.0%) | 1 (20.0%) |
| Accommodation & Food Services | 6 (42.9%) | 8 (57.1%) |
| Public Administration | 7 (15.6%) | 38 (84.4%) |
| Total | 283 (44.2%) | 358 (55.8%) |
Education in Silver Lake
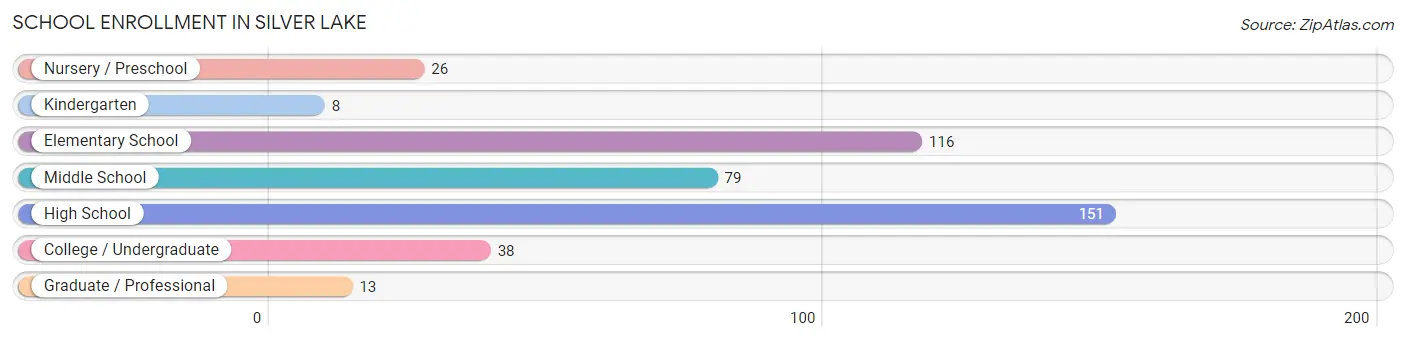
School Enrollment in Silver Lake
The most common levels of schooling among the 431 students in Silver Lake are high school (151 | 35.0%), elementary school (116 | 26.9%), and middle school (79 | 18.3%).
| School Level | # Students | % Students |
| Nursery / Preschool | 26 | 6.0% |
| Kindergarten | 8 | 1.9% |
| Elementary School | 116 | 26.9% |
| Middle School | 79 | 18.3% |
| High School | 151 | 35.0% |
| College / Undergraduate | 38 | 8.8% |
| Graduate / Professional | 13 | 3.0% |
| Total | 431 | 100.0% |
School Enrollment by Age by Funding Source in Silver Lake
Out of a total of 431 students who are enrolled in schools in Silver Lake, 5 (1.2%) attend a private institution, while the remaining 426 (98.8%) are enrolled in public schools. The age group of 20 to 24 year olds has the highest likelihood of being enrolled in private schools, with 2 (7.7% in the age bracket) enrolled. Conversely, the age group of 3 to 4 year olds has the lowest likelihood of being enrolled in a private school, with 10 (100.0% in the age bracket) attending a public institution.
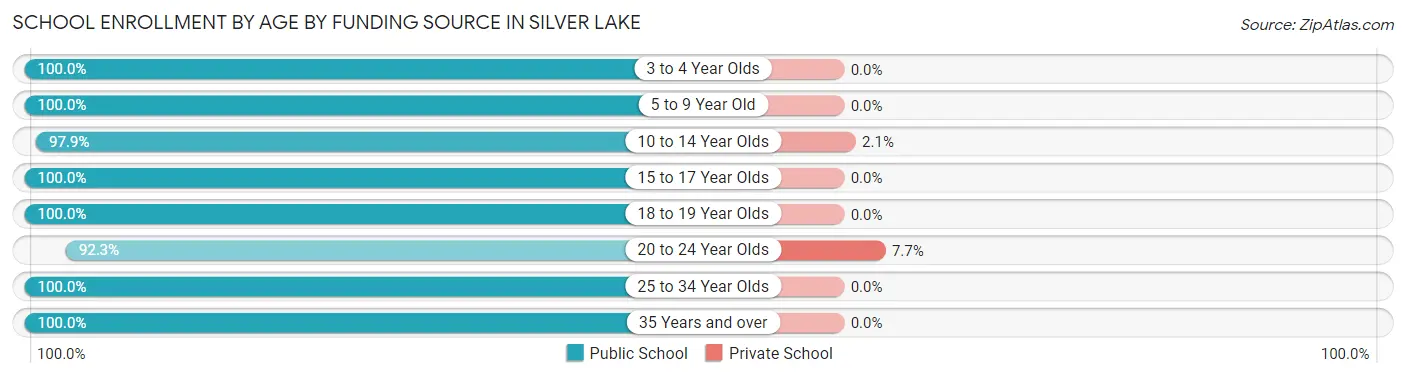
| Age Bracket | Public School | Private School |
| 3 to 4 Year Olds | 10 (100.0%) | 0 (0.0%) |
| 5 to 9 Year Old | 107 (100.0%) | 0 (0.0%) |
| 10 to 14 Year Olds | 137 (97.9%) | 3 (2.1%) |
| 15 to 17 Year Olds | 104 (100.0%) | 0 (0.0%) |
| 18 to 19 Year Olds | 20 (100.0%) | 0 (0.0%) |
| 20 to 24 Year Olds | 24 (92.3%) | 2 (7.7%) |
| 25 to 34 Year Olds | 16 (100.0%) | 0 (0.0%) |
| 35 Years and over | 8 (100.0%) | 0 (0.0%) |
| Total | 426 (98.8%) | 5 (1.2%) |
Educational Attainment by Field of Study in Silver Lake
Education (92 | 26.6%), business (78 | 22.5%), science & technology (51 | 14.7%), communications (32 | 9.2%), and arts & humanities (17 | 4.9%) are the most common fields of study among 346 individuals in Silver Lake who have obtained a bachelor's degree or higher.
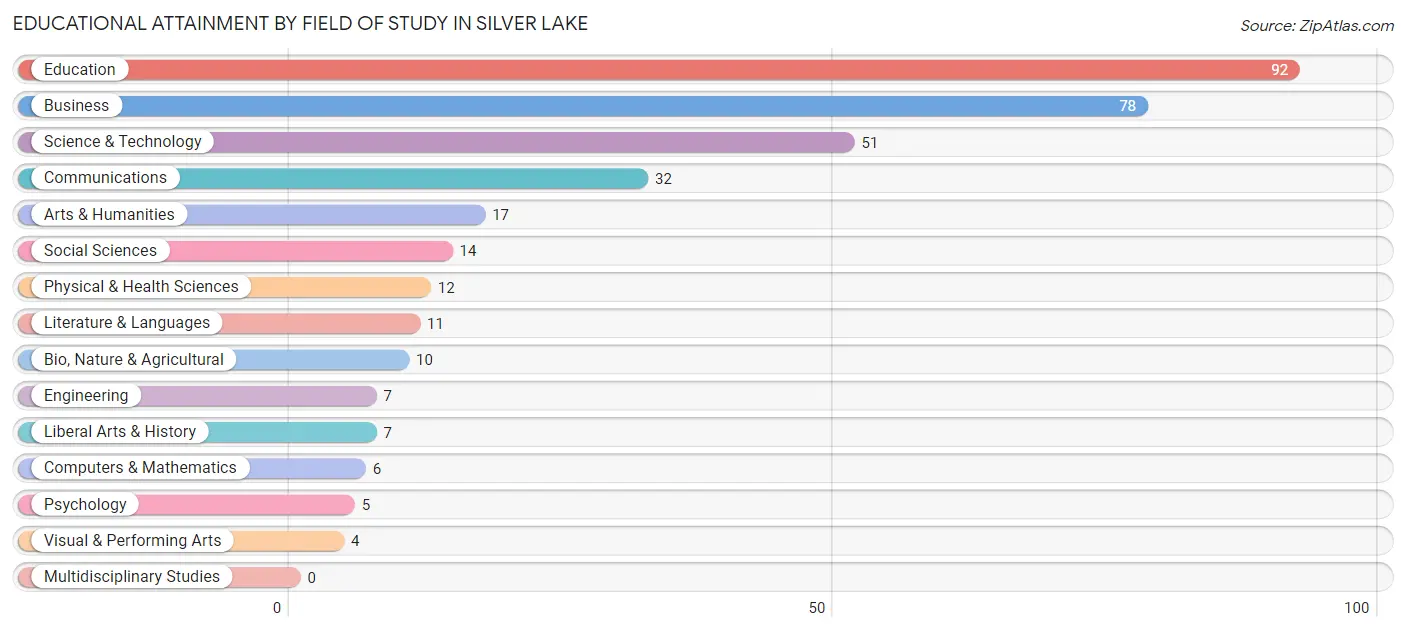
| Field of Study | # Graduates | % Graduates |
| Computers & Mathematics | 6 | 1.7% |
| Bio, Nature & Agricultural | 10 | 2.9% |
| Physical & Health Sciences | 12 | 3.5% |
| Psychology | 5 | 1.5% |
| Social Sciences | 14 | 4.1% |
| Engineering | 7 | 2.0% |
| Multidisciplinary Studies | 0 | 0.0% |
| Science & Technology | 51 | 14.7% |
| Business | 78 | 22.5% |
| Education | 92 | 26.6% |
| Literature & Languages | 11 | 3.2% |
| Liberal Arts & History | 7 | 2.0% |
| Visual & Performing Arts | 4 | 1.2% |
| Communications | 32 | 9.2% |
| Arts & Humanities | 17 | 4.9% |
| Total | 346 | 100.0% |
Transportation & Commute in Silver Lake
Vehicle Availability by Sex in Silver Lake
The most prevalent vehicle ownership categories in Silver Lake are males with 2 vehicles (115, accounting for 40.4%) and females with 2 vehicles (152, making up 32.3%).
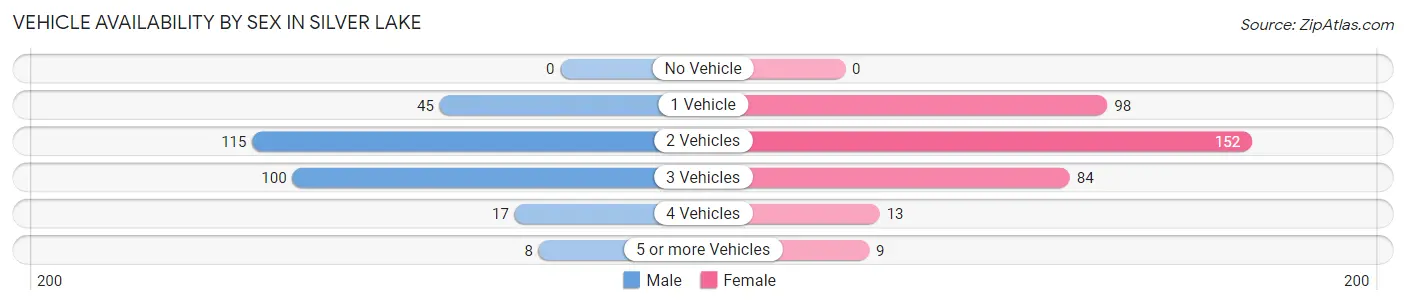
| Vehicles Available | Male | Female |
| No Vehicle | 0 (0.0%) | 0 (0.0%) |
| 1 Vehicle | 45 (15.8%) | 98 (27.5%) |
| 2 Vehicles | 115 (40.4%) | 152 (42.7%) |
| 3 Vehicles | 100 (35.1%) | 84 (23.6%) |
| 4 Vehicles | 17 (6.0%) | 13 (3.6%) |
| 5 or more Vehicles | 8 (2.8%) | 9 (2.5%) |
| Total | 285 (100.0%) | 356 (100.0%) |
Commute Time in Silver Lake
The most frequently occuring commute durations in Silver Lake are 20 to 24 minutes (175 commuters, 31.4%), 15 to 19 minutes (97 commuters, 17.4%), and 10 to 14 minutes (90 commuters, 16.1%).
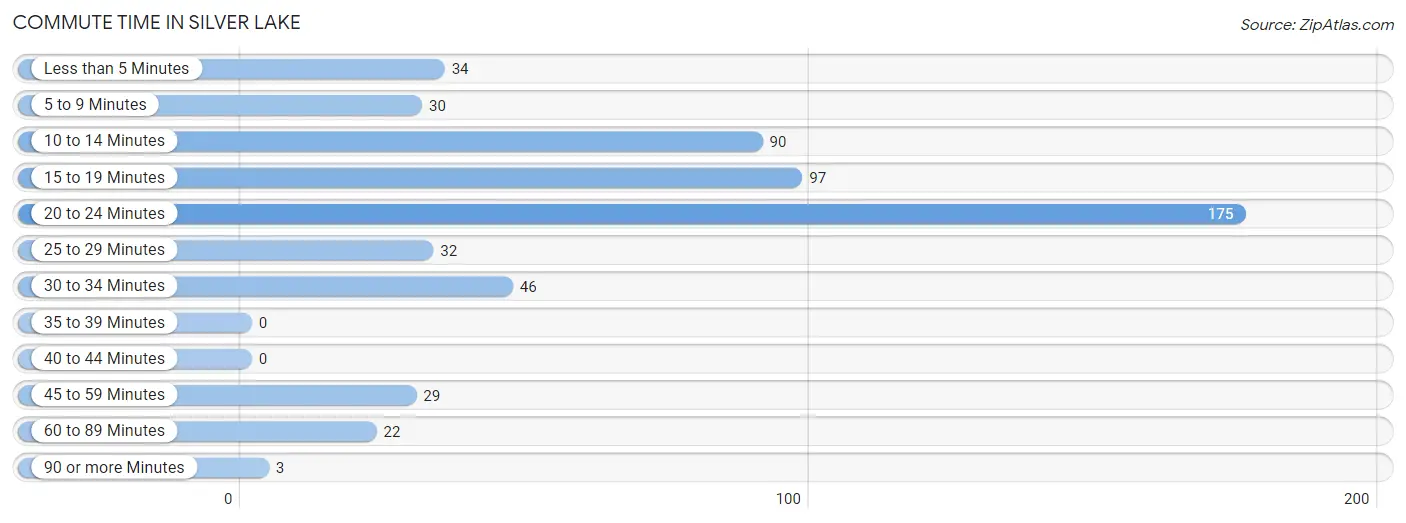
| Commute Time | # Commuters | % Commuters |
| Less than 5 Minutes | 34 | 6.1% |
| 5 to 9 Minutes | 30 | 5.4% |
| 10 to 14 Minutes | 90 | 16.1% |
| 15 to 19 Minutes | 97 | 17.4% |
| 20 to 24 Minutes | 175 | 31.4% |
| 25 to 29 Minutes | 32 | 5.7% |
| 30 to 34 Minutes | 46 | 8.2% |
| 35 to 39 Minutes | 0 | 0.0% |
| 40 to 44 Minutes | 0 | 0.0% |
| 45 to 59 Minutes | 29 | 5.2% |
| 60 to 89 Minutes | 22 | 3.9% |
| 90 or more Minutes | 3 | 0.5% |
Commute Time by Sex in Silver Lake
The most common commute times in Silver Lake are 20 to 24 minutes (61 commuters, 25.0%) for males and 20 to 24 minutes (114 commuters, 36.3%) for females.
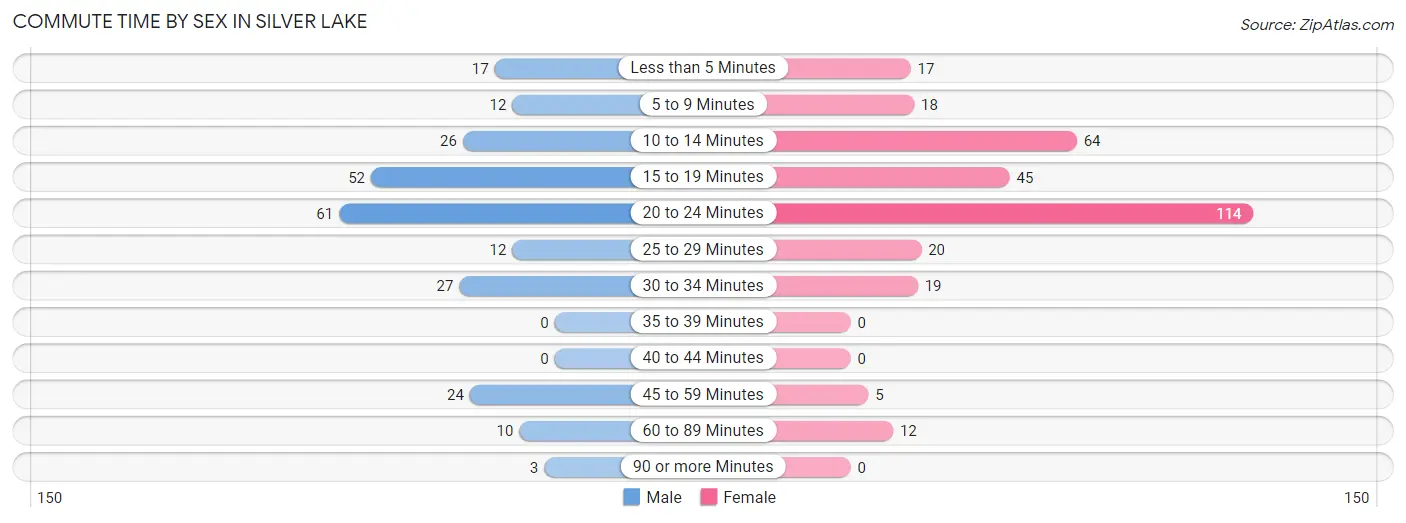
| Commute Time | Male | Female |
| Less than 5 Minutes | 17 (7.0%) | 17 (5.4%) |
| 5 to 9 Minutes | 12 (4.9%) | 18 (5.7%) |
| 10 to 14 Minutes | 26 (10.7%) | 64 (20.4%) |
| 15 to 19 Minutes | 52 (21.3%) | 45 (14.3%) |
| 20 to 24 Minutes | 61 (25.0%) | 114 (36.3%) |
| 25 to 29 Minutes | 12 (4.9%) | 20 (6.4%) |
| 30 to 34 Minutes | 27 (11.1%) | 19 (6.0%) |
| 35 to 39 Minutes | 0 (0.0%) | 0 (0.0%) |
| 40 to 44 Minutes | 0 (0.0%) | 0 (0.0%) |
| 45 to 59 Minutes | 24 (9.8%) | 5 (1.6%) |
| 60 to 89 Minutes | 10 (4.1%) | 12 (3.8%) |
| 90 or more Minutes | 3 (1.2%) | 0 (0.0%) |
Time of Departure to Work by Sex in Silver Lake
The most frequent times of departure to work in Silver Lake are 7:00 AM to 7:29 AM (50, 20.5%) for males and 8:00 AM to 8:29 AM (78, 24.8%) for females.
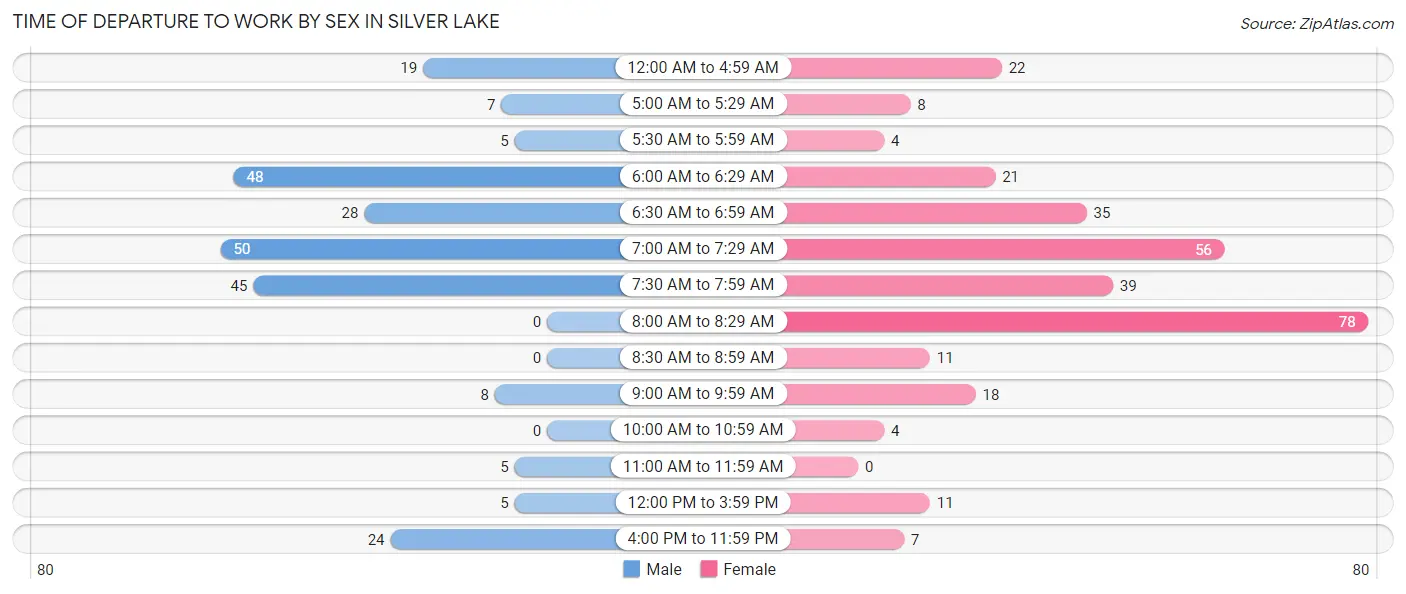
| Time of Departure | Male | Female |
| 12:00 AM to 4:59 AM | 19 (7.8%) | 22 (7.0%) |
| 5:00 AM to 5:29 AM | 7 (2.9%) | 8 (2.5%) |
| 5:30 AM to 5:59 AM | 5 (2.1%) | 4 (1.3%) |
| 6:00 AM to 6:29 AM | 48 (19.7%) | 21 (6.7%) |
| 6:30 AM to 6:59 AM | 28 (11.5%) | 35 (11.2%) |
| 7:00 AM to 7:29 AM | 50 (20.5%) | 56 (17.8%) |
| 7:30 AM to 7:59 AM | 45 (18.4%) | 39 (12.4%) |
| 8:00 AM to 8:29 AM | 0 (0.0%) | 78 (24.8%) |
| 8:30 AM to 8:59 AM | 0 (0.0%) | 11 (3.5%) |
| 9:00 AM to 9:59 AM | 8 (3.3%) | 18 (5.7%) |
| 10:00 AM to 10:59 AM | 0 (0.0%) | 4 (1.3%) |
| 11:00 AM to 11:59 AM | 5 (2.1%) | 0 (0.0%) |
| 12:00 PM to 3:59 PM | 5 (2.1%) | 11 (3.5%) |
| 4:00 PM to 11:59 PM | 24 (9.8%) | 7 (2.2%) |
| Total | 244 (100.0%) | 314 (100.0%) |
Housing Occupancy in Silver Lake
Occupancy by Ownership in Silver Lake
Of the total 642 dwellings in Silver Lake, owner-occupied units account for 466 (72.6%), while renter-occupied units make up 176 (27.4%).
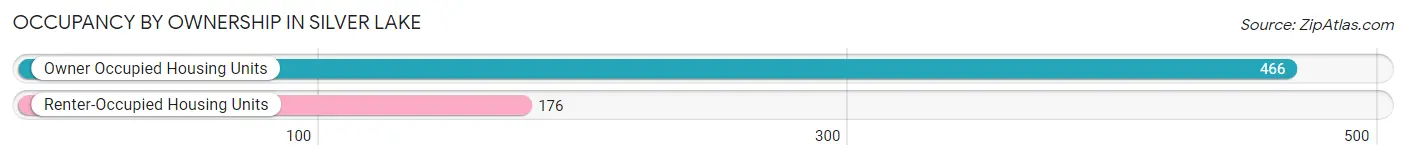
| Occupancy | # Housing Units | % Housing Units |
| Owner Occupied Housing Units | 466 | 72.6% |
| Renter-Occupied Housing Units | 176 | 27.4% |
| Total Occupied Housing Units | 642 | 100.0% |
Occupancy by Household Size in Silver Lake
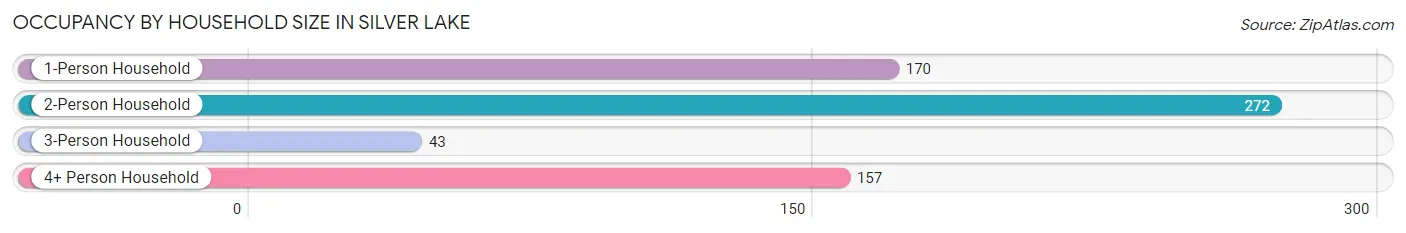
| Household Size | # Housing Units | % Housing Units |
| 1-Person Household | 170 | 26.5% |
| 2-Person Household | 272 | 42.4% |
| 3-Person Household | 43 | 6.7% |
| 4+ Person Household | 157 | 24.4% |
| Total Housing Units | 642 | 100.0% |
Occupancy by Ownership by Household Size in Silver Lake
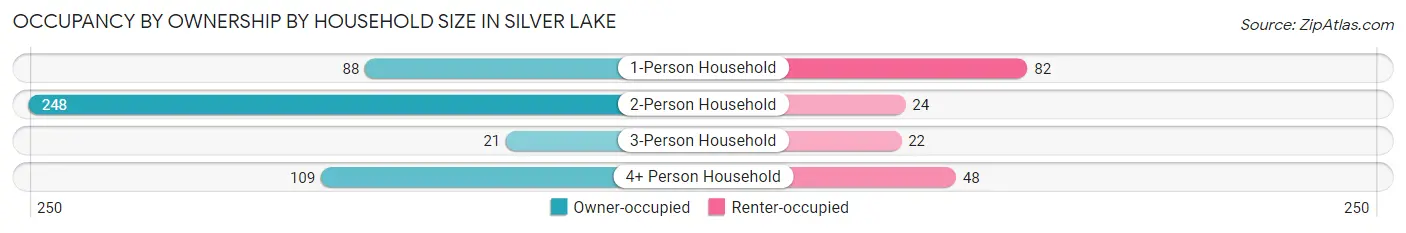
| Household Size | Owner-occupied | Renter-occupied |
| 1-Person Household | 88 (51.8%) | 82 (48.2%) |
| 2-Person Household | 248 (91.2%) | 24 (8.8%) |
| 3-Person Household | 21 (48.8%) | 22 (51.2%) |
| 4+ Person Household | 109 (69.4%) | 48 (30.6%) |
| Total Housing Units | 466 (72.6%) | 176 (27.4%) |
Occupancy by Educational Attainment in Silver Lake
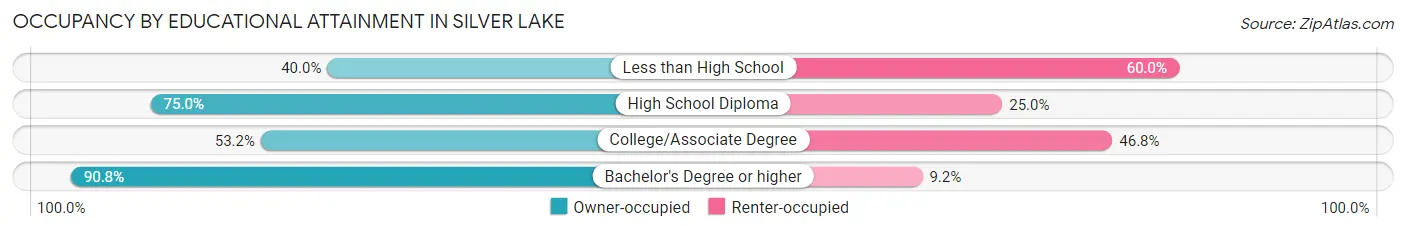
| Household Size | Owner-occupied | Renter-occupied |
| Less than High School | 2 (40.0%) | 3 (60.0%) |
| High School Diploma | 177 (75.0%) | 59 (25.0%) |
| College/Associate Degree | 109 (53.2%) | 96 (46.8%) |
| Bachelor's Degree or higher | 178 (90.8%) | 18 (9.2%) |
Occupancy by Age of Householder in Silver Lake
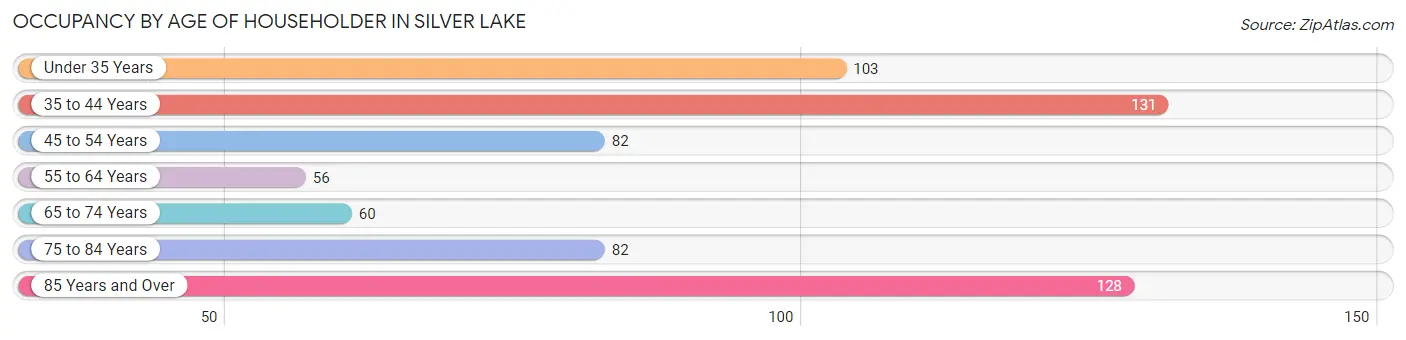
| Age Bracket | # Households | % Households |
| Under 35 Years | 103 | 16.0% |
| 35 to 44 Years | 131 | 20.4% |
| 45 to 54 Years | 82 | 12.8% |
| 55 to 64 Years | 56 | 8.7% |
| 65 to 74 Years | 60 | 9.3% |
| 75 to 84 Years | 82 | 12.8% |
| 85 Years and Over | 128 | 19.9% |
| Total | 642 | 100.0% |
Housing Finances in Silver Lake
Median Income by Occupancy in Silver Lake
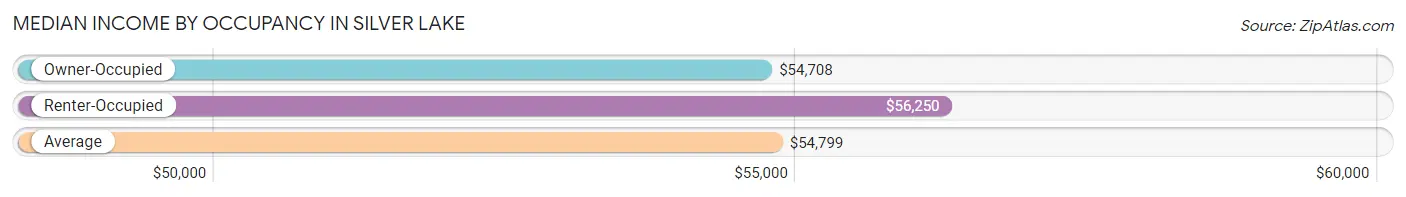
| Occupancy Type | # Households | Median Income |
| Owner-Occupied | 466 (72.6%) | $54,708 |
| Renter-Occupied | 176 (27.4%) | $56,250 |
| Average | 642 (100.0%) | $54,799 |
Occupancy by Householder Income Bracket in Silver Lake
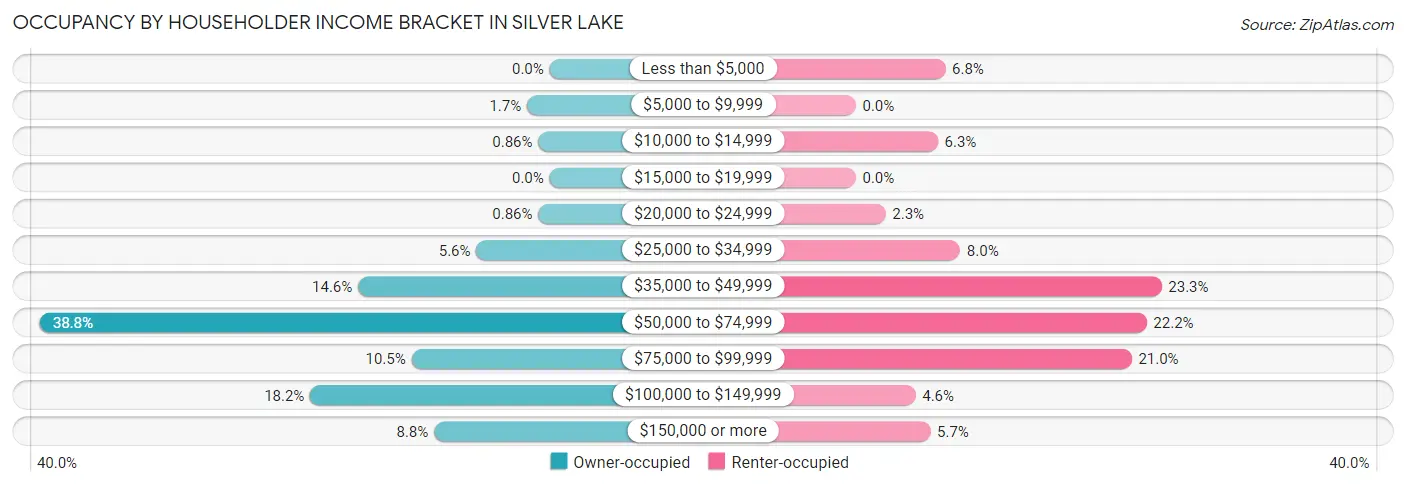
| Income Bracket | Owner-occupied | Renter-occupied |
| Less than $5,000 | 0 (0.0%) | 12 (6.8%) |
| $5,000 to $9,999 | 8 (1.7%) | 0 (0.0%) |
| $10,000 to $14,999 | 4 (0.9%) | 11 (6.2%) |
| $15,000 to $19,999 | 0 (0.0%) | 0 (0.0%) |
| $20,000 to $24,999 | 4 (0.9%) | 4 (2.3%) |
| $25,000 to $34,999 | 26 (5.6%) | 14 (8.0%) |
| $35,000 to $49,999 | 68 (14.6%) | 41 (23.3%) |
| $50,000 to $74,999 | 181 (38.8%) | 39 (22.2%) |
| $75,000 to $99,999 | 49 (10.5%) | 37 (21.0%) |
| $100,000 to $149,999 | 85 (18.2%) | 8 (4.5%) |
| $150,000 or more | 41 (8.8%) | 10 (5.7%) |
| Total | 466 (100.0%) | 176 (100.0%) |
Monthly Housing Cost Tiers in Silver Lake
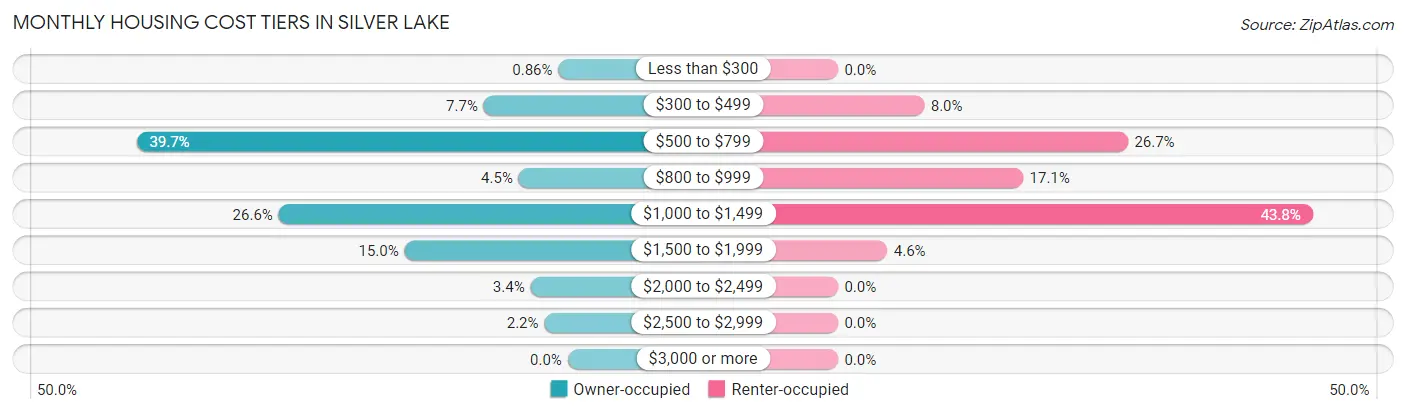
| Monthly Cost | Owner-occupied | Renter-occupied |
| Less than $300 | 4 (0.9%) | 0 (0.0%) |
| $300 to $499 | 36 (7.7%) | 14 (8.0%) |
| $500 to $799 | 185 (39.7%) | 47 (26.7%) |
| $800 to $999 | 21 (4.5%) | 30 (17.1%) |
| $1,000 to $1,499 | 124 (26.6%) | 77 (43.8%) |
| $1,500 to $1,999 | 70 (15.0%) | 8 (4.5%) |
| $2,000 to $2,499 | 16 (3.4%) | 0 (0.0%) |
| $2,500 to $2,999 | 10 (2.1%) | 0 (0.0%) |
| $3,000 or more | 0 (0.0%) | 0 (0.0%) |
| Total | 466 (100.0%) | 176 (100.0%) |
Physical Housing Characteristics in Silver Lake
Housing Structures in Silver Lake
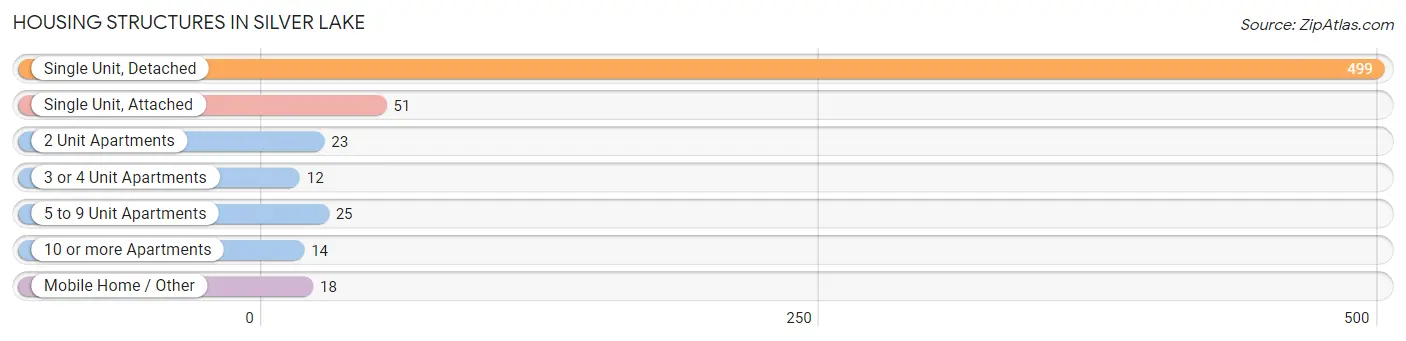
| Structure Type | # Housing Units | % Housing Units |
| Single Unit, Detached | 499 | 77.7% |
| Single Unit, Attached | 51 | 7.9% |
| 2 Unit Apartments | 23 | 3.6% |
| 3 or 4 Unit Apartments | 12 | 1.9% |
| 5 to 9 Unit Apartments | 25 | 3.9% |
| 10 or more Apartments | 14 | 2.2% |
| Mobile Home / Other | 18 | 2.8% |
| Total | 642 | 100.0% |
Housing Structures by Occupancy in Silver Lake
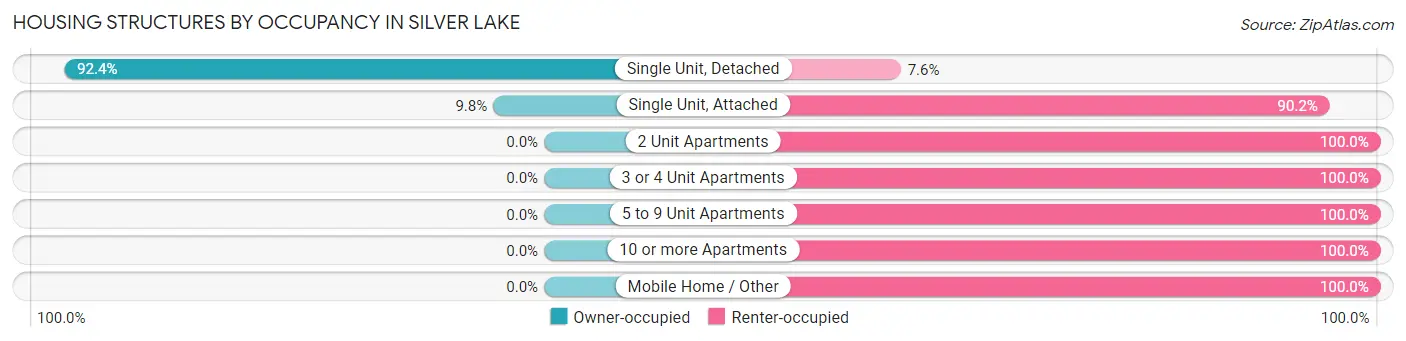
| Structure Type | Owner-occupied | Renter-occupied |
| Single Unit, Detached | 461 (92.4%) | 38 (7.6%) |
| Single Unit, Attached | 5 (9.8%) | 46 (90.2%) |
| 2 Unit Apartments | 0 (0.0%) | 23 (100.0%) |
| 3 or 4 Unit Apartments | 0 (0.0%) | 12 (100.0%) |
| 5 to 9 Unit Apartments | 0 (0.0%) | 25 (100.0%) |
| 10 or more Apartments | 0 (0.0%) | 14 (100.0%) |
| Mobile Home / Other | 0 (0.0%) | 18 (100.0%) |
| Total | 466 (72.6%) | 176 (27.4%) |
Housing Structures by Number of Rooms in Silver Lake
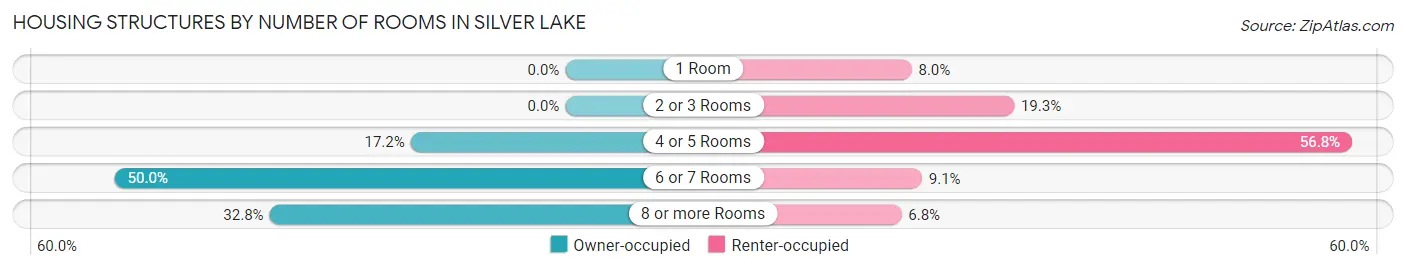
| Number of Rooms | Owner-occupied | Renter-occupied |
| 1 Room | 0 (0.0%) | 14 (8.0%) |
| 2 or 3 Rooms | 0 (0.0%) | 34 (19.3%) |
| 4 or 5 Rooms | 80 (17.2%) | 100 (56.8%) |
| 6 or 7 Rooms | 233 (50.0%) | 16 (9.1%) |
| 8 or more Rooms | 153 (32.8%) | 12 (6.8%) |
| Total | 466 (100.0%) | 176 (100.0%) |
Housing Structure by Heating Type in Silver Lake
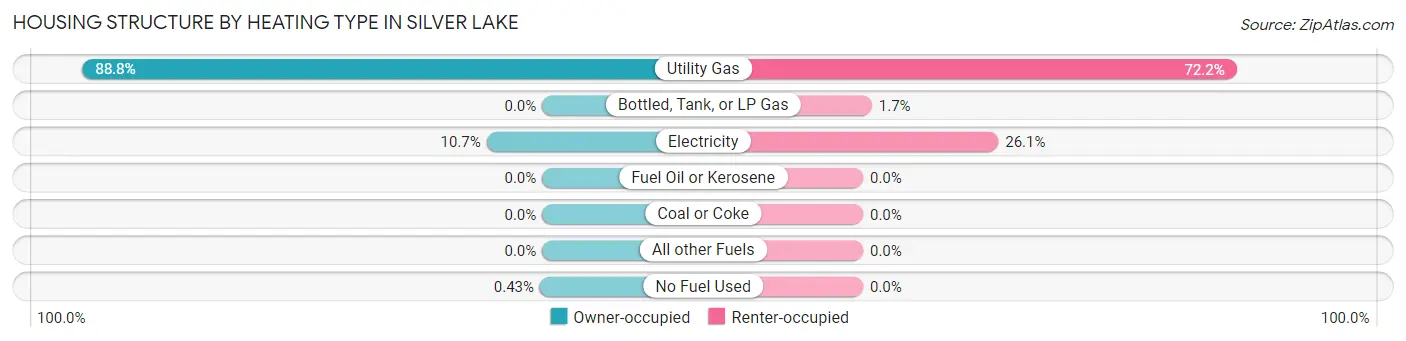
| Heating Type | Owner-occupied | Renter-occupied |
| Utility Gas | 414 (88.8%) | 127 (72.2%) |
| Bottled, Tank, or LP Gas | 0 (0.0%) | 3 (1.7%) |
| Electricity | 50 (10.7%) | 46 (26.1%) |
| Fuel Oil or Kerosene | 0 (0.0%) | 0 (0.0%) |
| Coal or Coke | 0 (0.0%) | 0 (0.0%) |
| All other Fuels | 0 (0.0%) | 0 (0.0%) |
| No Fuel Used | 2 (0.4%) | 0 (0.0%) |
| Total | 466 (100.0%) | 176 (100.0%) |
Household Vehicle Usage in Silver Lake
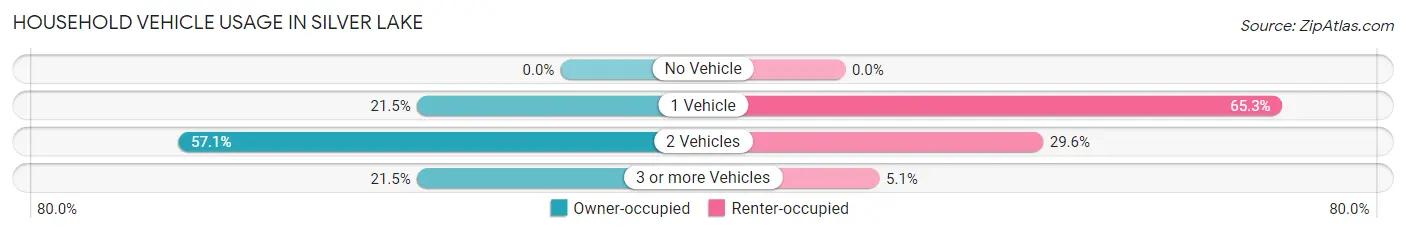
| Vehicles per Household | Owner-occupied | Renter-occupied |
| No Vehicle | 0 (0.0%) | 0 (0.0%) |
| 1 Vehicle | 100 (21.5%) | 115 (65.3%) |
| 2 Vehicles | 266 (57.1%) | 52 (29.5%) |
| 3 or more Vehicles | 100 (21.5%) | 9 (5.1%) |
| Total | 466 (100.0%) | 176 (100.0%) |
Real Estate & Mortgages in Silver Lake
Real Estate and Mortgage Overview in Silver Lake
| Characteristic | Without Mortgage | With Mortgage |
| Housing Units | 226 | 240 |
| Median Property Value | $117,900 | $172,300 |
| Median Household Income | $53,960 | $34 |
| Monthly Housing Costs | $632 | $0 |
| Real Estate Taxes | $2,515 | $5 |
Property Value by Mortgage Status in Silver Lake
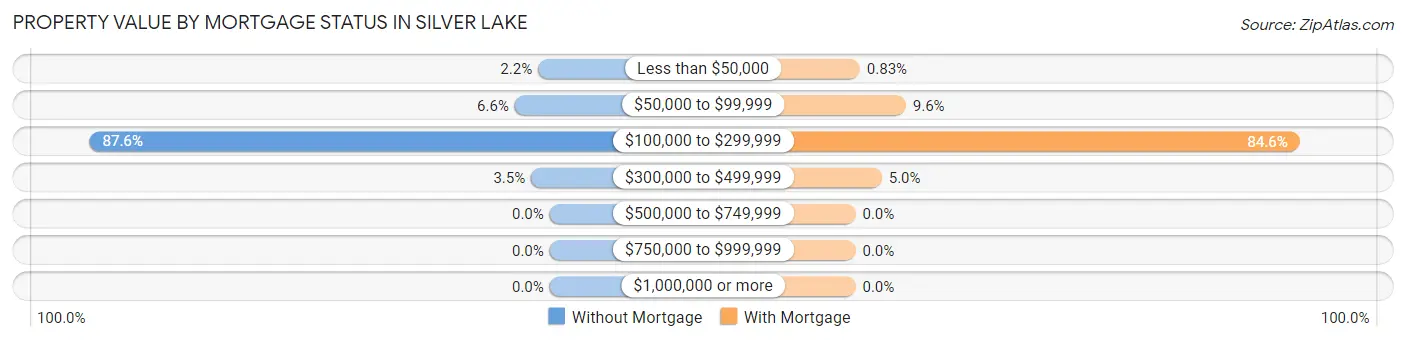
| Property Value | Without Mortgage | With Mortgage |
| Less than $50,000 | 5 (2.2%) | 2 (0.8%) |
| $50,000 to $99,999 | 15 (6.6%) | 23 (9.6%) |
| $100,000 to $299,999 | 198 (87.6%) | 203 (84.6%) |
| $300,000 to $499,999 | 8 (3.5%) | 12 (5.0%) |
| $500,000 to $749,999 | 0 (0.0%) | 0 (0.0%) |
| $750,000 to $999,999 | 0 (0.0%) | 0 (0.0%) |
| $1,000,000 or more | 0 (0.0%) | 0 (0.0%) |
| Total | 226 (100.0%) | 240 (100.0%) |
Household Income by Mortgage Status in Silver Lake
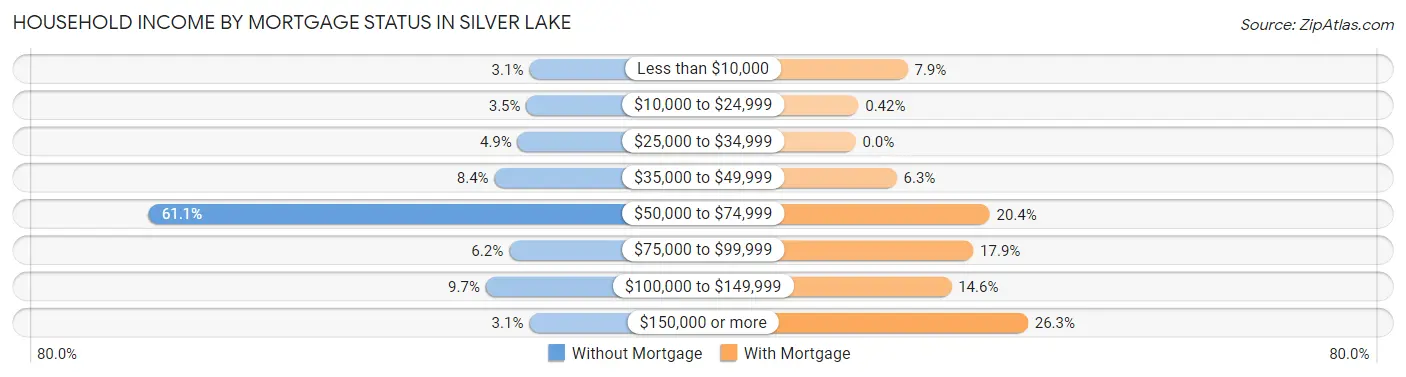
| Household Income | Without Mortgage | With Mortgage |
| Less than $10,000 | 7 (3.1%) | 19 (7.9%) |
| $10,000 to $24,999 | 8 (3.5%) | 1 (0.4%) |
| $25,000 to $34,999 | 11 (4.9%) | 0 (0.0%) |
| $35,000 to $49,999 | 19 (8.4%) | 15 (6.2%) |
| $50,000 to $74,999 | 138 (61.1%) | 49 (20.4%) |
| $75,000 to $99,999 | 14 (6.2%) | 43 (17.9%) |
| $100,000 to $149,999 | 22 (9.7%) | 35 (14.6%) |
| $150,000 or more | 7 (3.1%) | 63 (26.3%) |
| Total | 226 (100.0%) | 240 (100.0%) |
Property Value to Household Income Ratio in Silver Lake
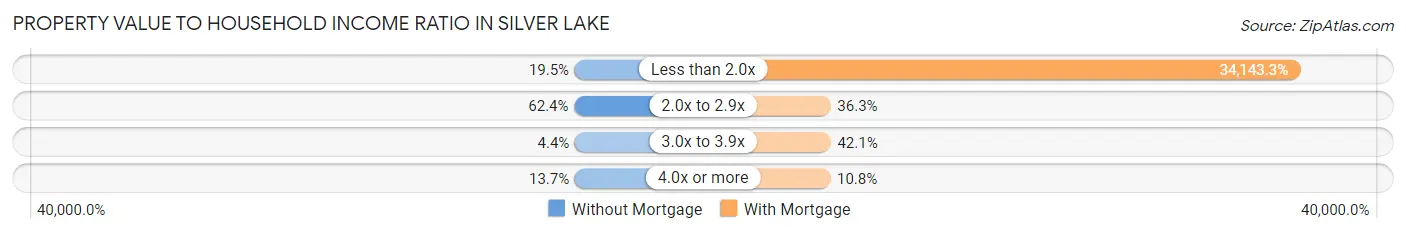
| Value-to-Income Ratio | Without Mortgage | With Mortgage |
| Less than 2.0x | 44 (19.5%) | 81,944 (34,143.3%) |
| 2.0x to 2.9x | 141 (62.4%) | 87 (36.2%) |
| 3.0x to 3.9x | 10 (4.4%) | 101 (42.1%) |
| 4.0x or more | 31 (13.7%) | 26 (10.8%) |
| Total | 226 (100.0%) | 240 (100.0%) |
Real Estate Taxes by Mortgage Status in Silver Lake
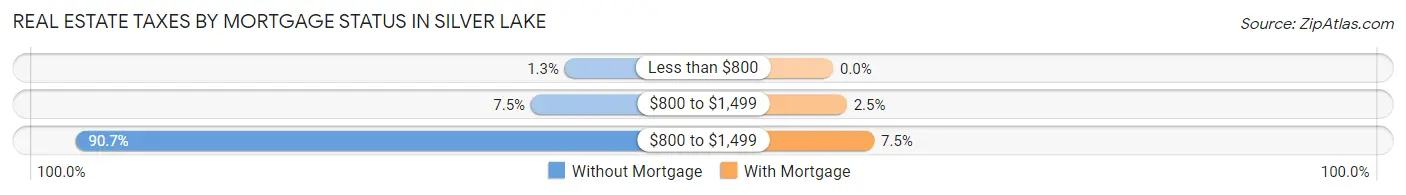
| Property Taxes | Without Mortgage | With Mortgage |
| Less than $800 | 3 (1.3%) | 0 (0.0%) |
| $800 to $1,499 | 17 (7.5%) | 6 (2.5%) |
| $800 to $1,499 | 205 (90.7%) | 18 (7.5%) |
| Total | 226 (100.0%) | 240 (100.0%) |
Health & Disability in Silver Lake
Health Insurance Coverage by Age in Silver Lake
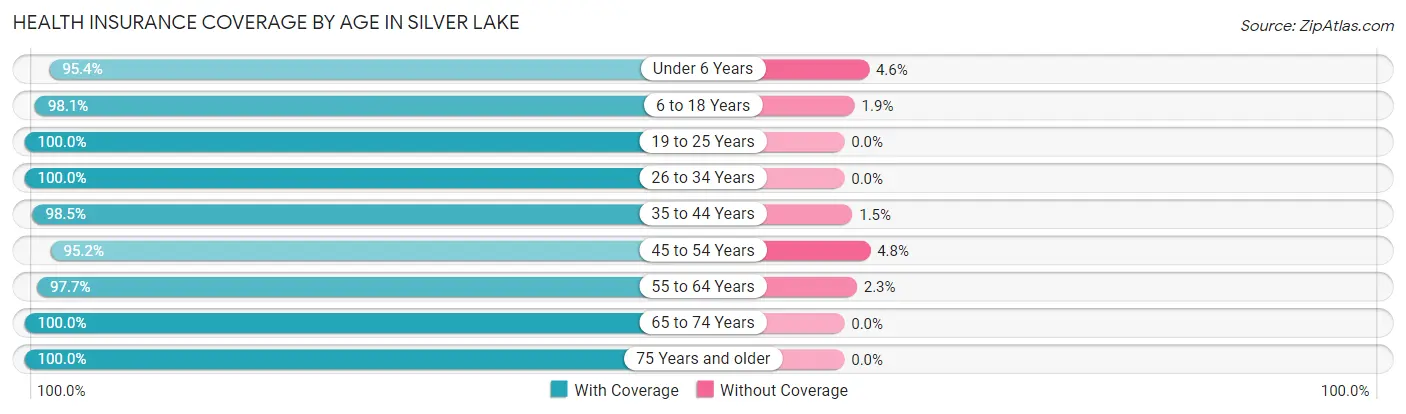
| Age Bracket | With Coverage | Without Coverage |
| Under 6 Years | 83 (95.4%) | 4 (4.6%) |
| 6 to 18 Years | 355 (98.1%) | 7 (1.9%) |
| 19 to 25 Years | 98 (100.0%) | 0 (0.0%) |
| 26 to 34 Years | 113 (100.0%) | 0 (0.0%) |
| 35 to 44 Years | 198 (98.5%) | 3 (1.5%) |
| 45 to 54 Years | 138 (95.2%) | 7 (4.8%) |
| 55 to 64 Years | 84 (97.7%) | 2 (2.3%) |
| 65 to 74 Years | 108 (100.0%) | 0 (0.0%) |
| 75 Years and older | 240 (100.0%) | 0 (0.0%) |
| Total | 1,417 (98.4%) | 23 (1.6%) |
Health Insurance Coverage by Citizenship Status in Silver Lake
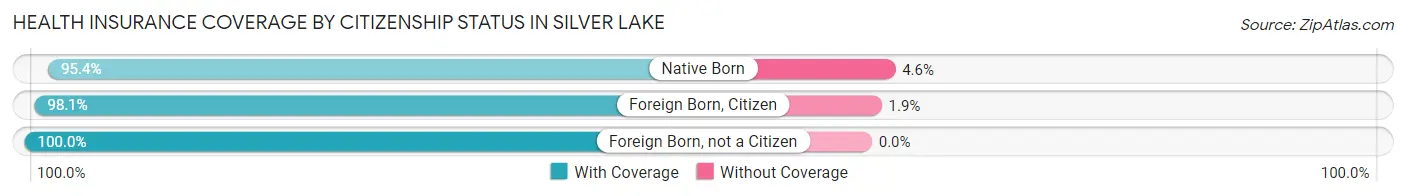
| Citizenship Status | With Coverage | Without Coverage |
| Native Born | 83 (95.4%) | 4 (4.6%) |
| Foreign Born, Citizen | 355 (98.1%) | 7 (1.9%) |
| Foreign Born, not a Citizen | 98 (100.0%) | 0 (0.0%) |
Health Insurance Coverage by Household Income in Silver Lake
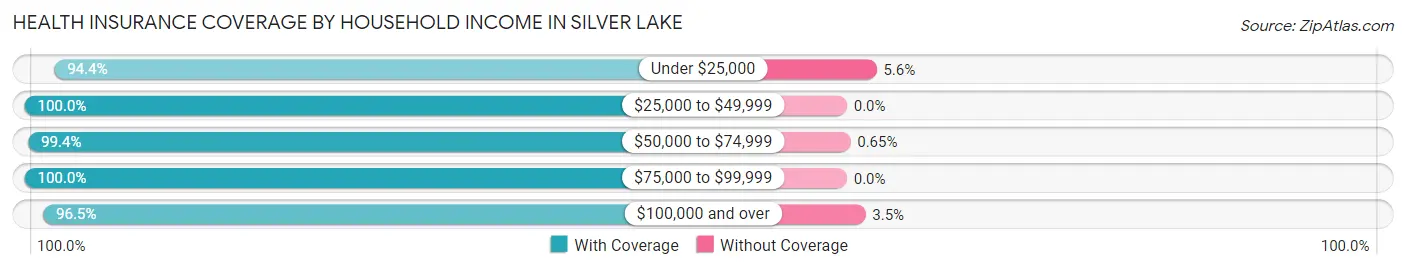
| Household Income | With Coverage | Without Coverage |
| Under $25,000 | 51 (94.4%) | 3 (5.6%) |
| $25,000 to $49,999 | 308 (100.0%) | 0 (0.0%) |
| $50,000 to $74,999 | 307 (99.4%) | 2 (0.6%) |
| $75,000 to $99,999 | 251 (100.0%) | 0 (0.0%) |
| $100,000 and over | 500 (96.5%) | 18 (3.5%) |
Public vs Private Health Insurance Coverage by Age in Silver Lake
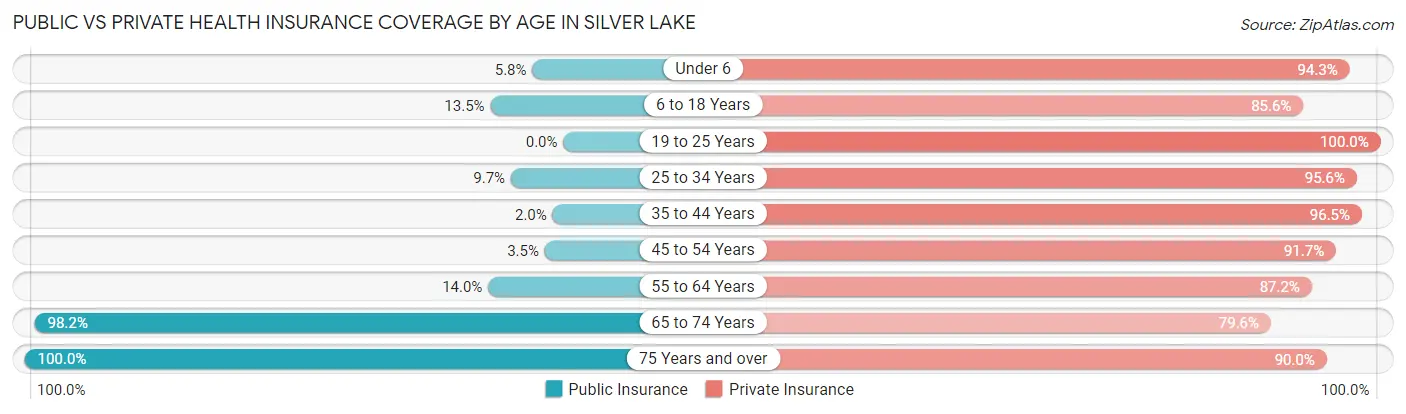
| Age Bracket | Public Insurance | Private Insurance |
| Under 6 | 5 (5.8%) | 82 (94.3%) |
| 6 to 18 Years | 49 (13.5%) | 310 (85.6%) |
| 19 to 25 Years | 0 (0.0%) | 98 (100.0%) |
| 25 to 34 Years | 11 (9.7%) | 108 (95.6%) |
| 35 to 44 Years | 4 (2.0%) | 194 (96.5%) |
| 45 to 54 Years | 5 (3.5%) | 133 (91.7%) |
| 55 to 64 Years | 12 (14.0%) | 75 (87.2%) |
| 65 to 74 Years | 106 (98.2%) | 86 (79.6%) |
| 75 Years and over | 240 (100.0%) | 216 (90.0%) |
| Total | 432 (30.0%) | 1,302 (90.4%) |
Disability Status by Sex by Age in Silver Lake
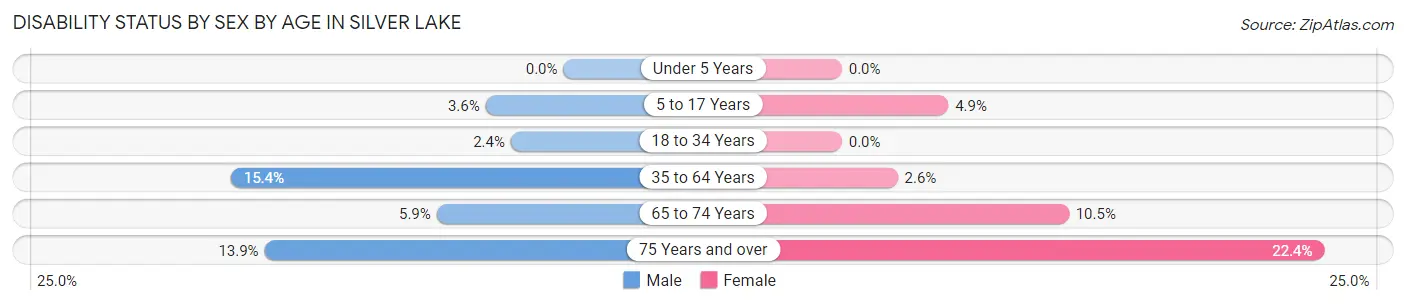
| Age Bracket | Male | Female |
| Under 5 Years | 0 (0.0%) | 0 (0.0%) |
| 5 to 17 Years | 7 (3.6%) | 8 (4.9%) |
| 18 to 34 Years | 4 (2.4%) | 0 (0.0%) |
| 35 to 64 Years | 25 (15.4%) | 7 (2.6%) |
| 65 to 74 Years | 3 (5.9%) | 6 (10.5%) |
| 75 Years and over | 24 (13.9%) | 15 (22.4%) |
Disability Class by Sex by Age in Silver Lake
Disability Class: Hearing Difficulty
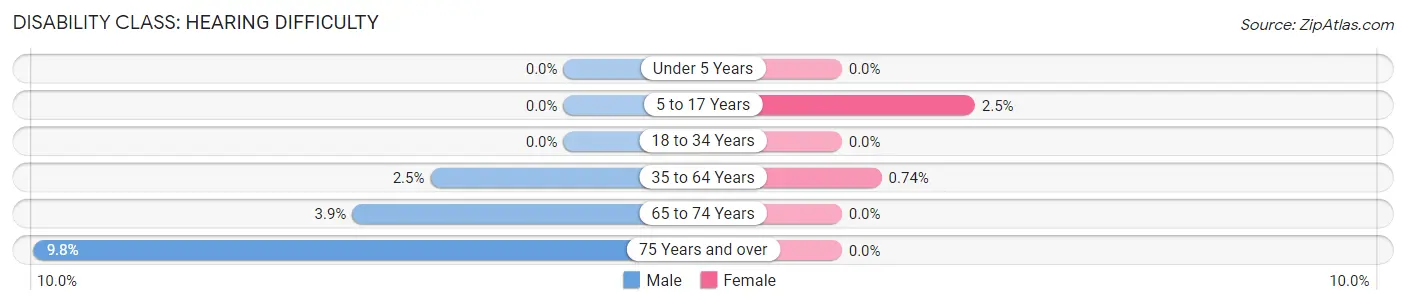
| Age Bracket | Male | Female |
| Under 5 Years | 0 (0.0%) | 0 (0.0%) |
| 5 to 17 Years | 0 (0.0%) | 4 (2.5%) |
| 18 to 34 Years | 0 (0.0%) | 0 (0.0%) |
| 35 to 64 Years | 4 (2.5%) | 2 (0.7%) |
| 65 to 74 Years | 2 (3.9%) | 0 (0.0%) |
| 75 Years and over | 17 (9.8%) | 0 (0.0%) |
Disability Class: Vision Difficulty
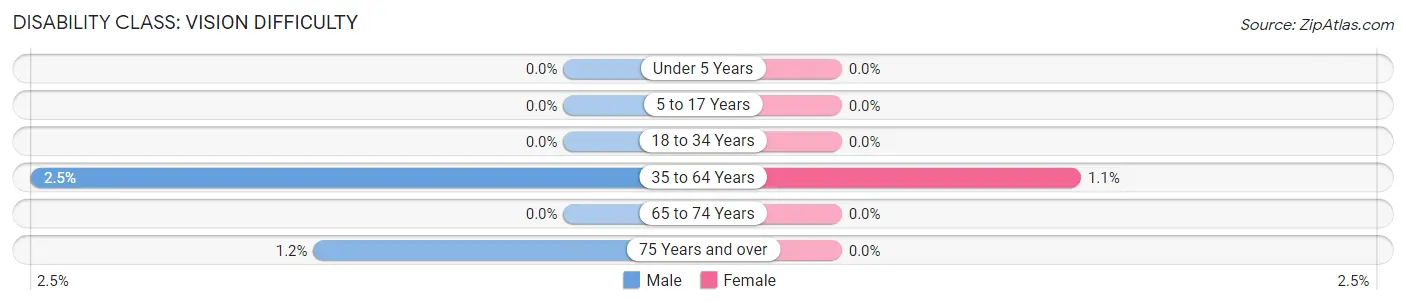
| Age Bracket | Male | Female |
| Under 5 Years | 0 (0.0%) | 0 (0.0%) |
| 5 to 17 Years | 0 (0.0%) | 0 (0.0%) |
| 18 to 34 Years | 0 (0.0%) | 0 (0.0%) |
| 35 to 64 Years | 4 (2.5%) | 3 (1.1%) |
| 65 to 74 Years | 0 (0.0%) | 0 (0.0%) |
| 75 Years and over | 2 (1.2%) | 0 (0.0%) |
Disability Class: Cognitive Difficulty
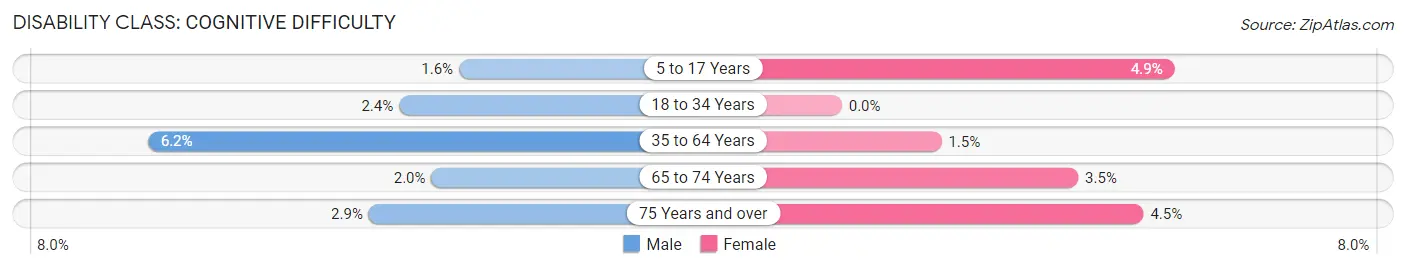
| Age Bracket | Male | Female |
| 5 to 17 Years | 3 (1.5%) | 8 (4.9%) |
| 18 to 34 Years | 4 (2.4%) | 0 (0.0%) |
| 35 to 64 Years | 10 (6.2%) | 4 (1.5%) |
| 65 to 74 Years | 1 (2.0%) | 2 (3.5%) |
| 75 Years and over | 5 (2.9%) | 3 (4.5%) |
Disability Class: Ambulatory Difficulty
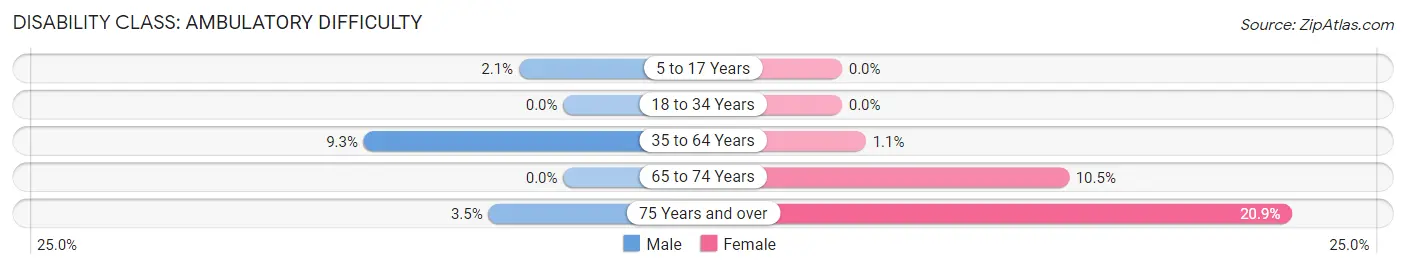
| Age Bracket | Male | Female |
| 5 to 17 Years | 4 (2.1%) | 0 (0.0%) |
| 18 to 34 Years | 0 (0.0%) | 0 (0.0%) |
| 35 to 64 Years | 15 (9.3%) | 3 (1.1%) |
| 65 to 74 Years | 0 (0.0%) | 6 (10.5%) |
| 75 Years and over | 6 (3.5%) | 14 (20.9%) |
Disability Class: Self-Care Difficulty
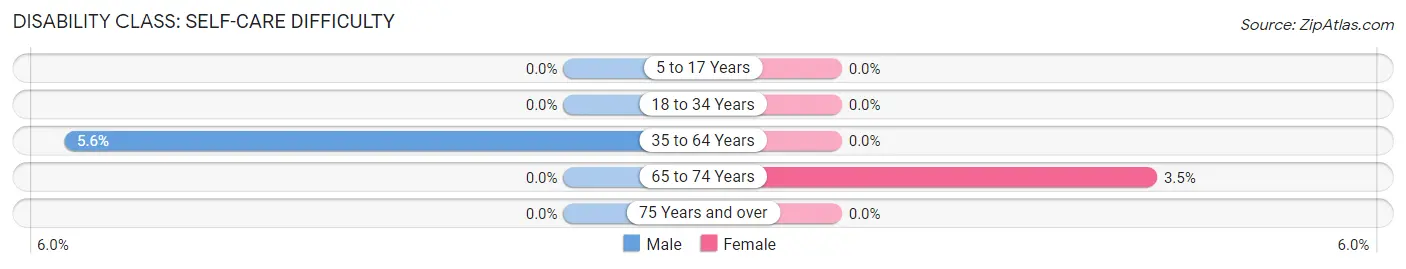
| Age Bracket | Male | Female |
| 5 to 17 Years | 0 (0.0%) | 0 (0.0%) |
| 18 to 34 Years | 0 (0.0%) | 0 (0.0%) |
| 35 to 64 Years | 9 (5.6%) | 0 (0.0%) |
| 65 to 74 Years | 0 (0.0%) | 2 (3.5%) |
| 75 Years and over | 0 (0.0%) | 0 (0.0%) |
Technology Access in Silver Lake
Computing Device Access in Silver Lake
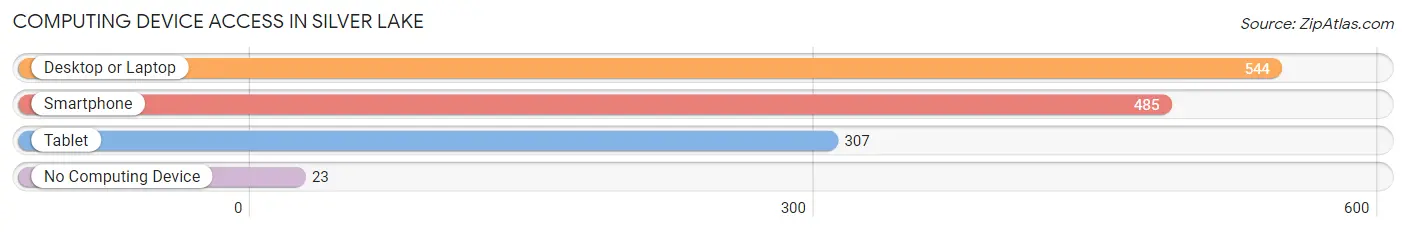
| Device Type | # Households | % Households |
| Desktop or Laptop | 544 | 84.7% |
| Smartphone | 485 | 75.5% |
| Tablet | 307 | 47.8% |
| No Computing Device | 23 | 3.6% |
| Total | 642 | 100.0% |
Internet Access in Silver Lake
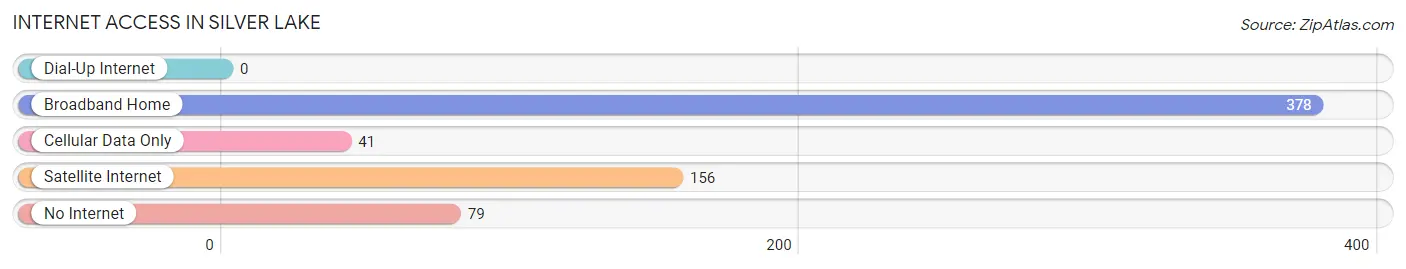
| Internet Type | # Households | % Households |
| Dial-Up Internet | 0 | 0.0% |
| Broadband Home | 378 | 58.9% |
| Cellular Data Only | 41 | 6.4% |
| Satellite Internet | 156 | 24.3% |
| No Internet | 79 | 12.3% |
| Total | 642 | 100.0% |
Silver Lake Summary
Introduction
Silver Lake is a small city located in Shawnee County, Kansas. It is situated on the banks of Silver Lake, a natural lake that was formed by a glacier. The city has a population of 1,845 people, according to the 2010 census. Silver Lake is a rural community with a strong agricultural base. It is also home to a variety of businesses, including a winery, a golf course, and a variety of restaurants.
History
Silver Lake was founded in 1854 by a group of settlers from Ohio. The settlers named the town after the nearby lake, which was named for its silver-colored water. The town was originally a farming community, and the settlers grew wheat, corn, and other crops.
In 1867, the town was incorporated as a city. The city was home to a variety of businesses, including a flour mill, a sawmill, and a blacksmith shop. The town also had a school, a post office, and a newspaper.
In the late 19th century, the town began to grow and prosper. The railroad arrived in 1887, and the town became a shipping center for the surrounding area. The town also became a popular tourist destination, and the lake was a popular spot for fishing and swimming.
In the early 20th century, the town continued to grow and prosper. The population increased from 1,000 in 1900 to 1,500 in 1910. The town was home to a variety of businesses, including a bank, a hotel, and a variety of stores.
In the 1950s, the town began to decline. The railroad stopped running in the 1950s, and the town lost its shipping center status. The population decreased from 1,500 in 1950 to 1,200 in 1960.
In the late 20th century, the town began to experience a resurgence. The population increased from 1,200 in 1960 to 1,845 in 2010. The town is now home to a variety of businesses, including a winery, a golf course, and a variety of restaurants.
Geography
Silver Lake is located in Shawnee County, Kansas. It is situated on the banks of Silver Lake, a natural lake that was formed by a glacier. The lake is approximately 1,000 acres in size and is a popular spot for fishing and swimming.
The city is located in the Flint Hills region of Kansas. The area is characterized by rolling hills and grasslands. The climate is semi-arid, with hot summers and cold winters.
Economy
Silver Lake is a rural community with a strong agricultural base. The town is home to a variety of farms, including cattle, hog, and poultry farms. The town is also home to a variety of businesses, including a winery, a golf course, and a variety of restaurants.
The town is also home to a variety of manufacturing businesses, including a furniture factory and a metal fabrication plant. The town is also home to a variety of retail businesses, including a grocery store, a hardware store, and a variety of specialty shops.
Demographics
According to the 2010 census, Silver Lake has a population of 1,845 people. The population is predominantly white (94.3%), with small percentages of African American (2.2%), Hispanic (1.7%), and Asian (0.8%) residents.
The median household income in Silver Lake is $45,000, and the median home value is $90,000. The town has a poverty rate of 11.3%, and the unemployment rate is 4.2%.
Conclusion
Silver Lake is a small city located in Shawnee County, Kansas. It is situated on the banks of Silver Lake, a natural lake that was formed by a glacier. The city has a population of 1,845 people, according to the 2010 census. Silver Lake is a rural community with a strong agricultural base. It is also home to a variety of businesses, including a winery, a golf course, and a variety of restaurants. The town is predominantly white, with small percentages of African American, Hispanic, and Asian residents. The median household income in Silver Lake is $45,000, and the median home value is $90,000. The town has a poverty rate of 11.3%, and the unemployment rate is 4.2%. Silver Lake is a vibrant community with a rich history and a bright future.
Common Questions
What is Per Capita Income in Silver Lake?
Per Capita income in Silver Lake is $33,218.
What is the Median Family Income in Silver Lake?
Median Family Income in Silver Lake is $67,031.
What is the Median Household income in Silver Lake?
Median Household Income in Silver Lake is $54,799.
What is Income or Wage Gap in Silver Lake?
Income or Wage Gap in Silver Lake is 13.2%.
Women in Silver Lake earn 86.8 cents for every dollar earned by a man.
What is Inequality or Gini Index in Silver Lake?
Inequality or Gini Index in Silver Lake is 0.36.
What is the Total Population of Silver Lake?
Total Population of Silver Lake is 1,446.
What is the Total Male Population of Silver Lake?
Total Male Population of Silver Lake is 771.
What is the Total Female Population of Silver Lake?
Total Female Population of Silver Lake is 675.
What is the Ratio of Males per 100 Females in Silver Lake?
There are 114.22 Males per 100 Females in Silver Lake.
What is the Ratio of Females per 100 Males in Silver Lake?
There are 87.55 Females per 100 Males in Silver Lake.
What is the Median Population Age in Silver Lake?
Median Population Age in Silver Lake is 39.5 Years.
What is the Average Family Size in Silver Lake
Average Family Size in Silver Lake is 2.7 People.
What is the Average Household Size in Silver Lake
Average Household Size in Silver Lake is 2.2 People.
How Large is the Labor Force in Silver Lake?
There are 663 People in the Labor Forcein in Silver Lake.
What is the Percentage of People in the Labor Force in Silver Lake?
62.1% of People are in the Labor Force in Silver Lake.
What is the Unemployment Rate in Silver Lake?
Unemployment Rate in Silver Lake is 2.4%.