Mcpherson, KS Map & Demographics
Mcpherson Map
Mcpherson Overview
$33,449
PER CAPITA INCOME
$90,208
AVG FAMILY INCOME
$69,807
AVG HOUSEHOLD INCOME
35.9%
WAGE / INCOME GAP [ % ]
64.1¢/ $1
WAGE / INCOME GAP [ $ ]
0.40
INEQUALITY / GINI INDEX
13,955
TOTAL POPULATION
7,043
MALE POPULATION
6,912
FEMALE POPULATION
101.90
MALES / 100 FEMALES
98.14
FEMALES / 100 MALES
36.2
MEDIAN AGE
2.8
AVG FAMILY SIZE
2.2
AVG HOUSEHOLD SIZE
7,798
LABOR FORCE [ PEOPLE ]
67.9%
PERCENT IN LABOR FORCE
2.8%
UNEMPLOYMENT RATE
Mcpherson Zip Codes
Mcpherson Area Codes
Income in Mcpherson
Income Overview in Mcpherson
Per Capita Income in Mcpherson is $33,449, while median incomes of families and households are $90,208 and $69,807 respectively.
| Characteristic | Number | Measure |
| Per Capita Income | 13,955 | $33,449 |
| Median Family Income | 3,585 | $90,208 |
| Mean Family Income | 3,585 | $93,529 |
| Median Household Income | 5,903 | $69,807 |
| Mean Household Income | 5,903 | $78,685 |
| Income Deficit | 3,585 | $0 |
| Wage / Income Gap (%) | 13,955 | 35.92% |
| Wage / Income Gap ($) | 13,955 | 64.08¢ per $1 |
| Gini / Inequality Index | 13,955 | 0.40 |
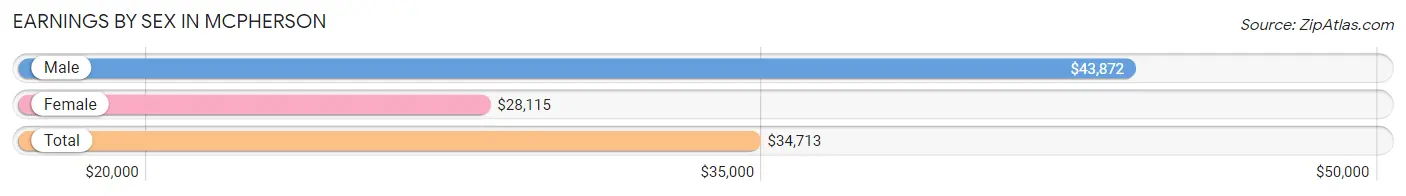
Earnings by Sex in Mcpherson
Average Earnings in Mcpherson are $34,713, $43,872 for men and $28,115 for women, a difference of 35.9%.
| Sex | Number | Average Earnings |
| Male | 4,612 (53.3%) | $43,872 |
| Female | 4,043 (46.7%) | $28,115 |
| Total | 8,655 (100.0%) | $34,713 |
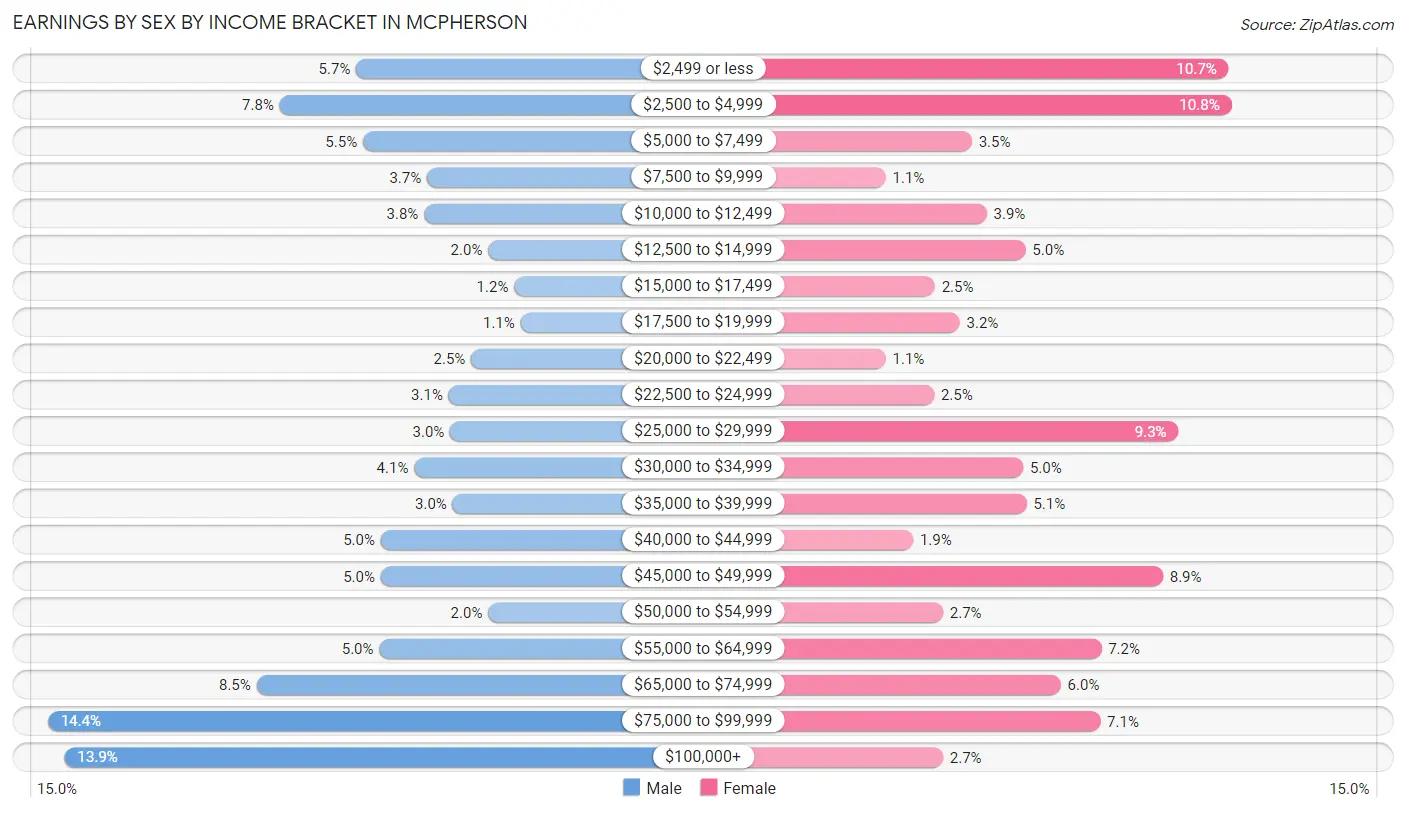
Earnings by Sex by Income Bracket in Mcpherson
The most common earnings brackets in Mcpherson are $75,000 to $99,999 for men (662 | 14.3%) and $2,500 to $4,999 for women (437 | 10.8%).
| Income | Male | Female |
| $2,499 or less | 262 (5.7%) | 434 (10.7%) |
| $2,500 to $4,999 | 361 (7.8%) | 437 (10.8%) |
| $5,000 to $7,499 | 253 (5.5%) | 142 (3.5%) |
| $7,500 to $9,999 | 170 (3.7%) | 44 (1.1%) |
| $10,000 to $12,499 | 174 (3.8%) | 159 (3.9%) |
| $12,500 to $14,999 | 91 (2.0%) | 203 (5.0%) |
| $15,000 to $17,499 | 57 (1.2%) | 100 (2.5%) |
| $17,500 to $19,999 | 49 (1.1%) | 128 (3.2%) |
| $20,000 to $22,499 | 113 (2.5%) | 44 (1.1%) |
| $22,500 to $24,999 | 142 (3.1%) | 99 (2.5%) |
| $25,000 to $29,999 | 140 (3.0%) | 377 (9.3%) |
| $30,000 to $34,999 | 187 (4.1%) | 200 (5.0%) |
| $35,000 to $39,999 | 137 (3.0%) | 204 (5.1%) |
| $40,000 to $44,999 | 230 (5.0%) | 75 (1.9%) |
| $45,000 to $49,999 | 230 (5.0%) | 359 (8.9%) |
| $50,000 to $54,999 | 91 (2.0%) | 109 (2.7%) |
| $55,000 to $64,999 | 232 (5.0%) | 289 (7.1%) |
| $65,000 to $74,999 | 391 (8.5%) | 243 (6.0%) |
| $75,000 to $99,999 | 662 (14.3%) | 288 (7.1%) |
| $100,000+ | 640 (13.9%) | 109 (2.7%) |
| Total | 4,612 (100.0%) | 4,043 (100.0%) |
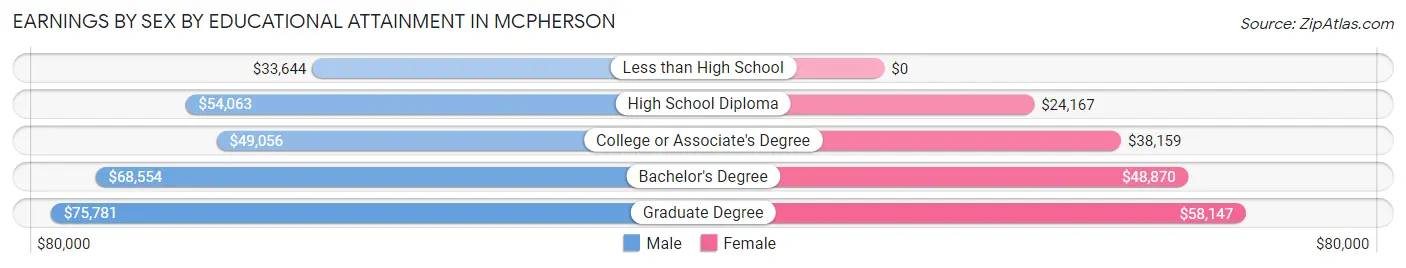
Earnings by Sex by Educational Attainment in Mcpherson
Average earnings in Mcpherson are $59,414 for men and $38,577 for women, a difference of 35.1%. Men with an educational attainment of graduate degree enjoy the highest average annual earnings of $75,781, while those with less than high school education earn the least with $33,644. Women with an educational attainment of graduate degree earn the most with the average annual earnings of $58,147, while those with high school diploma education have the smallest earnings of $24,167.
| Educational Attainment | Male Income | Female Income |
| Less than High School | $33,644 | $0 |
| High School Diploma | $54,063 | $24,167 |
| College or Associate's Degree | $49,056 | $38,159 |
| Bachelor's Degree | $68,554 | $48,870 |
| Graduate Degree | $75,781 | $58,147 |
| Total | $59,414 | $38,577 |
Family Income in Mcpherson
Family Income Brackets in Mcpherson
According to the Mcpherson family income data, there are 950 families falling into the $100,000 to $149,999 income range, which is the most common income bracket and makes up 26.5% of all families. Conversely, the $10,000 to $14,999 income bracket is the least frequent group with only 11 families (0.3%) belonging to this category.
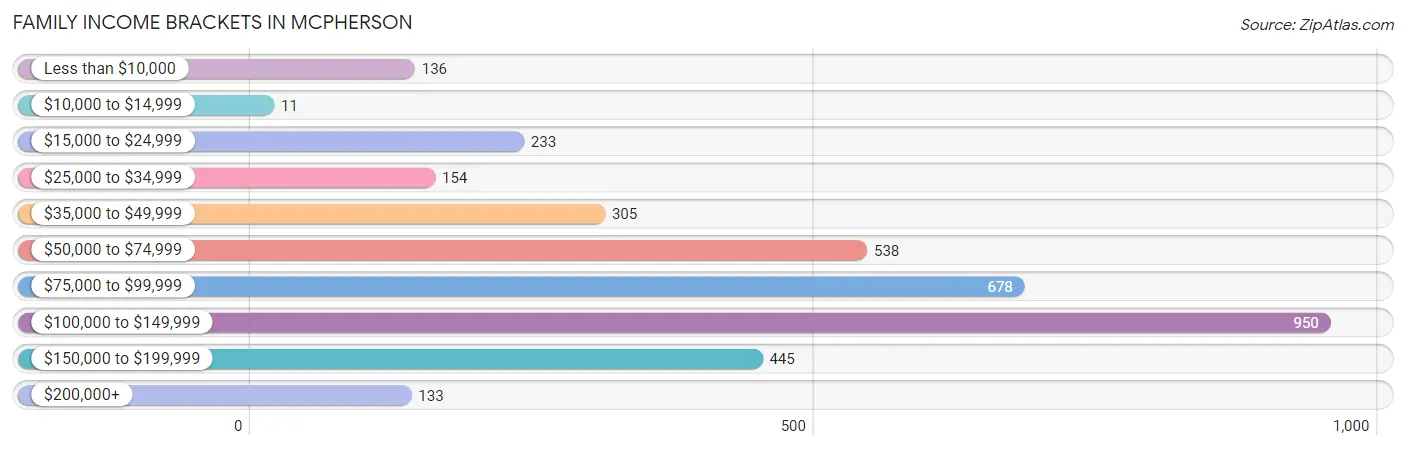
| Income Bracket | # Families | % Families |
| Less than $10,000 | 136 | 3.8% |
| $10,000 to $14,999 | 11 | 0.3% |
| $15,000 to $24,999 | 233 | 6.5% |
| $25,000 to $34,999 | 154 | 4.3% |
| $35,000 to $49,999 | 305 | 8.5% |
| $50,000 to $74,999 | 538 | 15.0% |
| $75,000 to $99,999 | 678 | 18.9% |
| $100,000 to $149,999 | 950 | 26.5% |
| $150,000 to $199,999 | 445 | 12.4% |
| $200,000+ | 133 | 3.7% |
Family Income by Famaliy Size in Mcpherson
7+ person families (38 | 1.1%) account for the highest median family income in Mcpherson with $250,001 per family, while 2-person families (1,746 | 48.7%) have the highest median income of $41,966 per family member.
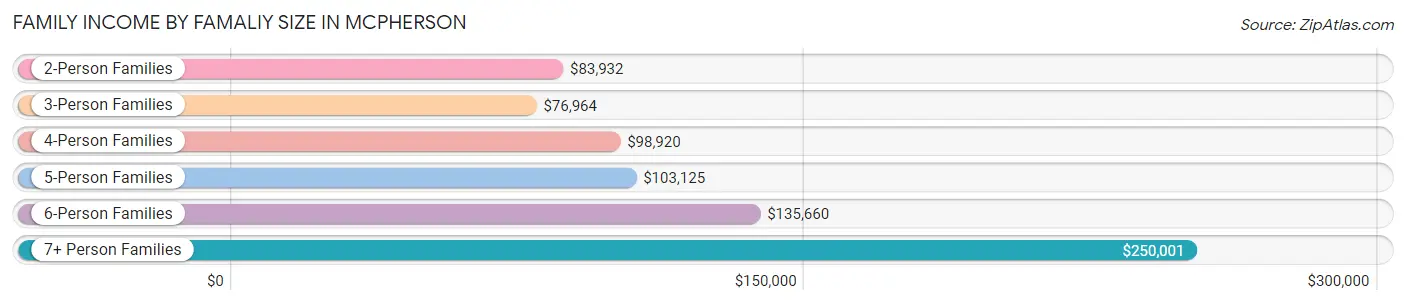
| Income Bracket | # Families | Median Income |
| 2-Person Families | 1,746 (48.7%) | $83,932 |
| 3-Person Families | 814 (22.7%) | $76,964 |
| 4-Person Families | 651 (18.2%) | $98,920 |
| 5-Person Families | 227 (6.3%) | $103,125 |
| 6-Person Families | 109 (3.0%) | $135,660 |
| 7+ Person Families | 38 (1.1%) | $250,001 |
| Total | 3,585 (100.0%) | $90,208 |
Family Income by Number of Earners in Mcpherson
The median family income in Mcpherson is $90,208, with families comprising 3+ earners (424) having the highest median family income of $118,056, while families with 1 earner (807) have the lowest median family income of $68,523, accounting for 11.8% and 22.5% of families, respectively.
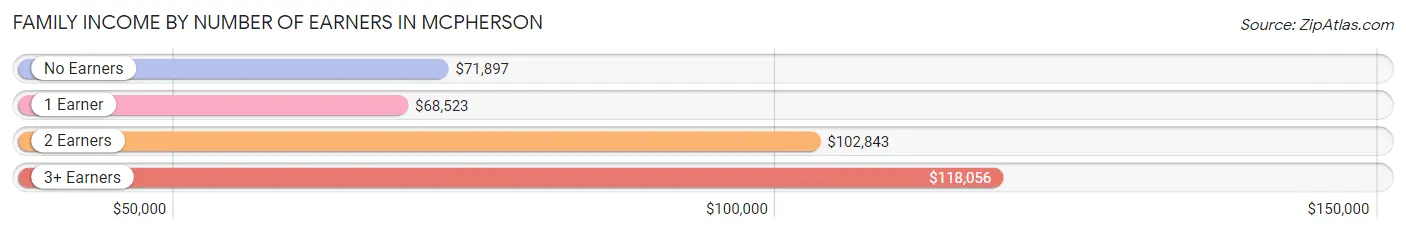
| Number of Earners | # Families | Median Income |
| No Earners | 454 (12.7%) | $71,897 |
| 1 Earner | 807 (22.5%) | $68,523 |
| 2 Earners | 1,900 (53.0%) | $102,843 |
| 3+ Earners | 424 (11.8%) | $118,056 |
| Total | 3,585 (100.0%) | $90,208 |
Household Income in Mcpherson
Household Income Brackets in Mcpherson
With 1,092 households falling in the category, the $100,000 to $149,999 income range is the most frequent in Mcpherson, accounting for 18.5% of all households. In contrast, only 100 households (1.7%) fall into the $10,000 to $14,999 income bracket, making it the least populous group.
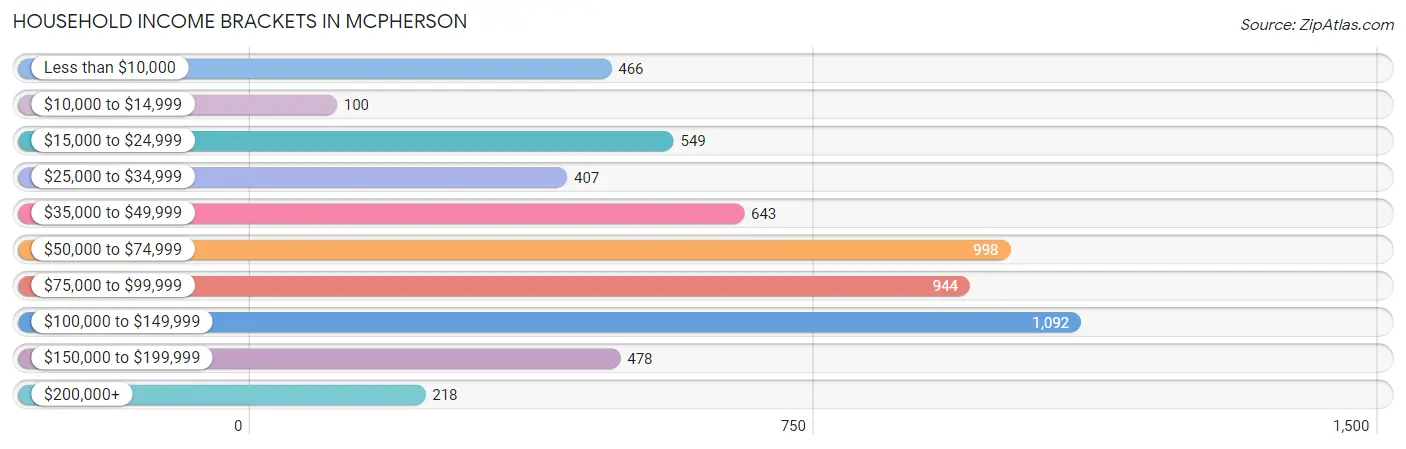
| Income Bracket | # Households | % Households |
| Less than $10,000 | 466 | 7.9% |
| $10,000 to $14,999 | 100 | 1.7% |
| $15,000 to $24,999 | 549 | 9.3% |
| $25,000 to $34,999 | 407 | 6.9% |
| $35,000 to $49,999 | 643 | 10.9% |
| $50,000 to $74,999 | 998 | 16.9% |
| $75,000 to $99,999 | 944 | 16.0% |
| $100,000 to $149,999 | 1,092 | 18.5% |
| $150,000 to $199,999 | 478 | 8.1% |
| $200,000+ | 218 | 3.7% |
Household Income by Householder Age in Mcpherson
The median household income in Mcpherson is $69,807, with the highest median household income of $92,386 found in the 45 to 64 years age bracket for the primary householder. A total of 1,966 households (33.3%) fall into this category. Meanwhile, the 15 to 24 years age bracket for the primary householder has the lowest median household income of $35,577, with 648 households (11.0%) in this group.
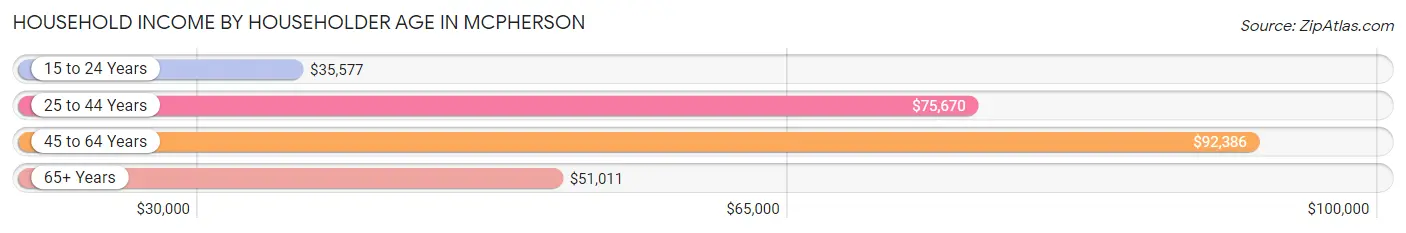
| Income Bracket | # Households | Median Income |
| 15 to 24 Years | 648 (11.0%) | $35,577 |
| 25 to 44 Years | 2,079 (35.2%) | $75,670 |
| 45 to 64 Years | 1,966 (33.3%) | $92,386 |
| 65+ Years | 1,210 (20.5%) | $51,011 |
| Total | 5,903 (100.0%) | $69,807 |
Poverty in Mcpherson
Income Below Poverty by Sex and Age in Mcpherson
With 12.4% poverty level for males and 17.7% for females among the residents of Mcpherson, 18 to 24 year old males and 18 to 24 year old females are the most vulnerable to poverty, with 395 males (43.7%) and 384 females (49.9%) in their respective age groups living below the poverty level.
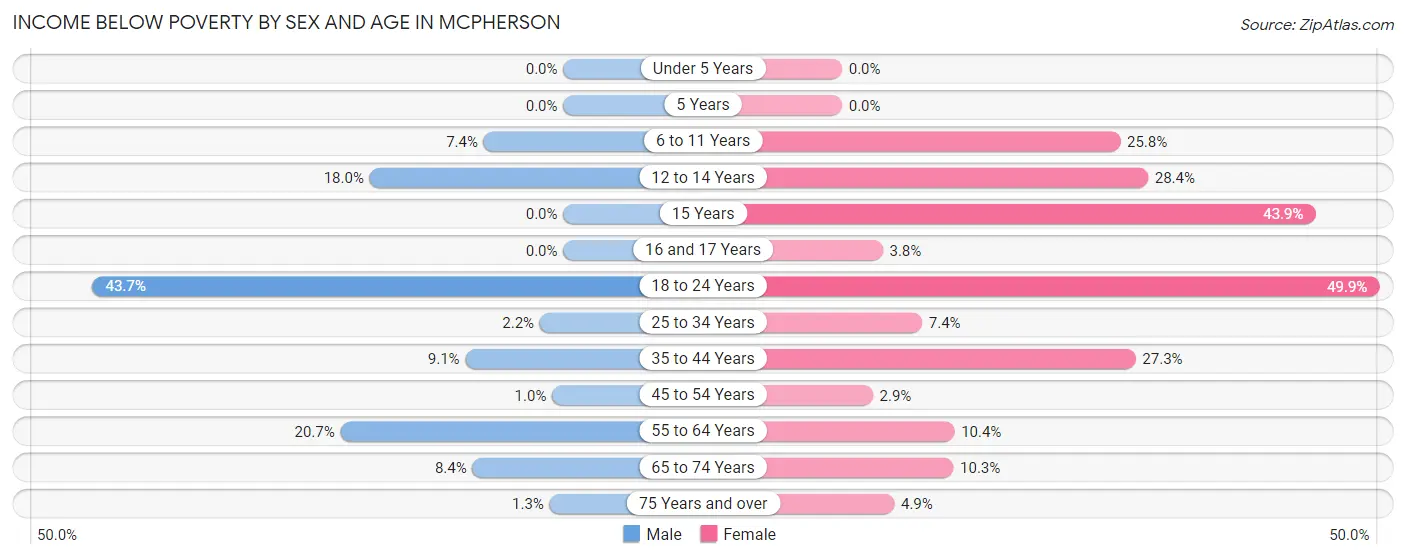
| Age Bracket | Male | Female |
| Under 5 Years | 0 (0.0%) | 0 (0.0%) |
| 5 Years | 0 (0.0%) | 0 (0.0%) |
| 6 to 11 Years | 46 (7.4%) | 134 (25.8%) |
| 12 to 14 Years | 53 (18.0%) | 92 (28.4%) |
| 15 Years | 0 (0.0%) | 29 (43.9%) |
| 16 and 17 Years | 0 (0.0%) | 9 (3.8%) |
| 18 to 24 Years | 395 (43.7%) | 384 (49.9%) |
| 25 to 34 Years | 20 (2.2%) | 63 (7.4%) |
| 35 to 44 Years | 74 (9.1%) | 276 (27.3%) |
| 45 to 54 Years | 8 (1.0%) | 22 (2.9%) |
| 55 to 64 Years | 177 (20.7%) | 80 (10.4%) |
| 65 to 74 Years | 49 (8.4%) | 53 (10.3%) |
| 75 Years and over | 4 (1.3%) | 27 (4.9%) |
| Total | 826 (12.4%) | 1,169 (17.7%) |
Income Above Poverty by Sex and Age in Mcpherson
According to the poverty statistics in Mcpherson, males aged under 5 years and females aged under 5 years are the age groups that are most secure financially, with 100.0% of males and 100.0% of females in these age groups living above the poverty line.
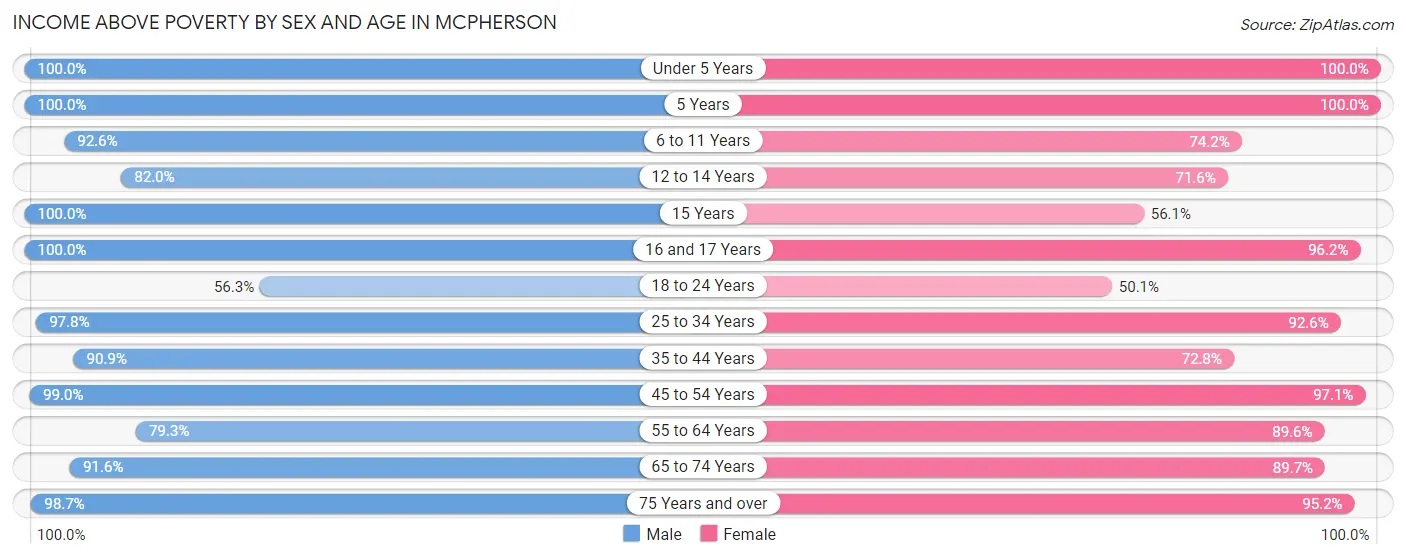
| Age Bracket | Male | Female |
| Under 5 Years | 316 (100.0%) | 206 (100.0%) |
| 5 Years | 33 (100.0%) | 5 (100.0%) |
| 6 to 11 Years | 577 (92.6%) | 385 (74.2%) |
| 12 to 14 Years | 242 (82.0%) | 232 (71.6%) |
| 15 Years | 69 (100.0%) | 37 (56.1%) |
| 16 and 17 Years | 139 (100.0%) | 229 (96.2%) |
| 18 to 24 Years | 509 (56.3%) | 386 (50.1%) |
| 25 to 34 Years | 901 (97.8%) | 785 (92.6%) |
| 35 to 44 Years | 740 (90.9%) | 737 (72.8%) |
| 45 to 54 Years | 770 (99.0%) | 746 (97.1%) |
| 55 to 64 Years | 679 (79.3%) | 687 (89.6%) |
| 65 to 74 Years | 532 (91.6%) | 460 (89.7%) |
| 75 Years and over | 312 (98.7%) | 530 (95.2%) |
| Total | 5,819 (87.6%) | 5,425 (82.3%) |
Income Below Poverty Among Married-Couple Families in Mcpherson
The poverty statistics for married-couple families in Mcpherson show that 3.4% or 99 of the total 2,916 families live below the poverty line. Families with 3 or 4 children have the highest poverty rate of 8.5%, comprising of 20 families. On the other hand, families with 5 or more children have the lowest poverty rate of 0.0%, which includes 0 families.
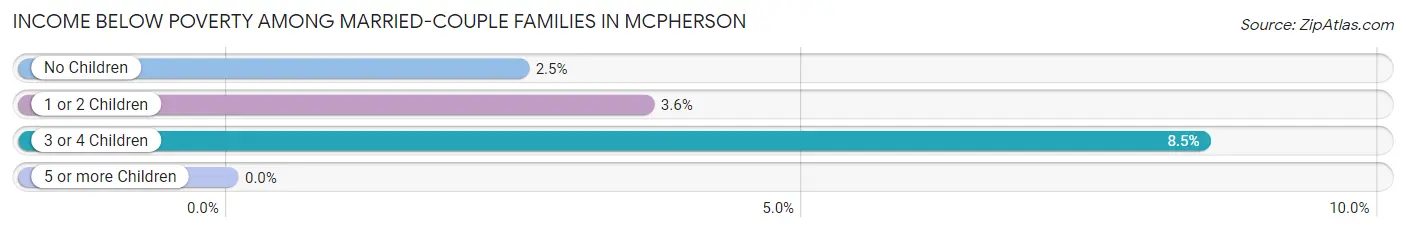
| Children | Above Poverty | Below Poverty |
| No Children | 1,544 (97.5%) | 40 (2.5%) |
| 1 or 2 Children | 1,039 (96.4%) | 39 (3.6%) |
| 3 or 4 Children | 216 (91.5%) | 20 (8.5%) |
| 5 or more Children | 18 (100.0%) | 0 (0.0%) |
| Total | 2,817 (96.6%) | 99 (3.4%) |
Income Below Poverty Among Single-Parent Households in Mcpherson
According to the poverty data in Mcpherson, 17.2% or 40 single-father households and 42.8% or 187 single-mother households are living below the poverty line. Among single-father households, those with 3 or 4 children have the highest poverty rate, with 16 households (100.0%) experiencing poverty. Likewise, among single-mother households, those with no children have the highest poverty rate, with 96 households (82.8%) falling below the poverty line.
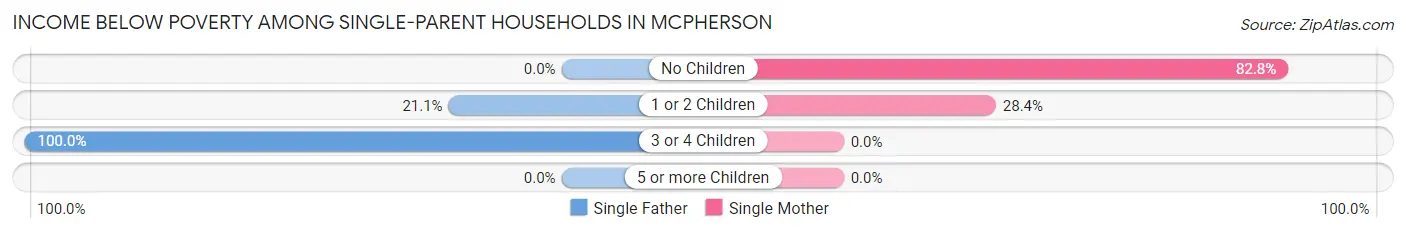
| Children | Single Father | Single Mother |
| No Children | 0 (0.0%) | 96 (82.8%) |
| 1 or 2 Children | 24 (21.0%) | 91 (28.3%) |
| 3 or 4 Children | 16 (100.0%) | 0 (0.0%) |
| 5 or more Children | 0 (0.0%) | 0 (0.0%) |
| Total | 40 (17.2%) | 187 (42.8%) |
Income Below Poverty Among Married-Couple vs Single-Parent Households in Mcpherson
The poverty data for Mcpherson shows that 99 of the married-couple family households (3.4%) and 227 of the single-parent households (33.9%) are living below the poverty level. Within the married-couple family households, those with 3 or 4 children have the highest poverty rate, with 20 households (8.5%) falling below the poverty line. Among the single-parent households, those with 3 or 4 children have the highest poverty rate, with 16 household (100.0%) living below poverty.
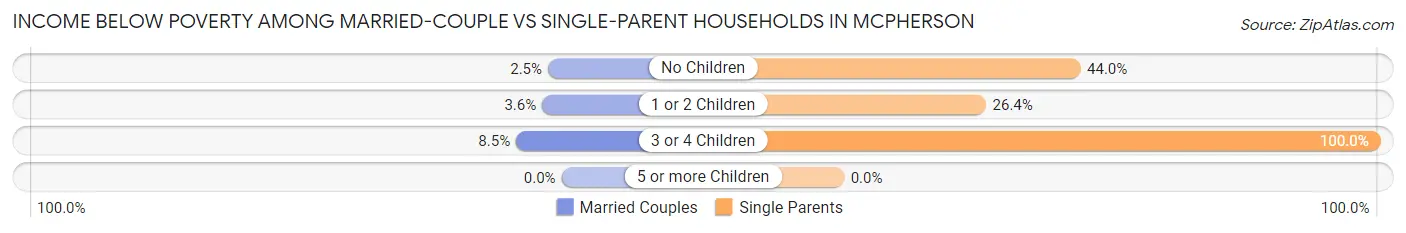
| Children | Married-Couple Families | Single-Parent Households |
| No Children | 40 (2.5%) | 96 (44.0%) |
| 1 or 2 Children | 39 (3.6%) | 115 (26.4%) |
| 3 or 4 Children | 20 (8.5%) | 16 (100.0%) |
| 5 or more Children | 0 (0.0%) | 0 (0.0%) |
| Total | 99 (3.4%) | 227 (33.9%) |
Race in Mcpherson
The most populous races in Mcpherson are White / Caucasian (12,752 | 91.4%), Hispanic or Latino (877 | 6.3%), and Two or more Races (598 | 4.3%).
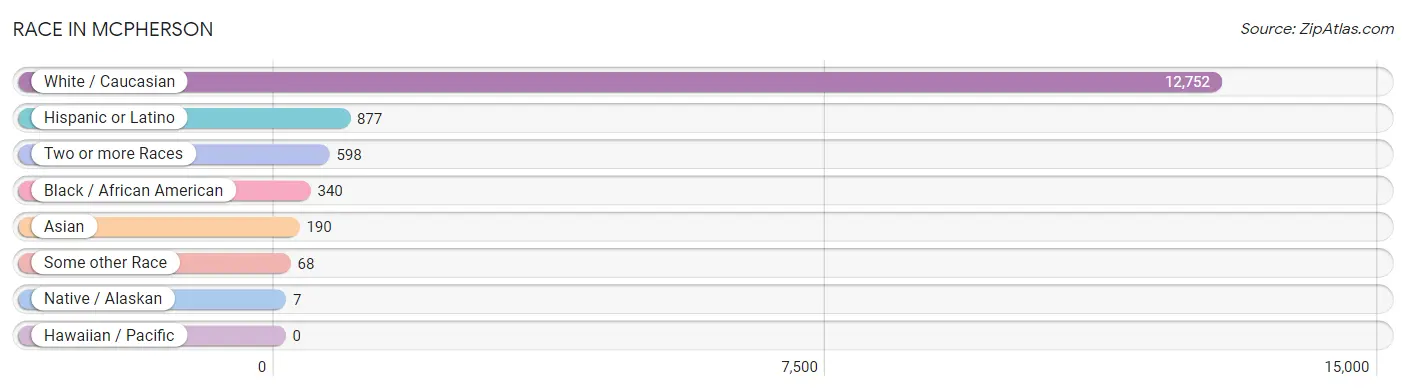
| Race | # Population | % Population |
| Asian | 190 | 1.4% |
| Black / African American | 340 | 2.4% |
| Hawaiian / Pacific | 0 | 0.0% |
| Hispanic or Latino | 877 | 6.3% |
| Native / Alaskan | 7 | 0.1% |
| White / Caucasian | 12,752 | 91.4% |
| Two or more Races | 598 | 4.3% |
| Some other Race | 68 | 0.5% |
| Total | 13,955 | 100.0% |
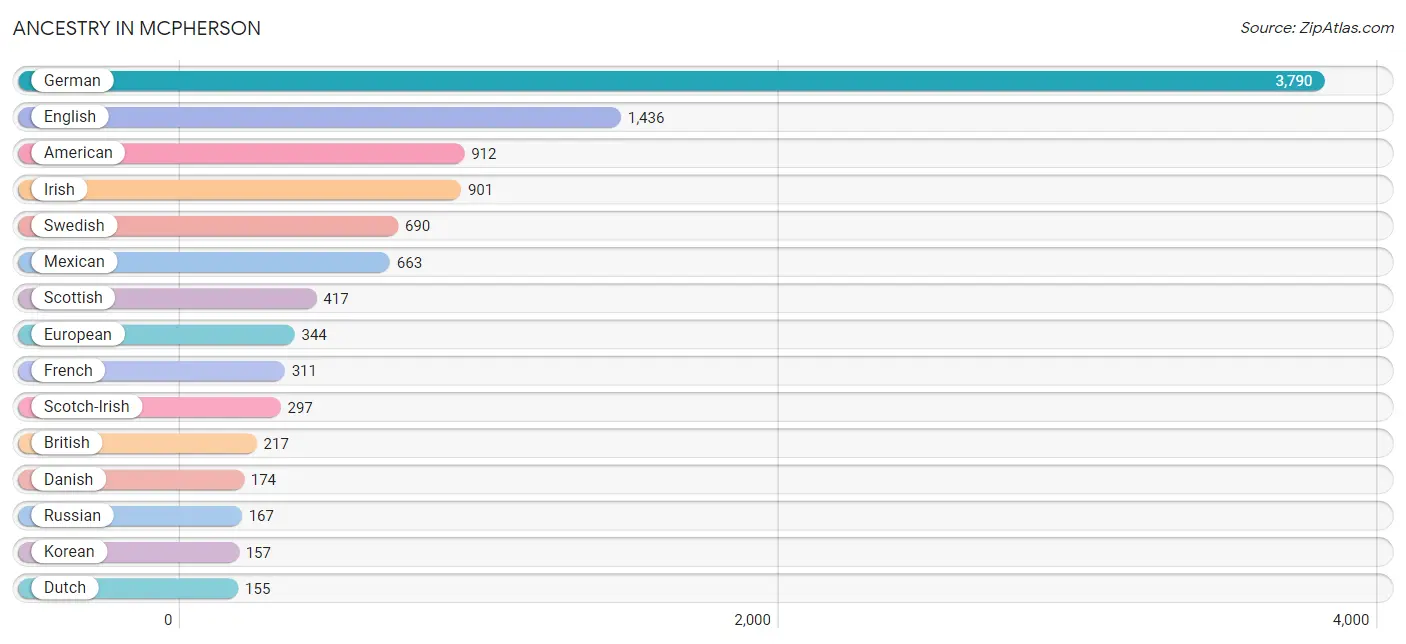
Ancestry in Mcpherson
The most populous ancestries reported in Mcpherson are German (3,790 | 27.2%), English (1,436 | 10.3%), American (912 | 6.5%), Irish (901 | 6.5%), and Swedish (690 | 4.9%), together accounting for 55.4% of all Mcpherson residents.
| Ancestry | # Population | % Population |
| American | 912 | 6.5% |
| Austrian | 49 | 0.4% |
| Bahamian | 2 | 0.0% |
| Bhutanese | 96 | 0.7% |
| Blackfeet | 29 | 0.2% |
| Brazilian | 2 | 0.0% |
| British | 217 | 1.5% |
| Burmese | 14 | 0.1% |
| Central American | 20 | 0.1% |
| Cherokee | 74 | 0.5% |
| Chippewa | 14 | 0.1% |
| Choctaw | 2 | 0.0% |
| Colombian | 79 | 0.6% |
| Creek | 3 | 0.0% |
| Cuban | 69 | 0.5% |
| Czech | 108 | 0.8% |
| Czechoslovakian | 16 | 0.1% |
| Danish | 174 | 1.3% |
| Delaware | 5 | 0.0% |
| Dutch | 155 | 1.1% |
| Eastern European | 17 | 0.1% |
| English | 1,436 | 10.3% |
| European | 344 | 2.5% |
| French | 311 | 2.2% |
| French Canadian | 26 | 0.2% |
| German | 3,790 | 27.2% |
| Greek | 24 | 0.2% |
| Haitian | 6 | 0.0% |
| Indian (Asian) | 6 | 0.0% |
| Irish | 901 | 6.5% |
| Iroquois | 19 | 0.1% |
| Italian | 121 | 0.9% |
| Korean | 157 | 1.1% |
| Mexican | 663 | 4.8% |
| Navajo | 23 | 0.2% |
| Northern European | 7 | 0.1% |
| Norwegian | 78 | 0.6% |
| Polish | 78 | 0.6% |
| Puerto Rican | 19 | 0.1% |
| Russian | 167 | 1.2% |
| Salvadoran | 20 | 0.1% |
| Scandinavian | 21 | 0.2% |
| Scotch-Irish | 297 | 2.1% |
| Scottish | 417 | 3.0% |
| Slavic | 56 | 0.4% |
| Slovene | 20 | 0.1% |
| South African | 13 | 0.1% |
| South American | 79 | 0.6% |
| Spanish | 15 | 0.1% |
| Sri Lankan | 25 | 0.2% |
| Subsaharan African | 46 | 0.3% |
| Swedish | 690 | 4.9% |
| Swiss | 153 | 1.1% |
| Thai | 6 | 0.0% |
| Ukrainian | 3 | 0.0% |
| Welsh | 82 | 0.6% | View All 56 Rows |
Immigrants in Mcpherson
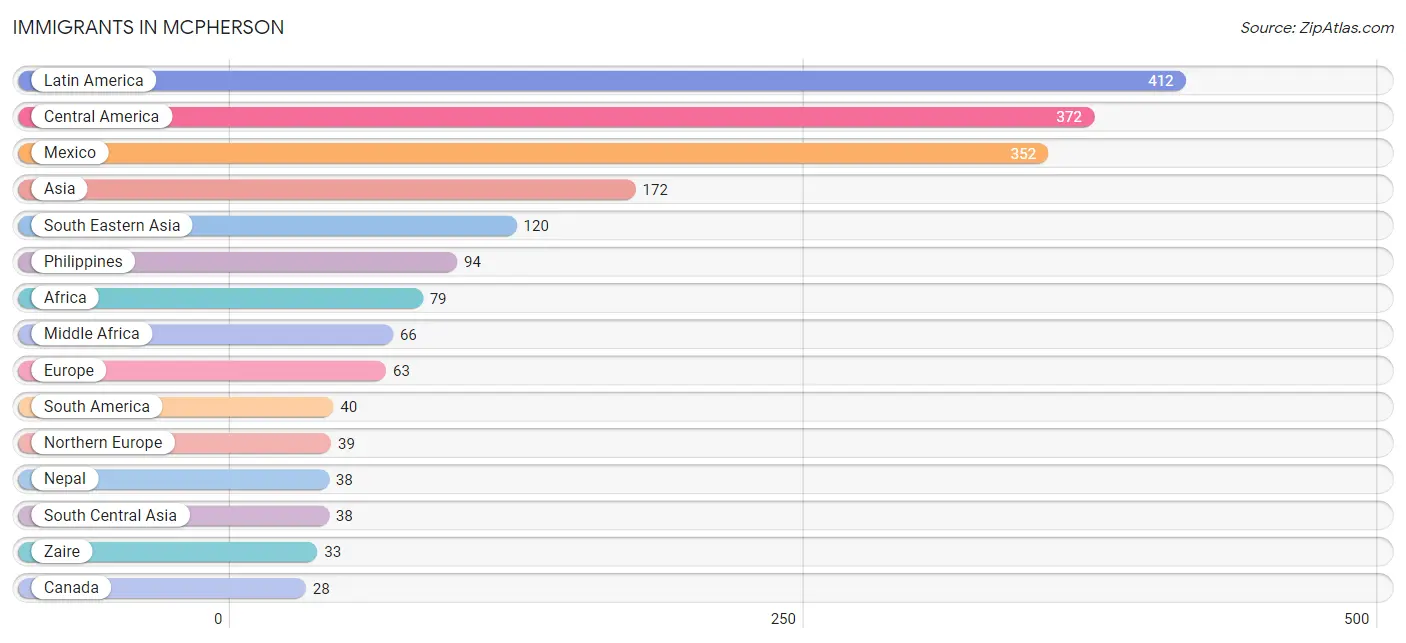
The most numerous immigrant groups reported in Mcpherson came from Latin America (412 | 2.9%), Central America (372 | 2.7%), Mexico (352 | 2.5%), Asia (172 | 1.2%), and South Eastern Asia (120 | 0.9%), together accounting for 10.2% of all Mcpherson residents.
| Immigration Origin | # Population | % Population |
| Africa | 79 | 0.6% |
| Asia | 172 | 1.2% |
| Brazil | 20 | 0.1% |
| Canada | 28 | 0.2% |
| Central America | 372 | 2.7% |
| Colombia | 20 | 0.1% |
| Eastern Asia | 14 | 0.1% |
| El Salvador | 20 | 0.1% |
| England | 26 | 0.2% |
| Europe | 63 | 0.4% |
| France | 3 | 0.0% |
| Germany | 21 | 0.2% |
| Korea | 14 | 0.1% |
| Latin America | 412 | 2.9% |
| Mexico | 352 | 2.5% |
| Middle Africa | 66 | 0.5% |
| Nepal | 38 | 0.3% |
| Northern Europe | 39 | 0.3% |
| Philippines | 94 | 0.7% |
| South Africa | 13 | 0.1% |
| South America | 40 | 0.3% |
| South Central Asia | 38 | 0.3% |
| South Eastern Asia | 120 | 0.9% |
| Vietnam | 26 | 0.2% |
| Western Europe | 24 | 0.2% |
| Zaire | 33 | 0.2% | View All 26 Rows |
Sex and Age in Mcpherson
Sex and Age in Mcpherson
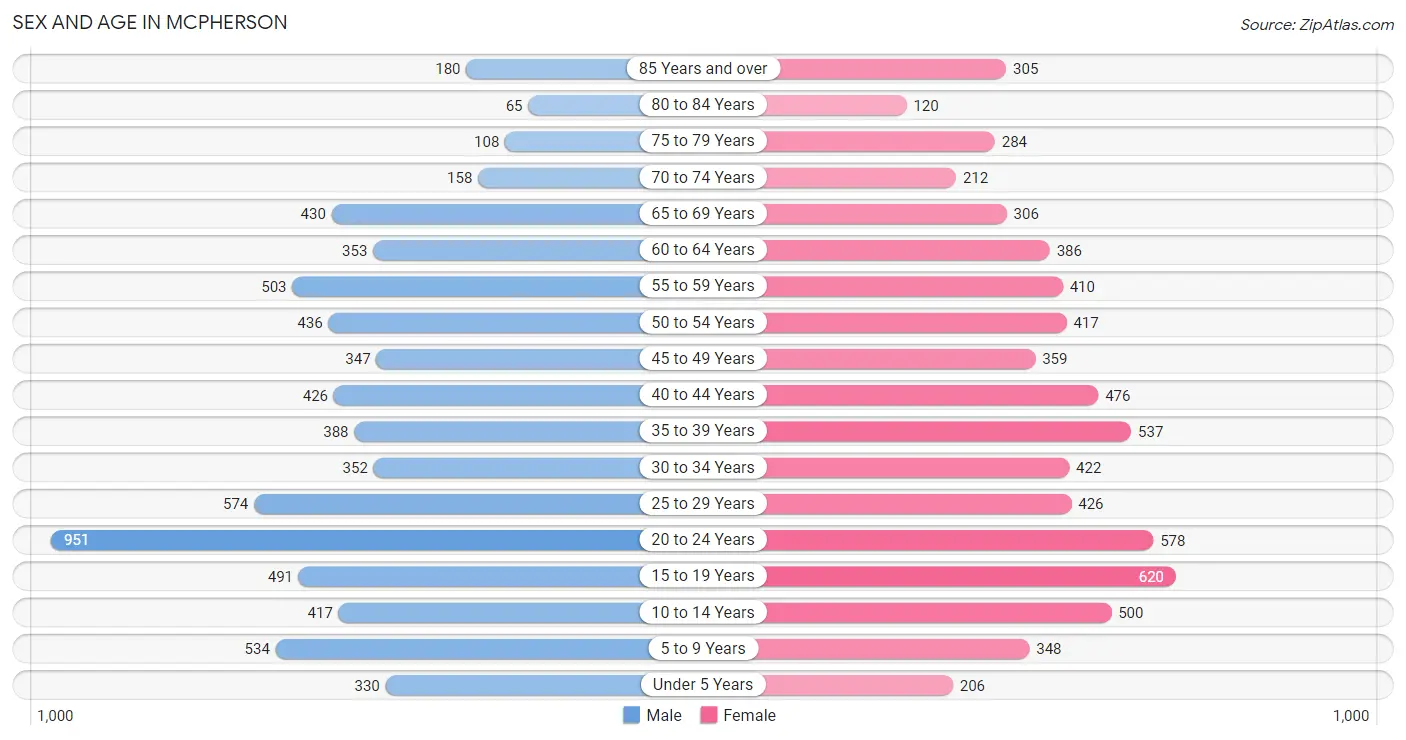
The most populous age groups in Mcpherson are 20 to 24 Years (951 | 13.5%) for men and 15 to 19 Years (620 | 9.0%) for women.
| Age Bracket | Male | Female |
| Under 5 Years | 330 (4.7%) | 206 (3.0%) |
| 5 to 9 Years | 534 (7.6%) | 348 (5.0%) |
| 10 to 14 Years | 417 (5.9%) | 500 (7.2%) |
| 15 to 19 Years | 491 (7.0%) | 620 (9.0%) |
| 20 to 24 Years | 951 (13.5%) | 578 (8.4%) |
| 25 to 29 Years | 574 (8.2%) | 426 (6.2%) |
| 30 to 34 Years | 352 (5.0%) | 422 (6.1%) |
| 35 to 39 Years | 388 (5.5%) | 537 (7.8%) |
| 40 to 44 Years | 426 (6.0%) | 476 (6.9%) |
| 45 to 49 Years | 347 (4.9%) | 359 (5.2%) |
| 50 to 54 Years | 436 (6.2%) | 417 (6.0%) |
| 55 to 59 Years | 503 (7.1%) | 410 (5.9%) |
| 60 to 64 Years | 353 (5.0%) | 386 (5.6%) |
| 65 to 69 Years | 430 (6.1%) | 306 (4.4%) |
| 70 to 74 Years | 158 (2.2%) | 212 (3.1%) |
| 75 to 79 Years | 108 (1.5%) | 284 (4.1%) |
| 80 to 84 Years | 65 (0.9%) | 120 (1.7%) |
| 85 Years and over | 180 (2.6%) | 305 (4.4%) |
| Total | 7,043 (100.0%) | 6,912 (100.0%) |
Families and Households in Mcpherson
Median Family Size in Mcpherson
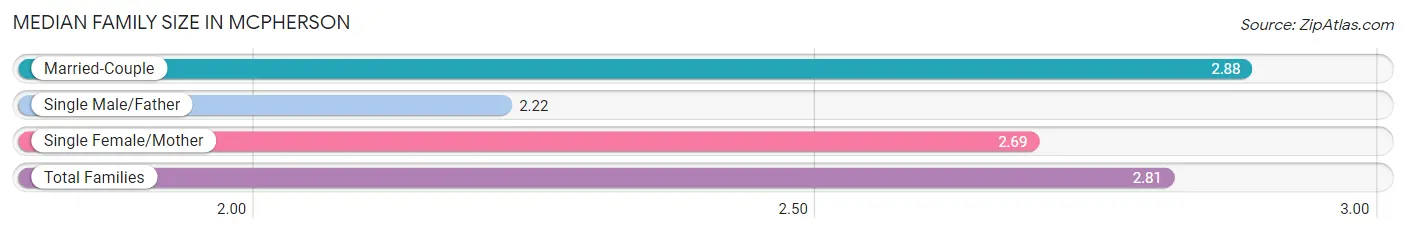
The median family size in Mcpherson is 2.81 persons per family, with married-couple families (2,916 | 81.3%) accounting for the largest median family size of 2.88 persons per family. On the other hand, single male/father families (232 | 6.5%) represent the smallest median family size with 2.22 persons per family.
| Family Type | # Families | Family Size |
| Married-Couple | 2,916 (81.3%) | 2.88 |
| Single Male/Father | 232 (6.5%) | 2.22 |
| Single Female/Mother | 437 (12.2%) | 2.69 |
| Total Families | 3,585 (100.0%) | 2.81 |
Median Household Size in Mcpherson
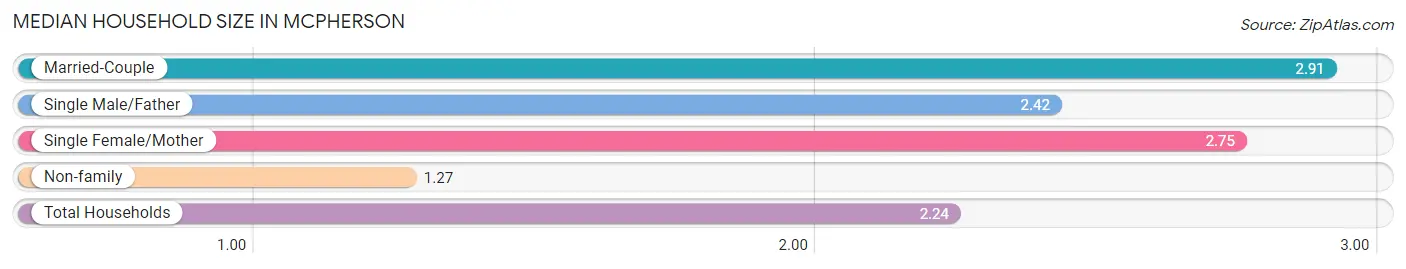
The median household size in Mcpherson is 2.24 persons per household, with married-couple households (2,916 | 49.4%) accounting for the largest median household size of 2.91 persons per household. non-family households (2,318 | 39.3%) represent the smallest median household size with 1.27 persons per household.
| Household Type | # Households | Household Size |
| Married-Couple | 2,916 (49.4%) | 2.91 |
| Single Male/Father | 232 (3.9%) | 2.42 |
| Single Female/Mother | 437 (7.4%) | 2.75 |
| Non-family | 2,318 (39.3%) | 1.27 |
| Total Households | 5,903 (100.0%) | 2.24 |
Household Size by Marriage Status in Mcpherson
Out of a total of 5,903 households in Mcpherson, 3,585 (60.7%) are family households, while 2,318 (39.3%) are nonfamily households. The most numerous type of family households are 2-person households, comprising 1,679, and the most common type of nonfamily households are 1-person households, comprising 1,791.
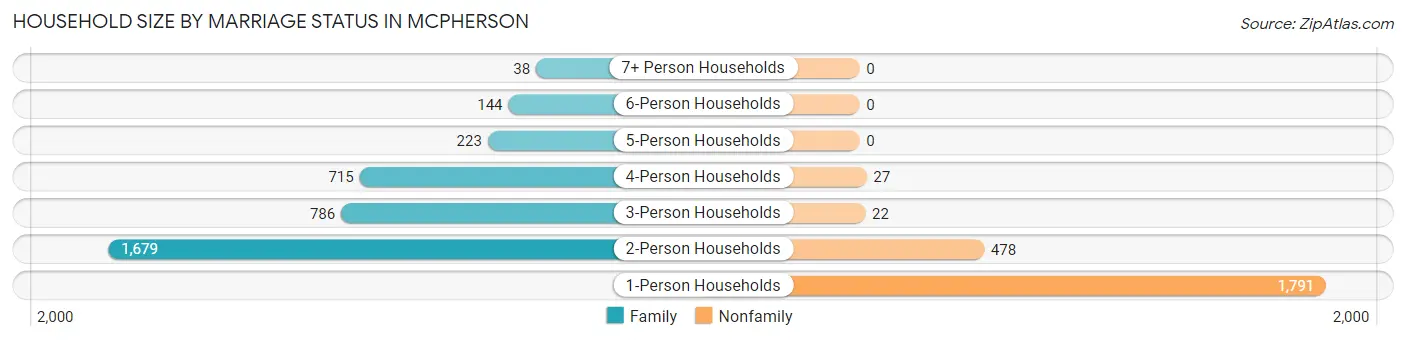
| Household Size | Family Households | Nonfamily Households |
| 1-Person Households | - | 1,791 (30.3%) |
| 2-Person Households | 1,679 (28.4%) | 478 (8.1%) |
| 3-Person Households | 786 (13.3%) | 22 (0.4%) |
| 4-Person Households | 715 (12.1%) | 27 (0.5%) |
| 5-Person Households | 223 (3.8%) | 0 (0.0%) |
| 6-Person Households | 144 (2.4%) | 0 (0.0%) |
| 7+ Person Households | 38 (0.6%) | 0 (0.0%) |
| Total | 3,585 (60.7%) | 2,318 (39.3%) |
Female Fertility in Mcpherson
Fertility by Age in Mcpherson
Average fertility rate in Mcpherson is 33.0 births per 1,000 women. Women in the age bracket of 20 to 34 years have the highest fertility rate with 74.0 births per 1,000 women. Women in the age bracket of 20 to 34 years acount for 89.7% of all women with births.
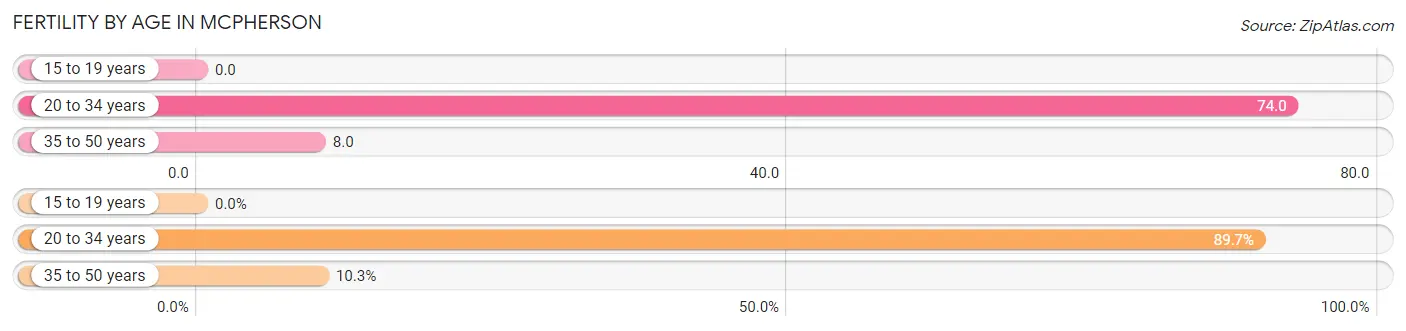
| Age Bracket | Women with Births | Births / 1,000 Women |
| 15 to 19 years | 0 (0.0%) | 0.0 |
| 20 to 34 years | 105 (89.7%) | 74.0 |
| 35 to 50 years | 12 (10.3%) | 8.0 |
| Total | 117 (100.0%) | 33.0 |
Fertility by Age by Marriage Status in Mcpherson
89.7% of women with births (117) in Mcpherson are married. The highest percentage of unmarried women with births falls into 35 to 50 years age bracket with 100.0% of them unmarried at the time of birth, while the lowest percentage of unmarried women with births belong to 20 to 34 years age bracket with 0.0% of them unmarried.
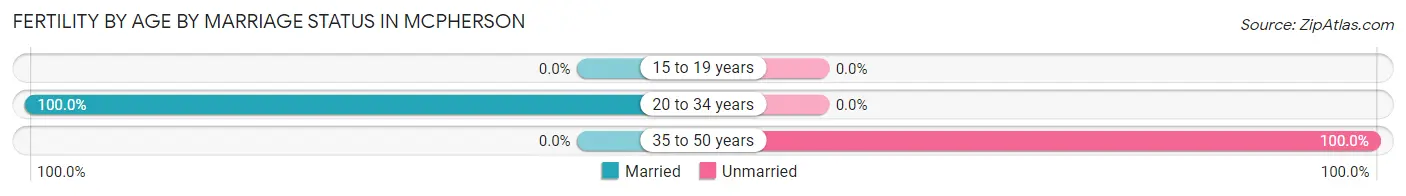
| Age Bracket | Married | Unmarried |
| 15 to 19 years | 0 (0.0%) | 0 (0.0%) |
| 20 to 34 years | 105 (100.0%) | 0 (0.0%) |
| 35 to 50 years | 0 (0.0%) | 12 (100.0%) |
| Total | 105 (89.7%) | 12 (10.3%) |
Fertility by Education in Mcpherson
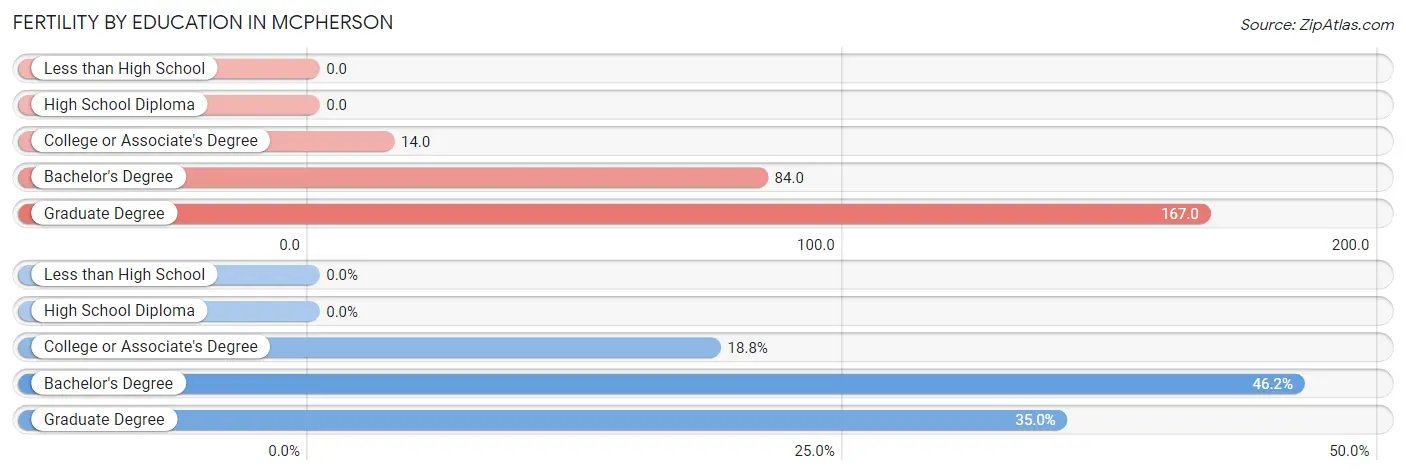
| Educational Attainment | Women with Births | Births / 1,000 Women |
| Less than High School | 0 (0.0%) | 0.0 |
| High School Diploma | 0 (0.0%) | 0.0 |
| College or Associate's Degree | 22 (18.8%) | 14.0 |
| Bachelor's Degree | 54 (46.2%) | 84.0 |
| Graduate Degree | 41 (35.0%) | 167.0 |
| Total | 117 (100.0%) | 33.0 |
Fertility by Education by Marriage Status in Mcpherson
10.3% of women with births in Mcpherson are unmarried. Women with the educational attainment of bachelor's degree are most likely to be married with 100.0% of them married at childbirth, while women with the educational attainment of college or associate's degree are least likely to be married with 54.5% of them unmarried at childbirth.
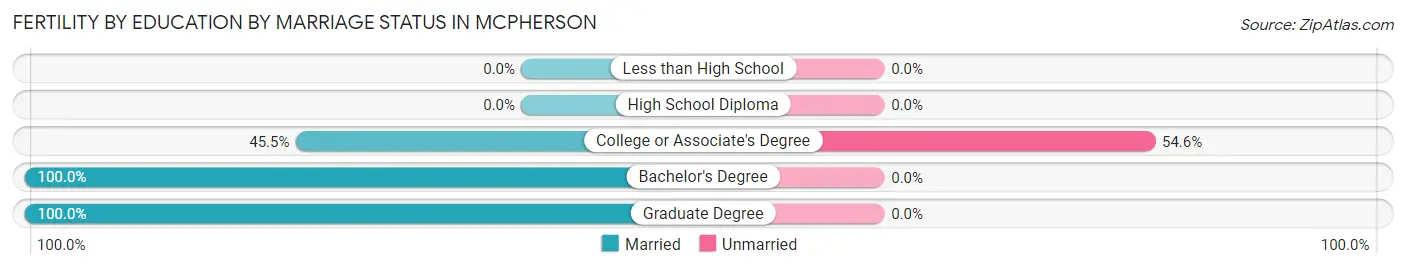
| Educational Attainment | Married | Unmarried |
| Less than High School | 0 (0.0%) | 0 (0.0%) |
| High School Diploma | 0 (0.0%) | 0 (0.0%) |
| College or Associate's Degree | 10 (45.5%) | 12 (54.5%) |
| Bachelor's Degree | 54 (100.0%) | 0 (0.0%) |
| Graduate Degree | 41 (100.0%) | 0 (0.0%) |
| Total | 105 (89.7%) | 12 (10.3%) |
Employment Characteristics in Mcpherson
Employment by Class of Employer in Mcpherson
Among the 7,536 employed individuals in Mcpherson, private company employees (5,152 | 68.4%), local government employees (762 | 10.1%), and not-for-profit organizations (656 | 8.7%) make up the most common classes of employment.
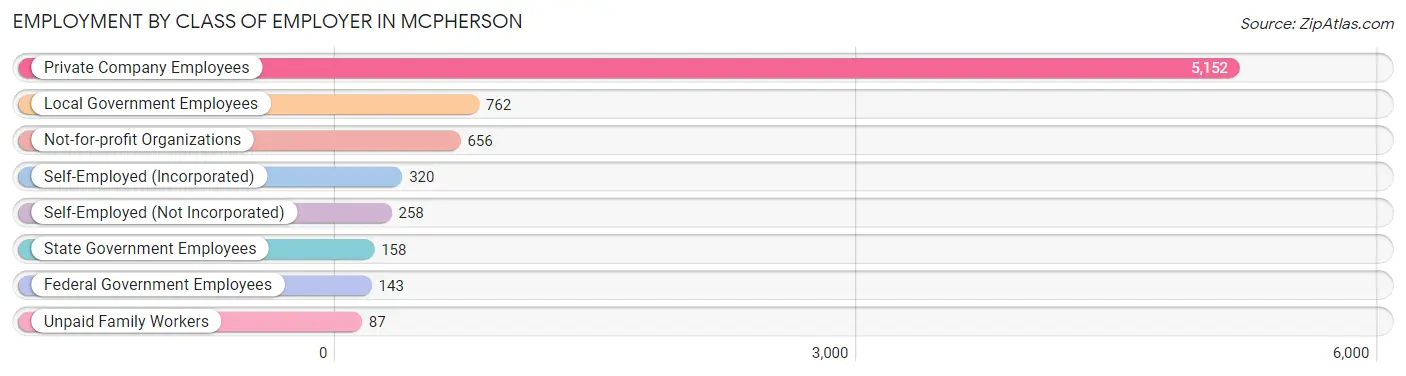
| Employer Class | # Employees | % Employees |
| Private Company Employees | 5,152 | 68.4% |
| Self-Employed (Incorporated) | 320 | 4.3% |
| Self-Employed (Not Incorporated) | 258 | 3.4% |
| Not-for-profit Organizations | 656 | 8.7% |
| Local Government Employees | 762 | 10.1% |
| State Government Employees | 158 | 2.1% |
| Federal Government Employees | 143 | 1.9% |
| Unpaid Family Workers | 87 | 1.1% |
| Total | 7,536 | 100.0% |
Employment Status by Age in Mcpherson
According to the labor force statistics for Mcpherson, out of the total population over 16 years of age (11,485), 67.9% or 7,798 individuals are in the labor force, with 2.8% or 218 of them unemployed. The age group with the highest labor force participation rate is 30 to 34 years, with 90.6% or 701 individuals in the labor force. Within the labor force, the 16 to 19 years age range has the highest percentage of unemployed individuals, with 20.9% or 135 of them being unemployed.
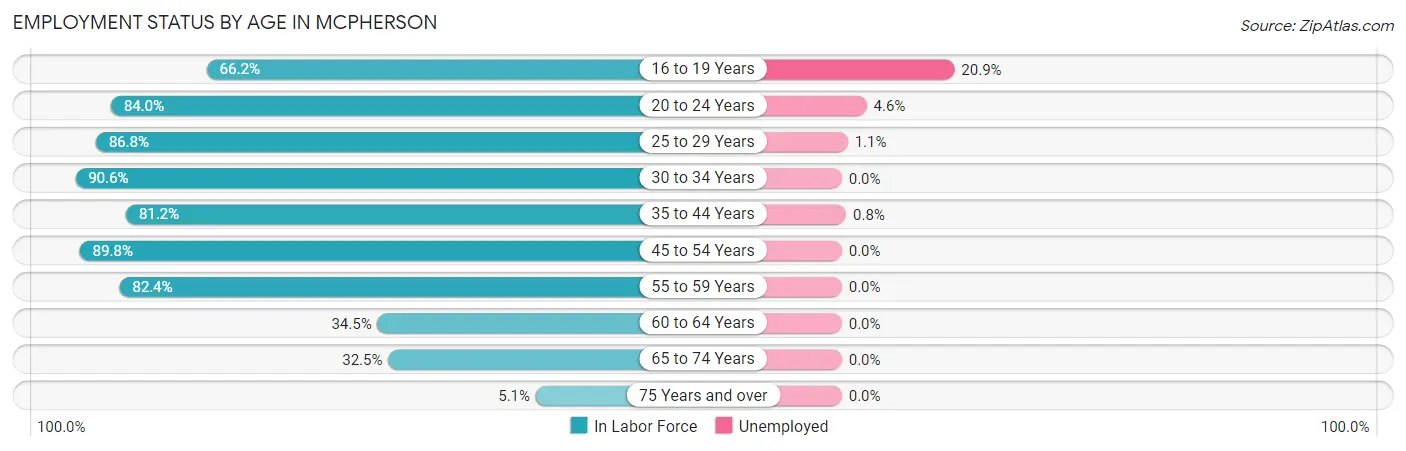
| Age Bracket | In Labor Force | Unemployed |
| 16 to 19 Years | 646 (66.2%) | 135 (20.9%) |
| 20 to 24 Years | 1,284 (84.0%) | 59 (4.6%) |
| 25 to 29 Years | 868 (86.8%) | 10 (1.1%) |
| 30 to 34 Years | 701 (90.6%) | 0 (0.0%) |
| 35 to 44 Years | 1,484 (81.2%) | 12 (0.8%) |
| 45 to 54 Years | 1,400 (89.8%) | 0 (0.0%) |
| 55 to 59 Years | 752 (82.4%) | 0 (0.0%) |
| 60 to 64 Years | 255 (34.5%) | 0 (0.0%) |
| 65 to 74 Years | 359 (32.5%) | 0 (0.0%) |
| 75 Years and over | 54 (5.1%) | 0 (0.0%) |
| Total | 7,798 (67.9%) | 218 (2.8%) |
Employment Status by Educational Attainment in Mcpherson
According to labor force statistics for Mcpherson, 80.1% of individuals (5,456) out of the total population between 25 and 64 years of age (6,812) are in the labor force, with 0.4% or 22 of them being unemployed. The group with the highest labor force participation rate are those with the educational attainment of bachelor's degree or higher, with 92.6% or 2,151 individuals in the labor force. Within the labor force, individuals with less than high school education have the highest percentage of unemployment, with 5.5% or 9 of them being unemployed.
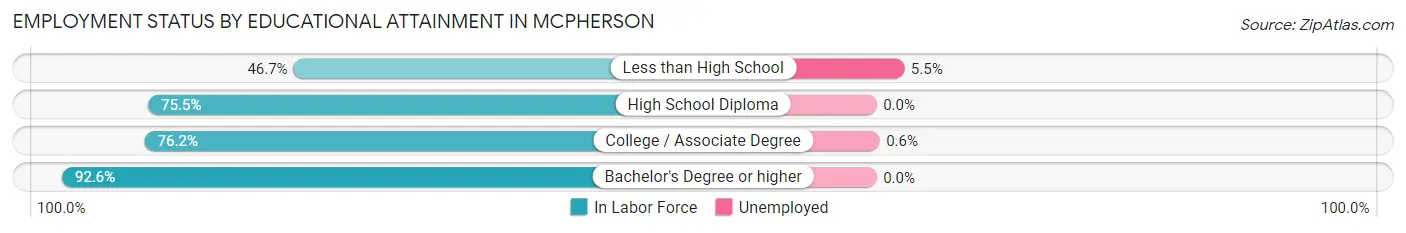
| Educational Attainment | In Labor Force | Unemployed |
| Less than High School | 164 (46.7%) | 19 (5.5%) |
| High School Diploma | 1,132 (75.5%) | 0 (0.0%) |
| College / Associate Degree | 2,010 (76.2%) | 16 (0.6%) |
| Bachelor's Degree or higher | 2,151 (92.6%) | 0 (0.0%) |
| Total | 5,456 (80.1%) | 27 (0.4%) |
Employment Occupations by Sex in Mcpherson
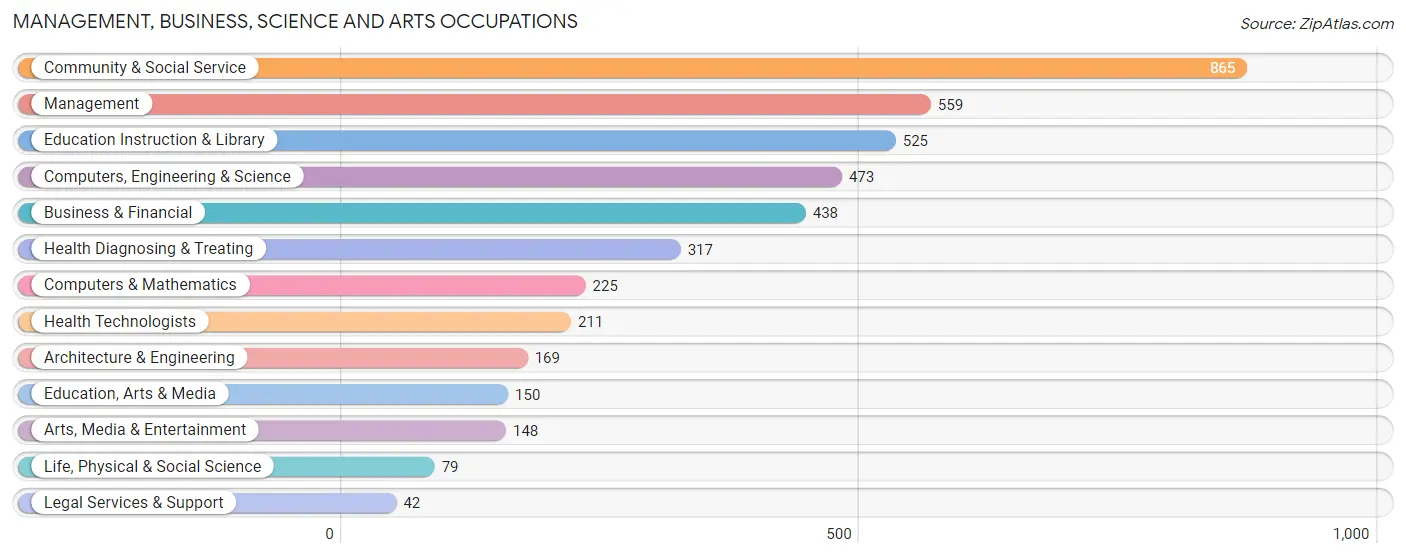
Management, Business, Science and Arts Occupations
The most common Management, Business, Science and Arts occupations in Mcpherson are Community & Social Service (865 | 11.4%), Management (559 | 7.4%), Education Instruction & Library (525 | 6.9%), Computers, Engineering & Science (473 | 6.3%), and Business & Financial (438 | 5.8%).
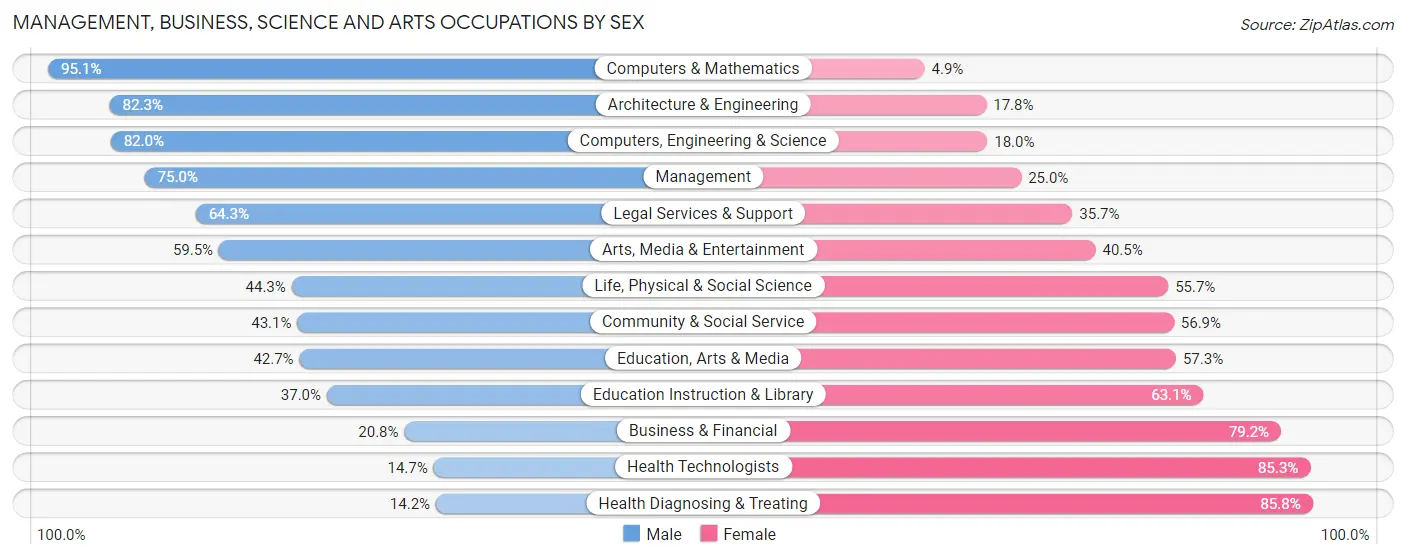
Management, Business, Science and Arts Occupations by Sex
Within the Management, Business, Science and Arts occupations in Mcpherson, the most male-oriented occupations are Computers & Mathematics (95.1%), Architecture & Engineering (82.3%), and Computers, Engineering & Science (82.0%), while the most female-oriented occupations are Health Diagnosing & Treating (85.8%), Health Technologists (85.3%), and Business & Financial (79.2%).
| Occupation | Male | Female |
| Management | 419 (75.0%) | 140 (25.0%) |
| Business & Financial | 91 (20.8%) | 347 (79.2%) |
| Computers, Engineering & Science | 388 (82.0%) | 85 (18.0%) |
| Computers & Mathematics | 214 (95.1%) | 11 (4.9%) |
| Architecture & Engineering | 139 (82.3%) | 30 (17.7%) |
| Life, Physical & Social Science | 35 (44.3%) | 44 (55.7%) |
| Community & Social Service | 373 (43.1%) | 492 (56.9%) |
| Education, Arts & Media | 64 (42.7%) | 86 (57.3%) |
| Legal Services & Support | 27 (64.3%) | 15 (35.7%) |
| Education Instruction & Library | 194 (36.9%) | 331 (63.0%) |
| Arts, Media & Entertainment | 88 (59.5%) | 60 (40.5%) |
| Health Diagnosing & Treating | 45 (14.2%) | 272 (85.8%) |
| Health Technologists | 31 (14.7%) | 180 (85.3%) |
| Total (Category) | 1,316 (49.6%) | 1,336 (50.4%) |
| Total (Overall) | 3,989 (52.8%) | 3,571 (47.2%) |
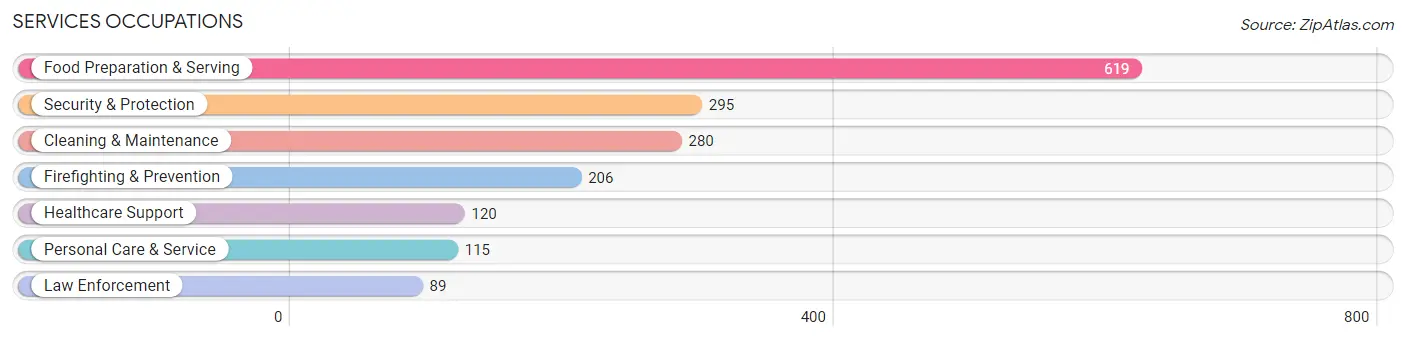
Services Occupations
The most common Services occupations in Mcpherson are Food Preparation & Serving (619 | 8.2%), Security & Protection (295 | 3.9%), Cleaning & Maintenance (280 | 3.7%), Firefighting & Prevention (206 | 2.7%), and Healthcare Support (120 | 1.6%).
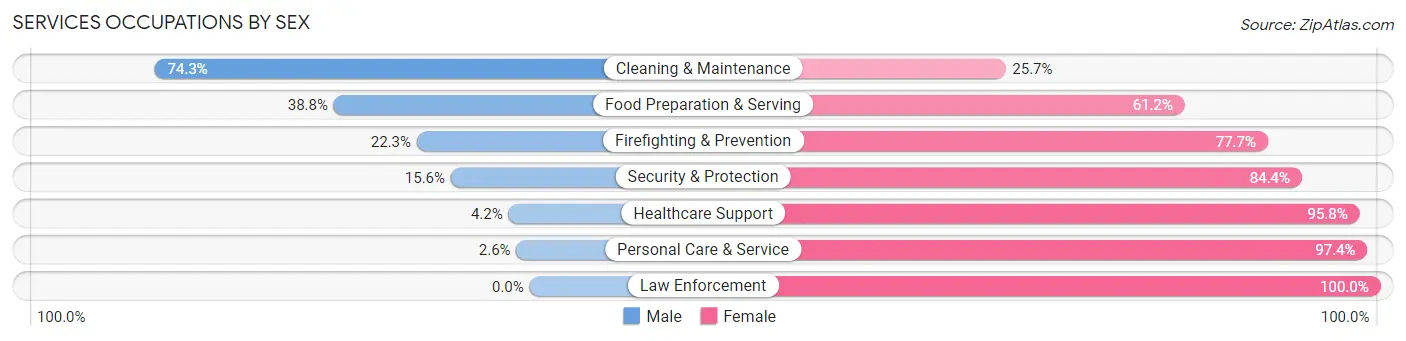
Services Occupations by Sex
Within the Services occupations in Mcpherson, the most male-oriented occupations are Cleaning & Maintenance (74.3%), Food Preparation & Serving (38.8%), and Firefighting & Prevention (22.3%), while the most female-oriented occupations are Law Enforcement (100.0%), Personal Care & Service (97.4%), and Healthcare Support (95.8%).
| Occupation | Male | Female |
| Healthcare Support | 5 (4.2%) | 115 (95.8%) |
| Security & Protection | 46 (15.6%) | 249 (84.4%) |
| Firefighting & Prevention | 46 (22.3%) | 160 (77.7%) |
| Law Enforcement | 0 (0.0%) | 89 (100.0%) |
| Food Preparation & Serving | 240 (38.8%) | 379 (61.2%) |
| Cleaning & Maintenance | 208 (74.3%) | 72 (25.7%) |
| Personal Care & Service | 3 (2.6%) | 112 (97.4%) |
| Total (Category) | 502 (35.1%) | 927 (64.9%) |
| Total (Overall) | 3,989 (52.8%) | 3,571 (47.2%) |
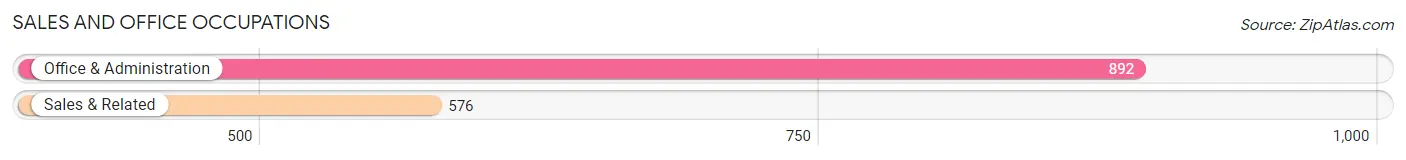
Sales and Office Occupations
The most common Sales and Office occupations in Mcpherson are Office & Administration (892 | 11.8%), and Sales & Related (576 | 7.6%).
Sales and Office Occupations by Sex
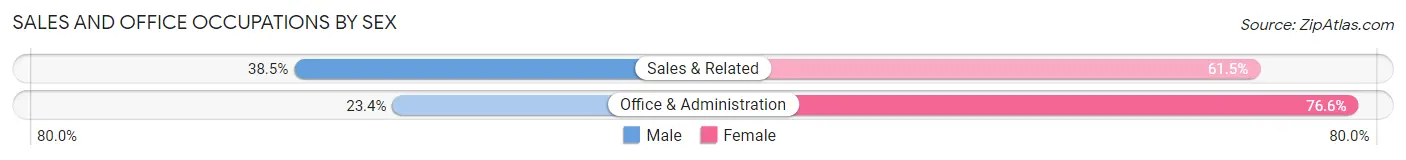
| Occupation | Male | Female |
| Sales & Related | 222 (38.5%) | 354 (61.5%) |
| Office & Administration | 209 (23.4%) | 683 (76.6%) |
| Total (Category) | 431 (29.4%) | 1,037 (70.6%) |
| Total (Overall) | 3,989 (52.8%) | 3,571 (47.2%) |
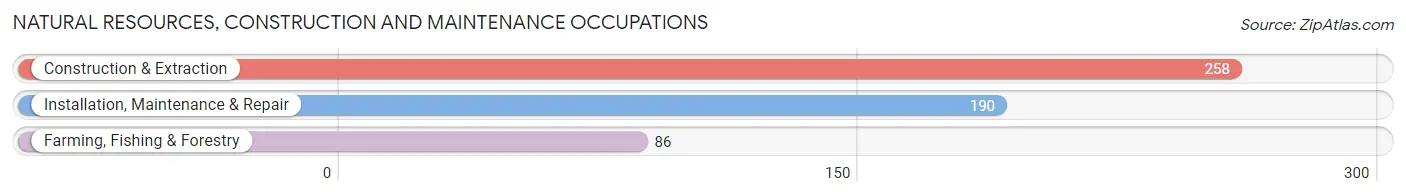
Natural Resources, Construction and Maintenance Occupations
The most common Natural Resources, Construction and Maintenance occupations in Mcpherson are Construction & Extraction (258 | 3.4%), Installation, Maintenance & Repair (190 | 2.5%), and Farming, Fishing & Forestry (86 | 1.1%).
Natural Resources, Construction and Maintenance Occupations by Sex
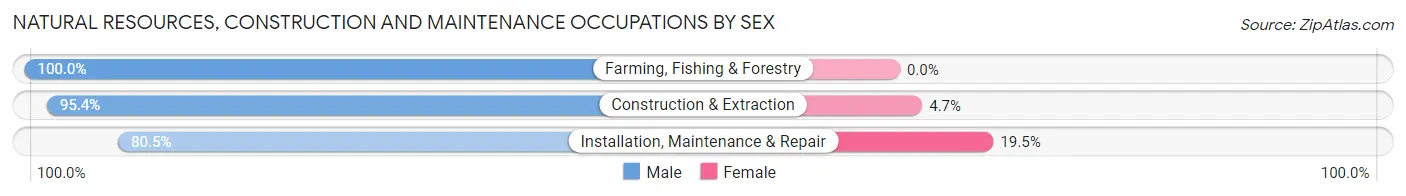
| Occupation | Male | Female |
| Farming, Fishing & Forestry | 86 (100.0%) | 0 (0.0%) |
| Construction & Extraction | 246 (95.4%) | 12 (4.6%) |
| Installation, Maintenance & Repair | 153 (80.5%) | 37 (19.5%) |
| Total (Category) | 485 (90.8%) | 49 (9.2%) |
| Total (Overall) | 3,989 (52.8%) | 3,571 (47.2%) |
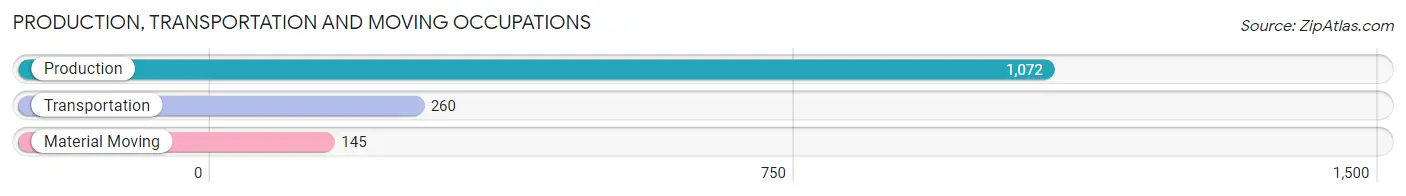
Production, Transportation and Moving Occupations
The most common Production, Transportation and Moving occupations in Mcpherson are Production (1,072 | 14.2%), Transportation (260 | 3.4%), and Material Moving (145 | 1.9%).
Production, Transportation and Moving Occupations by Sex
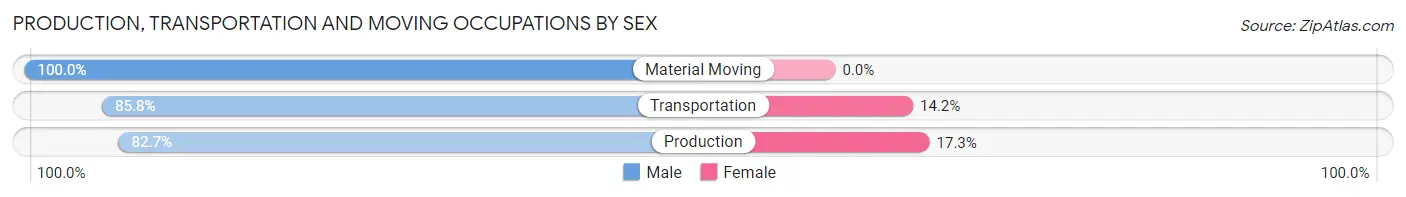
| Occupation | Male | Female |
| Production | 887 (82.7%) | 185 (17.3%) |
| Transportation | 223 (85.8%) | 37 (14.2%) |
| Material Moving | 145 (100.0%) | 0 (0.0%) |
| Total (Category) | 1,255 (85.0%) | 222 (15.0%) |
| Total (Overall) | 3,989 (52.8%) | 3,571 (47.2%) |
Employment Industries by Sex in Mcpherson
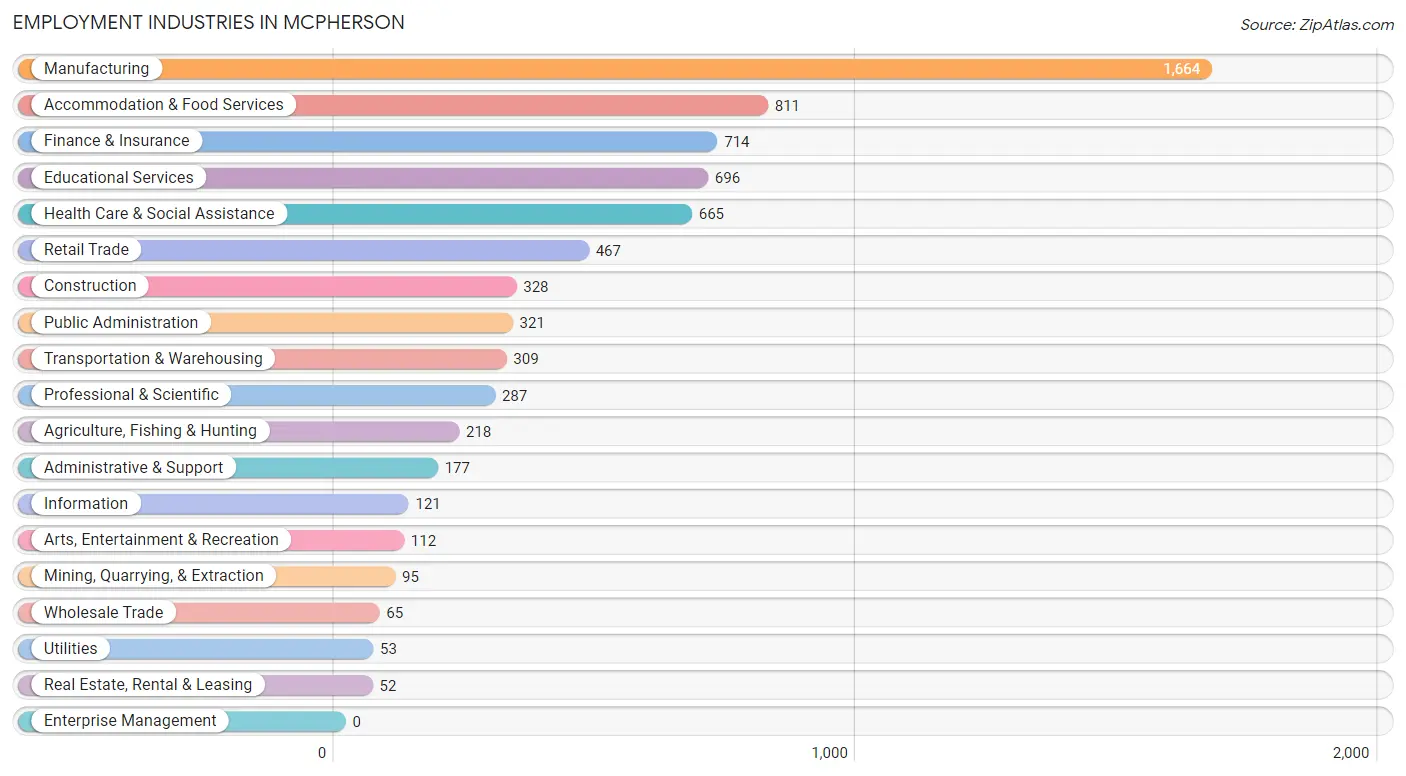
Employment Industries in Mcpherson
The major employment industries in Mcpherson include Manufacturing (1,664 | 22.0%), Accommodation & Food Services (811 | 10.7%), Finance & Insurance (714 | 9.4%), Educational Services (696 | 9.2%), and Health Care & Social Assistance (665 | 8.8%).
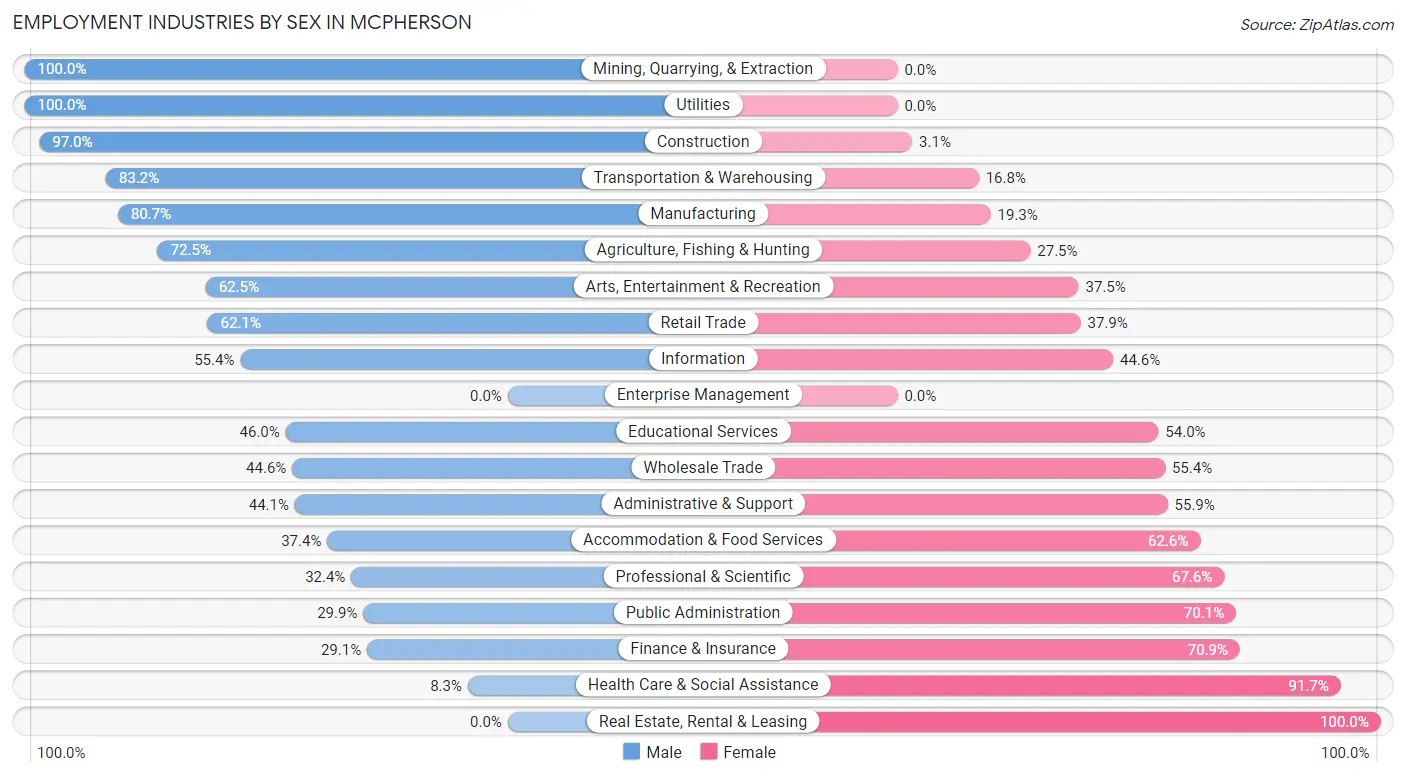
Employment Industries by Sex in Mcpherson
The Mcpherson industries that see more men than women are Mining, Quarrying, & Extraction (100.0%), Utilities (100.0%), and Construction (97.0%), whereas the industries that tend to have a higher number of women are Real Estate, Rental & Leasing (100.0%), Health Care & Social Assistance (91.7%), and Finance & Insurance (70.9%).
| Industry | Male | Female |
| Agriculture, Fishing & Hunting | 158 (72.5%) | 60 (27.5%) |
| Mining, Quarrying, & Extraction | 95 (100.0%) | 0 (0.0%) |
| Construction | 318 (97.0%) | 10 (3.0%) |
| Manufacturing | 1,343 (80.7%) | 321 (19.3%) |
| Wholesale Trade | 29 (44.6%) | 36 (55.4%) |
| Retail Trade | 290 (62.1%) | 177 (37.9%) |
| Transportation & Warehousing | 257 (83.2%) | 52 (16.8%) |
| Utilities | 53 (100.0%) | 0 (0.0%) |
| Information | 67 (55.4%) | 54 (44.6%) |
| Finance & Insurance | 208 (29.1%) | 506 (70.9%) |
| Real Estate, Rental & Leasing | 0 (0.0%) | 52 (100.0%) |
| Professional & Scientific | 93 (32.4%) | 194 (67.6%) |
| Enterprise Management | 0 (0.0%) | 0 (0.0%) |
| Administrative & Support | 78 (44.1%) | 99 (55.9%) |
| Educational Services | 320 (46.0%) | 376 (54.0%) |
| Health Care & Social Assistance | 55 (8.3%) | 610 (91.7%) |
| Arts, Entertainment & Recreation | 70 (62.5%) | 42 (37.5%) |
| Accommodation & Food Services | 303 (37.4%) | 508 (62.6%) |
| Public Administration | 96 (29.9%) | 225 (70.1%) |
| Total | 3,989 (52.8%) | 3,571 (47.2%) |
Education in Mcpherson
School Enrollment in Mcpherson
The most common levels of schooling among the 3,968 students in Mcpherson are college / undergraduate (1,267 | 31.9%), elementary school (775 | 19.5%), and high school (724 | 18.2%).
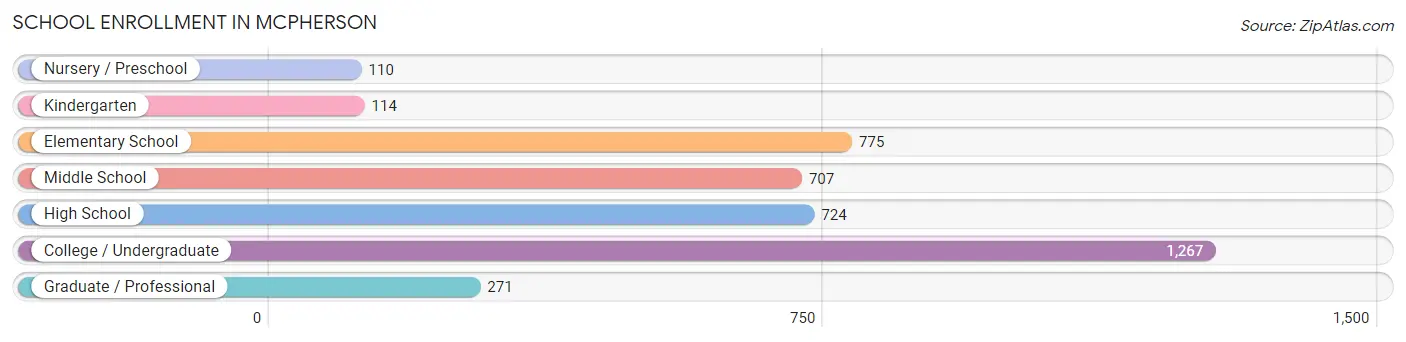
| School Level | # Students | % Students |
| Nursery / Preschool | 110 | 2.8% |
| Kindergarten | 114 | 2.9% |
| Elementary School | 775 | 19.5% |
| Middle School | 707 | 17.8% |
| High School | 724 | 18.2% |
| College / Undergraduate | 1,267 | 31.9% |
| Graduate / Professional | 271 | 6.8% |
| Total | 3,968 | 100.0% |
School Enrollment by Age by Funding Source in Mcpherson
Out of a total of 3,968 students who are enrolled in schools in Mcpherson, 1,532 (38.6%) attend a private institution, while the remaining 2,436 (61.4%) are enrolled in public schools. The age group of 18 to 19 year olds has the highest likelihood of being enrolled in private schools, with 464 (84.1% in the age bracket) enrolled. Conversely, the age group of 25 to 34 year olds has the lowest likelihood of being enrolled in a private school, with 172 (90.5% in the age bracket) attending a public institution.
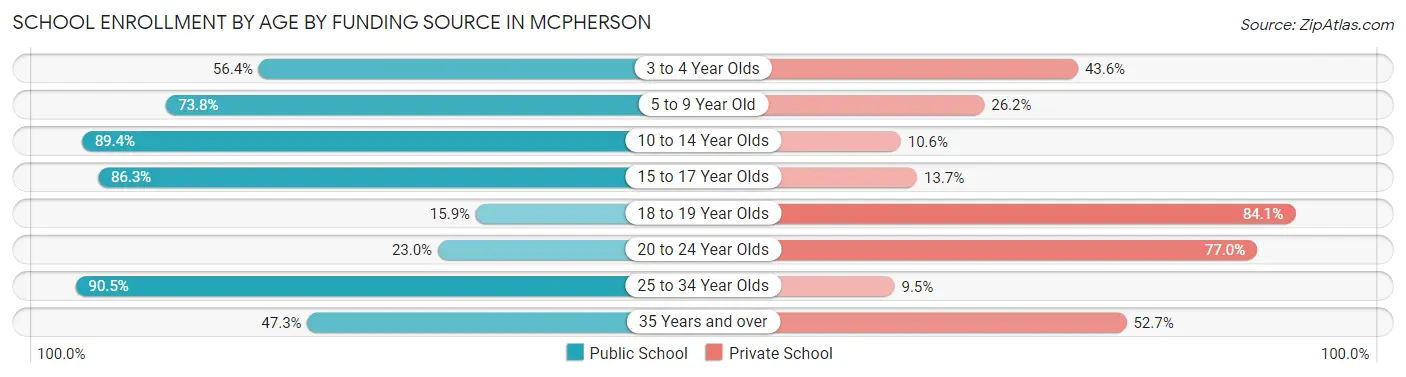
| Age Bracket | Public School | Private School |
| 3 to 4 Year Olds | 62 (56.4%) | 48 (43.6%) |
| 5 to 9 Year Old | 651 (73.8%) | 231 (26.2%) |
| 10 to 14 Year Olds | 773 (89.4%) | 92 (10.6%) |
| 15 to 17 Year Olds | 442 (86.3%) | 70 (13.7%) |
| 18 to 19 Year Olds | 88 (15.9%) | 464 (84.1%) |
| 20 to 24 Year Olds | 150 (23.0%) | 502 (77.0%) |
| 25 to 34 Year Olds | 172 (90.5%) | 18 (9.5%) |
| 35 Years and over | 97 (47.3%) | 108 (52.7%) |
| Total | 2,436 (61.4%) | 1,532 (38.6%) |
Educational Attainment by Field of Study in Mcpherson
Business (751 | 23.1%), education (604 | 18.6%), bio, nature & agricultural (314 | 9.7%), visual & performing arts (276 | 8.5%), and psychology (201 | 6.2%) are the most common fields of study among 3,251 individuals in Mcpherson who have obtained a bachelor's degree or higher.
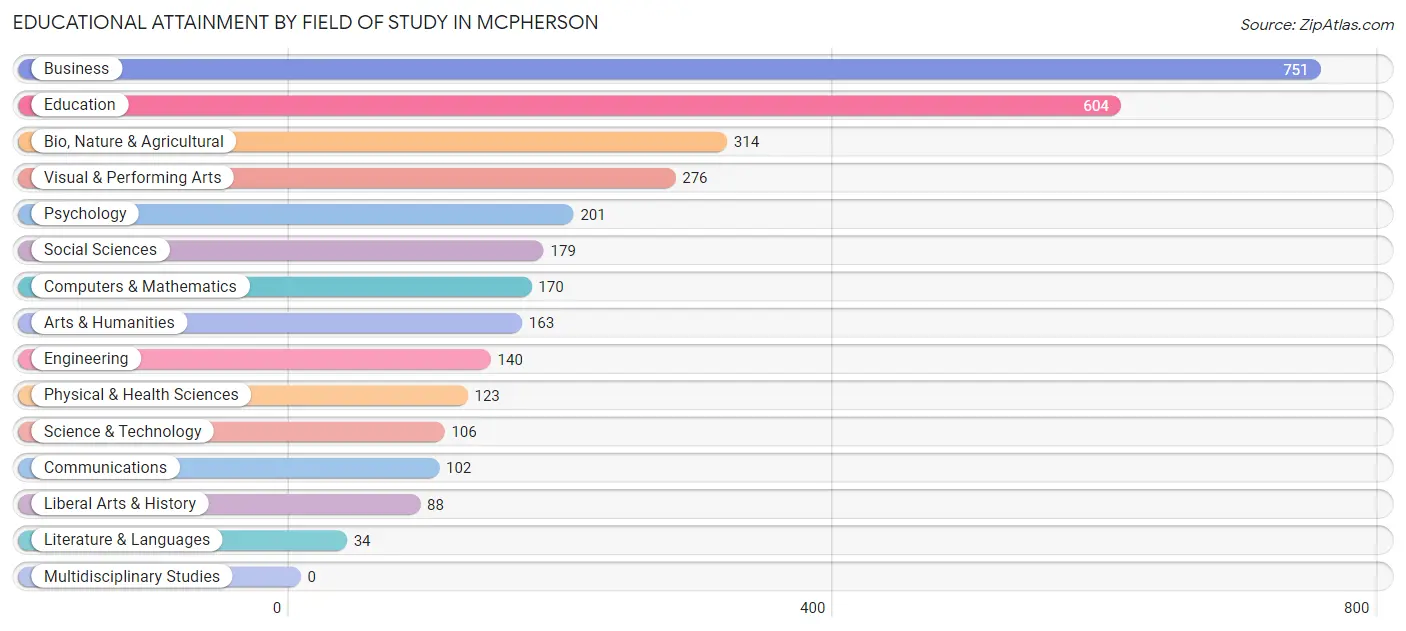
| Field of Study | # Graduates | % Graduates |
| Computers & Mathematics | 170 | 5.2% |
| Bio, Nature & Agricultural | 314 | 9.7% |
| Physical & Health Sciences | 123 | 3.8% |
| Psychology | 201 | 6.2% |
| Social Sciences | 179 | 5.5% |
| Engineering | 140 | 4.3% |
| Multidisciplinary Studies | 0 | 0.0% |
| Science & Technology | 106 | 3.3% |
| Business | 751 | 23.1% |
| Education | 604 | 18.6% |
| Literature & Languages | 34 | 1.1% |
| Liberal Arts & History | 88 | 2.7% |
| Visual & Performing Arts | 276 | 8.5% |
| Communications | 102 | 3.1% |
| Arts & Humanities | 163 | 5.0% |
| Total | 3,251 | 100.0% |
Transportation & Commute in Mcpherson
Vehicle Availability by Sex in Mcpherson
The most prevalent vehicle ownership categories in Mcpherson are males with 2 vehicles (1,839, accounting for 47.6%) and females with 2 vehicles (1,938, making up 53.1%).
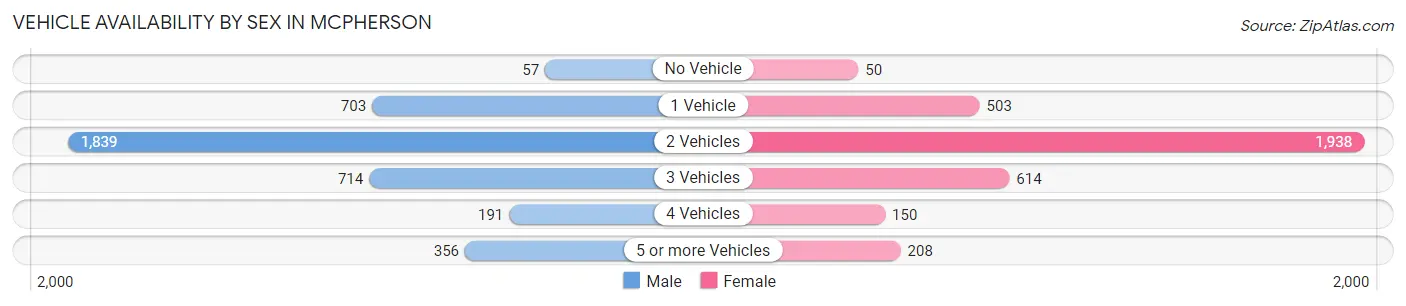
| Vehicles Available | Male | Female |
| No Vehicle | 57 (1.5%) | 50 (1.4%) |
| 1 Vehicle | 703 (18.2%) | 503 (14.5%) |
| 2 Vehicles | 1,839 (47.6%) | 1,938 (56.0%) |
| 3 Vehicles | 714 (18.5%) | 614 (17.7%) |
| 4 Vehicles | 191 (5.0%) | 150 (4.3%) |
| 5 or more Vehicles | 356 (9.2%) | 208 (6.0%) |
| Total | 3,860 (100.0%) | 3,463 (100.0%) |
Commute Time in Mcpherson
The most frequently occuring commute durations in Mcpherson are 5 to 9 minutes (3,209 commuters, 44.4%), 10 to 14 minutes (1,468 commuters, 20.3%), and less than 5 minutes (1,079 commuters, 14.9%).
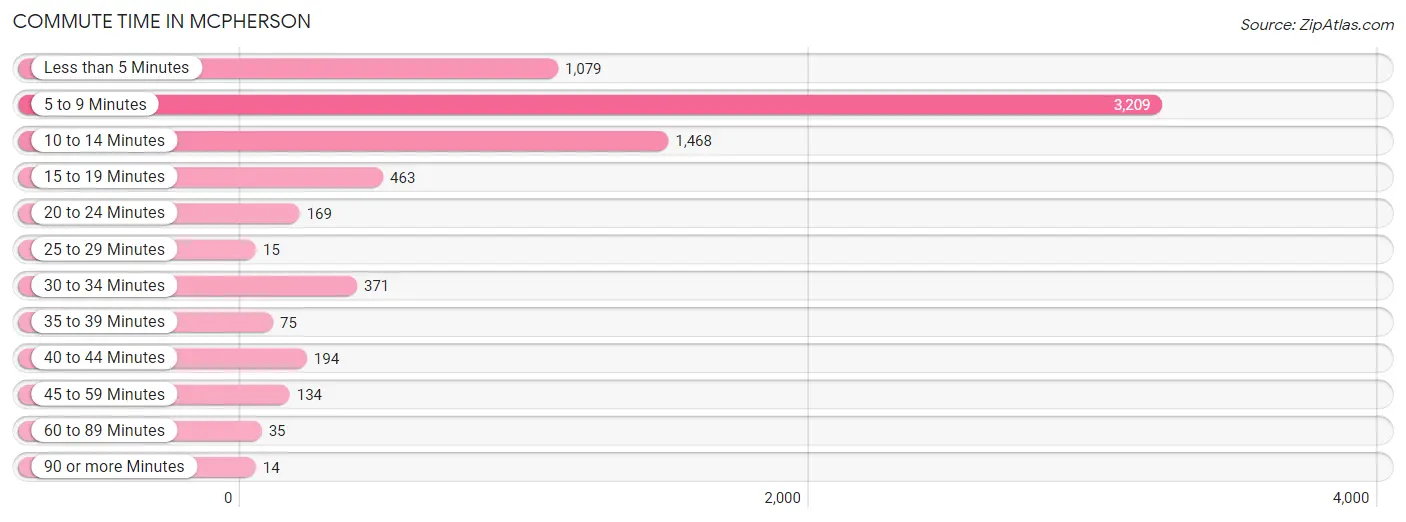
| Commute Time | # Commuters | % Commuters |
| Less than 5 Minutes | 1,079 | 14.9% |
| 5 to 9 Minutes | 3,209 | 44.4% |
| 10 to 14 Minutes | 1,468 | 20.3% |
| 15 to 19 Minutes | 463 | 6.4% |
| 20 to 24 Minutes | 169 | 2.3% |
| 25 to 29 Minutes | 15 | 0.2% |
| 30 to 34 Minutes | 371 | 5.1% |
| 35 to 39 Minutes | 75 | 1.0% |
| 40 to 44 Minutes | 194 | 2.7% |
| 45 to 59 Minutes | 134 | 1.8% |
| 60 to 89 Minutes | 35 | 0.5% |
| 90 or more Minutes | 14 | 0.2% |
Commute Time by Sex in Mcpherson
The most common commute times in Mcpherson are 5 to 9 minutes (1,507 commuters, 39.3%) for males and 5 to 9 minutes (1,702 commuters, 50.2%) for females.
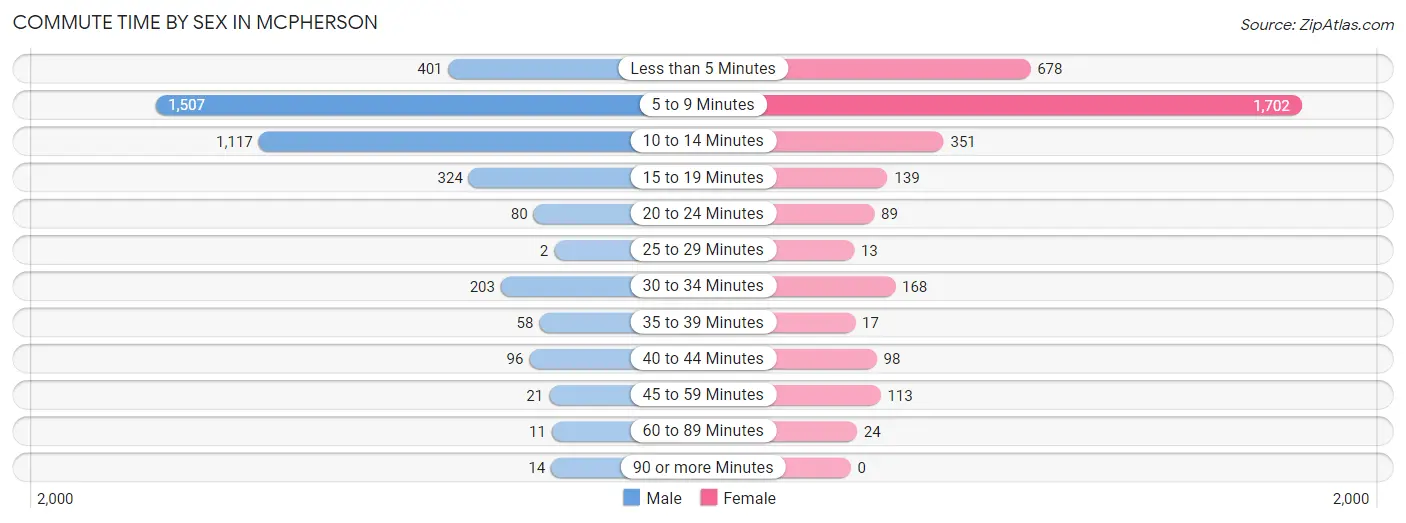
| Commute Time | Male | Female |
| Less than 5 Minutes | 401 (10.5%) | 678 (20.0%) |
| 5 to 9 Minutes | 1,507 (39.3%) | 1,702 (50.2%) |
| 10 to 14 Minutes | 1,117 (29.1%) | 351 (10.3%) |
| 15 to 19 Minutes | 324 (8.5%) | 139 (4.1%) |
| 20 to 24 Minutes | 80 (2.1%) | 89 (2.6%) |
| 25 to 29 Minutes | 2 (0.1%) | 13 (0.4%) |
| 30 to 34 Minutes | 203 (5.3%) | 168 (5.0%) |
| 35 to 39 Minutes | 58 (1.5%) | 17 (0.5%) |
| 40 to 44 Minutes | 96 (2.5%) | 98 (2.9%) |
| 45 to 59 Minutes | 21 (0.5%) | 113 (3.3%) |
| 60 to 89 Minutes | 11 (0.3%) | 24 (0.7%) |
| 90 or more Minutes | 14 (0.4%) | 0 (0.0%) |
Time of Departure to Work by Sex in Mcpherson
The most frequent times of departure to work in Mcpherson are 7:30 AM to 7:59 AM (665, 17.3%) for males and 7:30 AM to 7:59 AM (883, 26.0%) for females.
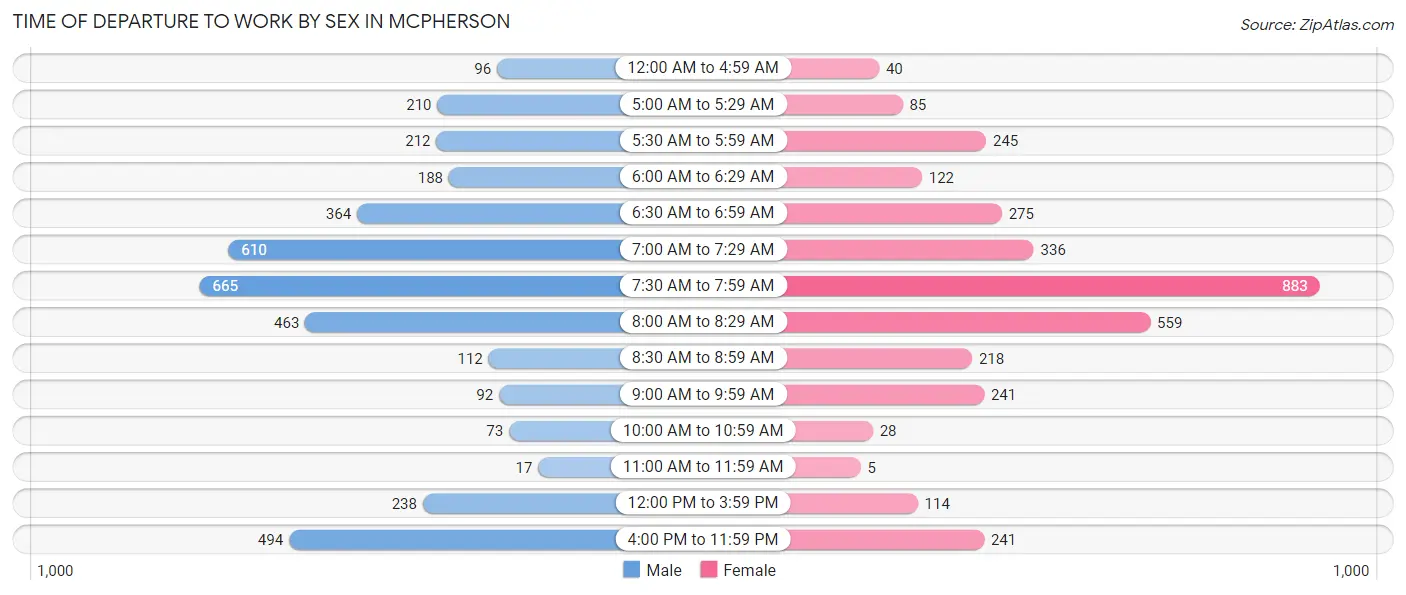
| Time of Departure | Male | Female |
| 12:00 AM to 4:59 AM | 96 (2.5%) | 40 (1.2%) |
| 5:00 AM to 5:29 AM | 210 (5.5%) | 85 (2.5%) |
| 5:30 AM to 5:59 AM | 212 (5.5%) | 245 (7.2%) |
| 6:00 AM to 6:29 AM | 188 (4.9%) | 122 (3.6%) |
| 6:30 AM to 6:59 AM | 364 (9.5%) | 275 (8.1%) |
| 7:00 AM to 7:29 AM | 610 (15.9%) | 336 (9.9%) |
| 7:30 AM to 7:59 AM | 665 (17.3%) | 883 (26.0%) |
| 8:00 AM to 8:29 AM | 463 (12.1%) | 559 (16.5%) |
| 8:30 AM to 8:59 AM | 112 (2.9%) | 218 (6.4%) |
| 9:00 AM to 9:59 AM | 92 (2.4%) | 241 (7.1%) |
| 10:00 AM to 10:59 AM | 73 (1.9%) | 28 (0.8%) |
| 11:00 AM to 11:59 AM | 17 (0.4%) | 5 (0.2%) |
| 12:00 PM to 3:59 PM | 238 (6.2%) | 114 (3.4%) |
| 4:00 PM to 11:59 PM | 494 (12.9%) | 241 (7.1%) |
| Total | 3,834 (100.0%) | 3,392 (100.0%) |
Housing Occupancy in Mcpherson
Occupancy by Ownership in Mcpherson
Of the total 5,903 dwellings in Mcpherson, owner-occupied units account for 4,027 (68.2%), while renter-occupied units make up 1,876 (31.8%).
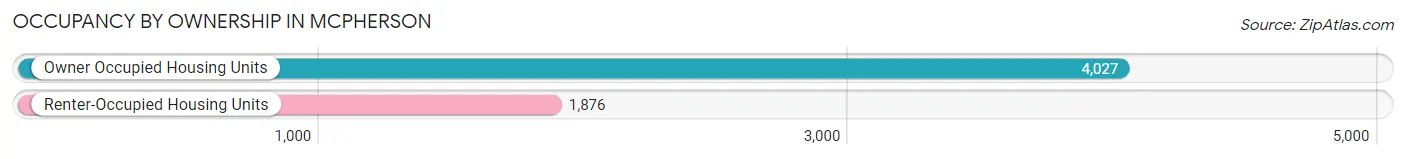
| Occupancy | # Housing Units | % Housing Units |
| Owner Occupied Housing Units | 4,027 | 68.2% |
| Renter-Occupied Housing Units | 1,876 | 31.8% |
| Total Occupied Housing Units | 5,903 | 100.0% |
Occupancy by Household Size in Mcpherson
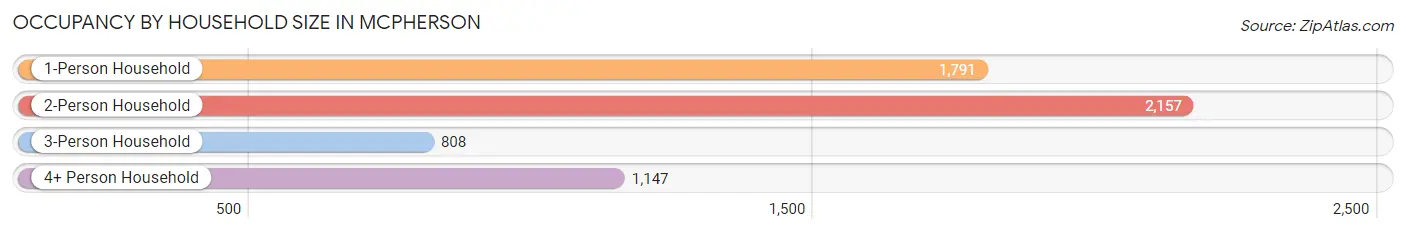
| Household Size | # Housing Units | % Housing Units |
| 1-Person Household | 1,791 | 30.3% |
| 2-Person Household | 2,157 | 36.5% |
| 3-Person Household | 808 | 13.7% |
| 4+ Person Household | 1,147 | 19.4% |
| Total Housing Units | 5,903 | 100.0% |
Occupancy by Ownership by Household Size in Mcpherson
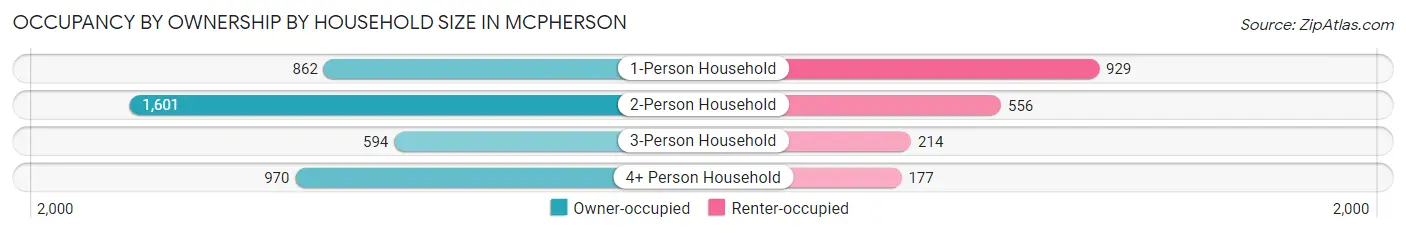
| Household Size | Owner-occupied | Renter-occupied |
| 1-Person Household | 862 (48.1%) | 929 (51.9%) |
| 2-Person Household | 1,601 (74.2%) | 556 (25.8%) |
| 3-Person Household | 594 (73.5%) | 214 (26.5%) |
| 4+ Person Household | 970 (84.6%) | 177 (15.4%) |
| Total Housing Units | 4,027 (68.2%) | 1,876 (31.8%) |
Occupancy by Educational Attainment in Mcpherson
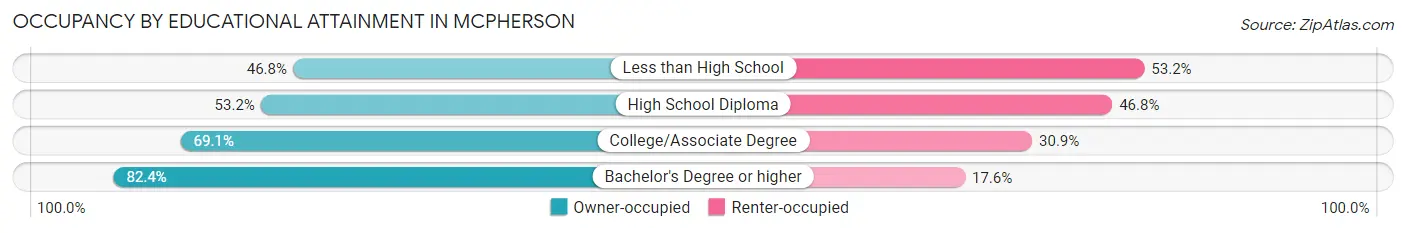
| Household Size | Owner-occupied | Renter-occupied |
| Less than High School | 103 (46.8%) | 117 (53.2%) |
| High School Diploma | 782 (53.2%) | 688 (46.8%) |
| College/Associate Degree | 1,707 (69.1%) | 764 (30.9%) |
| Bachelor's Degree or higher | 1,435 (82.4%) | 307 (17.6%) |
Occupancy by Age of Householder in Mcpherson
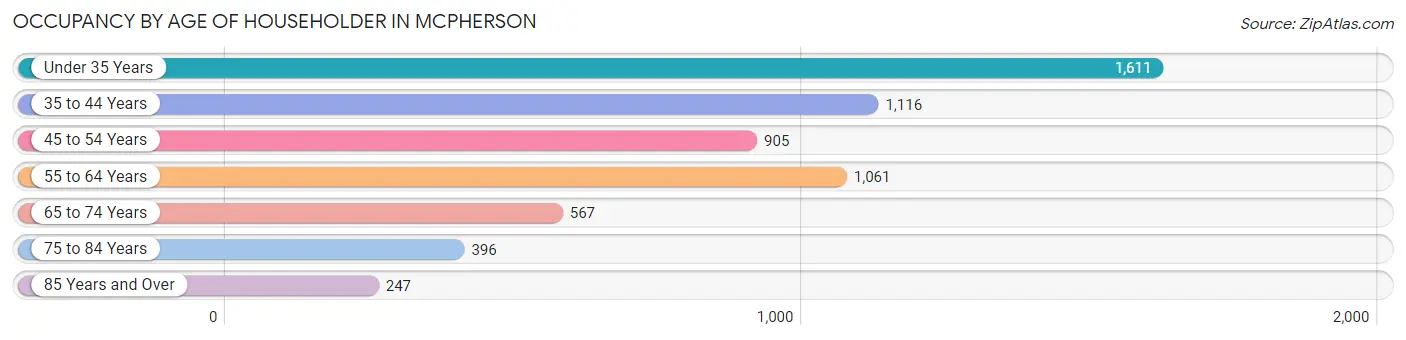
| Age Bracket | # Households | % Households |
| Under 35 Years | 1,611 | 27.3% |
| 35 to 44 Years | 1,116 | 18.9% |
| 45 to 54 Years | 905 | 15.3% |
| 55 to 64 Years | 1,061 | 18.0% |
| 65 to 74 Years | 567 | 9.6% |
| 75 to 84 Years | 396 | 6.7% |
| 85 Years and Over | 247 | 4.2% |
| Total | 5,903 | 100.0% |
Housing Finances in Mcpherson
Median Income by Occupancy in Mcpherson
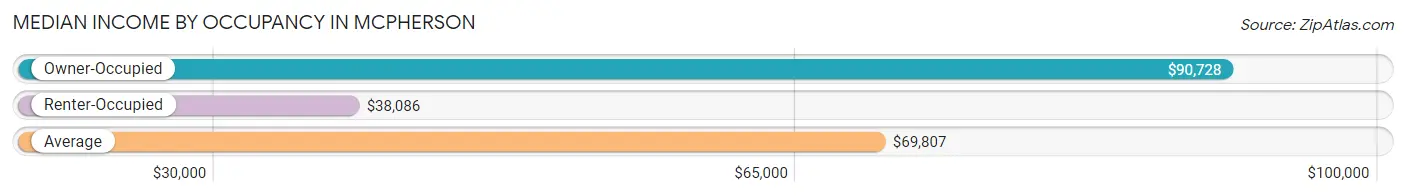
| Occupancy Type | # Households | Median Income |
| Owner-Occupied | 4,027 (68.2%) | $90,728 |
| Renter-Occupied | 1,876 (31.8%) | $38,086 |
| Average | 5,903 (100.0%) | $69,807 |
Occupancy by Householder Income Bracket in Mcpherson
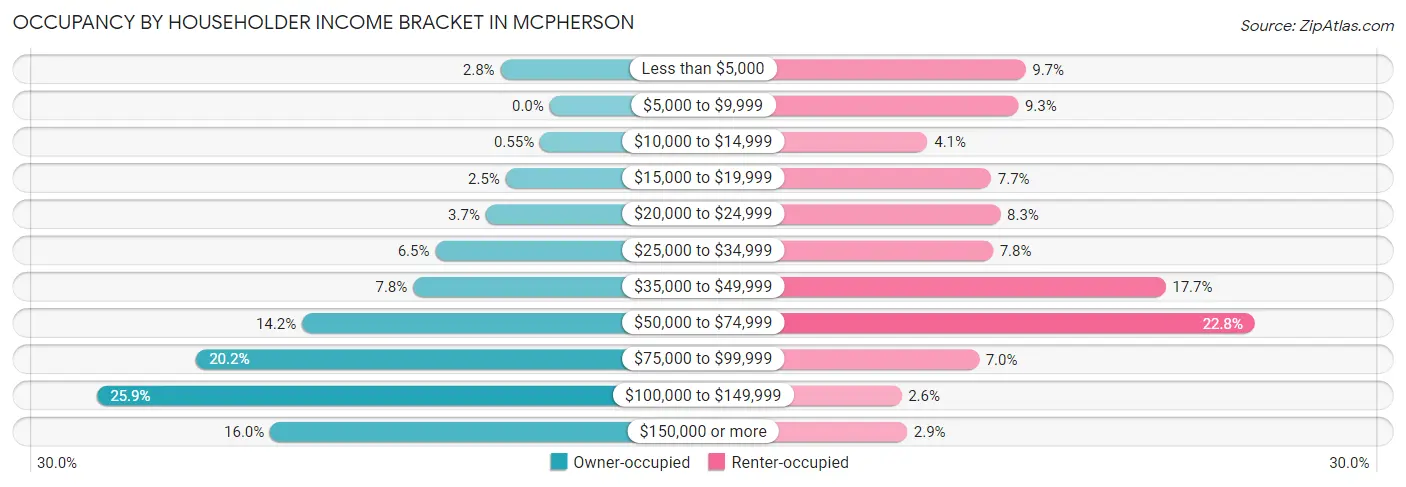
| Income Bracket | Owner-occupied | Renter-occupied |
| Less than $5,000 | 113 (2.8%) | 182 (9.7%) |
| $5,000 to $9,999 | 0 (0.0%) | 174 (9.3%) |
| $10,000 to $14,999 | 22 (0.5%) | 77 (4.1%) |
| $15,000 to $19,999 | 101 (2.5%) | 145 (7.7%) |
| $20,000 to $24,999 | 147 (3.6%) | 155 (8.3%) |
| $25,000 to $34,999 | 263 (6.5%) | 147 (7.8%) |
| $35,000 to $49,999 | 314 (7.8%) | 332 (17.7%) |
| $50,000 to $74,999 | 570 (14.1%) | 428 (22.8%) |
| $75,000 to $99,999 | 813 (20.2%) | 132 (7.0%) |
| $100,000 to $149,999 | 1,041 (25.9%) | 49 (2.6%) |
| $150,000 or more | 643 (16.0%) | 55 (2.9%) |
| Total | 4,027 (100.0%) | 1,876 (100.0%) |
Monthly Housing Cost Tiers in Mcpherson
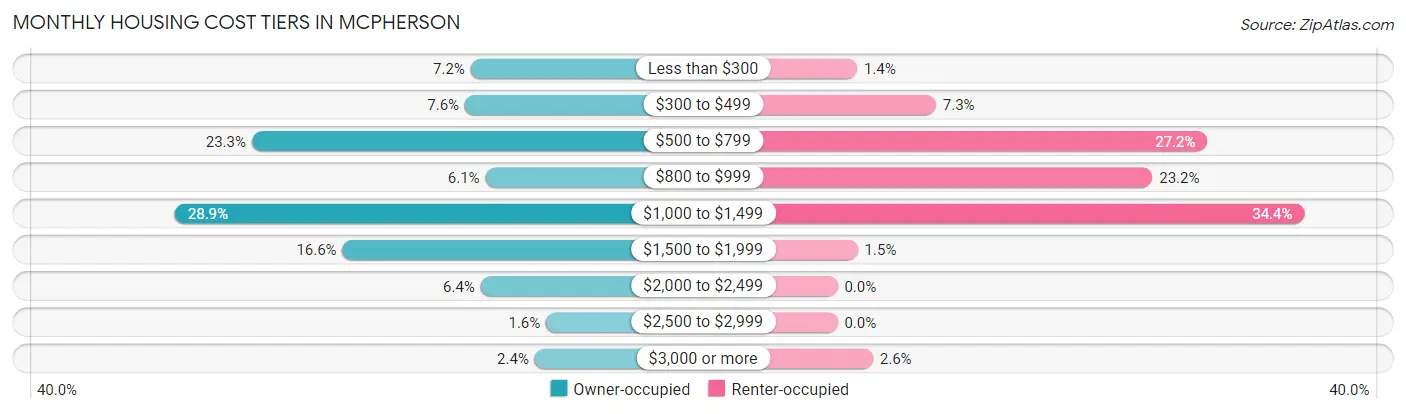
| Monthly Cost | Owner-occupied | Renter-occupied |
| Less than $300 | 288 (7.1%) | 27 (1.4%) |
| $300 to $499 | 305 (7.6%) | 136 (7.2%) |
| $500 to $799 | 937 (23.3%) | 511 (27.2%) |
| $800 to $999 | 244 (6.1%) | 435 (23.2%) |
| $1,000 to $1,499 | 1,165 (28.9%) | 645 (34.4%) |
| $1,500 to $1,999 | 668 (16.6%) | 28 (1.5%) |
| $2,000 to $2,499 | 258 (6.4%) | 0 (0.0%) |
| $2,500 to $2,999 | 64 (1.6%) | 0 (0.0%) |
| $3,000 or more | 98 (2.4%) | 49 (2.6%) |
| Total | 4,027 (100.0%) | 1,876 (100.0%) |
Physical Housing Characteristics in Mcpherson
Housing Structures in Mcpherson
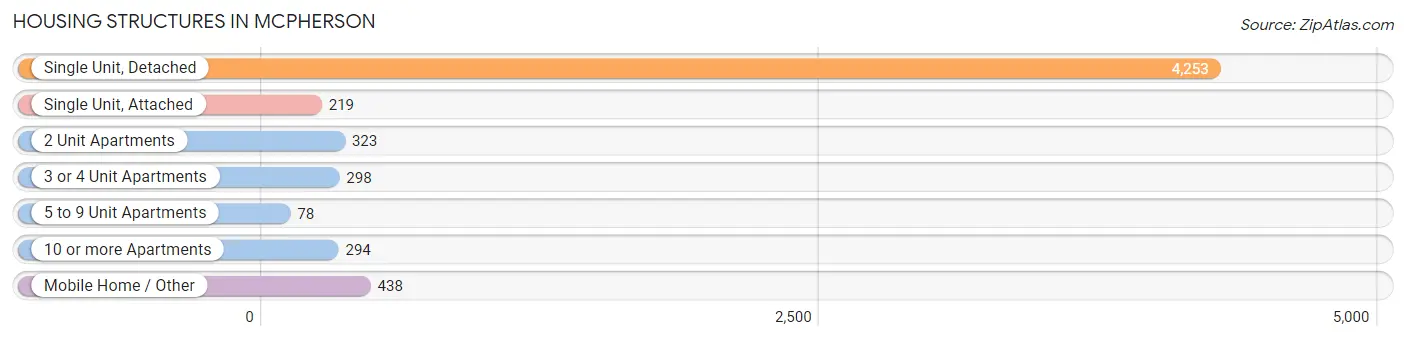
| Structure Type | # Housing Units | % Housing Units |
| Single Unit, Detached | 4,253 | 72.1% |
| Single Unit, Attached | 219 | 3.7% |
| 2 Unit Apartments | 323 | 5.5% |
| 3 or 4 Unit Apartments | 298 | 5.1% |
| 5 to 9 Unit Apartments | 78 | 1.3% |
| 10 or more Apartments | 294 | 5.0% |
| Mobile Home / Other | 438 | 7.4% |
| Total | 5,903 | 100.0% |
Housing Structures by Occupancy in Mcpherson
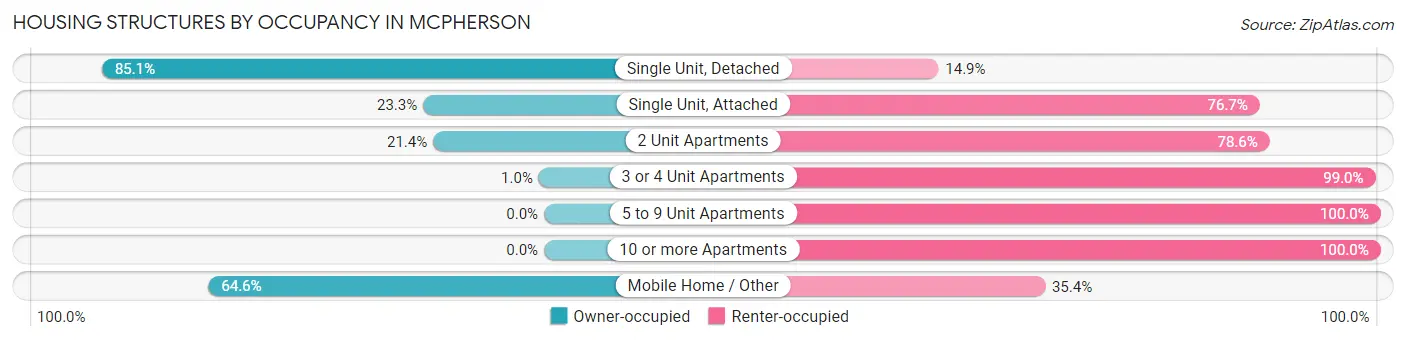
| Structure Type | Owner-occupied | Renter-occupied |
| Single Unit, Detached | 3,621 (85.1%) | 632 (14.9%) |
| Single Unit, Attached | 51 (23.3%) | 168 (76.7%) |
| 2 Unit Apartments | 69 (21.4%) | 254 (78.6%) |
| 3 or 4 Unit Apartments | 3 (1.0%) | 295 (99.0%) |
| 5 to 9 Unit Apartments | 0 (0.0%) | 78 (100.0%) |
| 10 or more Apartments | 0 (0.0%) | 294 (100.0%) |
| Mobile Home / Other | 283 (64.6%) | 155 (35.4%) |
| Total | 4,027 (68.2%) | 1,876 (31.8%) |
Housing Structures by Number of Rooms in Mcpherson
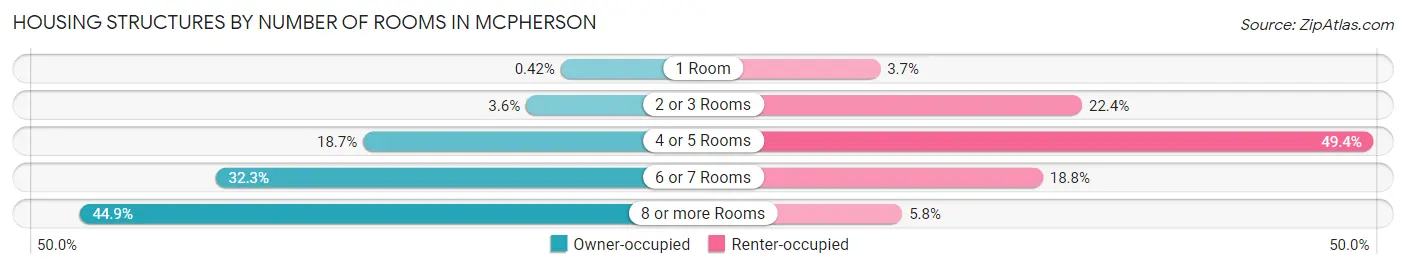
| Number of Rooms | Owner-occupied | Renter-occupied |
| 1 Room | 17 (0.4%) | 70 (3.7%) |
| 2 or 3 Rooms | 146 (3.6%) | 420 (22.4%) |
| 4 or 5 Rooms | 753 (18.7%) | 926 (49.4%) |
| 6 or 7 Rooms | 1,302 (32.3%) | 352 (18.8%) |
| 8 or more Rooms | 1,809 (44.9%) | 108 (5.8%) |
| Total | 4,027 (100.0%) | 1,876 (100.0%) |
Housing Structure by Heating Type in Mcpherson
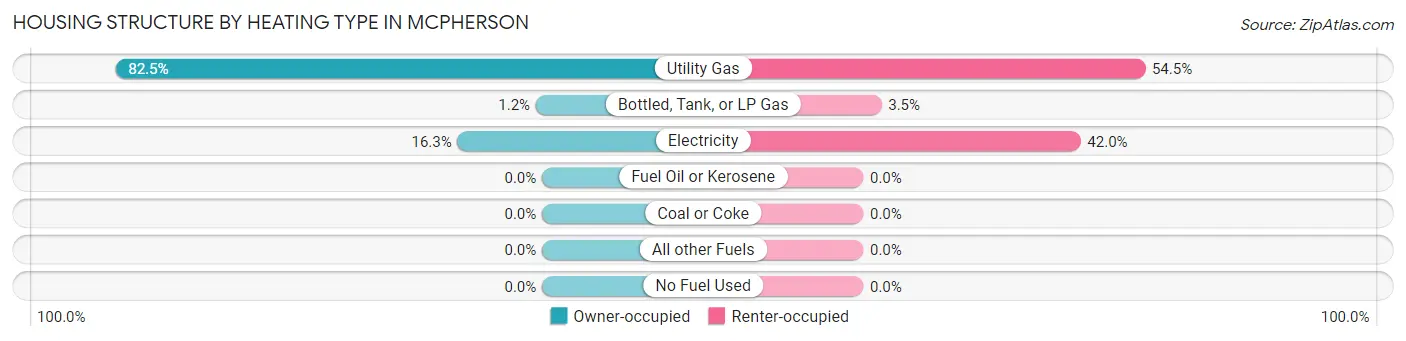
| Heating Type | Owner-occupied | Renter-occupied |
| Utility Gas | 3,321 (82.5%) | 1,022 (54.5%) |
| Bottled, Tank, or LP Gas | 48 (1.2%) | 66 (3.5%) |
| Electricity | 658 (16.3%) | 788 (42.0%) |
| Fuel Oil or Kerosene | 0 (0.0%) | 0 (0.0%) |
| Coal or Coke | 0 (0.0%) | 0 (0.0%) |
| All other Fuels | 0 (0.0%) | 0 (0.0%) |
| No Fuel Used | 0 (0.0%) | 0 (0.0%) |
| Total | 4,027 (100.0%) | 1,876 (100.0%) |
Household Vehicle Usage in Mcpherson
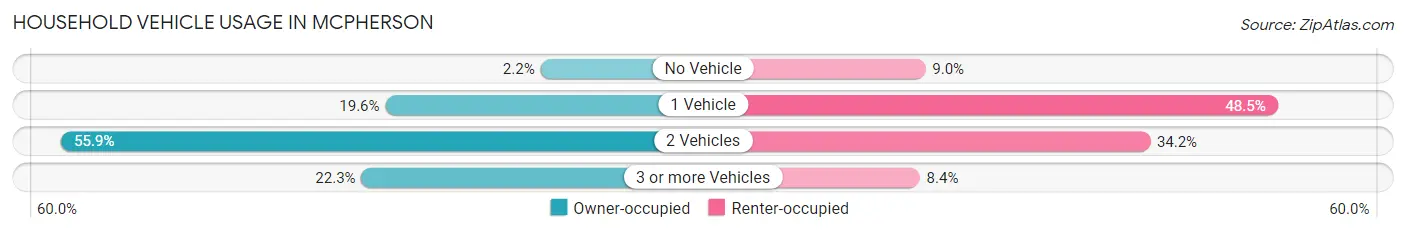
| Vehicles per Household | Owner-occupied | Renter-occupied |
| No Vehicle | 89 (2.2%) | 169 (9.0%) |
| 1 Vehicle | 789 (19.6%) | 909 (48.4%) |
| 2 Vehicles | 2,252 (55.9%) | 641 (34.2%) |
| 3 or more Vehicles | 897 (22.3%) | 157 (8.4%) |
| Total | 4,027 (100.0%) | 1,876 (100.0%) |
Real Estate & Mortgages in Mcpherson
Real Estate and Mortgage Overview in Mcpherson
| Characteristic | Without Mortgage | With Mortgage |
| Housing Units | 1,549 | 2,478 |
| Median Property Value | $169,200 | $201,900 |
| Median Household Income | $71,279 | $512 |
| Monthly Housing Costs | $610 | $98 |
| Real Estate Taxes | $2,848 | $92 |
Property Value by Mortgage Status in Mcpherson
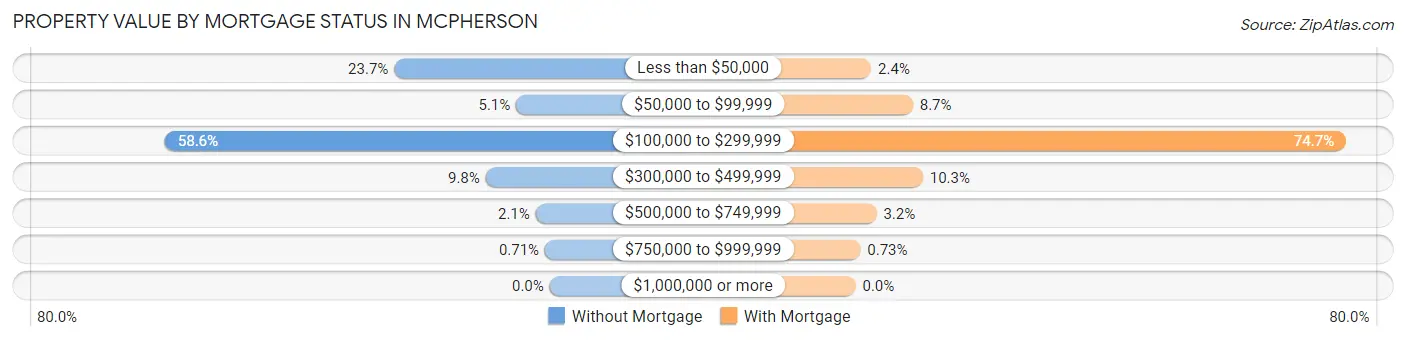
| Property Value | Without Mortgage | With Mortgage |
| Less than $50,000 | 367 (23.7%) | 59 (2.4%) |
| $50,000 to $99,999 | 79 (5.1%) | 216 (8.7%) |
| $100,000 to $299,999 | 908 (58.6%) | 1,852 (74.7%) |
| $300,000 to $499,999 | 151 (9.8%) | 254 (10.2%) |
| $500,000 to $749,999 | 33 (2.1%) | 79 (3.2%) |
| $750,000 to $999,999 | 11 (0.7%) | 18 (0.7%) |
| $1,000,000 or more | 0 (0.0%) | 0 (0.0%) |
| Total | 1,549 (100.0%) | 2,478 (100.0%) |
Household Income by Mortgage Status in Mcpherson
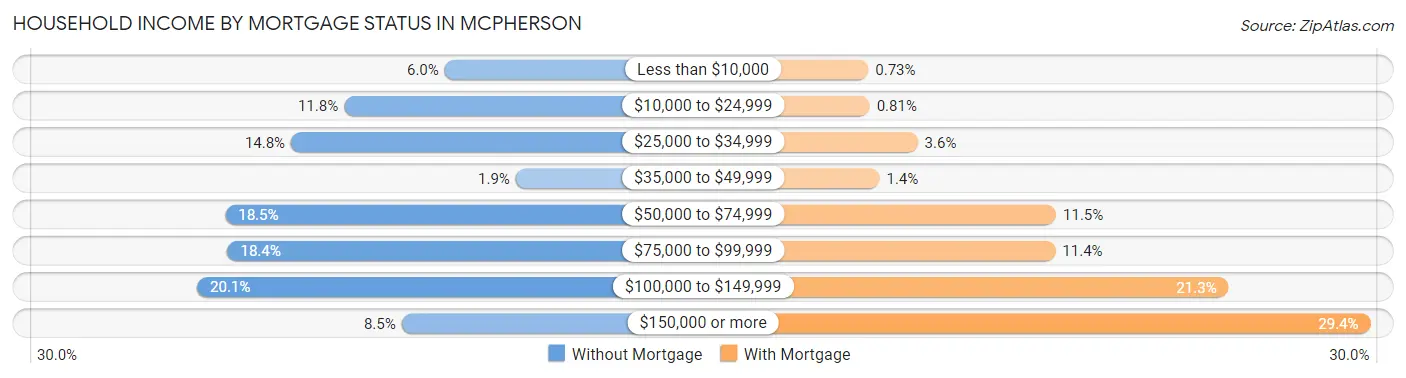
| Household Income | Without Mortgage | With Mortgage |
| Less than $10,000 | 93 (6.0%) | 18 (0.7%) |
| $10,000 to $24,999 | 182 (11.7%) | 20 (0.8%) |
| $25,000 to $34,999 | 229 (14.8%) | 88 (3.5%) |
| $35,000 to $49,999 | 30 (1.9%) | 34 (1.4%) |
| $50,000 to $74,999 | 287 (18.5%) | 284 (11.5%) |
| $75,000 to $99,999 | 285 (18.4%) | 283 (11.4%) |
| $100,000 to $149,999 | 312 (20.1%) | 528 (21.3%) |
| $150,000 or more | 131 (8.5%) | 729 (29.4%) |
| Total | 1,549 (100.0%) | 2,478 (100.0%) |
Property Value to Household Income Ratio in Mcpherson
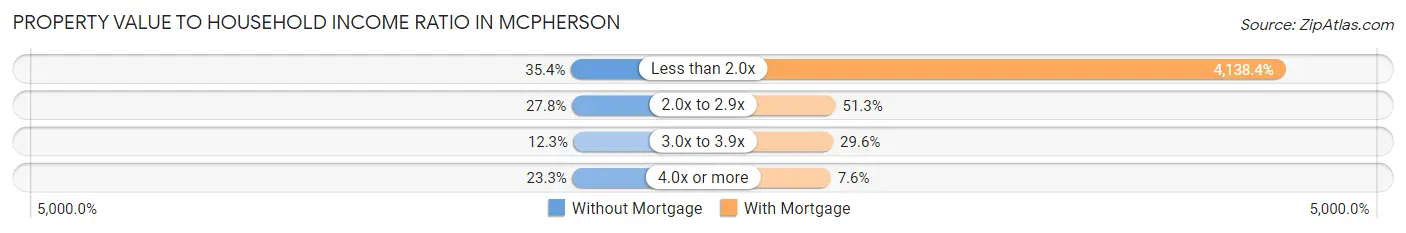
| Value-to-Income Ratio | Without Mortgage | With Mortgage |
| Less than 2.0x | 549 (35.4%) | 102,550 (4,138.4%) |
| 2.0x to 2.9x | 430 (27.8%) | 1,271 (51.3%) |
| 3.0x to 3.9x | 190 (12.3%) | 733 (29.6%) |
| 4.0x or more | 361 (23.3%) | 188 (7.6%) |
| Total | 1,549 (100.0%) | 2,478 (100.0%) |
Real Estate Taxes by Mortgage Status in Mcpherson
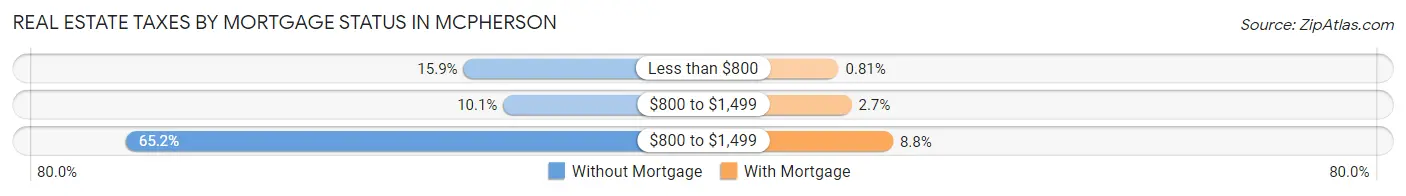
| Property Taxes | Without Mortgage | With Mortgage |
| Less than $800 | 246 (15.9%) | 20 (0.8%) |
| $800 to $1,499 | 156 (10.1%) | 67 (2.7%) |
| $800 to $1,499 | 1,010 (65.2%) | 217 (8.8%) |
| Total | 1,549 (100.0%) | 2,478 (100.0%) |
Health & Disability in Mcpherson
Health Insurance Coverage by Age in Mcpherson
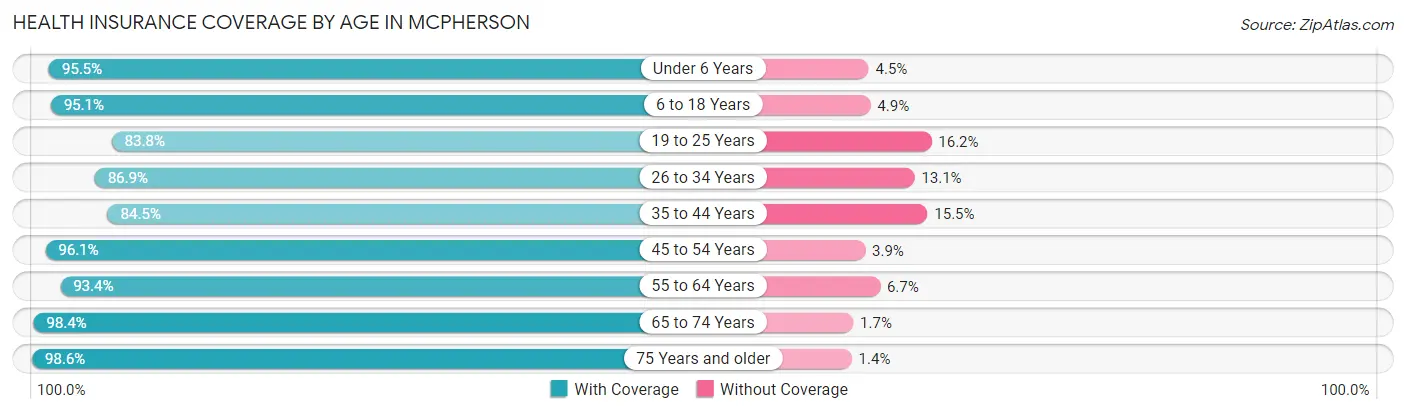
| Age Bracket | With Coverage | Without Coverage |
| Under 6 Years | 548 (95.5%) | 26 (4.5%) |
| 6 to 18 Years | 2,304 (95.1%) | 118 (4.9%) |
| 19 to 25 Years | 1,775 (83.8%) | 344 (16.2%) |
| 26 to 34 Years | 1,396 (86.9%) | 210 (13.1%) |
| 35 to 44 Years | 1,544 (84.5%) | 283 (15.5%) |
| 45 to 54 Years | 1,486 (96.1%) | 60 (3.9%) |
| 55 to 64 Years | 1,515 (93.3%) | 108 (6.7%) |
| 65 to 74 Years | 1,076 (98.4%) | 18 (1.7%) |
| 75 Years and older | 861 (98.6%) | 12 (1.4%) |
| Total | 12,505 (91.4%) | 1,179 (8.6%) |
Health Insurance Coverage by Citizenship Status in Mcpherson
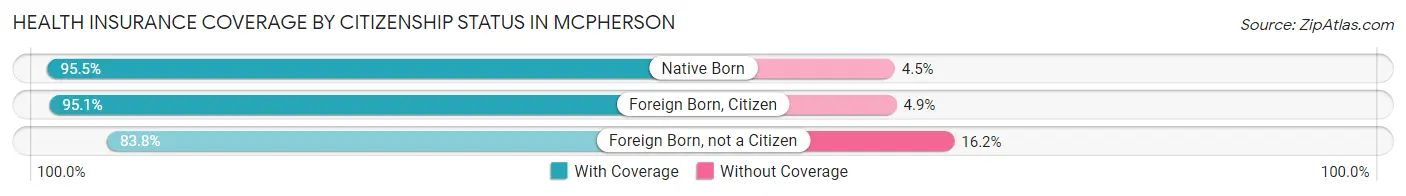
| Citizenship Status | With Coverage | Without Coverage |
| Native Born | 548 (95.5%) | 26 (4.5%) |
| Foreign Born, Citizen | 2,304 (95.1%) | 118 (4.9%) |
| Foreign Born, not a Citizen | 1,775 (83.8%) | 344 (16.2%) |
Health Insurance Coverage by Household Income in Mcpherson
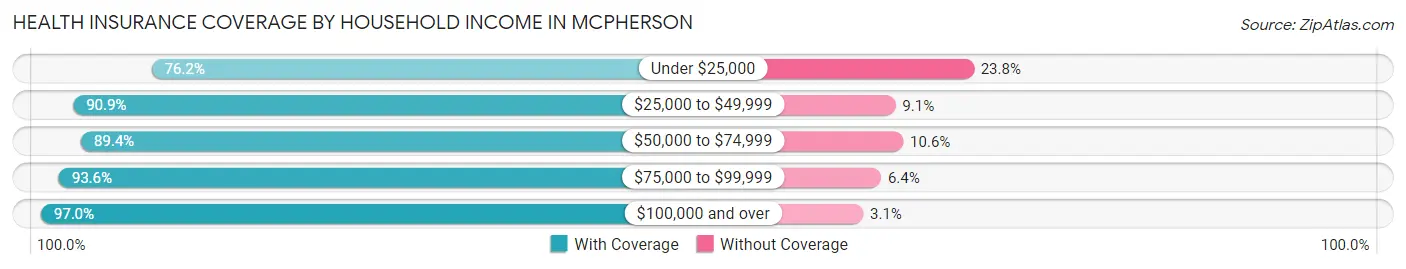
| Household Income | With Coverage | Without Coverage |
| Under $25,000 | 1,519 (76.2%) | 474 (23.8%) |
| $25,000 to $49,999 | 1,547 (90.9%) | 155 (9.1%) |
| $50,000 to $74,999 | 1,939 (89.4%) | 229 (10.6%) |
| $75,000 to $99,999 | 2,028 (93.6%) | 139 (6.4%) |
| $100,000 and over | 4,984 (97.0%) | 157 (3.0%) |
Public vs Private Health Insurance Coverage by Age in Mcpherson
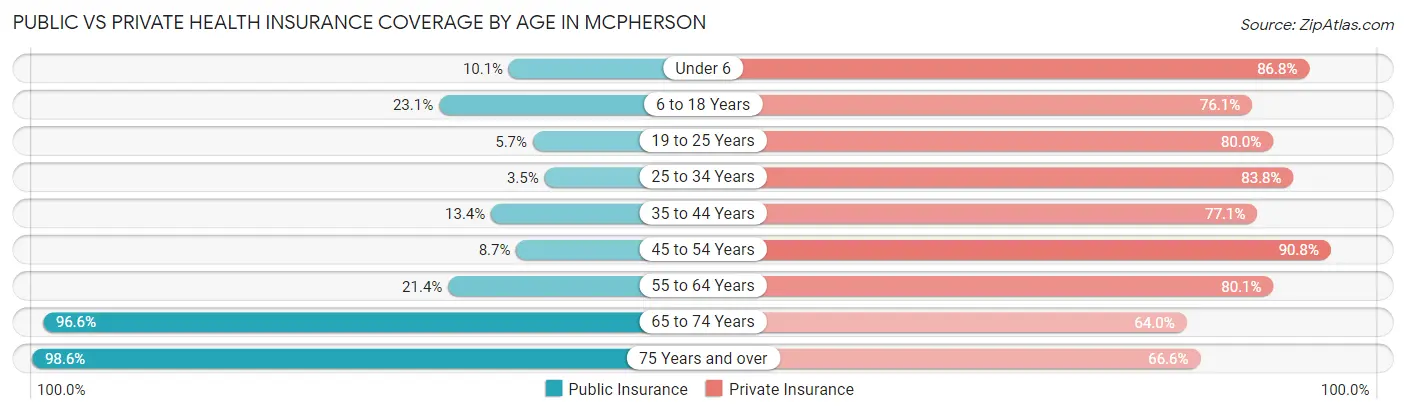
| Age Bracket | Public Insurance | Private Insurance |
| Under 6 | 58 (10.1%) | 498 (86.8%) |
| 6 to 18 Years | 559 (23.1%) | 1,844 (76.1%) |
| 19 to 25 Years | 120 (5.7%) | 1,696 (80.0%) |
| 25 to 34 Years | 56 (3.5%) | 1,346 (83.8%) |
| 35 to 44 Years | 245 (13.4%) | 1,409 (77.1%) |
| 45 to 54 Years | 135 (8.7%) | 1,403 (90.7%) |
| 55 to 64 Years | 347 (21.4%) | 1,300 (80.1%) |
| 65 to 74 Years | 1,057 (96.6%) | 700 (64.0%) |
| 75 Years and over | 861 (98.6%) | 581 (66.5%) |
| Total | 3,438 (25.1%) | 10,777 (78.8%) |
Disability Status by Sex by Age in Mcpherson
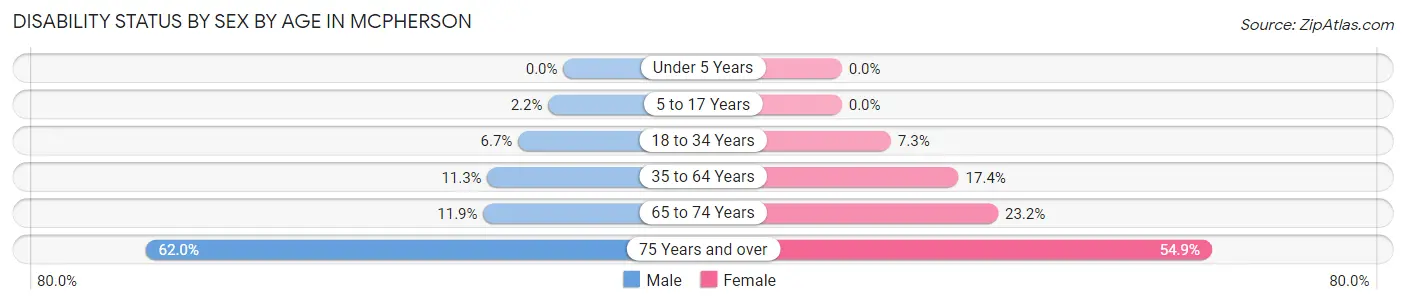
| Age Bracket | Male | Female |
| Under 5 Years | 0 (0.0%) | 0 (0.0%) |
| 5 to 17 Years | 26 (2.2%) | 0 (0.0%) |
| 18 to 34 Years | 143 (6.7%) | 127 (7.3%) |
| 35 to 64 Years | 276 (11.3%) | 442 (17.3%) |
| 65 to 74 Years | 69 (11.9%) | 119 (23.2%) |
| 75 Years and over | 196 (62.0%) | 306 (54.9%) |
Disability Class by Sex by Age in Mcpherson
Disability Class: Hearing Difficulty
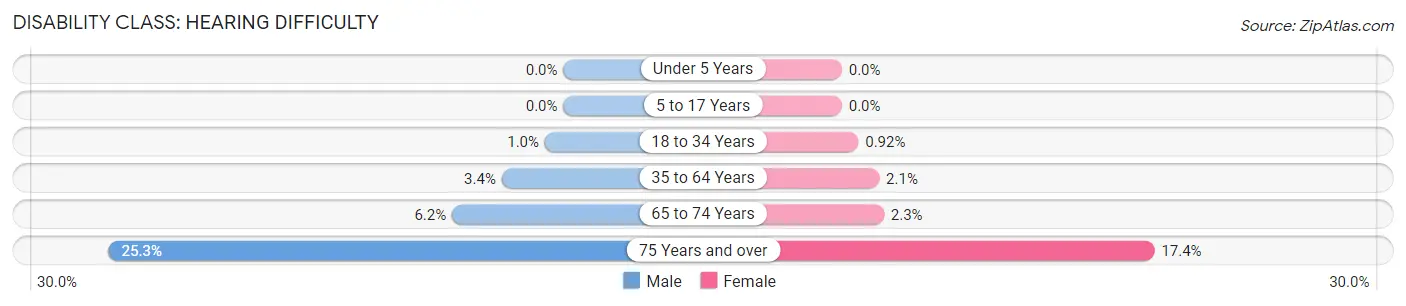
| Age Bracket | Male | Female |
| Under 5 Years | 0 (0.0%) | 0 (0.0%) |
| 5 to 17 Years | 0 (0.0%) | 0 (0.0%) |
| 18 to 34 Years | 22 (1.0%) | 16 (0.9%) |
| 35 to 64 Years | 84 (3.4%) | 53 (2.1%) |
| 65 to 74 Years | 36 (6.2%) | 12 (2.3%) |
| 75 Years and over | 80 (25.3%) | 97 (17.4%) |
Disability Class: Vision Difficulty
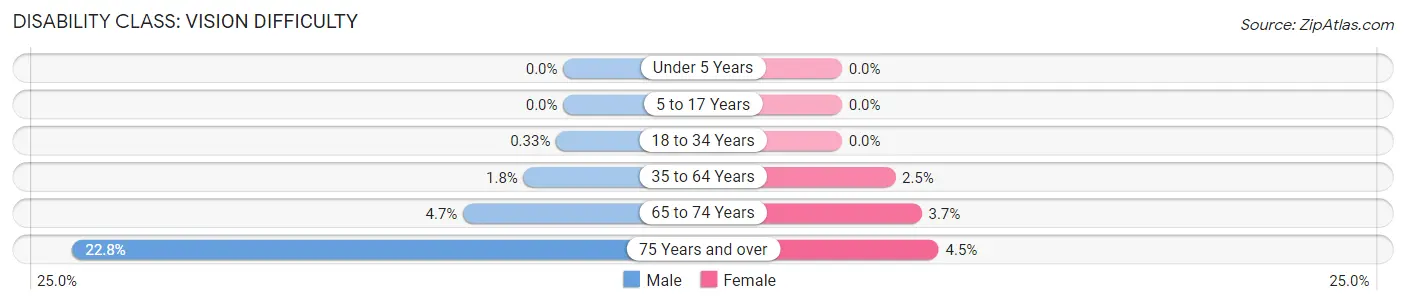
| Age Bracket | Male | Female |
| Under 5 Years | 0 (0.0%) | 0 (0.0%) |
| 5 to 17 Years | 0 (0.0%) | 0 (0.0%) |
| 18 to 34 Years | 7 (0.3%) | 0 (0.0%) |
| 35 to 64 Years | 45 (1.8%) | 63 (2.5%) |
| 65 to 74 Years | 27 (4.6%) | 19 (3.7%) |
| 75 Years and over | 72 (22.8%) | 25 (4.5%) |
Disability Class: Cognitive Difficulty
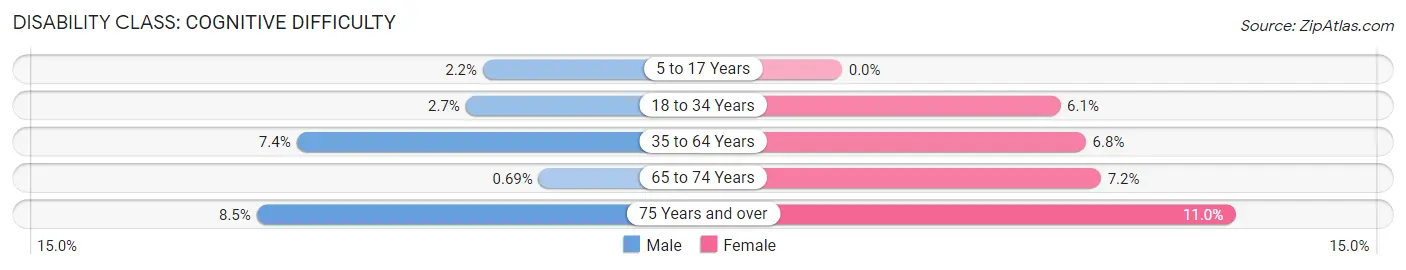
| Age Bracket | Male | Female |
| 5 to 17 Years | 26 (2.2%) | 0 (0.0%) |
| 18 to 34 Years | 58 (2.7%) | 106 (6.1%) |
| 35 to 64 Years | 182 (7.4%) | 173 (6.8%) |
| 65 to 74 Years | 4 (0.7%) | 37 (7.2%) |
| 75 Years and over | 27 (8.5%) | 61 (11.0%) |
Disability Class: Ambulatory Difficulty
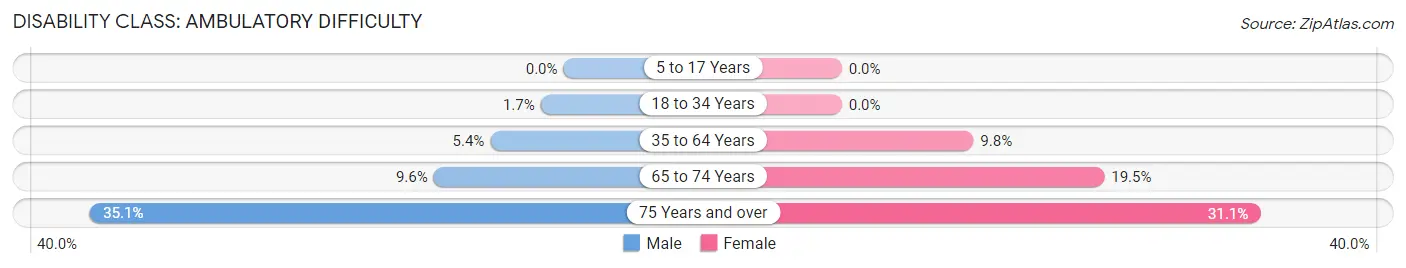
| Age Bracket | Male | Female |
| 5 to 17 Years | 0 (0.0%) | 0 (0.0%) |
| 18 to 34 Years | 36 (1.7%) | 0 (0.0%) |
| 35 to 64 Years | 133 (5.4%) | 249 (9.8%) |
| 65 to 74 Years | 56 (9.6%) | 100 (19.5%) |
| 75 Years and over | 111 (35.1%) | 173 (31.1%) |
Disability Class: Self-Care Difficulty
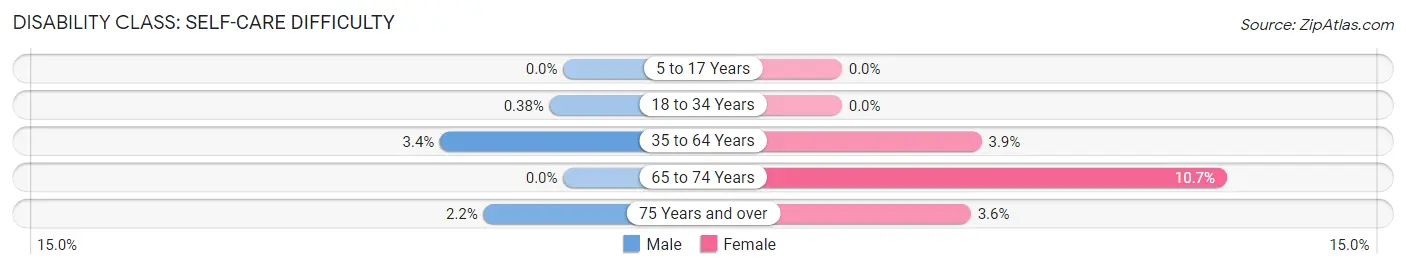
| Age Bracket | Male | Female |
| 5 to 17 Years | 0 (0.0%) | 0 (0.0%) |
| 18 to 34 Years | 8 (0.4%) | 0 (0.0%) |
| 35 to 64 Years | 84 (3.4%) | 99 (3.9%) |
| 65 to 74 Years | 0 (0.0%) | 55 (10.7%) |
| 75 Years and over | 7 (2.2%) | 20 (3.6%) |
Technology Access in Mcpherson
Computing Device Access in Mcpherson
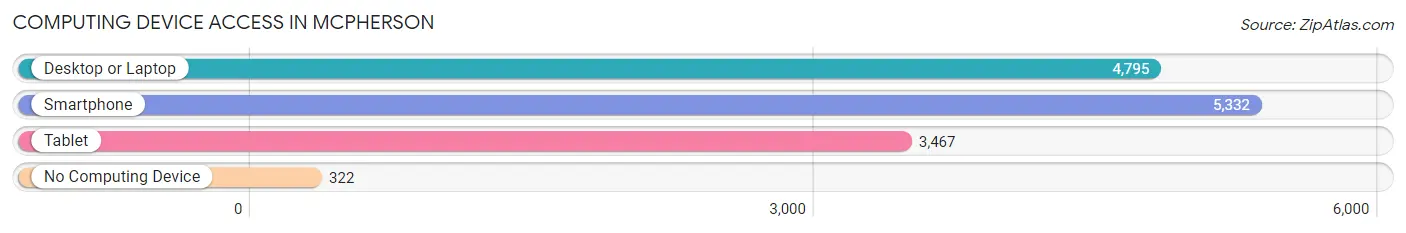
| Device Type | # Households | % Households |
| Desktop or Laptop | 4,795 | 81.2% |
| Smartphone | 5,332 | 90.3% |
| Tablet | 3,467 | 58.7% |
| No Computing Device | 322 | 5.4% |
| Total | 5,903 | 100.0% |
Internet Access in Mcpherson
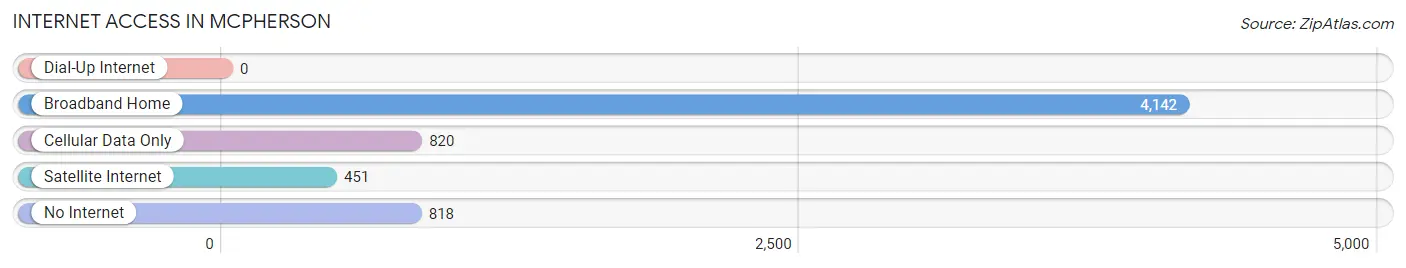
| Internet Type | # Households | % Households |
| Dial-Up Internet | 0 | 0.0% |
| Broadband Home | 4,142 | 70.2% |
| Cellular Data Only | 820 | 13.9% |
| Satellite Internet | 451 | 7.6% |
| No Internet | 818 | 13.9% |
| Total | 5,903 | 100.0% |
Mcpherson Summary
McPherson, Kansas is a city located in the central part of the state, in McPherson County. It is situated on the Smoky Hill River, and is the county seat of McPherson County. The city has a population of approximately 13,000 people, and is the home of McPherson College, a private liberal arts college.
History
McPherson was founded in 1872 by settlers from the nearby town of Salina. The town was named after General James B. McPherson, a Union general in the Civil War. The town was incorporated in 1875, and the first post office was established in 1876.
The city grew rapidly in the late 19th century, and by the early 20th century, it had become a major agricultural center. The city was also home to several manufacturing companies, including a flour mill, a creamery, and a canning factory.
In the 1950s, the city began to experience a decline in its manufacturing sector, and the population began to decline as well. However, in the late 1970s, the city began to experience a resurgence, and the population began to grow again.
Geography
McPherson is located in the central part of the state, in McPherson County. It is situated on the Smoky Hill River, and is the county seat of McPherson County. The city has a total area of 8.2 square miles, of which 8.1 square miles is land and 0.1 square miles is water.
The city is located in the Central Plains region of the United States, and is characterized by flat terrain and rolling hills. The climate is characterized by hot, humid summers and cold, dry winters.
Economy
McPherson’s economy is largely based on agriculture and manufacturing. The city is home to several large agricultural companies, including Cargill, Inc., and Tyson Foods. The city is also home to several manufacturing companies, including a flour mill, a creamery, and a canning factory.
The city is also home to several retail stores, including Walmart, Target, and Kohl’s. The city is also home to several restaurants, including Applebee’s, Chili’s, and Olive Garden.
Demographics
As of the 2010 census, the population of McPherson was 13,155. The racial makeup of the city was 92.3% White, 2.3% African American, 0.4% Native American, 0.9% Asian, 0.1% Pacific Islander, 1.7% from other races, and 2.3% from two or more races. Hispanic or Latino of any race were 4.2% of the population.
The median income for a household in the city was $45,945, and the median income for a family was $54,945. The per capita income for the city was $21,945. About 8.3% of families and 11.2% of the population were below the poverty line, including 15.2% of those under age 18 and 8.2% of those age 65 or over.
Common Questions
What is Per Capita Income in Mcpherson?
Per Capita income in Mcpherson is $33,449.
What is the Median Family Income in Mcpherson?
Median Family Income in Mcpherson is $90,208.
What is the Median Household income in Mcpherson?
Median Household Income in Mcpherson is $69,807.
What is Income or Wage Gap in Mcpherson?
Income or Wage Gap in Mcpherson is 35.9%.
Women in Mcpherson earn 64.1 cents for every dollar earned by a man.
What is Inequality or Gini Index in Mcpherson?
Inequality or Gini Index in Mcpherson is 0.40.
What is the Total Population of Mcpherson?
Total Population of Mcpherson is 13,955.
What is the Total Male Population of Mcpherson?
Total Male Population of Mcpherson is 7,043.
What is the Total Female Population of Mcpherson?
Total Female Population of Mcpherson is 6,912.
What is the Ratio of Males per 100 Females in Mcpherson?
There are 101.90 Males per 100 Females in Mcpherson.
What is the Ratio of Females per 100 Males in Mcpherson?
There are 98.14 Females per 100 Males in Mcpherson.
What is the Median Population Age in Mcpherson?
Median Population Age in Mcpherson is 36.2 Years.
What is the Average Family Size in Mcpherson
Average Family Size in Mcpherson is 2.8 People.
What is the Average Household Size in Mcpherson
Average Household Size in Mcpherson is 2.2 People.
How Large is the Labor Force in Mcpherson?
There are 7,798 People in the Labor Forcein in Mcpherson.
What is the Percentage of People in the Labor Force in Mcpherson?
67.9% of People are in the Labor Force in Mcpherson.
What is the Unemployment Rate in Mcpherson?
Unemployment Rate in Mcpherson is 2.8%.