Atwood, KS Map & Demographics
Atwood Map
Atwood Overview
$38,920
PER CAPITA INCOME
$78,250
AVG FAMILY INCOME
$65,714
AVG HOUSEHOLD INCOME
27.7%
WAGE / INCOME GAP [ % ]
72.3¢/ $1
WAGE / INCOME GAP [ $ ]
$12,650
FAMILY INCOME DEFICIT
0.42
INEQUALITY / GINI INDEX
1,238
TOTAL POPULATION
613
MALE POPULATION
625
FEMALE POPULATION
98.08
MALES / 100 FEMALES
101.96
FEMALES / 100 MALES
45.8
MEDIAN AGE
2.6
AVG FAMILY SIZE
2.1
AVG HOUSEHOLD SIZE
660
LABOR FORCE [ PEOPLE ]
67.1%
PERCENT IN LABOR FORCE
0.3%
UNEMPLOYMENT RATE
Atwood Zip Codes
Atwood Area Codes
Income in Atwood
Income Overview in Atwood
Per Capita Income in Atwood is $38,920, while median incomes of families and households are $78,250 and $65,714 respectively.
| Characteristic | Number | Measure |
| Per Capita Income | 1,238 | $38,920 |
| Median Family Income | 354 | $78,250 |
| Mean Family Income | 354 | $97,242 |
| Median Household Income | 572 | $65,714 |
| Mean Household Income | 572 | $81,374 |
| Income Deficit | 354 | $12,650 |
| Wage / Income Gap (%) | 1,238 | 27.74% |
| Wage / Income Gap ($) | 1,238 | 72.26¢ per $1 |
| Gini / Inequality Index | 1,238 | 0.42 |
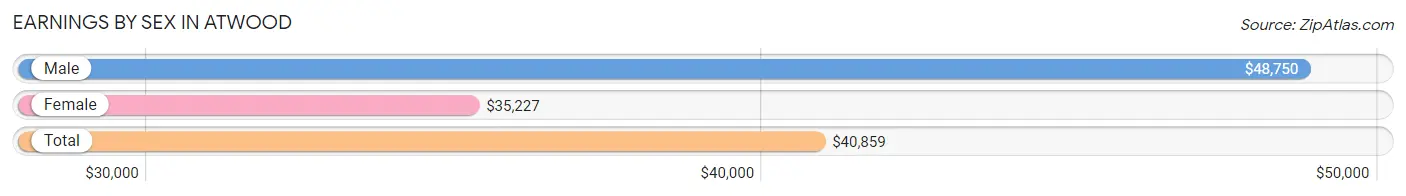
Earnings by Sex in Atwood
Average Earnings in Atwood are $40,859, $48,750 for men and $35,227 for women, a difference of 27.7%.
| Sex | Number | Average Earnings |
| Male | 349 (51.9%) | $48,750 |
| Female | 324 (48.1%) | $35,227 |
| Total | 673 (100.0%) | $40,859 |
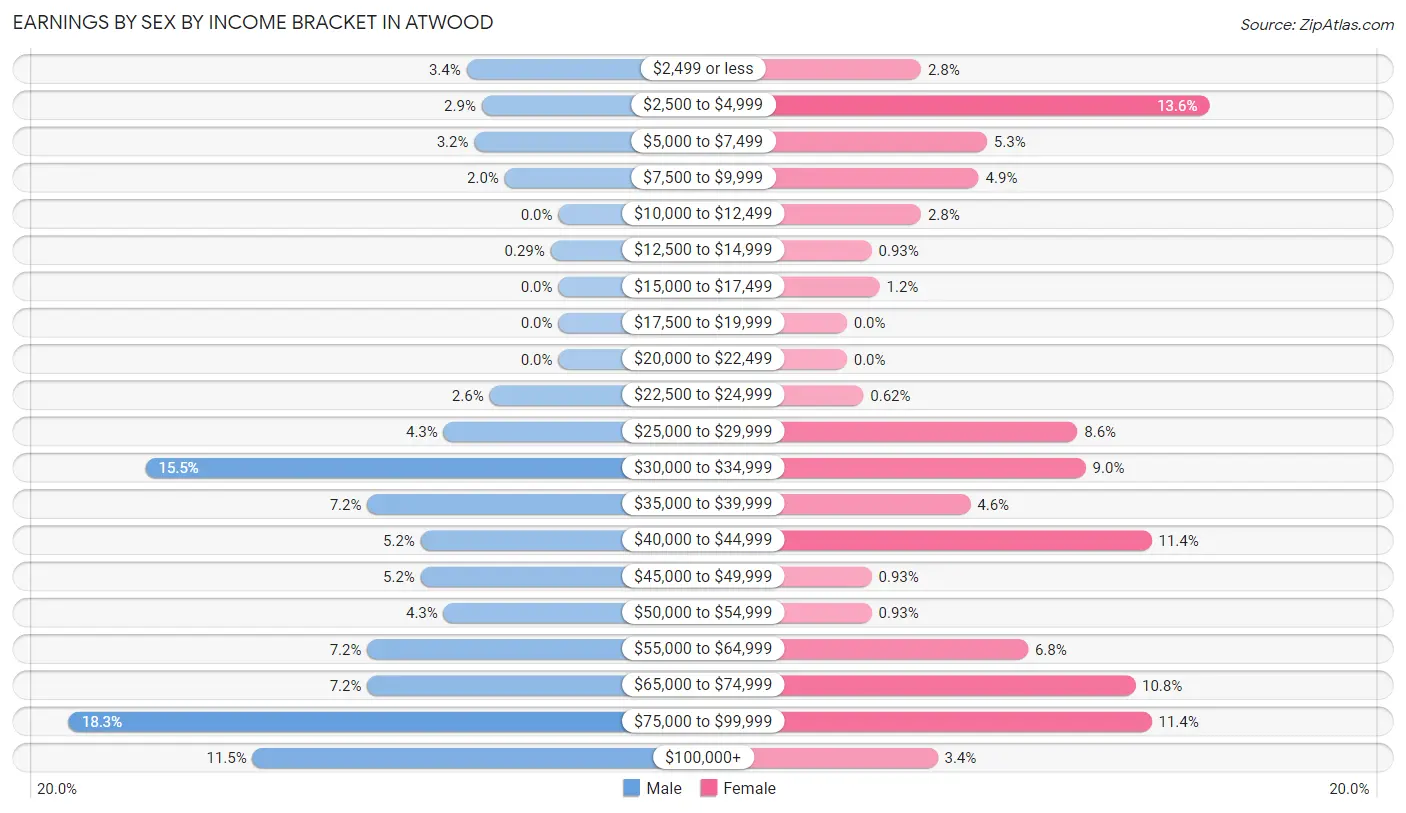
Earnings by Sex by Income Bracket in Atwood
The most common earnings brackets in Atwood are $75,000 to $99,999 for men (64 | 18.3%) and $2,500 to $4,999 for women (44 | 13.6%).
| Income | Male | Female |
| $2,499 or less | 12 (3.4%) | 9 (2.8%) |
| $2,500 to $4,999 | 10 (2.9%) | 44 (13.6%) |
| $5,000 to $7,499 | 11 (3.2%) | 17 (5.2%) |
| $7,500 to $9,999 | 7 (2.0%) | 16 (4.9%) |
| $10,000 to $12,499 | 0 (0.0%) | 9 (2.8%) |
| $12,500 to $14,999 | 1 (0.3%) | 3 (0.9%) |
| $15,000 to $17,499 | 0 (0.0%) | 4 (1.2%) |
| $17,500 to $19,999 | 0 (0.0%) | 0 (0.0%) |
| $20,000 to $22,499 | 0 (0.0%) | 0 (0.0%) |
| $22,500 to $24,999 | 9 (2.6%) | 2 (0.6%) |
| $25,000 to $29,999 | 15 (4.3%) | 28 (8.6%) |
| $30,000 to $34,999 | 54 (15.5%) | 29 (8.9%) |
| $35,000 to $39,999 | 25 (7.2%) | 15 (4.6%) |
| $40,000 to $44,999 | 18 (5.2%) | 37 (11.4%) |
| $45,000 to $49,999 | 18 (5.2%) | 3 (0.9%) |
| $50,000 to $54,999 | 15 (4.3%) | 3 (0.9%) |
| $55,000 to $64,999 | 25 (7.2%) | 22 (6.8%) |
| $65,000 to $74,999 | 25 (7.2%) | 35 (10.8%) |
| $75,000 to $99,999 | 64 (18.3%) | 37 (11.4%) |
| $100,000+ | 40 (11.5%) | 11 (3.4%) |
| Total | 349 (100.0%) | 324 (100.0%) |
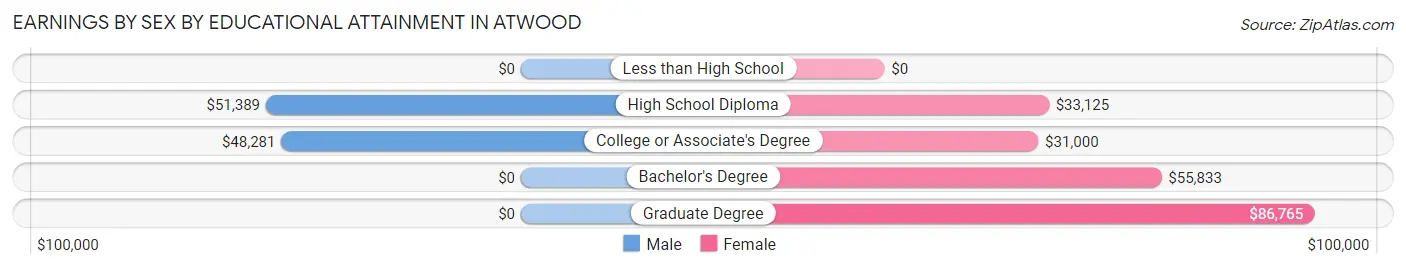
Earnings by Sex by Educational Attainment in Atwood
Average earnings in Atwood are $49,886 for men and $36,932 for women, a difference of 26.0%. Men with an educational attainment of high school diploma enjoy the highest average annual earnings of $51,389, while those with college or associate's degree education earn the least with $48,281. Women with an educational attainment of graduate degree earn the most with the average annual earnings of $86,765, while those with college or associate's degree education have the smallest earnings of $31,000.
| Educational Attainment | Male Income | Female Income |
| Less than High School | - | - |
| High School Diploma | $51,389 | $33,125 |
| College or Associate's Degree | $48,281 | $31,000 |
| Bachelor's Degree | - | - |
| Graduate Degree | - | - |
| Total | $49,886 | $36,932 |
Family Income in Atwood
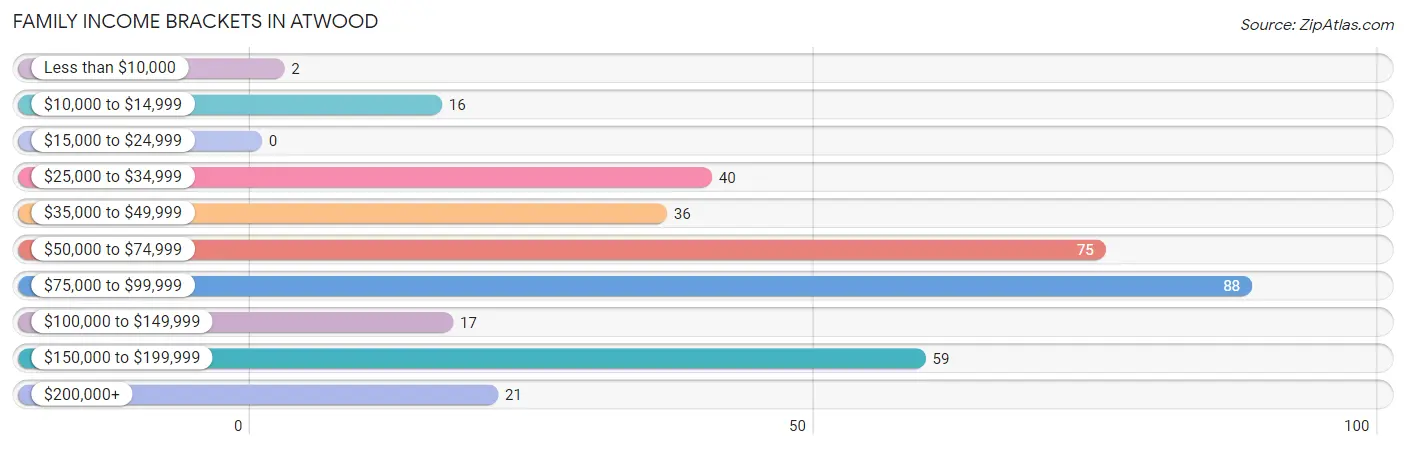
Family Income Brackets in Atwood
According to the Atwood family income data, there are 88 families falling into the $75,000 to $99,999 income range, which is the most common income bracket and makes up 24.9% of all families.
| Income Bracket | # Families | % Families |
| Less than $10,000 | 2 | 0.6% |
| $10,000 to $14,999 | 16 | 4.5% |
| $15,000 to $24,999 | 0 | 0.0% |
| $25,000 to $34,999 | 40 | 11.3% |
| $35,000 to $49,999 | 36 | 10.2% |
| $50,000 to $74,999 | 75 | 21.2% |
| $75,000 to $99,999 | 88 | 24.9% |
| $100,000 to $149,999 | 17 | 4.8% |
| $150,000 to $199,999 | 59 | 16.7% |
| $200,000+ | 21 | 5.9% |
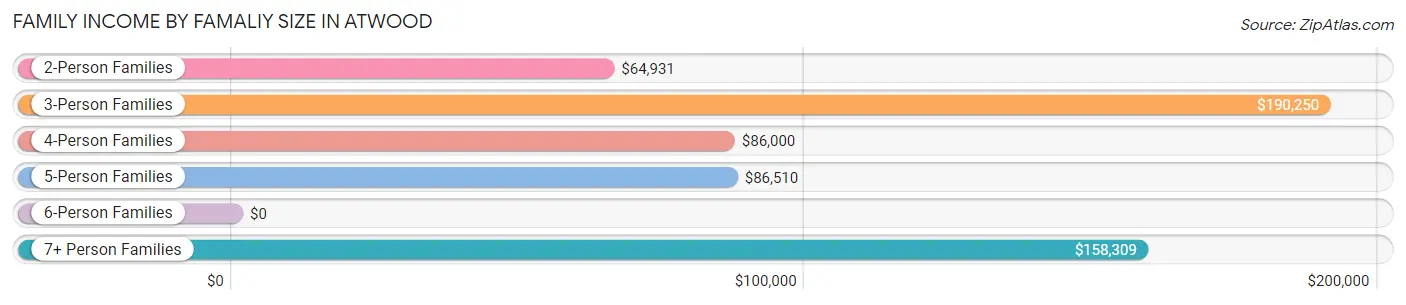
Family Income by Famaliy Size in Atwood
3-person families (21 | 5.9%) account for the highest median family income in Atwood with $190,250 per family, while 3-person families (21 | 5.9%) have the highest median income of $63,417 per family member.
| Income Bracket | # Families | Median Income |
| 2-Person Families | 211 (59.6%) | $64,931 |
| 3-Person Families | 21 (5.9%) | $190,250 |
| 4-Person Families | 40 (11.3%) | $86,000 |
| 5-Person Families | 59 (16.7%) | $86,510 |
| 6-Person Families | 0 (0.0%) | $0 |
| 7+ Person Families | 23 (6.5%) | $158,309 |
| Total | 354 (100.0%) | $78,250 |
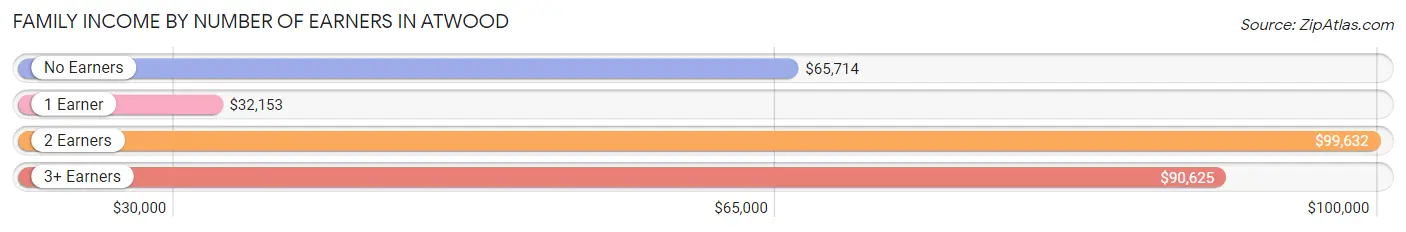
Family Income by Number of Earners in Atwood
The median family income in Atwood is $78,250, with families comprising 2 earners (181) having the highest median family income of $99,632, while families with 1 earner (84) have the lowest median family income of $32,153, accounting for 51.1% and 23.7% of families, respectively.
| Number of Earners | # Families | Median Income |
| No Earners | 78 (22.0%) | $65,714 |
| 1 Earner | 84 (23.7%) | $32,153 |
| 2 Earners | 181 (51.1%) | $99,632 |
| 3+ Earners | 11 (3.1%) | $90,625 |
| Total | 354 (100.0%) | $78,250 |
Household Income in Atwood
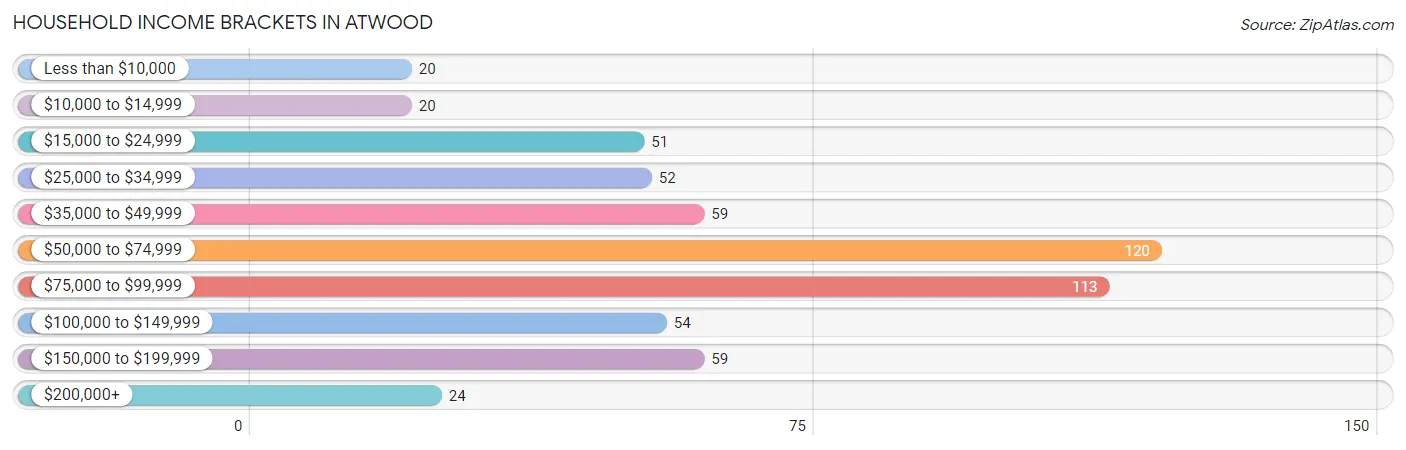
Household Income Brackets in Atwood
With 120 households falling in the category, the $50,000 to $74,999 income range is the most frequent in Atwood, accounting for 21.0% of all households. In contrast, only 20 households (3.5%) fall into the less than $10,000 income bracket, making it the least populous group.
| Income Bracket | # Households | % Households |
| Less than $10,000 | 20 | 3.5% |
| $10,000 to $14,999 | 20 | 3.5% |
| $15,000 to $24,999 | 51 | 8.9% |
| $25,000 to $34,999 | 52 | 9.1% |
| $35,000 to $49,999 | 59 | 10.3% |
| $50,000 to $74,999 | 120 | 21.0% |
| $75,000 to $99,999 | 113 | 19.8% |
| $100,000 to $149,999 | 54 | 9.4% |
| $150,000 to $199,999 | 59 | 10.3% |
| $200,000+ | 24 | 4.2% |
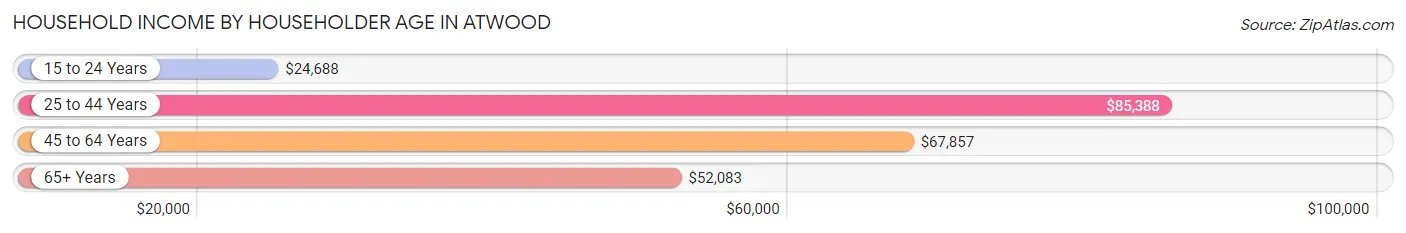
Household Income by Householder Age in Atwood
The median household income in Atwood is $65,714, with the highest median household income of $85,388 found in the 25 to 44 years age bracket for the primary householder. A total of 155 households (27.1%) fall into this category. Meanwhile, the 15 to 24 years age bracket for the primary householder has the lowest median household income of $24,688, with 13 households (2.3%) in this group.
| Income Bracket | # Households | Median Income |
| 15 to 24 Years | 13 (2.3%) | $24,688 |
| 25 to 44 Years | 155 (27.1%) | $85,388 |
| 45 to 64 Years | 224 (39.2%) | $67,857 |
| 65+ Years | 180 (31.5%) | $52,083 |
| Total | 572 (100.0%) | $65,714 |
Poverty in Atwood
Income Below Poverty by Sex and Age in Atwood
With 6.5% poverty level for males and 12.3% for females among the residents of Atwood, 5 year old males and 5 year old females are the most vulnerable to poverty, with 2 males (50.0%) and 3 females (75.0%) in their respective age groups living below the poverty level.
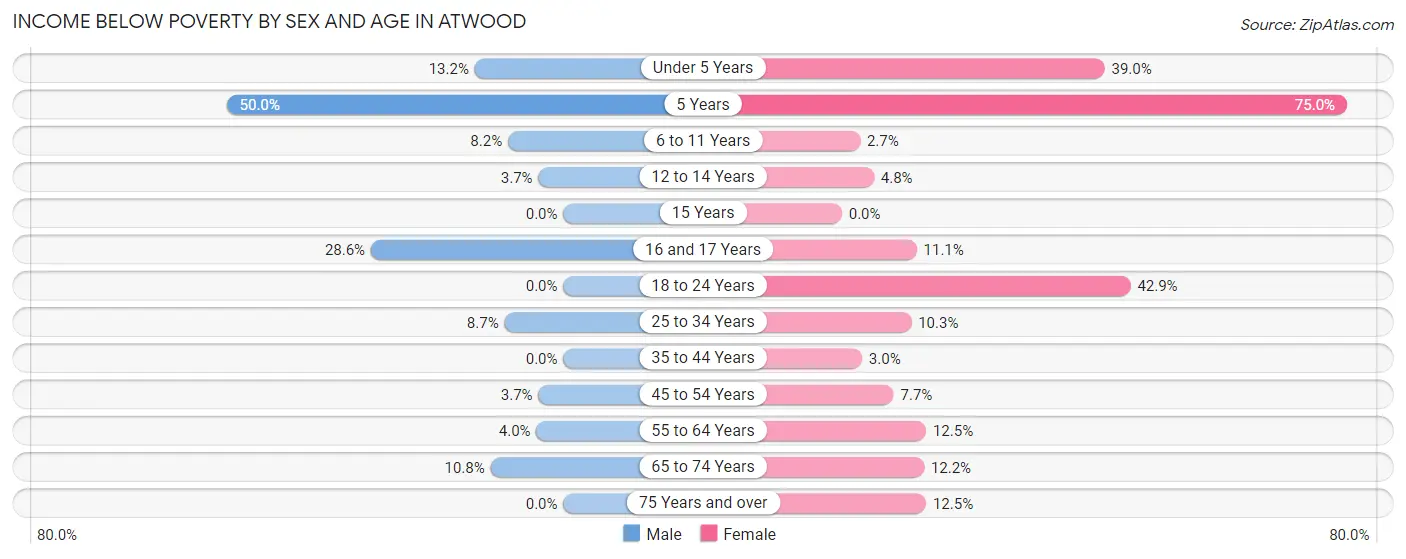
| Age Bracket | Male | Female |
| Under 5 Years | 5 (13.2%) | 16 (39.0%) |
| 5 Years | 2 (50.0%) | 3 (75.0%) |
| 6 to 11 Years | 6 (8.2%) | 1 (2.7%) |
| 12 to 14 Years | 1 (3.7%) | 1 (4.8%) |
| 15 Years | 0 (0.0%) | 0 (0.0%) |
| 16 and 17 Years | 2 (28.6%) | 1 (11.1%) |
| 18 to 24 Years | 0 (0.0%) | 6 (42.9%) |
| 25 to 34 Years | 9 (8.7%) | 10 (10.3%) |
| 35 to 44 Years | 0 (0.0%) | 2 (3.0%) |
| 45 to 54 Years | 3 (3.7%) | 6 (7.7%) |
| 55 to 64 Years | 3 (4.0%) | 12 (12.5%) |
| 65 to 74 Years | 8 (10.8%) | 5 (12.2%) |
| 75 Years and over | 0 (0.0%) | 11 (12.5%) |
| Total | 39 (6.5%) | 74 (12.3%) |
Income Above Poverty by Sex and Age in Atwood
According to the poverty statistics in Atwood, males aged 15 years and females aged 15 years are the age groups that are most secure financially, with 100.0% of males and 100.0% of females in these age groups living above the poverty line.
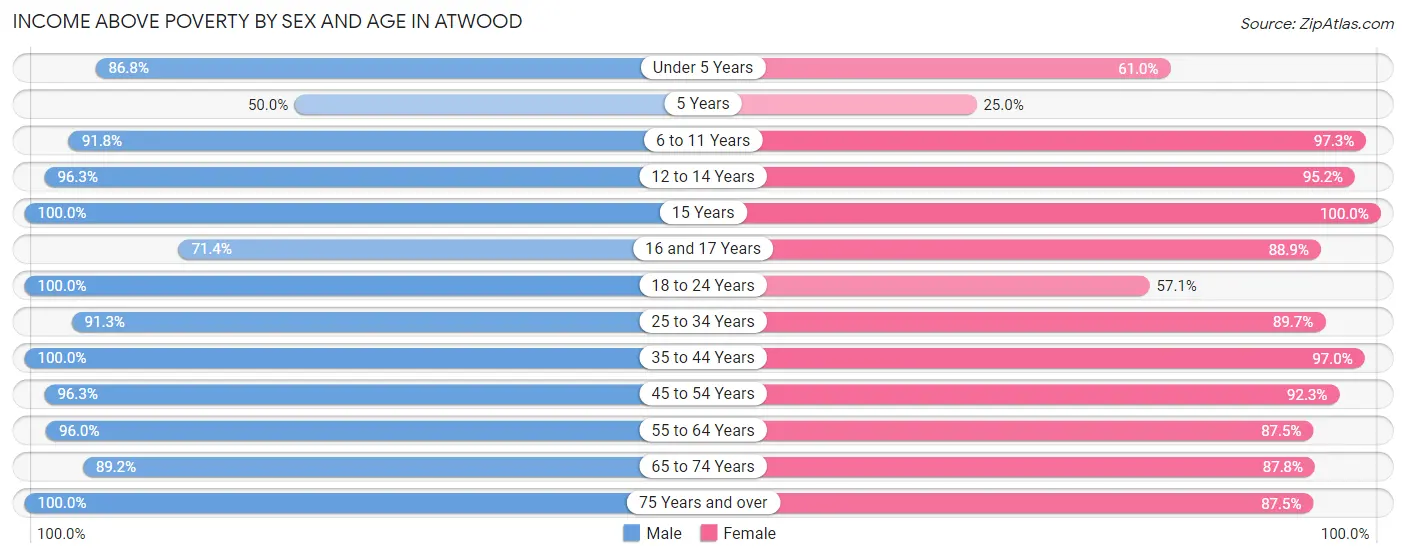
| Age Bracket | Male | Female |
| Under 5 Years | 33 (86.8%) | 25 (61.0%) |
| 5 Years | 2 (50.0%) | 1 (25.0%) |
| 6 to 11 Years | 67 (91.8%) | 36 (97.3%) |
| 12 to 14 Years | 26 (96.3%) | 20 (95.2%) |
| 15 Years | 1 (100.0%) | 9 (100.0%) |
| 16 and 17 Years | 5 (71.4%) | 8 (88.9%) |
| 18 to 24 Years | 4 (100.0%) | 8 (57.1%) |
| 25 to 34 Years | 94 (91.3%) | 87 (89.7%) |
| 35 to 44 Years | 49 (100.0%) | 65 (97.0%) |
| 45 to 54 Years | 78 (96.3%) | 72 (92.3%) |
| 55 to 64 Years | 72 (96.0%) | 84 (87.5%) |
| 65 to 74 Years | 66 (89.2%) | 36 (87.8%) |
| 75 Years and over | 65 (100.0%) | 77 (87.5%) |
| Total | 562 (93.5%) | 528 (87.7%) |
Income Below Poverty Among Married-Couple Families in Atwood
The poverty statistics for married-couple families in Atwood show that 3.3% or 9 of the total 277 families live below the poverty line. Families with no children have the highest poverty rate of 4.2%, comprising of 7 families. On the other hand, families with 1 or 2 children have the lowest poverty rate of 0.0%, which includes 0 families.
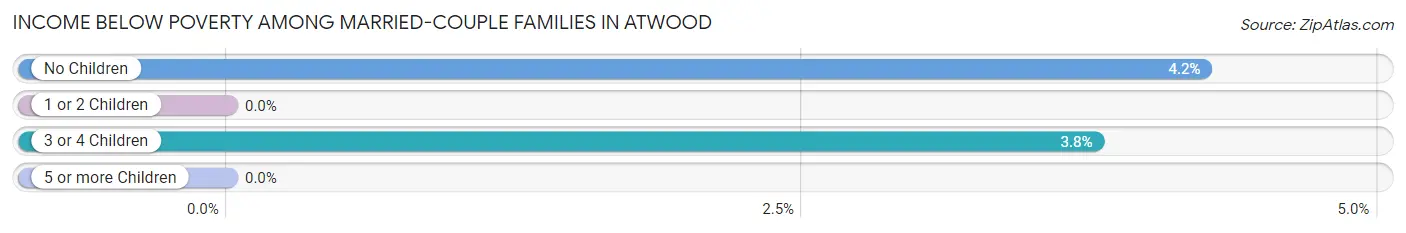
| Children | Above Poverty | Below Poverty |
| No Children | 158 (95.8%) | 7 (4.2%) |
| 1 or 2 Children | 38 (100.0%) | 0 (0.0%) |
| 3 or 4 Children | 51 (96.2%) | 2 (3.8%) |
| 5 or more Children | 21 (100.0%) | 0 (0.0%) |
| Total | 268 (96.8%) | 9 (3.3%) |
Income Below Poverty Among Single-Parent Households in Atwood
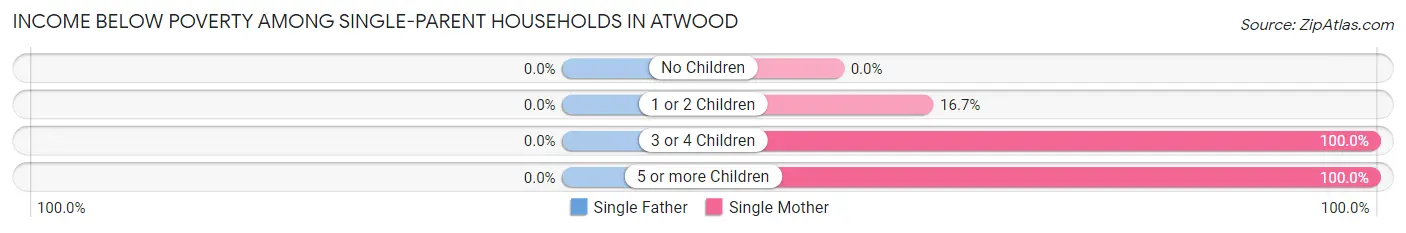
| Children | Single Father | Single Mother |
| No Children | 0 (0.0%) | 0 (0.0%) |
| 1 or 2 Children | 0 (0.0%) | 3 (16.7%) |
| 3 or 4 Children | 0 (0.0%) | 8 (100.0%) |
| 5 or more Children | 0 (0.0%) | 2 (100.0%) |
| Total | 0 (0.0%) | 13 (46.4%) |
Income Below Poverty Among Married-Couple vs Single-Parent Households in Atwood
The poverty data for Atwood shows that 9 of the married-couple family households (3.3%) and 13 of the single-parent households (16.9%) are living below the poverty level. Within the married-couple family households, those with no children have the highest poverty rate, with 7 households (4.2%) falling below the poverty line. Among the single-parent households, those with 5 or more children have the highest poverty rate, with 2 household (100.0%) living below poverty.
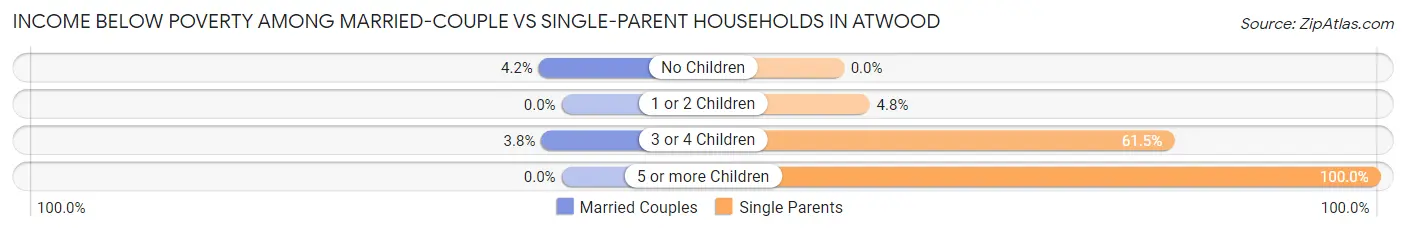
| Children | Married-Couple Families | Single-Parent Households |
| No Children | 7 (4.2%) | 0 (0.0%) |
| 1 or 2 Children | 0 (0.0%) | 3 (4.8%) |
| 3 or 4 Children | 2 (3.8%) | 8 (61.5%) |
| 5 or more Children | 0 (0.0%) | 2 (100.0%) |
| Total | 9 (3.3%) | 13 (16.9%) |
Race in Atwood
The most populous races in Atwood are White / Caucasian (1,122 | 90.6%), Hispanic or Latino (173 | 14.0%), and Some other Race (61 | 4.9%).
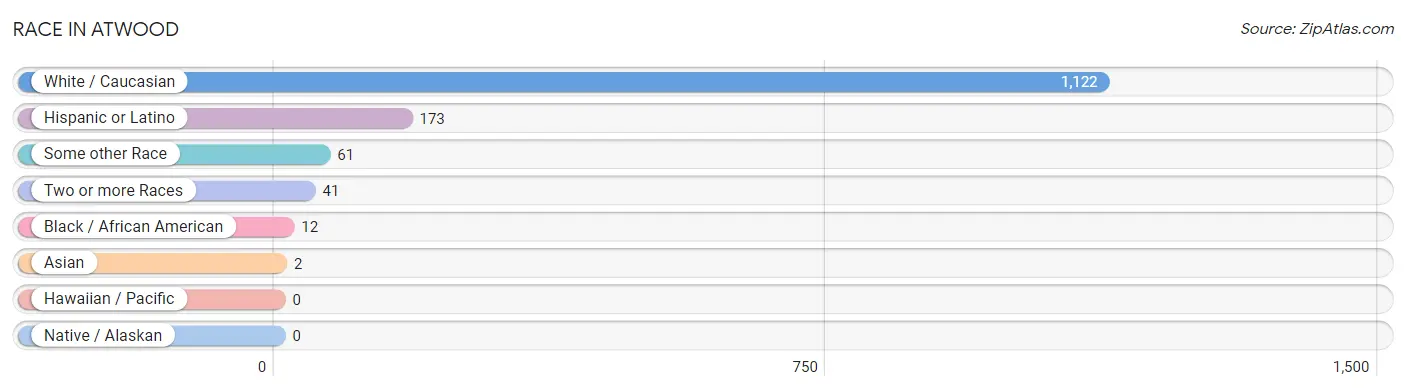
| Race | # Population | % Population |
| Asian | 2 | 0.2% |
| Black / African American | 12 | 1.0% |
| Hawaiian / Pacific | 0 | 0.0% |
| Hispanic or Latino | 173 | 14.0% |
| Native / Alaskan | 0 | 0.0% |
| White / Caucasian | 1,122 | 90.6% |
| Two or more Races | 41 | 3.3% |
| Some other Race | 61 | 4.9% |
| Total | 1,238 | 100.0% |
Ancestry in Atwood
The most populous ancestries reported in Atwood are German (387 | 31.3%), English (151 | 12.2%), Mexican (131 | 10.6%), Czech (75 | 6.1%), and Irish (70 | 5.7%), together accounting for 65.7% of all Atwood residents.
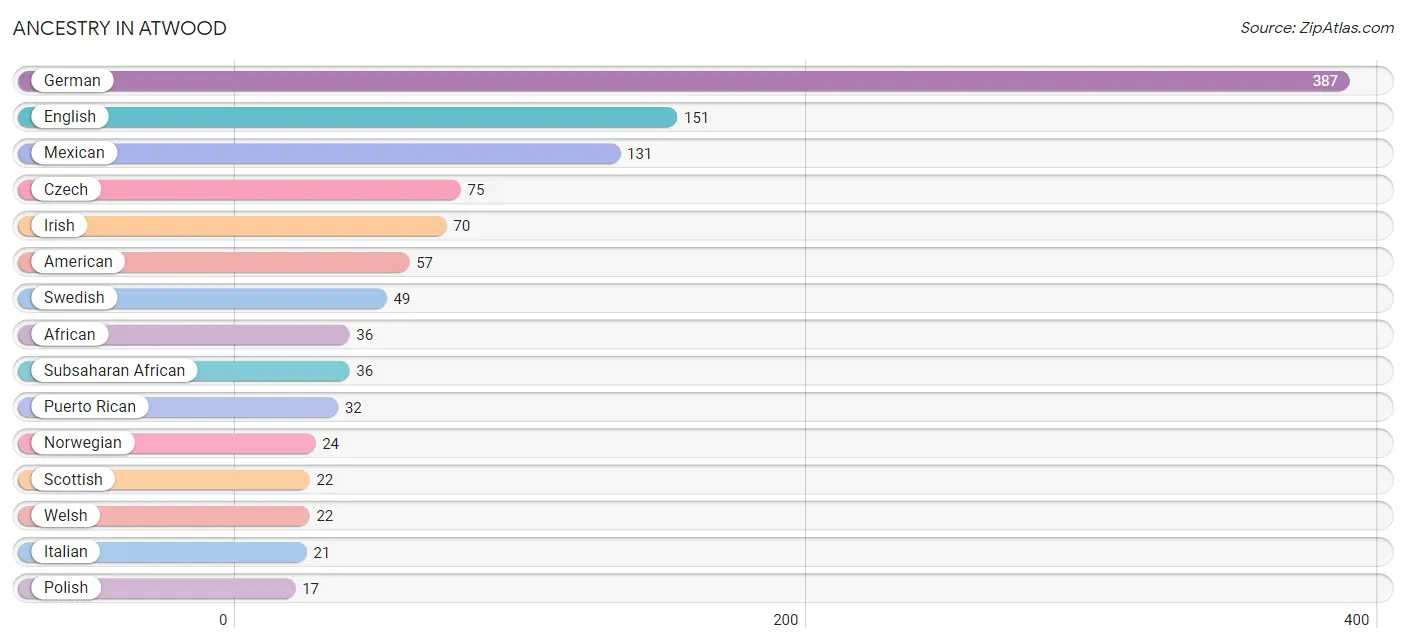
| Ancestry | # Population | % Population |
| African | 36 | 2.9% |
| American | 57 | 4.6% |
| Austrian | 5 | 0.4% |
| Belgian | 5 | 0.4% |
| British | 3 | 0.2% |
| Central American | 4 | 0.3% |
| Cherokee | 8 | 0.6% |
| Cheyenne | 1 | 0.1% |
| Cuban | 6 | 0.5% |
| Czech | 75 | 6.1% |
| Czechoslovakian | 4 | 0.3% |
| Danish | 2 | 0.2% |
| Dutch | 3 | 0.2% |
| Eastern European | 3 | 0.2% |
| English | 151 | 12.2% |
| European | 5 | 0.4% |
| French | 3 | 0.2% |
| German | 387 | 31.3% |
| Greek | 3 | 0.2% |
| Guatemalan | 4 | 0.3% |
| Haitian | 1 | 0.1% |
| Hungarian | 7 | 0.6% |
| Irish | 70 | 5.7% |
| Italian | 21 | 1.7% |
| Korean | 2 | 0.2% |
| Mexican | 131 | 10.6% |
| Norwegian | 24 | 1.9% |
| Polish | 17 | 1.4% |
| Puerto Rican | 32 | 2.6% |
| Russian | 13 | 1.1% |
| Scotch-Irish | 4 | 0.3% |
| Scottish | 22 | 1.8% |
| Subsaharan African | 36 | 2.9% |
| Swedish | 49 | 4.0% |
| Welsh | 22 | 1.8% | View All 35 Rows |
Immigrants in Atwood
The most numerous immigrant groups reported in Atwood came from Africa (21 | 1.7%), Latin America (19 | 1.5%), Central America (18 | 1.5%), Mexico (18 | 1.5%), and Asia (2 | 0.2%), together accounting for 6.3% of all Atwood residents.
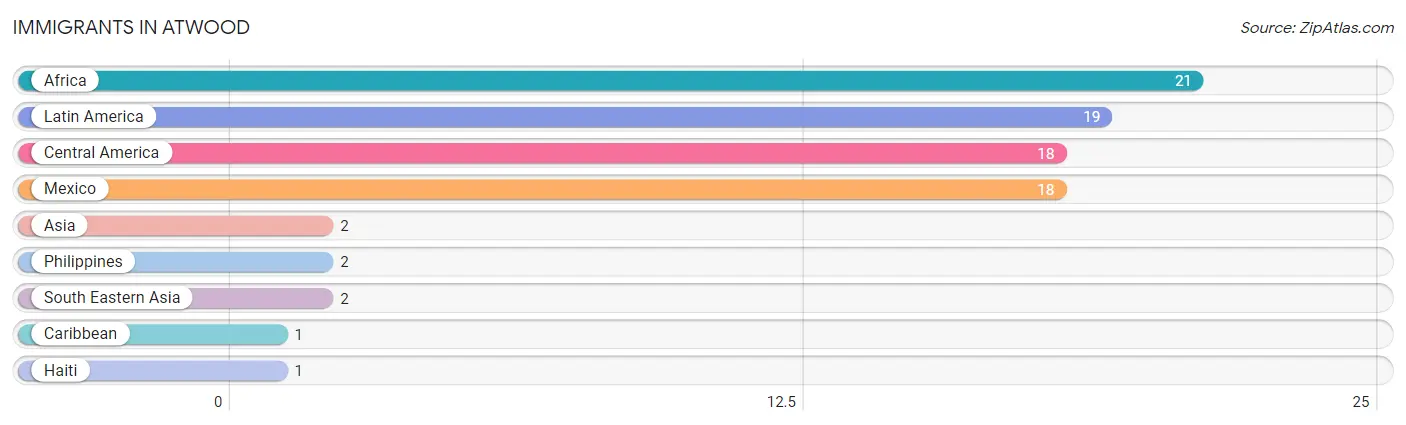
| Immigration Origin | # Population | % Population |
| Africa | 21 | 1.7% |
| Asia | 2 | 0.2% |
| Caribbean | 1 | 0.1% |
| Central America | 18 | 1.5% |
| Haiti | 1 | 0.1% |
| Latin America | 19 | 1.5% |
| Mexico | 18 | 1.5% |
| Philippines | 2 | 0.2% |
| South Eastern Asia | 2 | 0.2% | View All 9 Rows |
Sex and Age in Atwood
Sex and Age in Atwood
The most populous age groups in Atwood are 30 to 34 Years (67 | 10.9%) for men and 30 to 34 Years (49 | 7.8%) for women.
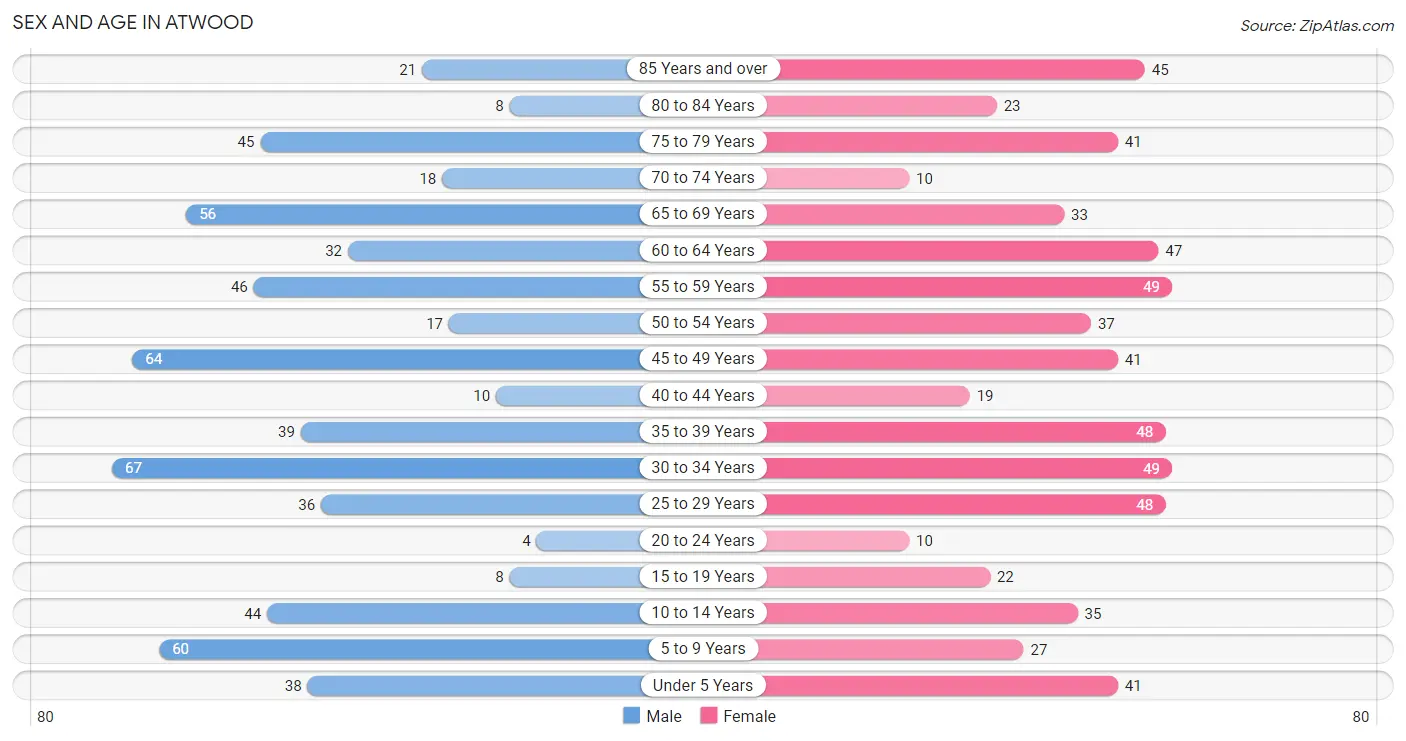
| Age Bracket | Male | Female |
| Under 5 Years | 38 (6.2%) | 41 (6.6%) |
| 5 to 9 Years | 60 (9.8%) | 27 (4.3%) |
| 10 to 14 Years | 44 (7.2%) | 35 (5.6%) |
| 15 to 19 Years | 8 (1.3%) | 22 (3.5%) |
| 20 to 24 Years | 4 (0.6%) | 10 (1.6%) |
| 25 to 29 Years | 36 (5.9%) | 48 (7.7%) |
| 30 to 34 Years | 67 (10.9%) | 49 (7.8%) |
| 35 to 39 Years | 39 (6.4%) | 48 (7.7%) |
| 40 to 44 Years | 10 (1.6%) | 19 (3.0%) |
| 45 to 49 Years | 64 (10.4%) | 41 (6.6%) |
| 50 to 54 Years | 17 (2.8%) | 37 (5.9%) |
| 55 to 59 Years | 46 (7.5%) | 49 (7.8%) |
| 60 to 64 Years | 32 (5.2%) | 47 (7.5%) |
| 65 to 69 Years | 56 (9.1%) | 33 (5.3%) |
| 70 to 74 Years | 18 (2.9%) | 10 (1.6%) |
| 75 to 79 Years | 45 (7.3%) | 41 (6.6%) |
| 80 to 84 Years | 8 (1.3%) | 23 (3.7%) |
| 85 Years and over | 21 (3.4%) | 45 (7.2%) |
| Total | 613 (100.0%) | 625 (100.0%) |
Families and Households in Atwood
Median Family Size in Atwood
The median family size in Atwood is 2.61 persons per family, with married-couple families (277 | 78.2%) accounting for the largest median family size of 2.77 persons per family. On the other hand, single male/father families (49 | 13.8%) represent the smallest median family size with 1.65 persons per family.
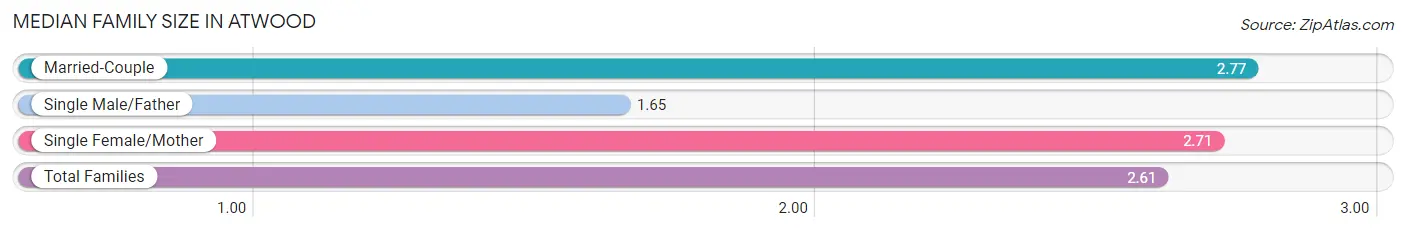
| Family Type | # Families | Family Size |
| Married-Couple | 277 (78.2%) | 2.77 |
| Single Male/Father | 49 (13.8%) | 1.65 |
| Single Female/Mother | 28 (7.9%) | 2.71 |
| Total Families | 354 (100.0%) | 2.61 |
Median Household Size in Atwood
The median household size in Atwood is 2.10 persons per household, with single female/mother households (28 | 4.9%) accounting for the largest median household size of 3.46 persons per household. non-family households (218 | 38.1%) represent the smallest median household size with 1.02 persons per household.
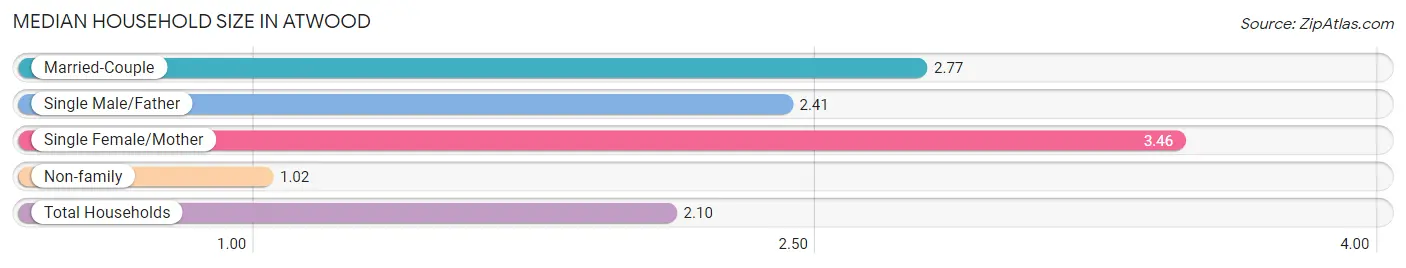
| Household Type | # Households | Household Size |
| Married-Couple | 277 (48.4%) | 2.77 |
| Single Male/Father | 49 (8.6%) | 2.41 |
| Single Female/Mother | 28 (4.9%) | 3.46 |
| Non-family | 218 (38.1%) | 1.02 |
| Total Households | 572 (100.0%) | 2.10 |
Household Size by Marriage Status in Atwood
Out of a total of 572 households in Atwood, 354 (61.9%) are family households, while 218 (38.1%) are nonfamily households. The most numerous type of family households are 2-person households, comprising 160, and the most common type of nonfamily households are 1-person households, comprising 216.
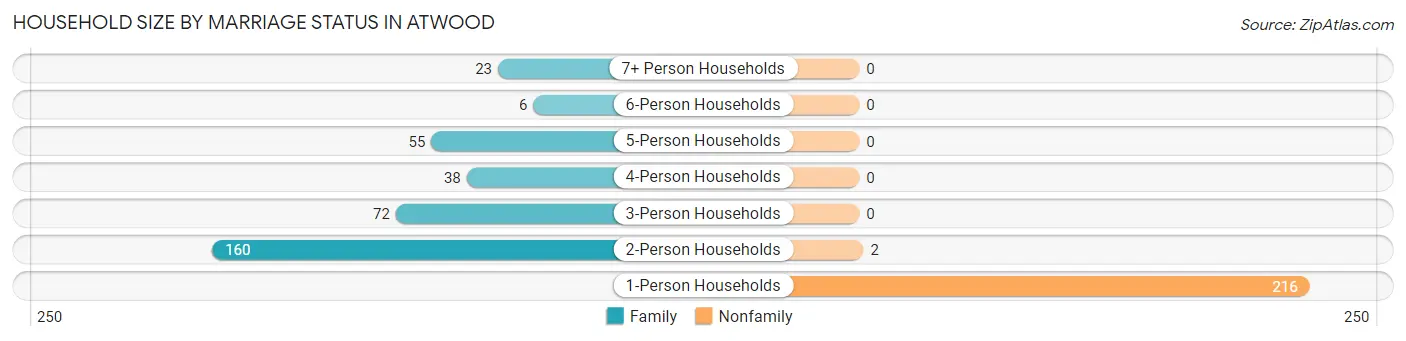
| Household Size | Family Households | Nonfamily Households |
| 1-Person Households | - | 216 (37.8%) |
| 2-Person Households | 160 (28.0%) | 2 (0.4%) |
| 3-Person Households | 72 (12.6%) | 0 (0.0%) |
| 4-Person Households | 38 (6.6%) | 0 (0.0%) |
| 5-Person Households | 55 (9.6%) | 0 (0.0%) |
| 6-Person Households | 6 (1.1%) | 0 (0.0%) |
| 7+ Person Households | 23 (4.0%) | 0 (0.0%) |
| Total | 354 (61.9%) | 218 (38.1%) |
Female Fertility in Atwood
Fertility by Age in Atwood
Average fertility rate in Atwood is 33.0 births per 1,000 women. Women in the age bracket of 20 to 34 years have the highest fertility rate with 75.0 births per 1,000 women. Women in the age bracket of 20 to 34 years acount for 100.0% of all women with births.
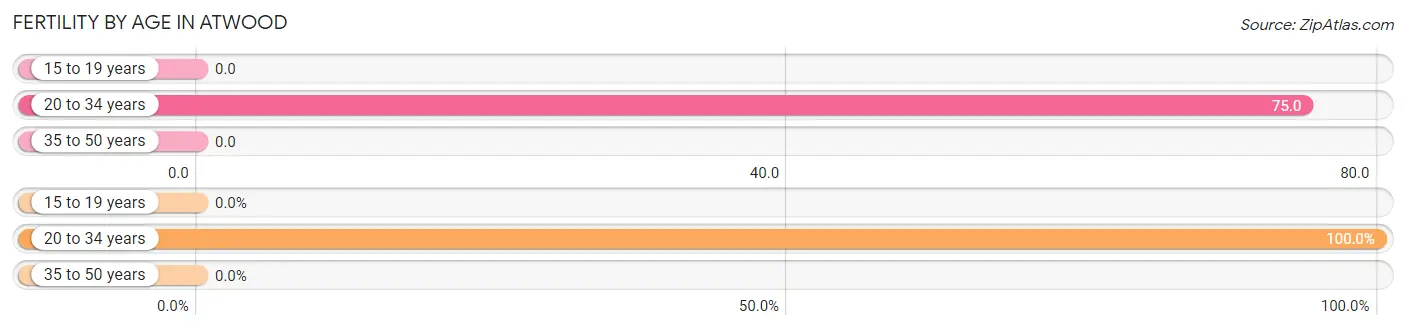
| Age Bracket | Women with Births | Births / 1,000 Women |
| 15 to 19 years | 0 (0.0%) | 0.0 |
| 20 to 34 years | 8 (100.0%) | 75.0 |
| 35 to 50 years | 0 (0.0%) | 0.0 |
| Total | 8 (100.0%) | 33.0 |
Fertility by Age by Marriage Status in Atwood
25.0% of women with births (8) in Atwood are married. The highest percentage of unmarried women with births falls into 20 to 34 years age bracket with 75.0% of them unmarried at the time of birth, while the lowest percentage of unmarried women with births belong to 20 to 34 years age bracket with 75.0% of them unmarried.
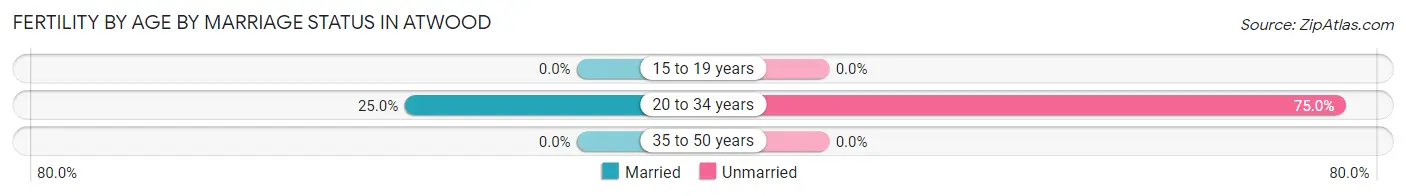
| Age Bracket | Married | Unmarried |
| 15 to 19 years | 0 (0.0%) | 0 (0.0%) |
| 20 to 34 years | 2 (25.0%) | 6 (75.0%) |
| 35 to 50 years | 0 (0.0%) | 0 (0.0%) |
| Total | 2 (25.0%) | 6 (75.0%) |
Fertility by Education in Atwood
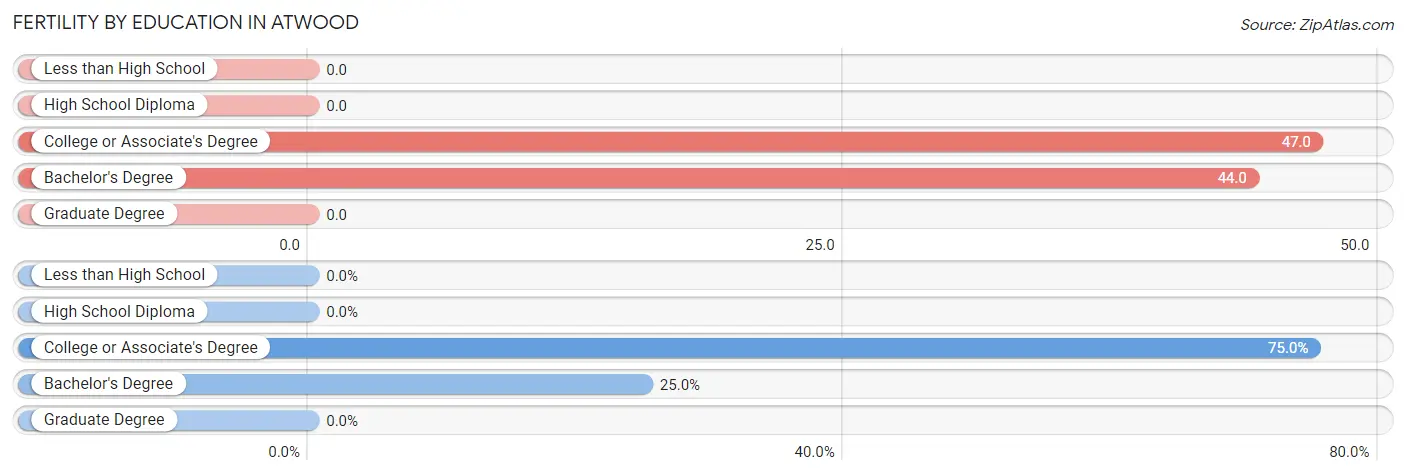
| Educational Attainment | Women with Births | Births / 1,000 Women |
| Less than High School | 0 (0.0%) | 0.0 |
| High School Diploma | 0 (0.0%) | 0.0 |
| College or Associate's Degree | 6 (75.0%) | 47.0 |
| Bachelor's Degree | 2 (25.0%) | 44.0 |
| Graduate Degree | 0 (0.0%) | 0.0 |
| Total | 8 (100.0%) | 33.0 |
Fertility by Education by Marriage Status in Atwood
75.0% of women with births in Atwood are unmarried. Women with the educational attainment of bachelor's degree are most likely to be married with 100.0% of them married at childbirth, while women with the educational attainment of college or associate's degree are least likely to be married with 100.0% of them unmarried at childbirth.
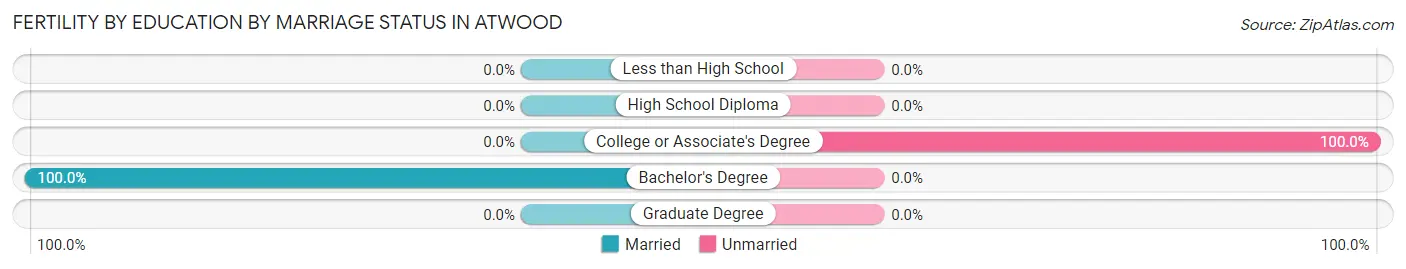
| Educational Attainment | Married | Unmarried |
| Less than High School | 0 (0.0%) | 0 (0.0%) |
| High School Diploma | 0 (0.0%) | 0 (0.0%) |
| College or Associate's Degree | 0 (0.0%) | 6 (100.0%) |
| Bachelor's Degree | 2 (100.0%) | 0 (0.0%) |
| Graduate Degree | 0 (0.0%) | 0 (0.0%) |
| Total | 2 (25.0%) | 6 (75.0%) |
Employment Characteristics in Atwood
Employment by Class of Employer in Atwood
Among the 617 employed individuals in Atwood, private company employees (357 | 57.9%), local government employees (123 | 19.9%), and self-employed (not incorporated) (53 | 8.6%) make up the most common classes of employment.
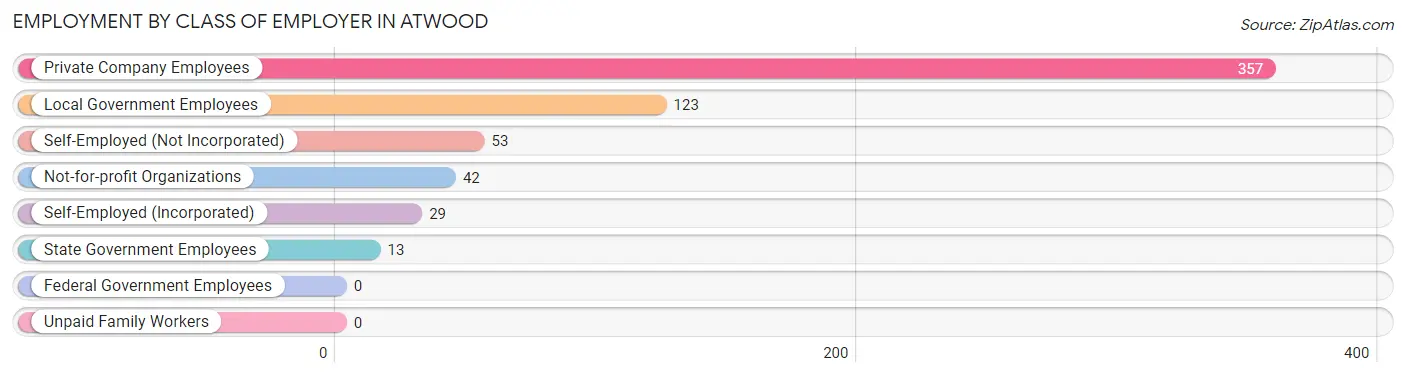
| Employer Class | # Employees | % Employees |
| Private Company Employees | 357 | 57.9% |
| Self-Employed (Incorporated) | 29 | 4.7% |
| Self-Employed (Not Incorporated) | 53 | 8.6% |
| Not-for-profit Organizations | 42 | 6.8% |
| Local Government Employees | 123 | 19.9% |
| State Government Employees | 13 | 2.1% |
| Federal Government Employees | 0 | 0.0% |
| Unpaid Family Workers | 0 | 0.0% |
| Total | 617 | 100.0% |
Employment Status by Age in Atwood
According to the labor force statistics for Atwood, out of the total population over 16 years of age (983), 67.1% or 660 individuals are in the labor force, with 0.3% or 2 of them unemployed. The age group with the highest labor force participation rate is 30 to 34 years, with 99.1% or 115 individuals in the labor force. Within the labor force, the 60 to 64 years age range has the highest percentage of unemployed individuals, with 10.0% or 2 of them being unemployed.
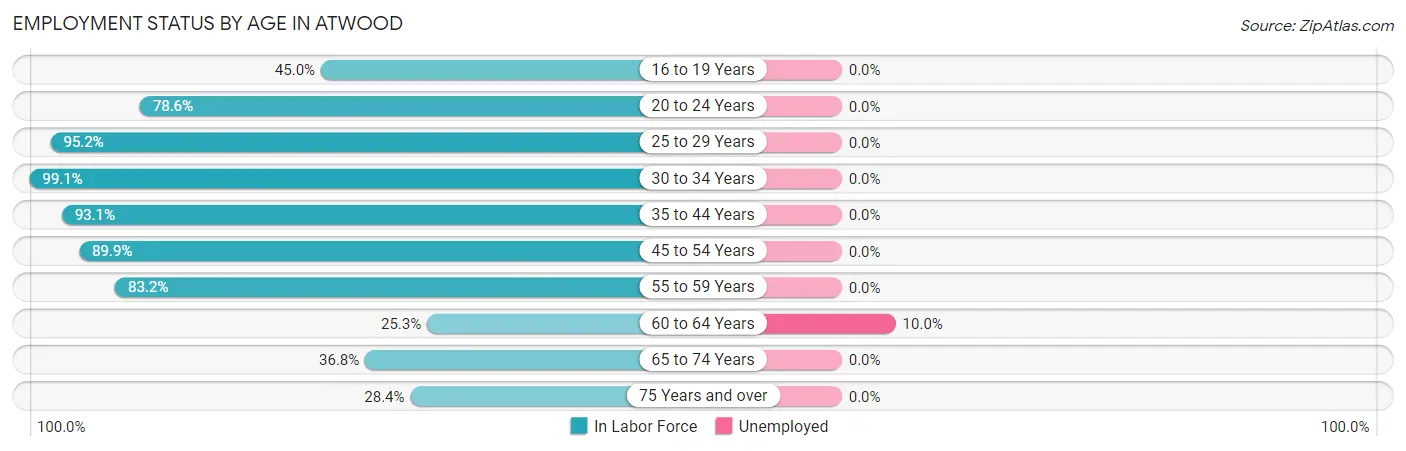
| Age Bracket | In Labor Force | Unemployed |
| 16 to 19 Years | 9 (45.0%) | 0 (0.0%) |
| 20 to 24 Years | 11 (78.6%) | 0 (0.0%) |
| 25 to 29 Years | 80 (95.2%) | 0 (0.0%) |
| 30 to 34 Years | 115 (99.1%) | 0 (0.0%) |
| 35 to 44 Years | 108 (93.1%) | 0 (0.0%) |
| 45 to 54 Years | 143 (89.9%) | 0 (0.0%) |
| 55 to 59 Years | 79 (83.2%) | 0 (0.0%) |
| 60 to 64 Years | 20 (25.3%) | 2 (10.0%) |
| 65 to 74 Years | 43 (36.8%) | 0 (0.0%) |
| 75 Years and over | 52 (28.4%) | 0 (0.0%) |
| Total | 660 (67.1%) | 2 (0.3%) |
Employment Status by Educational Attainment in Atwood
According to labor force statistics for Atwood, 84.0% of individuals (545) out of the total population between 25 and 64 years of age (649) are in the labor force, with 0.4% or 2 of them being unemployed. The group with the highest labor force participation rate are those with the educational attainment of bachelor's degree or higher, with 90.4% or 113 individuals in the labor force. Within the labor force, individuals with bachelor's degree or higher education have the highest percentage of unemployment, with 1.8% or 2 of them being unemployed.
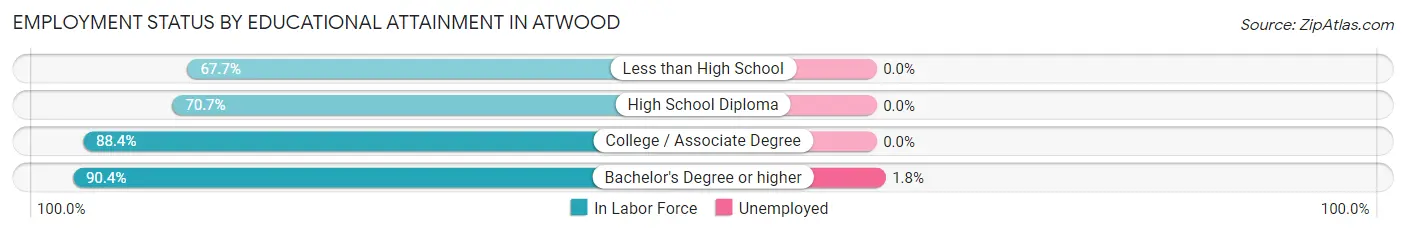
| Educational Attainment | In Labor Force | Unemployed |
| Less than High School | 21 (67.7%) | 0 (0.0%) |
| High School Diploma | 99 (70.7%) | 0 (0.0%) |
| College / Associate Degree | 312 (88.4%) | 0 (0.0%) |
| Bachelor's Degree or higher | 113 (90.4%) | 2 (1.8%) |
| Total | 545 (84.0%) | 3 (0.4%) |
Employment Occupations by Sex in Atwood
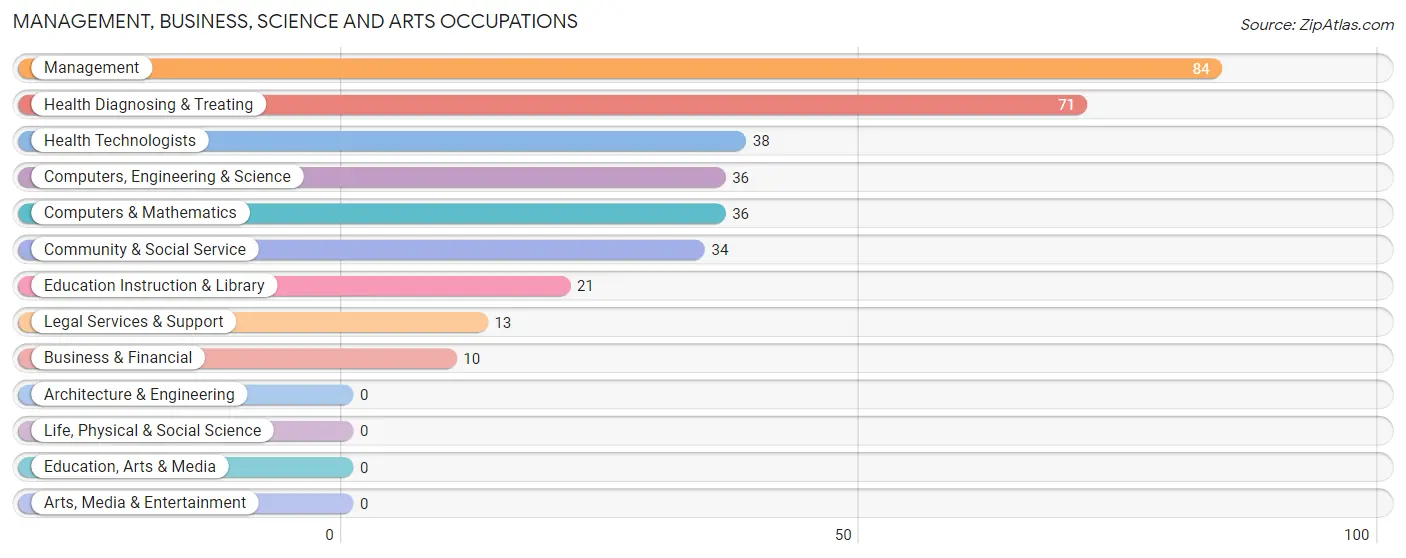
Management, Business, Science and Arts Occupations
The most common Management, Business, Science and Arts occupations in Atwood are Management (84 | 12.8%), Health Diagnosing & Treating (71 | 10.8%), Health Technologists (38 | 5.8%), Computers, Engineering & Science (36 | 5.5%), and Computers & Mathematics (36 | 5.5%).
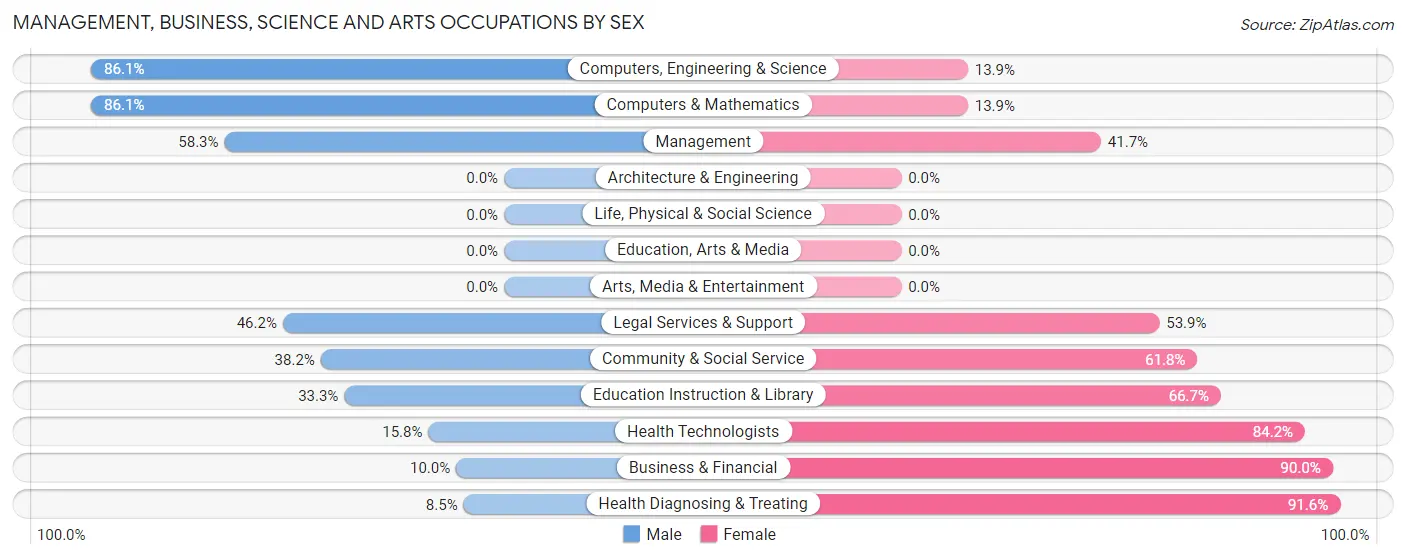
Management, Business, Science and Arts Occupations by Sex
Within the Management, Business, Science and Arts occupations in Atwood, the most male-oriented occupations are Computers, Engineering & Science (86.1%), Computers & Mathematics (86.1%), and Management (58.3%), while the most female-oriented occupations are Health Diagnosing & Treating (91.5%), Business & Financial (90.0%), and Health Technologists (84.2%).
| Occupation | Male | Female |
| Management | 49 (58.3%) | 35 (41.7%) |
| Business & Financial | 1 (10.0%) | 9 (90.0%) |
| Computers, Engineering & Science | 31 (86.1%) | 5 (13.9%) |
| Computers & Mathematics | 31 (86.1%) | 5 (13.9%) |
| Architecture & Engineering | 0 (0.0%) | 0 (0.0%) |
| Life, Physical & Social Science | 0 (0.0%) | 0 (0.0%) |
| Community & Social Service | 13 (38.2%) | 21 (61.8%) |
| Education, Arts & Media | 0 (0.0%) | 0 (0.0%) |
| Legal Services & Support | 6 (46.2%) | 7 (53.8%) |
| Education Instruction & Library | 7 (33.3%) | 14 (66.7%) |
| Arts, Media & Entertainment | 0 (0.0%) | 0 (0.0%) |
| Health Diagnosing & Treating | 6 (8.5%) | 65 (91.5%) |
| Health Technologists | 6 (15.8%) | 32 (84.2%) |
| Total (Category) | 100 (42.5%) | 135 (57.5%) |
| Total (Overall) | 341 (51.8%) | 317 (48.2%) |
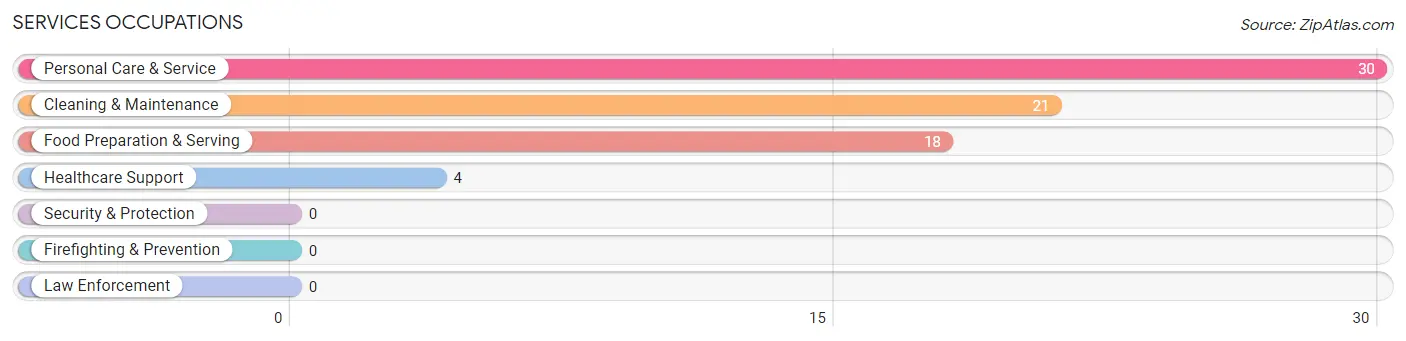
Services Occupations
The most common Services occupations in Atwood are Personal Care & Service (30 | 4.6%), Cleaning & Maintenance (21 | 3.2%), Food Preparation & Serving (18 | 2.7%), and Healthcare Support (4 | 0.6%).
Services Occupations by Sex
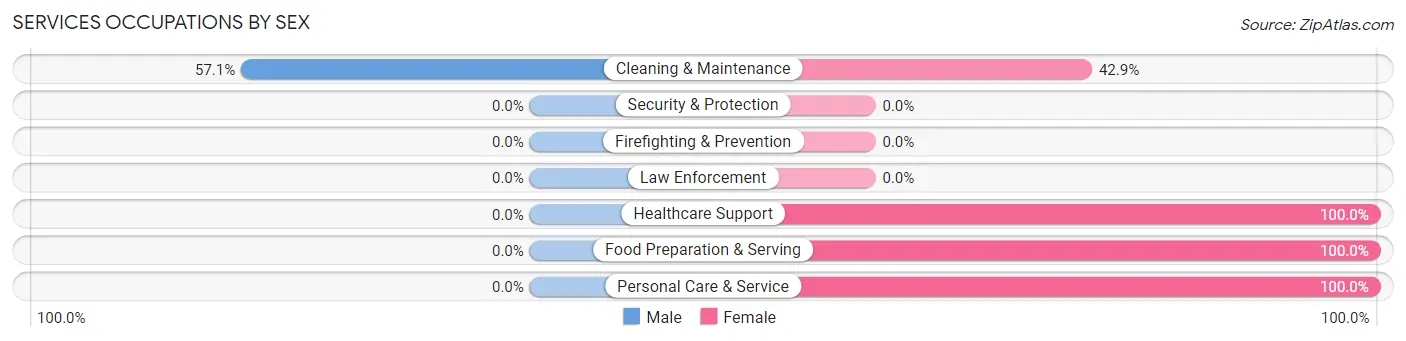
| Occupation | Male | Female |
| Healthcare Support | 0 (0.0%) | 4 (100.0%) |
| Security & Protection | 0 (0.0%) | 0 (0.0%) |
| Firefighting & Prevention | 0 (0.0%) | 0 (0.0%) |
| Law Enforcement | 0 (0.0%) | 0 (0.0%) |
| Food Preparation & Serving | 0 (0.0%) | 18 (100.0%) |
| Cleaning & Maintenance | 12 (57.1%) | 9 (42.9%) |
| Personal Care & Service | 0 (0.0%) | 30 (100.0%) |
| Total (Category) | 12 (16.4%) | 61 (83.6%) |
| Total (Overall) | 341 (51.8%) | 317 (48.2%) |
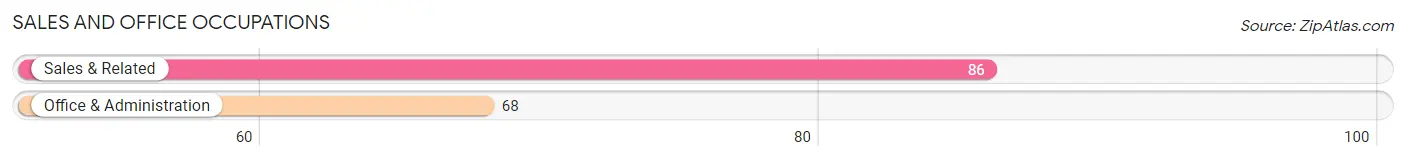
Sales and Office Occupations
The most common Sales and Office occupations in Atwood are Sales & Related (86 | 13.1%), and Office & Administration (68 | 10.3%).
Sales and Office Occupations by Sex
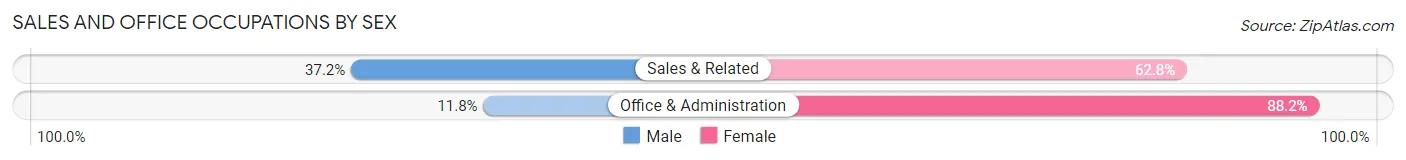
| Occupation | Male | Female |
| Sales & Related | 32 (37.2%) | 54 (62.8%) |
| Office & Administration | 8 (11.8%) | 60 (88.2%) |
| Total (Category) | 40 (26.0%) | 114 (74.0%) |
| Total (Overall) | 341 (51.8%) | 317 (48.2%) |
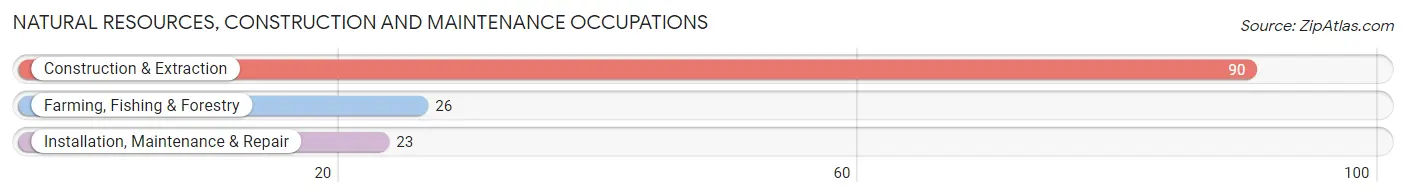
Natural Resources, Construction and Maintenance Occupations
The most common Natural Resources, Construction and Maintenance occupations in Atwood are Construction & Extraction (90 | 13.7%), Farming, Fishing & Forestry (26 | 4.0%), and Installation, Maintenance & Repair (23 | 3.5%).
Natural Resources, Construction and Maintenance Occupations by Sex
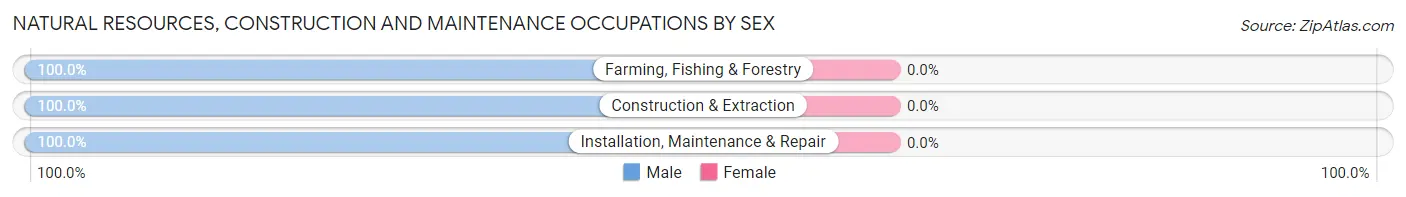
| Occupation | Male | Female |
| Farming, Fishing & Forestry | 26 (100.0%) | 0 (0.0%) |
| Construction & Extraction | 90 (100.0%) | 0 (0.0%) |
| Installation, Maintenance & Repair | 23 (100.0%) | 0 (0.0%) |
| Total (Category) | 139 (100.0%) | 0 (0.0%) |
| Total (Overall) | 341 (51.8%) | 317 (48.2%) |
Production, Transportation and Moving Occupations
The most common Production, Transportation and Moving occupations in Atwood are Material Moving (29 | 4.4%), Production (24 | 3.6%), and Transportation (4 | 0.6%).
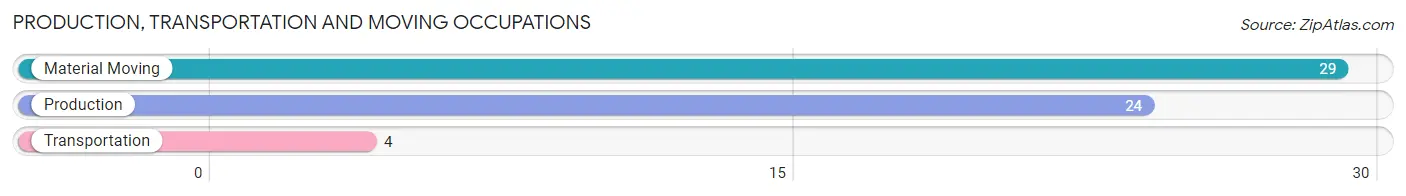
Production, Transportation and Moving Occupations by Sex
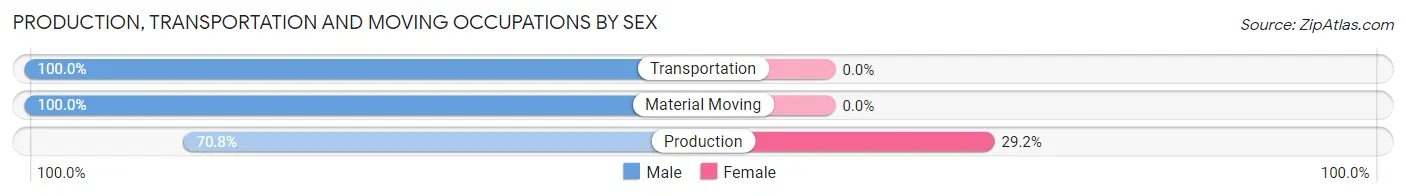
| Occupation | Male | Female |
| Production | 17 (70.8%) | 7 (29.2%) |
| Transportation | 4 (100.0%) | 0 (0.0%) |
| Material Moving | 29 (100.0%) | 0 (0.0%) |
| Total (Category) | 50 (87.7%) | 7 (12.3%) |
| Total (Overall) | 341 (51.8%) | 317 (48.2%) |
Employment Industries by Sex in Atwood
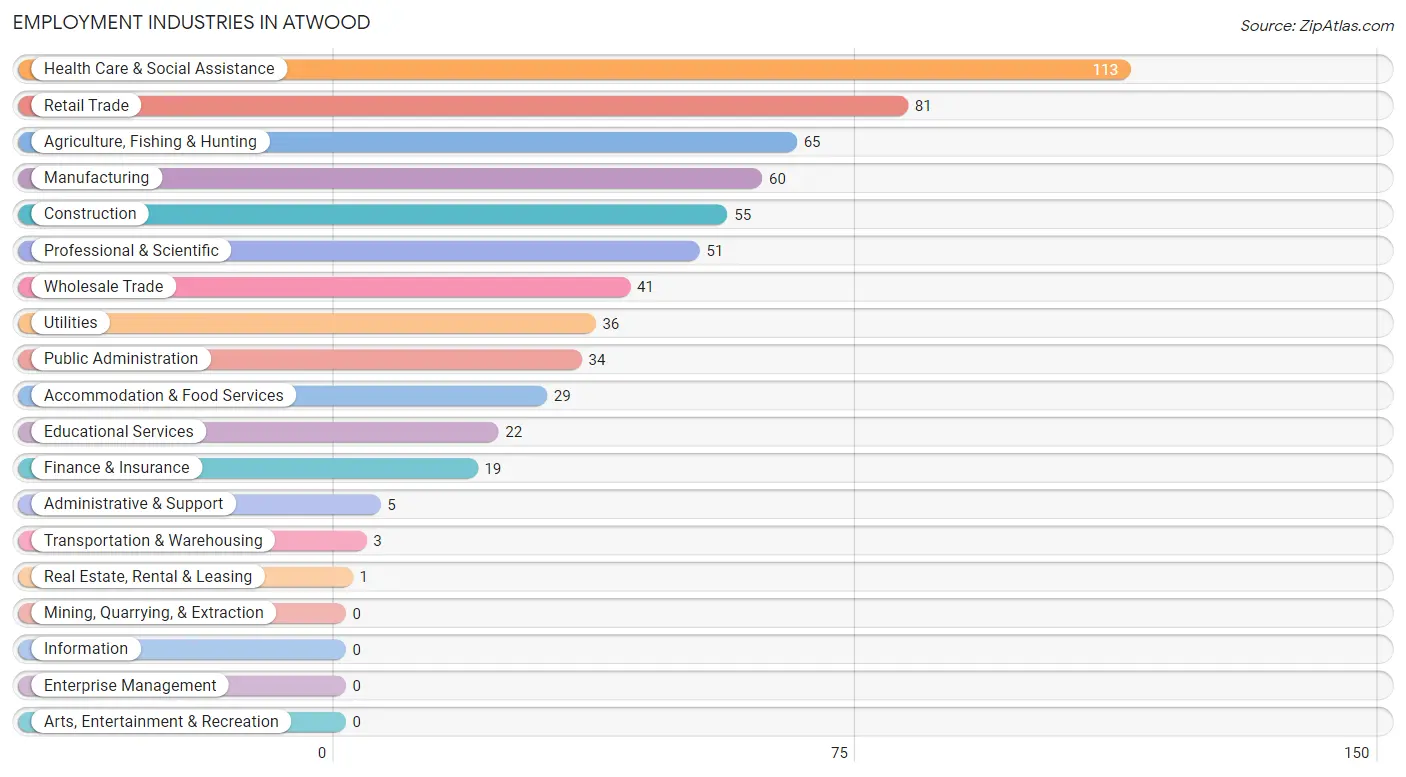
Employment Industries in Atwood
The major employment industries in Atwood include Health Care & Social Assistance (113 | 17.2%), Retail Trade (81 | 12.3%), Agriculture, Fishing & Hunting (65 | 9.9%), Manufacturing (60 | 9.1%), and Construction (55 | 8.4%).
Employment Industries by Sex in Atwood
The Atwood industries that see more men than women are Agriculture, Fishing & Hunting (100.0%), Construction (100.0%), and Utilities (100.0%), whereas the industries that tend to have a higher number of women are Transportation & Warehousing (100.0%), Finance & Insurance (100.0%), and Health Care & Social Assistance (94.7%).
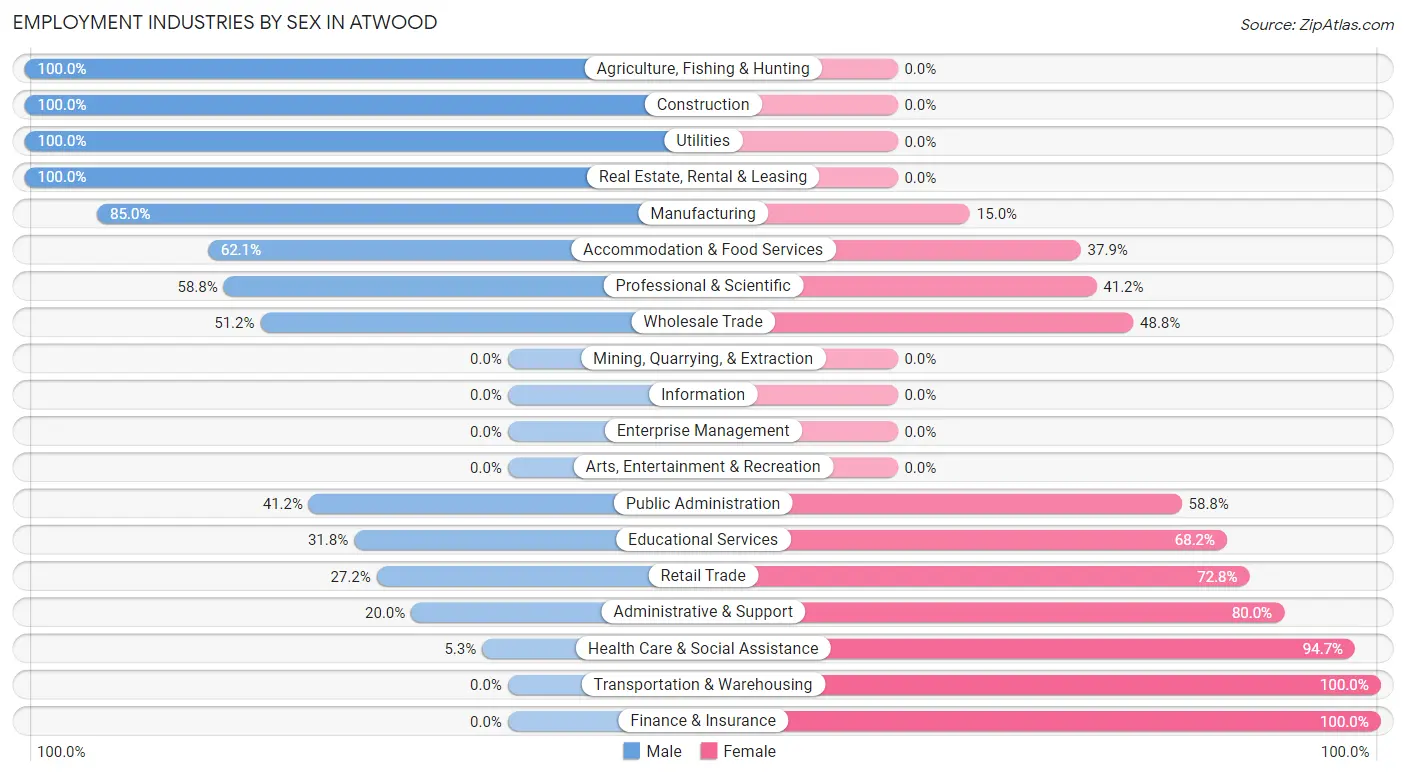
| Industry | Male | Female |
| Agriculture, Fishing & Hunting | 65 (100.0%) | 0 (0.0%) |
| Mining, Quarrying, & Extraction | 0 (0.0%) | 0 (0.0%) |
| Construction | 55 (100.0%) | 0 (0.0%) |
| Manufacturing | 51 (85.0%) | 9 (15.0%) |
| Wholesale Trade | 21 (51.2%) | 20 (48.8%) |
| Retail Trade | 22 (27.2%) | 59 (72.8%) |
| Transportation & Warehousing | 0 (0.0%) | 3 (100.0%) |
| Utilities | 36 (100.0%) | 0 (0.0%) |
| Information | 0 (0.0%) | 0 (0.0%) |
| Finance & Insurance | 0 (0.0%) | 19 (100.0%) |
| Real Estate, Rental & Leasing | 1 (100.0%) | 0 (0.0%) |
| Professional & Scientific | 30 (58.8%) | 21 (41.2%) |
| Enterprise Management | 0 (0.0%) | 0 (0.0%) |
| Administrative & Support | 1 (20.0%) | 4 (80.0%) |
| Educational Services | 7 (31.8%) | 15 (68.2%) |
| Health Care & Social Assistance | 6 (5.3%) | 107 (94.7%) |
| Arts, Entertainment & Recreation | 0 (0.0%) | 0 (0.0%) |
| Accommodation & Food Services | 18 (62.1%) | 11 (37.9%) |
| Public Administration | 14 (41.2%) | 20 (58.8%) |
| Total | 341 (51.8%) | 317 (48.2%) |
Education in Atwood
School Enrollment in Atwood
The most common levels of schooling among the 286 students in Atwood are elementary school (84 | 29.4%), middle school (70 | 24.5%), and college / undergraduate (51 | 17.8%).
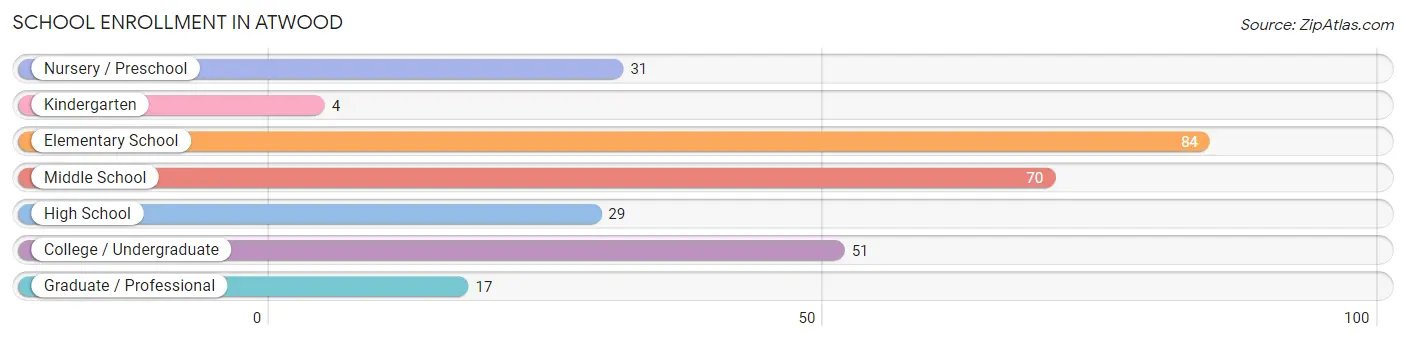
| School Level | # Students | % Students |
| Nursery / Preschool | 31 | 10.8% |
| Kindergarten | 4 | 1.4% |
| Elementary School | 84 | 29.4% |
| Middle School | 70 | 24.5% |
| High School | 29 | 10.1% |
| College / Undergraduate | 51 | 17.8% |
| Graduate / Professional | 17 | 5.9% |
| Total | 286 | 100.0% |
School Enrollment by Age by Funding Source in Atwood
Out of a total of 286 students who are enrolled in schools in Atwood, 6 (2.1%) attend a private institution, while the remaining 280 (97.9%) are enrolled in public schools. The age group of 15 to 17 year olds has the highest likelihood of being enrolled in private schools, with 6 (24.0% in the age bracket) enrolled. Conversely, the age group of 3 to 4 year olds has the lowest likelihood of being enrolled in a private school, with 29 (100.0% in the age bracket) attending a public institution.
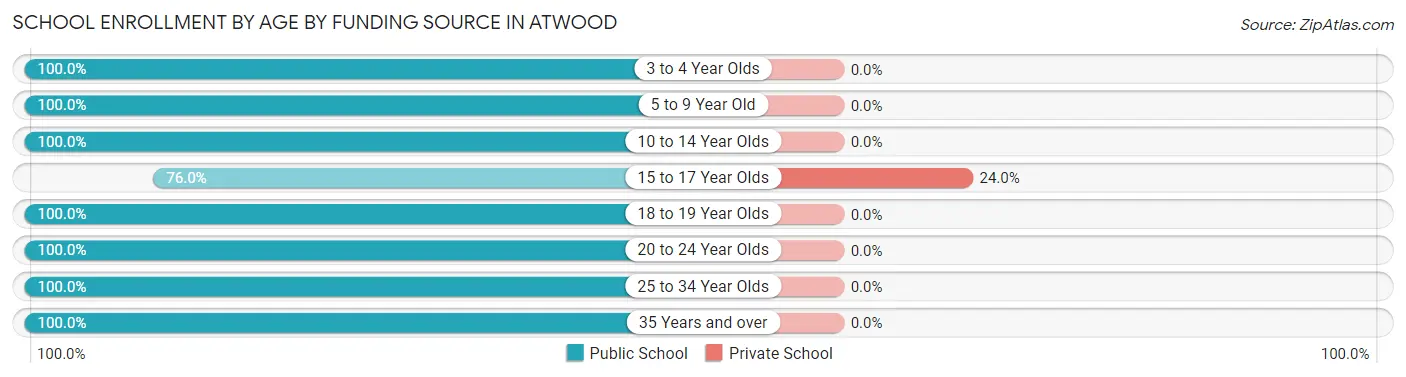
| Age Bracket | Public School | Private School |
| 3 to 4 Year Olds | 29 (100.0%) | 0 (0.0%) |
| 5 to 9 Year Old | 81 (100.0%) | 0 (0.0%) |
| 10 to 14 Year Olds | 79 (100.0%) | 0 (0.0%) |
| 15 to 17 Year Olds | 19 (76.0%) | 6 (24.0%) |
| 18 to 19 Year Olds | 4 (100.0%) | 0 (0.0%) |
| 20 to 24 Year Olds | 6 (100.0%) | 0 (0.0%) |
| 25 to 34 Year Olds | 26 (100.0%) | 0 (0.0%) |
| 35 Years and over | 36 (100.0%) | 0 (0.0%) |
| Total | 280 (97.9%) | 6 (2.1%) |
Educational Attainment by Field of Study in Atwood
Business (52 | 31.3%), science & technology (24 | 14.5%), education (20 | 12.0%), arts & humanities (20 | 12.0%), and bio, nature & agricultural (17 | 10.2%) are the most common fields of study among 166 individuals in Atwood who have obtained a bachelor's degree or higher.
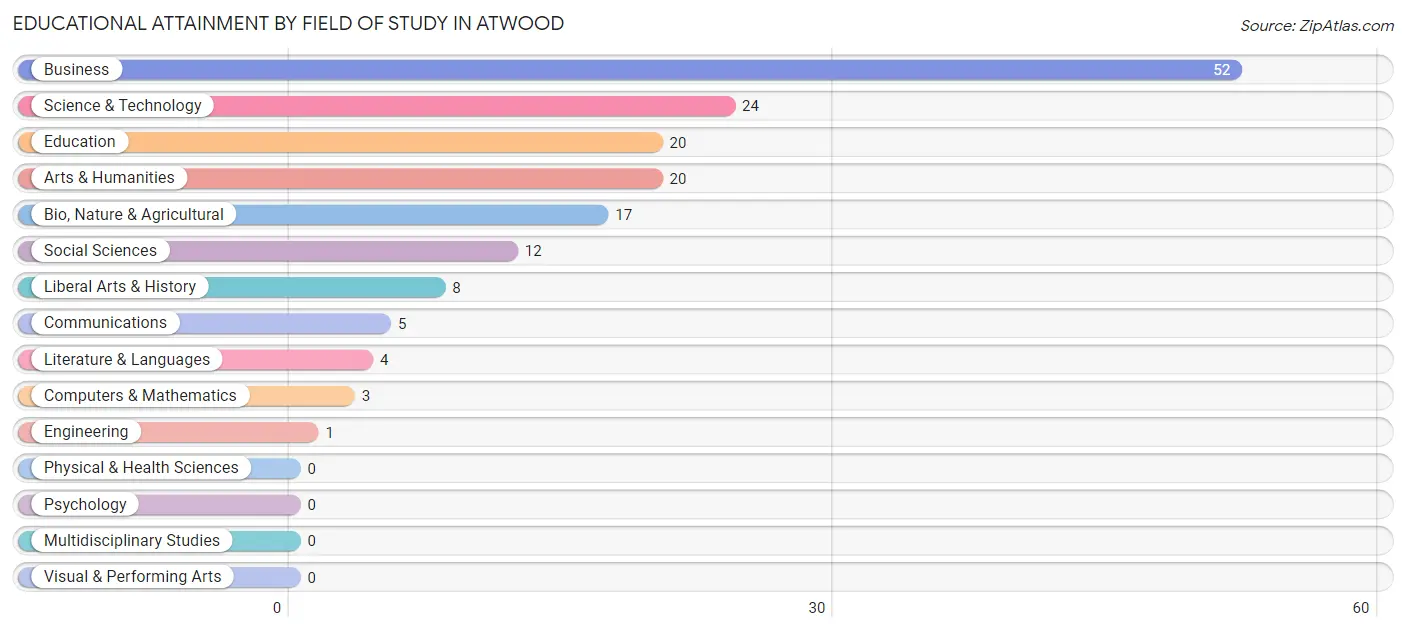
| Field of Study | # Graduates | % Graduates |
| Computers & Mathematics | 3 | 1.8% |
| Bio, Nature & Agricultural | 17 | 10.2% |
| Physical & Health Sciences | 0 | 0.0% |
| Psychology | 0 | 0.0% |
| Social Sciences | 12 | 7.2% |
| Engineering | 1 | 0.6% |
| Multidisciplinary Studies | 0 | 0.0% |
| Science & Technology | 24 | 14.5% |
| Business | 52 | 31.3% |
| Education | 20 | 12.0% |
| Literature & Languages | 4 | 2.4% |
| Liberal Arts & History | 8 | 4.8% |
| Visual & Performing Arts | 0 | 0.0% |
| Communications | 5 | 3.0% |
| Arts & Humanities | 20 | 12.0% |
| Total | 166 | 100.0% |
Transportation & Commute in Atwood
Vehicle Availability by Sex in Atwood
The most prevalent vehicle ownership categories in Atwood are males with 2 vehicles (152, accounting for 47.3%) and females with 2 vehicles (117, making up 51.3%).
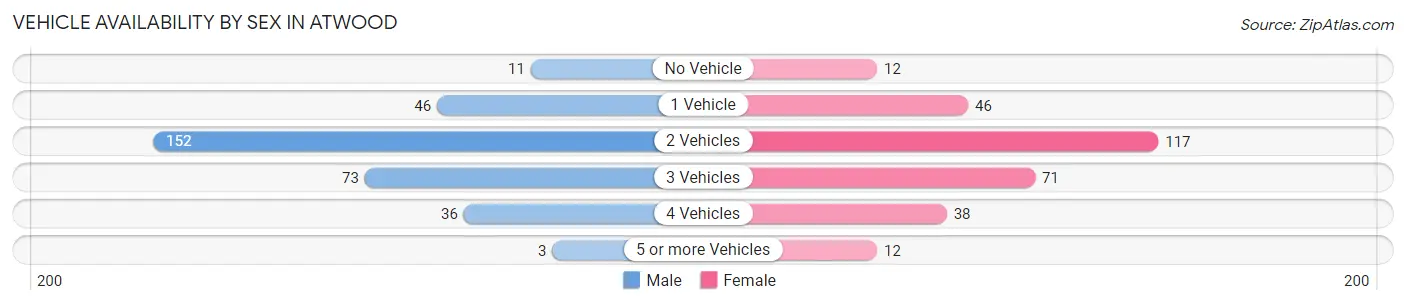
| Vehicles Available | Male | Female |
| No Vehicle | 11 (3.4%) | 12 (4.1%) |
| 1 Vehicle | 46 (14.3%) | 46 (15.5%) |
| 2 Vehicles | 152 (47.3%) | 117 (39.5%) |
| 3 Vehicles | 73 (22.7%) | 71 (24.0%) |
| 4 Vehicles | 36 (11.2%) | 38 (12.8%) |
| 5 or more Vehicles | 3 (0.9%) | 12 (4.1%) |
| Total | 321 (100.0%) | 296 (100.0%) |
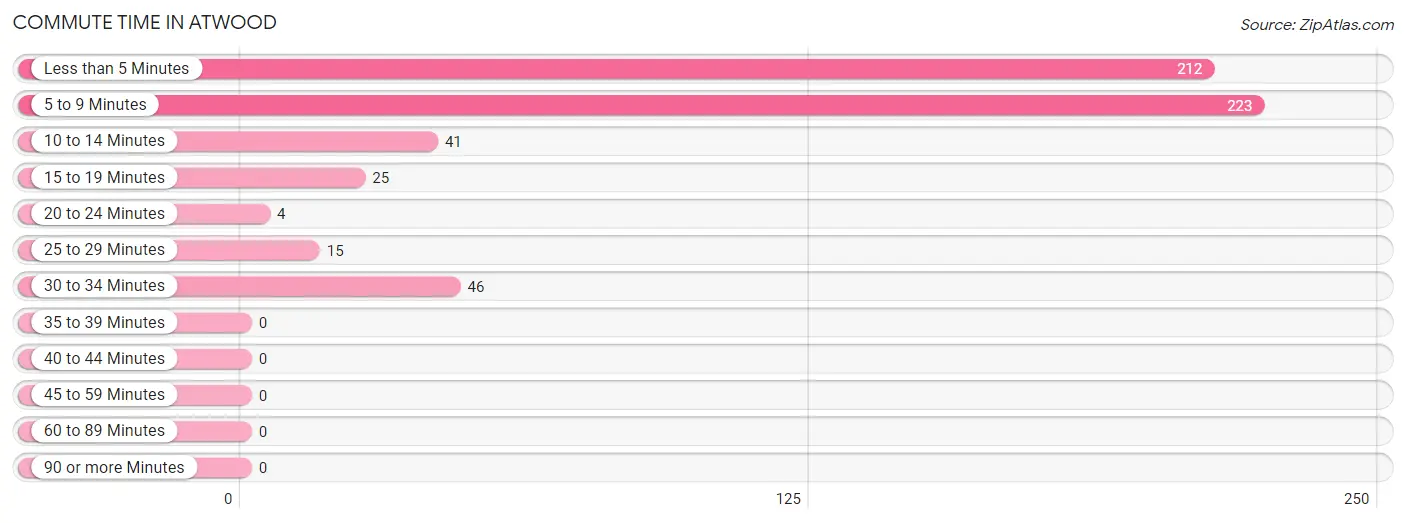
Commute Time in Atwood
The most frequently occuring commute durations in Atwood are 5 to 9 minutes (223 commuters, 39.4%), less than 5 minutes (212 commuters, 37.5%), and 30 to 34 minutes (46 commuters, 8.1%).
| Commute Time | # Commuters | % Commuters |
| Less than 5 Minutes | 212 | 37.5% |
| 5 to 9 Minutes | 223 | 39.4% |
| 10 to 14 Minutes | 41 | 7.2% |
| 15 to 19 Minutes | 25 | 4.4% |
| 20 to 24 Minutes | 4 | 0.7% |
| 25 to 29 Minutes | 15 | 2.6% |
| 30 to 34 Minutes | 46 | 8.1% |
| 35 to 39 Minutes | 0 | 0.0% |
| 40 to 44 Minutes | 0 | 0.0% |
| 45 to 59 Minutes | 0 | 0.0% |
| 60 to 89 Minutes | 0 | 0.0% |
| 90 or more Minutes | 0 | 0.0% |
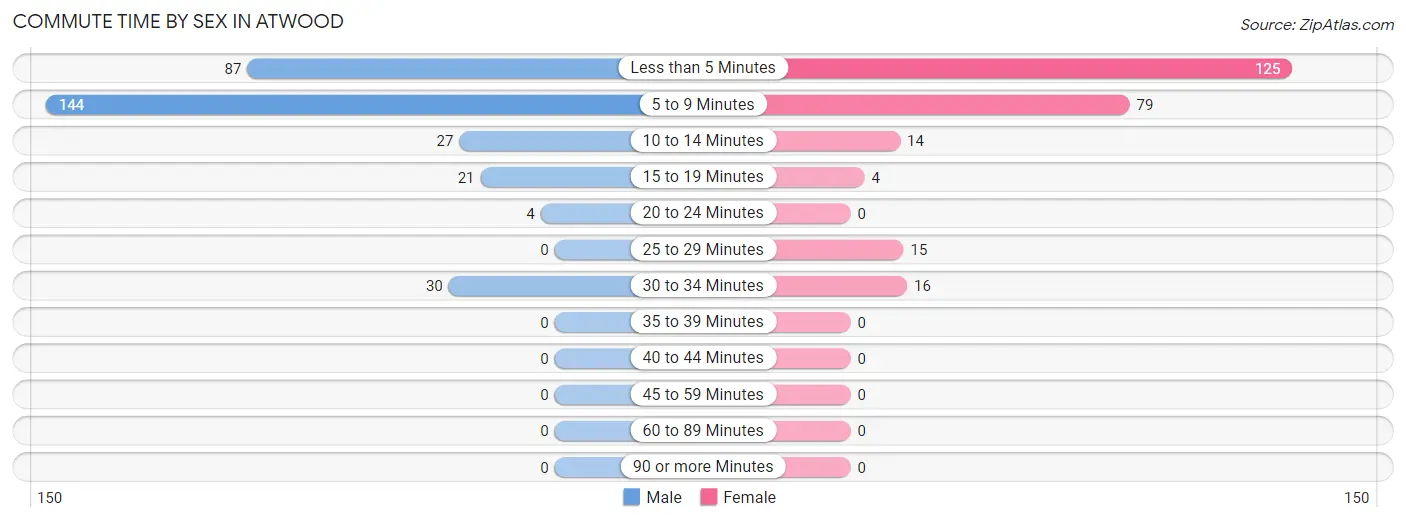
Commute Time by Sex in Atwood
The most common commute times in Atwood are 5 to 9 minutes (144 commuters, 46.0%) for males and less than 5 minutes (125 commuters, 49.4%) for females.
| Commute Time | Male | Female |
| Less than 5 Minutes | 87 (27.8%) | 125 (49.4%) |
| 5 to 9 Minutes | 144 (46.0%) | 79 (31.2%) |
| 10 to 14 Minutes | 27 (8.6%) | 14 (5.5%) |
| 15 to 19 Minutes | 21 (6.7%) | 4 (1.6%) |
| 20 to 24 Minutes | 4 (1.3%) | 0 (0.0%) |
| 25 to 29 Minutes | 0 (0.0%) | 15 (5.9%) |
| 30 to 34 Minutes | 30 (9.6%) | 16 (6.3%) |
| 35 to 39 Minutes | 0 (0.0%) | 0 (0.0%) |
| 40 to 44 Minutes | 0 (0.0%) | 0 (0.0%) |
| 45 to 59 Minutes | 0 (0.0%) | 0 (0.0%) |
| 60 to 89 Minutes | 0 (0.0%) | 0 (0.0%) |
| 90 or more Minutes | 0 (0.0%) | 0 (0.0%) |
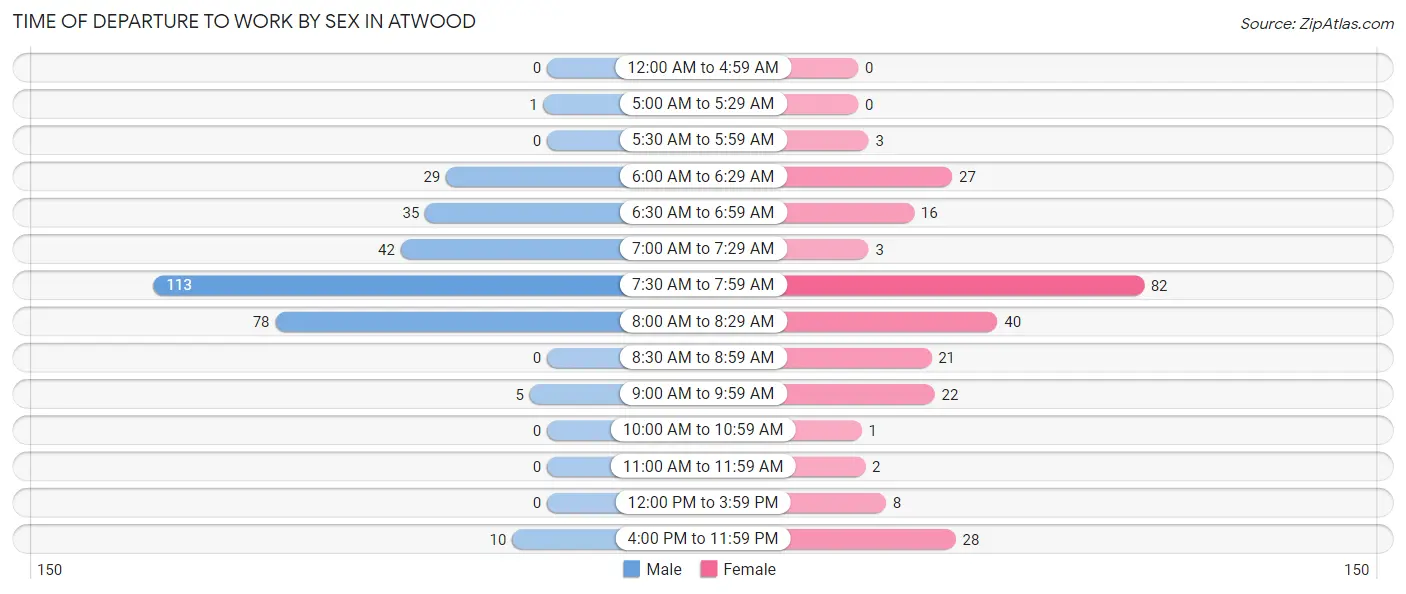
Time of Departure to Work by Sex in Atwood
The most frequent times of departure to work in Atwood are 7:30 AM to 7:59 AM (113, 36.1%) for males and 7:30 AM to 7:59 AM (82, 32.4%) for females.
| Time of Departure | Male | Female |
| 12:00 AM to 4:59 AM | 0 (0.0%) | 0 (0.0%) |
| 5:00 AM to 5:29 AM | 1 (0.3%) | 0 (0.0%) |
| 5:30 AM to 5:59 AM | 0 (0.0%) | 3 (1.2%) |
| 6:00 AM to 6:29 AM | 29 (9.3%) | 27 (10.7%) |
| 6:30 AM to 6:59 AM | 35 (11.2%) | 16 (6.3%) |
| 7:00 AM to 7:29 AM | 42 (13.4%) | 3 (1.2%) |
| 7:30 AM to 7:59 AM | 113 (36.1%) | 82 (32.4%) |
| 8:00 AM to 8:29 AM | 78 (24.9%) | 40 (15.8%) |
| 8:30 AM to 8:59 AM | 0 (0.0%) | 21 (8.3%) |
| 9:00 AM to 9:59 AM | 5 (1.6%) | 22 (8.7%) |
| 10:00 AM to 10:59 AM | 0 (0.0%) | 1 (0.4%) |
| 11:00 AM to 11:59 AM | 0 (0.0%) | 2 (0.8%) |
| 12:00 PM to 3:59 PM | 0 (0.0%) | 8 (3.2%) |
| 4:00 PM to 11:59 PM | 10 (3.2%) | 28 (11.1%) |
| Total | 313 (100.0%) | 253 (100.0%) |
Housing Occupancy in Atwood
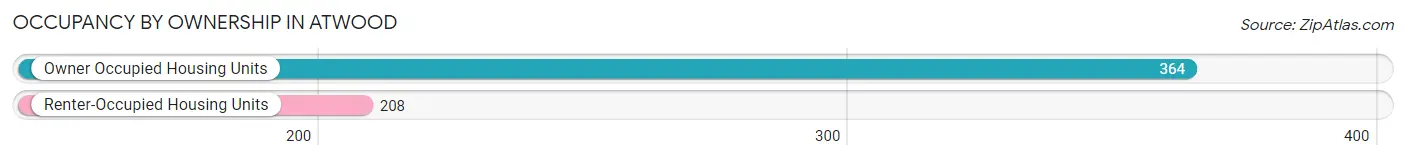
Occupancy by Ownership in Atwood
Of the total 572 dwellings in Atwood, owner-occupied units account for 364 (63.6%), while renter-occupied units make up 208 (36.4%).
| Occupancy | # Housing Units | % Housing Units |
| Owner Occupied Housing Units | 364 | 63.6% |
| Renter-Occupied Housing Units | 208 | 36.4% |
| Total Occupied Housing Units | 572 | 100.0% |
Occupancy by Household Size in Atwood
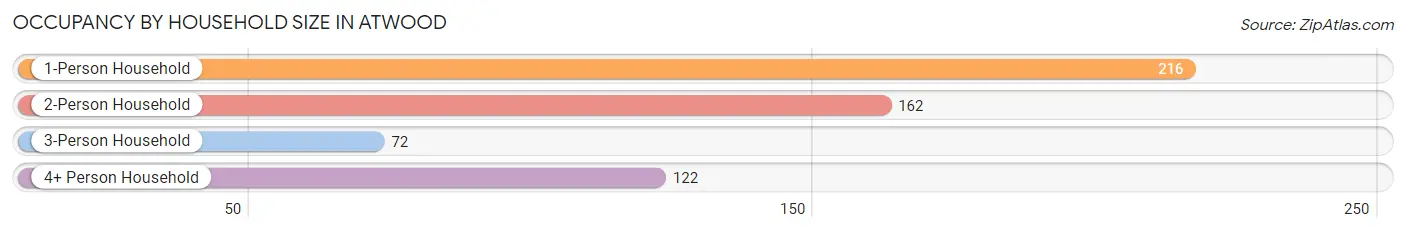
| Household Size | # Housing Units | % Housing Units |
| 1-Person Household | 216 | 37.8% |
| 2-Person Household | 162 | 28.3% |
| 3-Person Household | 72 | 12.6% |
| 4+ Person Household | 122 | 21.3% |
| Total Housing Units | 572 | 100.0% |
Occupancy by Ownership by Household Size in Atwood
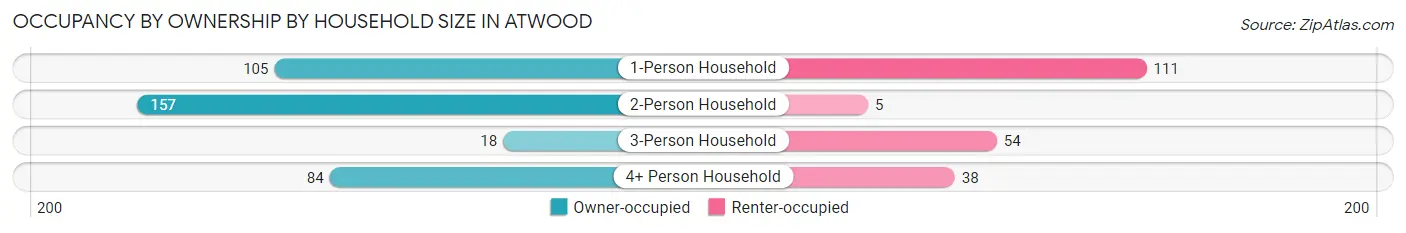
| Household Size | Owner-occupied | Renter-occupied |
| 1-Person Household | 105 (48.6%) | 111 (51.4%) |
| 2-Person Household | 157 (96.9%) | 5 (3.1%) |
| 3-Person Household | 18 (25.0%) | 54 (75.0%) |
| 4+ Person Household | 84 (68.9%) | 38 (31.1%) |
| Total Housing Units | 364 (63.6%) | 208 (36.4%) |
Occupancy by Educational Attainment in Atwood
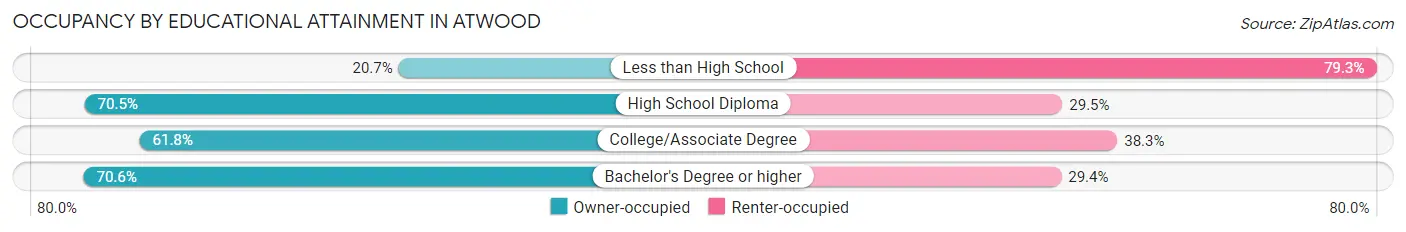
| Household Size | Owner-occupied | Renter-occupied |
| Less than High School | 6 (20.7%) | 23 (79.3%) |
| High School Diploma | 105 (70.5%) | 44 (29.5%) |
| College/Associate Degree | 176 (61.8%) | 109 (38.3%) |
| Bachelor's Degree or higher | 77 (70.6%) | 32 (29.4%) |
Occupancy by Age of Householder in Atwood
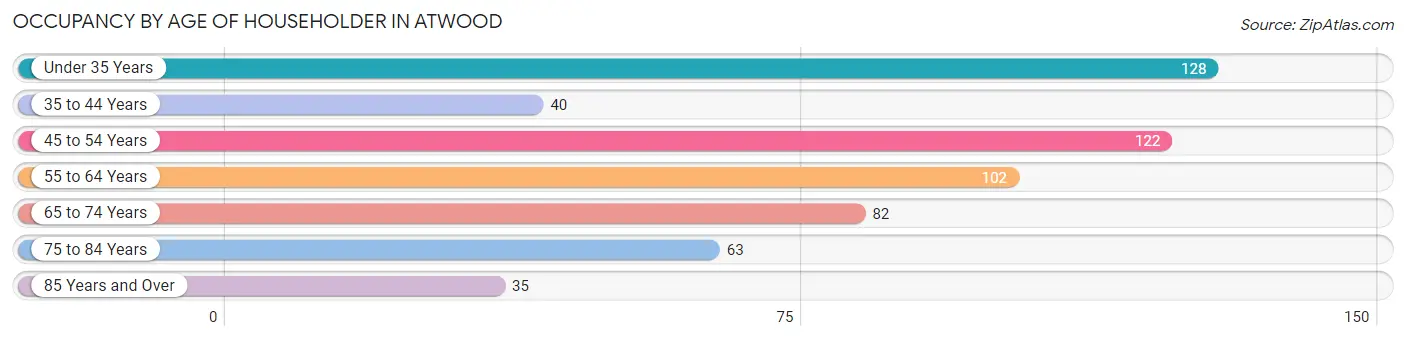
| Age Bracket | # Households | % Households |
| Under 35 Years | 128 | 22.4% |
| 35 to 44 Years | 40 | 7.0% |
| 45 to 54 Years | 122 | 21.3% |
| 55 to 64 Years | 102 | 17.8% |
| 65 to 74 Years | 82 | 14.3% |
| 75 to 84 Years | 63 | 11.0% |
| 85 Years and Over | 35 | 6.1% |
| Total | 572 | 100.0% |
Housing Finances in Atwood
Median Income by Occupancy in Atwood
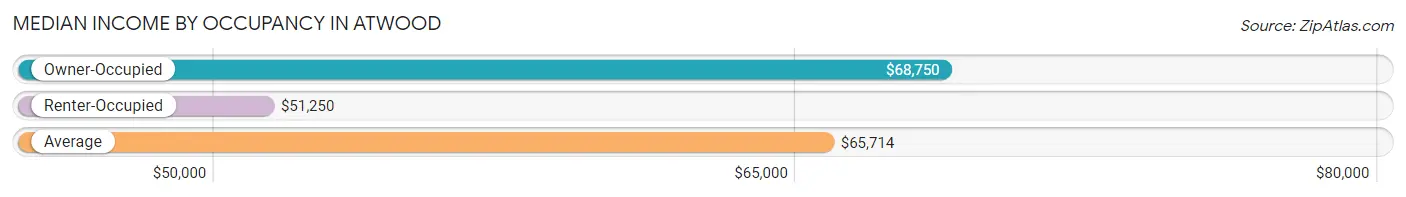
| Occupancy Type | # Households | Median Income |
| Owner-Occupied | 364 (63.6%) | $68,750 |
| Renter-Occupied | 208 (36.4%) | $51,250 |
| Average | 572 (100.0%) | $65,714 |
Occupancy by Householder Income Bracket in Atwood
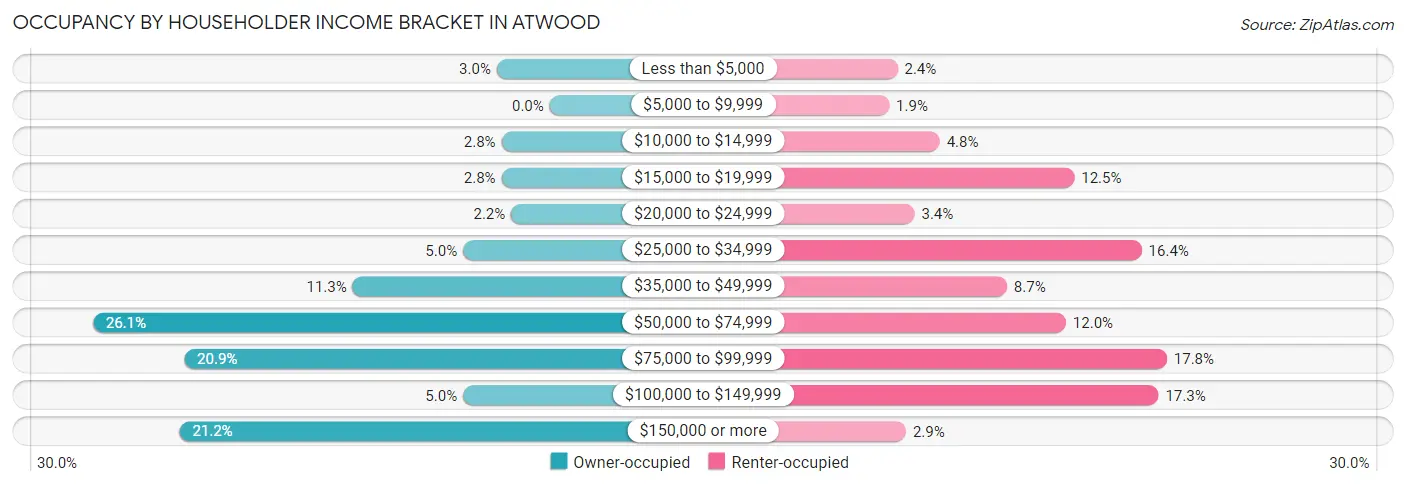
| Income Bracket | Owner-occupied | Renter-occupied |
| Less than $5,000 | 11 (3.0%) | 5 (2.4%) |
| $5,000 to $9,999 | 0 (0.0%) | 4 (1.9%) |
| $10,000 to $14,999 | 10 (2.8%) | 10 (4.8%) |
| $15,000 to $19,999 | 10 (2.8%) | 26 (12.5%) |
| $20,000 to $24,999 | 8 (2.2%) | 7 (3.4%) |
| $25,000 to $34,999 | 18 (5.0%) | 34 (16.4%) |
| $35,000 to $49,999 | 41 (11.3%) | 18 (8.6%) |
| $50,000 to $74,999 | 95 (26.1%) | 25 (12.0%) |
| $75,000 to $99,999 | 76 (20.9%) | 37 (17.8%) |
| $100,000 to $149,999 | 18 (5.0%) | 36 (17.3%) |
| $150,000 or more | 77 (21.1%) | 6 (2.9%) |
| Total | 364 (100.0%) | 208 (100.0%) |
Monthly Housing Cost Tiers in Atwood
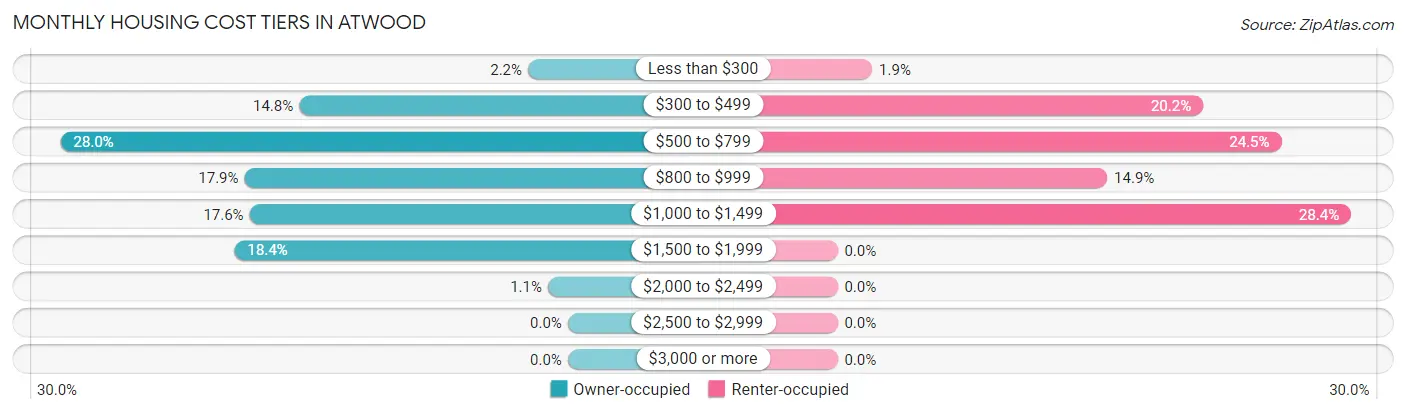
| Monthly Cost | Owner-occupied | Renter-occupied |
| Less than $300 | 8 (2.2%) | 4 (1.9%) |
| $300 to $499 | 54 (14.8%) | 42 (20.2%) |
| $500 to $799 | 102 (28.0%) | 51 (24.5%) |
| $800 to $999 | 65 (17.9%) | 31 (14.9%) |
| $1,000 to $1,499 | 64 (17.6%) | 59 (28.4%) |
| $1,500 to $1,999 | 67 (18.4%) | 0 (0.0%) |
| $2,000 to $2,499 | 4 (1.1%) | 0 (0.0%) |
| $2,500 to $2,999 | 0 (0.0%) | 0 (0.0%) |
| $3,000 or more | 0 (0.0%) | 0 (0.0%) |
| Total | 364 (100.0%) | 208 (100.0%) |
Physical Housing Characteristics in Atwood
Housing Structures in Atwood
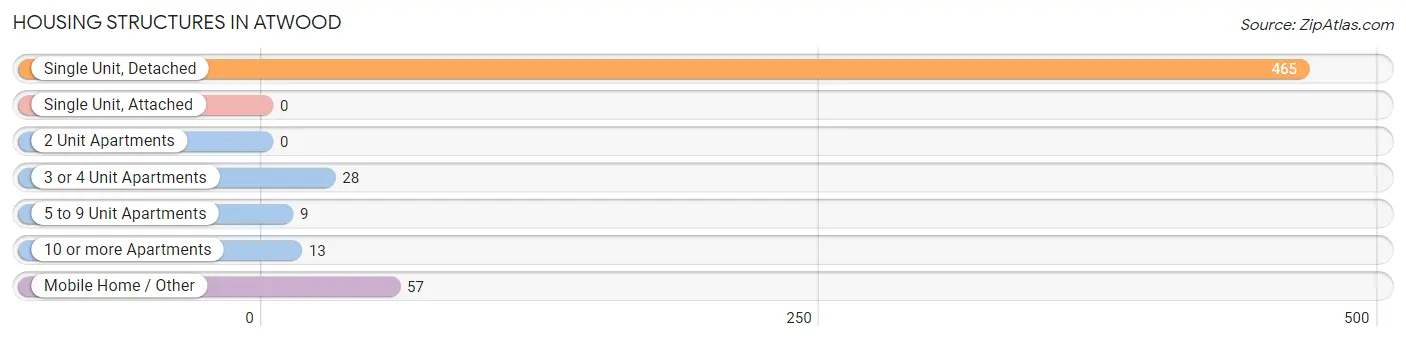
| Structure Type | # Housing Units | % Housing Units |
| Single Unit, Detached | 465 | 81.3% |
| Single Unit, Attached | 0 | 0.0% |
| 2 Unit Apartments | 0 | 0.0% |
| 3 or 4 Unit Apartments | 28 | 4.9% |
| 5 to 9 Unit Apartments | 9 | 1.6% |
| 10 or more Apartments | 13 | 2.3% |
| Mobile Home / Other | 57 | 10.0% |
| Total | 572 | 100.0% |
Housing Structures by Occupancy in Atwood
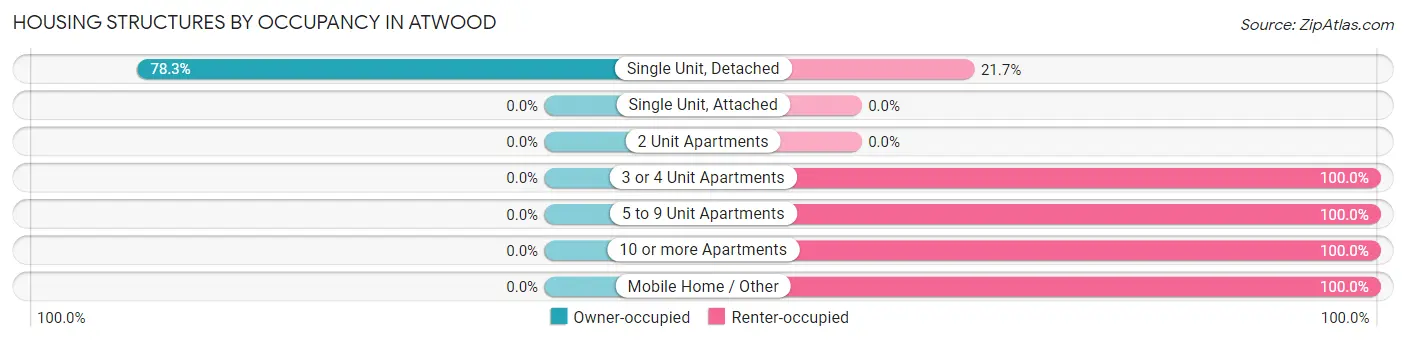
| Structure Type | Owner-occupied | Renter-occupied |
| Single Unit, Detached | 364 (78.3%) | 101 (21.7%) |
| Single Unit, Attached | 0 (0.0%) | 0 (0.0%) |
| 2 Unit Apartments | 0 (0.0%) | 0 (0.0%) |
| 3 or 4 Unit Apartments | 0 (0.0%) | 28 (100.0%) |
| 5 to 9 Unit Apartments | 0 (0.0%) | 9 (100.0%) |
| 10 or more Apartments | 0 (0.0%) | 13 (100.0%) |
| Mobile Home / Other | 0 (0.0%) | 57 (100.0%) |
| Total | 364 (63.6%) | 208 (36.4%) |
Housing Structures by Number of Rooms in Atwood
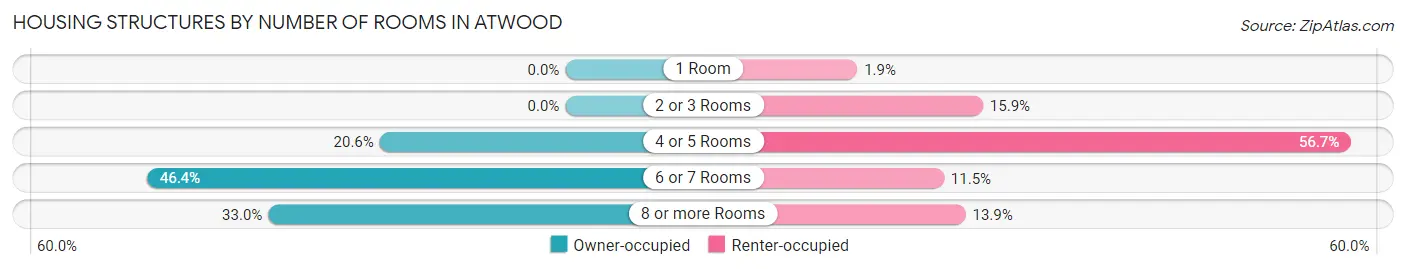
| Number of Rooms | Owner-occupied | Renter-occupied |
| 1 Room | 0 (0.0%) | 4 (1.9%) |
| 2 or 3 Rooms | 0 (0.0%) | 33 (15.9%) |
| 4 or 5 Rooms | 75 (20.6%) | 118 (56.7%) |
| 6 or 7 Rooms | 169 (46.4%) | 24 (11.5%) |
| 8 or more Rooms | 120 (33.0%) | 29 (13.9%) |
| Total | 364 (100.0%) | 208 (100.0%) |
Housing Structure by Heating Type in Atwood
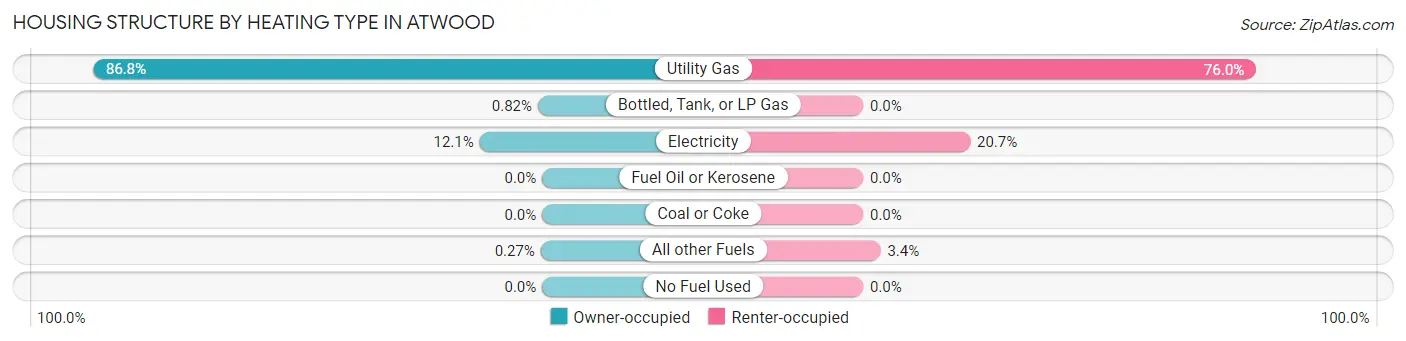
| Heating Type | Owner-occupied | Renter-occupied |
| Utility Gas | 316 (86.8%) | 158 (76.0%) |
| Bottled, Tank, or LP Gas | 3 (0.8%) | 0 (0.0%) |
| Electricity | 44 (12.1%) | 43 (20.7%) |
| Fuel Oil or Kerosene | 0 (0.0%) | 0 (0.0%) |
| Coal or Coke | 0 (0.0%) | 0 (0.0%) |
| All other Fuels | 1 (0.3%) | 7 (3.4%) |
| No Fuel Used | 0 (0.0%) | 0 (0.0%) |
| Total | 364 (100.0%) | 208 (100.0%) |
Household Vehicle Usage in Atwood
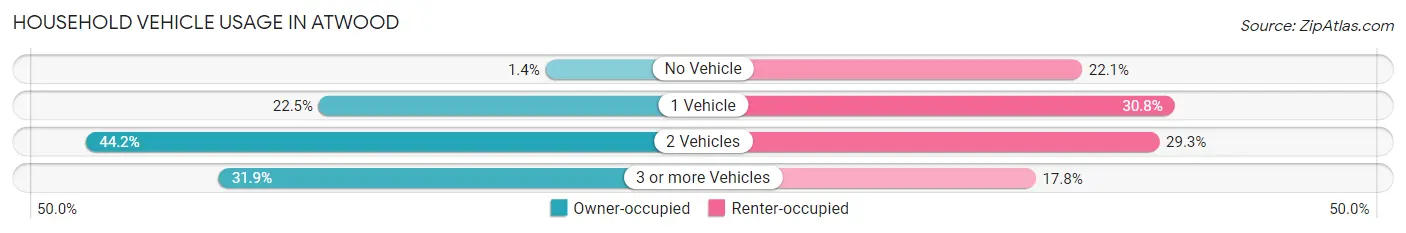
| Vehicles per Household | Owner-occupied | Renter-occupied |
| No Vehicle | 5 (1.4%) | 46 (22.1%) |
| 1 Vehicle | 82 (22.5%) | 64 (30.8%) |
| 2 Vehicles | 161 (44.2%) | 61 (29.3%) |
| 3 or more Vehicles | 116 (31.9%) | 37 (17.8%) |
| Total | 364 (100.0%) | 208 (100.0%) |
Real Estate & Mortgages in Atwood
Real Estate and Mortgage Overview in Atwood
| Characteristic | Without Mortgage | With Mortgage |
| Housing Units | 213 | 151 |
| Median Property Value | $93,900 | $152,800 |
| Median Household Income | $65,774 | $55 |
| Monthly Housing Costs | $570 | $0 |
| Real Estate Taxes | $1,738 | $0 |
Property Value by Mortgage Status in Atwood
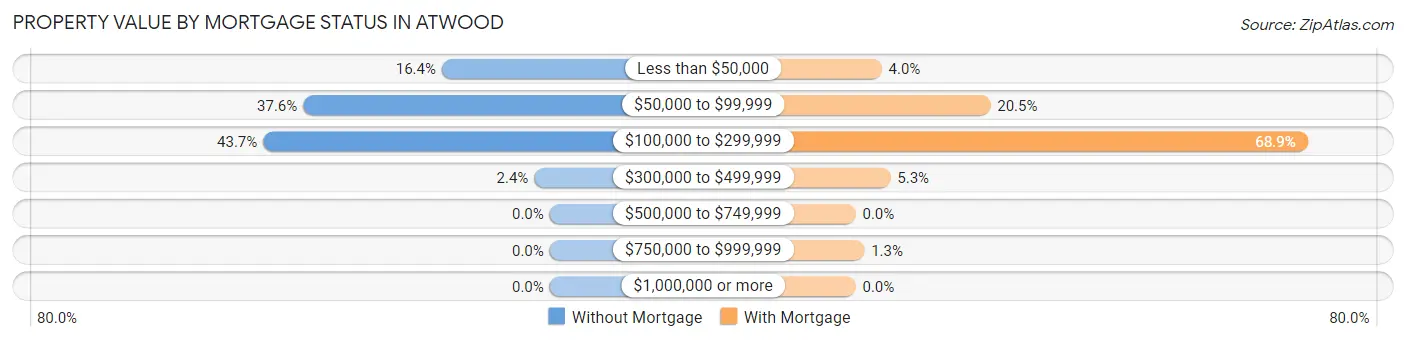
| Property Value | Without Mortgage | With Mortgage |
| Less than $50,000 | 35 (16.4%) | 6 (4.0%) |
| $50,000 to $99,999 | 80 (37.6%) | 31 (20.5%) |
| $100,000 to $299,999 | 93 (43.7%) | 104 (68.9%) |
| $300,000 to $499,999 | 5 (2.4%) | 8 (5.3%) |
| $500,000 to $749,999 | 0 (0.0%) | 0 (0.0%) |
| $750,000 to $999,999 | 0 (0.0%) | 2 (1.3%) |
| $1,000,000 or more | 0 (0.0%) | 0 (0.0%) |
| Total | 213 (100.0%) | 151 (100.0%) |
Household Income by Mortgage Status in Atwood
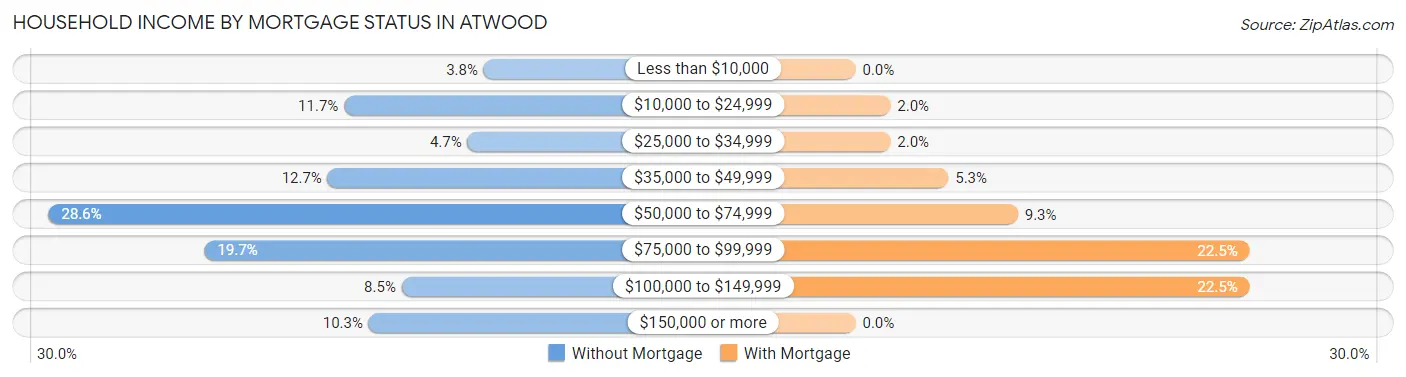
| Household Income | Without Mortgage | With Mortgage |
| Less than $10,000 | 8 (3.8%) | 0 (0.0%) |
| $10,000 to $24,999 | 25 (11.7%) | 3 (2.0%) |
| $25,000 to $34,999 | 10 (4.7%) | 3 (2.0%) |
| $35,000 to $49,999 | 27 (12.7%) | 8 (5.3%) |
| $50,000 to $74,999 | 61 (28.6%) | 14 (9.3%) |
| $75,000 to $99,999 | 42 (19.7%) | 34 (22.5%) |
| $100,000 to $149,999 | 18 (8.5%) | 34 (22.5%) |
| $150,000 or more | 22 (10.3%) | 0 (0.0%) |
| Total | 213 (100.0%) | 151 (100.0%) |
Property Value to Household Income Ratio in Atwood
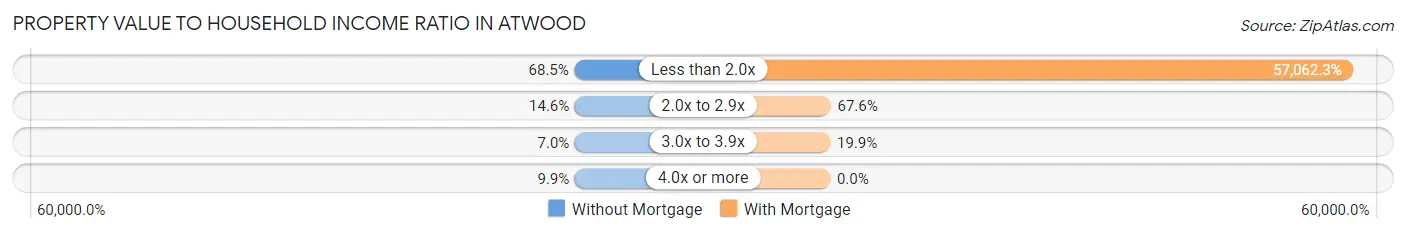
| Value-to-Income Ratio | Without Mortgage | With Mortgage |
| Less than 2.0x | 146 (68.5%) | 86,164 (57,062.2%) |
| 2.0x to 2.9x | 31 (14.5%) | 102 (67.5%) |
| 3.0x to 3.9x | 15 (7.0%) | 30 (19.9%) |
| 4.0x or more | 21 (9.9%) | 0 (0.0%) |
| Total | 213 (100.0%) | 151 (100.0%) |
Real Estate Taxes by Mortgage Status in Atwood
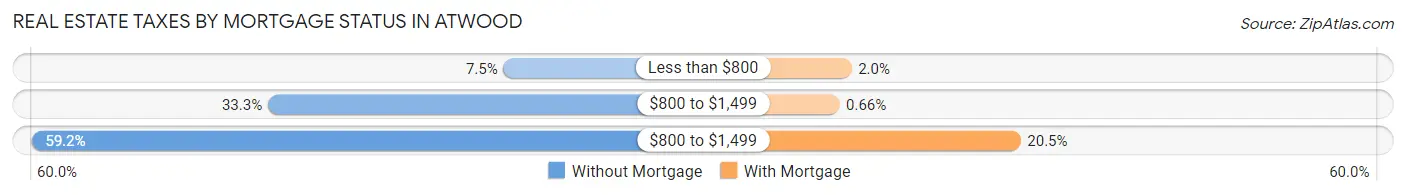
| Property Taxes | Without Mortgage | With Mortgage |
| Less than $800 | 16 (7.5%) | 3 (2.0%) |
| $800 to $1,499 | 71 (33.3%) | 1 (0.7%) |
| $800 to $1,499 | 126 (59.2%) | 31 (20.5%) |
| Total | 213 (100.0%) | 151 (100.0%) |
Health & Disability in Atwood
Health Insurance Coverage by Age in Atwood
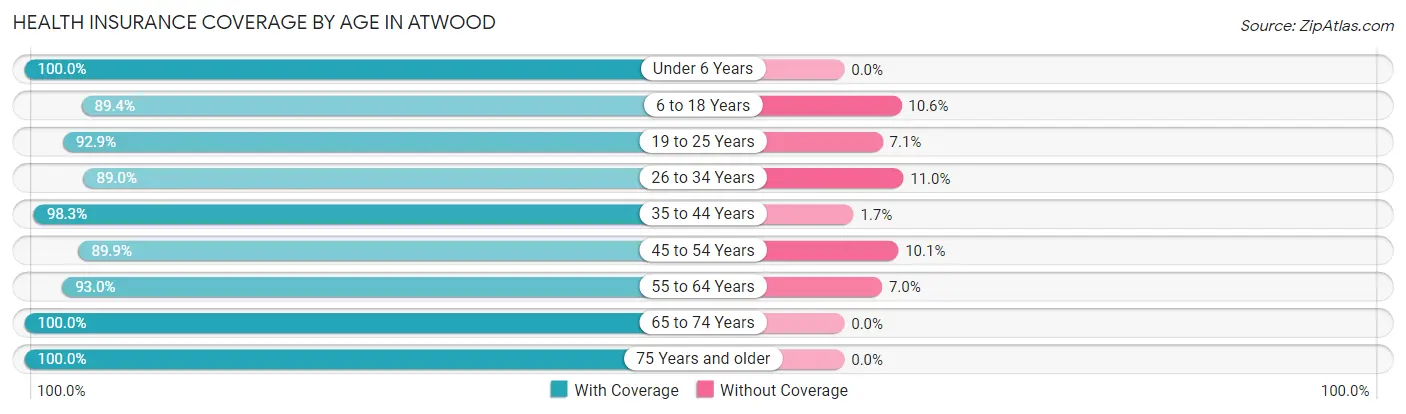
| Age Bracket | With Coverage | Without Coverage |
| Under 6 Years | 87 (100.0%) | 0 (0.0%) |
| 6 to 18 Years | 168 (89.4%) | 20 (10.6%) |
| 19 to 25 Years | 13 (92.9%) | 1 (7.1%) |
| 26 to 34 Years | 178 (89.0%) | 22 (11.0%) |
| 35 to 44 Years | 114 (98.3%) | 2 (1.7%) |
| 45 to 54 Years | 143 (89.9%) | 16 (10.1%) |
| 55 to 64 Years | 159 (93.0%) | 12 (7.0%) |
| 65 to 74 Years | 115 (100.0%) | 0 (0.0%) |
| 75 Years and older | 153 (100.0%) | 0 (0.0%) |
| Total | 1,130 (93.9%) | 73 (6.1%) |
Health Insurance Coverage by Citizenship Status in Atwood
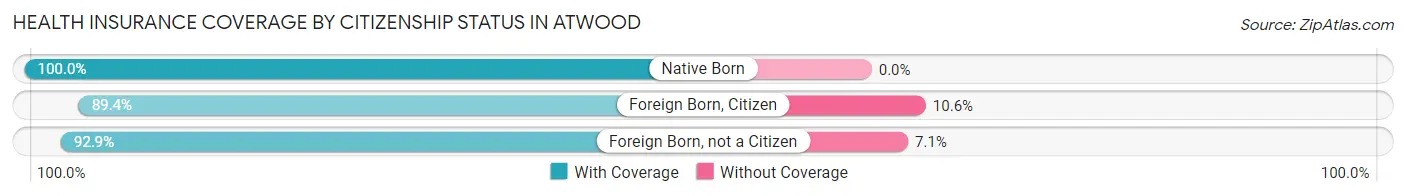
| Citizenship Status | With Coverage | Without Coverage |
| Native Born | 87 (100.0%) | 0 (0.0%) |
| Foreign Born, Citizen | 168 (89.4%) | 20 (10.6%) |
| Foreign Born, not a Citizen | 13 (92.9%) | 1 (7.1%) |
Health Insurance Coverage by Household Income in Atwood
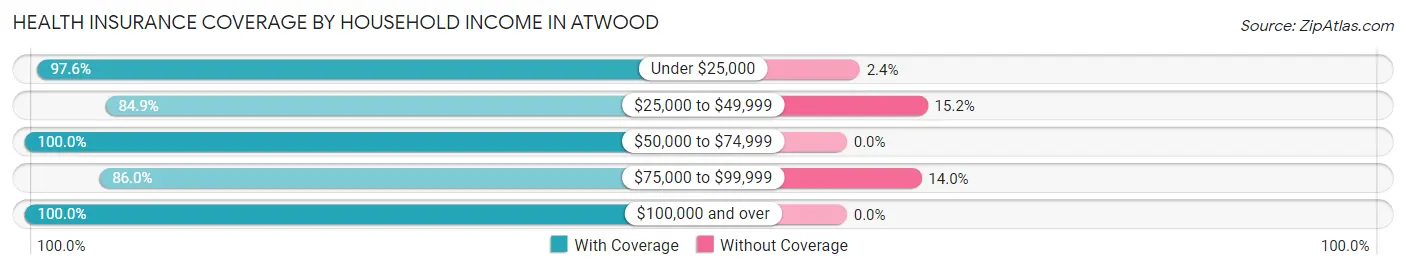
| Household Income | With Coverage | Without Coverage |
| Under $25,000 | 121 (97.6%) | 3 (2.4%) |
| $25,000 to $49,999 | 140 (84.9%) | 25 (15.1%) |
| $50,000 to $74,999 | 243 (100.0%) | 0 (0.0%) |
| $75,000 to $99,999 | 277 (86.0%) | 45 (14.0%) |
| $100,000 and over | 349 (100.0%) | 0 (0.0%) |
Public vs Private Health Insurance Coverage by Age in Atwood
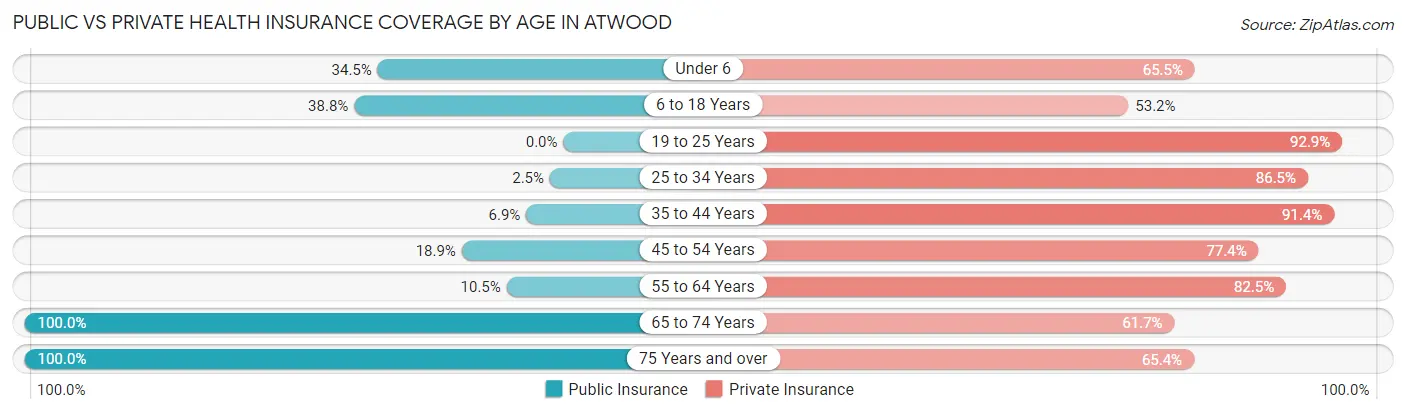
| Age Bracket | Public Insurance | Private Insurance |
| Under 6 | 30 (34.5%) | 57 (65.5%) |
| 6 to 18 Years | 73 (38.8%) | 100 (53.2%) |
| 19 to 25 Years | 0 (0.0%) | 13 (92.9%) |
| 25 to 34 Years | 5 (2.5%) | 173 (86.5%) |
| 35 to 44 Years | 8 (6.9%) | 106 (91.4%) |
| 45 to 54 Years | 30 (18.9%) | 123 (77.4%) |
| 55 to 64 Years | 18 (10.5%) | 141 (82.5%) |
| 65 to 74 Years | 115 (100.0%) | 71 (61.7%) |
| 75 Years and over | 153 (100.0%) | 100 (65.4%) |
| Total | 432 (35.9%) | 884 (73.5%) |
Disability Status by Sex by Age in Atwood
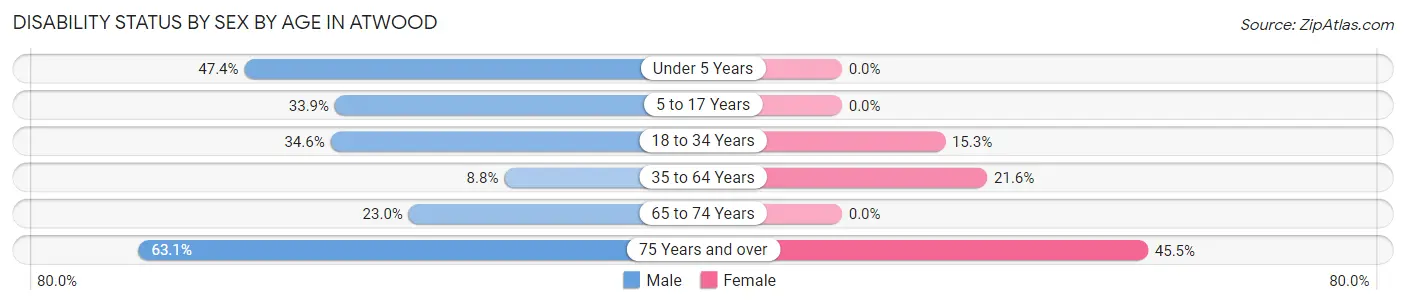
| Age Bracket | Male | Female |
| Under 5 Years | 18 (47.4%) | 0 (0.0%) |
| 5 to 17 Years | 38 (33.9%) | 0 (0.0%) |
| 18 to 34 Years | 37 (34.6%) | 17 (15.3%) |
| 35 to 64 Years | 18 (8.8%) | 52 (21.6%) |
| 65 to 74 Years | 17 (23.0%) | 0 (0.0%) |
| 75 Years and over | 41 (63.1%) | 40 (45.5%) |
Disability Class by Sex by Age in Atwood
Disability Class: Hearing Difficulty
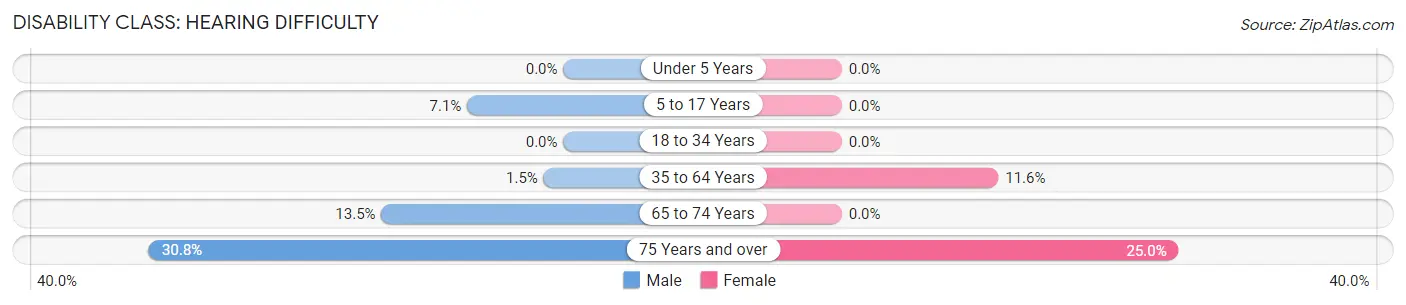
| Age Bracket | Male | Female |
| Under 5 Years | 0 (0.0%) | 0 (0.0%) |
| 5 to 17 Years | 8 (7.1%) | 0 (0.0%) |
| 18 to 34 Years | 0 (0.0%) | 0 (0.0%) |
| 35 to 64 Years | 3 (1.5%) | 28 (11.6%) |
| 65 to 74 Years | 10 (13.5%) | 0 (0.0%) |
| 75 Years and over | 20 (30.8%) | 22 (25.0%) |
Disability Class: Vision Difficulty
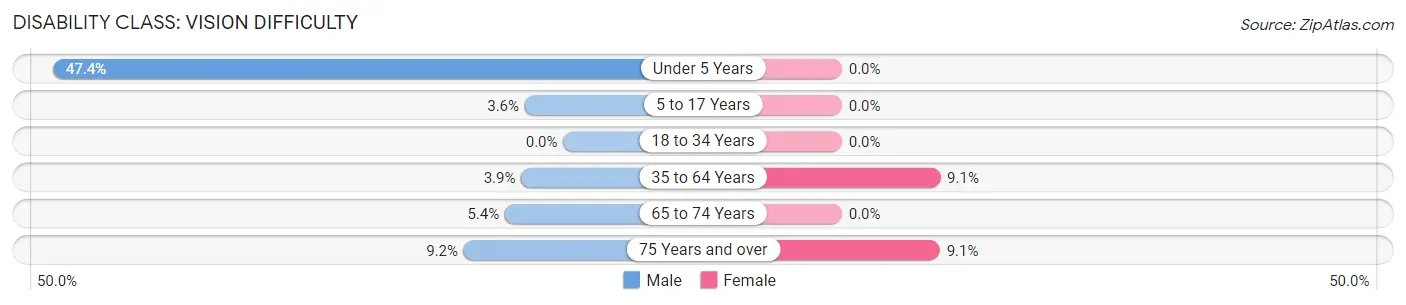
| Age Bracket | Male | Female |
| Under 5 Years | 18 (47.4%) | 0 (0.0%) |
| 5 to 17 Years | 4 (3.6%) | 0 (0.0%) |
| 18 to 34 Years | 0 (0.0%) | 0 (0.0%) |
| 35 to 64 Years | 8 (3.9%) | 22 (9.1%) |
| 65 to 74 Years | 4 (5.4%) | 0 (0.0%) |
| 75 Years and over | 6 (9.2%) | 8 (9.1%) |
Disability Class: Cognitive Difficulty
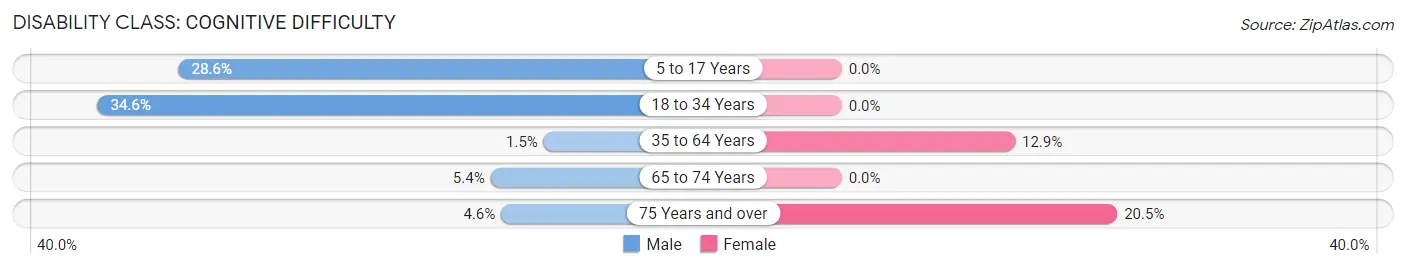
| Age Bracket | Male | Female |
| 5 to 17 Years | 32 (28.6%) | 0 (0.0%) |
| 18 to 34 Years | 37 (34.6%) | 0 (0.0%) |
| 35 to 64 Years | 3 (1.5%) | 31 (12.9%) |
| 65 to 74 Years | 4 (5.4%) | 0 (0.0%) |
| 75 Years and over | 3 (4.6%) | 18 (20.4%) |
Disability Class: Ambulatory Difficulty
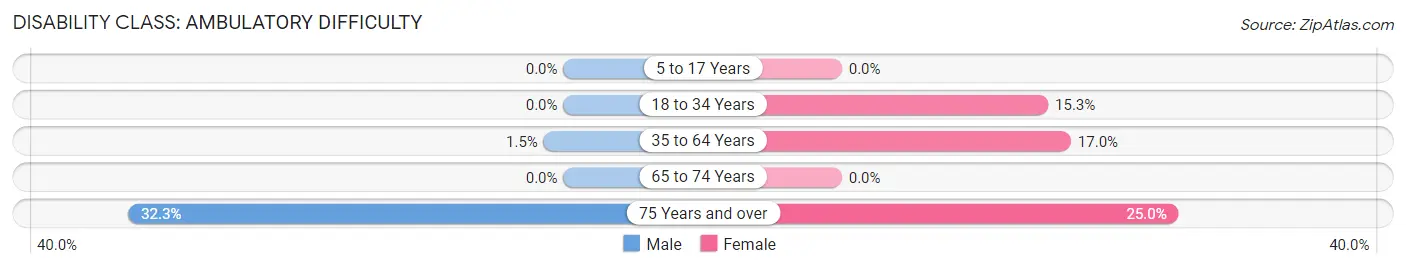
| Age Bracket | Male | Female |
| 5 to 17 Years | 0 (0.0%) | 0 (0.0%) |
| 18 to 34 Years | 0 (0.0%) | 17 (15.3%) |
| 35 to 64 Years | 3 (1.5%) | 41 (17.0%) |
| 65 to 74 Years | 0 (0.0%) | 0 (0.0%) |
| 75 Years and over | 21 (32.3%) | 22 (25.0%) |
Disability Class: Self-Care Difficulty
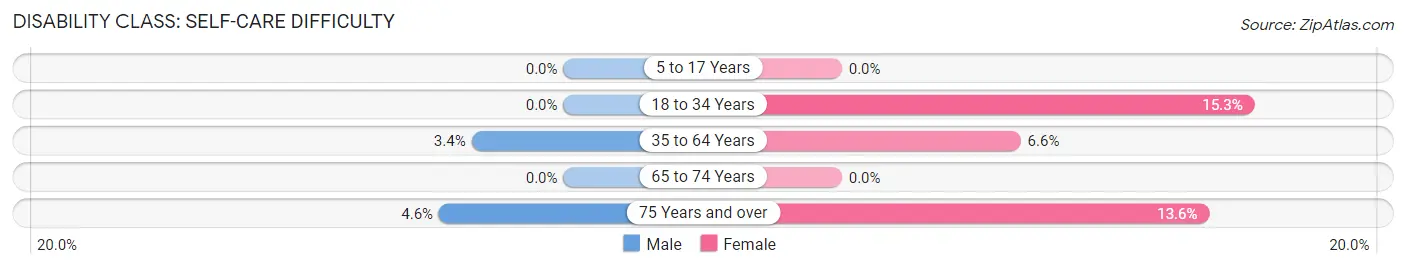
| Age Bracket | Male | Female |
| 5 to 17 Years | 0 (0.0%) | 0 (0.0%) |
| 18 to 34 Years | 0 (0.0%) | 17 (15.3%) |
| 35 to 64 Years | 7 (3.4%) | 16 (6.6%) |
| 65 to 74 Years | 0 (0.0%) | 0 (0.0%) |
| 75 Years and over | 3 (4.6%) | 12 (13.6%) |
Technology Access in Atwood
Computing Device Access in Atwood
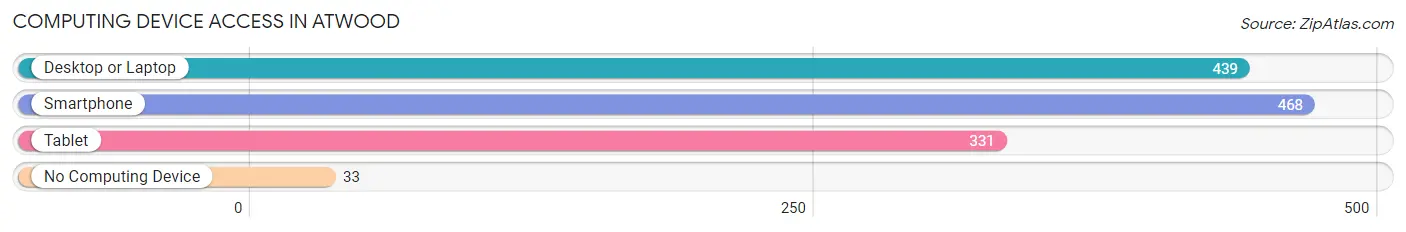
| Device Type | # Households | % Households |
| Desktop or Laptop | 439 | 76.7% |
| Smartphone | 468 | 81.8% |
| Tablet | 331 | 57.9% |
| No Computing Device | 33 | 5.8% |
| Total | 572 | 100.0% |
Internet Access in Atwood
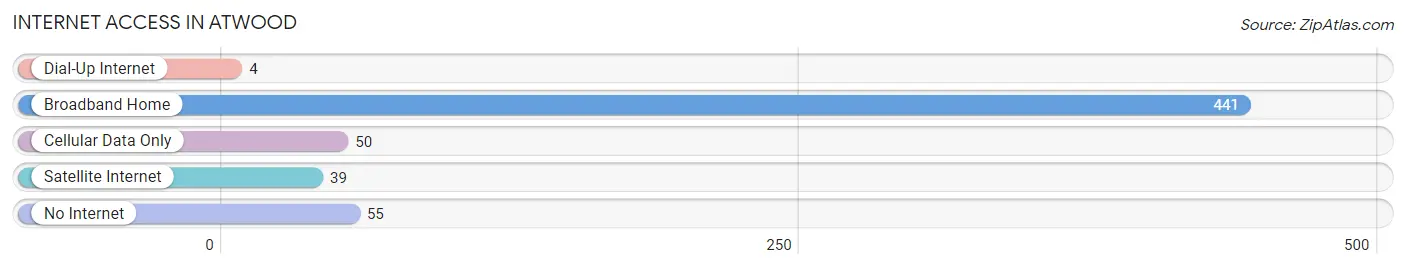
| Internet Type | # Households | % Households |
| Dial-Up Internet | 4 | 0.7% |
| Broadband Home | 441 | 77.1% |
| Cellular Data Only | 50 | 8.7% |
| Satellite Internet | 39 | 6.8% |
| No Internet | 55 | 9.6% |
| Total | 572 | 100.0% |
Atwood Summary
Atwood is a small city located in Rawlins County, Kansas, United States. It is situated along the Republican River, approximately 20 miles east of the Colorado border. The population was 1,845 at the 2010 census.
History
Atwood was founded in 1885 by the Atwood Town Company, which was formed by a group of settlers from Atwood, Illinois. The town was named after the original Atwood, Illinois, which was named after a prominent local family. The first post office was established in 1885.
Atwood was incorporated as a city in 1887. The city was a major stop on the Union Pacific Railroad, and the Atwood Depot was built in 1887. The depot was used as a passenger and freight station until it was closed in the 1950s.
Geography
Atwood is located at 39°45'25" North, 101°14'45" West (39.756944, -101.245833). According to the United States Census Bureau, the city has a total area of 1.2 square miles (3.1 km2), all of it land.
Economy
Atwood is a small agricultural community, with the majority of its economy based on farming and ranching. The city is home to several businesses, including a grocery store, a hardware store, a bank, and a few restaurants.
Demographics
As of the census of 2010, there were 1,845 people, 745 households, and 486 families residing in the city. The population density was 1,539.2 people per square mile (595.2/km2). There were 845 housing units at an average density of 704.2 per square mile (272.3/km2). The racial makeup of the city was 97.2% White, 0.2% African American, 0.3% Native American, 0.2% Asian, 0.2% from other races, and 1.9% from two or more races. Hispanic or Latino of any race were 1.2% of the population.
There were 745 households, out of which 28.2% had children under the age of 18 living with them, 51.2% were married couples living together, 8.7% had a female householder with no husband present, and 36.2% were non-families. 32.2% of all households were made up of individuals, and 16.2% had someone living alone who was 65 years of age or older. The average household size was 2.37 and the average family size was 2.98.
In the city, the population was spread out, with 24.7% under the age of 18, 6.2% from 18 to 24, 24.2% from 25 to 44, 24.2% from 45 to 64, and 20.7% who were 65 years of age or older. The median age was 41 years. For every 100 females, there were 91.2 males. For every 100 females age 18 and over, there were 87.2 males.
The median income for a household in the city was $31,250, and the median income for a family was $37,500. Males had a median income of $27,500 versus $20,000 for females. The per capita income for the city was $15,945. About 8.2% of families and 11.2% of the population were below the poverty line, including 14.2% of those under age 18 and 8.2% of those age 65 or over.
Common Questions
What is Per Capita Income in Atwood?
Per Capita income in Atwood is $38,920.
What is the Median Family Income in Atwood?
Median Family Income in Atwood is $78,250.
What is the Median Household income in Atwood?
Median Household Income in Atwood is $65,714.
What is Income or Wage Gap in Atwood?
Income or Wage Gap in Atwood is 27.7%.
Women in Atwood earn 72.3 cents for every dollar earned by a man.
What is Family Income Deficit in Atwood?
Family Income Deficit in Atwood is $12,650.
Families that are below poverty line in Atwood earn $12,650 less on average than the poverty threshold level.
What is Inequality or Gini Index in Atwood?
Inequality or Gini Index in Atwood is 0.42.
What is the Total Population of Atwood?
Total Population of Atwood is 1,238.
What is the Total Male Population of Atwood?
Total Male Population of Atwood is 613.
What is the Total Female Population of Atwood?
Total Female Population of Atwood is 625.
What is the Ratio of Males per 100 Females in Atwood?
There are 98.08 Males per 100 Females in Atwood.
What is the Ratio of Females per 100 Males in Atwood?
There are 101.96 Females per 100 Males in Atwood.
What is the Median Population Age in Atwood?
Median Population Age in Atwood is 45.8 Years.
What is the Average Family Size in Atwood
Average Family Size in Atwood is 2.6 People.
What is the Average Household Size in Atwood
Average Household Size in Atwood is 2.1 People.
How Large is the Labor Force in Atwood?
There are 660 People in the Labor Forcein in Atwood.
What is the Percentage of People in the Labor Force in Atwood?
67.1% of People are in the Labor Force in Atwood.
What is the Unemployment Rate in Atwood?
Unemployment Rate in Atwood is 0.3%.