Rose Hill, KS Map & Demographics
Rose Hill Map
Rose Hill Overview
$33,103
PER CAPITA INCOME
$94,154
AVG FAMILY INCOME
$90,962
AVG HOUSEHOLD INCOME
35.4%
WAGE / INCOME GAP [ % ]
64.6¢/ $1
WAGE / INCOME GAP [ $ ]
0.31
INEQUALITY / GINI INDEX
4,357
TOTAL POPULATION
1,984
MALE POPULATION
2,373
FEMALE POPULATION
83.61
MALES / 100 FEMALES
119.61
FEMALES / 100 MALES
32.0
MEDIAN AGE
3.2
AVG FAMILY SIZE
2.9
AVG HOUSEHOLD SIZE
2,254
LABOR FORCE [ PEOPLE ]
68.0%
PERCENT IN LABOR FORCE
4.1%
UNEMPLOYMENT RATE
Rose Hill Zip Codes
Rose Hill Area Codes
Income in Rose Hill
Income Overview in Rose Hill
Per Capita Income in Rose Hill is $33,103, while median incomes of families and households are $94,154 and $90,962 respectively.
| Characteristic | Number | Measure |
| Per Capita Income | 4,357 | $33,103 |
| Median Family Income | 1,227 | $94,154 |
| Mean Family Income | 1,227 | $106,654 |
| Median Household Income | 1,478 | $90,962 |
| Mean Household Income | 1,478 | $98,829 |
| Income Deficit | 1,227 | $0 |
| Wage / Income Gap (%) | 4,357 | 35.35% |
| Wage / Income Gap ($) | 4,357 | 64.65¢ per $1 |
| Gini / Inequality Index | 4,357 | 0.31 |
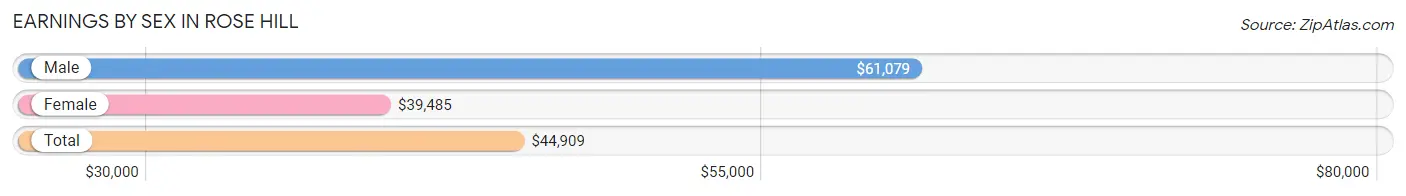
Earnings by Sex in Rose Hill
Average Earnings in Rose Hill are $44,909, $61,079 for men and $39,485 for women, a difference of 35.3%.
| Sex | Number | Average Earnings |
| Male | 1,083 (46.6%) | $61,079 |
| Female | 1,239 (53.4%) | $39,485 |
| Total | 2,322 (100.0%) | $44,909 |
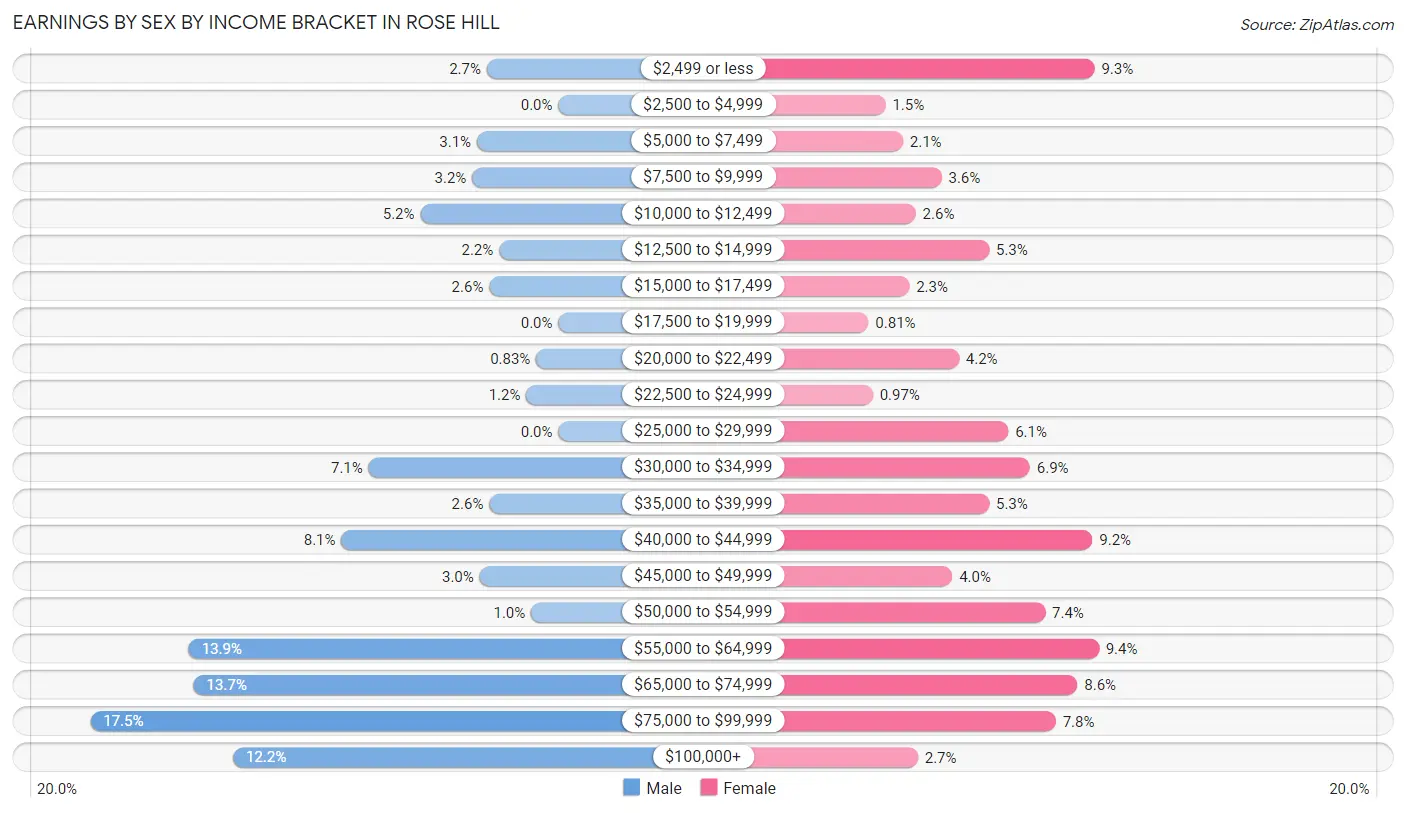
Earnings by Sex by Income Bracket in Rose Hill
The most common earnings brackets in Rose Hill are $75,000 to $99,999 for men (190 | 17.5%) and $55,000 to $64,999 for women (117 | 9.4%).
| Income | Male | Female |
| $2,499 or less | 29 (2.7%) | 115 (9.3%) |
| $2,500 to $4,999 | 0 (0.0%) | 18 (1.5%) |
| $5,000 to $7,499 | 33 (3.0%) | 26 (2.1%) |
| $7,500 to $9,999 | 35 (3.2%) | 44 (3.5%) |
| $10,000 to $12,499 | 56 (5.2%) | 32 (2.6%) |
| $12,500 to $14,999 | 24 (2.2%) | 66 (5.3%) |
| $15,000 to $17,499 | 28 (2.6%) | 29 (2.3%) |
| $17,500 to $19,999 | 0 (0.0%) | 10 (0.8%) |
| $20,000 to $22,499 | 9 (0.8%) | 52 (4.2%) |
| $22,500 to $24,999 | 13 (1.2%) | 12 (1.0%) |
| $25,000 to $29,999 | 0 (0.0%) | 75 (6.0%) |
| $30,000 to $34,999 | 77 (7.1%) | 85 (6.9%) |
| $35,000 to $39,999 | 28 (2.6%) | 66 (5.3%) |
| $40,000 to $44,999 | 88 (8.1%) | 114 (9.2%) |
| $45,000 to $49,999 | 32 (2.9%) | 49 (4.0%) |
| $50,000 to $54,999 | 11 (1.0%) | 92 (7.4%) |
| $55,000 to $64,999 | 150 (13.9%) | 117 (9.4%) |
| $65,000 to $74,999 | 148 (13.7%) | 107 (8.6%) |
| $75,000 to $99,999 | 190 (17.5%) | 97 (7.8%) |
| $100,000+ | 132 (12.2%) | 33 (2.7%) |
| Total | 1,083 (100.0%) | 1,239 (100.0%) |
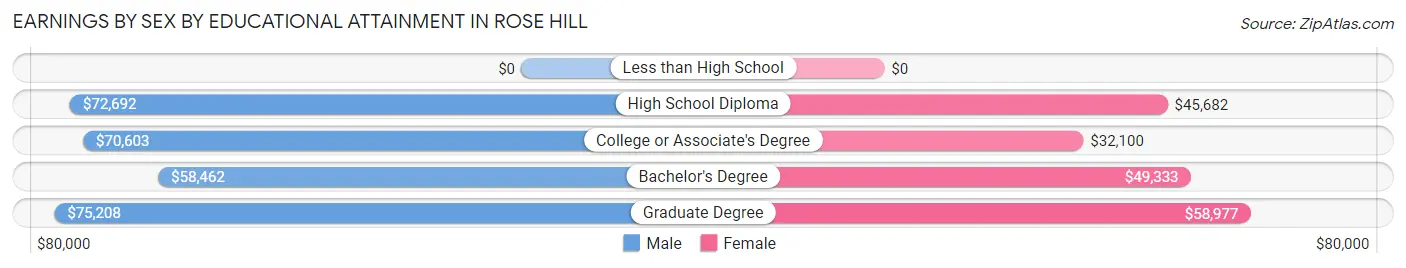
Earnings by Sex by Educational Attainment in Rose Hill
Average earnings in Rose Hill are $70,399 for men and $44,315 for women, a difference of 37.0%. Men with an educational attainment of graduate degree enjoy the highest average annual earnings of $75,208, while those with bachelor's degree education earn the least with $58,462. Women with an educational attainment of graduate degree earn the most with the average annual earnings of $58,977, while those with college or associate's degree education have the smallest earnings of $32,100.
| Educational Attainment | Male Income | Female Income |
| Less than High School | - | - |
| High School Diploma | $72,692 | $45,682 |
| College or Associate's Degree | $70,603 | $32,100 |
| Bachelor's Degree | $58,462 | $49,333 |
| Graduate Degree | $75,208 | $58,977 |
| Total | $70,399 | $44,315 |
Family Income in Rose Hill
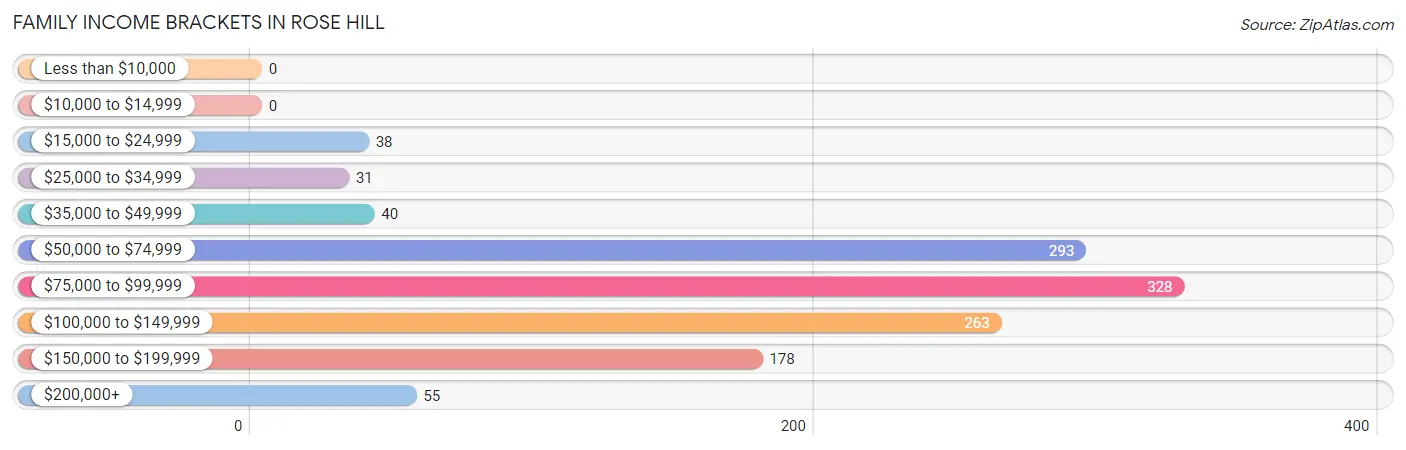
Family Income Brackets in Rose Hill
According to the Rose Hill family income data, there are 328 families falling into the $75,000 to $99,999 income range, which is the most common income bracket and makes up 26.7% of all families.
| Income Bracket | # Families | % Families |
| Less than $10,000 | 0 | 0.0% |
| $10,000 to $14,999 | 0 | 0.0% |
| $15,000 to $24,999 | 38 | 3.1% |
| $25,000 to $34,999 | 31 | 2.5% |
| $35,000 to $49,999 | 40 | 3.3% |
| $50,000 to $74,999 | 293 | 23.9% |
| $75,000 to $99,999 | 328 | 26.7% |
| $100,000 to $149,999 | 263 | 21.4% |
| $150,000 to $199,999 | 178 | 14.5% |
| $200,000+ | 55 | 4.5% |
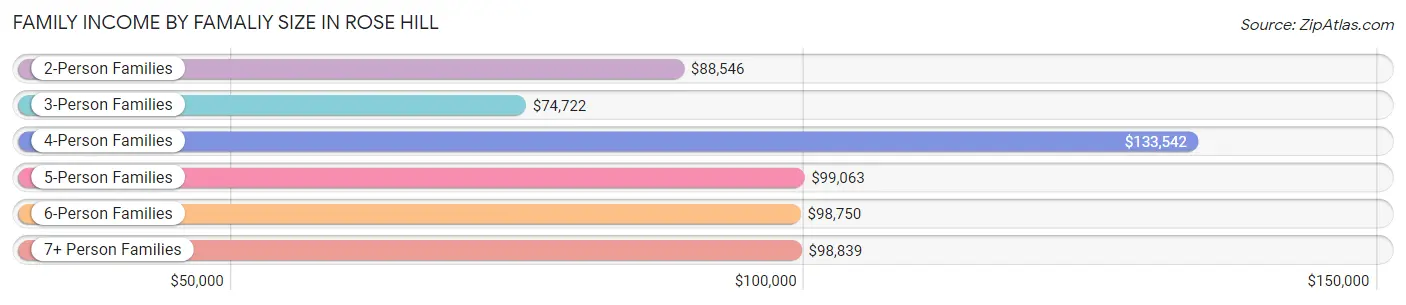
Family Income by Famaliy Size in Rose Hill
4-person families (250 | 20.4%) account for the highest median family income in Rose Hill with $133,542 per family, while 2-person families (503 | 41.0%) have the highest median income of $44,273 per family member.
| Income Bracket | # Families | Median Income |
| 2-Person Families | 503 (41.0%) | $88,546 |
| 3-Person Families | 262 (21.3%) | $74,722 |
| 4-Person Families | 250 (20.4%) | $133,542 |
| 5-Person Families | 149 (12.1%) | $99,063 |
| 6-Person Families | 28 (2.3%) | $98,750 |
| 7+ Person Families | 35 (2.9%) | $98,839 |
| Total | 1,227 (100.0%) | $94,154 |
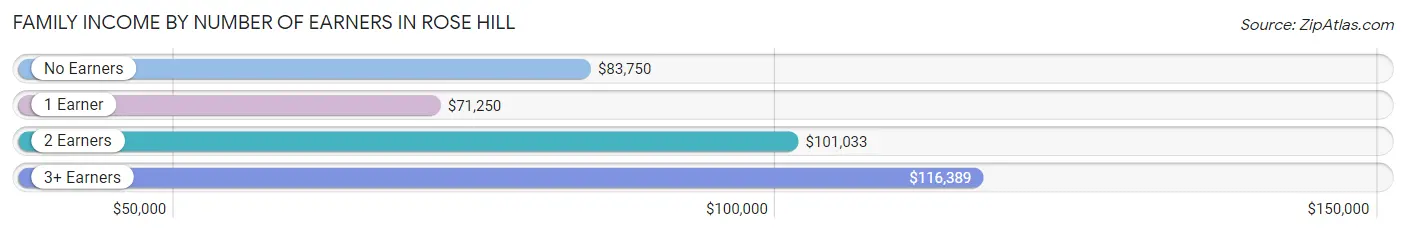
Family Income by Number of Earners in Rose Hill
The median family income in Rose Hill is $94,154, with families comprising 3+ earners (228) having the highest median family income of $116,389, while families with 1 earner (354) have the lowest median family income of $71,250, accounting for 18.6% and 28.8% of families, respectively.
| Number of Earners | # Families | Median Income |
| No Earners | 78 (6.4%) | $83,750 |
| 1 Earner | 354 (28.8%) | $71,250 |
| 2 Earners | 567 (46.2%) | $101,033 |
| 3+ Earners | 228 (18.6%) | $116,389 |
| Total | 1,227 (100.0%) | $94,154 |
Household Income in Rose Hill
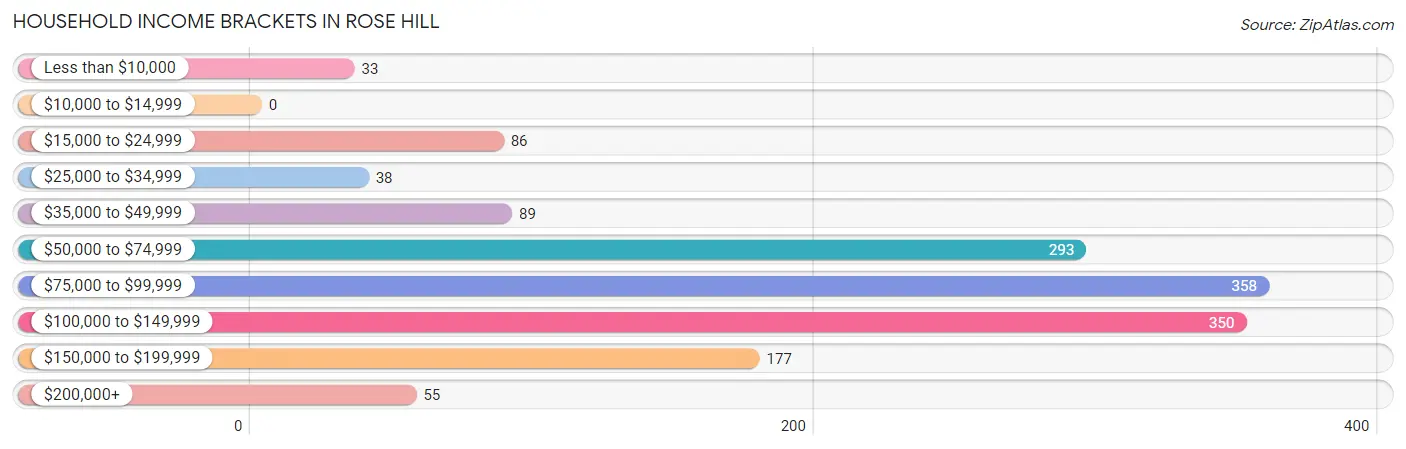
Household Income Brackets in Rose Hill
With 358 households falling in the category, the $75,000 to $99,999 income range is the most frequent in Rose Hill, accounting for 24.2% of all households.
| Income Bracket | # Households | % Households |
| Less than $10,000 | 33 | 2.2% |
| $10,000 to $14,999 | 0 | 0.0% |
| $15,000 to $24,999 | 86 | 5.8% |
| $25,000 to $34,999 | 38 | 2.6% |
| $35,000 to $49,999 | 89 | 6.0% |
| $50,000 to $74,999 | 293 | 19.8% |
| $75,000 to $99,999 | 358 | 24.2% |
| $100,000 to $149,999 | 350 | 23.7% |
| $150,000 to $199,999 | 177 | 12.0% |
| $200,000+ | 55 | 3.7% |
Household Income by Householder Age in Rose Hill
The median household income in Rose Hill is $90,962, with the highest median household income of $112,321 found in the 45 to 64 years age bracket for the primary householder. A total of 566 households (38.3%) fall into this category. Meanwhile, the 65+ years age bracket for the primary householder has the lowest median household income of $57,500, with 348 households (23.5%) in this group.
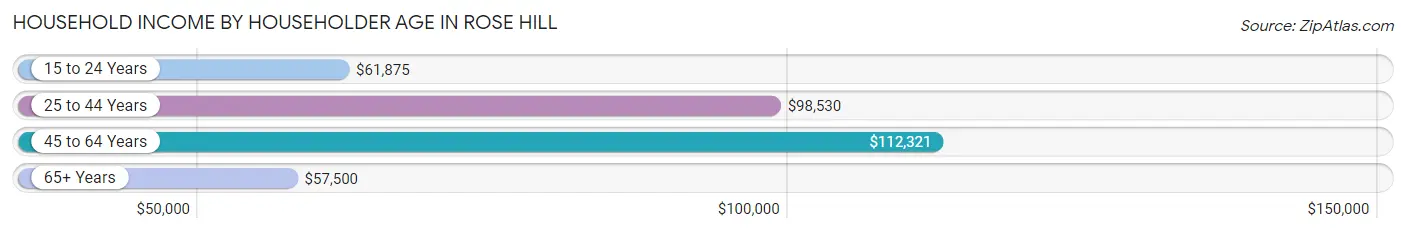
| Income Bracket | # Households | Median Income |
| 15 to 24 Years | 61 (4.1%) | $61,875 |
| 25 to 44 Years | 503 (34.0%) | $98,530 |
| 45 to 64 Years | 566 (38.3%) | $112,321 |
| 65+ Years | 348 (23.5%) | $57,500 |
| Total | 1,478 (100.0%) | $90,962 |
Poverty in Rose Hill
Income Below Poverty by Sex and Age in Rose Hill
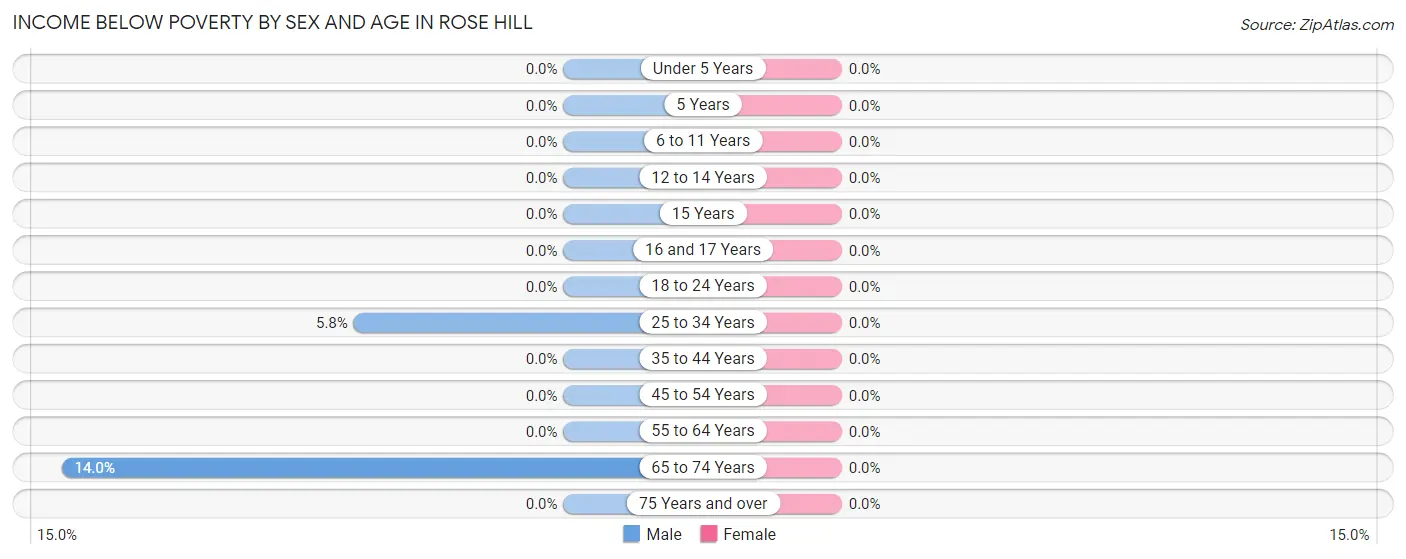
| Age Bracket | Male | Female |
| Under 5 Years | 0 (0.0%) | 0 (0.0%) |
| 5 Years | 0 (0.0%) | 0 (0.0%) |
| 6 to 11 Years | 0 (0.0%) | 0 (0.0%) |
| 12 to 14 Years | 0 (0.0%) | 0 (0.0%) |
| 15 Years | 0 (0.0%) | 0 (0.0%) |
| 16 and 17 Years | 0 (0.0%) | 0 (0.0%) |
| 18 to 24 Years | 0 (0.0%) | 0 (0.0%) |
| 25 to 34 Years | 16 (5.8%) | 0 (0.0%) |
| 35 to 44 Years | 0 (0.0%) | 0 (0.0%) |
| 45 to 54 Years | 0 (0.0%) | 0 (0.0%) |
| 55 to 64 Years | 0 (0.0%) | 0 (0.0%) |
| 65 to 74 Years | 32 (14.0%) | 0 (0.0%) |
| 75 Years and over | 0 (0.0%) | 0 (0.0%) |
| Total | 48 (2.5%) | 0 (0.0%) |
Income Above Poverty by Sex and Age in Rose Hill
According to the poverty statistics in Rose Hill, males aged under 5 years and females aged under 5 years are the age groups that are most secure financially, with 100.0% of males and 100.0% of females in these age groups living above the poverty line.
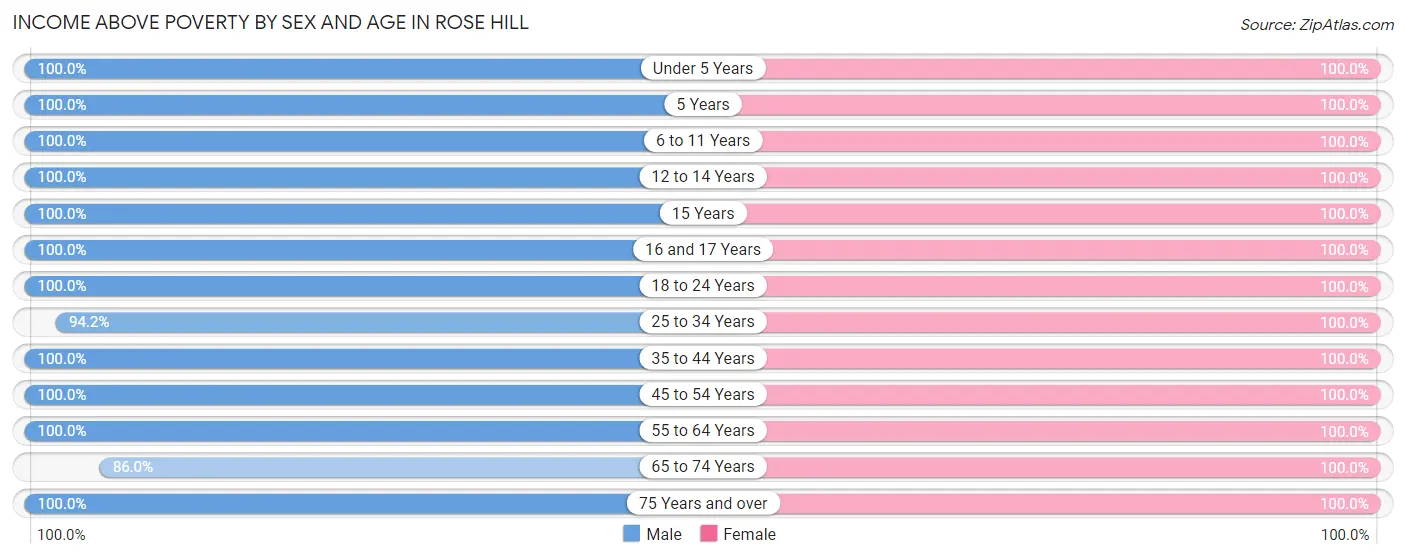
| Age Bracket | Male | Female |
| Under 5 Years | 128 (100.0%) | 153 (100.0%) |
| 5 Years | 16 (100.0%) | 7 (100.0%) |
| 6 to 11 Years | 146 (100.0%) | 239 (100.0%) |
| 12 to 14 Years | 96 (100.0%) | 86 (100.0%) |
| 15 Years | 40 (100.0%) | 121 (100.0%) |
| 16 and 17 Years | 92 (100.0%) | 152 (100.0%) |
| 18 to 24 Years | 223 (100.0%) | 238 (100.0%) |
| 25 to 34 Years | 258 (94.2%) | 287 (100.0%) |
| 35 to 44 Years | 223 (100.0%) | 308 (100.0%) |
| 45 to 54 Years | 248 (100.0%) | 308 (100.0%) |
| 55 to 64 Years | 223 (100.0%) | 236 (100.0%) |
| 65 to 74 Years | 197 (86.0%) | 132 (100.0%) |
| 75 Years and over | 25 (100.0%) | 68 (100.0%) |
| Total | 1,915 (97.6%) | 2,335 (100.0%) |
Income Below Poverty Among Married-Couple Families in Rose Hill
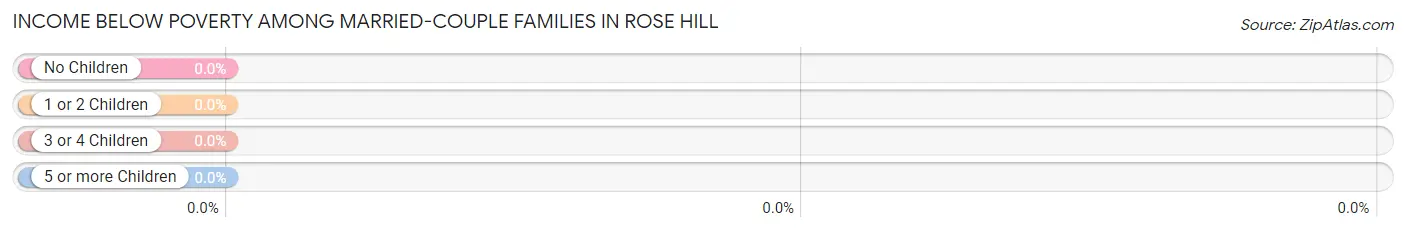
| Children | Above Poverty | Below Poverty |
| No Children | 460 (100.0%) | 0 (0.0%) |
| 1 or 2 Children | 410 (100.0%) | 0 (0.0%) |
| 3 or 4 Children | 72 (100.0%) | 0 (0.0%) |
| 5 or more Children | 25 (100.0%) | 0 (0.0%) |
| Total | 967 (100.0%) | 0 (0.0%) |
Income Below Poverty Among Single-Parent Households in Rose Hill
| Children | Single Father | Single Mother |
| No Children | 0 (0.0%) | 0 (0.0%) |
| 1 or 2 Children | 0 (0.0%) | 0 (0.0%) |
| 3 or 4 Children | 0 (0.0%) | 0 (0.0%) |
| 5 or more Children | 0 (0.0%) | 0 (0.0%) |
| Total | 0 (0.0%) | 0 (0.0%) |
Income Below Poverty Among Married-Couple vs Single-Parent Households in Rose Hill
| Children | Married-Couple Families | Single-Parent Households |
| No Children | 0 (0.0%) | 0 (0.0%) |
| 1 or 2 Children | 0 (0.0%) | 0 (0.0%) |
| 3 or 4 Children | 0 (0.0%) | 0 (0.0%) |
| 5 or more Children | 0 (0.0%) | 0 (0.0%) |
| Total | 0 (0.0%) | 0 (0.0%) |
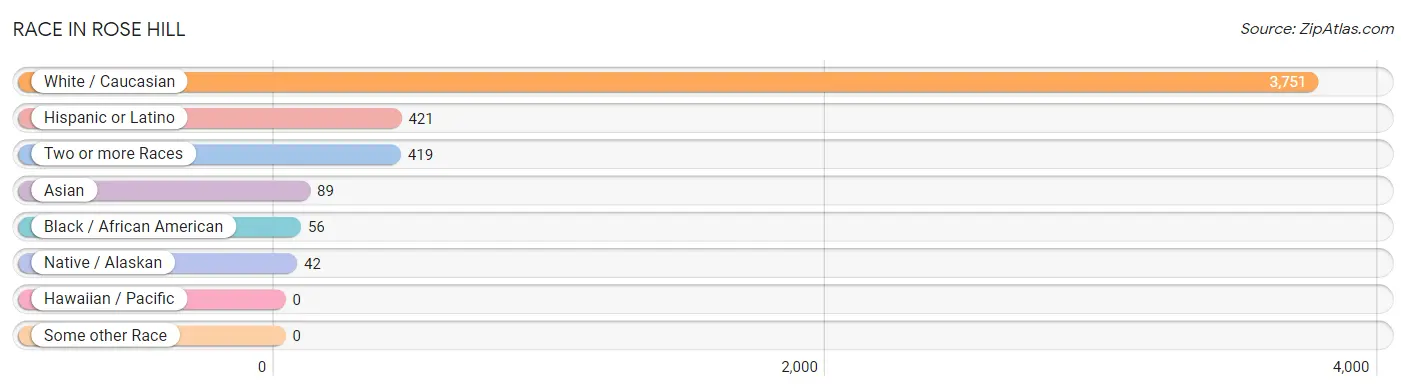
Race in Rose Hill
The most populous races in Rose Hill are White / Caucasian (3,751 | 86.1%), Hispanic or Latino (421 | 9.7%), and Two or more Races (419 | 9.6%).
| Race | # Population | % Population |
| Asian | 89 | 2.0% |
| Black / African American | 56 | 1.3% |
| Hawaiian / Pacific | 0 | 0.0% |
| Hispanic or Latino | 421 | 9.7% |
| Native / Alaskan | 42 | 1.0% |
| White / Caucasian | 3,751 | 86.1% |
| Two or more Races | 419 | 9.6% |
| Some other Race | 0 | 0.0% |
| Total | 4,357 | 100.0% |
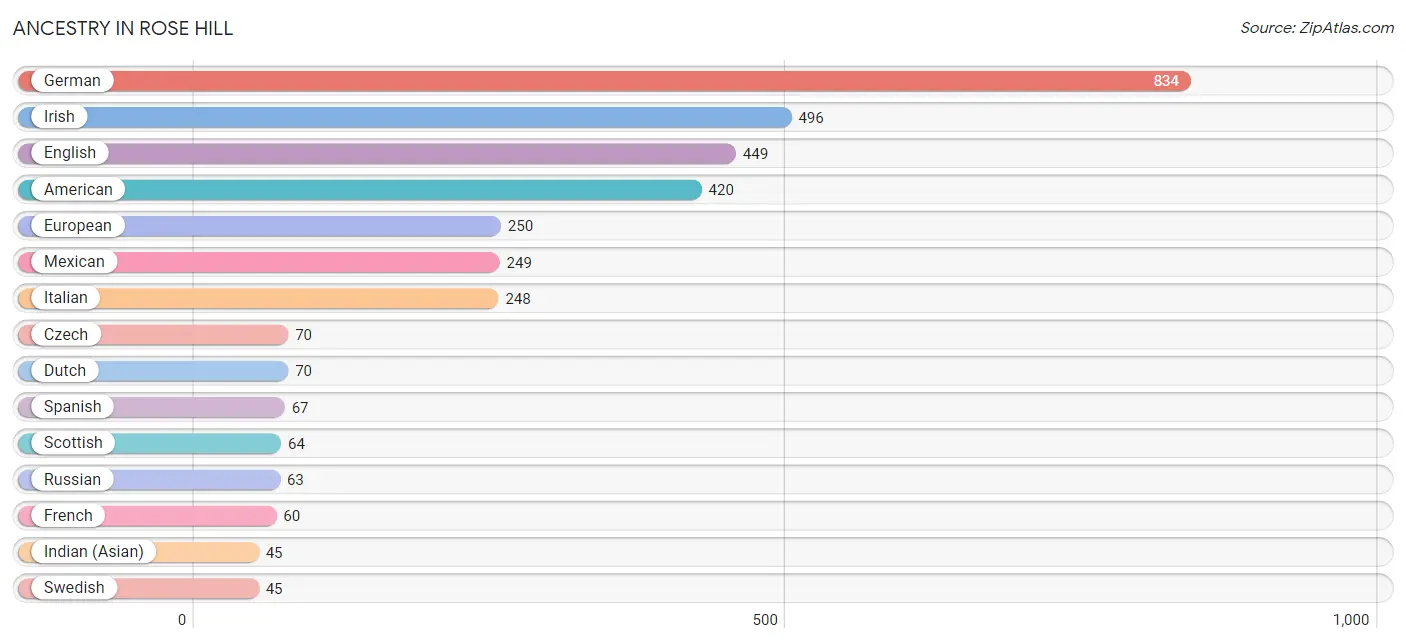
Ancestry in Rose Hill
The most populous ancestries reported in Rose Hill are German (834 | 19.1%), Irish (496 | 11.4%), English (449 | 10.3%), American (420 | 9.6%), and European (250 | 5.7%), together accounting for 56.2% of all Rose Hill residents.
| Ancestry | # Population | % Population |
| American | 420 | 9.6% |
| Bhutanese | 7 | 0.2% |
| British | 12 | 0.3% |
| Czech | 70 | 1.6% |
| Danish | 8 | 0.2% |
| Dutch | 70 | 1.6% |
| Eastern European | 12 | 0.3% |
| English | 449 | 10.3% |
| European | 250 | 5.7% |
| French | 60 | 1.4% |
| German | 834 | 19.1% |
| Greek | 11 | 0.3% |
| Indian (Asian) | 45 | 1.0% |
| Irish | 496 | 11.4% |
| Italian | 248 | 5.7% |
| Korean | 10 | 0.2% |
| Mexican | 249 | 5.7% |
| Navajo | 11 | 0.3% |
| Norwegian | 44 | 1.0% |
| Pakistani | 27 | 0.6% |
| Pennsylvania German | 8 | 0.2% |
| Polish | 33 | 0.8% |
| Potawatomi | 27 | 0.6% |
| Puerto Rican | 34 | 0.8% |
| Russian | 63 | 1.5% |
| Scotch-Irish | 34 | 0.8% |
| Scottish | 64 | 1.5% |
| Slovak | 15 | 0.3% |
| Spanish | 67 | 1.5% |
| Swedish | 45 | 1.0% | View All 30 Rows |
Immigrants in Rose Hill
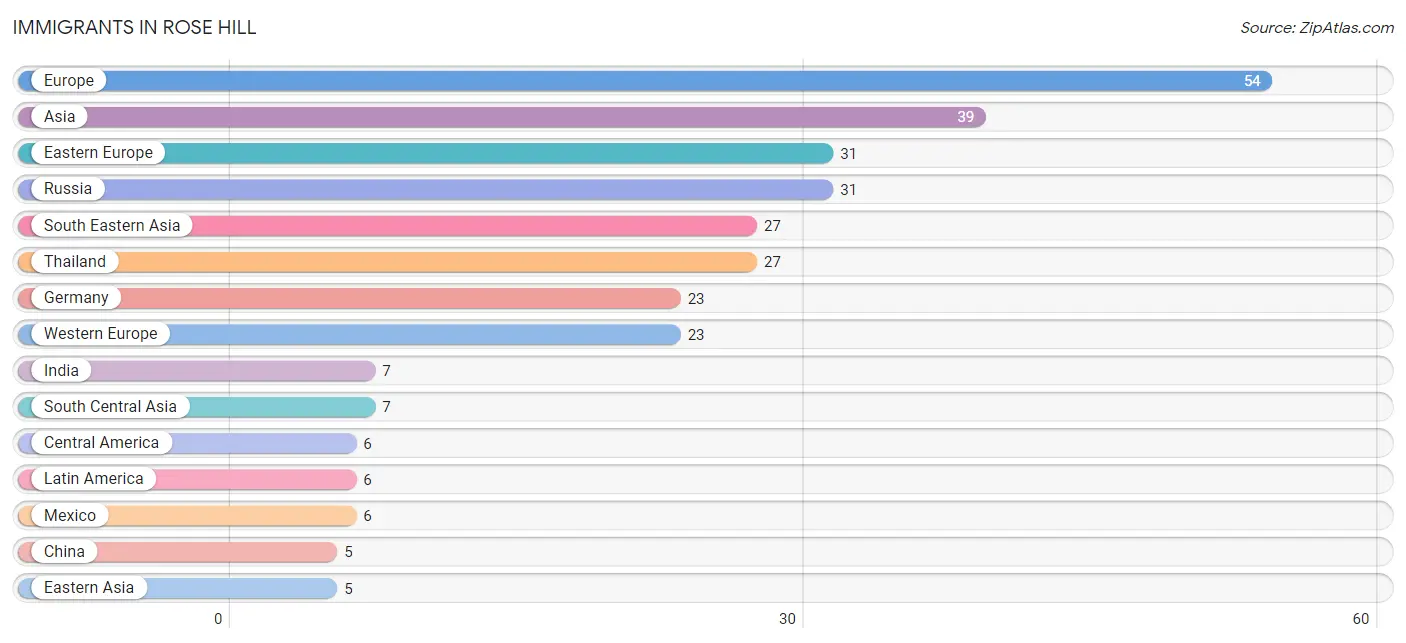
The most numerous immigrant groups reported in Rose Hill came from Europe (54 | 1.2%), Asia (39 | 0.9%), Eastern Europe (31 | 0.7%), Russia (31 | 0.7%), and South Eastern Asia (27 | 0.6%), together accounting for 4.2% of all Rose Hill residents.
| Immigration Origin | # Population | % Population |
| Asia | 39 | 0.9% |
| Central America | 6 | 0.1% |
| China | 5 | 0.1% |
| Eastern Asia | 5 | 0.1% |
| Eastern Europe | 31 | 0.7% |
| Europe | 54 | 1.2% |
| Germany | 23 | 0.5% |
| India | 7 | 0.2% |
| Latin America | 6 | 0.1% |
| Mexico | 6 | 0.1% |
| Russia | 31 | 0.7% |
| South Central Asia | 7 | 0.2% |
| South Eastern Asia | 27 | 0.6% |
| Thailand | 27 | 0.6% |
| Western Europe | 23 | 0.5% | View All 15 Rows |
Sex and Age in Rose Hill
Sex and Age in Rose Hill
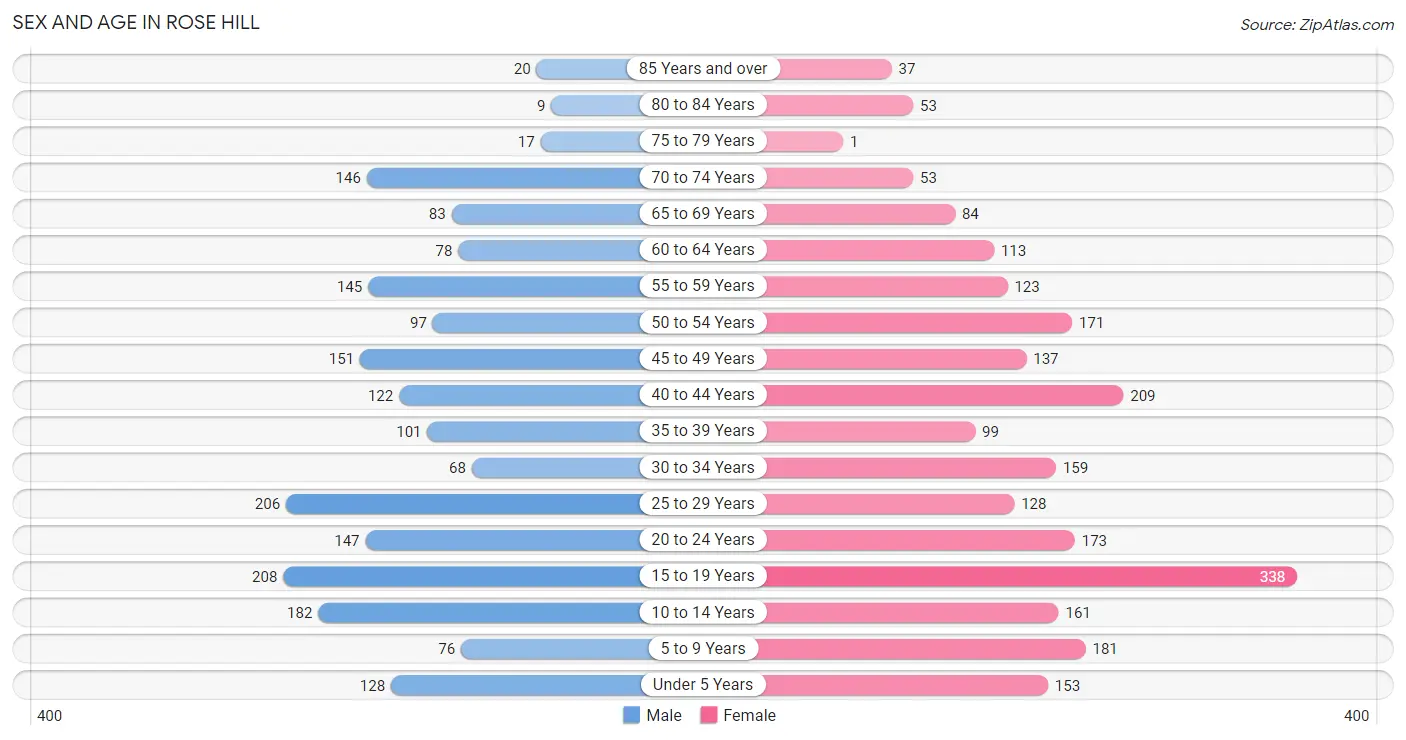
The most populous age groups in Rose Hill are 15 to 19 Years (208 | 10.5%) for men and 15 to 19 Years (338 | 14.2%) for women.
| Age Bracket | Male | Female |
| Under 5 Years | 128 (6.5%) | 153 (6.5%) |
| 5 to 9 Years | 76 (3.8%) | 181 (7.6%) |
| 10 to 14 Years | 182 (9.2%) | 161 (6.8%) |
| 15 to 19 Years | 208 (10.5%) | 338 (14.2%) |
| 20 to 24 Years | 147 (7.4%) | 173 (7.3%) |
| 25 to 29 Years | 206 (10.4%) | 128 (5.4%) |
| 30 to 34 Years | 68 (3.4%) | 159 (6.7%) |
| 35 to 39 Years | 101 (5.1%) | 99 (4.2%) |
| 40 to 44 Years | 122 (6.1%) | 209 (8.8%) |
| 45 to 49 Years | 151 (7.6%) | 137 (5.8%) |
| 50 to 54 Years | 97 (4.9%) | 171 (7.2%) |
| 55 to 59 Years | 145 (7.3%) | 123 (5.2%) |
| 60 to 64 Years | 78 (3.9%) | 113 (4.8%) |
| 65 to 69 Years | 83 (4.2%) | 84 (3.5%) |
| 70 to 74 Years | 146 (7.4%) | 53 (2.2%) |
| 75 to 79 Years | 17 (0.9%) | 1 (0.0%) |
| 80 to 84 Years | 9 (0.4%) | 53 (2.2%) |
| 85 Years and over | 20 (1.0%) | 37 (1.6%) |
| Total | 1,984 (100.0%) | 2,373 (100.0%) |
Families and Households in Rose Hill
Median Family Size in Rose Hill
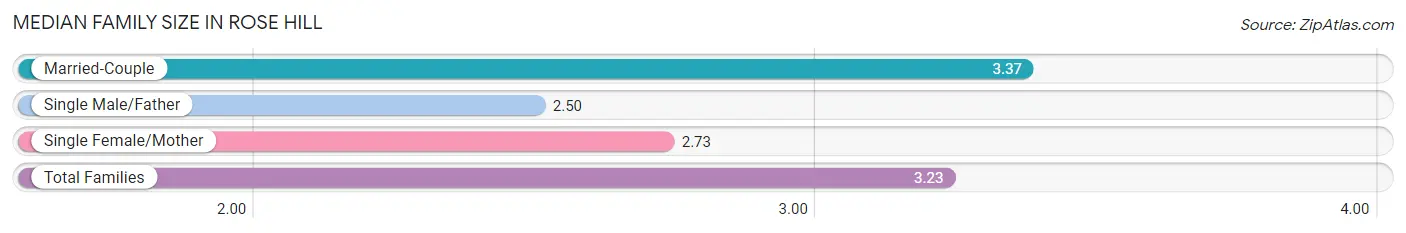
The median family size in Rose Hill is 3.23 persons per family, with married-couple families (967 | 78.8%) accounting for the largest median family size of 3.37 persons per family. On the other hand, single male/father families (26 | 2.1%) represent the smallest median family size with 2.50 persons per family.
| Family Type | # Families | Family Size |
| Married-Couple | 967 (78.8%) | 3.37 |
| Single Male/Father | 26 (2.1%) | 2.50 |
| Single Female/Mother | 234 (19.1%) | 2.73 |
| Total Families | 1,227 (100.0%) | 3.23 |
Median Household Size in Rose Hill
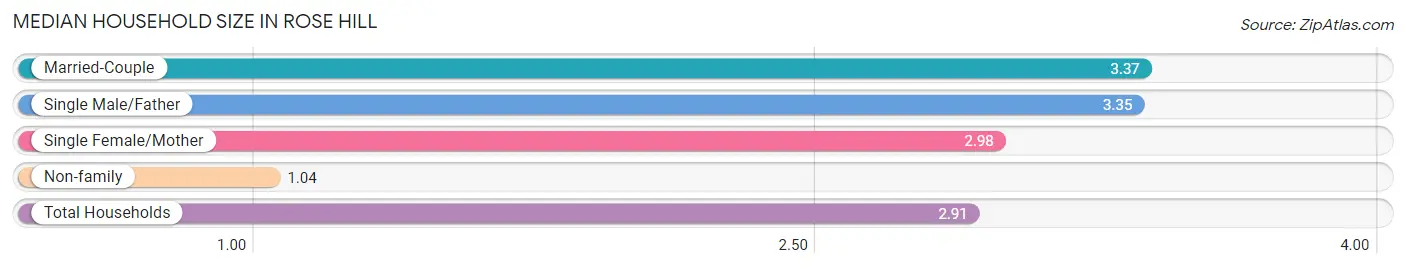
The median household size in Rose Hill is 2.91 persons per household, with married-couple households (967 | 65.4%) accounting for the largest median household size of 3.37 persons per household. non-family households (251 | 17.0%) represent the smallest median household size with 1.04 persons per household.
| Household Type | # Households | Household Size |
| Married-Couple | 967 (65.4%) | 3.37 |
| Single Male/Father | 26 (1.8%) | 3.35 |
| Single Female/Mother | 234 (15.8%) | 2.98 |
| Non-family | 251 (17.0%) | 1.04 |
| Total Households | 1,478 (100.0%) | 2.91 |
Household Size by Marriage Status in Rose Hill
Out of a total of 1,478 households in Rose Hill, 1,227 (83.0%) are family households, while 251 (17.0%) are nonfamily households. The most numerous type of family households are 2-person households, comprising 462, and the most common type of nonfamily households are 1-person households, comprising 236.
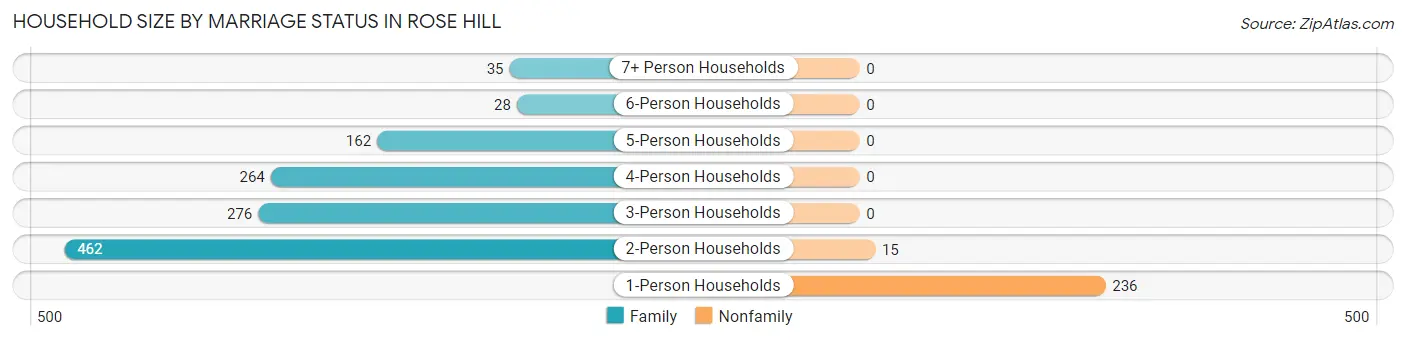
| Household Size | Family Households | Nonfamily Households |
| 1-Person Households | - | 236 (16.0%) |
| 2-Person Households | 462 (31.3%) | 15 (1.0%) |
| 3-Person Households | 276 (18.7%) | 0 (0.0%) |
| 4-Person Households | 264 (17.9%) | 0 (0.0%) |
| 5-Person Households | 162 (11.0%) | 0 (0.0%) |
| 6-Person Households | 28 (1.9%) | 0 (0.0%) |
| 7+ Person Households | 35 (2.4%) | 0 (0.0%) |
| Total | 1,227 (83.0%) | 251 (17.0%) |
Female Fertility in Rose Hill
Fertility by Age in Rose Hill
Average fertility rate in Rose Hill is 83.0 births per 1,000 women. Women in the age bracket of 20 to 34 years have the highest fertility rate with 191.0 births per 1,000 women. Women in the age bracket of 20 to 34 years acount for 85.4% of all women with births.
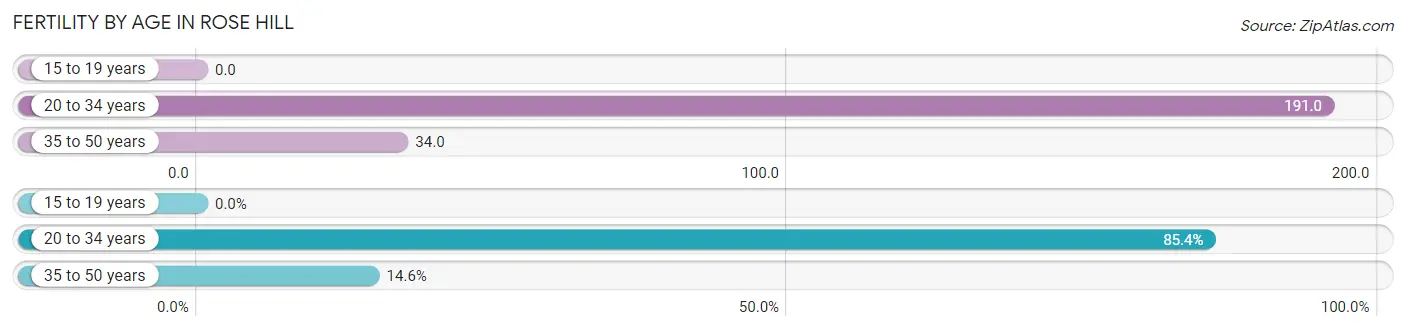
| Age Bracket | Women with Births | Births / 1,000 Women |
| 15 to 19 years | 0 (0.0%) | 0.0 |
| 20 to 34 years | 88 (85.4%) | 191.0 |
| 35 to 50 years | 15 (14.6%) | 34.0 |
| Total | 103 (100.0%) | 83.0 |
Fertility by Age by Marriage Status in Rose Hill
53.4% of women with births (103) in Rose Hill are married. The highest percentage of unmarried women with births falls into 20 to 34 years age bracket with 54.5% of them unmarried at the time of birth, while the lowest percentage of unmarried women with births belong to 35 to 50 years age bracket with 0.0% of them unmarried.
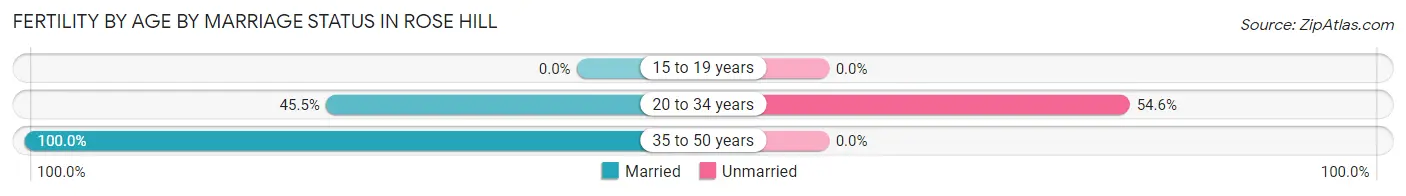
| Age Bracket | Married | Unmarried |
| 15 to 19 years | 0 (0.0%) | 0 (0.0%) |
| 20 to 34 years | 40 (45.5%) | 48 (54.5%) |
| 35 to 50 years | 15 (100.0%) | 0 (0.0%) |
| Total | 55 (53.4%) | 48 (46.6%) |
Fertility by Education in Rose Hill
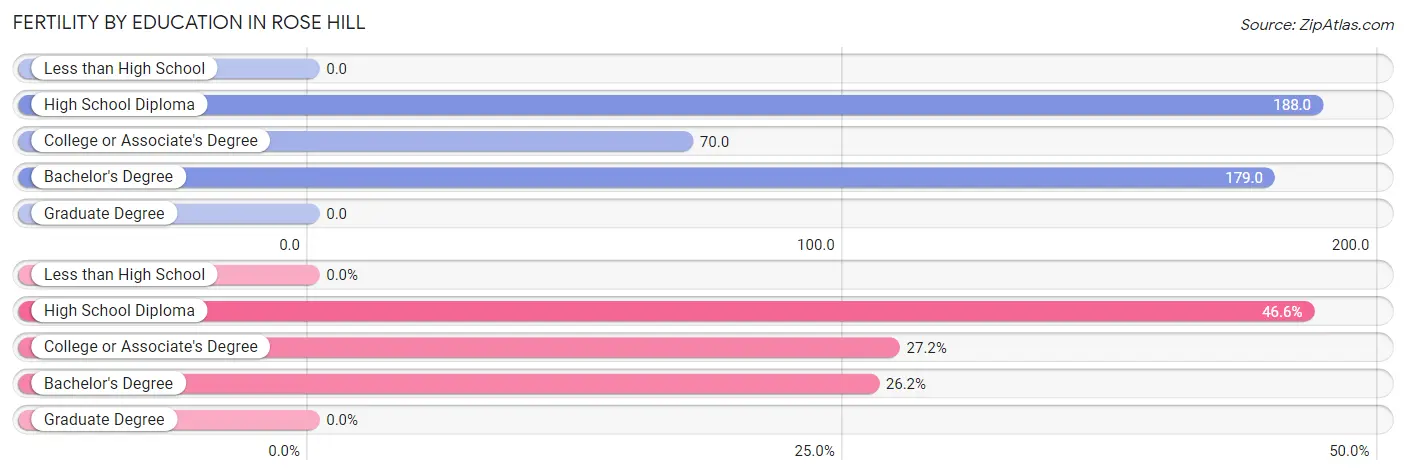
| Educational Attainment | Women with Births | Births / 1,000 Women |
| Less than High School | 0 (0.0%) | 0.0 |
| High School Diploma | 48 (46.6%) | 188.0 |
| College or Associate's Degree | 28 (27.2%) | 70.0 |
| Bachelor's Degree | 27 (26.2%) | 179.0 |
| Graduate Degree | 0 (0.0%) | 0.0 |
| Total | 103 (100.0%) | 83.0 |
Fertility by Education by Marriage Status in Rose Hill
46.6% of women with births in Rose Hill are unmarried. Women with the educational attainment of college or associate's degree are most likely to be married with 100.0% of them married at childbirth, while women with the educational attainment of high school diploma are least likely to be married with 100.0% of them unmarried at childbirth.
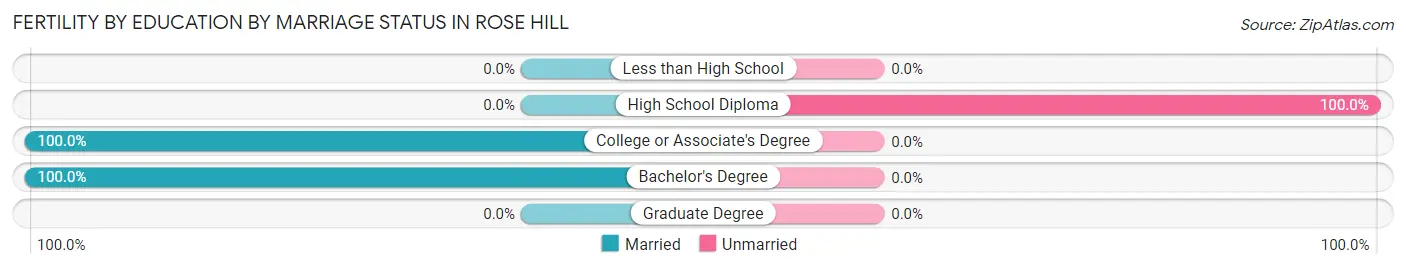
| Educational Attainment | Married | Unmarried |
| Less than High School | 0 (0.0%) | 0 (0.0%) |
| High School Diploma | 0 (0.0%) | 48 (100.0%) |
| College or Associate's Degree | 28 (100.0%) | 0 (0.0%) |
| Bachelor's Degree | 27 (100.0%) | 0 (0.0%) |
| Graduate Degree | 0 (0.0%) | 0 (0.0%) |
| Total | 55 (53.4%) | 48 (46.6%) |
Employment Characteristics in Rose Hill
Employment by Class of Employer in Rose Hill
Among the 2,167 employed individuals in Rose Hill, private company employees (1,262 | 58.2%), federal government employees (302 | 13.9%), and local government employees (283 | 13.1%) make up the most common classes of employment.
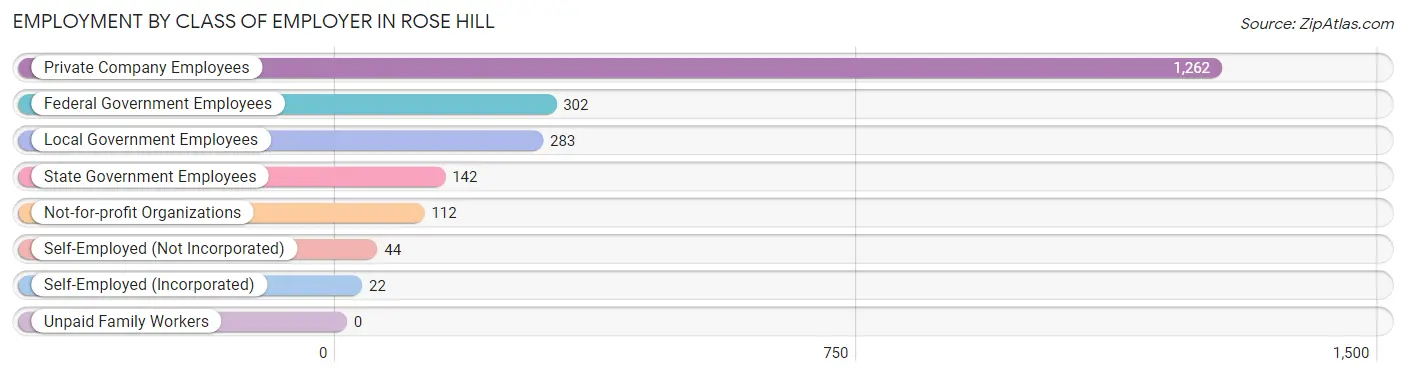
| Employer Class | # Employees | % Employees |
| Private Company Employees | 1,262 | 58.2% |
| Self-Employed (Incorporated) | 22 | 1.0% |
| Self-Employed (Not Incorporated) | 44 | 2.0% |
| Not-for-profit Organizations | 112 | 5.2% |
| Local Government Employees | 283 | 13.1% |
| State Government Employees | 142 | 6.6% |
| Federal Government Employees | 302 | 13.9% |
| Unpaid Family Workers | 0 | 0.0% |
| Total | 2,167 | 100.0% |
Employment Status by Age in Rose Hill
According to the labor force statistics for Rose Hill, out of the total population over 16 years of age (3,315), 68.0% or 2,254 individuals are in the labor force, with 4.1% or 92 of them unemployed. The age group with the highest labor force participation rate is 35 to 44 years, with 95.3% or 506 individuals in the labor force. Within the labor force, the 45 to 54 years age range has the highest percentage of unemployed individuals, with 10.6% or 55 of them being unemployed.
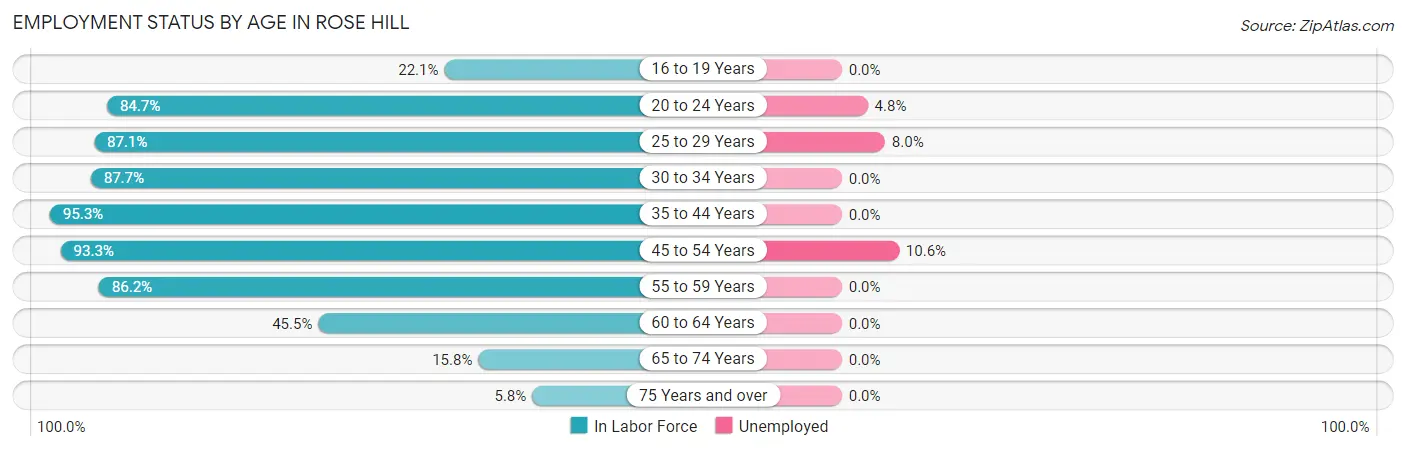
| Age Bracket | In Labor Force | Unemployed |
| 16 to 19 Years | 85 (22.1%) | 0 (0.0%) |
| 20 to 24 Years | 271 (84.7%) | 13 (4.8%) |
| 25 to 29 Years | 291 (87.1%) | 23 (8.0%) |
| 30 to 34 Years | 199 (87.7%) | 0 (0.0%) |
| 35 to 44 Years | 506 (95.3%) | 0 (0.0%) |
| 45 to 54 Years | 519 (93.3%) | 55 (10.6%) |
| 55 to 59 Years | 231 (86.2%) | 0 (0.0%) |
| 60 to 64 Years | 87 (45.5%) | 0 (0.0%) |
| 65 to 74 Years | 58 (15.8%) | 0 (0.0%) |
| 75 Years and over | 8 (5.8%) | 0 (0.0%) |
| Total | 2,254 (68.0%) | 92 (4.1%) |
Employment Status by Educational Attainment in Rose Hill
According to labor force statistics for Rose Hill, 87.0% of individuals (1,833) out of the total population between 25 and 64 years of age (2,107) are in the labor force, with 4.3% or 79 of them being unemployed. The group with the highest labor force participation rate are those with the educational attainment of bachelor's degree or higher, with 91.5% or 783 individuals in the labor force. Within the labor force, individuals with high school diploma education have the highest percentage of unemployment, with 9.5% or 30 of them being unemployed.
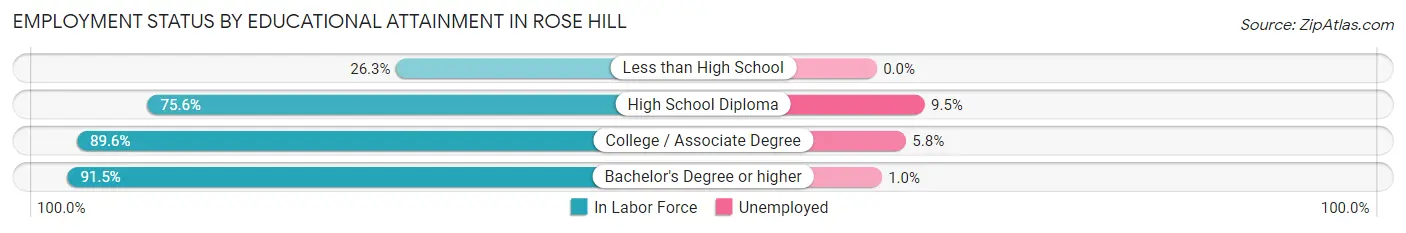
| Educational Attainment | In Labor Force | Unemployed |
| Less than High School | 5 (26.3%) | 0 (0.0%) |
| High School Diploma | 316 (75.6%) | 40 (9.5%) |
| College / Associate Degree | 729 (89.6%) | 47 (5.8%) |
| Bachelor's Degree or higher | 783 (91.5%) | 9 (1.0%) |
| Total | 1,833 (87.0%) | 91 (4.3%) |
Employment Occupations by Sex in Rose Hill
Management, Business, Science and Arts Occupations
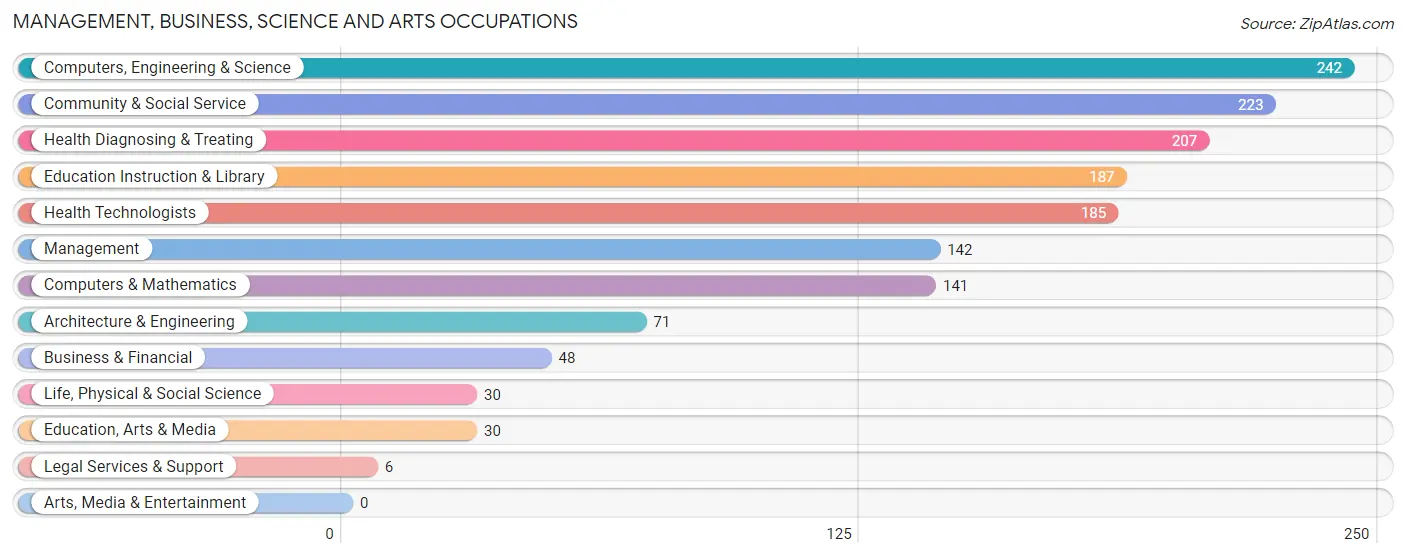
The most common Management, Business, Science and Arts occupations in Rose Hill are Computers, Engineering & Science (242 | 11.7%), Community & Social Service (223 | 10.7%), Health Diagnosing & Treating (207 | 10.0%), Education Instruction & Library (187 | 9.0%), and Health Technologists (185 | 8.9%).
Management, Business, Science and Arts Occupations by Sex
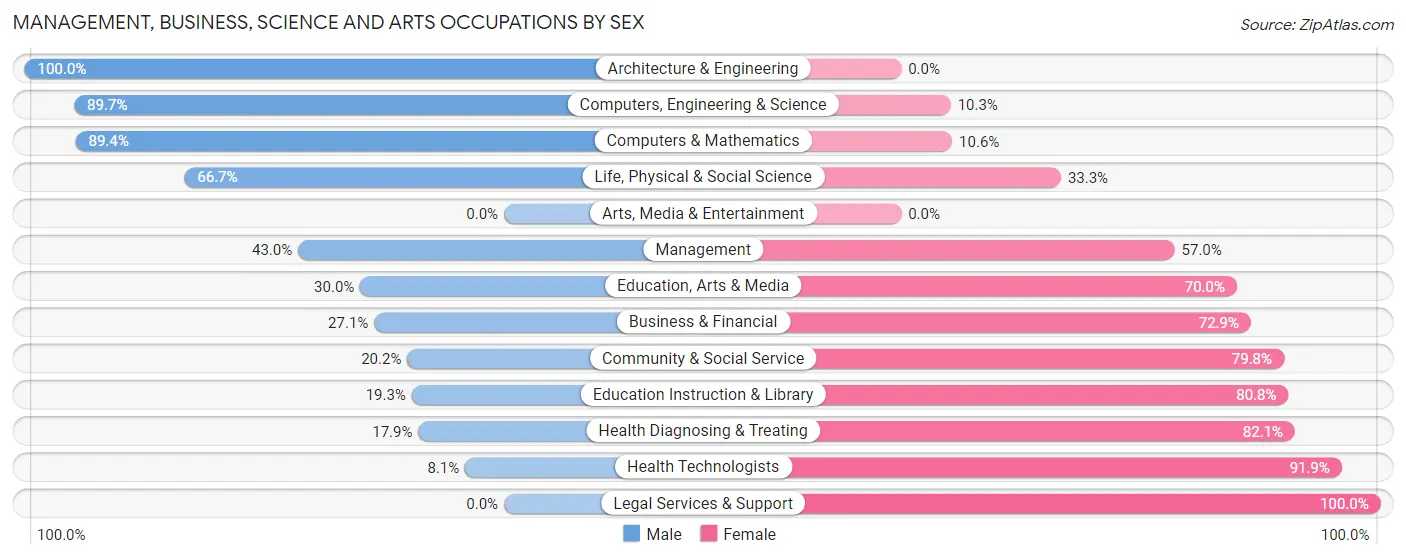
Within the Management, Business, Science and Arts occupations in Rose Hill, the most male-oriented occupations are Architecture & Engineering (100.0%), Computers, Engineering & Science (89.7%), and Computers & Mathematics (89.4%), while the most female-oriented occupations are Legal Services & Support (100.0%), Health Technologists (91.9%), and Health Diagnosing & Treating (82.1%).
| Occupation | Male | Female |
| Management | 61 (43.0%) | 81 (57.0%) |
| Business & Financial | 13 (27.1%) | 35 (72.9%) |
| Computers, Engineering & Science | 217 (89.7%) | 25 (10.3%) |
| Computers & Mathematics | 126 (89.4%) | 15 (10.6%) |
| Architecture & Engineering | 71 (100.0%) | 0 (0.0%) |
| Life, Physical & Social Science | 20 (66.7%) | 10 (33.3%) |
| Community & Social Service | 45 (20.2%) | 178 (79.8%) |
| Education, Arts & Media | 9 (30.0%) | 21 (70.0%) |
| Legal Services & Support | 0 (0.0%) | 6 (100.0%) |
| Education Instruction & Library | 36 (19.3%) | 151 (80.7%) |
| Arts, Media & Entertainment | 0 (0.0%) | 0 (0.0%) |
| Health Diagnosing & Treating | 37 (17.9%) | 170 (82.1%) |
| Health Technologists | 15 (8.1%) | 170 (91.9%) |
| Total (Category) | 373 (43.3%) | 489 (56.7%) |
| Total (Overall) | 958 (46.1%) | 1,119 (53.9%) |
Services Occupations
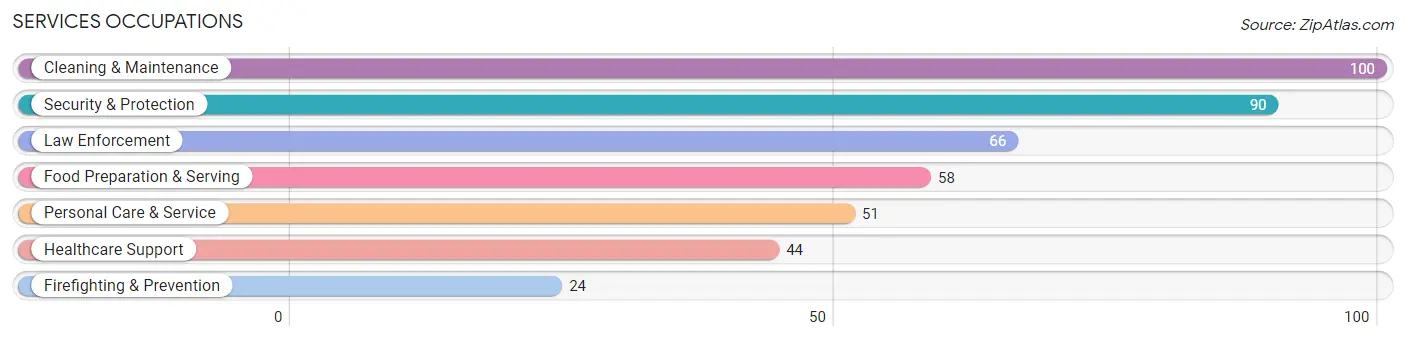
The most common Services occupations in Rose Hill are Cleaning & Maintenance (100 | 4.8%), Security & Protection (90 | 4.3%), Law Enforcement (66 | 3.2%), Food Preparation & Serving (58 | 2.8%), and Personal Care & Service (51 | 2.5%).
Services Occupations by Sex
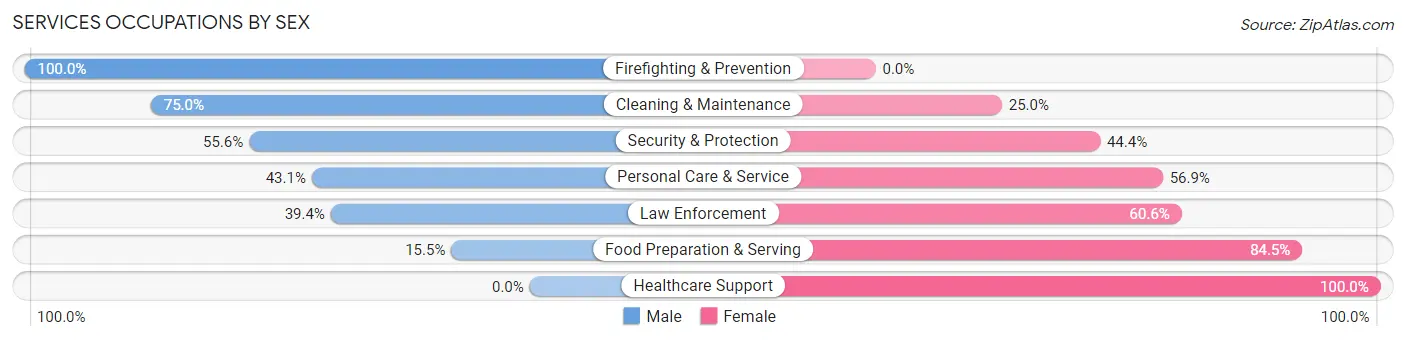
Within the Services occupations in Rose Hill, the most male-oriented occupations are Firefighting & Prevention (100.0%), Cleaning & Maintenance (75.0%), and Security & Protection (55.6%), while the most female-oriented occupations are Healthcare Support (100.0%), Food Preparation & Serving (84.5%), and Law Enforcement (60.6%).
| Occupation | Male | Female |
| Healthcare Support | 0 (0.0%) | 44 (100.0%) |
| Security & Protection | 50 (55.6%) | 40 (44.4%) |
| Firefighting & Prevention | 24 (100.0%) | 0 (0.0%) |
| Law Enforcement | 26 (39.4%) | 40 (60.6%) |
| Food Preparation & Serving | 9 (15.5%) | 49 (84.5%) |
| Cleaning & Maintenance | 75 (75.0%) | 25 (25.0%) |
| Personal Care & Service | 22 (43.1%) | 29 (56.9%) |
| Total (Category) | 156 (45.5%) | 187 (54.5%) |
| Total (Overall) | 958 (46.1%) | 1,119 (53.9%) |
Sales and Office Occupations
The most common Sales and Office occupations in Rose Hill are Office & Administration (292 | 14.1%), and Sales & Related (287 | 13.8%).
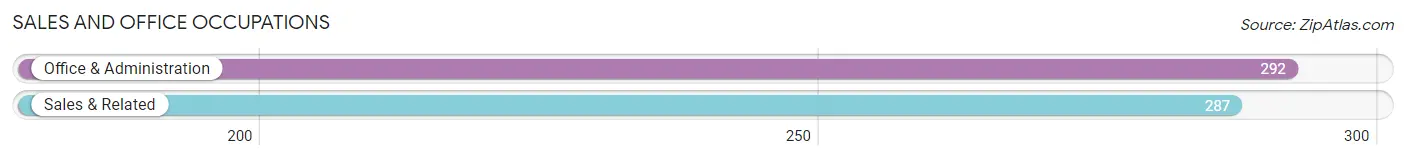
Sales and Office Occupations by Sex
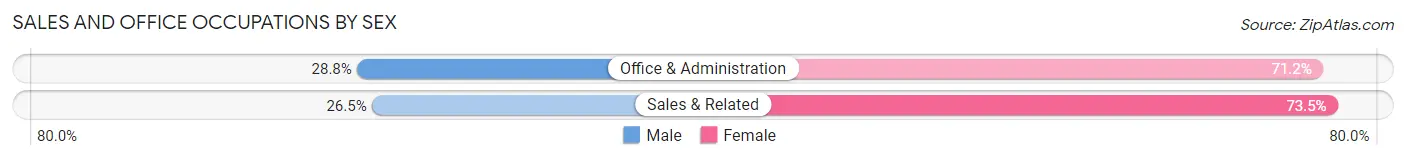
| Occupation | Male | Female |
| Sales & Related | 76 (26.5%) | 211 (73.5%) |
| Office & Administration | 84 (28.8%) | 208 (71.2%) |
| Total (Category) | 160 (27.6%) | 419 (72.4%) |
| Total (Overall) | 958 (46.1%) | 1,119 (53.9%) |
Natural Resources, Construction and Maintenance Occupations
The most common Natural Resources, Construction and Maintenance occupations in Rose Hill are Construction & Extraction (123 | 5.9%), and Installation, Maintenance & Repair (46 | 2.2%).
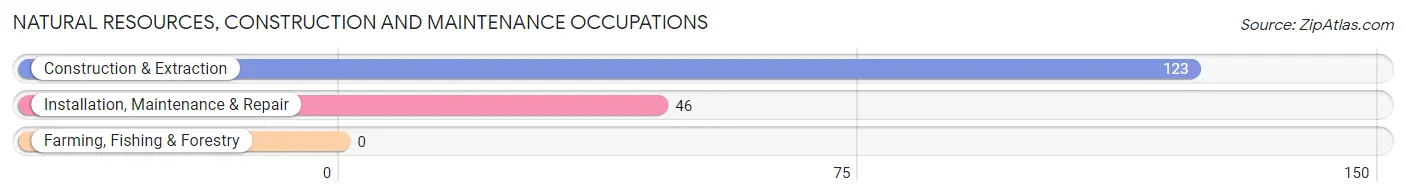
Natural Resources, Construction and Maintenance Occupations by Sex
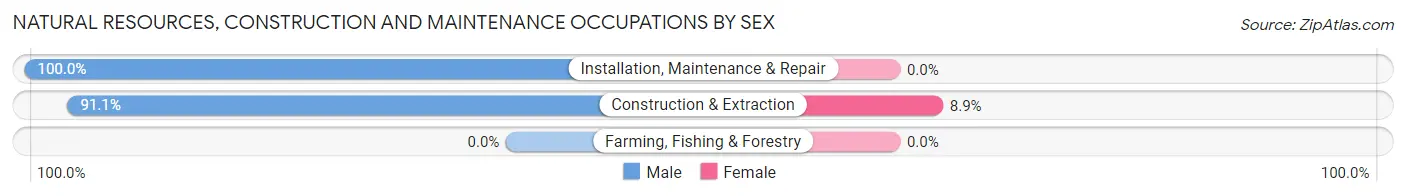
| Occupation | Male | Female |
| Farming, Fishing & Forestry | 0 (0.0%) | 0 (0.0%) |
| Construction & Extraction | 112 (91.1%) | 11 (8.9%) |
| Installation, Maintenance & Repair | 46 (100.0%) | 0 (0.0%) |
| Total (Category) | 158 (93.5%) | 11 (6.5%) |
| Total (Overall) | 958 (46.1%) | 1,119 (53.9%) |
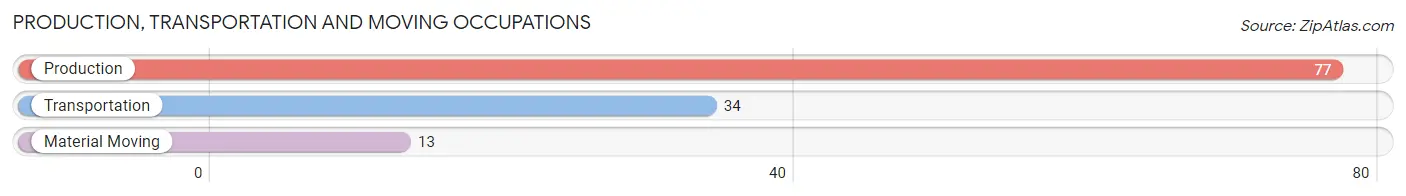
Production, Transportation and Moving Occupations
The most common Production, Transportation and Moving occupations in Rose Hill are Production (77 | 3.7%), Transportation (34 | 1.6%), and Material Moving (13 | 0.6%).
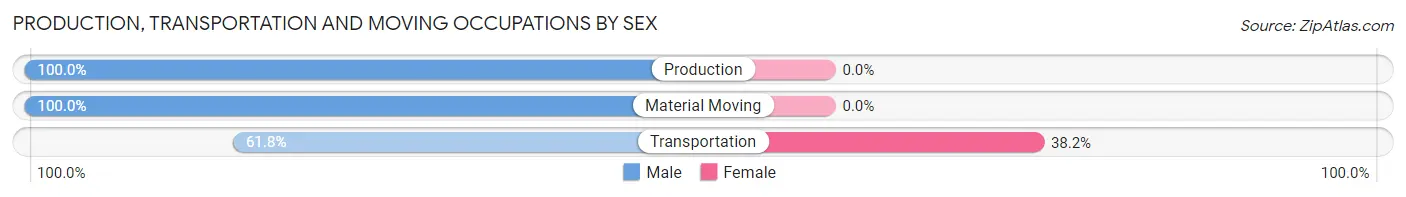
Production, Transportation and Moving Occupations by Sex
| Occupation | Male | Female |
| Production | 77 (100.0%) | 0 (0.0%) |
| Transportation | 21 (61.8%) | 13 (38.2%) |
| Material Moving | 13 (100.0%) | 0 (0.0%) |
| Total (Category) | 111 (89.5%) | 13 (10.5%) |
| Total (Overall) | 958 (46.1%) | 1,119 (53.9%) |
Employment Industries by Sex in Rose Hill
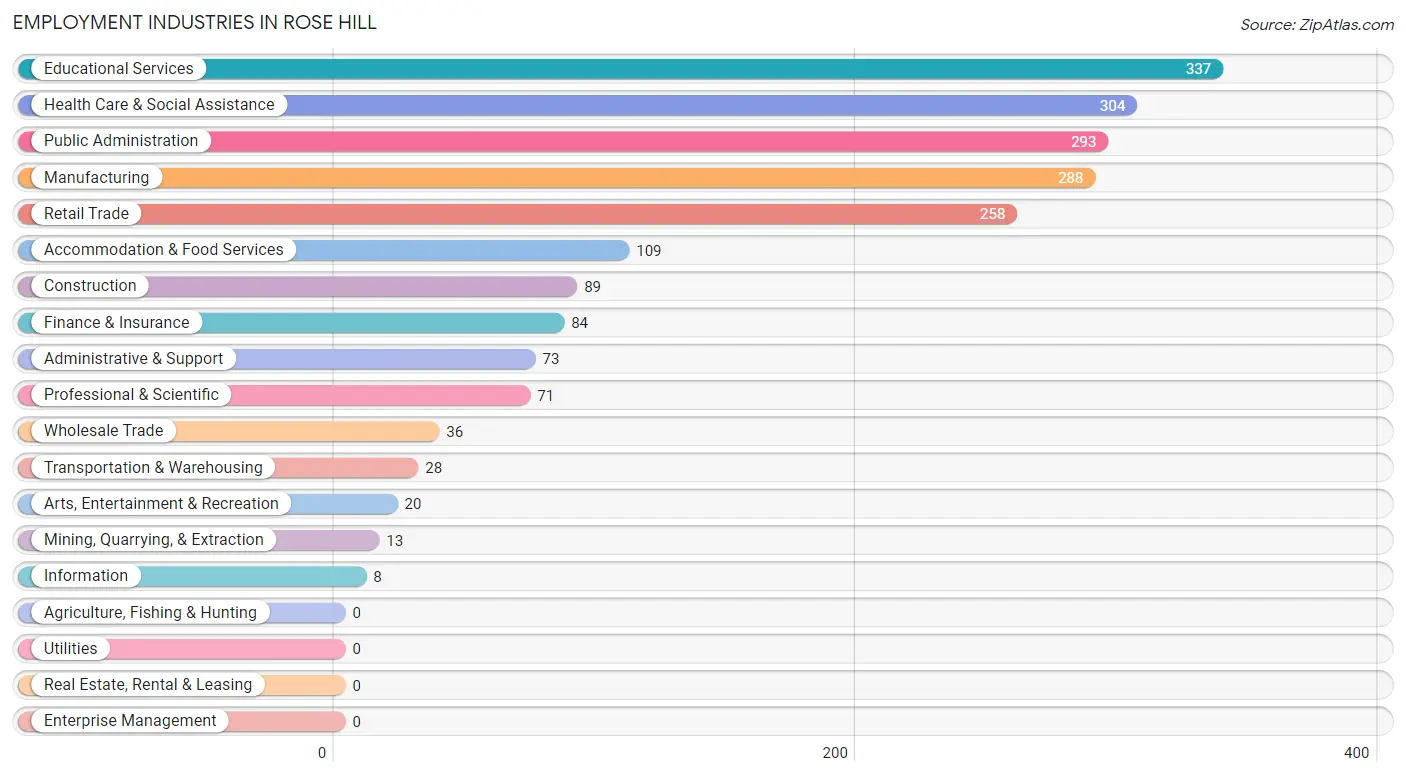
Employment Industries in Rose Hill
The major employment industries in Rose Hill include Educational Services (337 | 16.2%), Health Care & Social Assistance (304 | 14.6%), Public Administration (293 | 14.1%), Manufacturing (288 | 13.9%), and Retail Trade (258 | 12.4%).
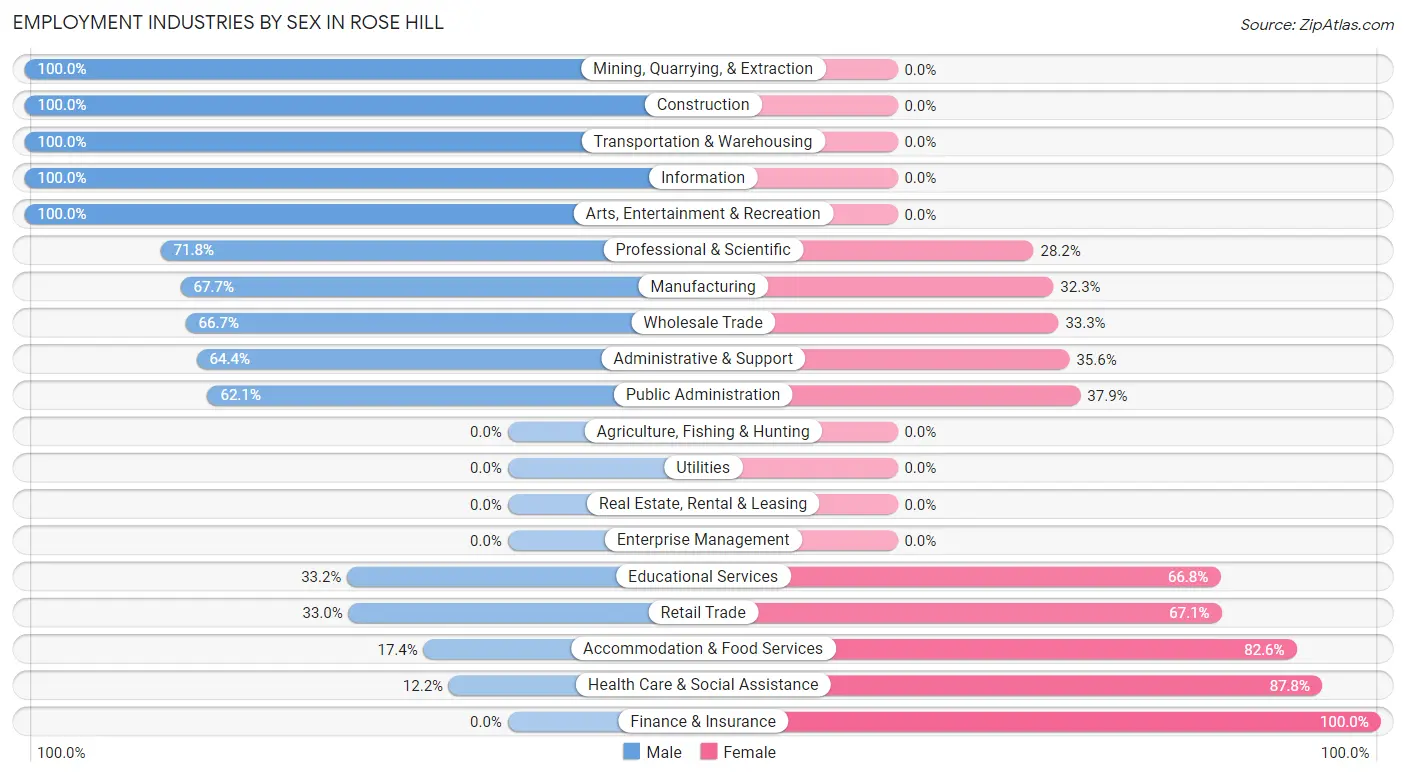
Employment Industries by Sex in Rose Hill
The Rose Hill industries that see more men than women are Mining, Quarrying, & Extraction (100.0%), Construction (100.0%), and Transportation & Warehousing (100.0%), whereas the industries that tend to have a higher number of women are Finance & Insurance (100.0%), Health Care & Social Assistance (87.8%), and Accommodation & Food Services (82.6%).
| Industry | Male | Female |
| Agriculture, Fishing & Hunting | 0 (0.0%) | 0 (0.0%) |
| Mining, Quarrying, & Extraction | 13 (100.0%) | 0 (0.0%) |
| Construction | 89 (100.0%) | 0 (0.0%) |
| Manufacturing | 195 (67.7%) | 93 (32.3%) |
| Wholesale Trade | 24 (66.7%) | 12 (33.3%) |
| Retail Trade | 85 (33.0%) | 173 (67.0%) |
| Transportation & Warehousing | 28 (100.0%) | 0 (0.0%) |
| Utilities | 0 (0.0%) | 0 (0.0%) |
| Information | 8 (100.0%) | 0 (0.0%) |
| Finance & Insurance | 0 (0.0%) | 84 (100.0%) |
| Real Estate, Rental & Leasing | 0 (0.0%) | 0 (0.0%) |
| Professional & Scientific | 51 (71.8%) | 20 (28.2%) |
| Enterprise Management | 0 (0.0%) | 0 (0.0%) |
| Administrative & Support | 47 (64.4%) | 26 (35.6%) |
| Educational Services | 112 (33.2%) | 225 (66.8%) |
| Health Care & Social Assistance | 37 (12.2%) | 267 (87.8%) |
| Arts, Entertainment & Recreation | 20 (100.0%) | 0 (0.0%) |
| Accommodation & Food Services | 19 (17.4%) | 90 (82.6%) |
| Public Administration | 182 (62.1%) | 111 (37.9%) |
| Total | 958 (46.1%) | 1,119 (53.9%) |
Education in Rose Hill
School Enrollment in Rose Hill
The most common levels of schooling among the 1,413 students in Rose Hill are high school (512 | 36.2%), elementary school (290 | 20.5%), and middle school (266 | 18.8%).
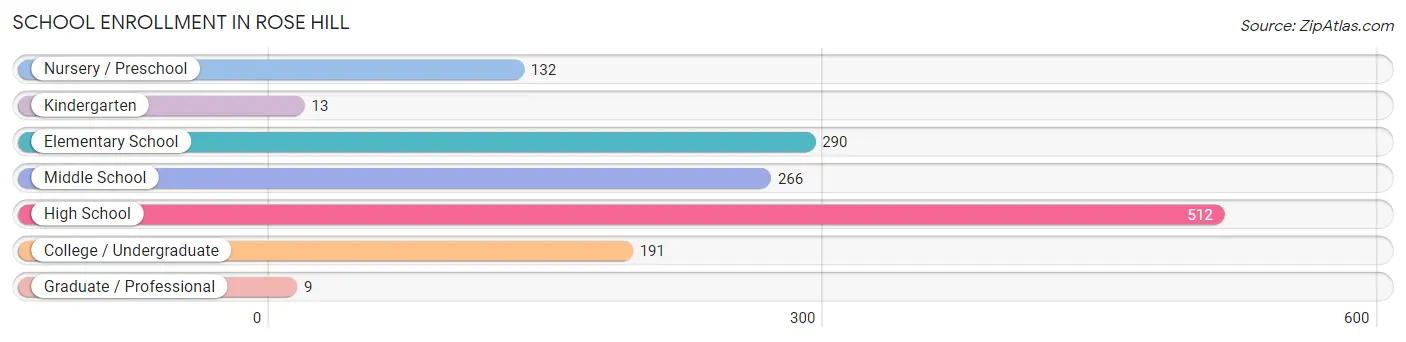
| School Level | # Students | % Students |
| Nursery / Preschool | 132 | 9.3% |
| Kindergarten | 13 | 0.9% |
| Elementary School | 290 | 20.5% |
| Middle School | 266 | 18.8% |
| High School | 512 | 36.2% |
| College / Undergraduate | 191 | 13.5% |
| Graduate / Professional | 9 | 0.6% |
| Total | 1,413 | 100.0% |
School Enrollment by Age by Funding Source in Rose Hill
Out of a total of 1,413 students who are enrolled in schools in Rose Hill, 59 (4.2%) attend a private institution, while the remaining 1,354 (95.8%) are enrolled in public schools. The age group of 35 years and over has the highest likelihood of being enrolled in private schools, with 11 (100.0% in the age bracket) enrolled. Conversely, the age group of 3 to 4 year olds has the lowest likelihood of being enrolled in a private school, with 118 (100.0% in the age bracket) attending a public institution.
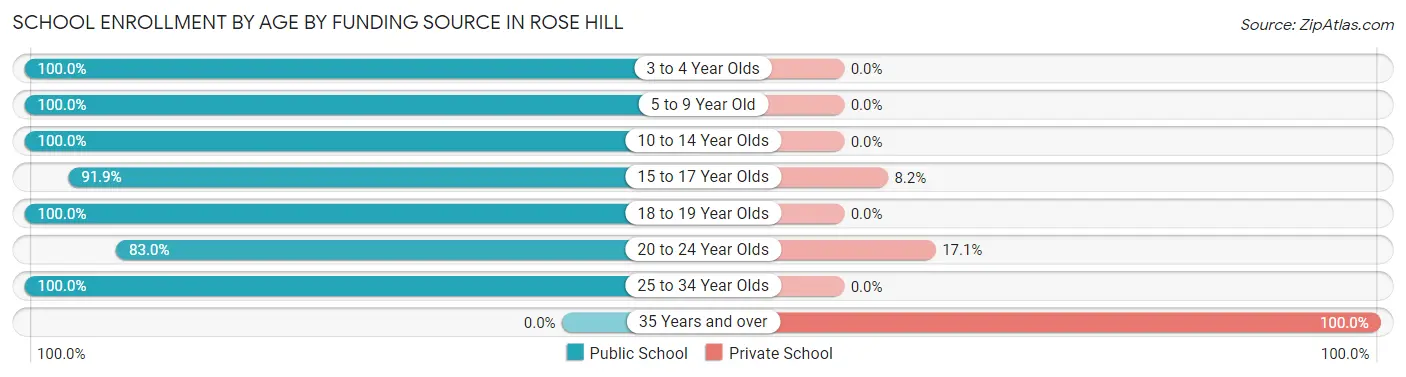
| Age Bracket | Public School | Private School |
| 3 to 4 Year Olds | 118 (100.0%) | 0 (0.0%) |
| 5 to 9 Year Old | 248 (100.0%) | 0 (0.0%) |
| 10 to 14 Year Olds | 343 (100.0%) | 0 (0.0%) |
| 15 to 17 Year Olds | 372 (91.8%) | 33 (8.2%) |
| 18 to 19 Year Olds | 107 (100.0%) | 0 (0.0%) |
| 20 to 24 Year Olds | 73 (83.0%) | 15 (17.1%) |
| 25 to 34 Year Olds | 93 (100.0%) | 0 (0.0%) |
| 35 Years and over | 0 (0.0%) | 11 (100.0%) |
| Total | 1,354 (95.8%) | 59 (4.2%) |
Educational Attainment by Field of Study in Rose Hill
Science & technology (243 | 20.7%), education (216 | 18.4%), business (215 | 18.3%), visual & performing arts (128 | 10.9%), and psychology (105 | 9.0%) are the most common fields of study among 1,172 individuals in Rose Hill who have obtained a bachelor's degree or higher.
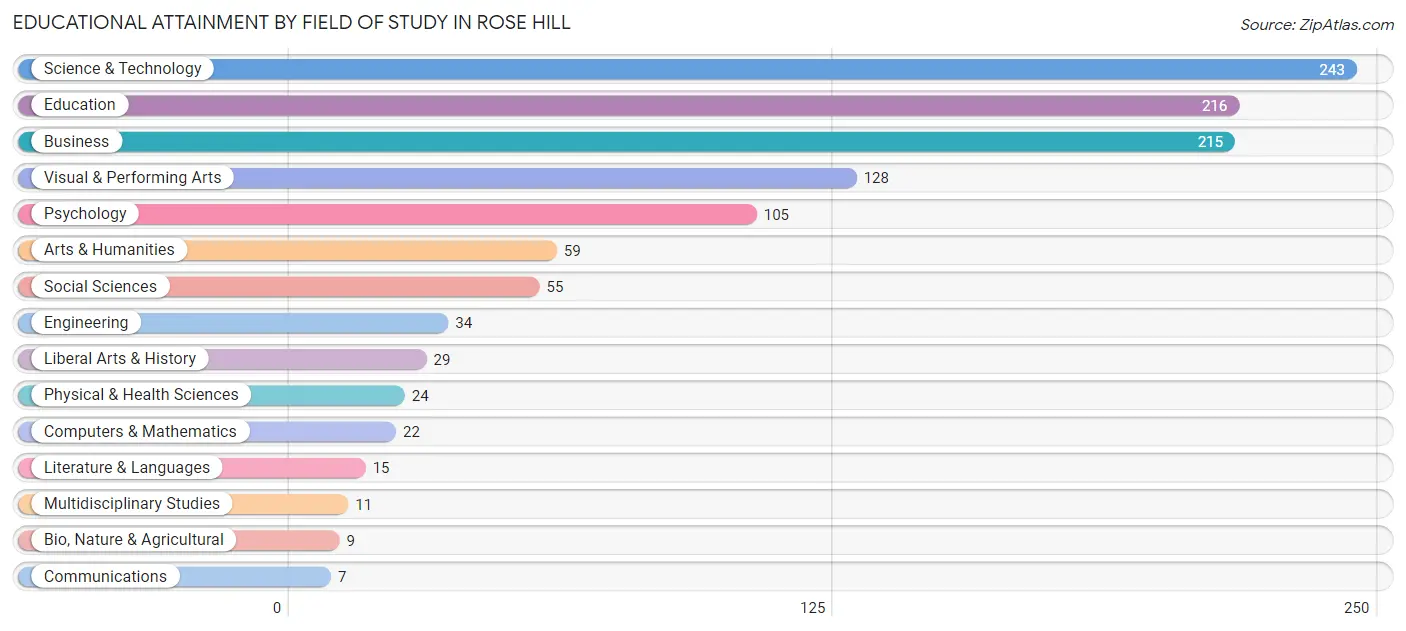
| Field of Study | # Graduates | % Graduates |
| Computers & Mathematics | 22 | 1.9% |
| Bio, Nature & Agricultural | 9 | 0.8% |
| Physical & Health Sciences | 24 | 2.1% |
| Psychology | 105 | 9.0% |
| Social Sciences | 55 | 4.7% |
| Engineering | 34 | 2.9% |
| Multidisciplinary Studies | 11 | 0.9% |
| Science & Technology | 243 | 20.7% |
| Business | 215 | 18.3% |
| Education | 216 | 18.4% |
| Literature & Languages | 15 | 1.3% |
| Liberal Arts & History | 29 | 2.5% |
| Visual & Performing Arts | 128 | 10.9% |
| Communications | 7 | 0.6% |
| Arts & Humanities | 59 | 5.0% |
| Total | 1,172 | 100.0% |
Transportation & Commute in Rose Hill
Vehicle Availability by Sex in Rose Hill
The most prevalent vehicle ownership categories in Rose Hill are males with 2 vehicles (446, accounting for 42.6%) and females with 2 vehicles (463, making up 39.9%).
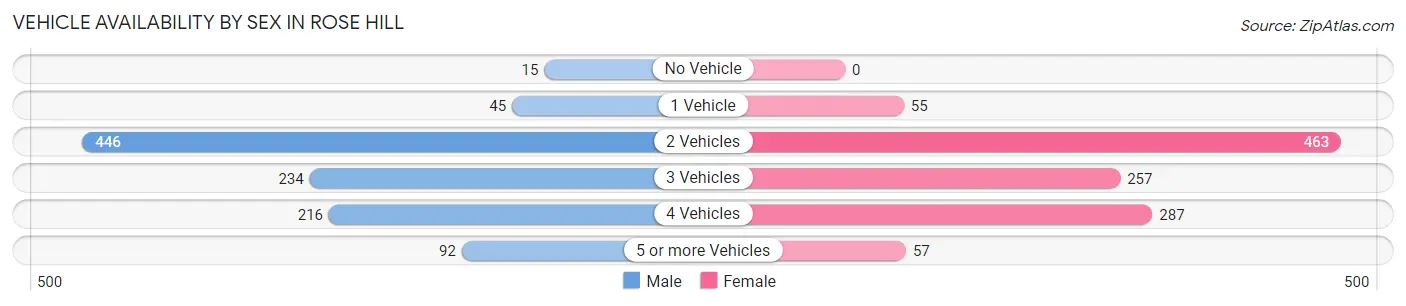
| Vehicles Available | Male | Female |
| No Vehicle | 15 (1.4%) | 0 (0.0%) |
| 1 Vehicle | 45 (4.3%) | 55 (4.9%) |
| 2 Vehicles | 446 (42.6%) | 463 (41.4%) |
| 3 Vehicles | 234 (22.3%) | 257 (23.0%) |
| 4 Vehicles | 216 (20.6%) | 287 (25.7%) |
| 5 or more Vehicles | 92 (8.8%) | 57 (5.1%) |
| Total | 1,048 (100.0%) | 1,119 (100.0%) |
Commute Time in Rose Hill
The most frequently occuring commute durations in Rose Hill are 30 to 34 minutes (502 commuters, 25.4%), 15 to 19 minutes (403 commuters, 20.4%), and 20 to 24 minutes (354 commuters, 17.9%).
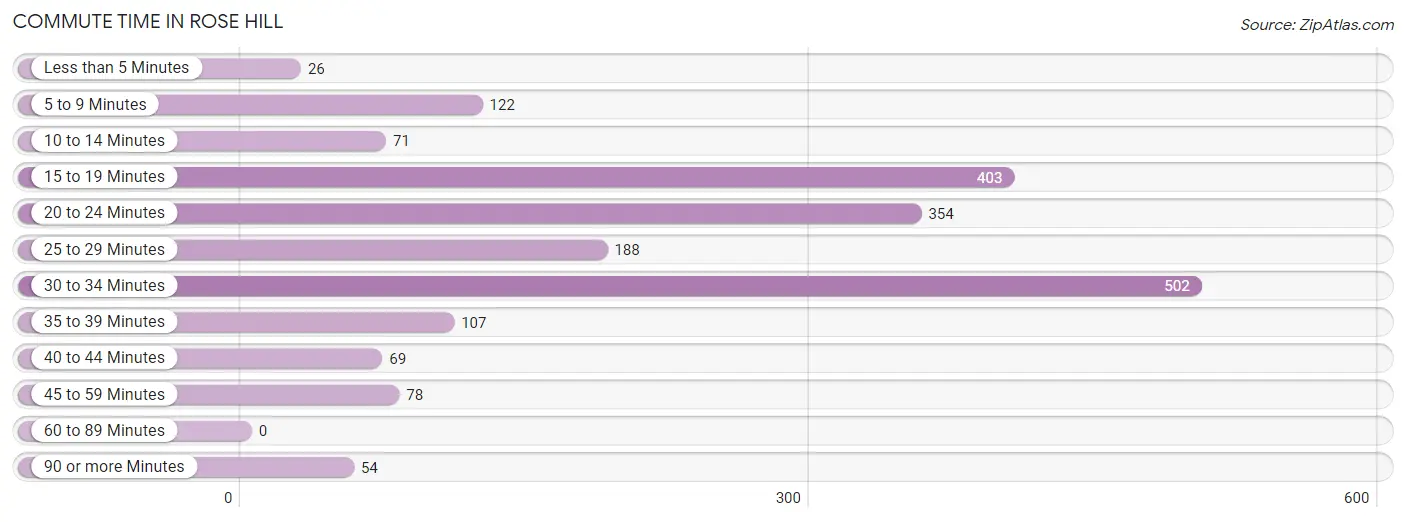
| Commute Time | # Commuters | % Commuters |
| Less than 5 Minutes | 26 | 1.3% |
| 5 to 9 Minutes | 122 | 6.2% |
| 10 to 14 Minutes | 71 | 3.6% |
| 15 to 19 Minutes | 403 | 20.4% |
| 20 to 24 Minutes | 354 | 17.9% |
| 25 to 29 Minutes | 188 | 9.5% |
| 30 to 34 Minutes | 502 | 25.4% |
| 35 to 39 Minutes | 107 | 5.4% |
| 40 to 44 Minutes | 69 | 3.5% |
| 45 to 59 Minutes | 78 | 4.0% |
| 60 to 89 Minutes | 0 | 0.0% |
| 90 or more Minutes | 54 | 2.7% |
Commute Time by Sex in Rose Hill
The most common commute times in Rose Hill are 30 to 34 minutes (270 commuters, 28.1%) for males and 15 to 19 minutes (261 commuters, 25.7%) for females.
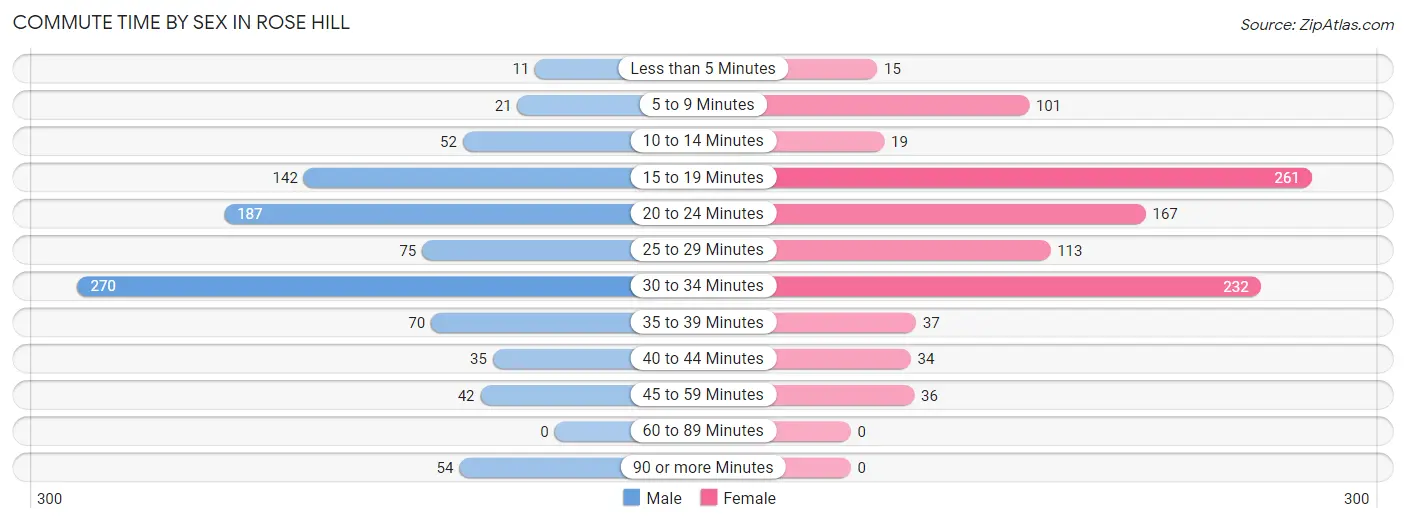
| Commute Time | Male | Female |
| Less than 5 Minutes | 11 (1.1%) | 15 (1.5%) |
| 5 to 9 Minutes | 21 (2.2%) | 101 (10.0%) |
| 10 to 14 Minutes | 52 (5.4%) | 19 (1.9%) |
| 15 to 19 Minutes | 142 (14.8%) | 261 (25.7%) |
| 20 to 24 Minutes | 187 (19.5%) | 167 (16.5%) |
| 25 to 29 Minutes | 75 (7.8%) | 113 (11.1%) |
| 30 to 34 Minutes | 270 (28.1%) | 232 (22.9%) |
| 35 to 39 Minutes | 70 (7.3%) | 37 (3.6%) |
| 40 to 44 Minutes | 35 (3.6%) | 34 (3.4%) |
| 45 to 59 Minutes | 42 (4.4%) | 36 (3.5%) |
| 60 to 89 Minutes | 0 (0.0%) | 0 (0.0%) |
| 90 or more Minutes | 54 (5.6%) | 0 (0.0%) |
Time of Departure to Work by Sex in Rose Hill
The most frequent times of departure to work in Rose Hill are 6:30 AM to 6:59 AM (191, 19.9%) for males and 7:00 AM to 7:29 AM (202, 19.9%) for females.
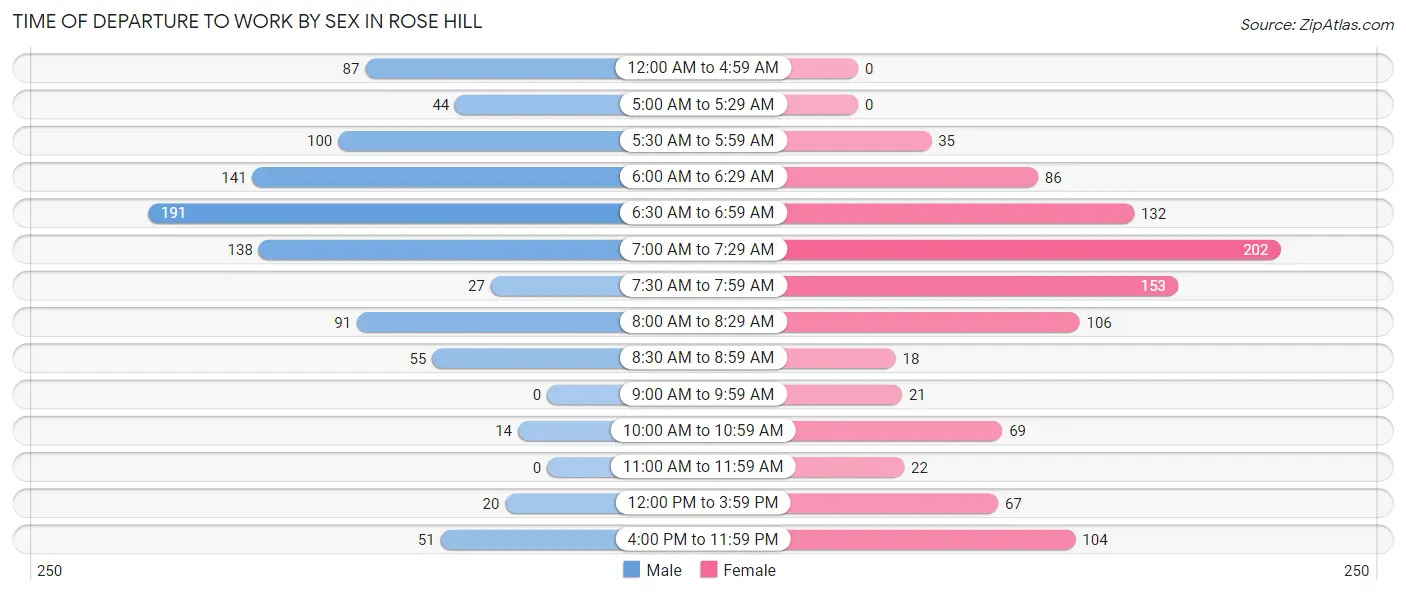
| Time of Departure | Male | Female |
| 12:00 AM to 4:59 AM | 87 (9.1%) | 0 (0.0%) |
| 5:00 AM to 5:29 AM | 44 (4.6%) | 0 (0.0%) |
| 5:30 AM to 5:59 AM | 100 (10.4%) | 35 (3.5%) |
| 6:00 AM to 6:29 AM | 141 (14.7%) | 86 (8.5%) |
| 6:30 AM to 6:59 AM | 191 (19.9%) | 132 (13.0%) |
| 7:00 AM to 7:29 AM | 138 (14.4%) | 202 (19.9%) |
| 7:30 AM to 7:59 AM | 27 (2.8%) | 153 (15.1%) |
| 8:00 AM to 8:29 AM | 91 (9.5%) | 106 (10.4%) |
| 8:30 AM to 8:59 AM | 55 (5.7%) | 18 (1.8%) |
| 9:00 AM to 9:59 AM | 0 (0.0%) | 21 (2.1%) |
| 10:00 AM to 10:59 AM | 14 (1.5%) | 69 (6.8%) |
| 11:00 AM to 11:59 AM | 0 (0.0%) | 22 (2.2%) |
| 12:00 PM to 3:59 PM | 20 (2.1%) | 67 (6.6%) |
| 4:00 PM to 11:59 PM | 51 (5.3%) | 104 (10.2%) |
| Total | 959 (100.0%) | 1,015 (100.0%) |
Housing Occupancy in Rose Hill
Occupancy by Ownership in Rose Hill
Of the total 1,478 dwellings in Rose Hill, owner-occupied units account for 1,226 (83.0%), while renter-occupied units make up 252 (17.1%).
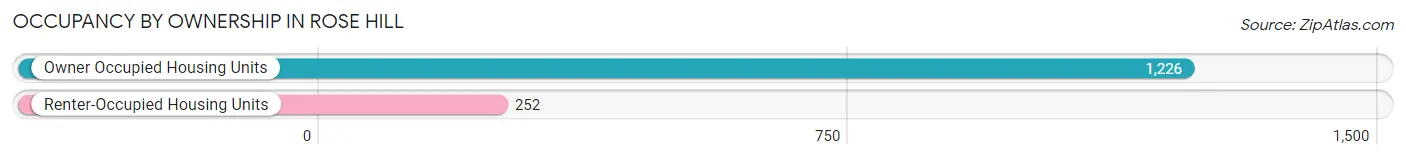
| Occupancy | # Housing Units | % Housing Units |
| Owner Occupied Housing Units | 1,226 | 83.0% |
| Renter-Occupied Housing Units | 252 | 17.1% |
| Total Occupied Housing Units | 1,478 | 100.0% |
Occupancy by Household Size in Rose Hill
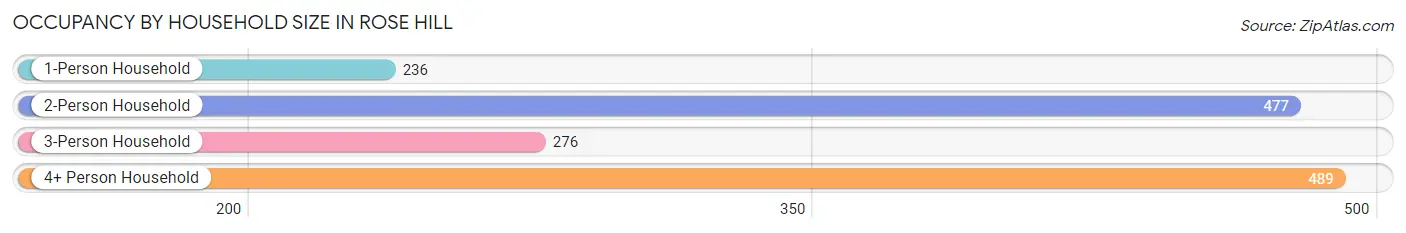
| Household Size | # Housing Units | % Housing Units |
| 1-Person Household | 236 | 16.0% |
| 2-Person Household | 477 | 32.3% |
| 3-Person Household | 276 | 18.7% |
| 4+ Person Household | 489 | 33.1% |
| Total Housing Units | 1,478 | 100.0% |
Occupancy by Ownership by Household Size in Rose Hill
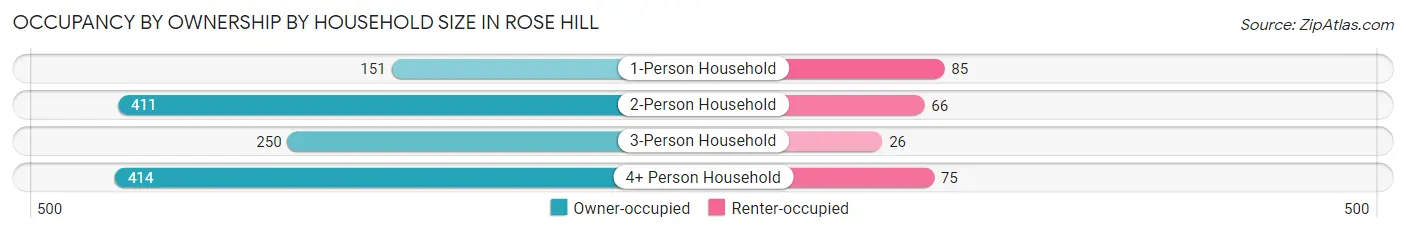
| Household Size | Owner-occupied | Renter-occupied |
| 1-Person Household | 151 (64.0%) | 85 (36.0%) |
| 2-Person Household | 411 (86.2%) | 66 (13.8%) |
| 3-Person Household | 250 (90.6%) | 26 (9.4%) |
| 4+ Person Household | 414 (84.7%) | 75 (15.3%) |
| Total Housing Units | 1,226 (83.0%) | 252 (17.1%) |
Occupancy by Educational Attainment in Rose Hill
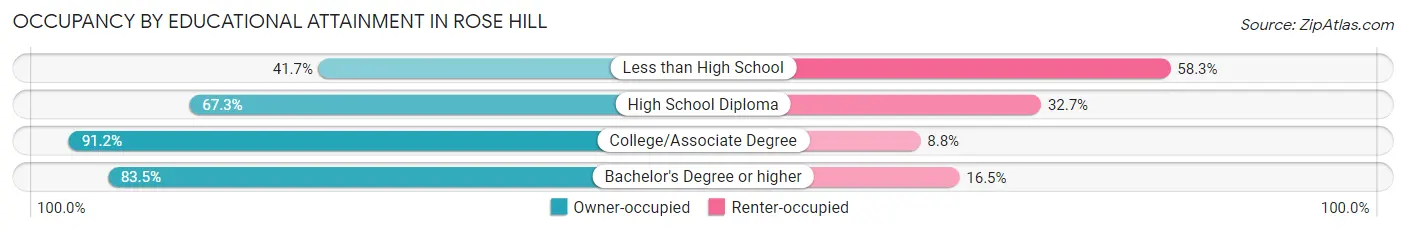
| Household Size | Owner-occupied | Renter-occupied |
| Less than High School | 10 (41.7%) | 14 (58.3%) |
| High School Diploma | 169 (67.3%) | 82 (32.7%) |
| College/Associate Degree | 500 (91.2%) | 48 (8.8%) |
| Bachelor's Degree or higher | 547 (83.5%) | 108 (16.5%) |
Occupancy by Age of Householder in Rose Hill
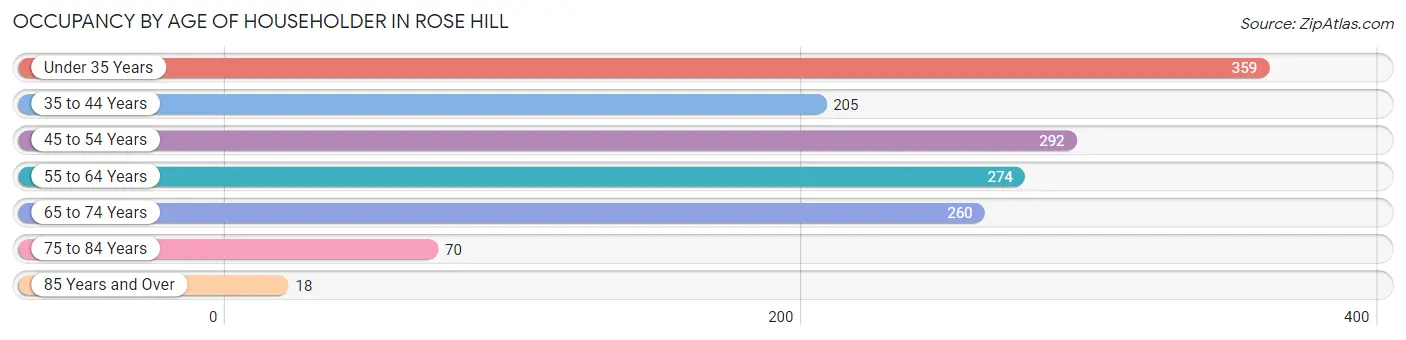
| Age Bracket | # Households | % Households |
| Under 35 Years | 359 | 24.3% |
| 35 to 44 Years | 205 | 13.9% |
| 45 to 54 Years | 292 | 19.8% |
| 55 to 64 Years | 274 | 18.5% |
| 65 to 74 Years | 260 | 17.6% |
| 75 to 84 Years | 70 | 4.7% |
| 85 Years and Over | 18 | 1.2% |
| Total | 1,478 | 100.0% |
Housing Finances in Rose Hill
Median Income by Occupancy in Rose Hill
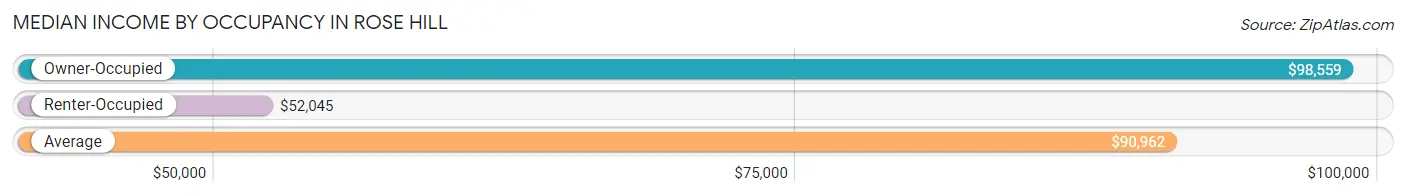
| Occupancy Type | # Households | Median Income |
| Owner-Occupied | 1,226 (83.0%) | $98,559 |
| Renter-Occupied | 252 (17.1%) | $52,045 |
| Average | 1,478 (100.0%) | $90,962 |
Occupancy by Householder Income Bracket in Rose Hill
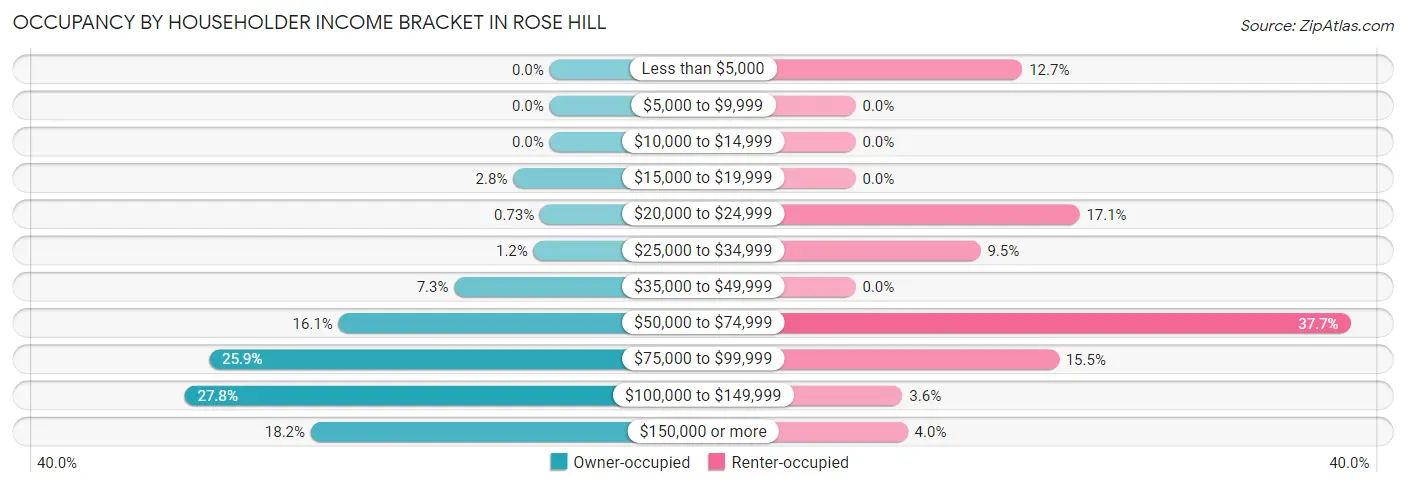
| Income Bracket | Owner-occupied | Renter-occupied |
| Less than $5,000 | 0 (0.0%) | 32 (12.7%) |
| $5,000 to $9,999 | 0 (0.0%) | 0 (0.0%) |
| $10,000 to $14,999 | 0 (0.0%) | 0 (0.0%) |
| $15,000 to $19,999 | 34 (2.8%) | 0 (0.0%) |
| $20,000 to $24,999 | 9 (0.7%) | 43 (17.1%) |
| $25,000 to $34,999 | 15 (1.2%) | 24 (9.5%) |
| $35,000 to $49,999 | 89 (7.3%) | 0 (0.0%) |
| $50,000 to $74,999 | 197 (16.1%) | 95 (37.7%) |
| $75,000 to $99,999 | 318 (25.9%) | 39 (15.5%) |
| $100,000 to $149,999 | 341 (27.8%) | 9 (3.6%) |
| $150,000 or more | 223 (18.2%) | 10 (4.0%) |
| Total | 1,226 (100.0%) | 252 (100.0%) |
Monthly Housing Cost Tiers in Rose Hill
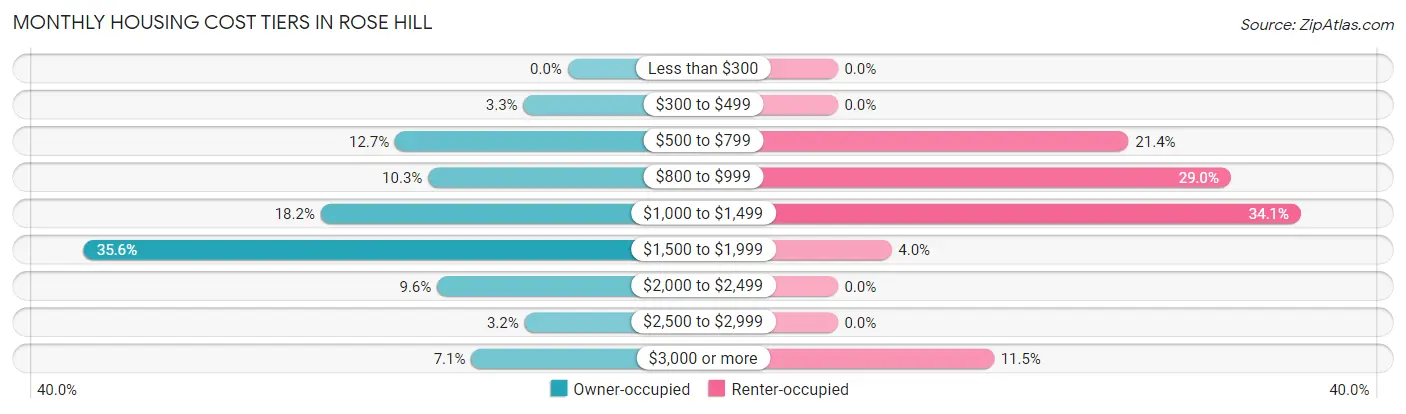
| Monthly Cost | Owner-occupied | Renter-occupied |
| Less than $300 | 0 (0.0%) | 0 (0.0%) |
| $300 to $499 | 40 (3.3%) | 0 (0.0%) |
| $500 to $799 | 156 (12.7%) | 54 (21.4%) |
| $800 to $999 | 126 (10.3%) | 73 (29.0%) |
| $1,000 to $1,499 | 223 (18.2%) | 86 (34.1%) |
| $1,500 to $1,999 | 437 (35.6%) | 10 (4.0%) |
| $2,000 to $2,499 | 118 (9.6%) | 0 (0.0%) |
| $2,500 to $2,999 | 39 (3.2%) | 0 (0.0%) |
| $3,000 or more | 87 (7.1%) | 29 (11.5%) |
| Total | 1,226 (100.0%) | 252 (100.0%) |
Physical Housing Characteristics in Rose Hill
Housing Structures in Rose Hill
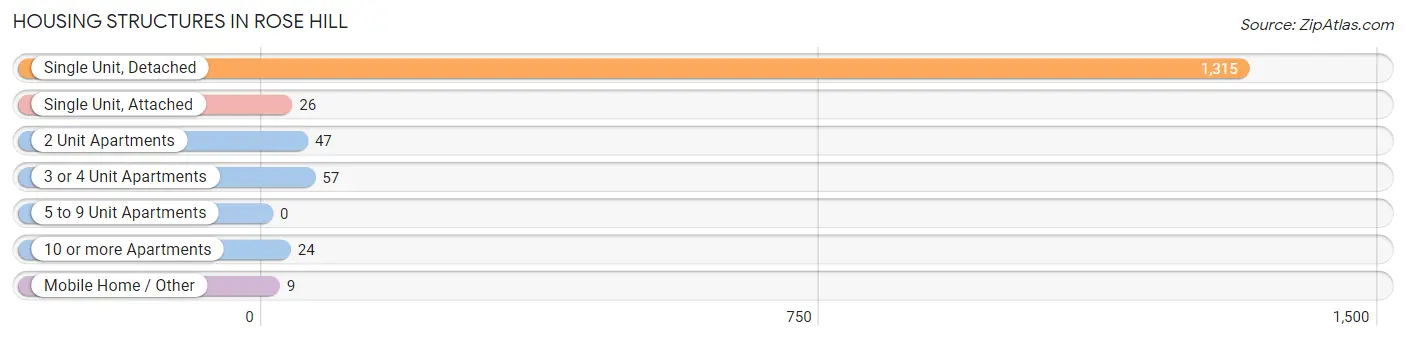
| Structure Type | # Housing Units | % Housing Units |
| Single Unit, Detached | 1,315 | 89.0% |
| Single Unit, Attached | 26 | 1.8% |
| 2 Unit Apartments | 47 | 3.2% |
| 3 or 4 Unit Apartments | 57 | 3.9% |
| 5 to 9 Unit Apartments | 0 | 0.0% |
| 10 or more Apartments | 24 | 1.6% |
| Mobile Home / Other | 9 | 0.6% |
| Total | 1,478 | 100.0% |
Housing Structures by Occupancy in Rose Hill
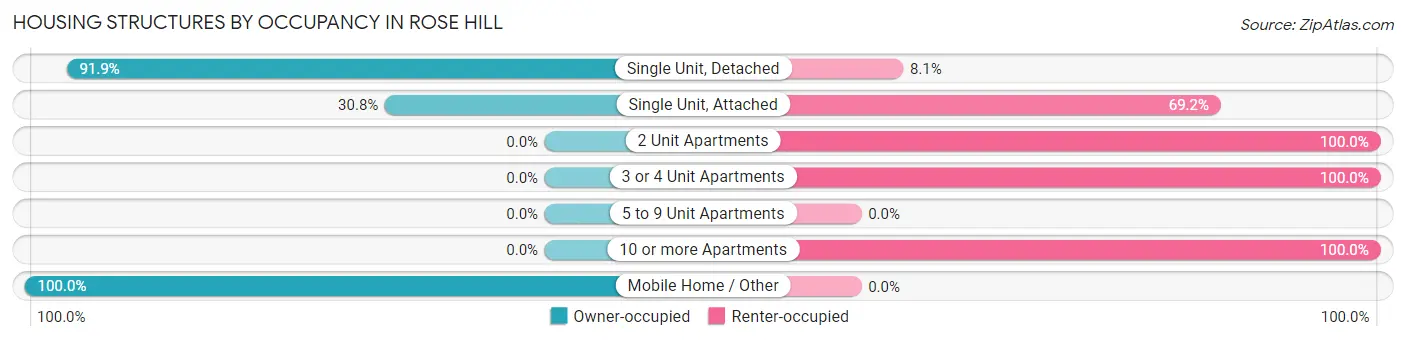
| Structure Type | Owner-occupied | Renter-occupied |
| Single Unit, Detached | 1,209 (91.9%) | 106 (8.1%) |
| Single Unit, Attached | 8 (30.8%) | 18 (69.2%) |
| 2 Unit Apartments | 0 (0.0%) | 47 (100.0%) |
| 3 or 4 Unit Apartments | 0 (0.0%) | 57 (100.0%) |
| 5 to 9 Unit Apartments | 0 (0.0%) | 0 (0.0%) |
| 10 or more Apartments | 0 (0.0%) | 24 (100.0%) |
| Mobile Home / Other | 9 (100.0%) | 0 (0.0%) |
| Total | 1,226 (83.0%) | 252 (17.1%) |
Housing Structures by Number of Rooms in Rose Hill
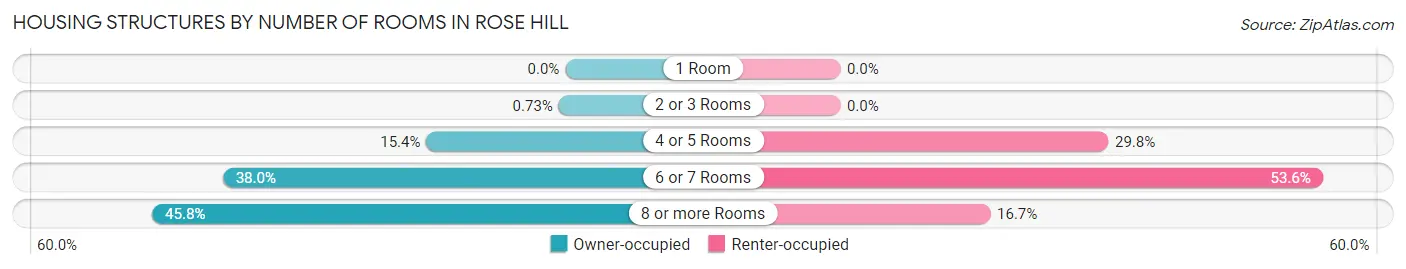
| Number of Rooms | Owner-occupied | Renter-occupied |
| 1 Room | 0 (0.0%) | 0 (0.0%) |
| 2 or 3 Rooms | 9 (0.7%) | 0 (0.0%) |
| 4 or 5 Rooms | 189 (15.4%) | 75 (29.8%) |
| 6 or 7 Rooms | 466 (38.0%) | 135 (53.6%) |
| 8 or more Rooms | 562 (45.8%) | 42 (16.7%) |
| Total | 1,226 (100.0%) | 252 (100.0%) |
Housing Structure by Heating Type in Rose Hill
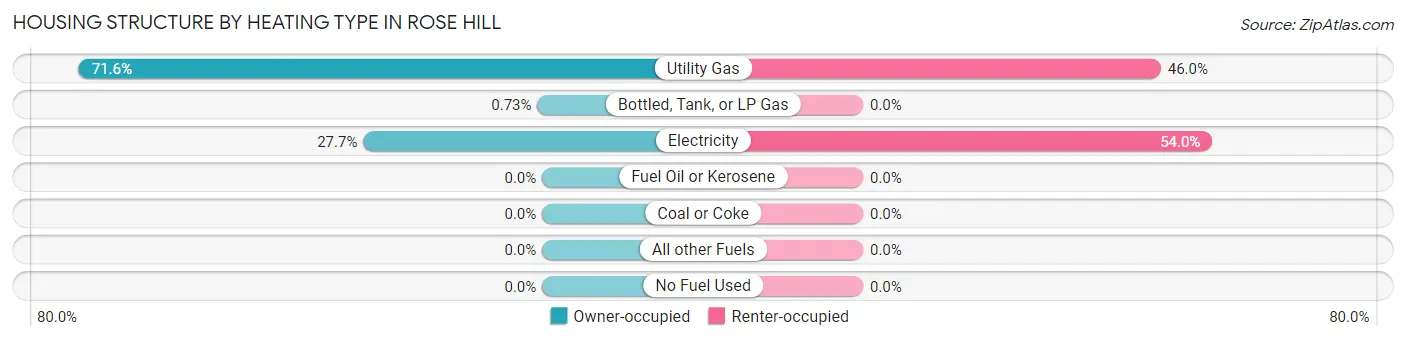
| Heating Type | Owner-occupied | Renter-occupied |
| Utility Gas | 878 (71.6%) | 116 (46.0%) |
| Bottled, Tank, or LP Gas | 9 (0.7%) | 0 (0.0%) |
| Electricity | 339 (27.7%) | 136 (54.0%) |
| Fuel Oil or Kerosene | 0 (0.0%) | 0 (0.0%) |
| Coal or Coke | 0 (0.0%) | 0 (0.0%) |
| All other Fuels | 0 (0.0%) | 0 (0.0%) |
| No Fuel Used | 0 (0.0%) | 0 (0.0%) |
| Total | 1,226 (100.0%) | 252 (100.0%) |
Household Vehicle Usage in Rose Hill
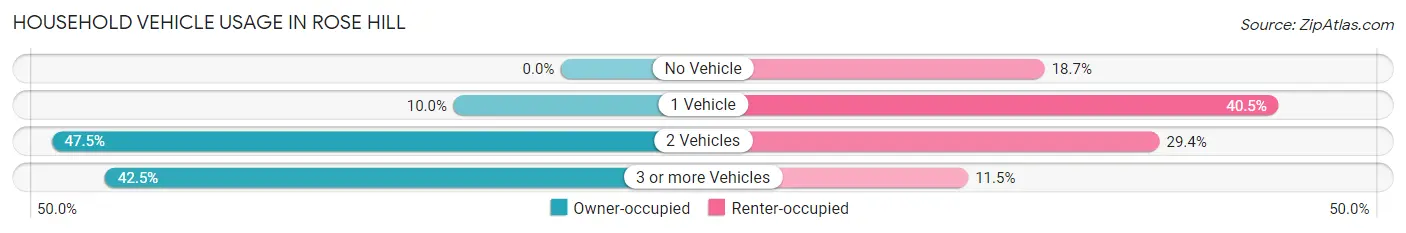
| Vehicles per Household | Owner-occupied | Renter-occupied |
| No Vehicle | 0 (0.0%) | 47 (18.6%) |
| 1 Vehicle | 123 (10.0%) | 102 (40.5%) |
| 2 Vehicles | 582 (47.5%) | 74 (29.4%) |
| 3 or more Vehicles | 521 (42.5%) | 29 (11.5%) |
| Total | 1,226 (100.0%) | 252 (100.0%) |
Real Estate & Mortgages in Rose Hill
Real Estate and Mortgage Overview in Rose Hill
| Characteristic | Without Mortgage | With Mortgage |
| Housing Units | 316 | 910 |
| Median Property Value | $197,200 | $198,000 |
| Median Household Income | $77,308 | $190 |
| Monthly Housing Costs | $696 | $75 |
| Real Estate Taxes | $3,456 | $10 |
Property Value by Mortgage Status in Rose Hill
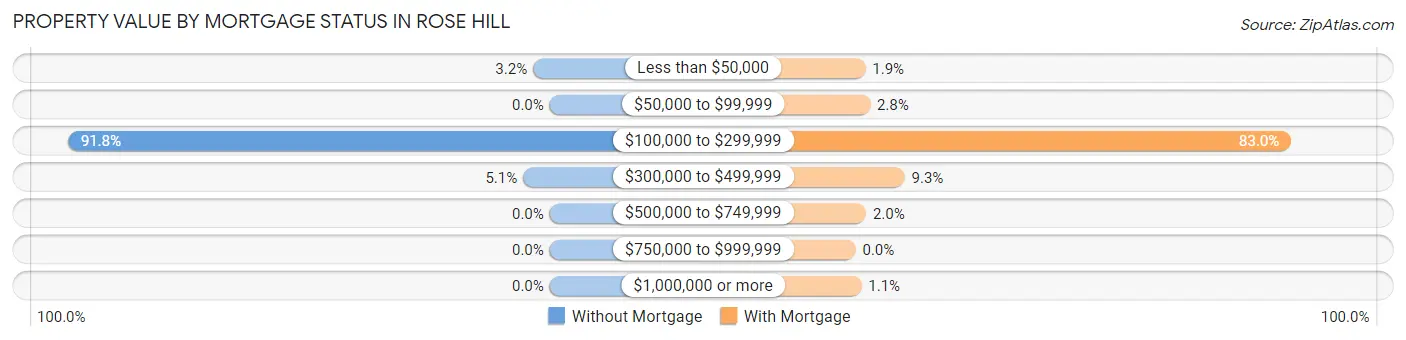
| Property Value | Without Mortgage | With Mortgage |
| Less than $50,000 | 10 (3.2%) | 17 (1.9%) |
| $50,000 to $99,999 | 0 (0.0%) | 25 (2.8%) |
| $100,000 to $299,999 | 290 (91.8%) | 755 (83.0%) |
| $300,000 to $499,999 | 16 (5.1%) | 85 (9.3%) |
| $500,000 to $749,999 | 0 (0.0%) | 18 (2.0%) |
| $750,000 to $999,999 | 0 (0.0%) | 0 (0.0%) |
| $1,000,000 or more | 0 (0.0%) | 10 (1.1%) |
| Total | 316 (100.0%) | 910 (100.0%) |
Household Income by Mortgage Status in Rose Hill
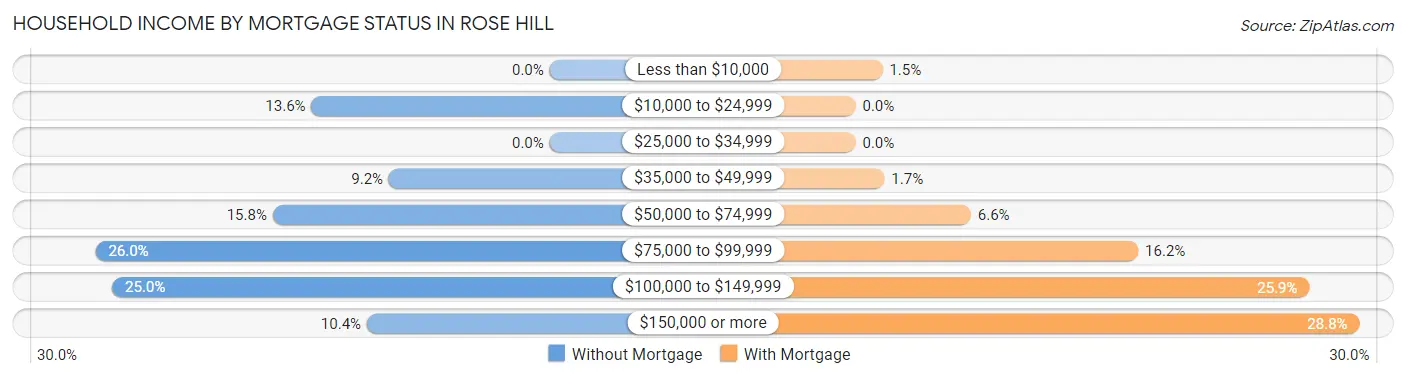
| Household Income | Without Mortgage | With Mortgage |
| Less than $10,000 | 0 (0.0%) | 14 (1.5%) |
| $10,000 to $24,999 | 43 (13.6%) | 0 (0.0%) |
| $25,000 to $34,999 | 0 (0.0%) | 0 (0.0%) |
| $35,000 to $49,999 | 29 (9.2%) | 15 (1.7%) |
| $50,000 to $74,999 | 50 (15.8%) | 60 (6.6%) |
| $75,000 to $99,999 | 82 (26.0%) | 147 (16.2%) |
| $100,000 to $149,999 | 79 (25.0%) | 236 (25.9%) |
| $150,000 or more | 33 (10.4%) | 262 (28.8%) |
| Total | 316 (100.0%) | 910 (100.0%) |
Property Value to Household Income Ratio in Rose Hill
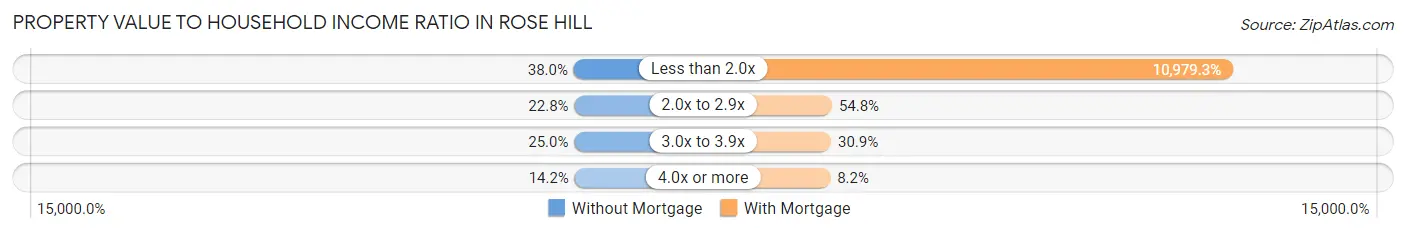
| Value-to-Income Ratio | Without Mortgage | With Mortgage |
| Less than 2.0x | 120 (38.0%) | 99,912 (10,979.3%) |
| 2.0x to 2.9x | 72 (22.8%) | 499 (54.8%) |
| 3.0x to 3.9x | 79 (25.0%) | 281 (30.9%) |
| 4.0x or more | 45 (14.2%) | 75 (8.2%) |
| Total | 316 (100.0%) | 910 (100.0%) |
Real Estate Taxes by Mortgage Status in Rose Hill
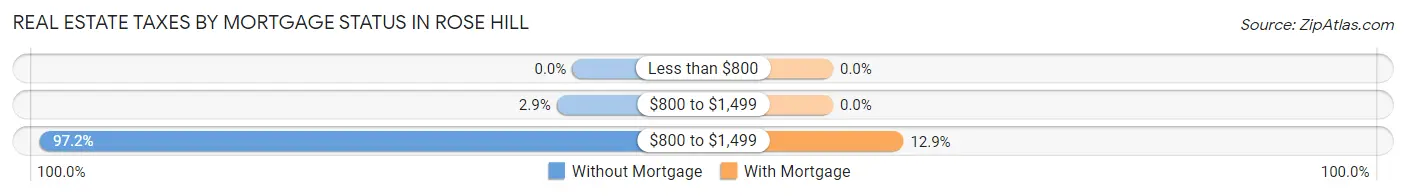
| Property Taxes | Without Mortgage | With Mortgage |
| Less than $800 | 0 (0.0%) | 0 (0.0%) |
| $800 to $1,499 | 9 (2.9%) | 0 (0.0%) |
| $800 to $1,499 | 307 (97.2%) | 117 (12.9%) |
| Total | 316 (100.0%) | 910 (100.0%) |
Health & Disability in Rose Hill
Health Insurance Coverage by Age in Rose Hill
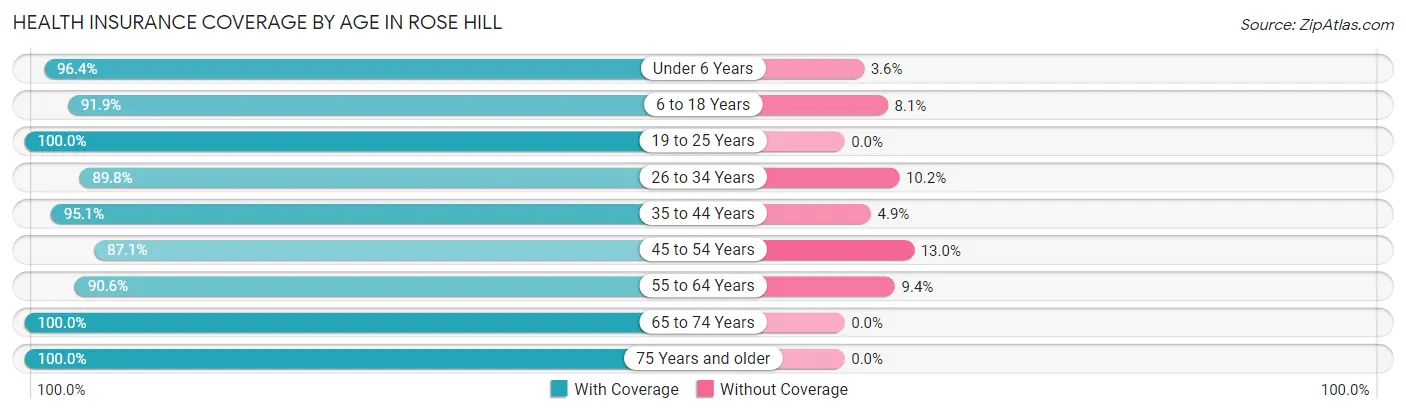
| Age Bracket | With Coverage | Without Coverage |
| Under 6 Years | 293 (96.4%) | 11 (3.6%) |
| 6 to 18 Years | 1,001 (91.9%) | 88 (8.1%) |
| 19 to 25 Years | 483 (100.0%) | 0 (0.0%) |
| 26 to 34 Years | 317 (89.8%) | 36 (10.2%) |
| 35 to 44 Years | 505 (95.1%) | 26 (4.9%) |
| 45 to 54 Years | 484 (87.1%) | 72 (13.0%) |
| 55 to 64 Years | 406 (90.6%) | 42 (9.4%) |
| 65 to 74 Years | 361 (100.0%) | 0 (0.0%) |
| 75 Years and older | 93 (100.0%) | 0 (0.0%) |
| Total | 3,943 (93.5%) | 275 (6.5%) |
Health Insurance Coverage by Citizenship Status in Rose Hill
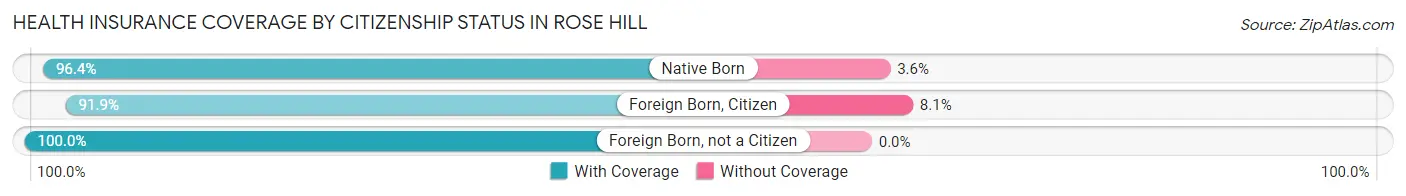
| Citizenship Status | With Coverage | Without Coverage |
| Native Born | 293 (96.4%) | 11 (3.6%) |
| Foreign Born, Citizen | 1,001 (91.9%) | 88 (8.1%) |
| Foreign Born, not a Citizen | 483 (100.0%) | 0 (0.0%) |
Health Insurance Coverage by Household Income in Rose Hill
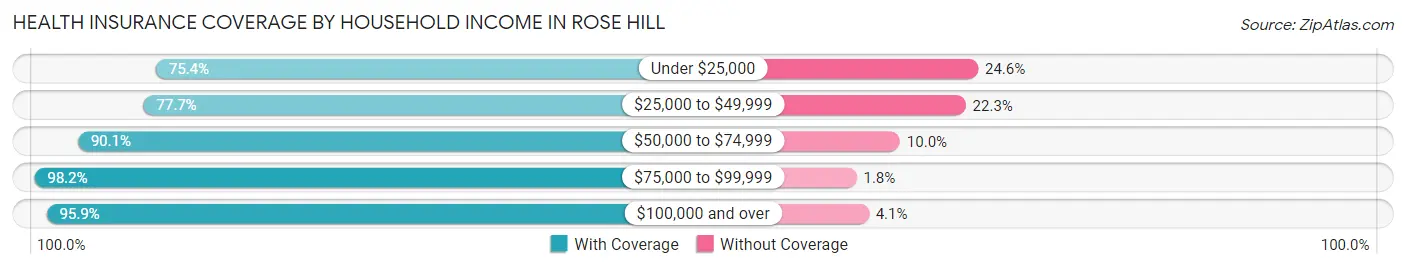
| Household Income | With Coverage | Without Coverage |
| Under $25,000 | 138 (75.4%) | 45 (24.6%) |
| $25,000 to $49,999 | 192 (77.7%) | 55 (22.3%) |
| $50,000 to $74,999 | 688 (90.0%) | 76 (10.0%) |
| $75,000 to $99,999 | 1,078 (98.2%) | 20 (1.8%) |
| $100,000 and over | 1,847 (95.9%) | 79 (4.1%) |
Public vs Private Health Insurance Coverage by Age in Rose Hill
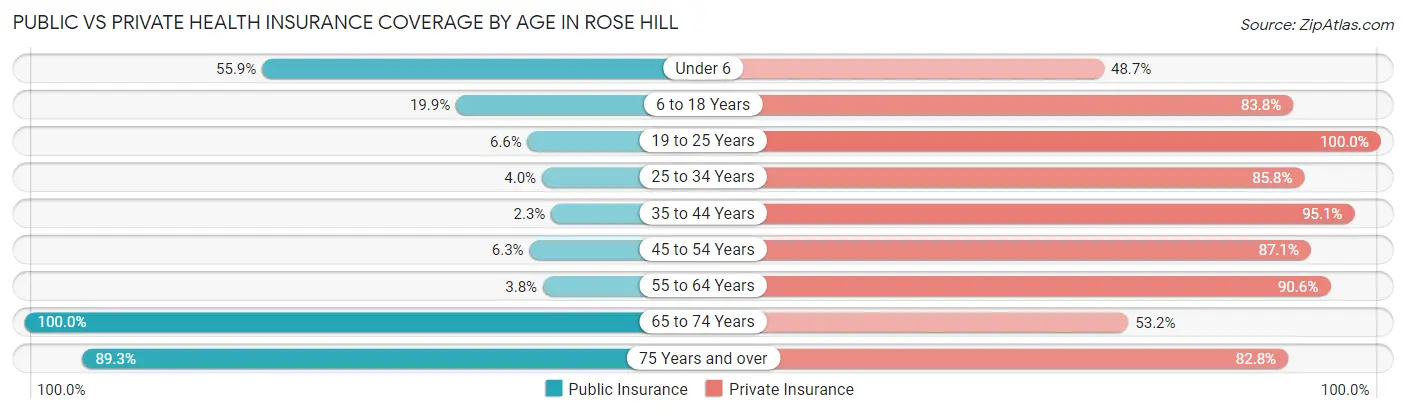
| Age Bracket | Public Insurance | Private Insurance |
| Under 6 | 170 (55.9%) | 148 (48.7%) |
| 6 to 18 Years | 217 (19.9%) | 912 (83.8%) |
| 19 to 25 Years | 32 (6.6%) | 483 (100.0%) |
| 25 to 34 Years | 14 (4.0%) | 303 (85.8%) |
| 35 to 44 Years | 12 (2.3%) | 505 (95.1%) |
| 45 to 54 Years | 35 (6.3%) | 484 (87.1%) |
| 55 to 64 Years | 17 (3.8%) | 406 (90.6%) |
| 65 to 74 Years | 361 (100.0%) | 192 (53.2%) |
| 75 Years and over | 83 (89.2%) | 77 (82.8%) |
| Total | 941 (22.3%) | 3,510 (83.2%) |
Disability Status by Sex by Age in Rose Hill
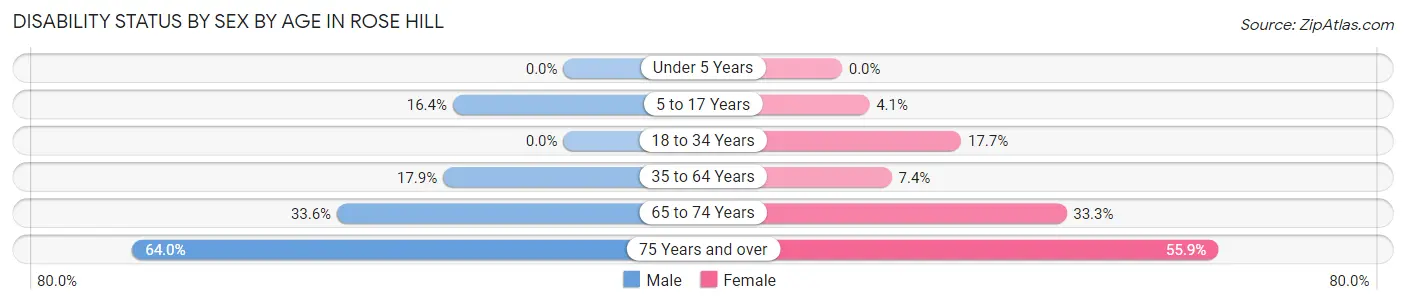
| Age Bracket | Male | Female |
| Under 5 Years | 0 (0.0%) | 0 (0.0%) |
| 5 to 17 Years | 64 (16.4%) | 25 (4.1%) |
| 18 to 34 Years | 0 (0.0%) | 93 (17.7%) |
| 35 to 64 Years | 122 (17.9%) | 63 (7.4%) |
| 65 to 74 Years | 77 (33.6%) | 44 (33.3%) |
| 75 Years and over | 16 (64.0%) | 38 (55.9%) |
Disability Class by Sex by Age in Rose Hill
Disability Class: Hearing Difficulty
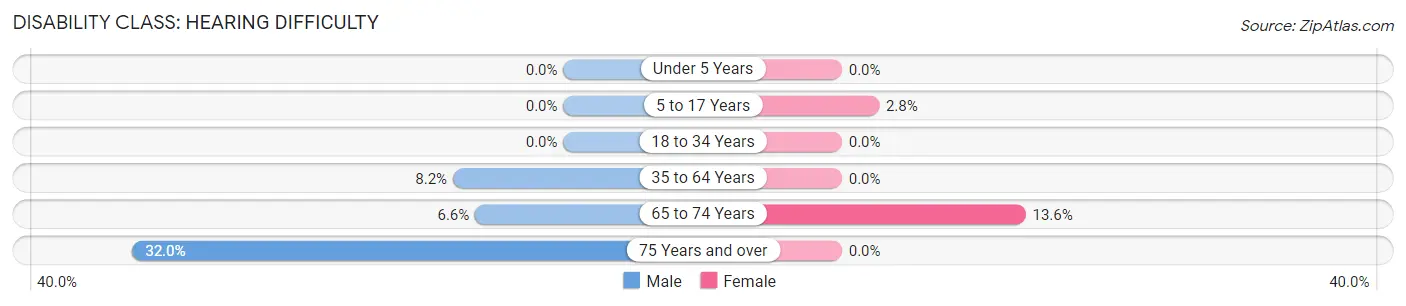
| Age Bracket | Male | Female |
| Under 5 Years | 0 (0.0%) | 0 (0.0%) |
| 5 to 17 Years | 0 (0.0%) | 17 (2.8%) |
| 18 to 34 Years | 0 (0.0%) | 0 (0.0%) |
| 35 to 64 Years | 56 (8.2%) | 0 (0.0%) |
| 65 to 74 Years | 15 (6.6%) | 18 (13.6%) |
| 75 Years and over | 8 (32.0%) | 0 (0.0%) |
Disability Class: Vision Difficulty
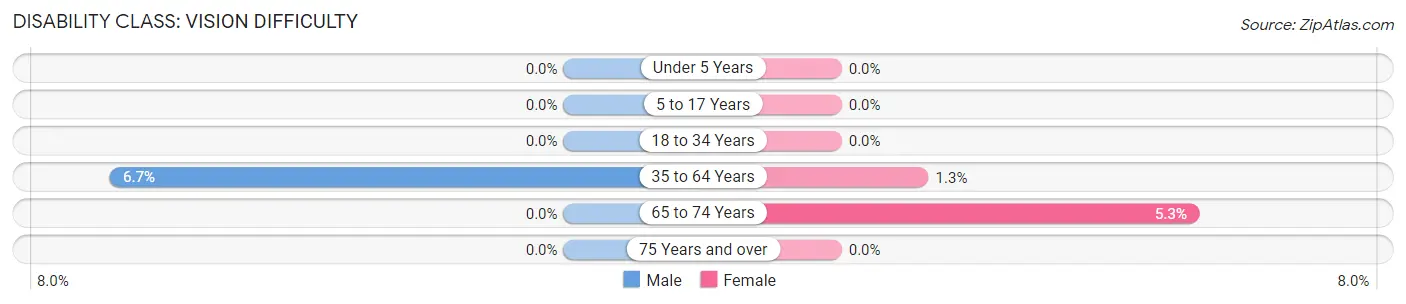
| Age Bracket | Male | Female |
| Under 5 Years | 0 (0.0%) | 0 (0.0%) |
| 5 to 17 Years | 0 (0.0%) | 0 (0.0%) |
| 18 to 34 Years | 0 (0.0%) | 0 (0.0%) |
| 35 to 64 Years | 46 (6.7%) | 11 (1.3%) |
| 65 to 74 Years | 0 (0.0%) | 7 (5.3%) |
| 75 Years and over | 0 (0.0%) | 0 (0.0%) |
Disability Class: Cognitive Difficulty
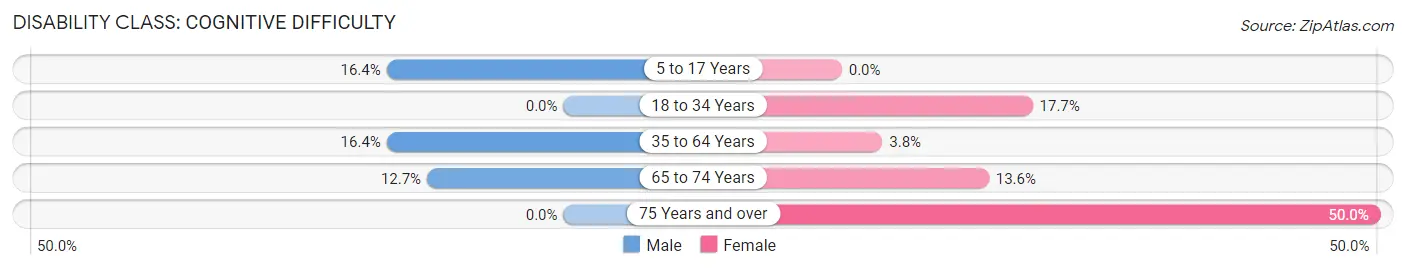
| Age Bracket | Male | Female |
| 5 to 17 Years | 64 (16.4%) | 0 (0.0%) |
| 18 to 34 Years | 0 (0.0%) | 93 (17.7%) |
| 35 to 64 Years | 112 (16.4%) | 32 (3.8%) |
| 65 to 74 Years | 29 (12.7%) | 18 (13.6%) |
| 75 Years and over | 0 (0.0%) | 34 (50.0%) |
Disability Class: Ambulatory Difficulty
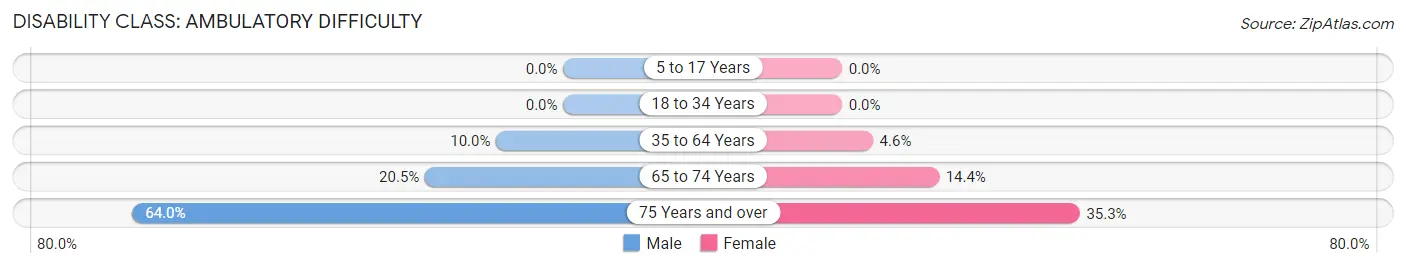
| Age Bracket | Male | Female |
| 5 to 17 Years | 0 (0.0%) | 0 (0.0%) |
| 18 to 34 Years | 0 (0.0%) | 0 (0.0%) |
| 35 to 64 Years | 68 (10.0%) | 39 (4.6%) |
| 65 to 74 Years | 47 (20.5%) | 19 (14.4%) |
| 75 Years and over | 16 (64.0%) | 24 (35.3%) |
Disability Class: Self-Care Difficulty
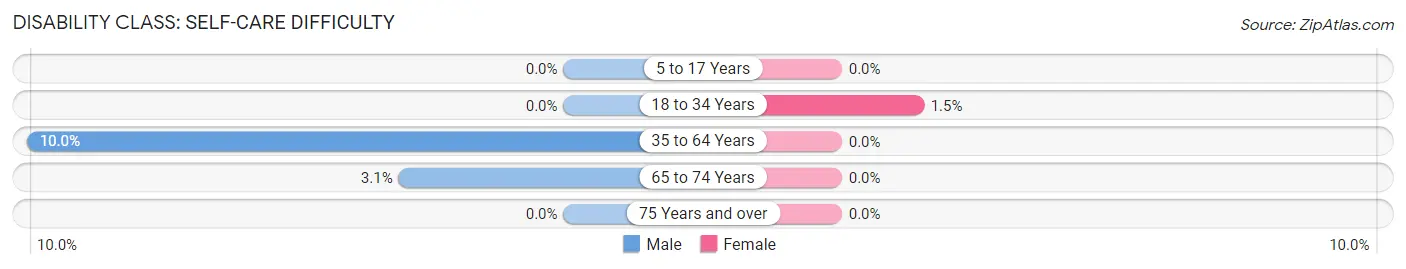
| Age Bracket | Male | Female |
| 5 to 17 Years | 0 (0.0%) | 0 (0.0%) |
| 18 to 34 Years | 0 (0.0%) | 8 (1.5%) |
| 35 to 64 Years | 68 (10.0%) | 0 (0.0%) |
| 65 to 74 Years | 7 (3.1%) | 0 (0.0%) |
| 75 Years and over | 0 (0.0%) | 0 (0.0%) |
Technology Access in Rose Hill
Computing Device Access in Rose Hill
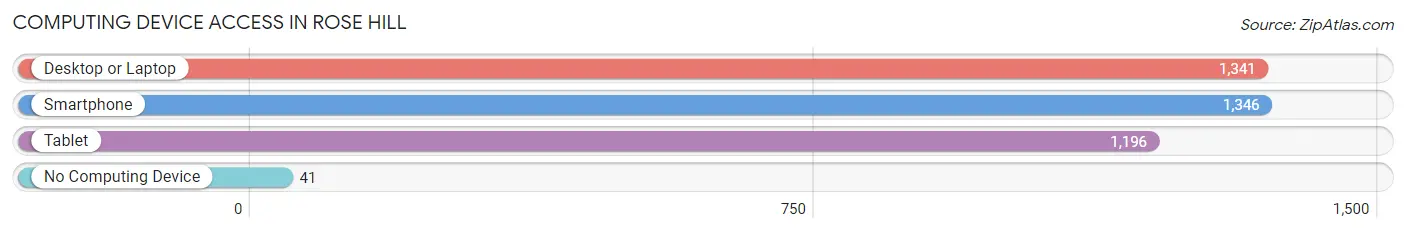
| Device Type | # Households | % Households |
| Desktop or Laptop | 1,341 | 90.7% |
| Smartphone | 1,346 | 91.1% |
| Tablet | 1,196 | 80.9% |
| No Computing Device | 41 | 2.8% |
| Total | 1,478 | 100.0% |
Internet Access in Rose Hill
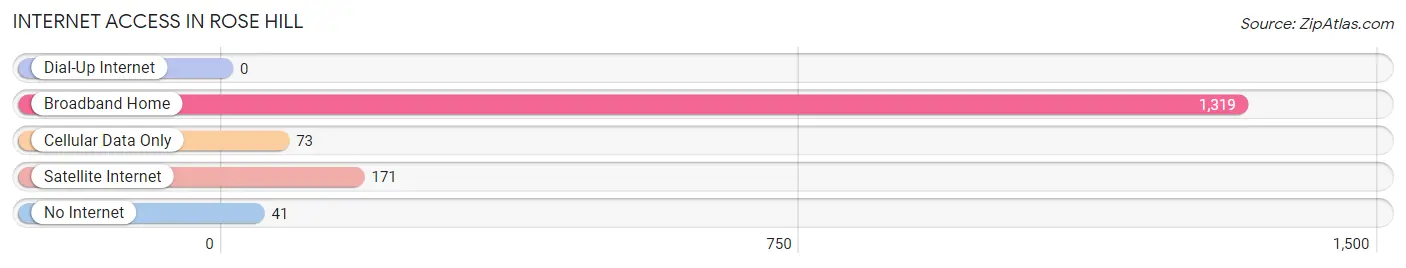
| Internet Type | # Households | % Households |
| Dial-Up Internet | 0 | 0.0% |
| Broadband Home | 1,319 | 89.2% |
| Cellular Data Only | 73 | 4.9% |
| Satellite Internet | 171 | 11.6% |
| No Internet | 41 | 2.8% |
| Total | 1,478 | 100.0% |
Rose Hill Summary
Rose Hill, Kansas is a small city located in Butler County, Kansas. It is situated in the south-central part of the state, approximately 20 miles south of Wichita. The city has a population of approximately 5,000 people and is part of the Wichita metropolitan area.
History
Rose Hill was founded in 1871 by a group of settlers from Ohio. The city was named after the wild roses that grew in the area. The first post office was established in 1872 and the city was incorporated in 1887.
In the early 1900s, Rose Hill was a thriving agricultural community. The city was home to several grain elevators, a flour mill, and a creamery. The city also had a number of businesses, including a bank, a hotel, a newspaper, and a movie theater.
In the 1950s, Rose Hill began to experience a decline in population as people moved away from rural areas to larger cities. The city’s population dropped from a peak of over 1,000 in 1950 to just over 500 in 2000.
Geography
Rose Hill is located in south-central Kansas, approximately 20 miles south of Wichita. The city is situated in the Arkansas River Valley, which is part of the Great Plains region. The city is surrounded by rolling hills and grasslands.
The climate in Rose Hill is characterized by hot, humid summers and cold, dry winters. The average annual temperature is around 55 degrees Fahrenheit. The average annual precipitation is around 30 inches.
Economy
The economy of Rose Hill is largely based on agriculture. The city is home to several grain elevators and a flour mill. The city also has a number of businesses, including a bank, a hotel, a newspaper, and a movie theater.
The city is also home to a number of manufacturing companies, including a plastics manufacturer and a metal fabrication company. The city is also home to a number of retail stores, including a grocery store, a hardware store, and a pharmacy.
Demographics
As of the 2010 census, the population of Rose Hill was 5,000. The racial makeup of the city was 95.3% White, 0.7% African American, 0.3% Native American, 0.3% Asian, 0.1% Pacific Islander, and 2.3% from other races. Hispanic or Latino of any race were 3.3% of the population.
The median household income in Rose Hill was $45,000, and the median family income was $50,000. The per capita income was $20,000. About 10.3% of families and 13.3% of the population were below the poverty line, including 17.3% of those under age 18 and 8.3% of those age 65 or over.
Conclusion
Rose Hill, Kansas is a small city located in Butler County, Kansas. It is situated in the south-central part of the state, approximately 20 miles south of Wichita. The city has a population of approximately 5,000 people and is part of the Wichita metropolitan area. The economy of Rose Hill is largely based on agriculture, with a number of businesses and manufacturing companies located in the city. The racial makeup of the city is predominantly White, with a small percentage of African American, Native American, Asian, and Pacific Islander residents. The median household income in Rose Hill is $45,000, and the median family income is $50,000.
Common Questions
What is Per Capita Income in Rose Hill?
Per Capita income in Rose Hill is $33,103.
What is the Median Family Income in Rose Hill?
Median Family Income in Rose Hill is $94,154.
What is the Median Household income in Rose Hill?
Median Household Income in Rose Hill is $90,962.
What is Income or Wage Gap in Rose Hill?
Income or Wage Gap in Rose Hill is 35.4%.
Women in Rose Hill earn 64.6 cents for every dollar earned by a man.
What is Inequality or Gini Index in Rose Hill?
Inequality or Gini Index in Rose Hill is 0.31.
What is the Total Population of Rose Hill?
Total Population of Rose Hill is 4,357.
What is the Total Male Population of Rose Hill?
Total Male Population of Rose Hill is 1,984.
What is the Total Female Population of Rose Hill?
Total Female Population of Rose Hill is 2,373.
What is the Ratio of Males per 100 Females in Rose Hill?
There are 83.61 Males per 100 Females in Rose Hill.
What is the Ratio of Females per 100 Males in Rose Hill?
There are 119.61 Females per 100 Males in Rose Hill.
What is the Median Population Age in Rose Hill?
Median Population Age in Rose Hill is 32.0 Years.
What is the Average Family Size in Rose Hill
Average Family Size in Rose Hill is 3.2 People.
What is the Average Household Size in Rose Hill
Average Household Size in Rose Hill is 2.9 People.
How Large is the Labor Force in Rose Hill?
There are 2,254 People in the Labor Forcein in Rose Hill.
What is the Percentage of People in the Labor Force in Rose Hill?
68.0% of People are in the Labor Force in Rose Hill.
What is the Unemployment Rate in Rose Hill?
Unemployment Rate in Rose Hill is 4.1%.