Allen, KS Map & Demographics
Allen Map
Allen Overview
$28,921
PER CAPITA INCOME
$71,250
AVG FAMILY INCOME
$54,722
AVG HOUSEHOLD INCOME
0.24
INEQUALITY / GINI INDEX
260
TOTAL POPULATION
119
MALE POPULATION
141
FEMALE POPULATION
84.40
MALES / 100 FEMALES
118.49
FEMALES / 100 MALES
38.0
MEDIAN AGE
2.8
AVG FAMILY SIZE
1.9
AVG HOUSEHOLD SIZE
139
LABOR FORCE [ PEOPLE ]
60.4%
PERCENT IN LABOR FORCE
Allen Zip Codes
Allen Area Codes
Income in Allen
Income Overview in Allen
Per Capita Income in Allen is $28,921, while median incomes of families and households are $71,250 and $54,722 respectively.
| Characteristic | Number | Measure |
| Per Capita Income | 260 | $28,921 |
| Median Family Income | 44 | $71,250 |
| Mean Family Income | 44 | $70,984 |
| Median Household Income | 140 | $54,722 |
| Mean Household Income | 140 | $56,996 |
| Income Deficit | 44 | $0 |
| Wage / Income Gap (%) | 260 | 0.00% |
| Wage / Income Gap ($) | 260 | 100.00¢ per $1 |
| Gini / Inequality Index | 260 | 0.24 |
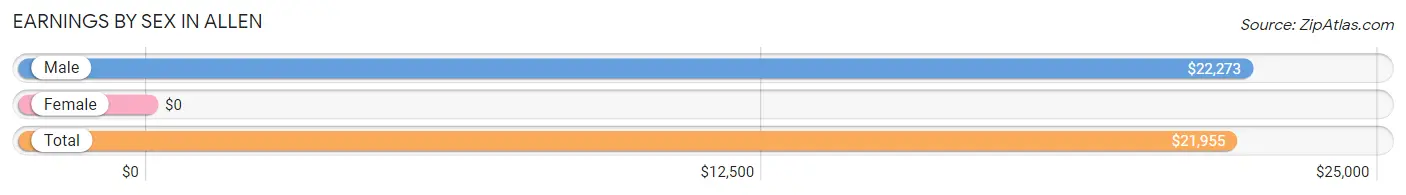
Earnings by Sex in Allen
| Sex | Number | Average Earnings |
| Male | 82 (45.3%) | $22,273 |
| Female | 99 (54.7%) | $0 |
| Total | 181 (100.0%) | $21,955 |
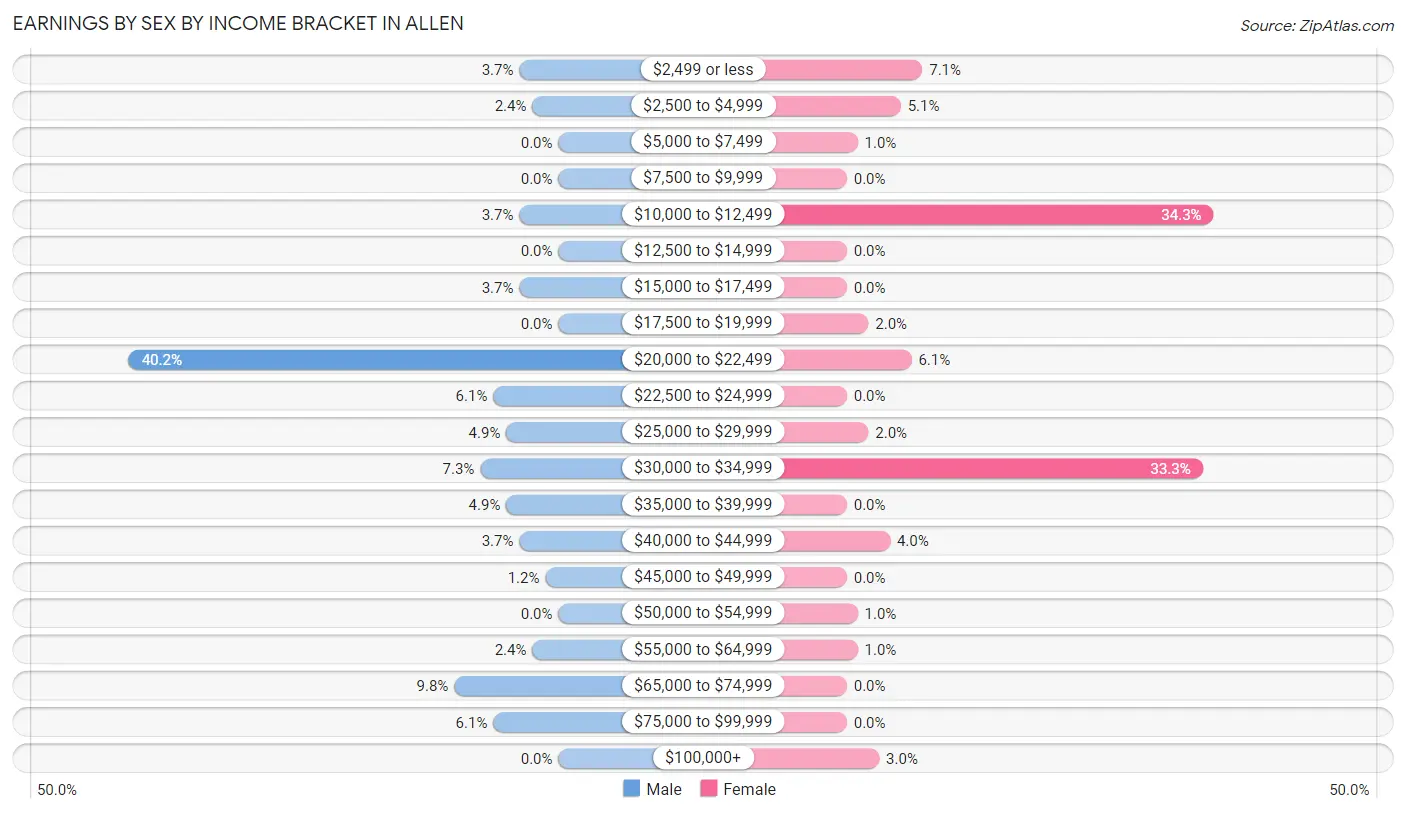
Earnings by Sex by Income Bracket in Allen
The most common earnings brackets in Allen are $20,000 to $22,499 for men (33 | 40.2%) and $10,000 to $12,499 for women (34 | 34.3%).
| Income | Male | Female |
| $2,499 or less | 3 (3.7%) | 7 (7.1%) |
| $2,500 to $4,999 | 2 (2.4%) | 5 (5.1%) |
| $5,000 to $7,499 | 0 (0.0%) | 1 (1.0%) |
| $7,500 to $9,999 | 0 (0.0%) | 0 (0.0%) |
| $10,000 to $12,499 | 3 (3.7%) | 34 (34.3%) |
| $12,500 to $14,999 | 0 (0.0%) | 0 (0.0%) |
| $15,000 to $17,499 | 3 (3.7%) | 0 (0.0%) |
| $17,500 to $19,999 | 0 (0.0%) | 2 (2.0%) |
| $20,000 to $22,499 | 33 (40.2%) | 6 (6.1%) |
| $22,500 to $24,999 | 5 (6.1%) | 0 (0.0%) |
| $25,000 to $29,999 | 4 (4.9%) | 2 (2.0%) |
| $30,000 to $34,999 | 6 (7.3%) | 33 (33.3%) |
| $35,000 to $39,999 | 4 (4.9%) | 0 (0.0%) |
| $40,000 to $44,999 | 3 (3.7%) | 4 (4.0%) |
| $45,000 to $49,999 | 1 (1.2%) | 0 (0.0%) |
| $50,000 to $54,999 | 0 (0.0%) | 1 (1.0%) |
| $55,000 to $64,999 | 2 (2.4%) | 1 (1.0%) |
| $65,000 to $74,999 | 8 (9.8%) | 0 (0.0%) |
| $75,000 to $99,999 | 5 (6.1%) | 0 (0.0%) |
| $100,000+ | 0 (0.0%) | 3 (3.0%) |
| Total | 82 (100.0%) | 99 (100.0%) |
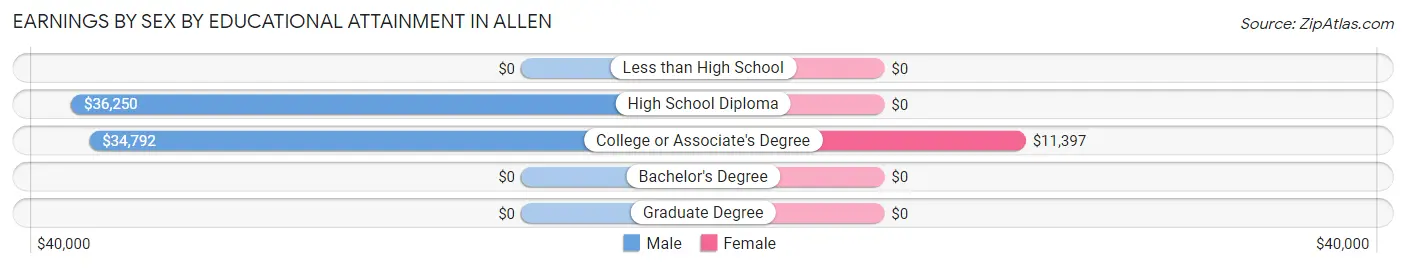
Earnings by Sex by Educational Attainment in Allen
Average earnings in Allen are $35,000 for men and $11,654 for women, a difference of 66.7%. Men with an educational attainment of high school diploma enjoy the highest average annual earnings of $36,250, while those with college or associate's degree education earn the least with $34,792. Women with an educational attainment of college or associate's degree earn the most with the average annual earnings of $11,397, while those with college or associate's degree education have the smallest earnings of $11,397.
| Educational Attainment | Male Income | Female Income |
| Less than High School | - | - |
| High School Diploma | $36,250 | $0 |
| College or Associate's Degree | $34,792 | $11,397 |
| Bachelor's Degree | - | - |
| Graduate Degree | - | - |
| Total | $35,000 | $11,654 |
Family Income in Allen
Family Income Brackets in Allen
According to the Allen family income data, there are 13 families falling into the $100,000 to $149,999 income range, which is the most common income bracket and makes up 29.5% of all families.
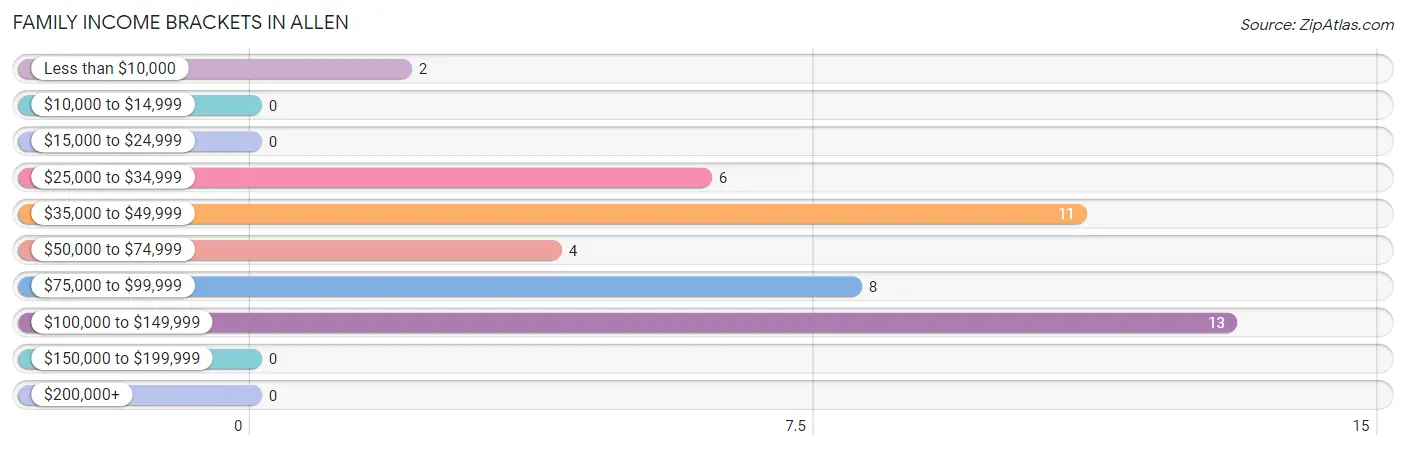
| Income Bracket | # Families | % Families |
| Less than $10,000 | 2 | 4.5% |
| $10,000 to $14,999 | 0 | 0.0% |
| $15,000 to $24,999 | 0 | 0.0% |
| $25,000 to $34,999 | 6 | 13.6% |
| $35,000 to $49,999 | 11 | 25.0% |
| $50,000 to $74,999 | 4 | 9.1% |
| $75,000 to $99,999 | 8 | 18.2% |
| $100,000 to $149,999 | 13 | 29.5% |
| $150,000 to $199,999 | 0 | 0.0% |
| $200,000+ | 0 | 0.0% |
Family Income by Famaliy Size in Allen
3-person families (5 | 11.4%) account for the highest median family income in Allen with $115,625 per family, while 3-person families (5 | 11.4%) have the highest median income of $38,542 per family member.
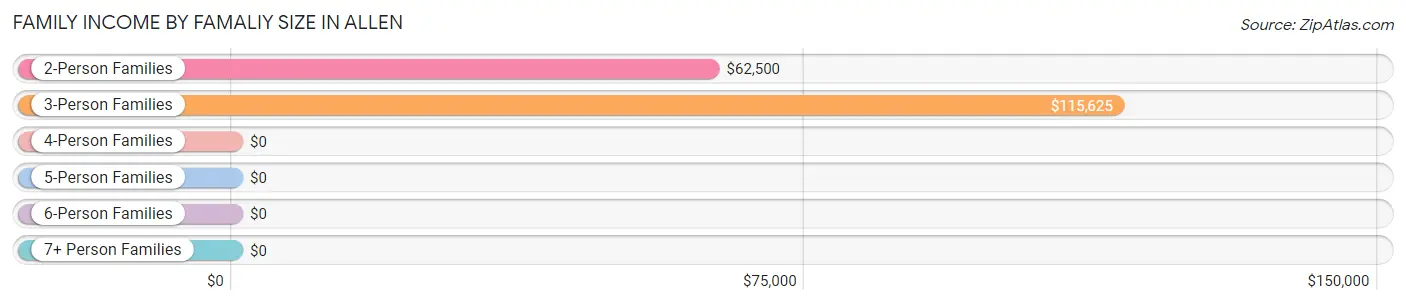
| Income Bracket | # Families | Median Income |
| 2-Person Families | 30 (68.2%) | $62,500 |
| 3-Person Families | 5 (11.4%) | $115,625 |
| 4-Person Families | 8 (18.2%) | $0 |
| 5-Person Families | 0 (0.0%) | $0 |
| 6-Person Families | 1 (2.3%) | $0 |
| 7+ Person Families | 0 (0.0%) | $0 |
| Total | 44 (100.0%) | $71,250 |
Family Income by Number of Earners in Allen
The median family income in Allen is $71,250, with families comprising 3+ earners (5) having the highest median family income of $114,375, while families with 1 earner (12) have the lowest median family income of $33,750, accounting for 11.4% and 27.3% of families, respectively.
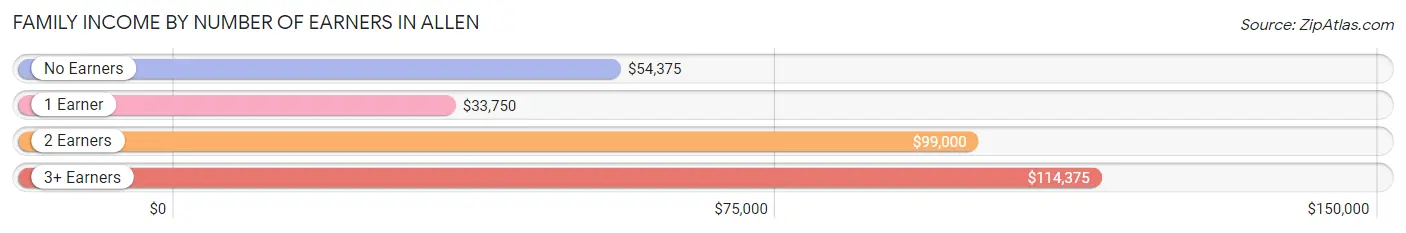
| Number of Earners | # Families | Median Income |
| No Earners | 5 (11.4%) | $54,375 |
| 1 Earner | 12 (27.3%) | $33,750 |
| 2 Earners | 22 (50.0%) | $99,000 |
| 3+ Earners | 5 (11.4%) | $114,375 |
| Total | 44 (100.0%) | $71,250 |
Household Income in Allen
Household Income Brackets in Allen
With 78 households falling in the category, the $50,000 to $74,999 income range is the most frequent in Allen, accounting for 55.7% of all households.
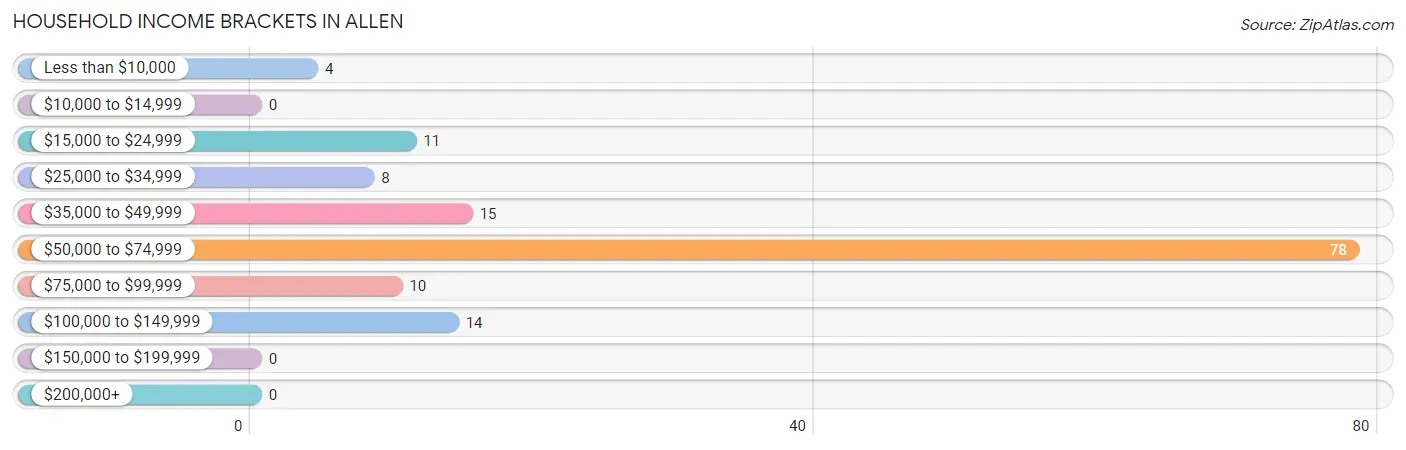
| Income Bracket | # Households | % Households |
| Less than $10,000 | 4 | 2.9% |
| $10,000 to $14,999 | 0 | 0.0% |
| $15,000 to $24,999 | 11 | 7.9% |
| $25,000 to $34,999 | 8 | 5.7% |
| $35,000 to $49,999 | 15 | 10.7% |
| $50,000 to $74,999 | 78 | 55.7% |
| $75,000 to $99,999 | 10 | 7.1% |
| $100,000 to $149,999 | 14 | 10.0% |
| $150,000 to $199,999 | 0 | 0.0% |
| $200,000+ | 0 | 0.0% |
Household Income by Householder Age in Allen
The median household income in Allen is $54,722, with the highest median household income of $73,750 found in the 45 to 64 years age bracket for the primary householder. A total of 18 households (12.9%) fall into this category. Meanwhile, the 25 to 44 years age bracket for the primary householder has the lowest median household income of $0, with 23 households (16.4%) in this group.
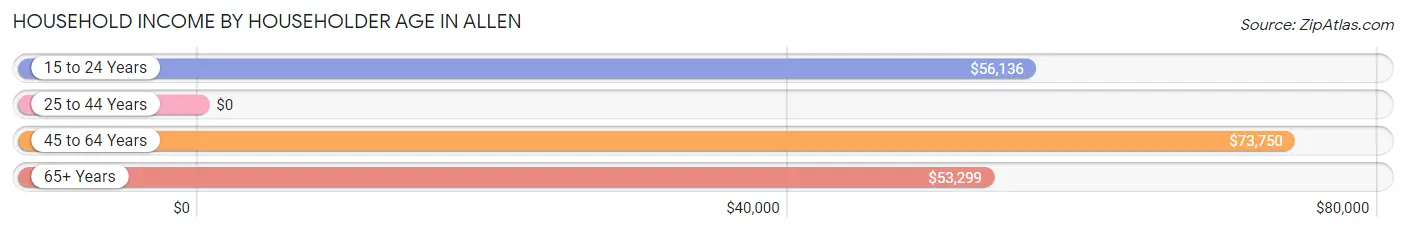
| Income Bracket | # Households | Median Income |
| 15 to 24 Years | 40 (28.6%) | $56,136 |
| 25 to 44 Years | 23 (16.4%) | $0 |
| 45 to 64 Years | 18 (12.9%) | $73,750 |
| 65+ Years | 59 (42.1%) | $53,299 |
| Total | 140 (100.0%) | $54,722 |
Poverty in Allen
Income Below Poverty by Sex and Age in Allen
With 6.7% poverty level for males and 10.6% for females among the residents of Allen, 65 to 74 year old males and under 5 year old females are the most vulnerable to poverty, with 3 males (33.3%) and 2 females (100.0%) in their respective age groups living below the poverty level.
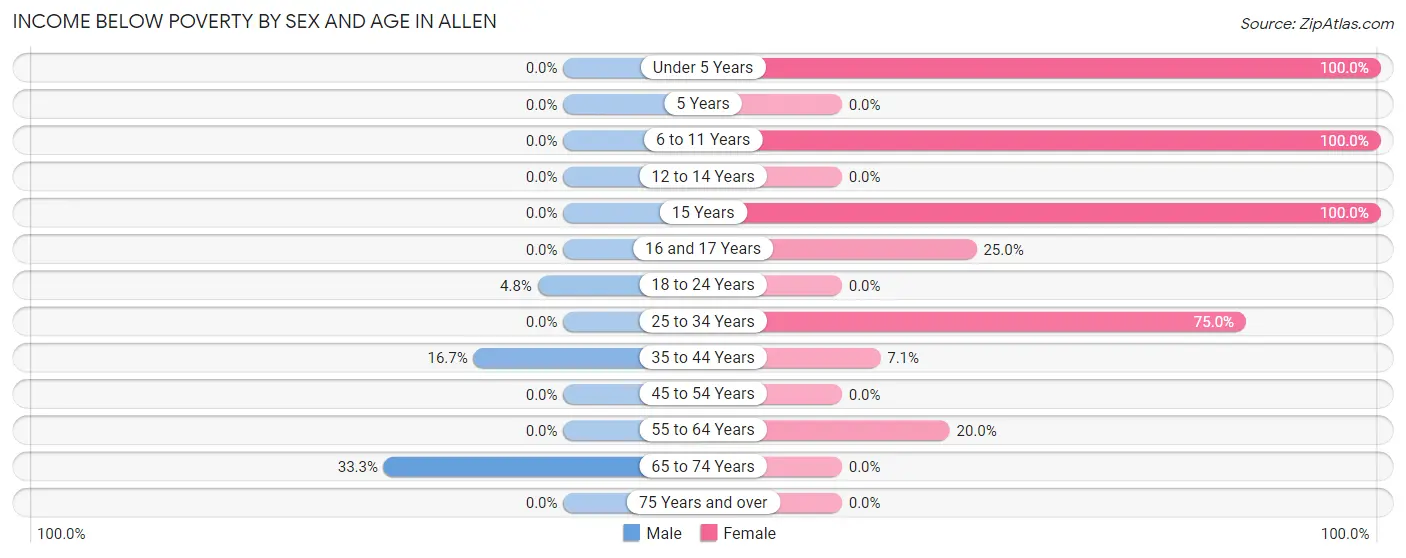
| Age Bracket | Male | Female |
| Under 5 Years | 0 (0.0%) | 2 (100.0%) |
| 5 Years | 0 (0.0%) | 0 (0.0%) |
| 6 to 11 Years | 0 (0.0%) | 2 (100.0%) |
| 12 to 14 Years | 0 (0.0%) | 0 (0.0%) |
| 15 Years | 0 (0.0%) | 3 (100.0%) |
| 16 and 17 Years | 0 (0.0%) | 3 (25.0%) |
| 18 to 24 Years | 2 (4.8%) | 0 (0.0%) |
| 25 to 34 Years | 0 (0.0%) | 3 (75.0%) |
| 35 to 44 Years | 3 (16.7%) | 1 (7.1%) |
| 45 to 54 Years | 0 (0.0%) | 0 (0.0%) |
| 55 to 64 Years | 0 (0.0%) | 1 (20.0%) |
| 65 to 74 Years | 3 (33.3%) | 0 (0.0%) |
| 75 Years and over | 0 (0.0%) | 0 (0.0%) |
| Total | 8 (6.7%) | 15 (10.6%) |
Income Above Poverty by Sex and Age in Allen
According to the poverty statistics in Allen, males aged 12 to 14 years and females aged 12 to 14 years are the age groups that are most secure financially, with 100.0% of males and 100.0% of females in these age groups living above the poverty line.
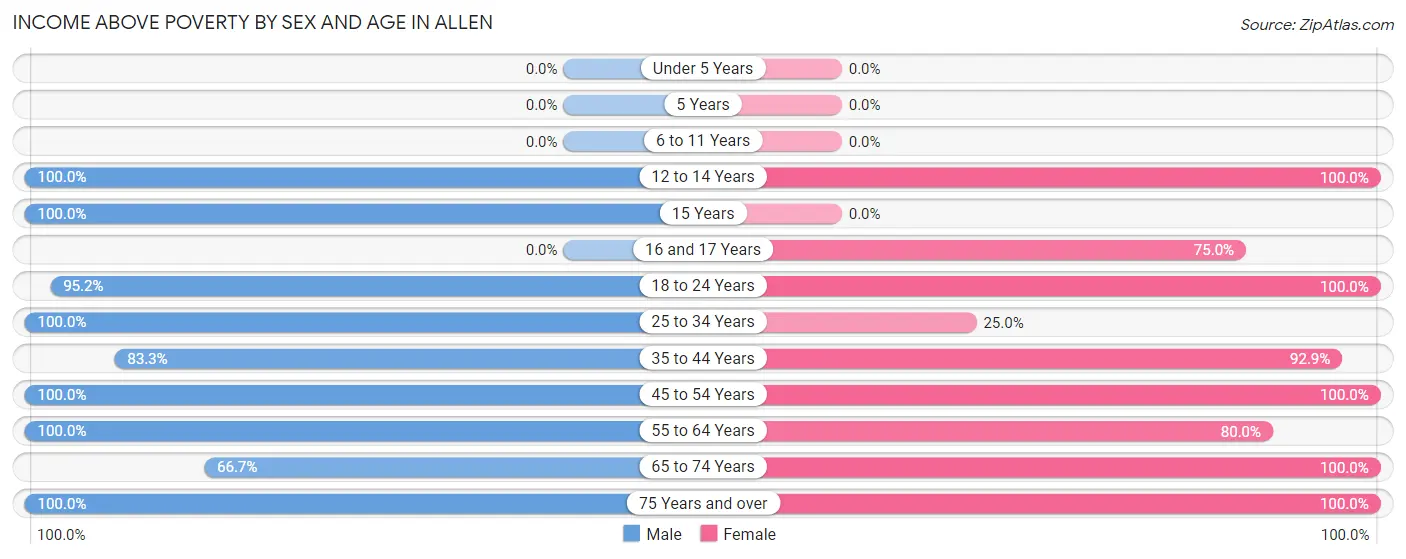
| Age Bracket | Male | Female |
| Under 5 Years | 0 (0.0%) | 0 (0.0%) |
| 5 Years | 0 (0.0%) | 0 (0.0%) |
| 6 to 11 Years | 0 (0.0%) | 0 (0.0%) |
| 12 to 14 Years | 5 (100.0%) | 5 (100.0%) |
| 15 Years | 13 (100.0%) | 0 (0.0%) |
| 16 and 17 Years | 0 (0.0%) | 9 (75.0%) |
| 18 to 24 Years | 40 (95.2%) | 31 (100.0%) |
| 25 to 34 Years | 4 (100.0%) | 1 (25.0%) |
| 35 to 44 Years | 15 (83.3%) | 13 (92.9%) |
| 45 to 54 Years | 10 (100.0%) | 6 (100.0%) |
| 55 to 64 Years | 12 (100.0%) | 4 (80.0%) |
| 65 to 74 Years | 6 (66.7%) | 46 (100.0%) |
| 75 Years and over | 6 (100.0%) | 11 (100.0%) |
| Total | 111 (93.3%) | 126 (89.4%) |
Income Below Poverty Among Married-Couple Families in Allen
The poverty statistics for married-couple families in Allen show that 2.7% or 1 of the total 37 families live below the poverty line. Families with 3 or 4 children have the highest poverty rate of 100.0%, comprising of 1 families. On the other hand, families with no children have the lowest poverty rate of 0.0%, which includes 0 families.
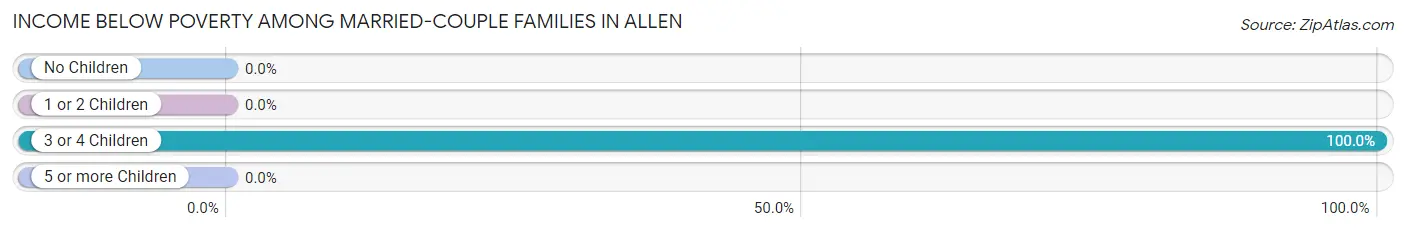
| Children | Above Poverty | Below Poverty |
| No Children | 28 (100.0%) | 0 (0.0%) |
| 1 or 2 Children | 8 (100.0%) | 0 (0.0%) |
| 3 or 4 Children | 0 (0.0%) | 1 (100.0%) |
| 5 or more Children | 0 (0.0%) | 0 (0.0%) |
| Total | 36 (97.3%) | 1 (2.7%) |
Income Below Poverty Among Single-Parent Households in Allen
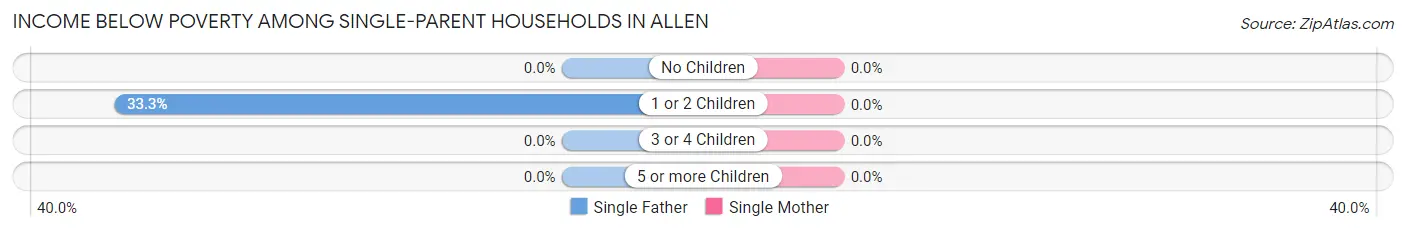
| Children | Single Father | Single Mother |
| No Children | 0 (0.0%) | 0 (0.0%) |
| 1 or 2 Children | 2 (33.3%) | 0 (0.0%) |
| 3 or 4 Children | 0 (0.0%) | 0 (0.0%) |
| 5 or more Children | 0 (0.0%) | 0 (0.0%) |
| Total | 2 (33.3%) | 0 (0.0%) |
Income Below Poverty Among Married-Couple vs Single-Parent Households in Allen
The poverty data for Allen shows that 1 of the married-couple family households (2.7%) and 2 of the single-parent households (28.6%) are living below the poverty level. Within the married-couple family households, those with 3 or 4 children have the highest poverty rate, with 1 households (100.0%) falling below the poverty line. Among the single-parent households, those with 1 or 2 children have the highest poverty rate, with 2 household (33.3%) living below poverty.
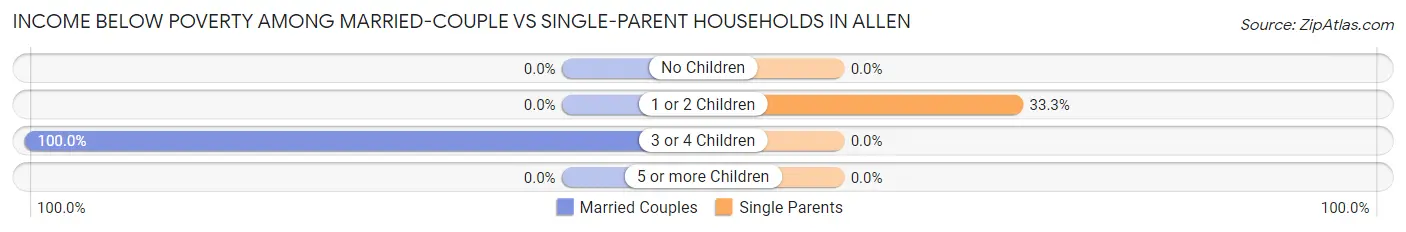
| Children | Married-Couple Families | Single-Parent Households |
| No Children | 0 (0.0%) | 0 (0.0%) |
| 1 or 2 Children | 0 (0.0%) | 2 (33.3%) |
| 3 or 4 Children | 1 (100.0%) | 0 (0.0%) |
| 5 or more Children | 0 (0.0%) | 0 (0.0%) |
| Total | 1 (2.7%) | 2 (28.6%) |
Race in Allen
The most populous races in Allen are White / Caucasian (240 | 92.3%), Two or more Races (17 | 6.5%), and Native / Alaskan (3 | 1.1%).
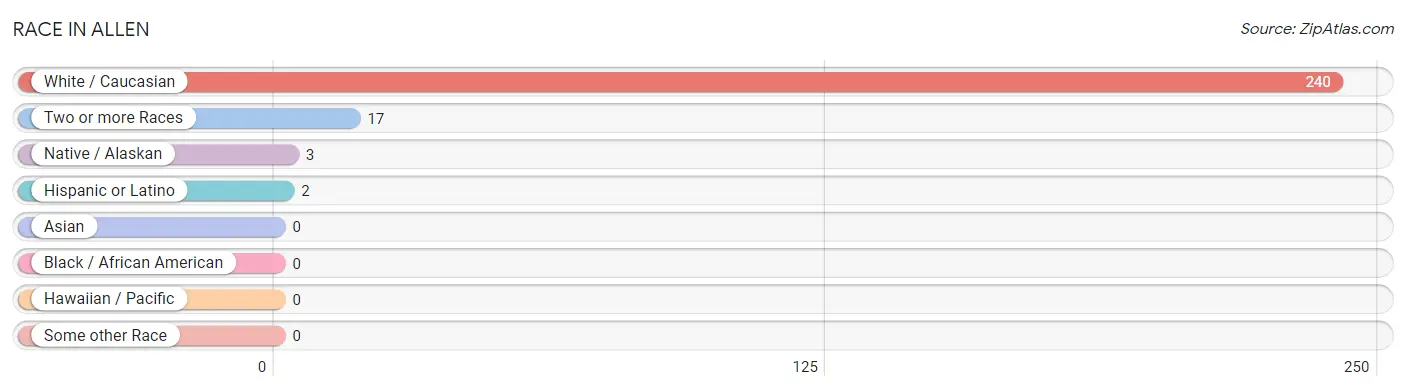
| Race | # Population | % Population |
| Asian | 0 | 0.0% |
| Black / African American | 0 | 0.0% |
| Hawaiian / Pacific | 0 | 0.0% |
| Hispanic or Latino | 2 | 0.8% |
| Native / Alaskan | 3 | 1.1% |
| White / Caucasian | 240 | 92.3% |
| Two or more Races | 17 | 6.5% |
| Some other Race | 0 | 0.0% |
| Total | 260 | 100.0% |
Ancestry in Allen
The most populous ancestries reported in Allen are Irish (41 | 15.8%), Swedish (39 | 15.0%), English (27 | 10.4%), Cherokee (20 | 7.7%), and German (20 | 7.7%), together accounting for 56.5% of all Allen residents.
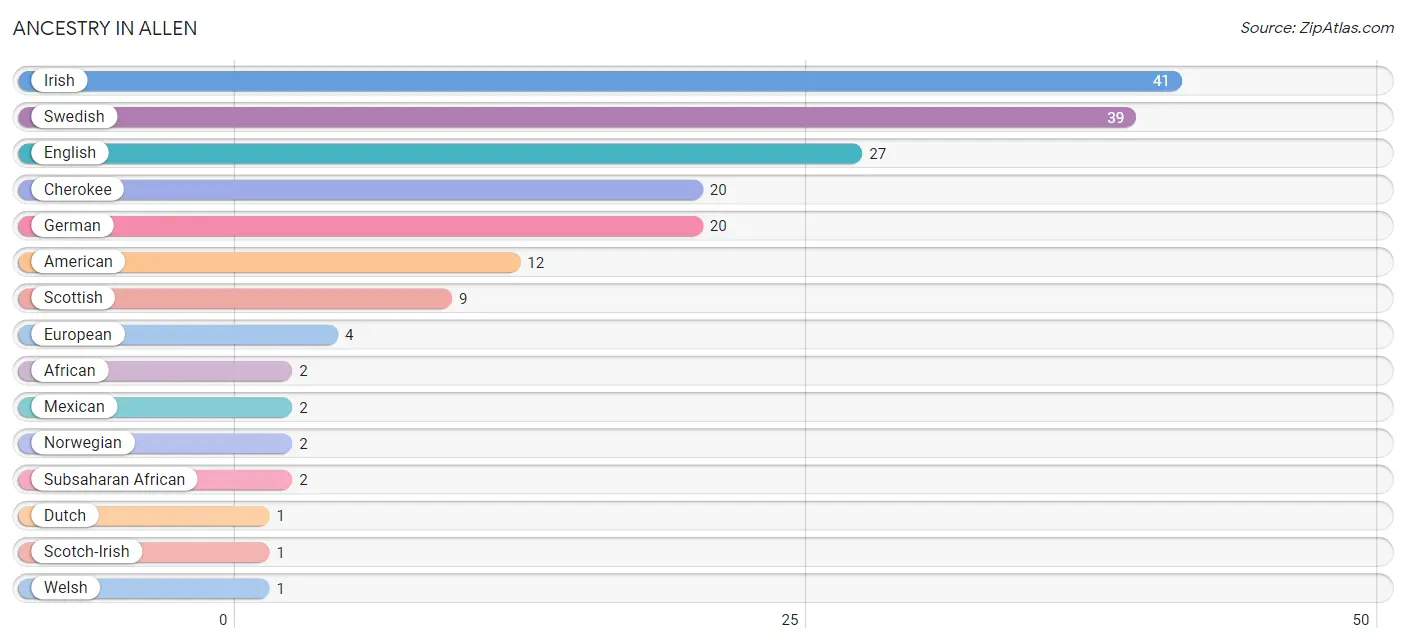
| Ancestry | # Population | % Population |
| African | 2 | 0.8% |
| American | 12 | 4.6% |
| Cherokee | 20 | 7.7% |
| Dutch | 1 | 0.4% |
| English | 27 | 10.4% |
| European | 4 | 1.5% |
| German | 20 | 7.7% |
| Irish | 41 | 15.8% |
| Mexican | 2 | 0.8% |
| Norwegian | 2 | 0.8% |
| Scotch-Irish | 1 | 0.4% |
| Scottish | 9 | 3.5% |
| Subsaharan African | 2 | 0.8% |
| Swedish | 39 | 15.0% |
| Welsh | 1 | 0.4% | View All 15 Rows |
Immigrants in Allen
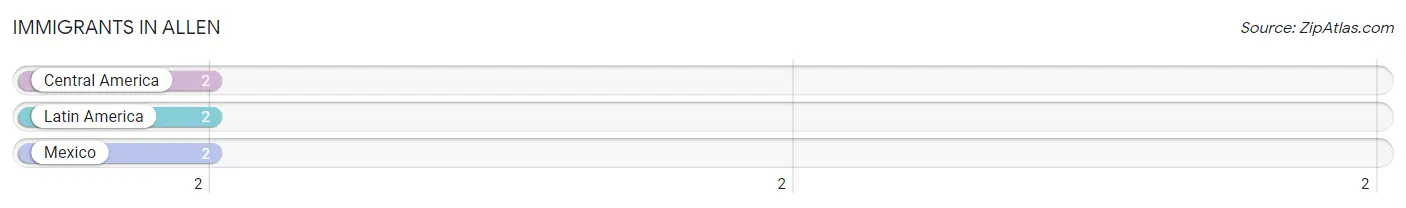
The most numerous immigrant groups reported in Allen came from Central America (2 | 0.8%), Latin America (2 | 0.8%), and Mexico (2 | 0.8%), together accounting for 2.3% of all Allen residents.
| Immigration Origin | # Population | % Population |
| Central America | 2 | 0.8% |
| Latin America | 2 | 0.8% |
| Mexico | 2 | 0.8% | View All 3 Rows |
Sex and Age in Allen
Sex and Age in Allen
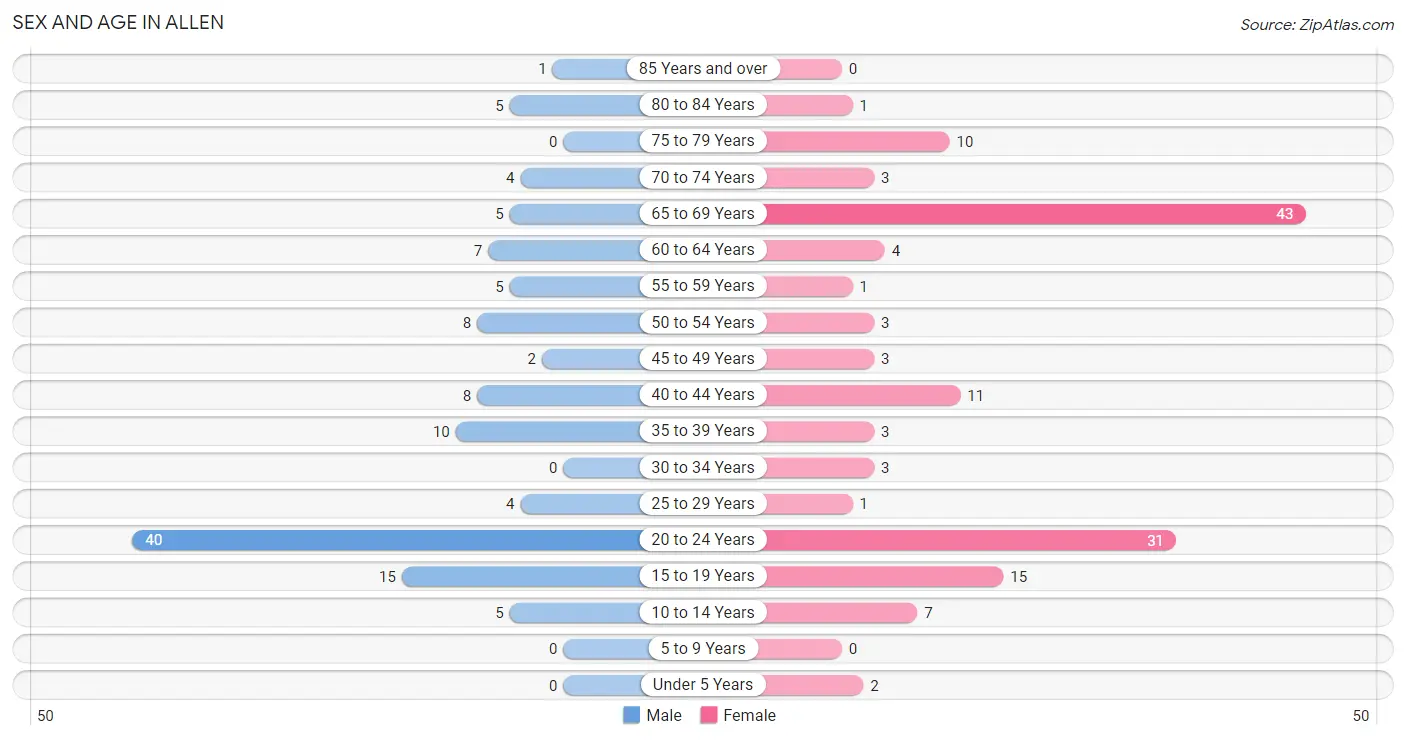
The most populous age groups in Allen are 20 to 24 Years (40 | 33.6%) for men and 65 to 69 Years (43 | 30.5%) for women.
| Age Bracket | Male | Female |
| Under 5 Years | 0 (0.0%) | 2 (1.4%) |
| 5 to 9 Years | 0 (0.0%) | 0 (0.0%) |
| 10 to 14 Years | 5 (4.2%) | 7 (5.0%) |
| 15 to 19 Years | 15 (12.6%) | 15 (10.6%) |
| 20 to 24 Years | 40 (33.6%) | 31 (22.0%) |
| 25 to 29 Years | 4 (3.4%) | 1 (0.7%) |
| 30 to 34 Years | 0 (0.0%) | 3 (2.1%) |
| 35 to 39 Years | 10 (8.4%) | 3 (2.1%) |
| 40 to 44 Years | 8 (6.7%) | 11 (7.8%) |
| 45 to 49 Years | 2 (1.7%) | 3 (2.1%) |
| 50 to 54 Years | 8 (6.7%) | 3 (2.1%) |
| 55 to 59 Years | 5 (4.2%) | 1 (0.7%) |
| 60 to 64 Years | 7 (5.9%) | 4 (2.8%) |
| 65 to 69 Years | 5 (4.2%) | 43 (30.5%) |
| 70 to 74 Years | 4 (3.4%) | 3 (2.1%) |
| 75 to 79 Years | 0 (0.0%) | 10 (7.1%) |
| 80 to 84 Years | 5 (4.2%) | 1 (0.7%) |
| 85 Years and over | 1 (0.8%) | 0 (0.0%) |
| Total | 119 (100.0%) | 141 (100.0%) |
Families and Households in Allen
Median Family Size in Allen
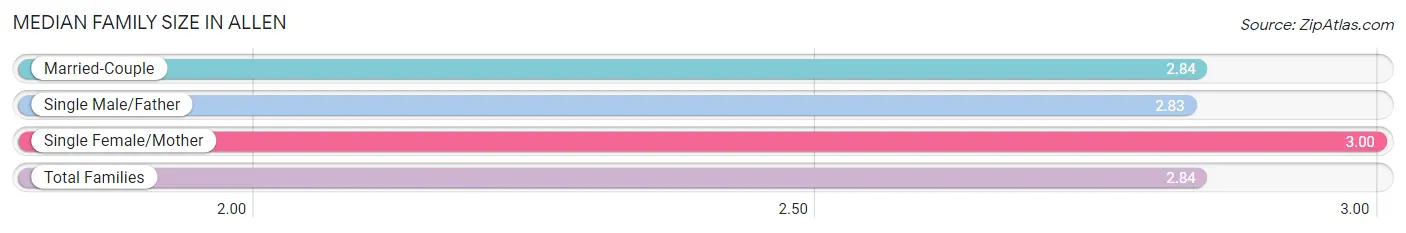
The median family size in Allen is 2.84 persons per family, with single female/mother families (1 | 2.3%) accounting for the largest median family size of 3 persons per family. On the other hand, single male/father families (6 | 13.6%) represent the smallest median family size with 2.83 persons per family.
| Family Type | # Families | Family Size |
| Married-Couple | 37 (84.1%) | 2.84 |
| Single Male/Father | 6 (13.6%) | 2.83 |
| Single Female/Mother | 1 (2.3%) | 3.00 |
| Total Families | 44 (100.0%) | 2.84 |
Median Household Size in Allen
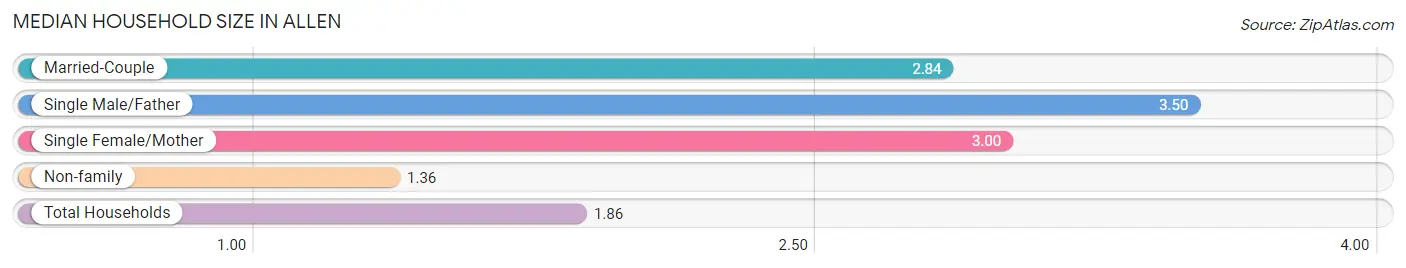
The median household size in Allen is 1.86 persons per household, with single male/father households (6 | 4.3%) accounting for the largest median household size of 3.5 persons per household. non-family households (96 | 68.6%) represent the smallest median household size with 1.36 persons per household.
| Household Type | # Households | Household Size |
| Married-Couple | 37 (26.4%) | 2.84 |
| Single Male/Father | 6 (4.3%) | 3.50 |
| Single Female/Mother | 1 (0.7%) | 3.00 |
| Non-family | 96 (68.6%) | 1.36 |
| Total Households | 140 (100.0%) | 1.86 |
Household Size by Marriage Status in Allen
Out of a total of 140 households in Allen, 44 (31.4%) are family households, while 96 (68.6%) are nonfamily households. The most numerous type of family households are 2-person households, comprising 24, and the most common type of nonfamily households are 1-person households, comprising 57.
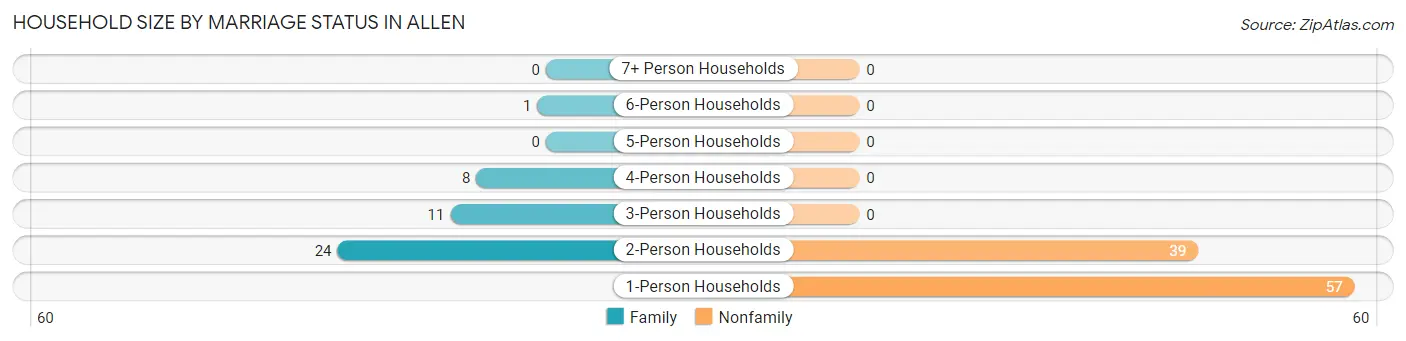
| Household Size | Family Households | Nonfamily Households |
| 1-Person Households | - | 57 (40.7%) |
| 2-Person Households | 24 (17.1%) | 39 (27.9%) |
| 3-Person Households | 11 (7.9%) | 0 (0.0%) |
| 4-Person Households | 8 (5.7%) | 0 (0.0%) |
| 5-Person Households | 0 (0.0%) | 0 (0.0%) |
| 6-Person Households | 1 (0.7%) | 0 (0.0%) |
| 7+ Person Households | 0 (0.0%) | 0 (0.0%) |
| Total | 44 (31.4%) | 96 (68.6%) |
Female Fertility in Allen
Fertility by Age in Allen
| Age Bracket | Women with Births | Births / 1,000 Women |
| 15 to 19 years | 0 (0.0%) | 0.0 |
| 20 to 34 years | 0 (0.0%) | 0.0 |
| 35 to 50 years | 0 (0.0%) | 0.0 |
| Total | 0 (0.0%) | 0.0 |
Fertility by Age by Marriage Status in Allen
| Age Bracket | Married | Unmarried |
| 15 to 19 years | 0 (0.0%) | 0 (0.0%) |
| 20 to 34 years | 0 (0.0%) | 0 (0.0%) |
| 35 to 50 years | 0 (0.0%) | 0 (0.0%) |
| Total | 0 (0.0%) | 0 (0.0%) |
Fertility by Education in Allen
| Educational Attainment | Women with Births | Births / 1,000 Women |
| Less than High School | 0 (0.0%) | 0.0 |
| High School Diploma | 0 (0.0%) | 0.0 |
| College or Associate's Degree | 0 (0.0%) | 0.0 |
| Bachelor's Degree | 0 (0.0%) | 0.0 |
| Graduate Degree | 0 (0.0%) | 0.0 |
| Total | 0 (0.0%) | 0.0 |
Fertility by Education by Marriage Status in Allen
| Educational Attainment | Married | Unmarried |
| Less than High School | 0 (0.0%) | 0 (0.0%) |
| High School Diploma | 0 (0.0%) | 0 (0.0%) |
| College or Associate's Degree | 0 (0.0%) | 0 (0.0%) |
| Bachelor's Degree | 0 (0.0%) | 0 (0.0%) |
| Graduate Degree | 0 (0.0%) | 0 (0.0%) |
| Total | 0 (0.0%) | 0 (0.0%) |
Employment Characteristics in Allen
Employment by Class of Employer in Allen
Among the 139 employed individuals in Allen, private company employees (56 | 40.3%), state government employees (35 | 25.2%), and not-for-profit organizations (34 | 24.5%) make up the most common classes of employment.
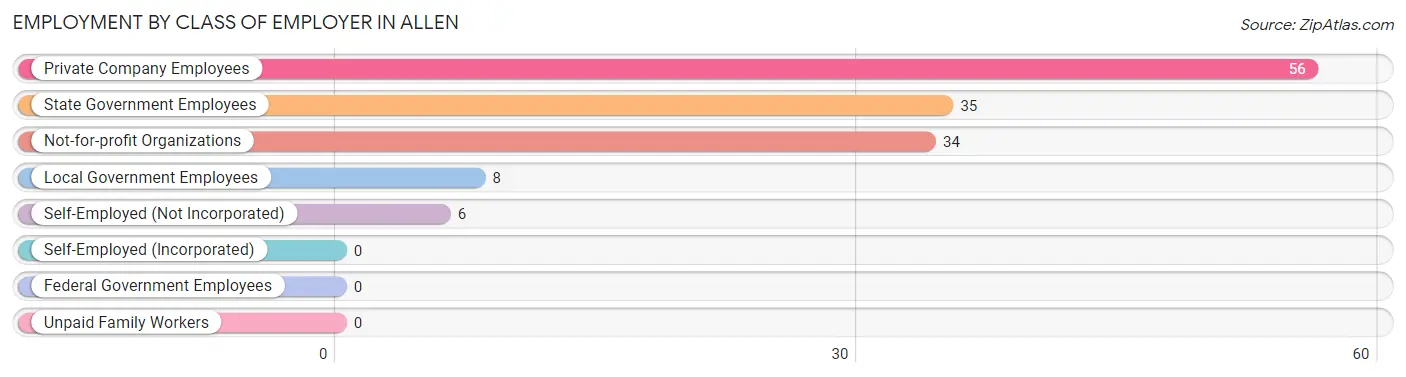
| Employer Class | # Employees | % Employees |
| Private Company Employees | 56 | 40.3% |
| Self-Employed (Incorporated) | 0 | 0.0% |
| Self-Employed (Not Incorporated) | 6 | 4.3% |
| Not-for-profit Organizations | 34 | 24.5% |
| Local Government Employees | 8 | 5.8% |
| State Government Employees | 35 | 25.2% |
| Federal Government Employees | 0 | 0.0% |
| Unpaid Family Workers | 0 | 0.0% |
| Total | 139 | 100.0% |
Employment Status by Age in Allen
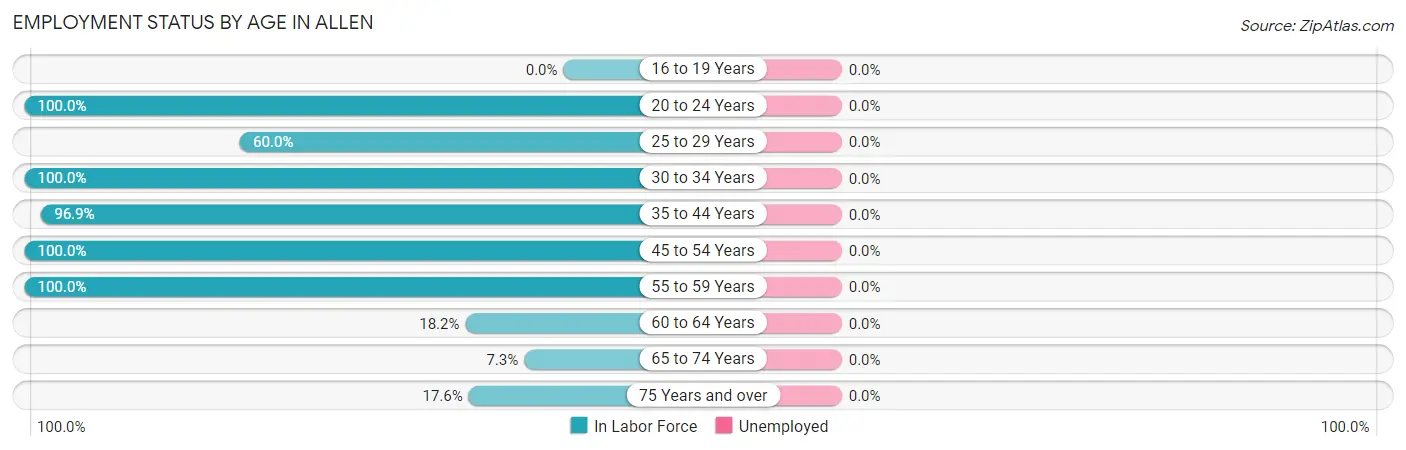
| Age Bracket | In Labor Force | Unemployed |
| 16 to 19 Years | 0 (0.0%) | 0 (0.0%) |
| 20 to 24 Years | 71 (100.0%) | 0 (0.0%) |
| 25 to 29 Years | 3 (60.0%) | 0 (0.0%) |
| 30 to 34 Years | 3 (100.0%) | 0 (0.0%) |
| 35 to 44 Years | 31 (96.9%) | 0 (0.0%) |
| 45 to 54 Years | 16 (100.0%) | 0 (0.0%) |
| 55 to 59 Years | 6 (100.0%) | 0 (0.0%) |
| 60 to 64 Years | 2 (18.2%) | 0 (0.0%) |
| 65 to 74 Years | 4 (7.3%) | 0 (0.0%) |
| 75 Years and over | 3 (17.6%) | 0 (0.0%) |
| Total | 139 (60.4%) | 0 (0.0%) |
Employment Status by Educational Attainment in Allen
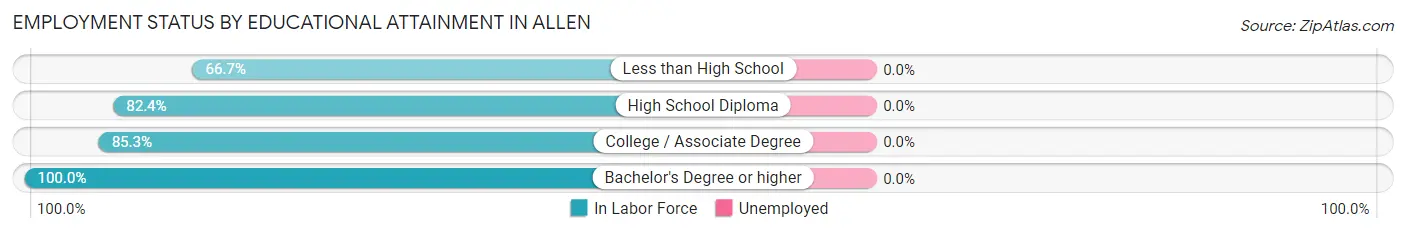
| Educational Attainment | In Labor Force | Unemployed |
| Less than High School | 2 (66.7%) | 0 (0.0%) |
| High School Diploma | 28 (82.4%) | 0 (0.0%) |
| College / Associate Degree | 29 (85.3%) | 0 (0.0%) |
| Bachelor's Degree or higher | 2 (100.0%) | 0 (0.0%) |
| Total | 61 (83.6%) | 0 (0.0%) |
Employment Occupations by Sex in Allen
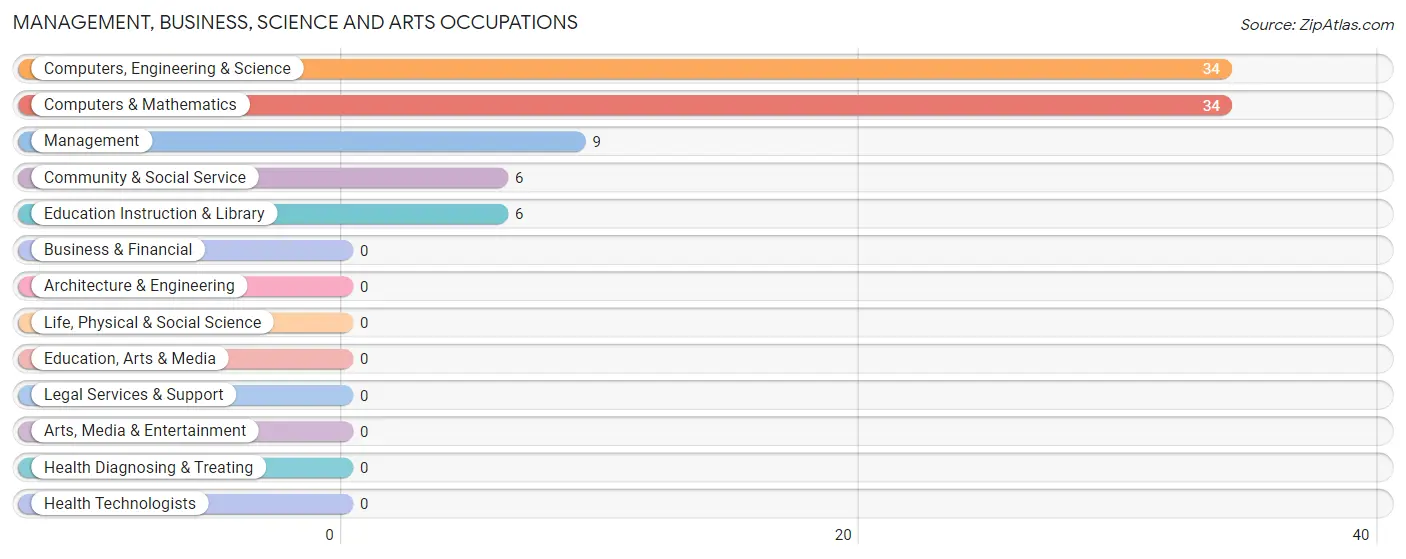
Management, Business, Science and Arts Occupations
The most common Management, Business, Science and Arts occupations in Allen are Computers, Engineering & Science (34 | 24.5%), Computers & Mathematics (34 | 24.5%), Management (9 | 6.5%), Community & Social Service (6 | 4.3%), and Education Instruction & Library (6 | 4.3%).
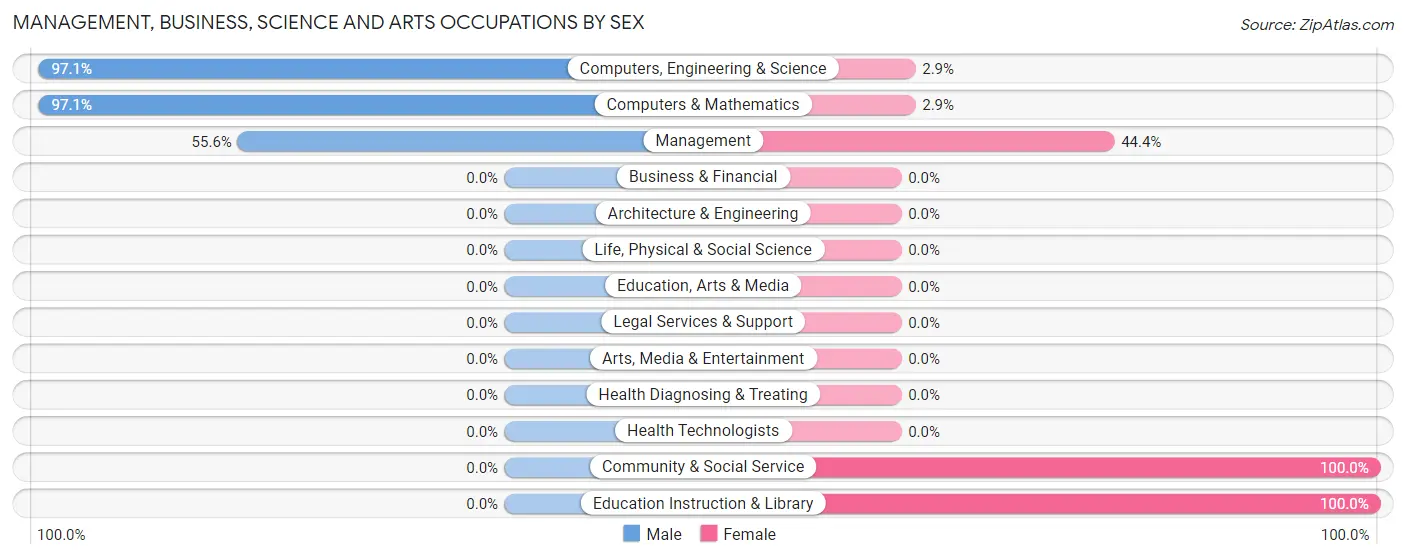
Management, Business, Science and Arts Occupations by Sex
Within the Management, Business, Science and Arts occupations in Allen, the most male-oriented occupations are Computers, Engineering & Science (97.1%), Computers & Mathematics (97.1%), and Management (55.6%), while the most female-oriented occupations are Community & Social Service (100.0%), Education Instruction & Library (100.0%), and Management (44.4%).
| Occupation | Male | Female |
| Management | 5 (55.6%) | 4 (44.4%) |
| Business & Financial | 0 (0.0%) | 0 (0.0%) |
| Computers, Engineering & Science | 33 (97.1%) | 1 (2.9%) |
| Computers & Mathematics | 33 (97.1%) | 1 (2.9%) |
| Architecture & Engineering | 0 (0.0%) | 0 (0.0%) |
| Life, Physical & Social Science | 0 (0.0%) | 0 (0.0%) |
| Community & Social Service | 0 (0.0%) | 6 (100.0%) |
| Education, Arts & Media | 0 (0.0%) | 0 (0.0%) |
| Legal Services & Support | 0 (0.0%) | 0 (0.0%) |
| Education Instruction & Library | 0 (0.0%) | 6 (100.0%) |
| Arts, Media & Entertainment | 0 (0.0%) | 0 (0.0%) |
| Health Diagnosing & Treating | 0 (0.0%) | 0 (0.0%) |
| Health Technologists | 0 (0.0%) | 0 (0.0%) |
| Total (Category) | 38 (77.5%) | 11 (22.5%) |
| Total (Overall) | 79 (56.8%) | 60 (43.2%) |
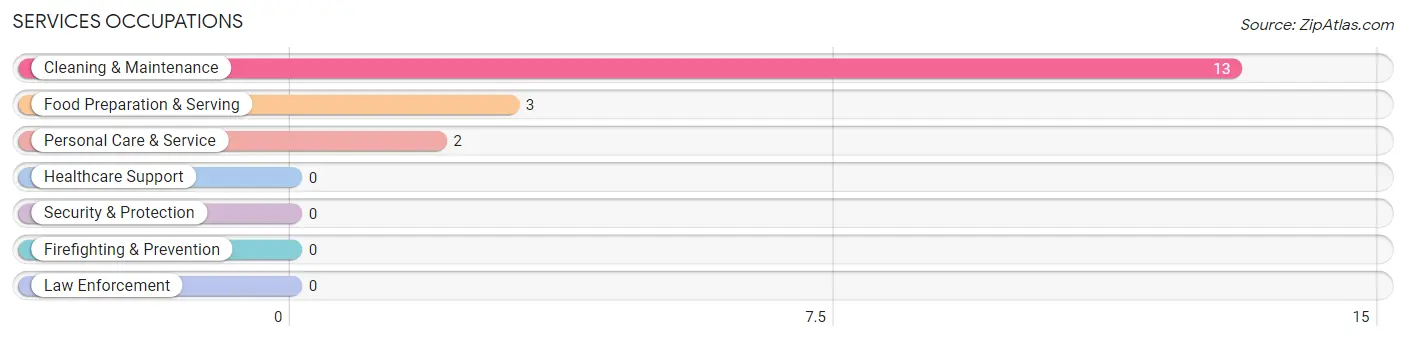
Services Occupations
The most common Services occupations in Allen are Cleaning & Maintenance (13 | 9.3%), Food Preparation & Serving (3 | 2.2%), and Personal Care & Service (2 | 1.4%).
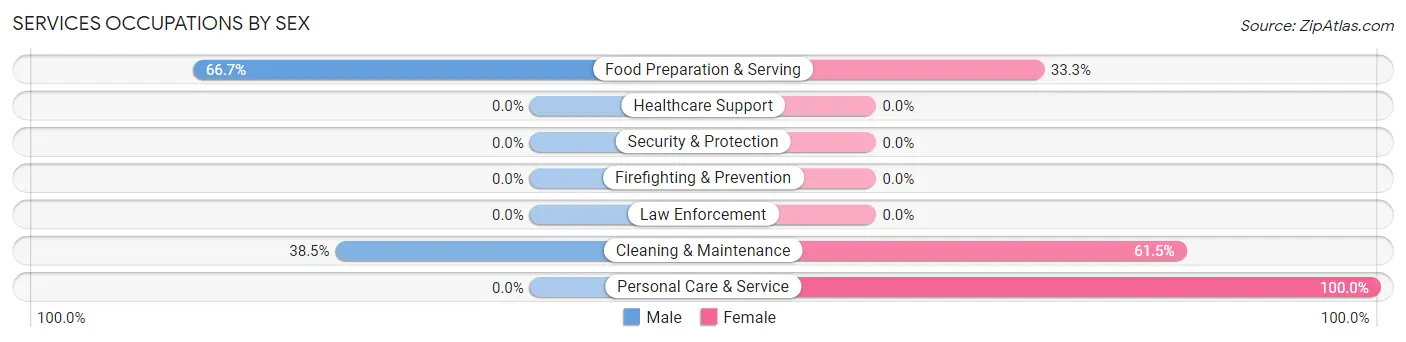
Services Occupations by Sex
Within the Services occupations in Allen, the most male-oriented occupations are Food Preparation & Serving (66.7%), and Cleaning & Maintenance (38.5%), while the most female-oriented occupations are Personal Care & Service (100.0%), Cleaning & Maintenance (61.5%), and Food Preparation & Serving (33.3%).
| Occupation | Male | Female |
| Healthcare Support | 0 (0.0%) | 0 (0.0%) |
| Security & Protection | 0 (0.0%) | 0 (0.0%) |
| Firefighting & Prevention | 0 (0.0%) | 0 (0.0%) |
| Law Enforcement | 0 (0.0%) | 0 (0.0%) |
| Food Preparation & Serving | 2 (66.7%) | 1 (33.3%) |
| Cleaning & Maintenance | 5 (38.5%) | 8 (61.5%) |
| Personal Care & Service | 0 (0.0%) | 2 (100.0%) |
| Total (Category) | 7 (38.9%) | 11 (61.1%) |
| Total (Overall) | 79 (56.8%) | 60 (43.2%) |
Sales and Office Occupations
The most common Sales and Office occupations in Allen are Office & Administration (11 | 7.9%), and Sales & Related (2 | 1.4%).
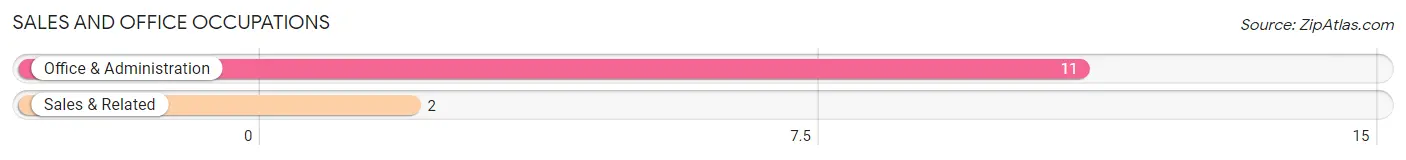
Sales and Office Occupations by Sex
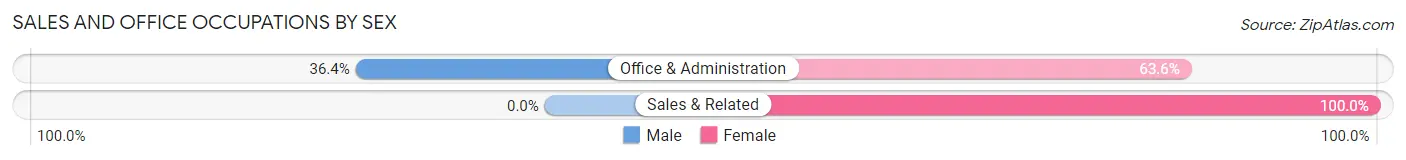
| Occupation | Male | Female |
| Sales & Related | 0 (0.0%) | 2 (100.0%) |
| Office & Administration | 4 (36.4%) | 7 (63.6%) |
| Total (Category) | 4 (30.8%) | 9 (69.2%) |
| Total (Overall) | 79 (56.8%) | 60 (43.2%) |
Natural Resources, Construction and Maintenance Occupations
The most common Natural Resources, Construction and Maintenance occupations in Allen are Installation, Maintenance & Repair (14 | 10.1%), Construction & Extraction (2 | 1.4%), and Farming, Fishing & Forestry (1 | 0.7%).
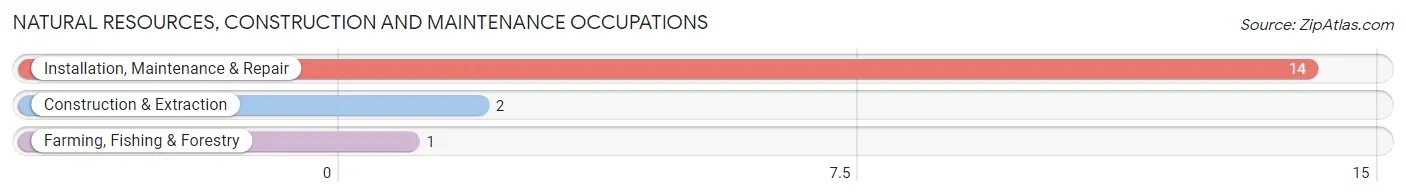
Natural Resources, Construction and Maintenance Occupations by Sex
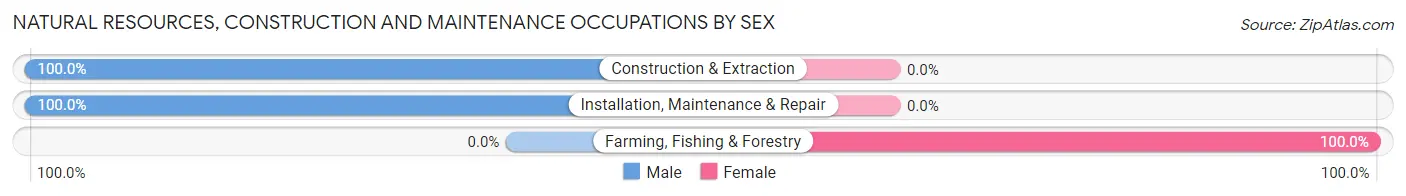
| Occupation | Male | Female |
| Farming, Fishing & Forestry | 0 (0.0%) | 1 (100.0%) |
| Construction & Extraction | 2 (100.0%) | 0 (0.0%) |
| Installation, Maintenance & Repair | 14 (100.0%) | 0 (0.0%) |
| Total (Category) | 16 (94.1%) | 1 (5.9%) |
| Total (Overall) | 79 (56.8%) | 60 (43.2%) |
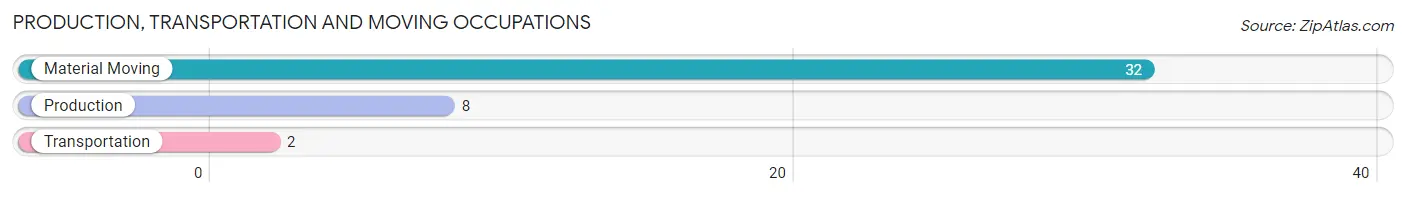
Production, Transportation and Moving Occupations
The most common Production, Transportation and Moving occupations in Allen are Material Moving (32 | 23.0%), Production (8 | 5.8%), and Transportation (2 | 1.4%).
Production, Transportation and Moving Occupations by Sex
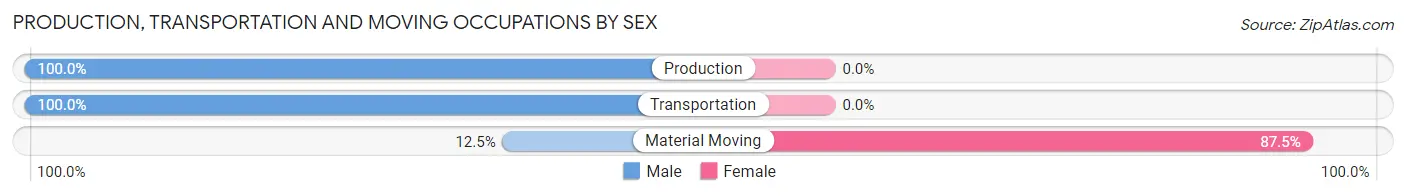
| Occupation | Male | Female |
| Production | 8 (100.0%) | 0 (0.0%) |
| Transportation | 2 (100.0%) | 0 (0.0%) |
| Material Moving | 4 (12.5%) | 28 (87.5%) |
| Total (Category) | 14 (33.3%) | 28 (66.7%) |
| Total (Overall) | 79 (56.8%) | 60 (43.2%) |
Employment Industries by Sex in Allen
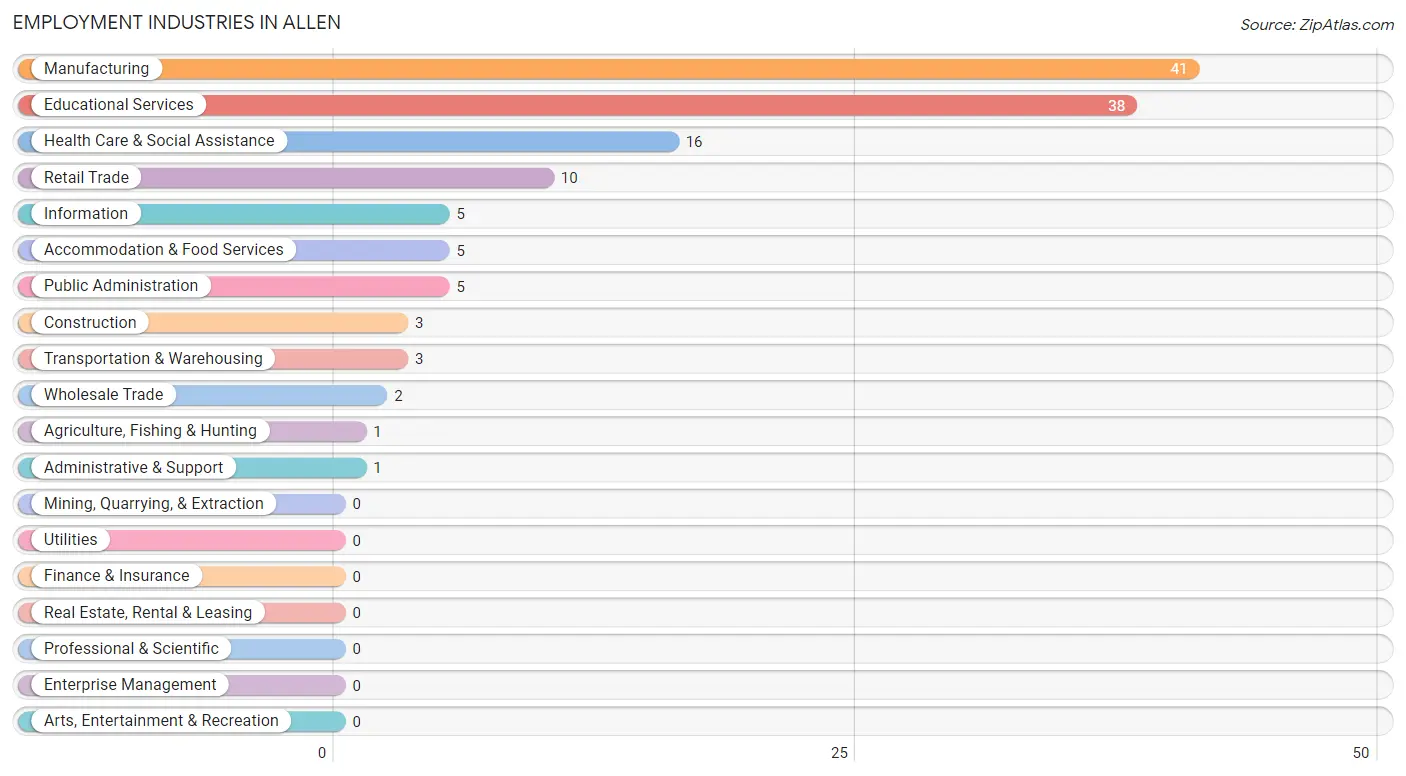
Employment Industries in Allen
The major employment industries in Allen include Manufacturing (41 | 29.5%), Educational Services (38 | 27.3%), Health Care & Social Assistance (16 | 11.5%), Retail Trade (10 | 7.2%), and Information (5 | 3.6%).
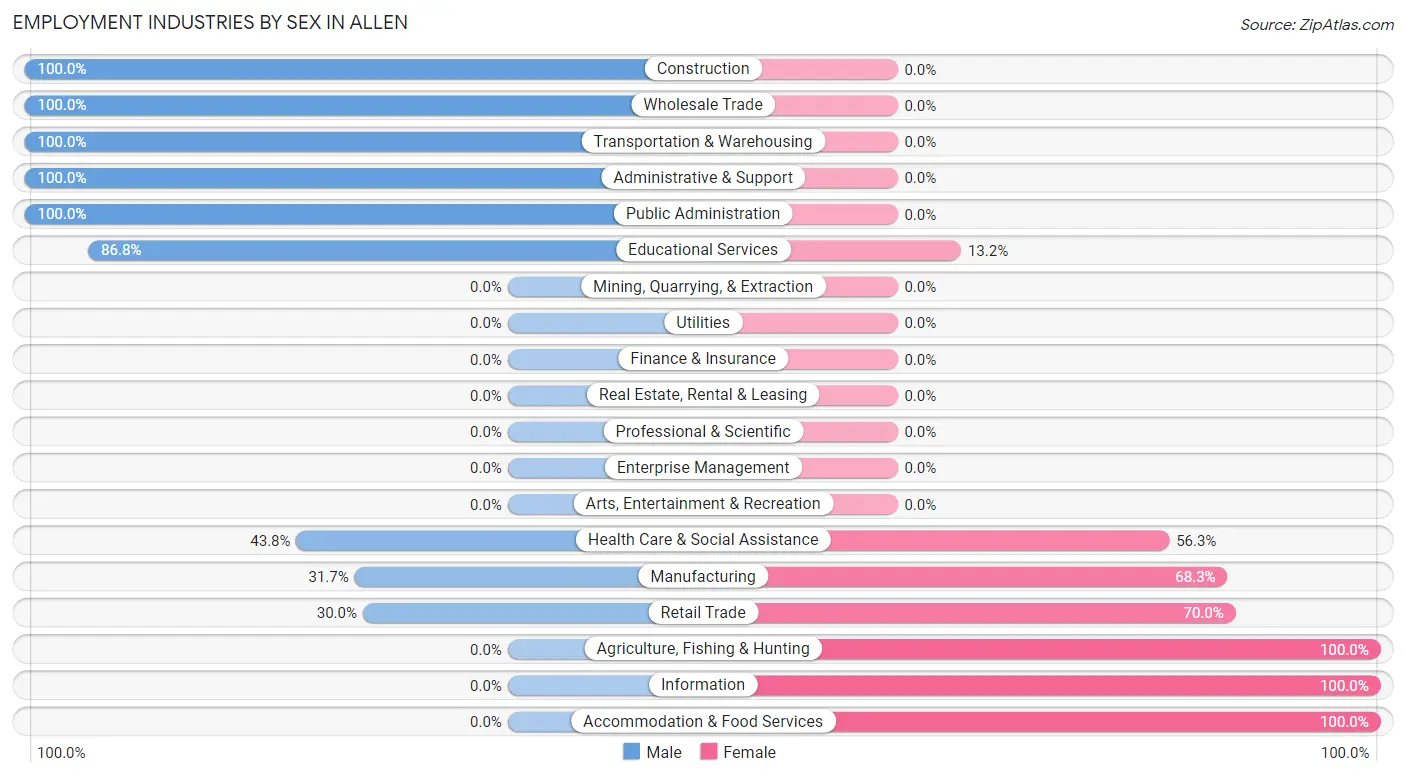
Employment Industries by Sex in Allen
The Allen industries that see more men than women are Construction (100.0%), Wholesale Trade (100.0%), and Transportation & Warehousing (100.0%), whereas the industries that tend to have a higher number of women are Agriculture, Fishing & Hunting (100.0%), Information (100.0%), and Accommodation & Food Services (100.0%).
| Industry | Male | Female |
| Agriculture, Fishing & Hunting | 0 (0.0%) | 1 (100.0%) |
| Mining, Quarrying, & Extraction | 0 (0.0%) | 0 (0.0%) |
| Construction | 3 (100.0%) | 0 (0.0%) |
| Manufacturing | 13 (31.7%) | 28 (68.3%) |
| Wholesale Trade | 2 (100.0%) | 0 (0.0%) |
| Retail Trade | 3 (30.0%) | 7 (70.0%) |
| Transportation & Warehousing | 3 (100.0%) | 0 (0.0%) |
| Utilities | 0 (0.0%) | 0 (0.0%) |
| Information | 0 (0.0%) | 5 (100.0%) |
| Finance & Insurance | 0 (0.0%) | 0 (0.0%) |
| Real Estate, Rental & Leasing | 0 (0.0%) | 0 (0.0%) |
| Professional & Scientific | 0 (0.0%) | 0 (0.0%) |
| Enterprise Management | 0 (0.0%) | 0 (0.0%) |
| Administrative & Support | 1 (100.0%) | 0 (0.0%) |
| Educational Services | 33 (86.8%) | 5 (13.2%) |
| Health Care & Social Assistance | 7 (43.8%) | 9 (56.2%) |
| Arts, Entertainment & Recreation | 0 (0.0%) | 0 (0.0%) |
| Accommodation & Food Services | 0 (0.0%) | 5 (100.0%) |
| Public Administration | 5 (100.0%) | 0 (0.0%) |
| Total | 79 (56.8%) | 60 (43.2%) |
Education in Allen
School Enrollment in Allen
The most common levels of schooling among the 80 students in Allen are college / undergraduate (38 | 47.5%), high school (35 | 43.8%), and middle school (7 | 8.7%).
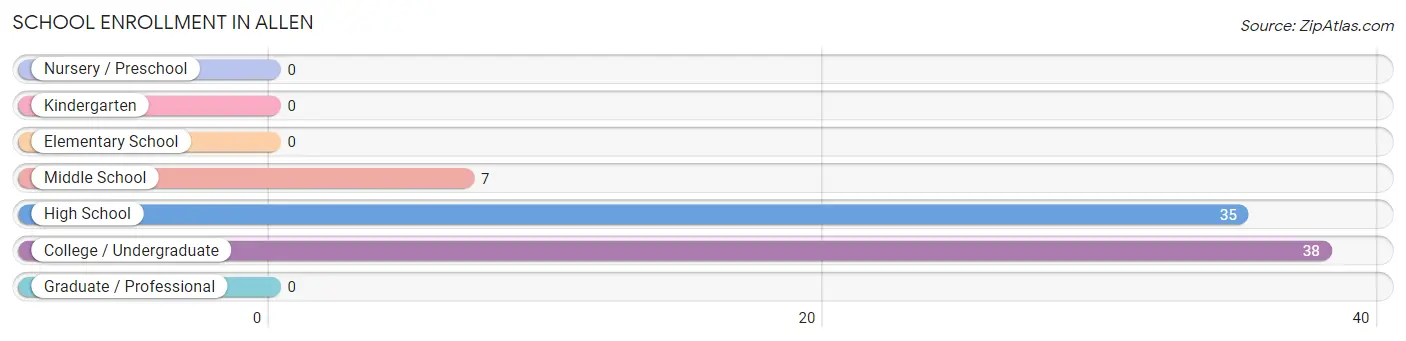
| School Level | # Students | % Students |
| Nursery / Preschool | 0 | 0.0% |
| Kindergarten | 0 | 0.0% |
| Elementary School | 0 | 0.0% |
| Middle School | 7 | 8.7% |
| High School | 35 | 43.8% |
| College / Undergraduate | 38 | 47.5% |
| Graduate / Professional | 0 | 0.0% |
| Total | 80 | 100.0% |
School Enrollment by Age by Funding Source in Allen
Out of a total of 80 students who are enrolled in schools in Allen, 10 (12.5%) attend a private institution, while the remaining 70 (87.5%) are enrolled in public schools. The age group of 10 to 14 year olds has the highest likelihood of being enrolled in private schools, with 5 (41.7% in the age bracket) enrolled. Conversely, the age group of 18 to 19 year olds has the lowest likelihood of being enrolled in a private school, with 2 (100.0% in the age bracket) attending a public institution.
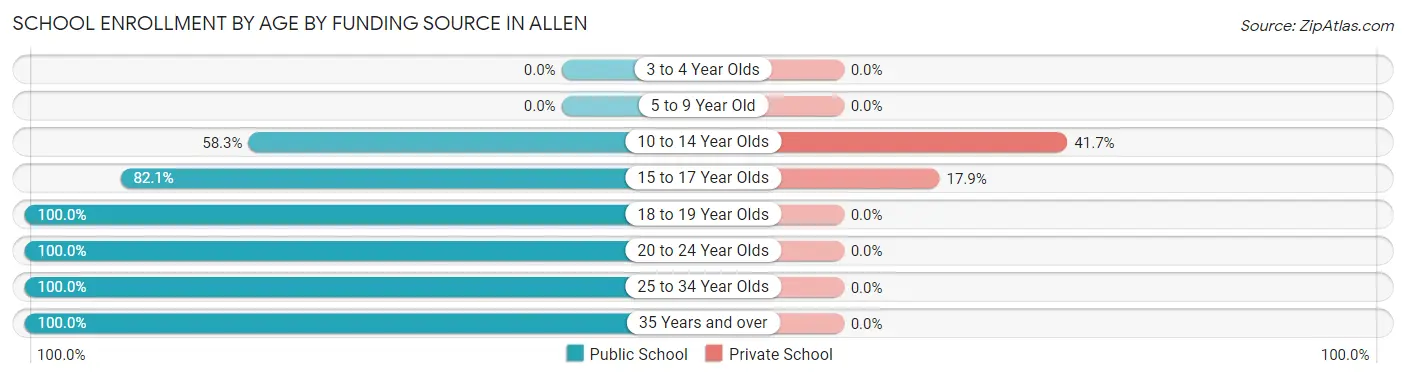
| Age Bracket | Public School | Private School |
| 3 to 4 Year Olds | 0 (0.0%) | 0 (0.0%) |
| 5 to 9 Year Old | 0 (0.0%) | 0 (0.0%) |
| 10 to 14 Year Olds | 7 (58.3%) | 5 (41.7%) |
| 15 to 17 Year Olds | 23 (82.1%) | 5 (17.9%) |
| 18 to 19 Year Olds | 2 (100.0%) | 0 (0.0%) |
| 20 to 24 Year Olds | 33 (100.0%) | 0 (0.0%) |
| 25 to 34 Year Olds | 2 (100.0%) | 0 (0.0%) |
| 35 Years and over | 3 (100.0%) | 0 (0.0%) |
| Total | 70 (87.5%) | 10 (12.5%) |
Educational Attainment by Field of Study in Allen
Education (7 | 50.0%), physical & health sciences (2 | 14.3%), social sciences (2 | 14.3%), science & technology (2 | 14.3%), and bio, nature & agricultural (1 | 7.1%) are the most common fields of study among 14 individuals in Allen who have obtained a bachelor's degree or higher.
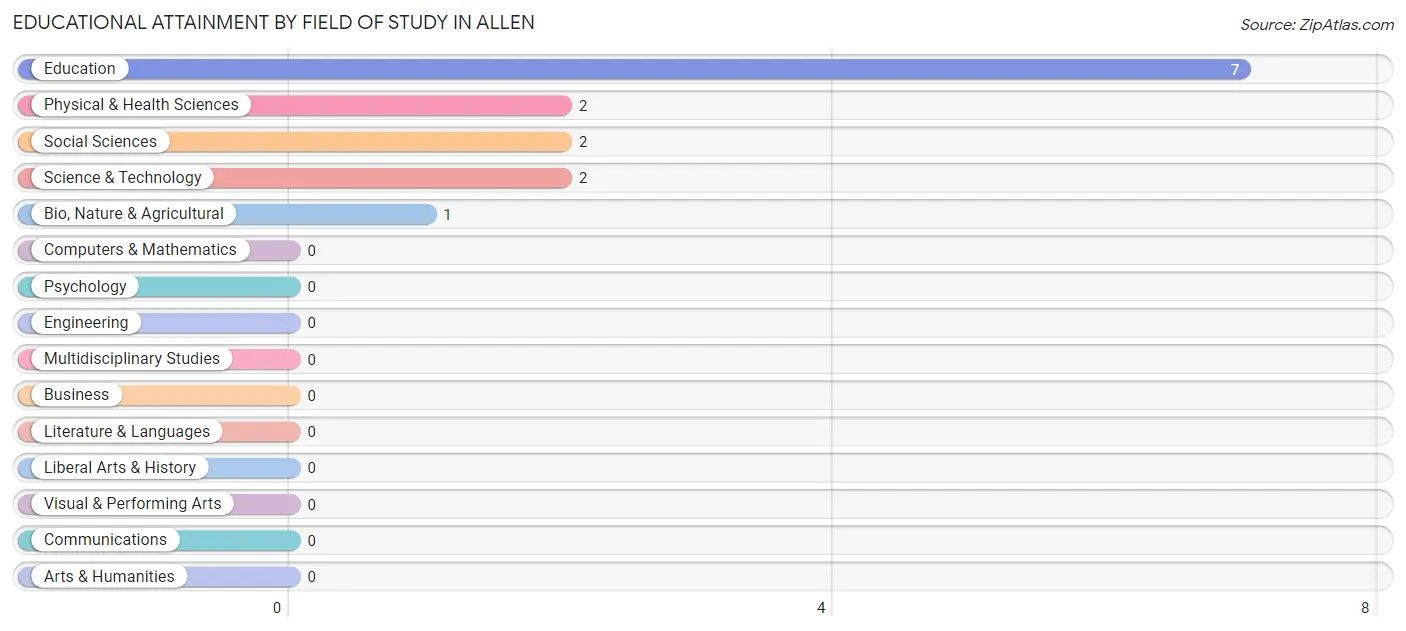
| Field of Study | # Graduates | % Graduates |
| Computers & Mathematics | 0 | 0.0% |
| Bio, Nature & Agricultural | 1 | 7.1% |
| Physical & Health Sciences | 2 | 14.3% |
| Psychology | 0 | 0.0% |
| Social Sciences | 2 | 14.3% |
| Engineering | 0 | 0.0% |
| Multidisciplinary Studies | 0 | 0.0% |
| Science & Technology | 2 | 14.3% |
| Business | 0 | 0.0% |
| Education | 7 | 50.0% |
| Literature & Languages | 0 | 0.0% |
| Liberal Arts & History | 0 | 0.0% |
| Visual & Performing Arts | 0 | 0.0% |
| Communications | 0 | 0.0% |
| Arts & Humanities | 0 | 0.0% |
| Total | 14 | 100.0% |
Transportation & Commute in Allen
Vehicle Availability by Sex in Allen
The most prevalent vehicle ownership categories in Allen are males with 1 vehicle (44, accounting for 55.7%) and females with 1 vehicle (31, making up 73.3%).
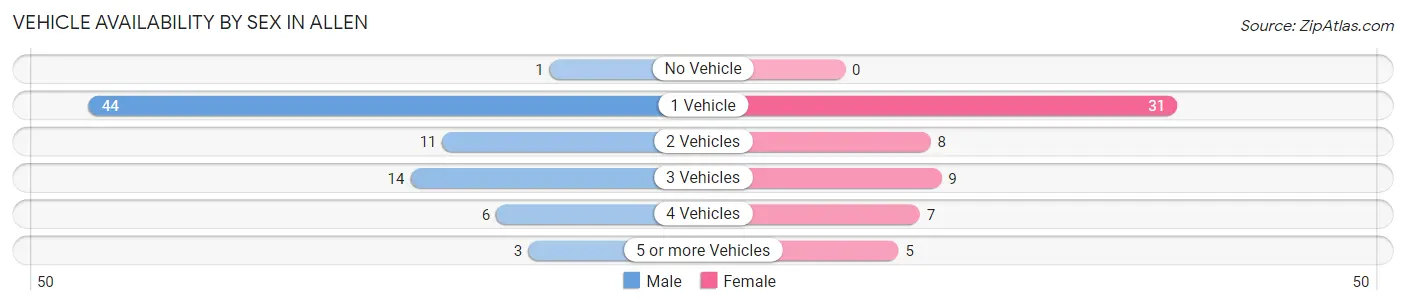
| Vehicles Available | Male | Female |
| No Vehicle | 1 (1.3%) | 0 (0.0%) |
| 1 Vehicle | 44 (55.7%) | 31 (51.7%) |
| 2 Vehicles | 11 (13.9%) | 8 (13.3%) |
| 3 Vehicles | 14 (17.7%) | 9 (15.0%) |
| 4 Vehicles | 6 (7.6%) | 7 (11.7%) |
| 5 or more Vehicles | 3 (3.8%) | 5 (8.3%) |
| Total | 79 (100.0%) | 60 (100.0%) |
Commute Time in Allen
The most frequently occuring commute durations in Allen are 20 to 24 minutes (44 commuters, 31.7%), 60 to 89 minutes (28 commuters, 20.1%), and 25 to 29 minutes (24 commuters, 17.3%).
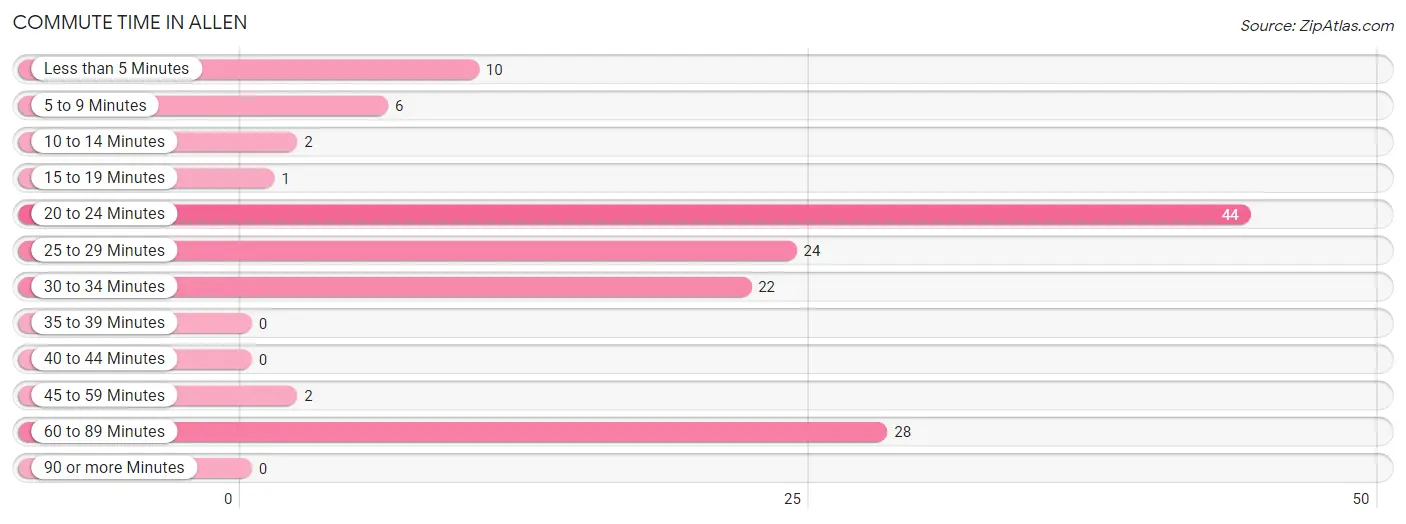
| Commute Time | # Commuters | % Commuters |
| Less than 5 Minutes | 10 | 7.2% |
| 5 to 9 Minutes | 6 | 4.3% |
| 10 to 14 Minutes | 2 | 1.4% |
| 15 to 19 Minutes | 1 | 0.7% |
| 20 to 24 Minutes | 44 | 31.7% |
| 25 to 29 Minutes | 24 | 17.3% |
| 30 to 34 Minutes | 22 | 15.8% |
| 35 to 39 Minutes | 0 | 0.0% |
| 40 to 44 Minutes | 0 | 0.0% |
| 45 to 59 Minutes | 2 | 1.4% |
| 60 to 89 Minutes | 28 | 20.1% |
| 90 or more Minutes | 0 | 0.0% |
Commute Time by Sex in Allen
The most common commute times in Allen are 20 to 24 minutes (43 commuters, 54.4%) for males and 60 to 89 minutes (28 commuters, 46.7%) for females.
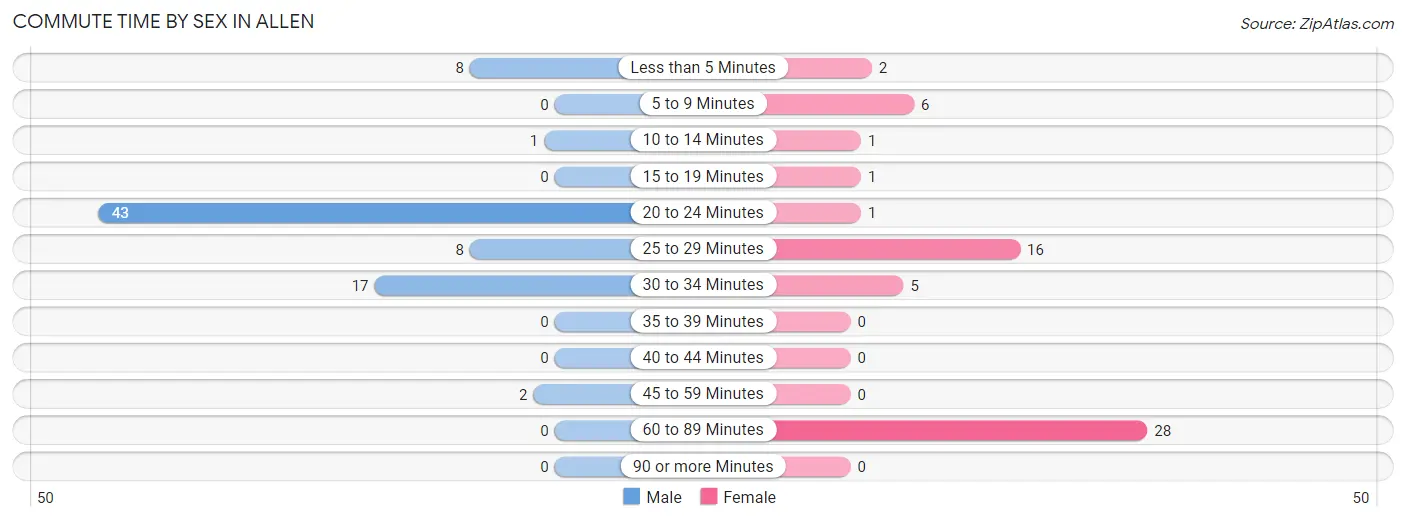
| Commute Time | Male | Female |
| Less than 5 Minutes | 8 (10.1%) | 2 (3.3%) |
| 5 to 9 Minutes | 0 (0.0%) | 6 (10.0%) |
| 10 to 14 Minutes | 1 (1.3%) | 1 (1.7%) |
| 15 to 19 Minutes | 0 (0.0%) | 1 (1.7%) |
| 20 to 24 Minutes | 43 (54.4%) | 1 (1.7%) |
| 25 to 29 Minutes | 8 (10.1%) | 16 (26.7%) |
| 30 to 34 Minutes | 17 (21.5%) | 5 (8.3%) |
| 35 to 39 Minutes | 0 (0.0%) | 0 (0.0%) |
| 40 to 44 Minutes | 0 (0.0%) | 0 (0.0%) |
| 45 to 59 Minutes | 2 (2.5%) | 0 (0.0%) |
| 60 to 89 Minutes | 0 (0.0%) | 28 (46.7%) |
| 90 or more Minutes | 0 (0.0%) | 0 (0.0%) |
Time of Departure to Work by Sex in Allen
The most frequent times of departure to work in Allen are 6:30 AM to 6:59 AM (33, 41.8%) for males and 6:30 AM to 6:59 AM (29, 48.3%) for females.
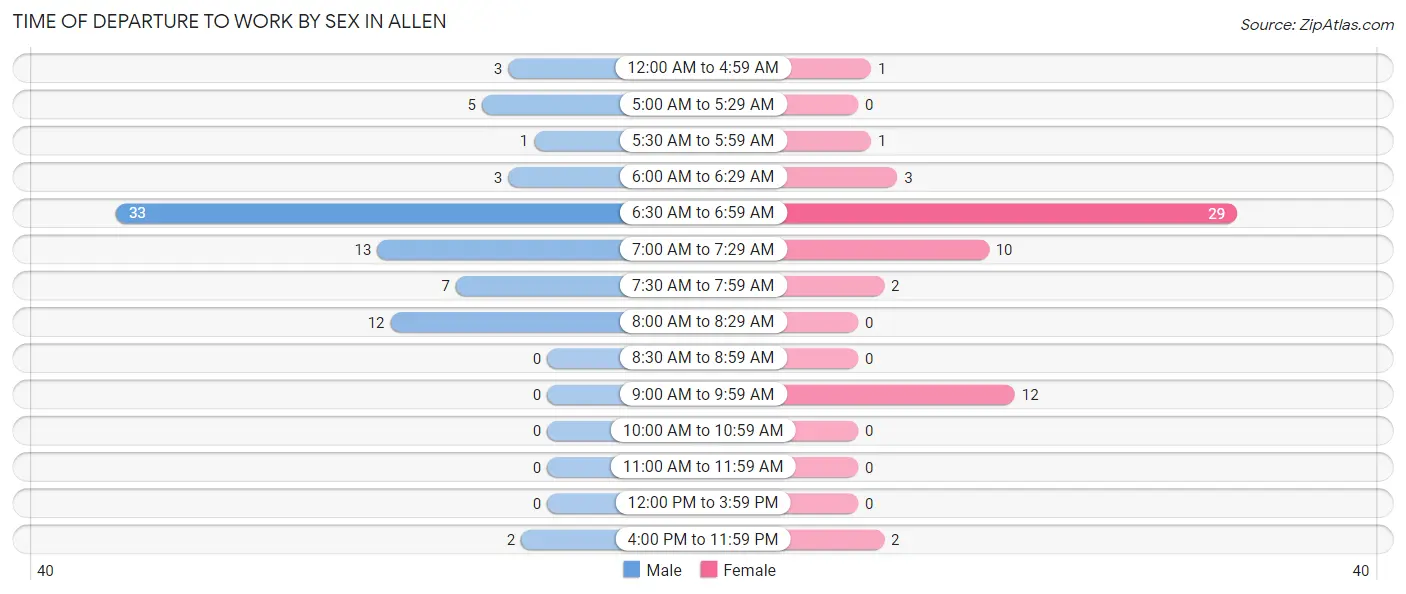
| Time of Departure | Male | Female |
| 12:00 AM to 4:59 AM | 3 (3.8%) | 1 (1.7%) |
| 5:00 AM to 5:29 AM | 5 (6.3%) | 0 (0.0%) |
| 5:30 AM to 5:59 AM | 1 (1.3%) | 1 (1.7%) |
| 6:00 AM to 6:29 AM | 3 (3.8%) | 3 (5.0%) |
| 6:30 AM to 6:59 AM | 33 (41.8%) | 29 (48.3%) |
| 7:00 AM to 7:29 AM | 13 (16.5%) | 10 (16.7%) |
| 7:30 AM to 7:59 AM | 7 (8.9%) | 2 (3.3%) |
| 8:00 AM to 8:29 AM | 12 (15.2%) | 0 (0.0%) |
| 8:30 AM to 8:59 AM | 0 (0.0%) | 0 (0.0%) |
| 9:00 AM to 9:59 AM | 0 (0.0%) | 12 (20.0%) |
| 10:00 AM to 10:59 AM | 0 (0.0%) | 0 (0.0%) |
| 11:00 AM to 11:59 AM | 0 (0.0%) | 0 (0.0%) |
| 12:00 PM to 3:59 PM | 0 (0.0%) | 0 (0.0%) |
| 4:00 PM to 11:59 PM | 2 (2.5%) | 2 (3.3%) |
| Total | 79 (100.0%) | 60 (100.0%) |
Housing Occupancy in Allen
Occupancy by Ownership in Allen
Of the total 140 dwellings in Allen, owner-occupied units account for 87 (62.1%), while renter-occupied units make up 53 (37.9%).
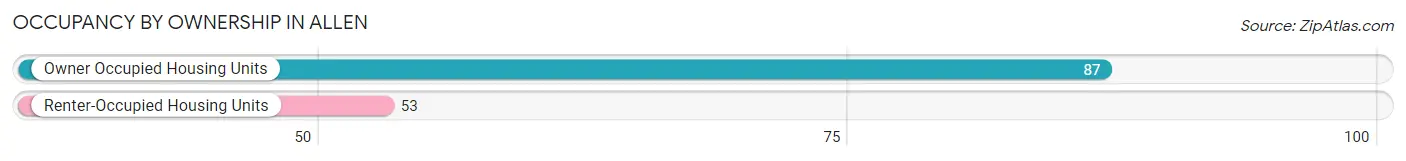
| Occupancy | # Housing Units | % Housing Units |
| Owner Occupied Housing Units | 87 | 62.1% |
| Renter-Occupied Housing Units | 53 | 37.9% |
| Total Occupied Housing Units | 140 | 100.0% |
Occupancy by Household Size in Allen
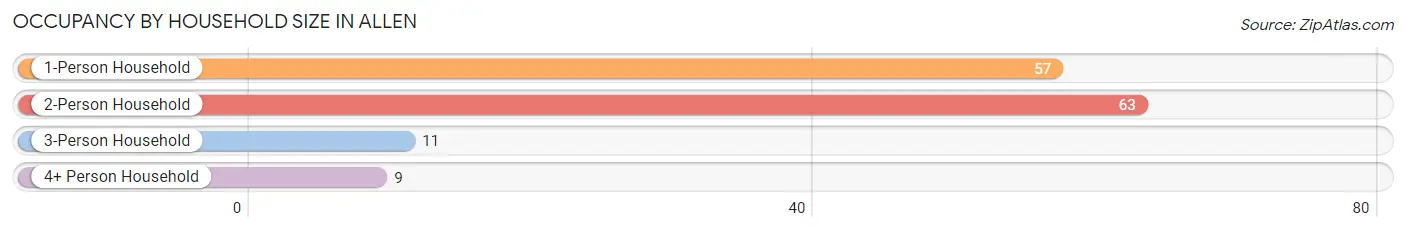
| Household Size | # Housing Units | % Housing Units |
| 1-Person Household | 57 | 40.7% |
| 2-Person Household | 63 | 45.0% |
| 3-Person Household | 11 | 7.9% |
| 4+ Person Household | 9 | 6.4% |
| Total Housing Units | 140 | 100.0% |
Occupancy by Ownership by Household Size in Allen
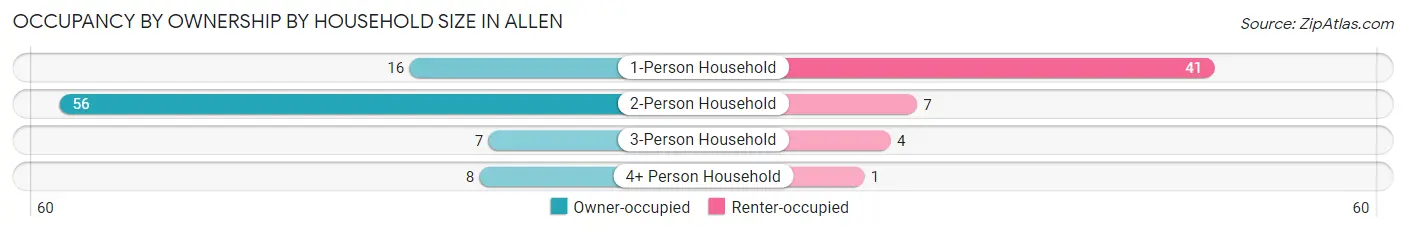
| Household Size | Owner-occupied | Renter-occupied |
| 1-Person Household | 16 (28.1%) | 41 (71.9%) |
| 2-Person Household | 56 (88.9%) | 7 (11.1%) |
| 3-Person Household | 7 (63.6%) | 4 (36.4%) |
| 4+ Person Household | 8 (88.9%) | 1 (11.1%) |
| Total Housing Units | 87 (62.1%) | 53 (37.9%) |
Occupancy by Educational Attainment in Allen
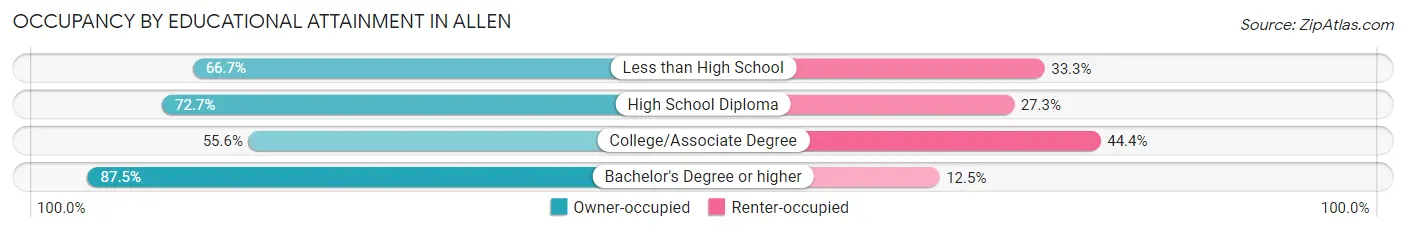
| Household Size | Owner-occupied | Renter-occupied |
| Less than High School | 6 (66.7%) | 3 (33.3%) |
| High School Diploma | 24 (72.7%) | 9 (27.3%) |
| College/Associate Degree | 50 (55.6%) | 40 (44.4%) |
| Bachelor's Degree or higher | 7 (87.5%) | 1 (12.5%) |
Occupancy by Age of Householder in Allen
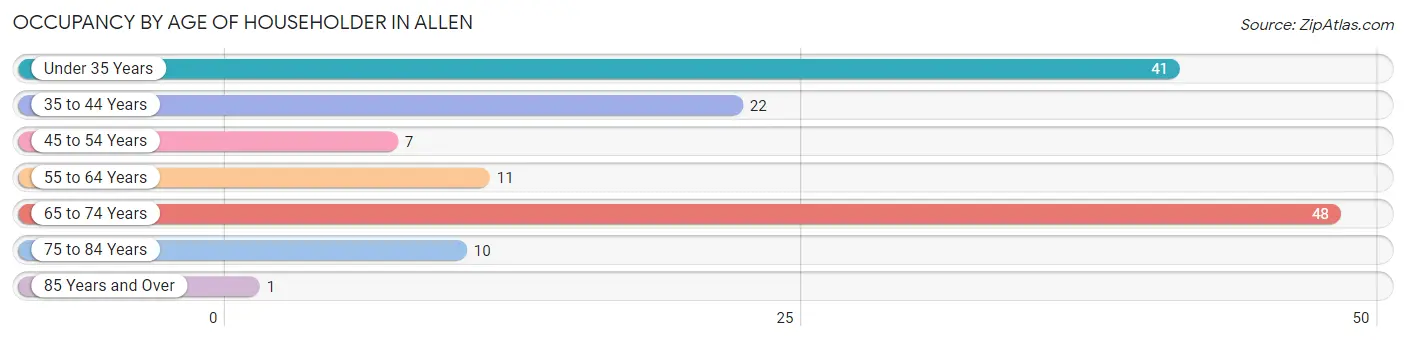
| Age Bracket | # Households | % Households |
| Under 35 Years | 41 | 29.3% |
| 35 to 44 Years | 22 | 15.7% |
| 45 to 54 Years | 7 | 5.0% |
| 55 to 64 Years | 11 | 7.9% |
| 65 to 74 Years | 48 | 34.3% |
| 75 to 84 Years | 10 | 7.1% |
| 85 Years and Over | 1 | 0.7% |
| Total | 140 | 100.0% |
Housing Finances in Allen
Median Income by Occupancy in Allen
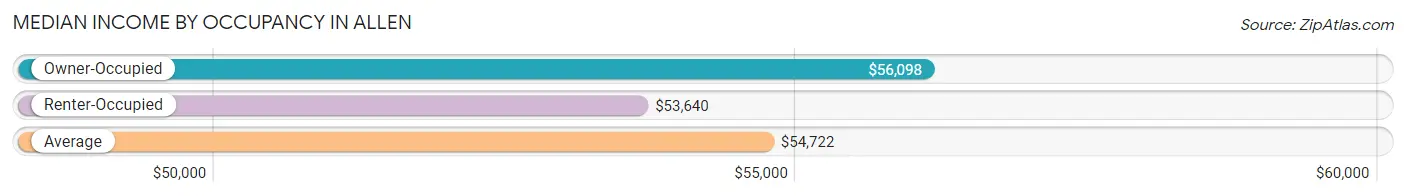
| Occupancy Type | # Households | Median Income |
| Owner-Occupied | 87 (62.1%) | $56,098 |
| Renter-Occupied | 53 (37.9%) | $53,640 |
| Average | 140 (100.0%) | $54,722 |
Occupancy by Householder Income Bracket in Allen
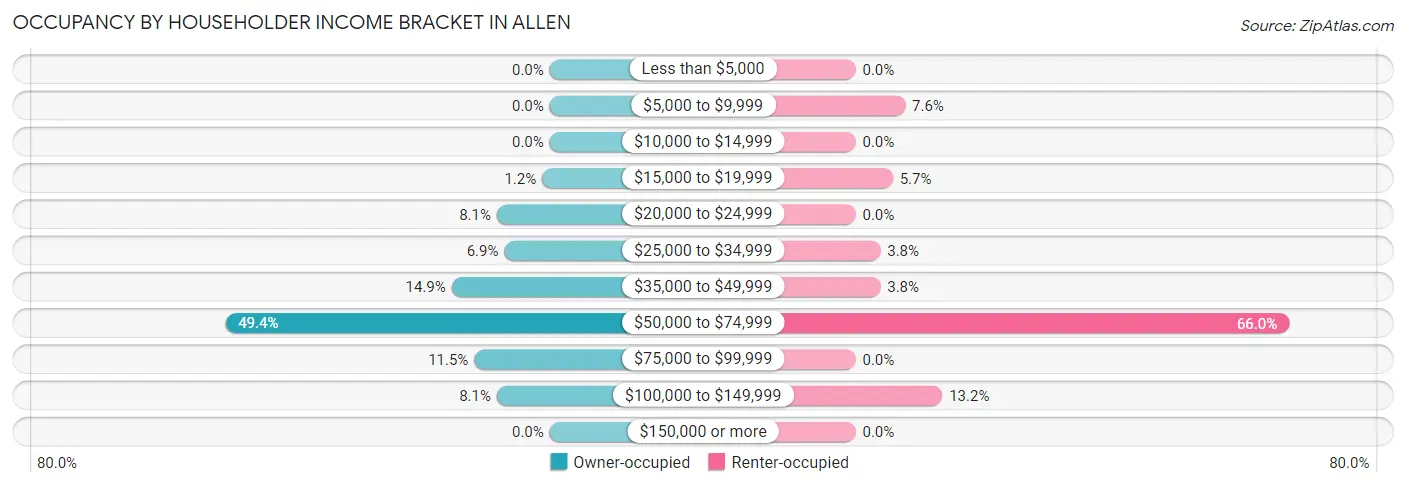
| Income Bracket | Owner-occupied | Renter-occupied |
| Less than $5,000 | 0 (0.0%) | 0 (0.0%) |
| $5,000 to $9,999 | 0 (0.0%) | 4 (7.5%) |
| $10,000 to $14,999 | 0 (0.0%) | 0 (0.0%) |
| $15,000 to $19,999 | 1 (1.1%) | 3 (5.7%) |
| $20,000 to $24,999 | 7 (8.1%) | 0 (0.0%) |
| $25,000 to $34,999 | 6 (6.9%) | 2 (3.8%) |
| $35,000 to $49,999 | 13 (14.9%) | 2 (3.8%) |
| $50,000 to $74,999 | 43 (49.4%) | 35 (66.0%) |
| $75,000 to $99,999 | 10 (11.5%) | 0 (0.0%) |
| $100,000 to $149,999 | 7 (8.1%) | 7 (13.2%) |
| $150,000 or more | 0 (0.0%) | 0 (0.0%) |
| Total | 87 (100.0%) | 53 (100.0%) |
Monthly Housing Cost Tiers in Allen
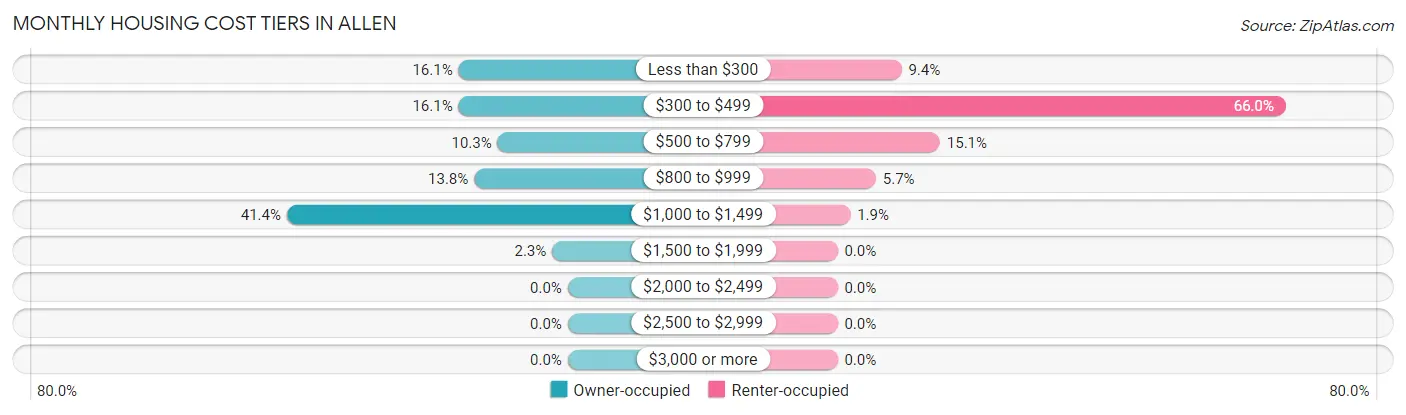
| Monthly Cost | Owner-occupied | Renter-occupied |
| Less than $300 | 14 (16.1%) | 5 (9.4%) |
| $300 to $499 | 14 (16.1%) | 35 (66.0%) |
| $500 to $799 | 9 (10.3%) | 8 (15.1%) |
| $800 to $999 | 12 (13.8%) | 3 (5.7%) |
| $1,000 to $1,499 | 36 (41.4%) | 1 (1.9%) |
| $1,500 to $1,999 | 2 (2.3%) | 0 (0.0%) |
| $2,000 to $2,499 | 0 (0.0%) | 0 (0.0%) |
| $2,500 to $2,999 | 0 (0.0%) | 0 (0.0%) |
| $3,000 or more | 0 (0.0%) | 0 (0.0%) |
| Total | 87 (100.0%) | 53 (100.0%) |
Physical Housing Characteristics in Allen
Housing Structures in Allen
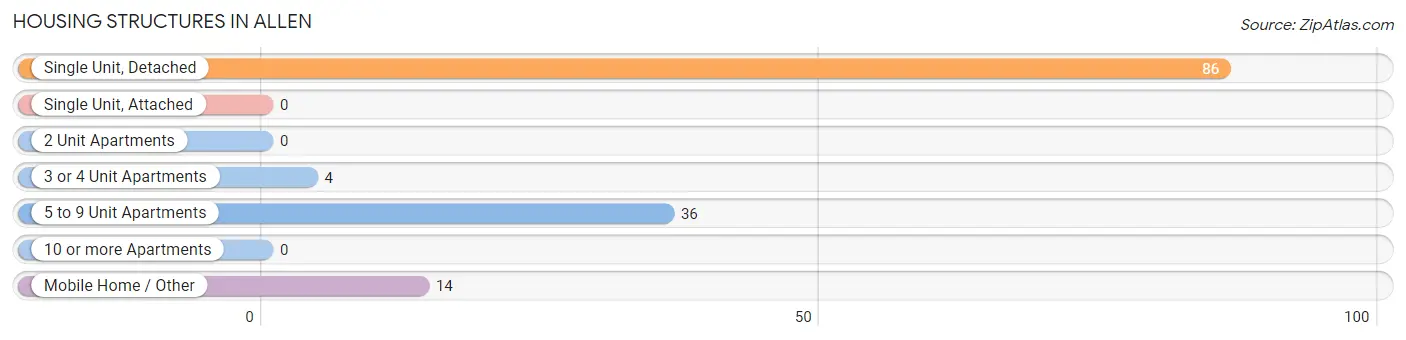
| Structure Type | # Housing Units | % Housing Units |
| Single Unit, Detached | 86 | 61.4% |
| Single Unit, Attached | 0 | 0.0% |
| 2 Unit Apartments | 0 | 0.0% |
| 3 or 4 Unit Apartments | 4 | 2.9% |
| 5 to 9 Unit Apartments | 36 | 25.7% |
| 10 or more Apartments | 0 | 0.0% |
| Mobile Home / Other | 14 | 10.0% |
| Total | 140 | 100.0% |
Housing Structures by Occupancy in Allen
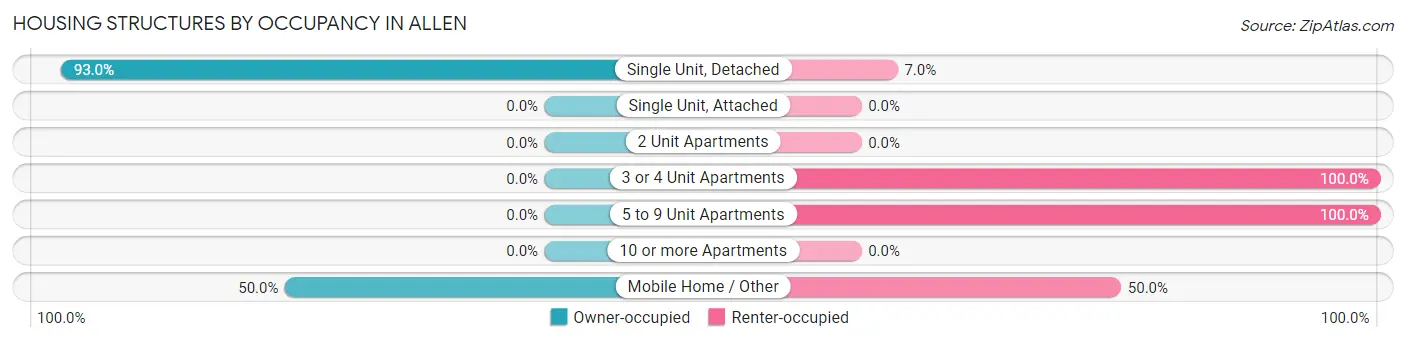
| Structure Type | Owner-occupied | Renter-occupied |
| Single Unit, Detached | 80 (93.0%) | 6 (7.0%) |
| Single Unit, Attached | 0 (0.0%) | 0 (0.0%) |
| 2 Unit Apartments | 0 (0.0%) | 0 (0.0%) |
| 3 or 4 Unit Apartments | 0 (0.0%) | 4 (100.0%) |
| 5 to 9 Unit Apartments | 0 (0.0%) | 36 (100.0%) |
| 10 or more Apartments | 0 (0.0%) | 0 (0.0%) |
| Mobile Home / Other | 7 (50.0%) | 7 (50.0%) |
| Total | 87 (62.1%) | 53 (37.9%) |
Housing Structures by Number of Rooms in Allen
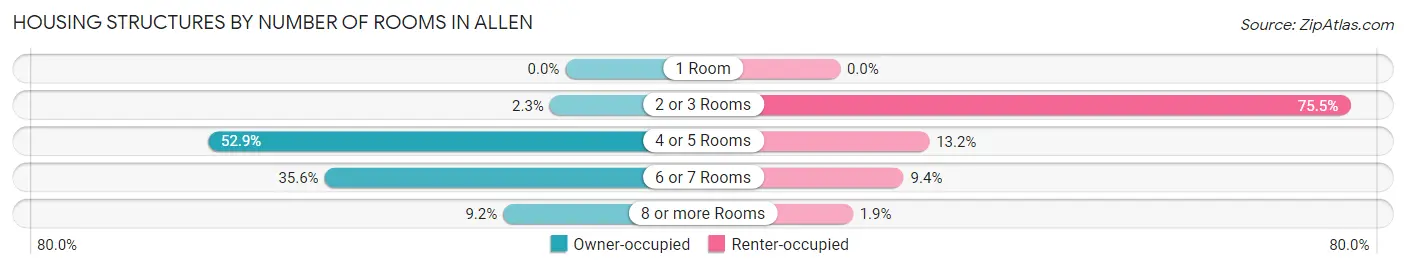
| Number of Rooms | Owner-occupied | Renter-occupied |
| 1 Room | 0 (0.0%) | 0 (0.0%) |
| 2 or 3 Rooms | 2 (2.3%) | 40 (75.5%) |
| 4 or 5 Rooms | 46 (52.9%) | 7 (13.2%) |
| 6 or 7 Rooms | 31 (35.6%) | 5 (9.4%) |
| 8 or more Rooms | 8 (9.2%) | 1 (1.9%) |
| Total | 87 (100.0%) | 53 (100.0%) |
Housing Structure by Heating Type in Allen
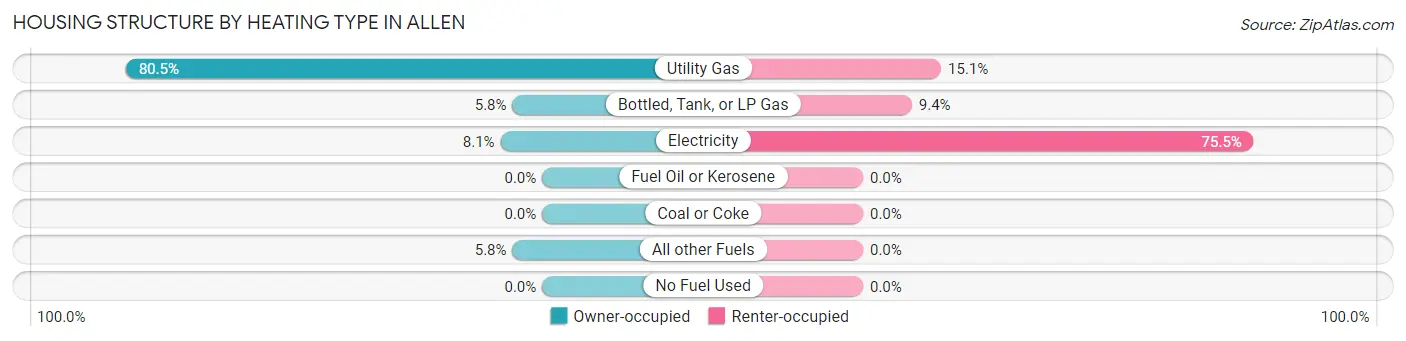
| Heating Type | Owner-occupied | Renter-occupied |
| Utility Gas | 70 (80.5%) | 8 (15.1%) |
| Bottled, Tank, or LP Gas | 5 (5.8%) | 5 (9.4%) |
| Electricity | 7 (8.1%) | 40 (75.5%) |
| Fuel Oil or Kerosene | 0 (0.0%) | 0 (0.0%) |
| Coal or Coke | 0 (0.0%) | 0 (0.0%) |
| All other Fuels | 5 (5.8%) | 0 (0.0%) |
| No Fuel Used | 0 (0.0%) | 0 (0.0%) |
| Total | 87 (100.0%) | 53 (100.0%) |
Household Vehicle Usage in Allen
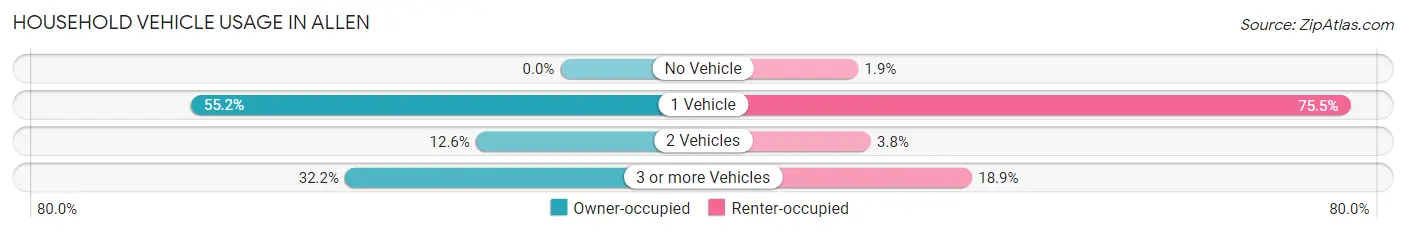
| Vehicles per Household | Owner-occupied | Renter-occupied |
| No Vehicle | 0 (0.0%) | 1 (1.9%) |
| 1 Vehicle | 48 (55.2%) | 40 (75.5%) |
| 2 Vehicles | 11 (12.6%) | 2 (3.8%) |
| 3 or more Vehicles | 28 (32.2%) | 10 (18.9%) |
| Total | 87 (100.0%) | 53 (100.0%) |
Real Estate & Mortgages in Allen
Real Estate and Mortgage Overview in Allen
| Characteristic | Without Mortgage | With Mortgage |
| Housing Units | 30 | 57 |
| Median Property Value | $36,400 | $56,200 |
| Median Household Income | $38,750 | $0 |
| Monthly Housing Costs | $306 | $0 |
| Real Estate Taxes | $550 | $3 |
Property Value by Mortgage Status in Allen
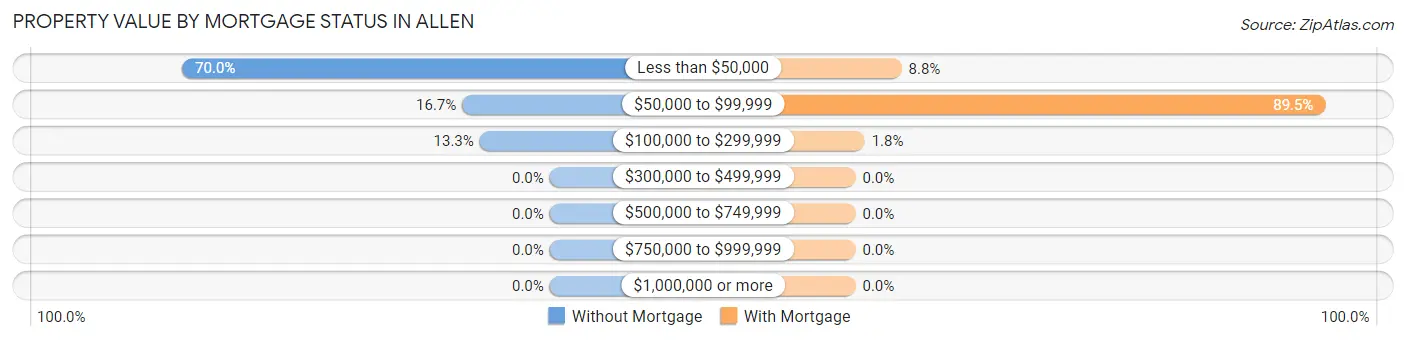
| Property Value | Without Mortgage | With Mortgage |
| Less than $50,000 | 21 (70.0%) | 5 (8.8%) |
| $50,000 to $99,999 | 5 (16.7%) | 51 (89.5%) |
| $100,000 to $299,999 | 4 (13.3%) | 1 (1.8%) |
| $300,000 to $499,999 | 0 (0.0%) | 0 (0.0%) |
| $500,000 to $749,999 | 0 (0.0%) | 0 (0.0%) |
| $750,000 to $999,999 | 0 (0.0%) | 0 (0.0%) |
| $1,000,000 or more | 0 (0.0%) | 0 (0.0%) |
| Total | 30 (100.0%) | 57 (100.0%) |
Household Income by Mortgage Status in Allen
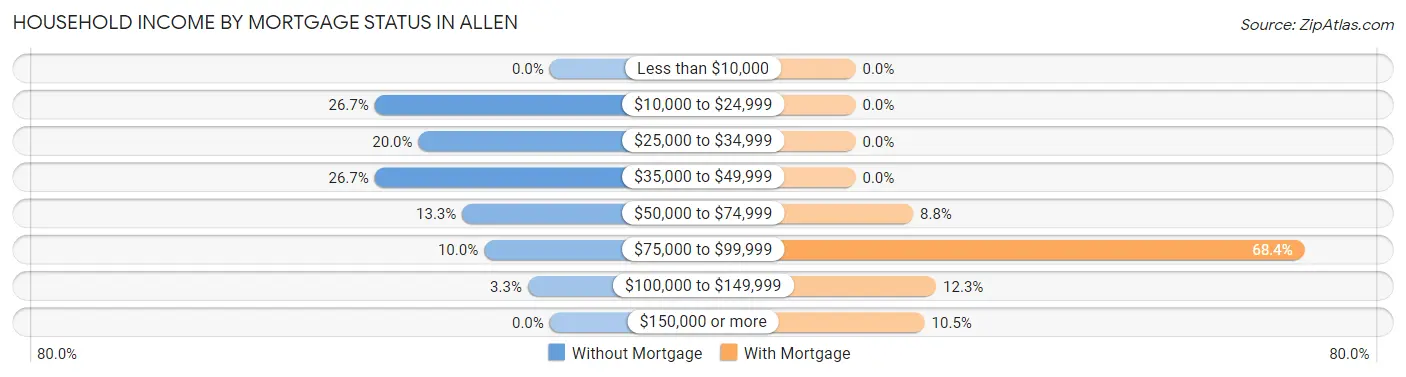
| Household Income | Without Mortgage | With Mortgage |
| Less than $10,000 | 0 (0.0%) | 0 (0.0%) |
| $10,000 to $24,999 | 8 (26.7%) | 0 (0.0%) |
| $25,000 to $34,999 | 6 (20.0%) | 0 (0.0%) |
| $35,000 to $49,999 | 8 (26.7%) | 0 (0.0%) |
| $50,000 to $74,999 | 4 (13.3%) | 5 (8.8%) |
| $75,000 to $99,999 | 3 (10.0%) | 39 (68.4%) |
| $100,000 to $149,999 | 1 (3.3%) | 7 (12.3%) |
| $150,000 or more | 0 (0.0%) | 6 (10.5%) |
| Total | 30 (100.0%) | 57 (100.0%) |
Property Value to Household Income Ratio in Allen
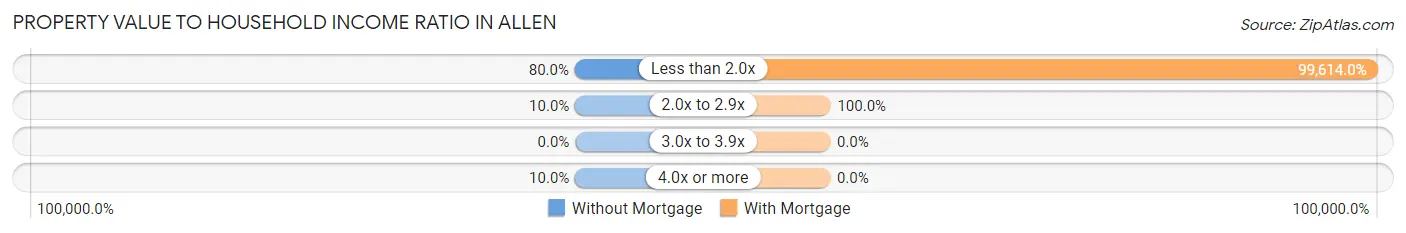
| Value-to-Income Ratio | Without Mortgage | With Mortgage |
| Less than 2.0x | 24 (80.0%) | 56,780 (99,614.0%) |
| 2.0x to 2.9x | 3 (10.0%) | 57 (100.0%) |
| 3.0x to 3.9x | 0 (0.0%) | 0 (0.0%) |
| 4.0x or more | 3 (10.0%) | 0 (0.0%) |
| Total | 30 (100.0%) | 57 (100.0%) |
Real Estate Taxes by Mortgage Status in Allen
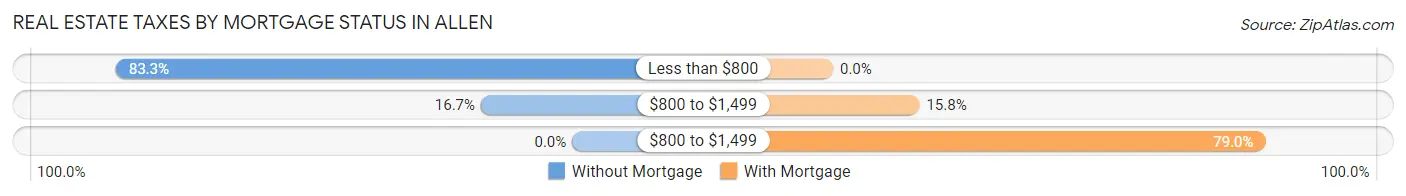
| Property Taxes | Without Mortgage | With Mortgage |
| Less than $800 | 25 (83.3%) | 0 (0.0%) |
| $800 to $1,499 | 5 (16.7%) | 9 (15.8%) |
| $800 to $1,499 | 0 (0.0%) | 45 (78.9%) |
| Total | 30 (100.0%) | 57 (100.0%) |
Health & Disability in Allen
Health Insurance Coverage by Age in Allen
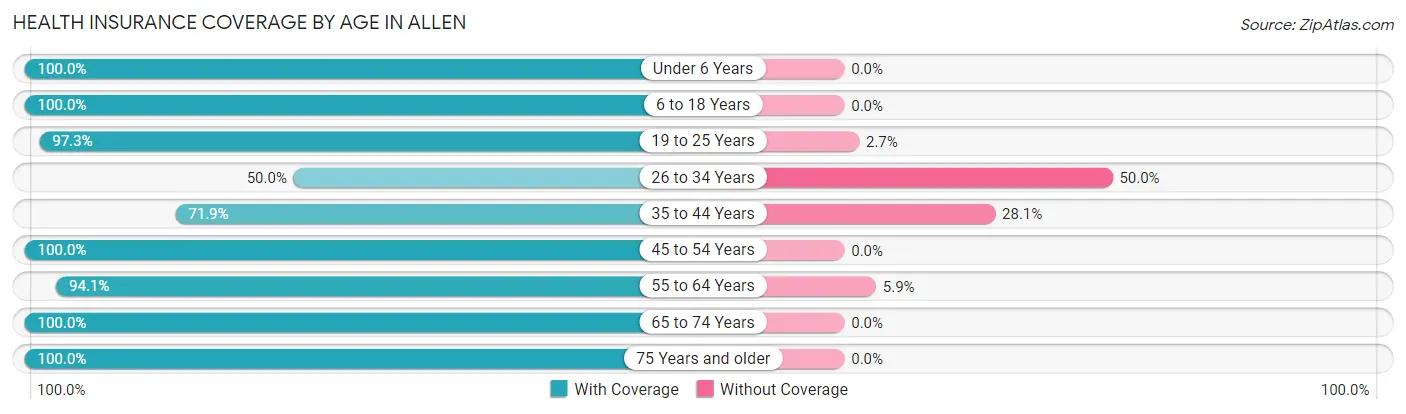
| Age Bracket | With Coverage | Without Coverage |
| Under 6 Years | 2 (100.0%) | 0 (0.0%) |
| 6 to 18 Years | 42 (100.0%) | 0 (0.0%) |
| 19 to 25 Years | 71 (97.3%) | 2 (2.7%) |
| 26 to 34 Years | 3 (50.0%) | 3 (50.0%) |
| 35 to 44 Years | 23 (71.9%) | 9 (28.1%) |
| 45 to 54 Years | 16 (100.0%) | 0 (0.0%) |
| 55 to 64 Years | 16 (94.1%) | 1 (5.9%) |
| 65 to 74 Years | 55 (100.0%) | 0 (0.0%) |
| 75 Years and older | 17 (100.0%) | 0 (0.0%) |
| Total | 245 (94.2%) | 15 (5.8%) |
Health Insurance Coverage by Citizenship Status in Allen
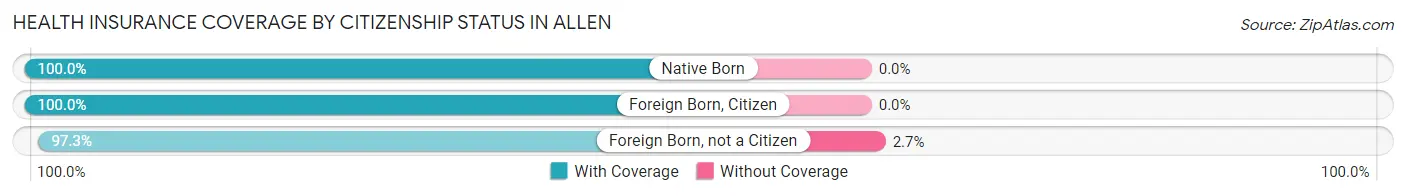
| Citizenship Status | With Coverage | Without Coverage |
| Native Born | 2 (100.0%) | 0 (0.0%) |
| Foreign Born, Citizen | 42 (100.0%) | 0 (0.0%) |
| Foreign Born, not a Citizen | 71 (97.3%) | 2 (2.7%) |
Health Insurance Coverage by Household Income in Allen
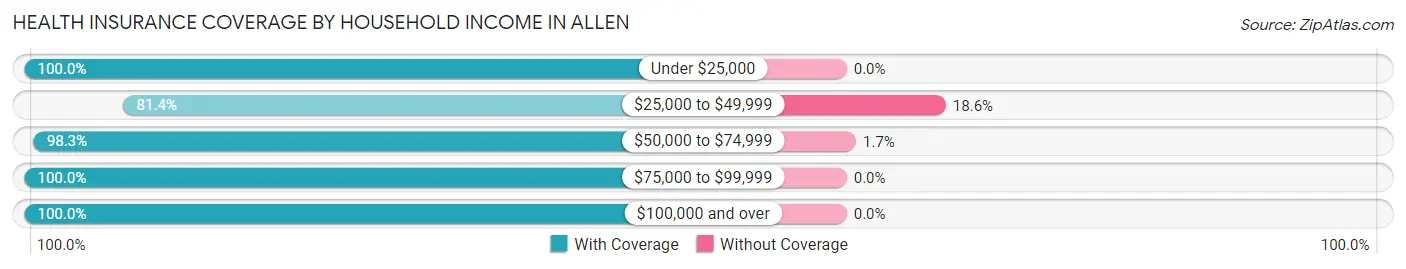
| Household Income | With Coverage | Without Coverage |
| Under $25,000 | 15 (100.0%) | 0 (0.0%) |
| $25,000 to $49,999 | 57 (81.4%) | 13 (18.6%) |
| $50,000 to $74,999 | 113 (98.3%) | 2 (1.7%) |
| $75,000 to $99,999 | 16 (100.0%) | 0 (0.0%) |
| $100,000 and over | 44 (100.0%) | 0 (0.0%) |
Public vs Private Health Insurance Coverage by Age in Allen
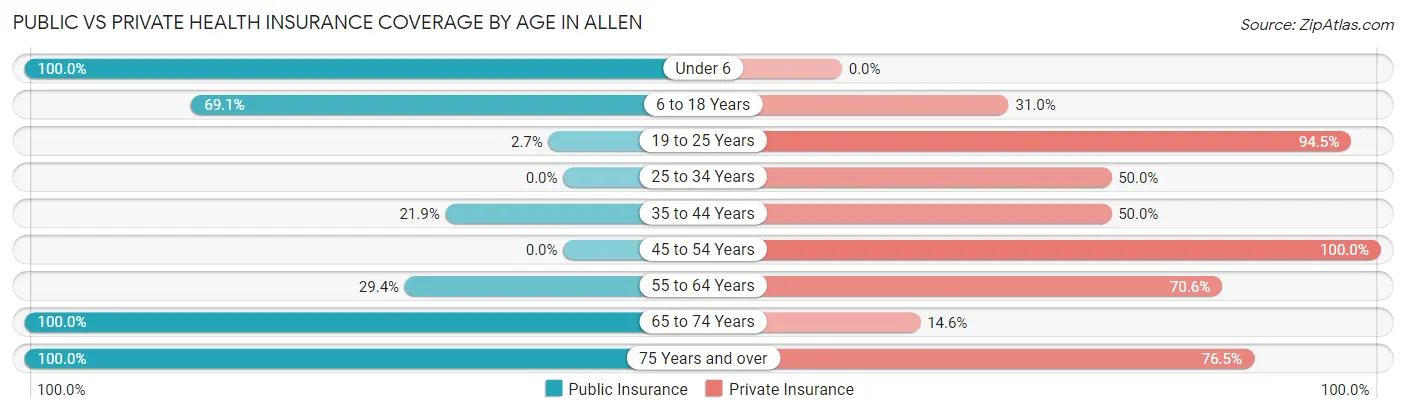
| Age Bracket | Public Insurance | Private Insurance |
| Under 6 | 2 (100.0%) | 0 (0.0%) |
| 6 to 18 Years | 29 (69.1%) | 13 (30.9%) |
| 19 to 25 Years | 2 (2.7%) | 69 (94.5%) |
| 25 to 34 Years | 0 (0.0%) | 3 (50.0%) |
| 35 to 44 Years | 7 (21.9%) | 16 (50.0%) |
| 45 to 54 Years | 0 (0.0%) | 16 (100.0%) |
| 55 to 64 Years | 5 (29.4%) | 12 (70.6%) |
| 65 to 74 Years | 55 (100.0%) | 8 (14.5%) |
| 75 Years and over | 17 (100.0%) | 13 (76.5%) |
| Total | 117 (45.0%) | 150 (57.7%) |
Disability Status by Sex by Age in Allen
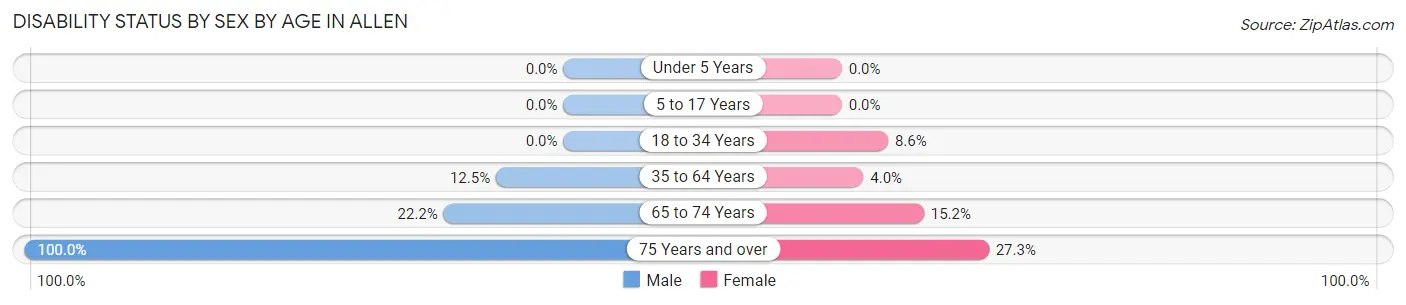
| Age Bracket | Male | Female |
| Under 5 Years | 0 (0.0%) | 0 (0.0%) |
| 5 to 17 Years | 0 (0.0%) | 0 (0.0%) |
| 18 to 34 Years | 0 (0.0%) | 3 (8.6%) |
| 35 to 64 Years | 5 (12.5%) | 1 (4.0%) |
| 65 to 74 Years | 2 (22.2%) | 7 (15.2%) |
| 75 Years and over | 6 (100.0%) | 3 (27.3%) |
Disability Class by Sex by Age in Allen
Disability Class: Hearing Difficulty
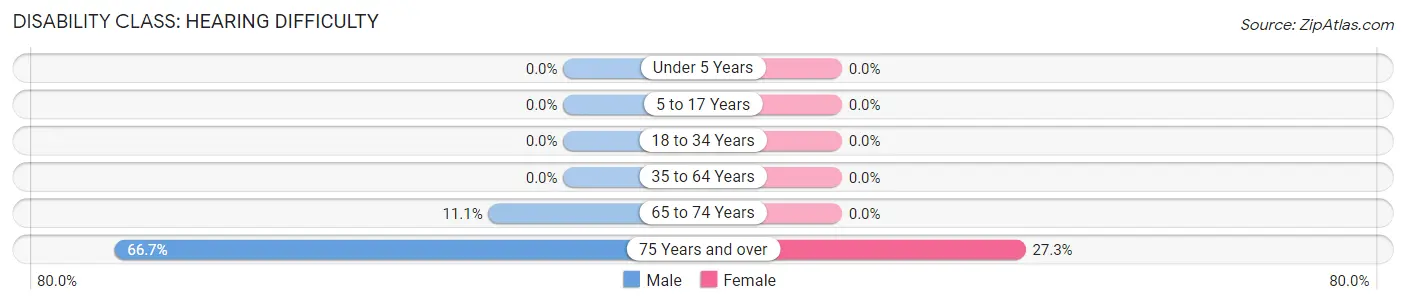
| Age Bracket | Male | Female |
| Under 5 Years | 0 (0.0%) | 0 (0.0%) |
| 5 to 17 Years | 0 (0.0%) | 0 (0.0%) |
| 18 to 34 Years | 0 (0.0%) | 0 (0.0%) |
| 35 to 64 Years | 0 (0.0%) | 0 (0.0%) |
| 65 to 74 Years | 1 (11.1%) | 0 (0.0%) |
| 75 Years and over | 4 (66.7%) | 3 (27.3%) |
Disability Class: Vision Difficulty
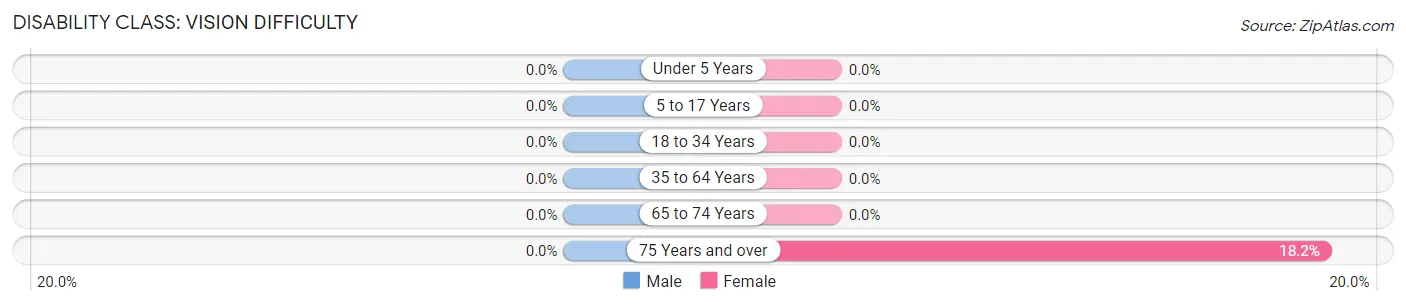
| Age Bracket | Male | Female |
| Under 5 Years | 0 (0.0%) | 0 (0.0%) |
| 5 to 17 Years | 0 (0.0%) | 0 (0.0%) |
| 18 to 34 Years | 0 (0.0%) | 0 (0.0%) |
| 35 to 64 Years | 0 (0.0%) | 0 (0.0%) |
| 65 to 74 Years | 0 (0.0%) | 0 (0.0%) |
| 75 Years and over | 0 (0.0%) | 2 (18.2%) |
Disability Class: Cognitive Difficulty
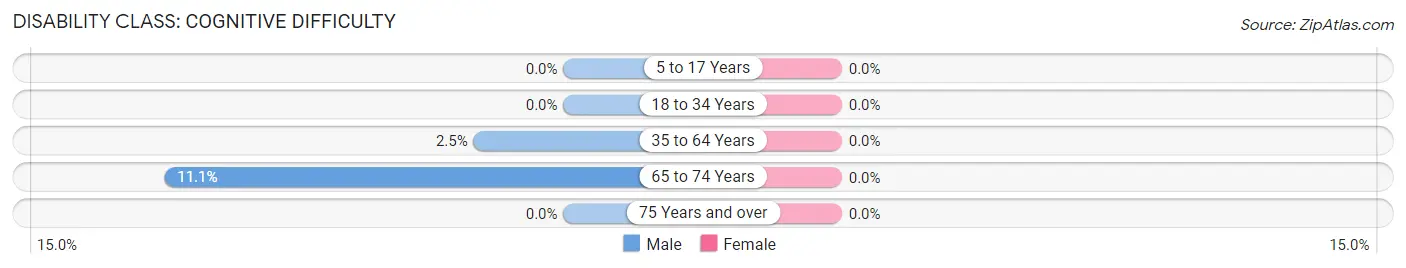
| Age Bracket | Male | Female |
| 5 to 17 Years | 0 (0.0%) | 0 (0.0%) |
| 18 to 34 Years | 0 (0.0%) | 0 (0.0%) |
| 35 to 64 Years | 1 (2.5%) | 0 (0.0%) |
| 65 to 74 Years | 1 (11.1%) | 0 (0.0%) |
| 75 Years and over | 0 (0.0%) | 0 (0.0%) |
Disability Class: Ambulatory Difficulty
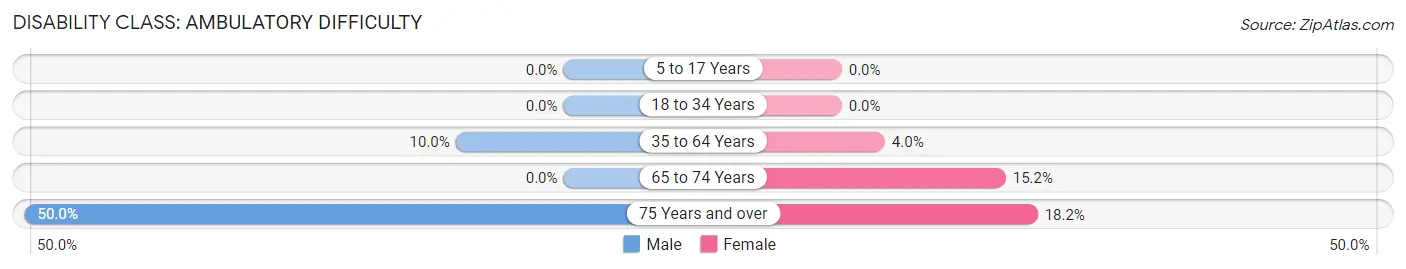
| Age Bracket | Male | Female |
| 5 to 17 Years | 0 (0.0%) | 0 (0.0%) |
| 18 to 34 Years | 0 (0.0%) | 0 (0.0%) |
| 35 to 64 Years | 4 (10.0%) | 1 (4.0%) |
| 65 to 74 Years | 0 (0.0%) | 7 (15.2%) |
| 75 Years and over | 3 (50.0%) | 2 (18.2%) |
Disability Class: Self-Care Difficulty
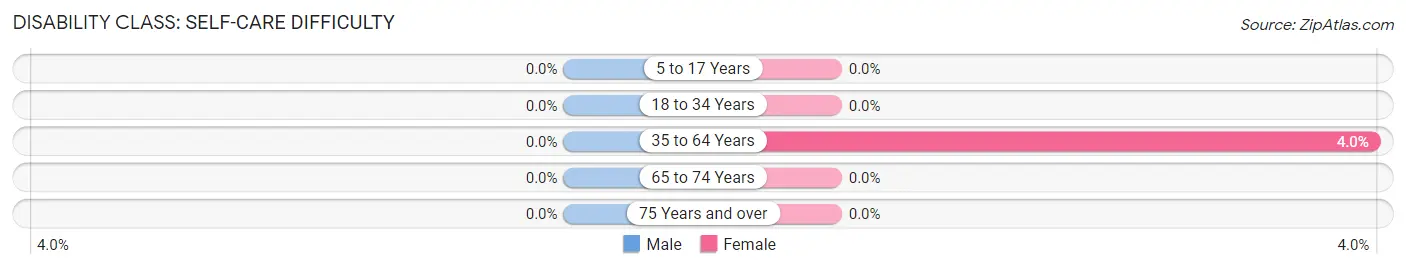
| Age Bracket | Male | Female |
| 5 to 17 Years | 0 (0.0%) | 0 (0.0%) |
| 18 to 34 Years | 0 (0.0%) | 0 (0.0%) |
| 35 to 64 Years | 0 (0.0%) | 1 (4.0%) |
| 65 to 74 Years | 0 (0.0%) | 0 (0.0%) |
| 75 Years and over | 0 (0.0%) | 0 (0.0%) |
Technology Access in Allen
Computing Device Access in Allen
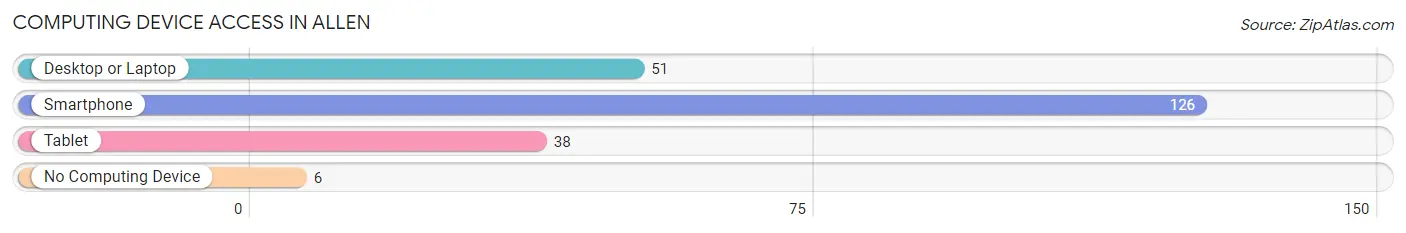
| Device Type | # Households | % Households |
| Desktop or Laptop | 51 | 36.4% |
| Smartphone | 126 | 90.0% |
| Tablet | 38 | 27.1% |
| No Computing Device | 6 | 4.3% |
| Total | 140 | 100.0% |
Internet Access in Allen
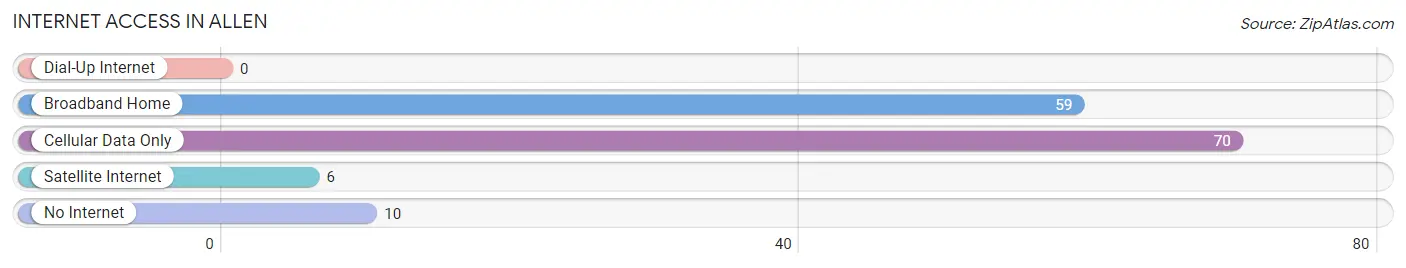
| Internet Type | # Households | % Households |
| Dial-Up Internet | 0 | 0.0% |
| Broadband Home | 59 | 42.1% |
| Cellular Data Only | 70 | 50.0% |
| Satellite Internet | 6 | 4.3% |
| No Internet | 10 | 7.1% |
| Total | 140 | 100.0% |
Allen Summary
Allen, Kansas is a small city located in the northeastern corner of the state, in the county of Anderson. It is situated on the banks of the Neosho River, and is surrounded by rolling hills and farmland. The city has a population of approximately 1,400 people, and is the county seat of Anderson County.
History
The area that is now Allen was first settled in the late 1800s by settlers from the eastern United States. The town was originally called “Neosho City”, but was later renamed “Allen” in honor of a local settler, William Allen. The town was officially incorporated in 1887.
In the early 1900s, Allen was a thriving agricultural community, with a variety of crops being grown in the area. The town was also home to a number of businesses, including a flour mill, a creamery, and a lumber yard.
In the 1950s, Allen began to experience a decline in population as many of its residents moved away in search of better economic opportunities. This trend continued until the late 1970s, when the town began to experience a resurgence in population growth.
Geography
Allen is located in the northeastern corner of Kansas, in Anderson County. The city is situated on the banks of the Neosho River, and is surrounded by rolling hills and farmland. The city has a total area of 1.2 square miles, all of which is land.
The climate in Allen is characterized by hot, humid summers and cold, dry winters. The average annual temperature is around 54 degrees Fahrenheit, and the average annual precipitation is around 36 inches.
Economy
The economy of Allen is largely based on agriculture. The city is home to a number of farms, which produce a variety of crops, including corn, soybeans, wheat, and hay. The city is also home to a number of businesses, including a lumber yard, a feed store, and a hardware store.
Demographics
As of the 2010 census, the population of Allen was 1,400 people. The racial makeup of the city was 97.3% White, 0.7% African American, 0.3% Native American, 0.3% Asian, and 1.4% from other races. The median household income was $37,500, and the median family income was $45,000.
Conclusion
Allen, Kansas is a small city located in the northeastern corner of the state, in the county of Anderson. It is situated on the banks of the Neosho River, and is surrounded by rolling hills and farmland. The city has a population of approximately 1,400 people, and is the county seat of Anderson County. The economy of Allen is largely based on agriculture, and the city is home to a number of businesses. The racial makeup of the city is predominantly White, with a small percentage of African American, Native American, and Asian residents.
Common Questions
What is Per Capita Income in Allen?
Per Capita income in Allen is $28,921.
What is the Median Family Income in Allen?
Median Family Income in Allen is $71,250.
What is the Median Household income in Allen?
Median Household Income in Allen is $54,722.
What is Inequality or Gini Index in Allen?
Inequality or Gini Index in Allen is 0.24.
What is the Total Population of Allen?
Total Population of Allen is 260.
What is the Total Male Population of Allen?
Total Male Population of Allen is 119.
What is the Total Female Population of Allen?
Total Female Population of Allen is 141.
What is the Ratio of Males per 100 Females in Allen?
There are 84.40 Males per 100 Females in Allen.
What is the Ratio of Females per 100 Males in Allen?
There are 118.49 Females per 100 Males in Allen.
What is the Median Population Age in Allen?
Median Population Age in Allen is 38.0 Years.
What is the Average Family Size in Allen
Average Family Size in Allen is 2.8 People.
What is the Average Household Size in Allen
Average Household Size in Allen is 1.9 People.
How Large is the Labor Force in Allen?
There are 139 People in the Labor Forcein in Allen.
What is the Percentage of People in the Labor Force in Allen?
60.4% of People are in the Labor Force in Allen.