Dorrance, KS Map & Demographics
Dorrance Map
Dorrance Overview
$34,832
PER CAPITA INCOME
$121,250
AVG FAMILY INCOME
$75,156
AVG HOUSEHOLD INCOME
0.45
INEQUALITY / GINI INDEX
205
TOTAL POPULATION
128
MALE POPULATION
77
FEMALE POPULATION
166.23
MALES / 100 FEMALES
60.16
FEMALES / 100 MALES
52.9
MEDIAN AGE
3.1
AVG FAMILY SIZE
2.5
AVG HOUSEHOLD SIZE
102
LABOR FORCE [ PEOPLE ]
53.1%
PERCENT IN LABOR FORCE
Dorrance Zip Codes
Dorrance Area Codes
Income in Dorrance
Income Overview in Dorrance
Per Capita Income in Dorrance is $34,832, while median incomes of families and households are $121,250 and $75,156 respectively.
| Characteristic | Number | Measure |
| Per Capita Income | 205 | $34,832 |
| Median Family Income | 54 | $121,250 |
| Mean Family Income | 54 | $122,678 |
| Median Household Income | 83 | $75,156 |
| Mean Household Income | 83 | $90,760 |
| Income Deficit | 54 | $0 |
| Wage / Income Gap (%) | 205 | 0.00% |
| Wage / Income Gap ($) | 205 | 100.00¢ per $1 |
| Gini / Inequality Index | 205 | 0.45 |
Earnings by Sex in Dorrance
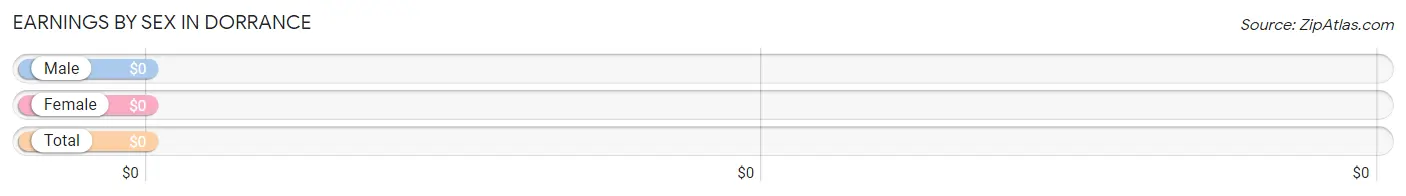
| Sex | Number | Average Earnings |
| Male | 97 (65.5%) | $0 |
| Female | 51 (34.5%) | $0 |
| Total | 148 (100.0%) | $0 |
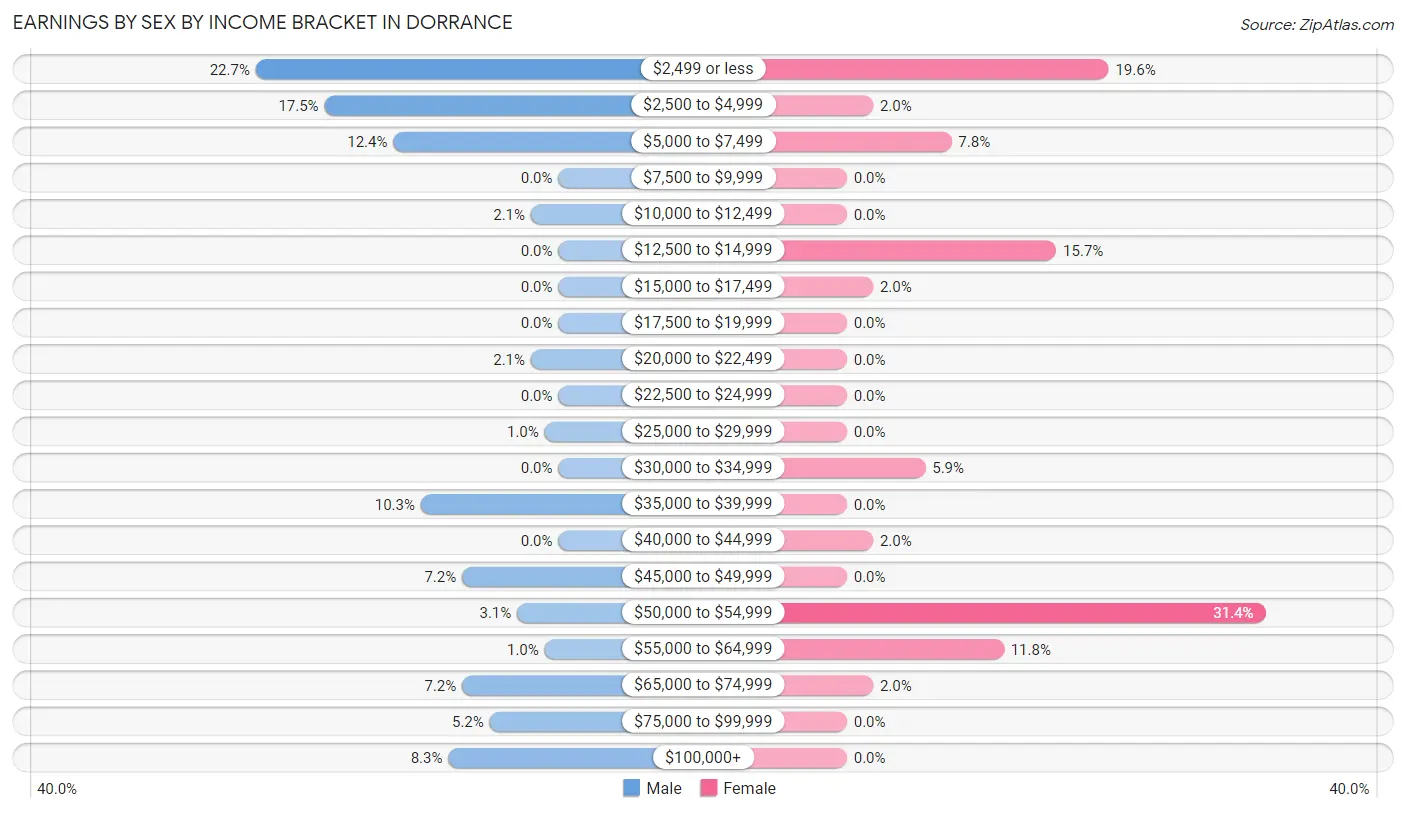
Earnings by Sex by Income Bracket in Dorrance
The most common earnings brackets in Dorrance are $2,499 or less for men (22 | 22.7%) and $50,000 to $54,999 for women (16 | 31.4%).
| Income | Male | Female |
| $2,499 or less | 22 (22.7%) | 10 (19.6%) |
| $2,500 to $4,999 | 17 (17.5%) | 1 (2.0%) |
| $5,000 to $7,499 | 12 (12.4%) | 4 (7.8%) |
| $7,500 to $9,999 | 0 (0.0%) | 0 (0.0%) |
| $10,000 to $12,499 | 2 (2.1%) | 0 (0.0%) |
| $12,500 to $14,999 | 0 (0.0%) | 8 (15.7%) |
| $15,000 to $17,499 | 0 (0.0%) | 1 (2.0%) |
| $17,500 to $19,999 | 0 (0.0%) | 0 (0.0%) |
| $20,000 to $22,499 | 2 (2.1%) | 0 (0.0%) |
| $22,500 to $24,999 | 0 (0.0%) | 0 (0.0%) |
| $25,000 to $29,999 | 1 (1.0%) | 0 (0.0%) |
| $30,000 to $34,999 | 0 (0.0%) | 3 (5.9%) |
| $35,000 to $39,999 | 10 (10.3%) | 0 (0.0%) |
| $40,000 to $44,999 | 0 (0.0%) | 1 (2.0%) |
| $45,000 to $49,999 | 7 (7.2%) | 0 (0.0%) |
| $50,000 to $54,999 | 3 (3.1%) | 16 (31.4%) |
| $55,000 to $64,999 | 1 (1.0%) | 6 (11.8%) |
| $65,000 to $74,999 | 7 (7.2%) | 1 (2.0%) |
| $75,000 to $99,999 | 5 (5.1%) | 0 (0.0%) |
| $100,000+ | 8 (8.3%) | 0 (0.0%) |
| Total | 97 (100.0%) | 51 (100.0%) |
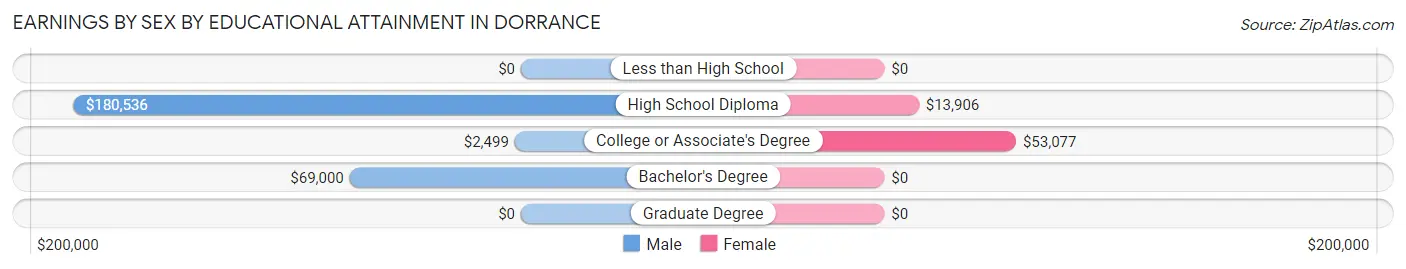
Earnings by Sex by Educational Attainment in Dorrance
Average earnings in Dorrance are $38,125 for men and $52,083 for women, a difference of 26.8%. Men with an educational attainment of high school diploma enjoy the highest average annual earnings of $180,536, while those with college or associate's degree education earn the least with $2,499. Women with an educational attainment of college or associate's degree earn the most with the average annual earnings of $53,077, while those with high school diploma education have the smallest earnings of $13,906.
| Educational Attainment | Male Income | Female Income |
| Less than High School | - | - |
| High School Diploma | $180,536 | $13,906 |
| College or Associate's Degree | $2,499 | $53,077 |
| Bachelor's Degree | $69,000 | $0 |
| Graduate Degree | - | - |
| Total | $38,125 | $52,083 |
Family Income in Dorrance
Family Income Brackets in Dorrance
According to the Dorrance family income data, there are 19 families falling into the $100,000 to $149,999 income range, which is the most common income bracket and makes up 35.2% of all families.
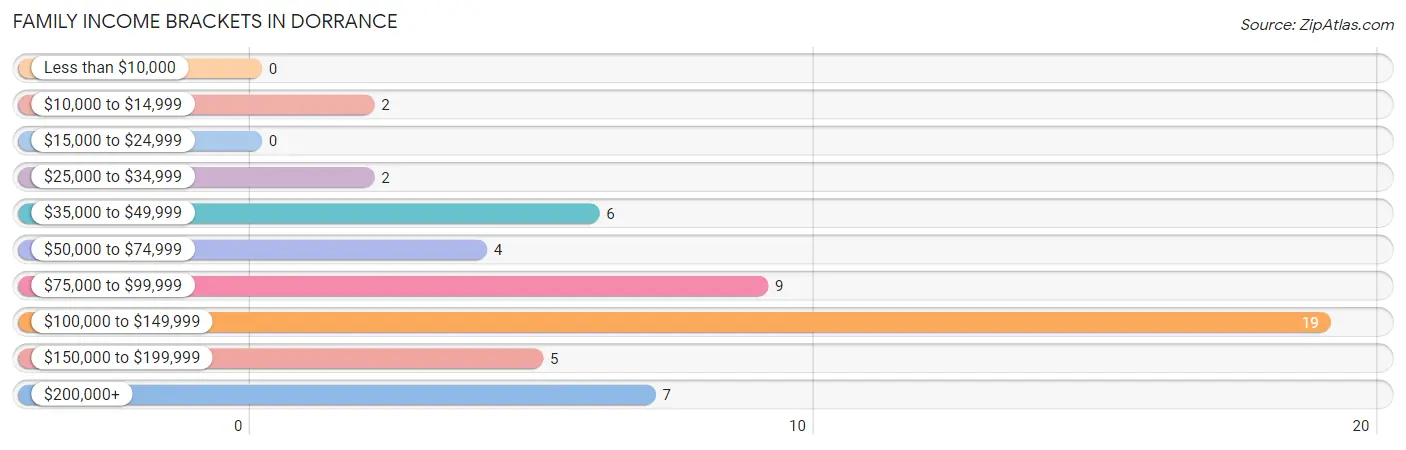
| Income Bracket | # Families | % Families |
| Less than $10,000 | 0 | 0.0% |
| $10,000 to $14,999 | 2 | 3.7% |
| $15,000 to $24,999 | 0 | 0.0% |
| $25,000 to $34,999 | 2 | 3.7% |
| $35,000 to $49,999 | 6 | 11.1% |
| $50,000 to $74,999 | 4 | 7.4% |
| $75,000 to $99,999 | 9 | 16.7% |
| $100,000 to $149,999 | 19 | 35.2% |
| $150,000 to $199,999 | 5 | 9.3% |
| $200,000+ | 7 | 13.0% |
Family Income by Famaliy Size in Dorrance
2-person families (36 | 66.7%) account for the highest median family income in Dorrance with $123,846 per family, while 2-person families (36 | 66.7%) have the highest median income of $61,923 per family member.
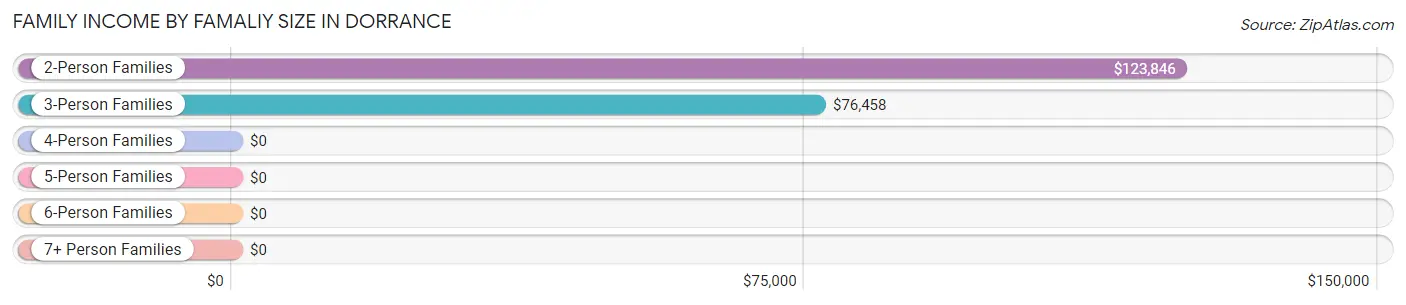
| Income Bracket | # Families | Median Income |
| 2-Person Families | 36 (66.7%) | $123,846 |
| 3-Person Families | 11 (20.4%) | $76,458 |
| 4-Person Families | 2 (3.7%) | $0 |
| 5-Person Families | 3 (5.6%) | $0 |
| 6-Person Families | 2 (3.7%) | $0 |
| 7+ Person Families | 0 (0.0%) | $0 |
| Total | 54 (100.0%) | $121,250 |
Family Income by Number of Earners in Dorrance
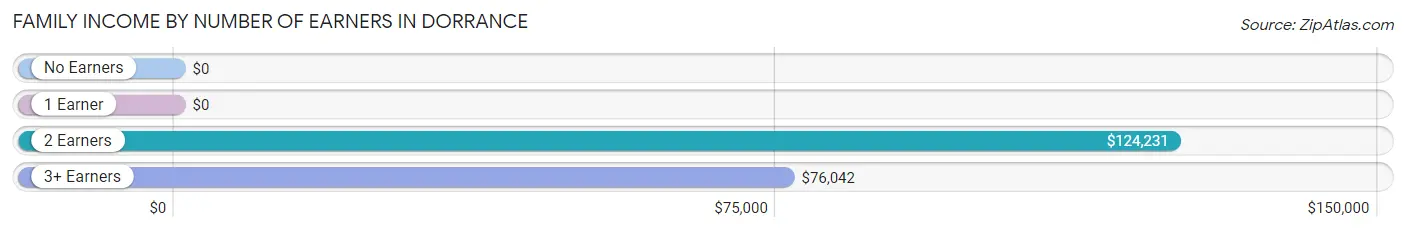
| Number of Earners | # Families | Median Income |
| No Earners | 5 (9.3%) | $0 |
| 1 Earner | 4 (7.4%) | $0 |
| 2 Earners | 30 (55.6%) | $124,231 |
| 3+ Earners | 15 (27.8%) | $76,042 |
| Total | 54 (100.0%) | $121,250 |
Household Income in Dorrance
Household Income Brackets in Dorrance
With 19 households falling in the category, the $100,000 to $149,999 income range is the most frequent in Dorrance, accounting for 22.9% of all households. In contrast, only 3 households (3.6%) fall into the $10,000 to $14,999 income bracket, making it the least populous group.
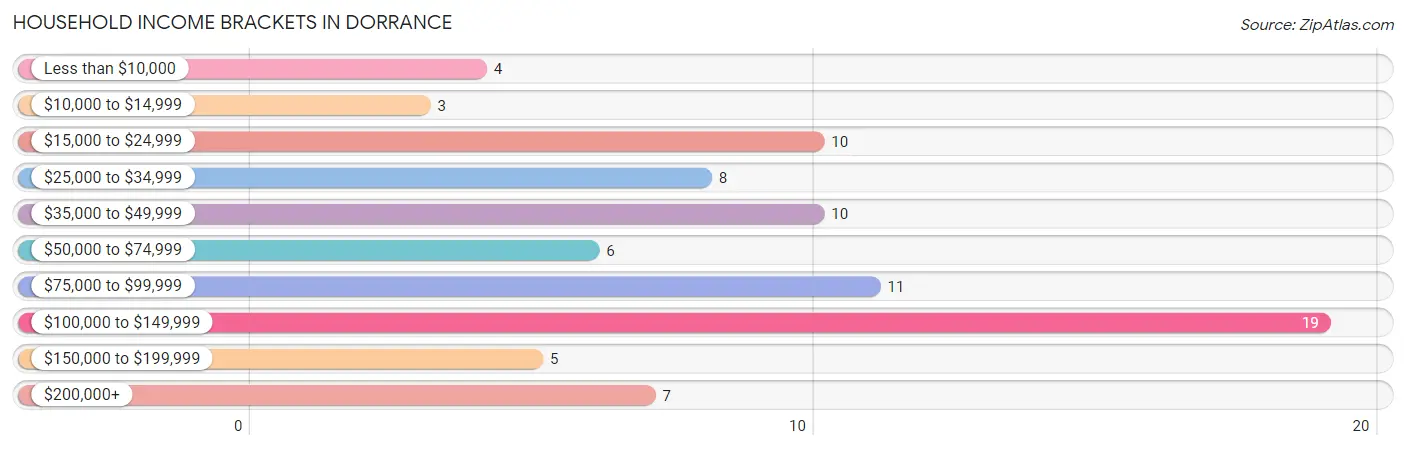
| Income Bracket | # Households | % Households |
| Less than $10,000 | 4 | 4.8% |
| $10,000 to $14,999 | 3 | 3.6% |
| $15,000 to $24,999 | 10 | 12.0% |
| $25,000 to $34,999 | 8 | 9.6% |
| $35,000 to $49,999 | 10 | 12.0% |
| $50,000 to $74,999 | 6 | 7.2% |
| $75,000 to $99,999 | 11 | 13.3% |
| $100,000 to $149,999 | 19 | 22.9% |
| $150,000 to $199,999 | 5 | 6.0% |
| $200,000+ | 7 | 8.4% |
Household Income by Householder Age in Dorrance
The median household income in Dorrance is $75,156, with the highest median household income of $75,781 found in the 65+ years age bracket for the primary householder. A total of 45 households (54.2%) fall into this category.
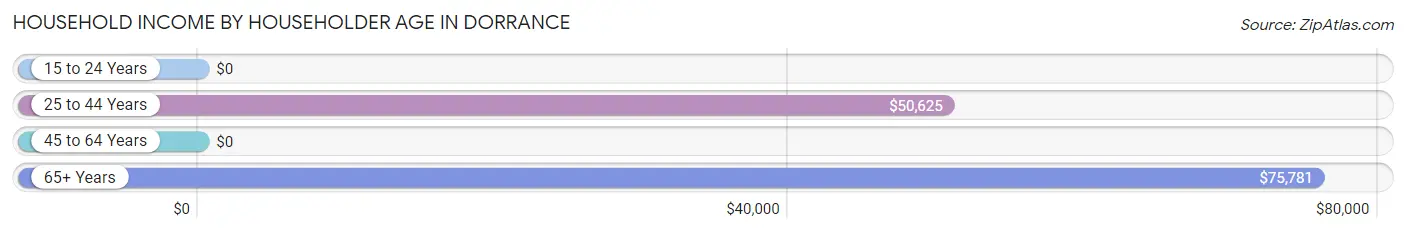
| Income Bracket | # Households | Median Income |
| 15 to 24 Years | 0 (0.0%) | $0 |
| 25 to 44 Years | 19 (22.9%) | $50,625 |
| 45 to 64 Years | 19 (22.9%) | $0 |
| 65+ Years | 45 (54.2%) | $75,781 |
| Total | 83 (100.0%) | $75,156 |
Poverty in Dorrance
Income Below Poverty by Sex and Age in Dorrance
With 1.6% poverty level for males and 10.4% for females among the residents of Dorrance, 35 to 44 year old males and 6 to 11 year old females are the most vulnerable to poverty, with 2 males (10.5%) and 1 females (100.0%) in their respective age groups living below the poverty level.
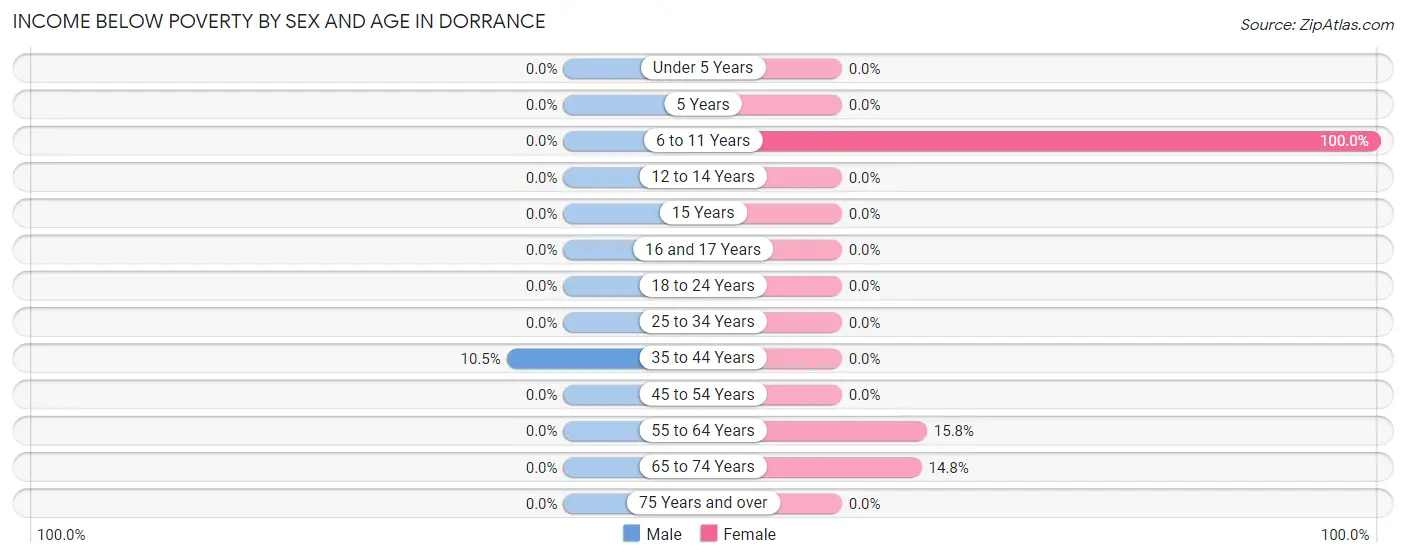
| Age Bracket | Male | Female |
| Under 5 Years | 0 (0.0%) | 0 (0.0%) |
| 5 Years | 0 (0.0%) | 0 (0.0%) |
| 6 to 11 Years | 0 (0.0%) | 1 (100.0%) |
| 12 to 14 Years | 0 (0.0%) | 0 (0.0%) |
| 15 Years | 0 (0.0%) | 0 (0.0%) |
| 16 and 17 Years | 0 (0.0%) | 0 (0.0%) |
| 18 to 24 Years | 0 (0.0%) | 0 (0.0%) |
| 25 to 34 Years | 0 (0.0%) | 0 (0.0%) |
| 35 to 44 Years | 2 (10.5%) | 0 (0.0%) |
| 45 to 54 Years | 0 (0.0%) | 0 (0.0%) |
| 55 to 64 Years | 0 (0.0%) | 3 (15.8%) |
| 65 to 74 Years | 0 (0.0%) | 4 (14.8%) |
| 75 Years and over | 0 (0.0%) | 0 (0.0%) |
| Total | 2 (1.6%) | 8 (10.4%) |
Income Above Poverty by Sex and Age in Dorrance
According to the poverty statistics in Dorrance, males aged under 5 years and females aged 5 years are the age groups that are most secure financially, with 100.0% of males and 100.0% of females in these age groups living above the poverty line.
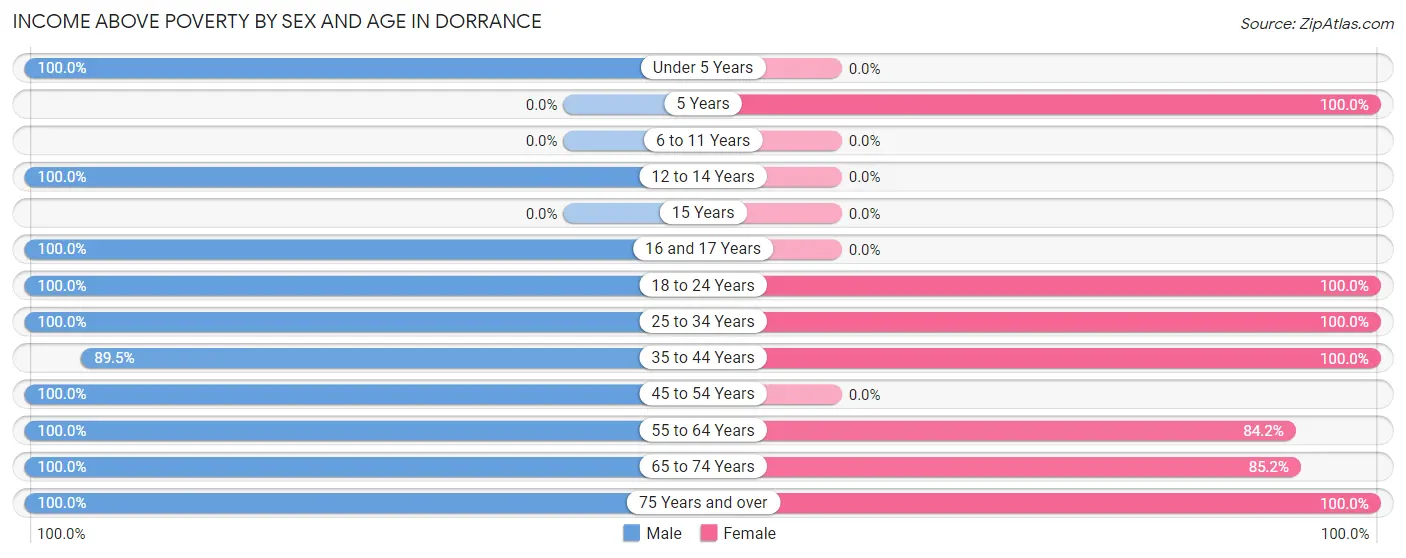
| Age Bracket | Male | Female |
| Under 5 Years | 2 (100.0%) | 0 (0.0%) |
| 5 Years | 0 (0.0%) | 1 (100.0%) |
| 6 to 11 Years | 0 (0.0%) | 0 (0.0%) |
| 12 to 14 Years | 9 (100.0%) | 0 (0.0%) |
| 15 Years | 0 (0.0%) | 0 (0.0%) |
| 16 and 17 Years | 12 (100.0%) | 0 (0.0%) |
| 18 to 24 Years | 21 (100.0%) | 10 (100.0%) |
| 25 to 34 Years | 6 (100.0%) | 6 (100.0%) |
| 35 to 44 Years | 17 (89.5%) | 7 (100.0%) |
| 45 to 54 Years | 9 (100.0%) | 0 (0.0%) |
| 55 to 64 Years | 8 (100.0%) | 16 (84.2%) |
| 65 to 74 Years | 35 (100.0%) | 23 (85.2%) |
| 75 Years and over | 7 (100.0%) | 6 (100.0%) |
| Total | 126 (98.4%) | 69 (89.6%) |
Income Below Poverty Among Married-Couple Families in Dorrance
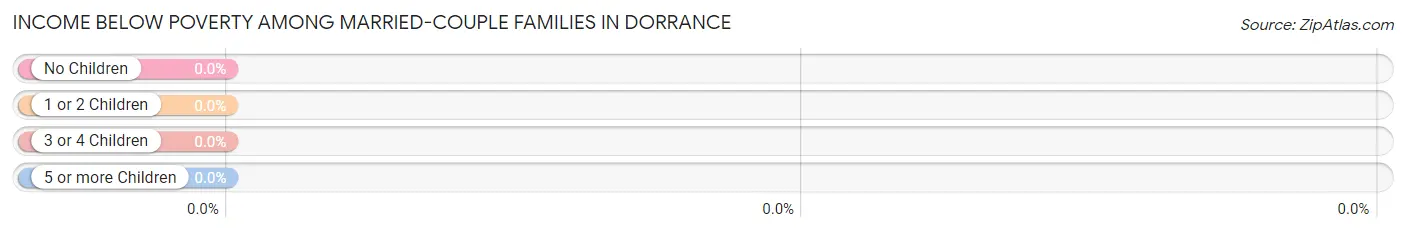
| Children | Above Poverty | Below Poverty |
| No Children | 34 (100.0%) | 0 (0.0%) |
| 1 or 2 Children | 8 (100.0%) | 0 (0.0%) |
| 3 or 4 Children | 2 (100.0%) | 0 (0.0%) |
| 5 or more Children | 0 (0.0%) | 0 (0.0%) |
| Total | 44 (100.0%) | 0 (0.0%) |
Income Below Poverty Among Single-Parent Households in Dorrance
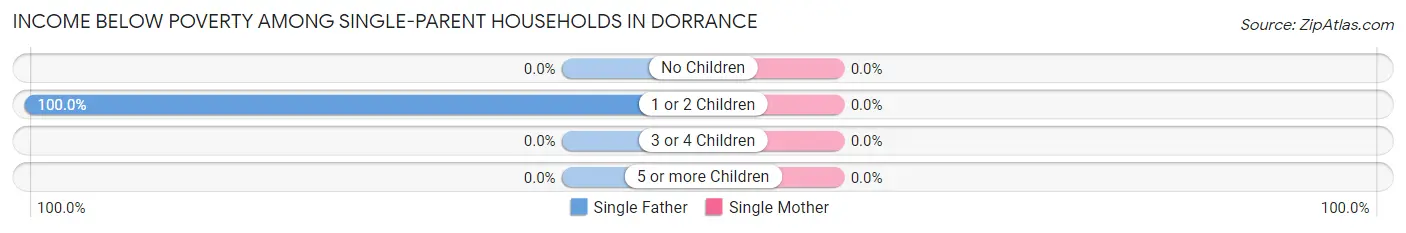
| Children | Single Father | Single Mother |
| No Children | 0 (0.0%) | 0 (0.0%) |
| 1 or 2 Children | 2 (100.0%) | 0 (0.0%) |
| 3 or 4 Children | 0 (0.0%) | 0 (0.0%) |
| 5 or more Children | 0 (0.0%) | 0 (0.0%) |
| Total | 2 (20.0%) | 0 (0.0%) |
Income Below Poverty Among Married-Couple vs Single-Parent Households in Dorrance
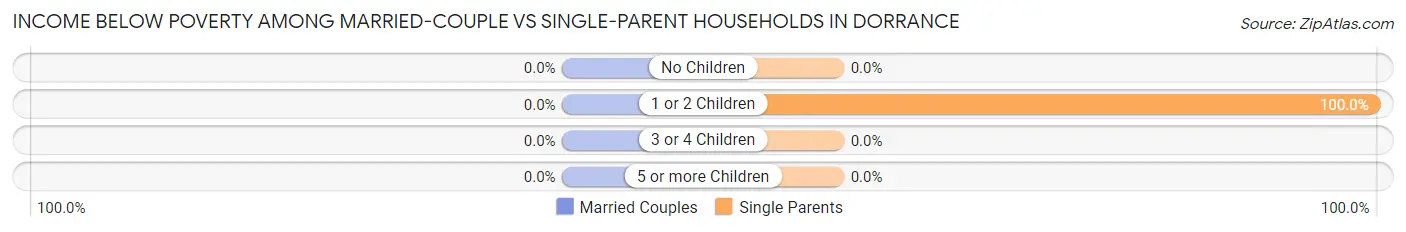
| Children | Married-Couple Families | Single-Parent Households |
| No Children | 0 (0.0%) | 0 (0.0%) |
| 1 or 2 Children | 0 (0.0%) | 2 (100.0%) |
| 3 or 4 Children | 0 (0.0%) | 0 (0.0%) |
| 5 or more Children | 0 (0.0%) | 0 (0.0%) |
| Total | 0 (0.0%) | 2 (20.0%) |
Race in Dorrance
The most populous races in Dorrance are , and White / Caucasian (205 | 100.0%).
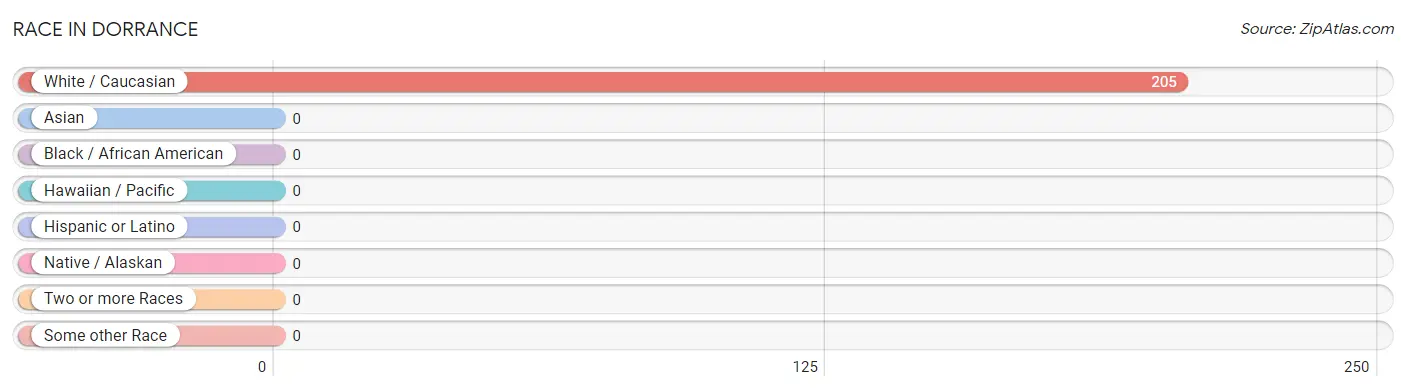
| Race | # Population | % Population |
| Asian | 0 | 0.0% |
| Black / African American | 0 | 0.0% |
| Hawaiian / Pacific | 0 | 0.0% |
| Hispanic or Latino | 0 | 0.0% |
| Native / Alaskan | 0 | 0.0% |
| White / Caucasian | 205 | 100.0% |
| Two or more Races | 0 | 0.0% |
| Some other Race | 0 | 0.0% |
| Total | 205 | 100.0% |
Ancestry in Dorrance
The most populous ancestries reported in Dorrance are German (129 | 62.9%), Irish (33 | 16.1%), American (27 | 13.2%), Czech (25 | 12.2%), and Scottish (18 | 8.8%), together accounting for 113.2% of all Dorrance residents.
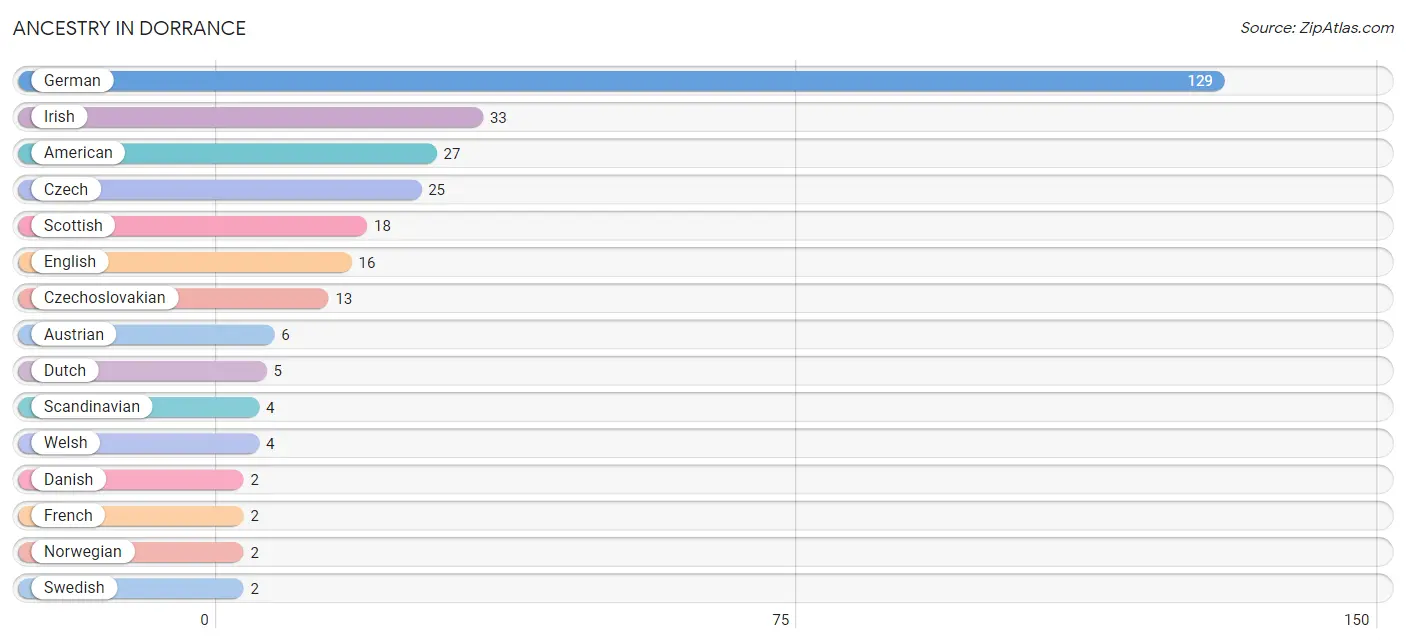
| Ancestry | # Population | % Population |
| American | 27 | 13.2% |
| Austrian | 6 | 2.9% |
| British | 1 | 0.5% |
| Czech | 25 | 12.2% |
| Czechoslovakian | 13 | 6.3% |
| Danish | 2 | 1.0% |
| Dutch | 5 | 2.4% |
| English | 16 | 7.8% |
| French | 2 | 1.0% |
| German | 129 | 62.9% |
| Irish | 33 | 16.1% |
| Norwegian | 2 | 1.0% |
| Scandinavian | 4 | 1.9% |
| Scotch-Irish | 1 | 0.5% |
| Scottish | 18 | 8.8% |
| Swedish | 2 | 1.0% |
| Swiss | 2 | 1.0% |
| Welsh | 4 | 1.9% | View All 18 Rows |
Immigrants in Dorrance

| Immigration Origin | # Population | % Population | View All 0 Rows |
Sex and Age in Dorrance
Sex and Age in Dorrance
The most populous age groups in Dorrance are 65 to 69 Years (26 | 20.3%) for men and 65 to 69 Years (26 | 33.8%) for women.
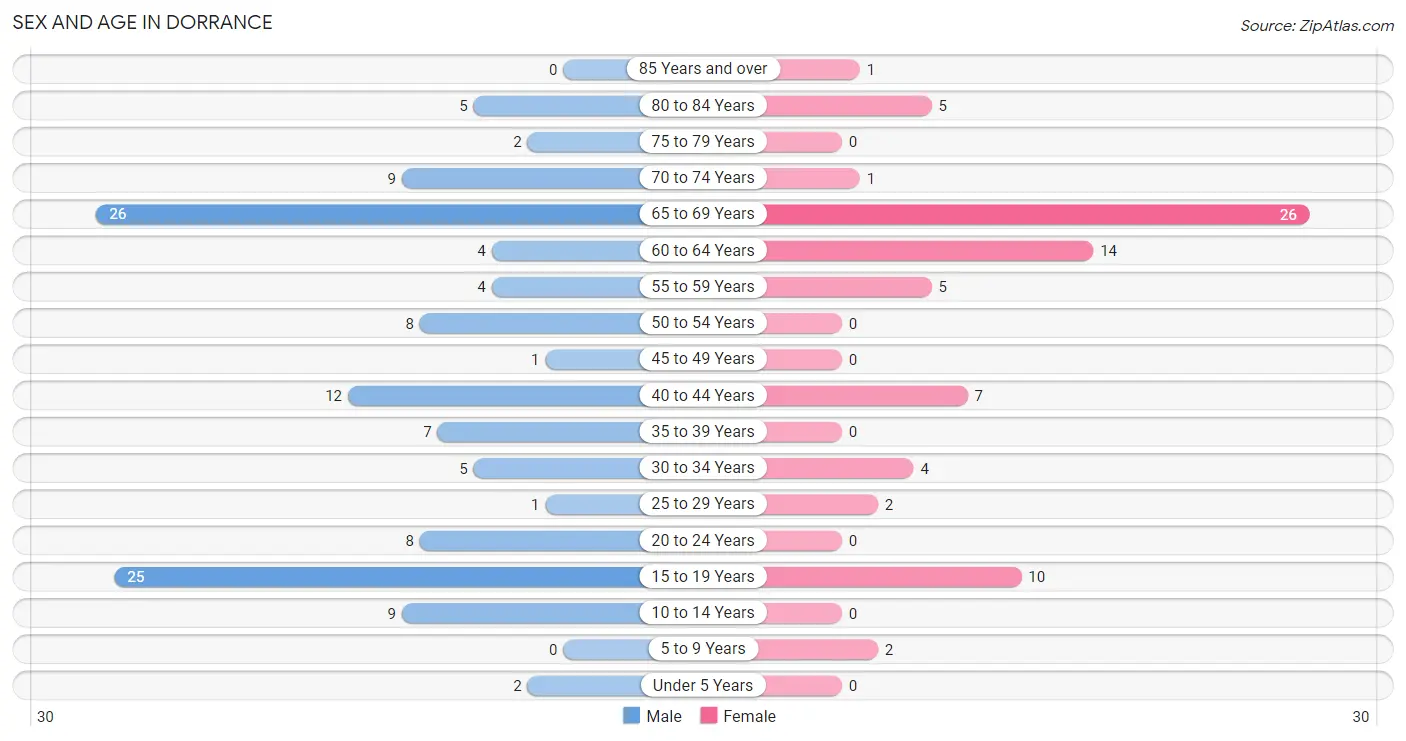
| Age Bracket | Male | Female |
| Under 5 Years | 2 (1.6%) | 0 (0.0%) |
| 5 to 9 Years | 0 (0.0%) | 2 (2.6%) |
| 10 to 14 Years | 9 (7.0%) | 0 (0.0%) |
| 15 to 19 Years | 25 (19.5%) | 10 (13.0%) |
| 20 to 24 Years | 8 (6.2%) | 0 (0.0%) |
| 25 to 29 Years | 1 (0.8%) | 2 (2.6%) |
| 30 to 34 Years | 5 (3.9%) | 4 (5.2%) |
| 35 to 39 Years | 7 (5.5%) | 0 (0.0%) |
| 40 to 44 Years | 12 (9.4%) | 7 (9.1%) |
| 45 to 49 Years | 1 (0.8%) | 0 (0.0%) |
| 50 to 54 Years | 8 (6.2%) | 0 (0.0%) |
| 55 to 59 Years | 4 (3.1%) | 5 (6.5%) |
| 60 to 64 Years | 4 (3.1%) | 14 (18.2%) |
| 65 to 69 Years | 26 (20.3%) | 26 (33.8%) |
| 70 to 74 Years | 9 (7.0%) | 1 (1.3%) |
| 75 to 79 Years | 2 (1.6%) | 0 (0.0%) |
| 80 to 84 Years | 5 (3.9%) | 5 (6.5%) |
| 85 Years and over | 0 (0.0%) | 1 (1.3%) |
| Total | 128 (100.0%) | 77 (100.0%) |
Families and Households in Dorrance
Median Family Size in Dorrance
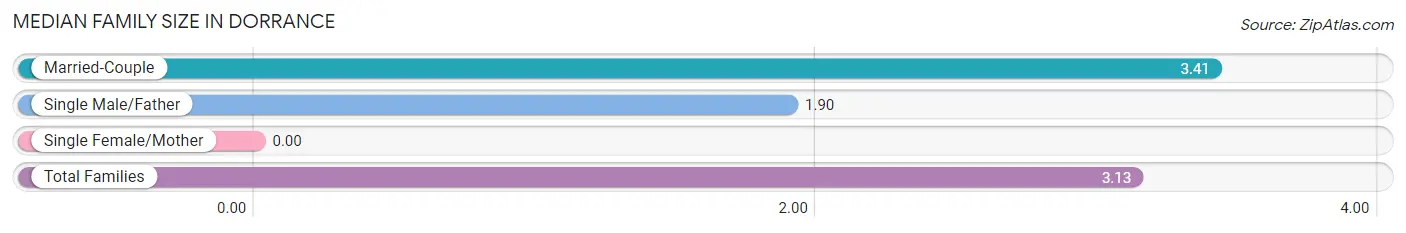
| Family Type | # Families | Family Size |
| Married-Couple | 44 (81.5%) | 3.41 |
| Single Male/Father | 10 (18.5%) | 1.90 |
| Single Female/Mother | 0 (0.0%) | - |
| Total Families | 54 (100.0%) | 3.13 |
Median Household Size in Dorrance
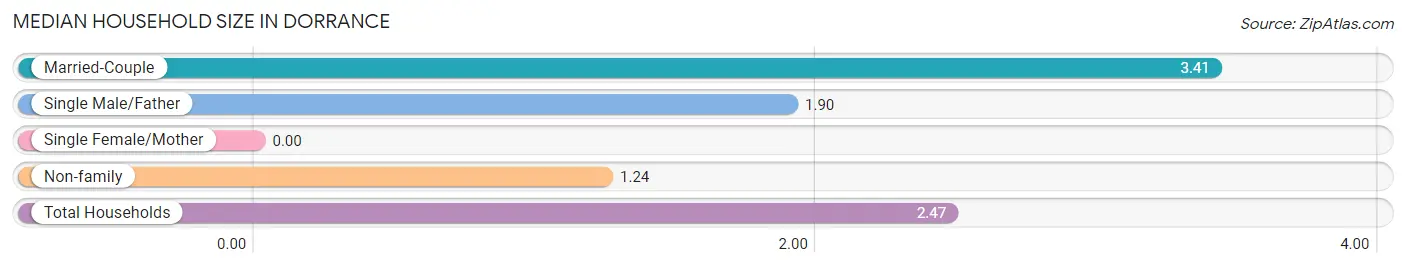
| Household Type | # Households | Household Size |
| Married-Couple | 44 (53.0%) | 3.41 |
| Single Male/Father | 10 (12.0%) | 1.90 |
| Single Female/Mother | 0 (0.0%) | - |
| Non-family | 29 (34.9%) | 1.24 |
| Total Households | 83 (100.0%) | 2.47 |
Household Size by Marriage Status in Dorrance
Out of a total of 83 households in Dorrance, 54 (65.1%) are family households, while 29 (34.9%) are nonfamily households. The most numerous type of family households are 2-person households, comprising 36, and the most common type of nonfamily households are 1-person households, comprising 24.
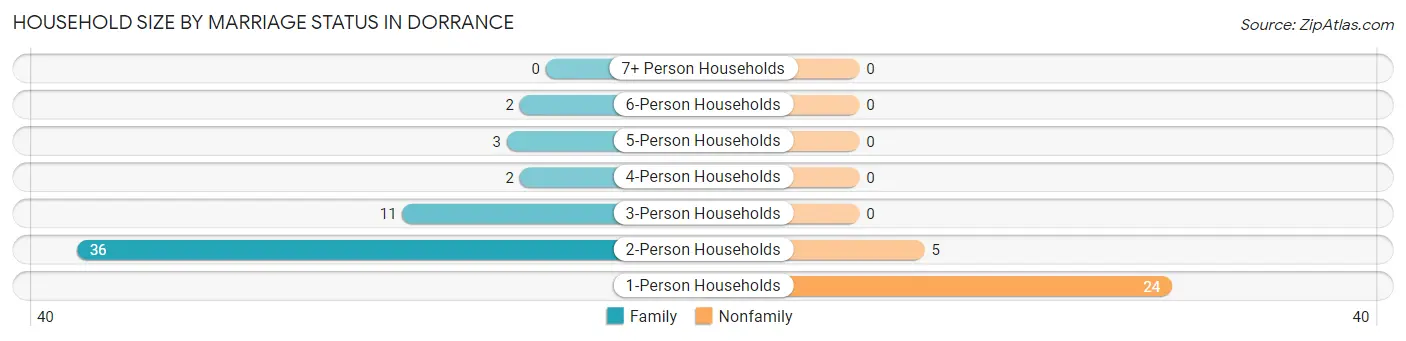
| Household Size | Family Households | Nonfamily Households |
| 1-Person Households | - | 24 (28.9%) |
| 2-Person Households | 36 (43.4%) | 5 (6.0%) |
| 3-Person Households | 11 (13.3%) | 0 (0.0%) |
| 4-Person Households | 2 (2.4%) | 0 (0.0%) |
| 5-Person Households | 3 (3.6%) | 0 (0.0%) |
| 6-Person Households | 2 (2.4%) | 0 (0.0%) |
| 7+ Person Households | 0 (0.0%) | 0 (0.0%) |
| Total | 54 (65.1%) | 29 (34.9%) |
Female Fertility in Dorrance
Fertility by Age in Dorrance
Average fertility rate in Dorrance is 43.0 births per 1,000 women. Women in the age bracket of 20 to 34 years have the highest fertility rate with 167.0 births per 1,000 women. Women in the age bracket of 20 to 34 years acount for 100.0% of all women with births.
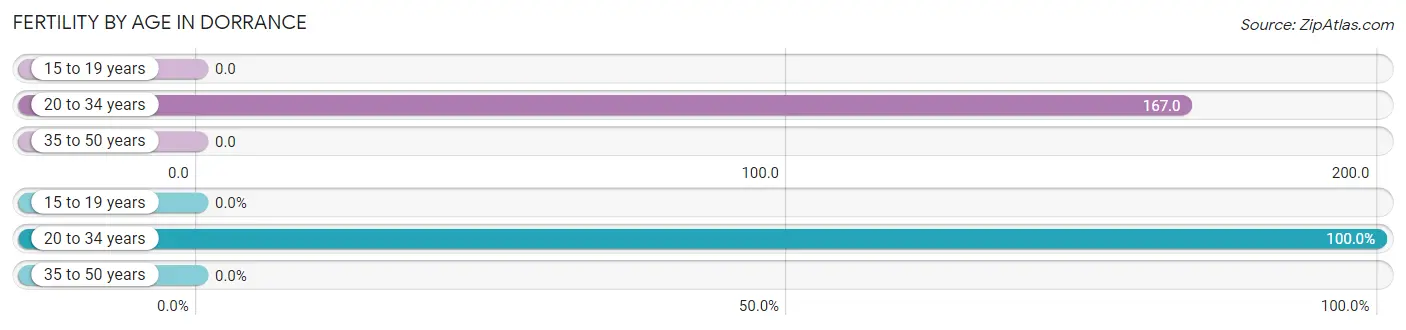
| Age Bracket | Women with Births | Births / 1,000 Women |
| 15 to 19 years | 0 (0.0%) | 0.0 |
| 20 to 34 years | 1 (100.0%) | 167.0 |
| 35 to 50 years | 0 (0.0%) | 0.0 |
| Total | 1 (100.0%) | 43.0 |
Fertility by Age by Marriage Status in Dorrance
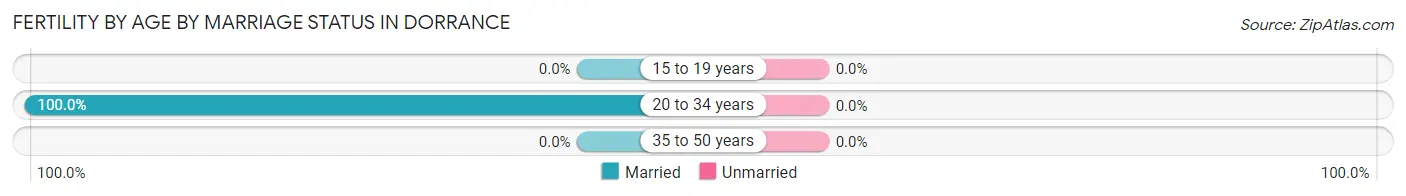
| Age Bracket | Married | Unmarried |
| 15 to 19 years | 0 (0.0%) | 0 (0.0%) |
| 20 to 34 years | 1 (100.0%) | 0 (0.0%) |
| 35 to 50 years | 0 (0.0%) | 0 (0.0%) |
| Total | 1 (100.0%) | 0 (0.0%) |
Fertility by Education in Dorrance
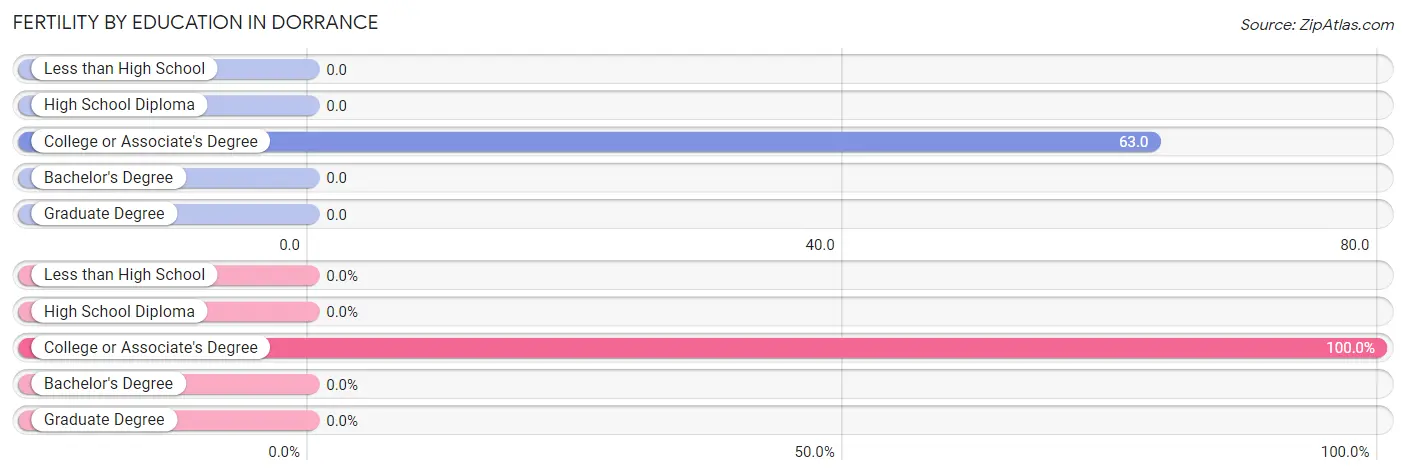
| Educational Attainment | Women with Births | Births / 1,000 Women |
| Less than High School | 0 (0.0%) | 0.0 |
| High School Diploma | 0 (0.0%) | 0.0 |
| College or Associate's Degree | 1 (100.0%) | 63.0 |
| Bachelor's Degree | 0 (0.0%) | 0.0 |
| Graduate Degree | 0 (0.0%) | 0.0 |
| Total | 1 (100.0%) | 43.0 |
Fertility by Education by Marriage Status in Dorrance
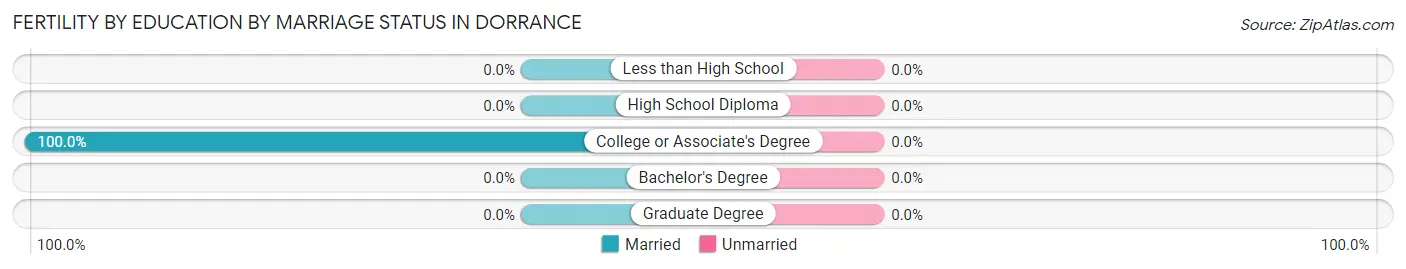
| Educational Attainment | Married | Unmarried |
| Less than High School | 0 (0.0%) | 0 (0.0%) |
| High School Diploma | 0 (0.0%) | 0 (0.0%) |
| College or Associate's Degree | 1 (100.0%) | 0 (0.0%) |
| Bachelor's Degree | 0 (0.0%) | 0 (0.0%) |
| Graduate Degree | 0 (0.0%) | 0 (0.0%) |
| Total | 1 (100.0%) | 0 (0.0%) |
Employment Characteristics in Dorrance
Employment by Class of Employer in Dorrance
Among the 102 employed individuals in Dorrance, private company employees (56 | 54.9%), local government employees (23 | 22.6%), and not-for-profit organizations (11 | 10.8%) make up the most common classes of employment.
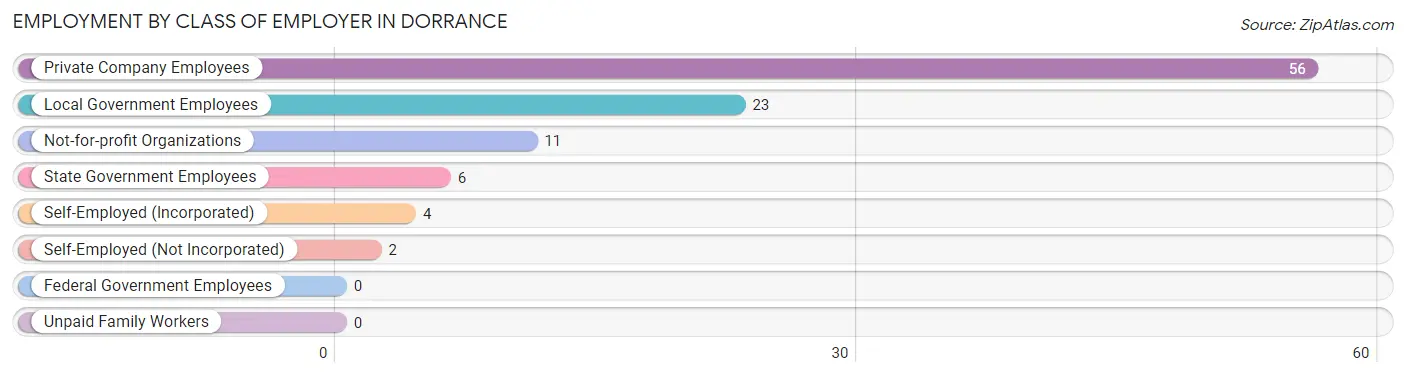
| Employer Class | # Employees | % Employees |
| Private Company Employees | 56 | 54.9% |
| Self-Employed (Incorporated) | 4 | 3.9% |
| Self-Employed (Not Incorporated) | 2 | 2.0% |
| Not-for-profit Organizations | 11 | 10.8% |
| Local Government Employees | 23 | 22.6% |
| State Government Employees | 6 | 5.9% |
| Federal Government Employees | 0 | 0.0% |
| Unpaid Family Workers | 0 | 0.0% |
| Total | 102 | 100.0% |
Employment Status by Age in Dorrance
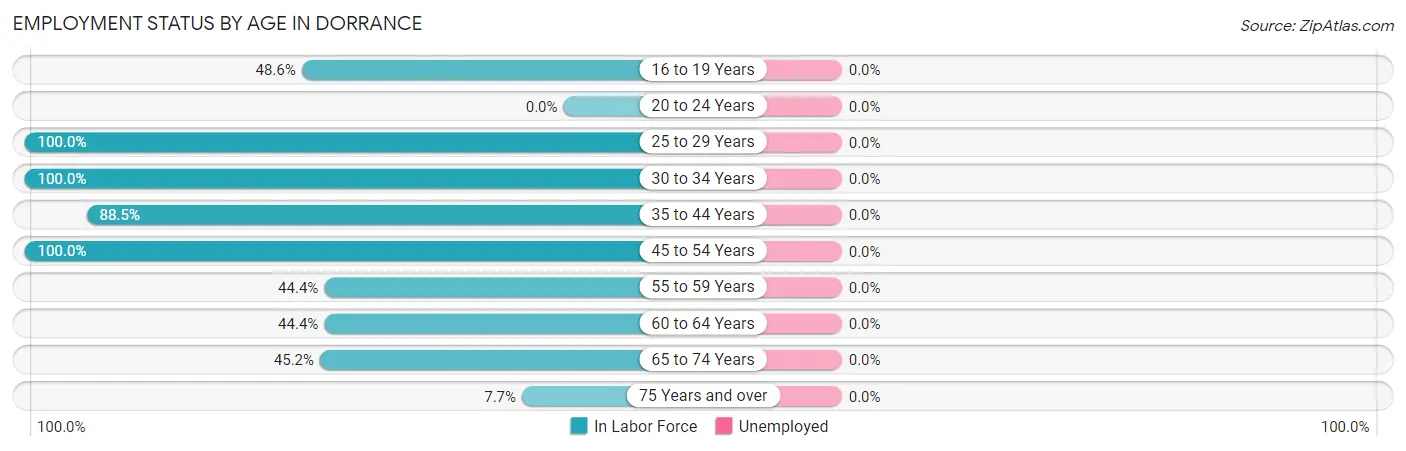
| Age Bracket | In Labor Force | Unemployed |
| 16 to 19 Years | 17 (48.6%) | 0 (0.0%) |
| 20 to 24 Years | 0 (0.0%) | 0 (0.0%) |
| 25 to 29 Years | 3 (100.0%) | 0 (0.0%) |
| 30 to 34 Years | 9 (100.0%) | 0 (0.0%) |
| 35 to 44 Years | 23 (88.5%) | 0 (0.0%) |
| 45 to 54 Years | 9 (100.0%) | 0 (0.0%) |
| 55 to 59 Years | 4 (44.4%) | 0 (0.0%) |
| 60 to 64 Years | 8 (44.4%) | 0 (0.0%) |
| 65 to 74 Years | 28 (45.2%) | 0 (0.0%) |
| 75 Years and over | 1 (7.7%) | 0 (0.0%) |
| Total | 102 (53.1%) | 0 (0.0%) |
Employment Status by Educational Attainment in Dorrance
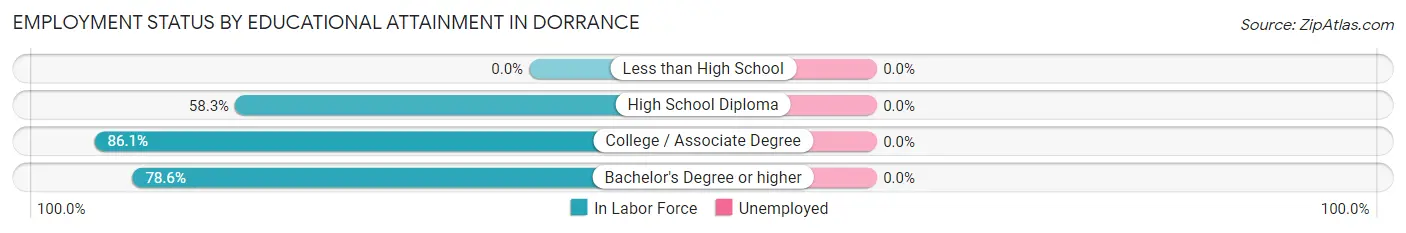
| Educational Attainment | In Labor Force | Unemployed |
| Less than High School | 0 (0.0%) | 0 (0.0%) |
| High School Diploma | 14 (58.3%) | 0 (0.0%) |
| College / Associate Degree | 31 (86.1%) | 0 (0.0%) |
| Bachelor's Degree or higher | 11 (78.6%) | 0 (0.0%) |
| Total | 56 (75.7%) | 0 (0.0%) |
Employment Occupations by Sex in Dorrance
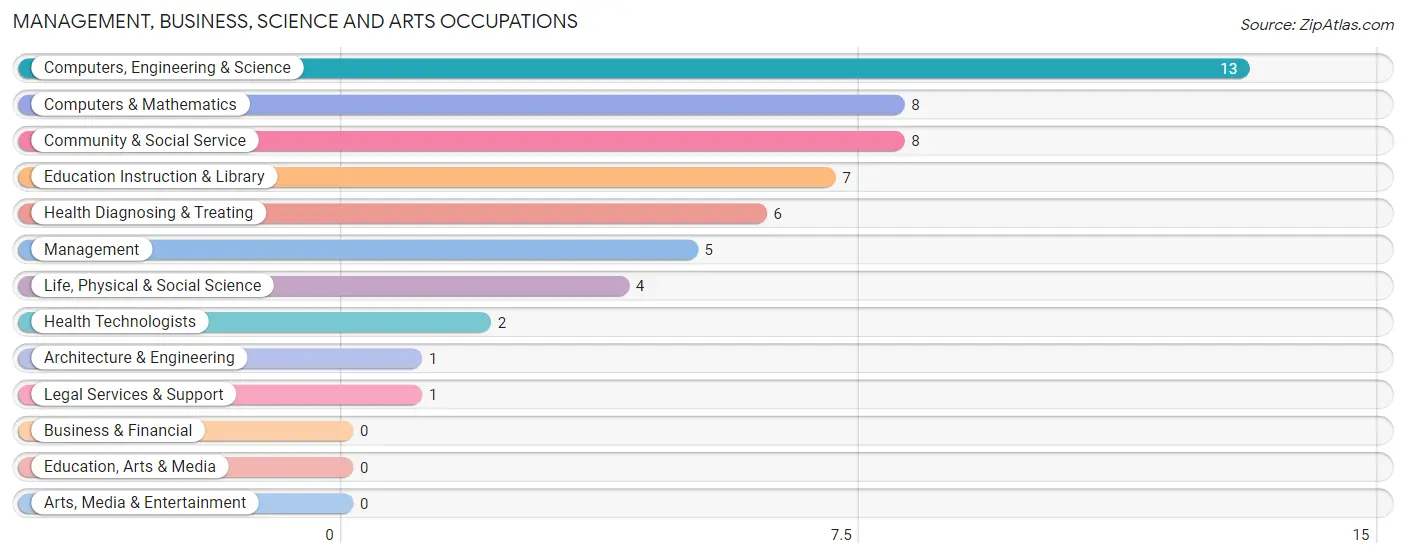
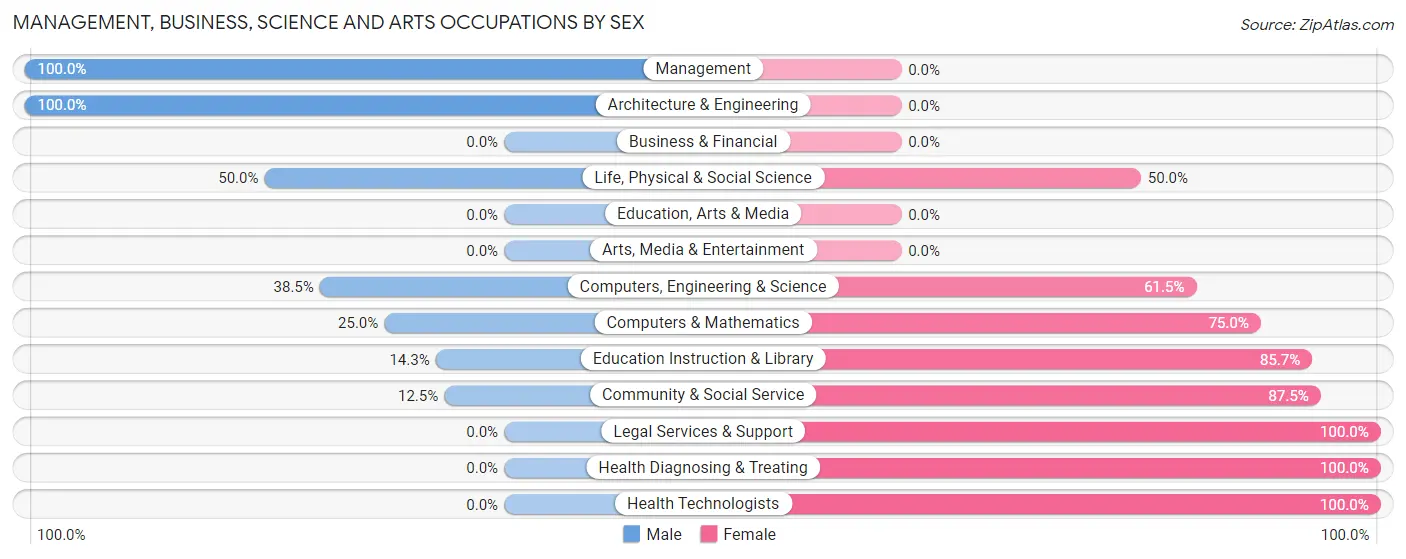
Management, Business, Science and Arts Occupations
The most common Management, Business, Science and Arts occupations in Dorrance are Computers, Engineering & Science (13 | 12.8%), Computers & Mathematics (8 | 7.8%), Community & Social Service (8 | 7.8%), Education Instruction & Library (7 | 6.9%), and Health Diagnosing & Treating (6 | 5.9%).
Management, Business, Science and Arts Occupations by Sex
Within the Management, Business, Science and Arts occupations in Dorrance, the most male-oriented occupations are Management (100.0%), Architecture & Engineering (100.0%), and Life, Physical & Social Science (50.0%), while the most female-oriented occupations are Legal Services & Support (100.0%), Health Diagnosing & Treating (100.0%), and Health Technologists (100.0%).
| Occupation | Male | Female |
| Management | 5 (100.0%) | 0 (0.0%) |
| Business & Financial | 0 (0.0%) | 0 (0.0%) |
| Computers, Engineering & Science | 5 (38.5%) | 8 (61.5%) |
| Computers & Mathematics | 2 (25.0%) | 6 (75.0%) |
| Architecture & Engineering | 1 (100.0%) | 0 (0.0%) |
| Life, Physical & Social Science | 2 (50.0%) | 2 (50.0%) |
| Community & Social Service | 1 (12.5%) | 7 (87.5%) |
| Education, Arts & Media | 0 (0.0%) | 0 (0.0%) |
| Legal Services & Support | 0 (0.0%) | 1 (100.0%) |
| Education Instruction & Library | 1 (14.3%) | 6 (85.7%) |
| Arts, Media & Entertainment | 0 (0.0%) | 0 (0.0%) |
| Health Diagnosing & Treating | 0 (0.0%) | 6 (100.0%) |
| Health Technologists | 0 (0.0%) | 2 (100.0%) |
| Total (Category) | 11 (34.4%) | 21 (65.6%) |
| Total (Overall) | 63 (61.8%) | 39 (38.2%) |
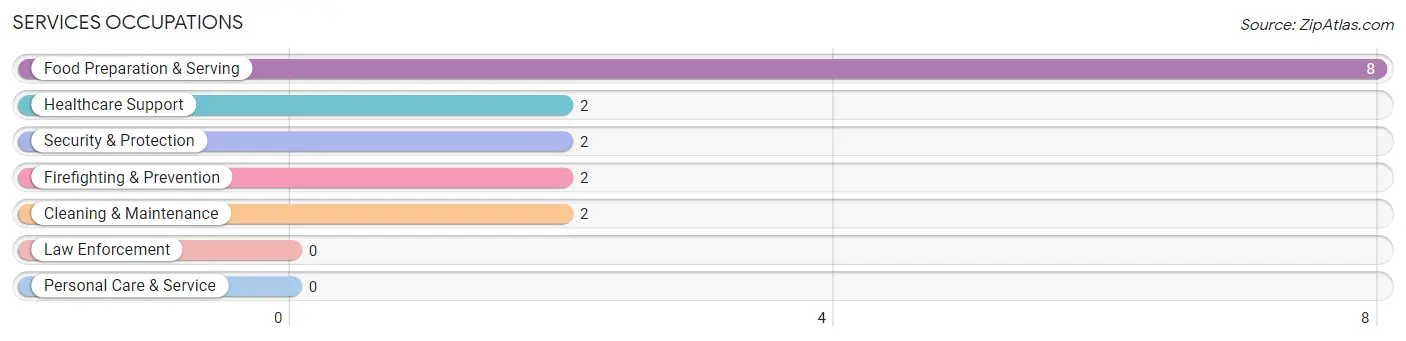
Services Occupations
The most common Services occupations in Dorrance are Food Preparation & Serving (8 | 7.8%), Healthcare Support (2 | 2.0%), Security & Protection (2 | 2.0%), Firefighting & Prevention (2 | 2.0%), and Cleaning & Maintenance (2 | 2.0%).
Services Occupations by Sex
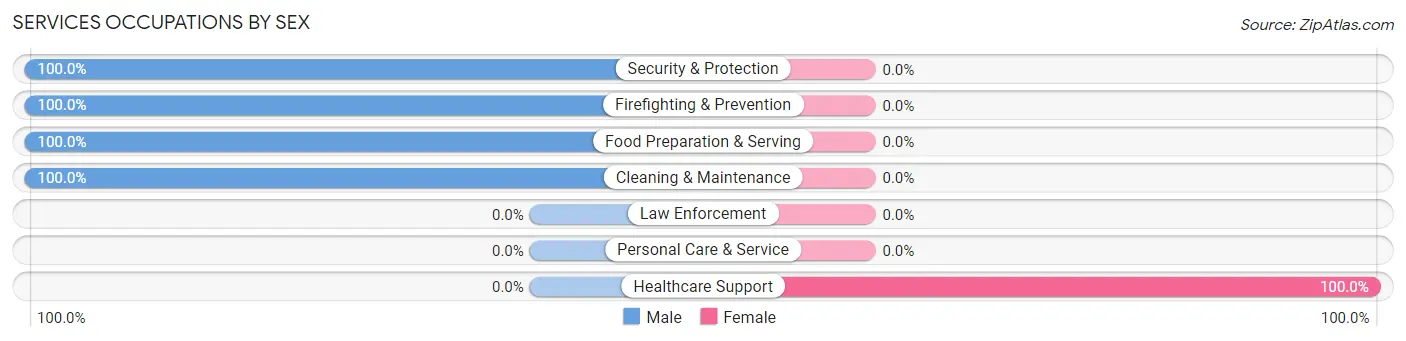
| Occupation | Male | Female |
| Healthcare Support | 0 (0.0%) | 2 (100.0%) |
| Security & Protection | 2 (100.0%) | 0 (0.0%) |
| Firefighting & Prevention | 2 (100.0%) | 0 (0.0%) |
| Law Enforcement | 0 (0.0%) | 0 (0.0%) |
| Food Preparation & Serving | 8 (100.0%) | 0 (0.0%) |
| Cleaning & Maintenance | 2 (100.0%) | 0 (0.0%) |
| Personal Care & Service | 0 (0.0%) | 0 (0.0%) |
| Total (Category) | 12 (85.7%) | 2 (14.3%) |
| Total (Overall) | 63 (61.8%) | 39 (38.2%) |
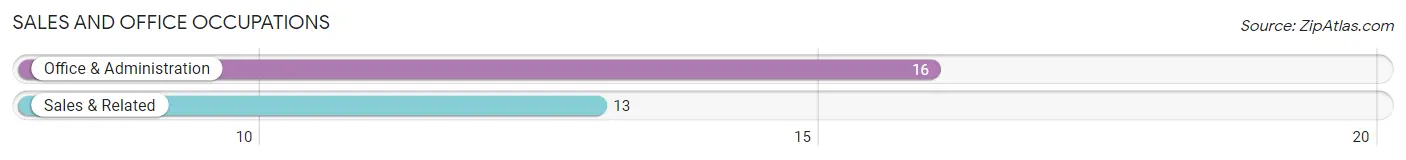
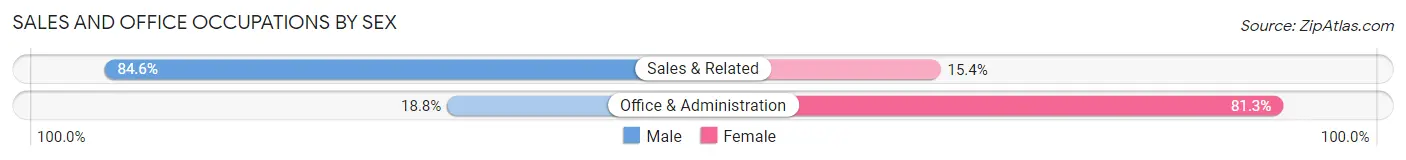
Sales and Office Occupations
The most common Sales and Office occupations in Dorrance are Office & Administration (16 | 15.7%), and Sales & Related (13 | 12.8%).
Sales and Office Occupations by Sex
| Occupation | Male | Female |
| Sales & Related | 11 (84.6%) | 2 (15.4%) |
| Office & Administration | 3 (18.8%) | 13 (81.2%) |
| Total (Category) | 14 (48.3%) | 15 (51.7%) |
| Total (Overall) | 63 (61.8%) | 39 (38.2%) |
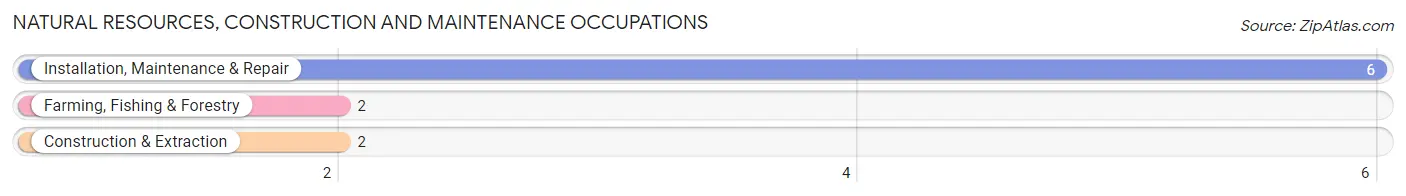
Natural Resources, Construction and Maintenance Occupations
The most common Natural Resources, Construction and Maintenance occupations in Dorrance are Installation, Maintenance & Repair (6 | 5.9%), Farming, Fishing & Forestry (2 | 2.0%), and Construction & Extraction (2 | 2.0%).
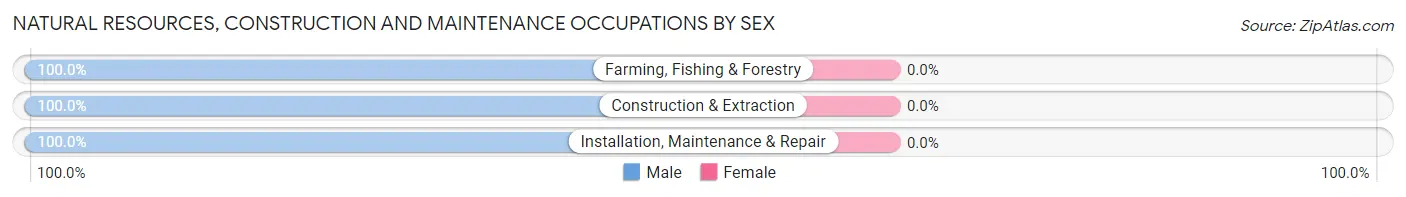
Natural Resources, Construction and Maintenance Occupations by Sex
| Occupation | Male | Female |
| Farming, Fishing & Forestry | 2 (100.0%) | 0 (0.0%) |
| Construction & Extraction | 2 (100.0%) | 0 (0.0%) |
| Installation, Maintenance & Repair | 6 (100.0%) | 0 (0.0%) |
| Total (Category) | 10 (100.0%) | 0 (0.0%) |
| Total (Overall) | 63 (61.8%) | 39 (38.2%) |
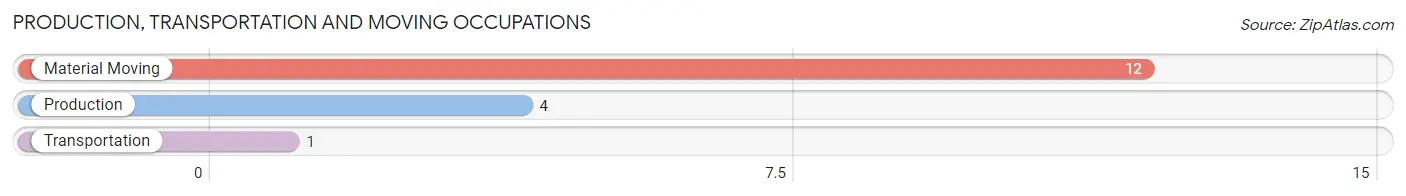
Production, Transportation and Moving Occupations
The most common Production, Transportation and Moving occupations in Dorrance are Material Moving (12 | 11.8%), Production (4 | 3.9%), and Transportation (1 | 1.0%).
Production, Transportation and Moving Occupations by Sex
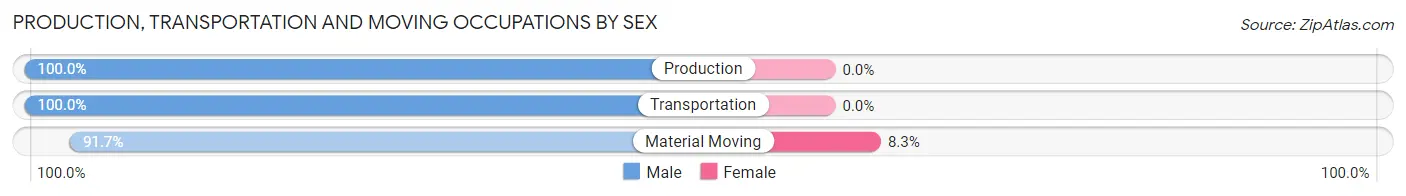
| Occupation | Male | Female |
| Production | 4 (100.0%) | 0 (0.0%) |
| Transportation | 1 (100.0%) | 0 (0.0%) |
| Material Moving | 11 (91.7%) | 1 (8.3%) |
| Total (Category) | 16 (94.1%) | 1 (5.9%) |
| Total (Overall) | 63 (61.8%) | 39 (38.2%) |
Employment Industries by Sex in Dorrance
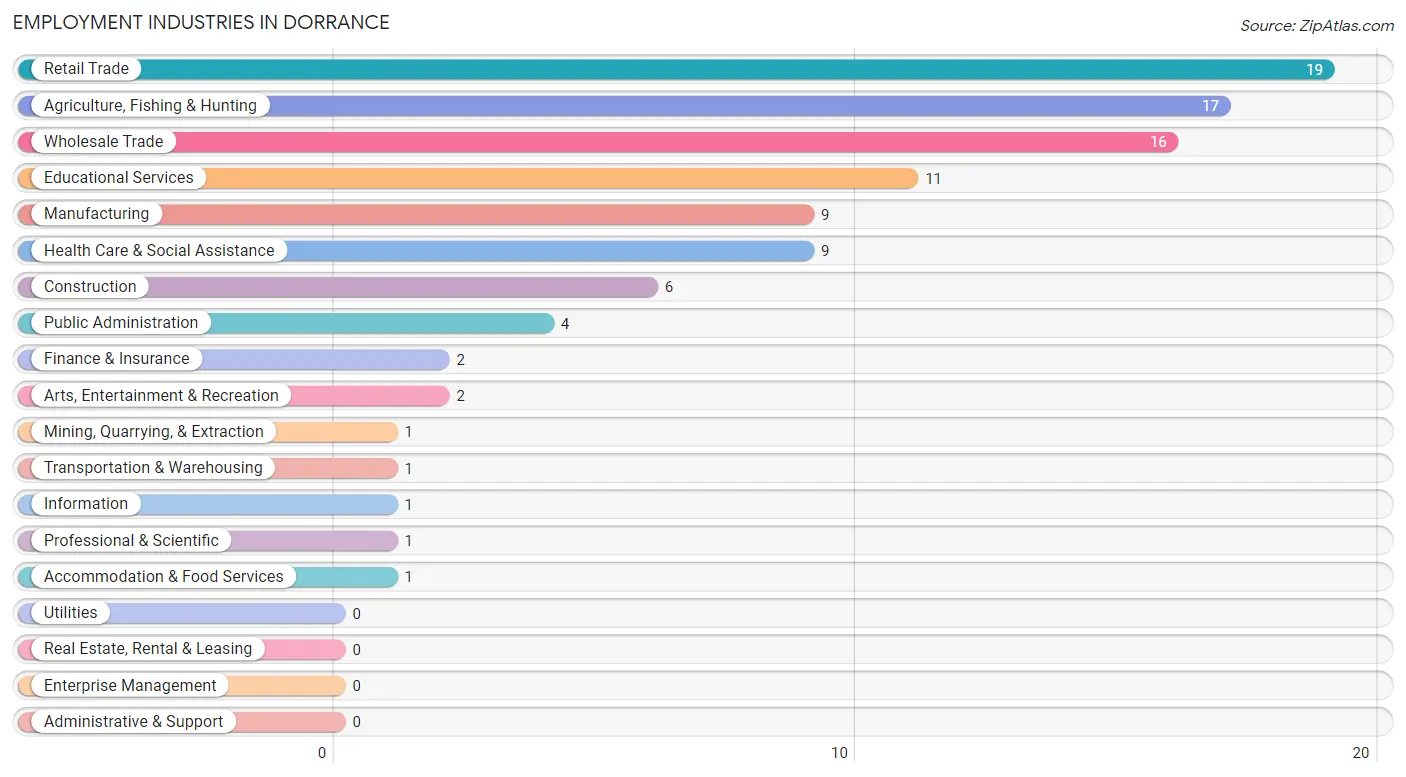
Employment Industries in Dorrance
The major employment industries in Dorrance include Retail Trade (19 | 18.6%), Agriculture, Fishing & Hunting (17 | 16.7%), Wholesale Trade (16 | 15.7%), Educational Services (11 | 10.8%), and Manufacturing (9 | 8.8%).
Employment Industries by Sex in Dorrance
The Dorrance industries that see more men than women are Construction (100.0%), Manufacturing (100.0%), and Wholesale Trade (100.0%), whereas the industries that tend to have a higher number of women are Mining, Quarrying, & Extraction (100.0%), Finance & Insurance (100.0%), and Professional & Scientific (100.0%).
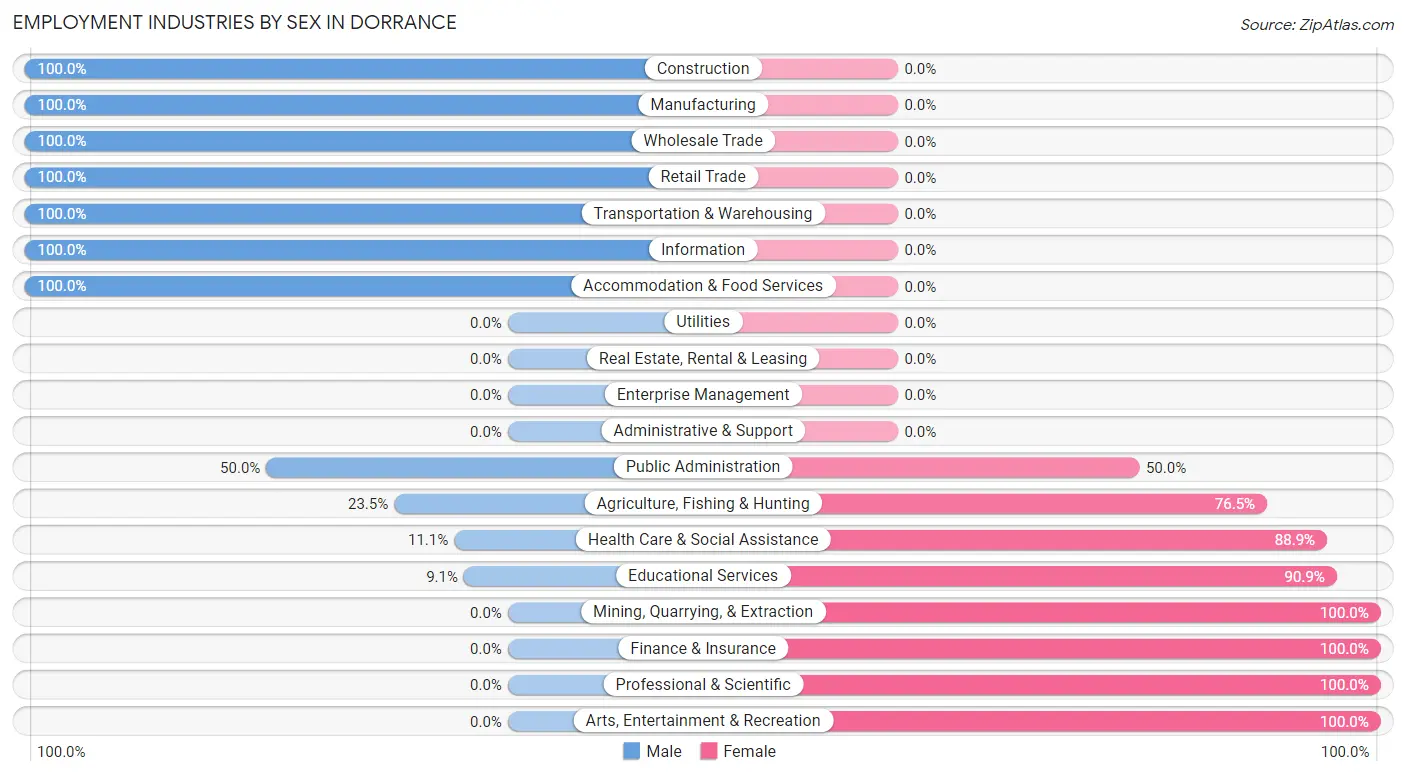
| Industry | Male | Female |
| Agriculture, Fishing & Hunting | 4 (23.5%) | 13 (76.5%) |
| Mining, Quarrying, & Extraction | 0 (0.0%) | 1 (100.0%) |
| Construction | 6 (100.0%) | 0 (0.0%) |
| Manufacturing | 9 (100.0%) | 0 (0.0%) |
| Wholesale Trade | 16 (100.0%) | 0 (0.0%) |
| Retail Trade | 19 (100.0%) | 0 (0.0%) |
| Transportation & Warehousing | 1 (100.0%) | 0 (0.0%) |
| Utilities | 0 (0.0%) | 0 (0.0%) |
| Information | 1 (100.0%) | 0 (0.0%) |
| Finance & Insurance | 0 (0.0%) | 2 (100.0%) |
| Real Estate, Rental & Leasing | 0 (0.0%) | 0 (0.0%) |
| Professional & Scientific | 0 (0.0%) | 1 (100.0%) |
| Enterprise Management | 0 (0.0%) | 0 (0.0%) |
| Administrative & Support | 0 (0.0%) | 0 (0.0%) |
| Educational Services | 1 (9.1%) | 10 (90.9%) |
| Health Care & Social Assistance | 1 (11.1%) | 8 (88.9%) |
| Arts, Entertainment & Recreation | 0 (0.0%) | 2 (100.0%) |
| Accommodation & Food Services | 1 (100.0%) | 0 (0.0%) |
| Public Administration | 2 (50.0%) | 2 (50.0%) |
| Total | 63 (61.8%) | 39 (38.2%) |
Education in Dorrance
School Enrollment in Dorrance
The most common levels of schooling among the 48 students in Dorrance are high school (27 | 56.2%), college / undergraduate (15 | 31.2%), and middle school (4 | 8.3%).
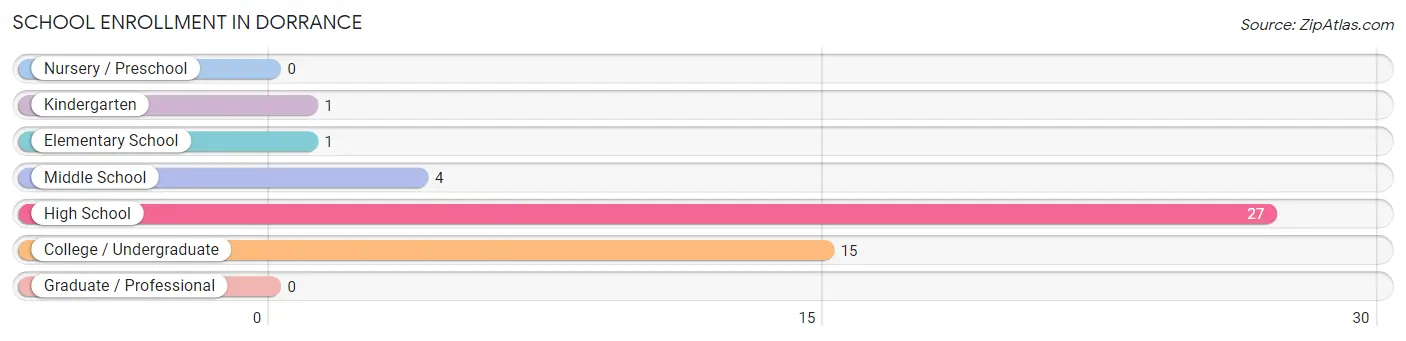
| School Level | # Students | % Students |
| Nursery / Preschool | 0 | 0.0% |
| Kindergarten | 1 | 2.1% |
| Elementary School | 1 | 2.1% |
| Middle School | 4 | 8.3% |
| High School | 27 | 56.2% |
| College / Undergraduate | 15 | 31.2% |
| Graduate / Professional | 0 | 0.0% |
| Total | 48 | 100.0% |
School Enrollment by Age by Funding Source in Dorrance
Out of a total of 48 students who are enrolled in schools in Dorrance, 10 (20.8%) attend a private institution, while the remaining 38 (79.2%) are enrolled in public schools. The age group of 18 to 19 year olds has the highest likelihood of being enrolled in private schools, with 10 (71.4% in the age bracket) enrolled. Conversely, the age group of 5 to 9 year old has the lowest likelihood of being enrolled in a private school, with 2 (100.0% in the age bracket) attending a public institution.
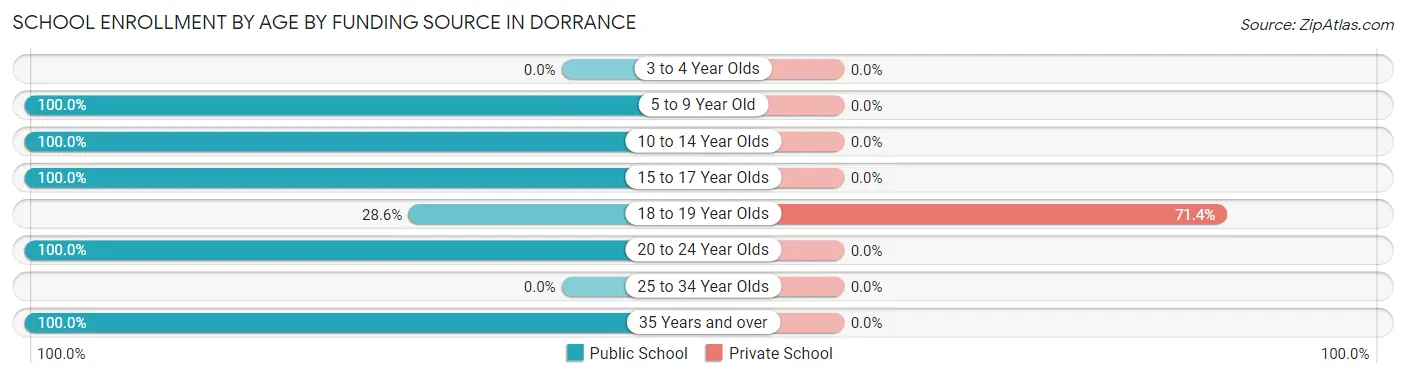
| Age Bracket | Public School | Private School |
| 3 to 4 Year Olds | 0 (0.0%) | 0 (0.0%) |
| 5 to 9 Year Old | 2 (100.0%) | 0 (0.0%) |
| 10 to 14 Year Olds | 9 (100.0%) | 0 (0.0%) |
| 15 to 17 Year Olds | 12 (100.0%) | 0 (0.0%) |
| 18 to 19 Year Olds | 4 (28.6%) | 10 (71.4%) |
| 20 to 24 Year Olds | 8 (100.0%) | 0 (0.0%) |
| 25 to 34 Year Olds | 0 (0.0%) | 0 (0.0%) |
| 35 Years and over | 3 (100.0%) | 0 (0.0%) |
| Total | 38 (79.2%) | 10 (20.8%) |
Educational Attainment by Field of Study in Dorrance
Bio, nature & agricultural (9 | 25.0%), business (6 | 16.7%), education (6 | 16.7%), computers & mathematics (5 | 13.9%), and physical & health sciences (5 | 13.9%) are the most common fields of study among 36 individuals in Dorrance who have obtained a bachelor's degree or higher.
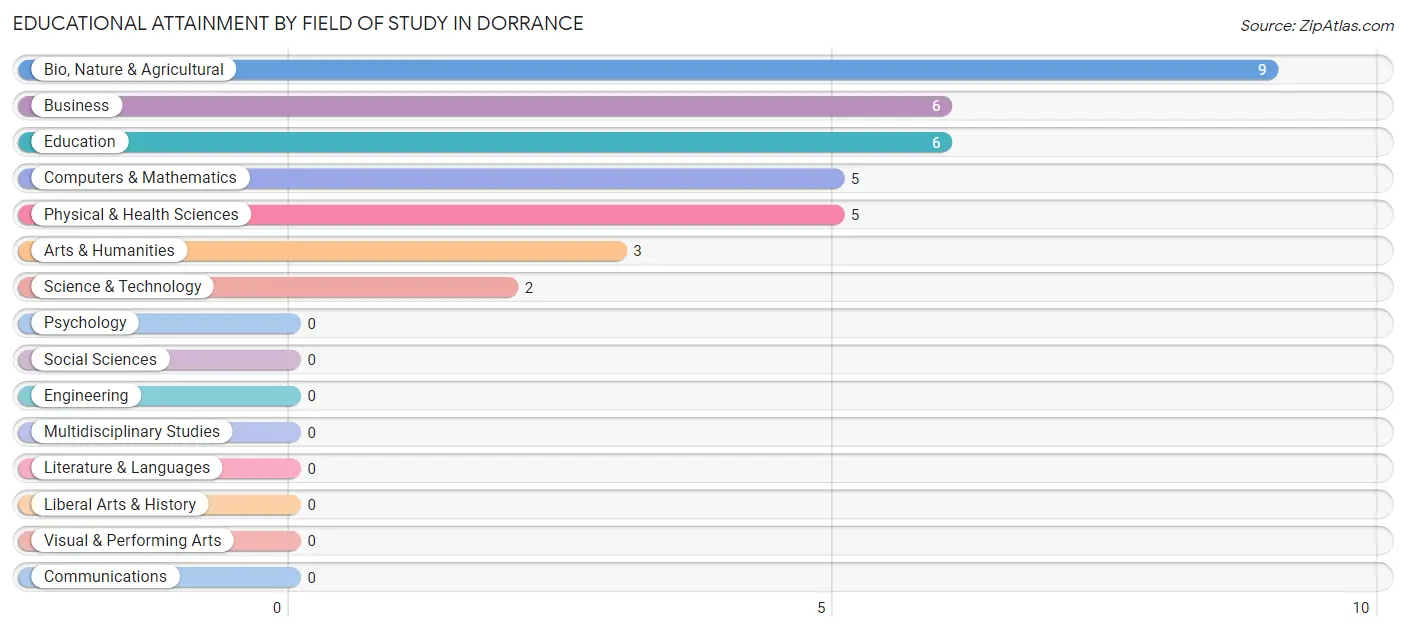
| Field of Study | # Graduates | % Graduates |
| Computers & Mathematics | 5 | 13.9% |
| Bio, Nature & Agricultural | 9 | 25.0% |
| Physical & Health Sciences | 5 | 13.9% |
| Psychology | 0 | 0.0% |
| Social Sciences | 0 | 0.0% |
| Engineering | 0 | 0.0% |
| Multidisciplinary Studies | 0 | 0.0% |
| Science & Technology | 2 | 5.6% |
| Business | 6 | 16.7% |
| Education | 6 | 16.7% |
| Literature & Languages | 0 | 0.0% |
| Liberal Arts & History | 0 | 0.0% |
| Visual & Performing Arts | 0 | 0.0% |
| Communications | 0 | 0.0% |
| Arts & Humanities | 3 | 8.3% |
| Total | 36 | 100.0% |
Transportation & Commute in Dorrance
Vehicle Availability by Sex in Dorrance
The most prevalent vehicle ownership categories in Dorrance are males with 3 vehicles (41, accounting for 65.1%) and females with 3 vehicles (5, making up 105.1%).
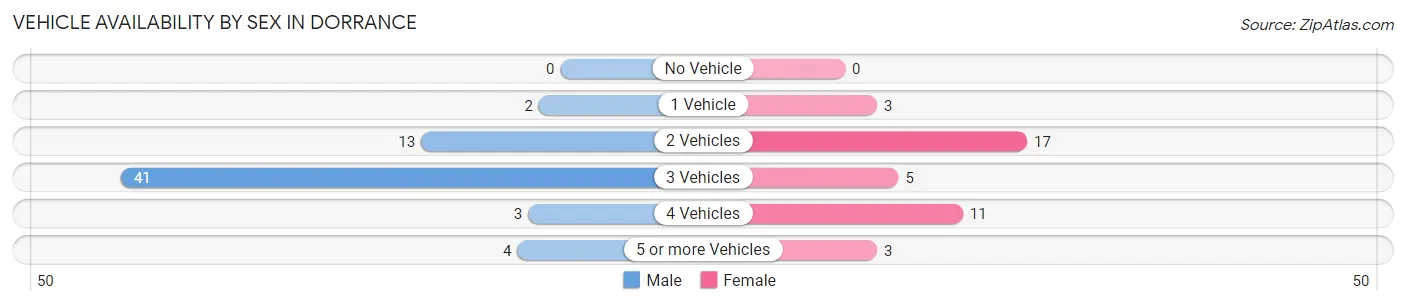
| Vehicles Available | Male | Female |
| No Vehicle | 0 (0.0%) | 0 (0.0%) |
| 1 Vehicle | 2 (3.2%) | 3 (7.7%) |
| 2 Vehicles | 13 (20.6%) | 17 (43.6%) |
| 3 Vehicles | 41 (65.1%) | 5 (12.8%) |
| 4 Vehicles | 3 (4.8%) | 11 (28.2%) |
| 5 or more Vehicles | 4 (6.4%) | 3 (7.7%) |
| Total | 63 (100.0%) | 39 (100.0%) |
Commute Time in Dorrance
The most frequently occuring commute durations in Dorrance are 20 to 24 minutes (26 commuters, 25.5%), 10 to 14 minutes (14 commuters, 13.7%), and 15 to 19 minutes (14 commuters, 13.7%).
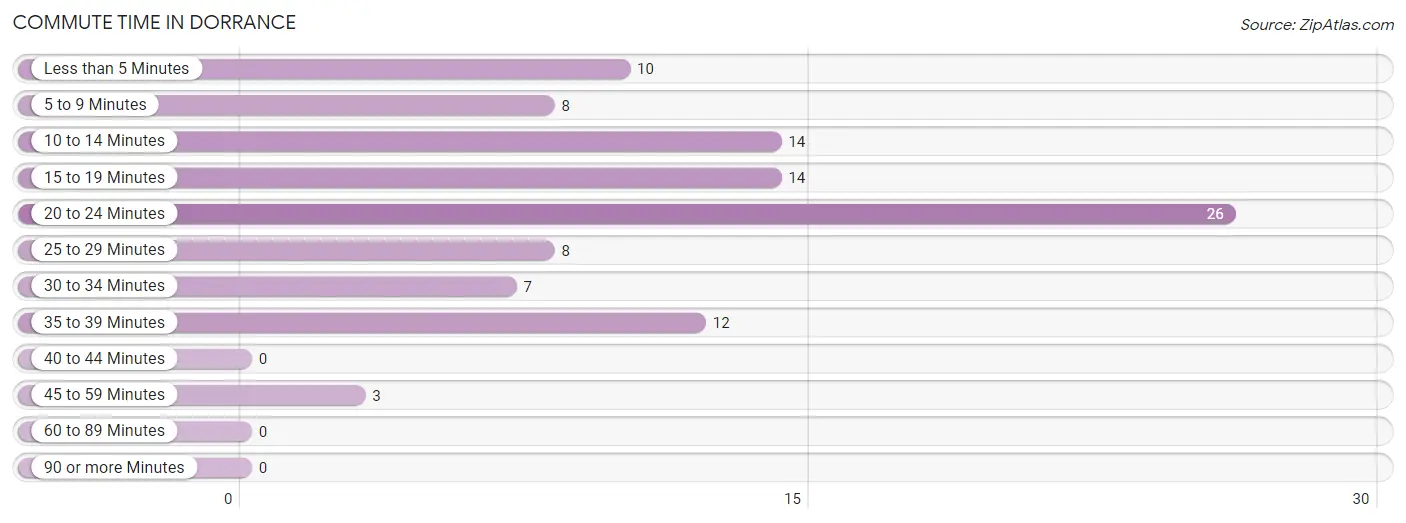
| Commute Time | # Commuters | % Commuters |
| Less than 5 Minutes | 10 | 9.8% |
| 5 to 9 Minutes | 8 | 7.8% |
| 10 to 14 Minutes | 14 | 13.7% |
| 15 to 19 Minutes | 14 | 13.7% |
| 20 to 24 Minutes | 26 | 25.5% |
| 25 to 29 Minutes | 8 | 7.8% |
| 30 to 34 Minutes | 7 | 6.9% |
| 35 to 39 Minutes | 12 | 11.8% |
| 40 to 44 Minutes | 0 | 0.0% |
| 45 to 59 Minutes | 3 | 2.9% |
| 60 to 89 Minutes | 0 | 0.0% |
| 90 or more Minutes | 0 | 0.0% |
Commute Time by Sex in Dorrance
The most common commute times in Dorrance are 35 to 39 minutes (12 commuters, 19.1%) for males and 20 to 24 minutes (23 commuters, 59.0%) for females.
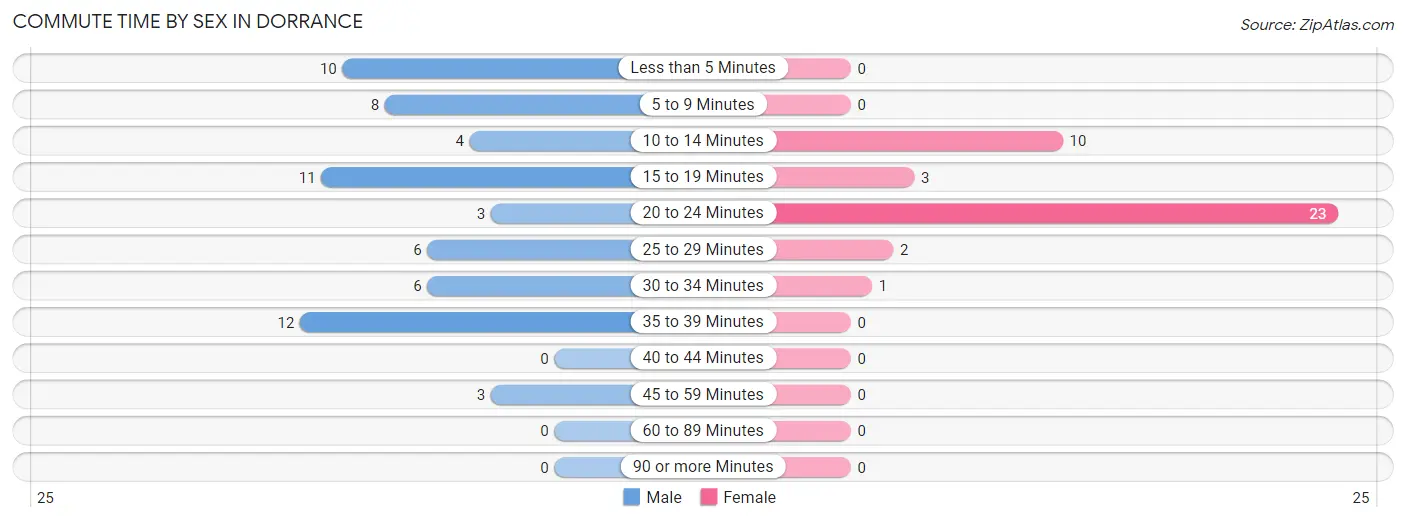
| Commute Time | Male | Female |
| Less than 5 Minutes | 10 (15.9%) | 0 (0.0%) |
| 5 to 9 Minutes | 8 (12.7%) | 0 (0.0%) |
| 10 to 14 Minutes | 4 (6.4%) | 10 (25.6%) |
| 15 to 19 Minutes | 11 (17.5%) | 3 (7.7%) |
| 20 to 24 Minutes | 3 (4.8%) | 23 (59.0%) |
| 25 to 29 Minutes | 6 (9.5%) | 2 (5.1%) |
| 30 to 34 Minutes | 6 (9.5%) | 1 (2.6%) |
| 35 to 39 Minutes | 12 (19.1%) | 0 (0.0%) |
| 40 to 44 Minutes | 0 (0.0%) | 0 (0.0%) |
| 45 to 59 Minutes | 3 (4.8%) | 0 (0.0%) |
| 60 to 89 Minutes | 0 (0.0%) | 0 (0.0%) |
| 90 or more Minutes | 0 (0.0%) | 0 (0.0%) |
Time of Departure to Work by Sex in Dorrance
The most frequent times of departure to work in Dorrance are 7:00 AM to 7:29 AM (19, 30.2%) for males and 6:30 AM to 6:59 AM (13, 33.3%) for females.
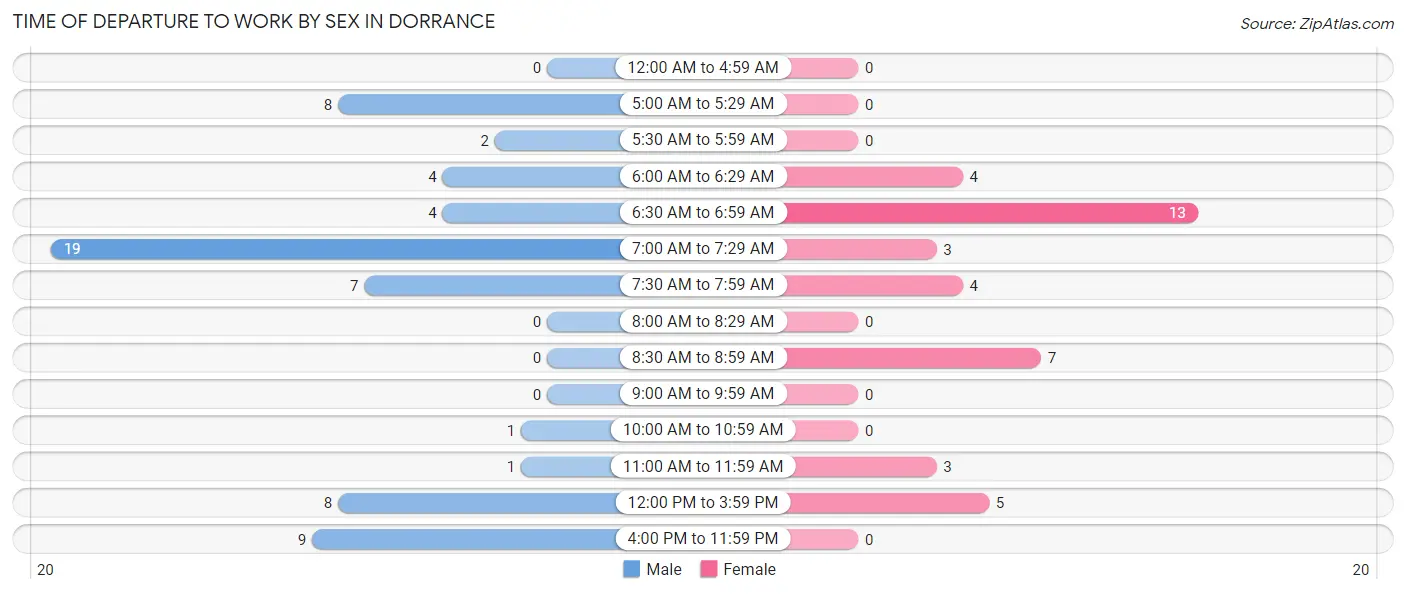
| Time of Departure | Male | Female |
| 12:00 AM to 4:59 AM | 0 (0.0%) | 0 (0.0%) |
| 5:00 AM to 5:29 AM | 8 (12.7%) | 0 (0.0%) |
| 5:30 AM to 5:59 AM | 2 (3.2%) | 0 (0.0%) |
| 6:00 AM to 6:29 AM | 4 (6.4%) | 4 (10.3%) |
| 6:30 AM to 6:59 AM | 4 (6.4%) | 13 (33.3%) |
| 7:00 AM to 7:29 AM | 19 (30.2%) | 3 (7.7%) |
| 7:30 AM to 7:59 AM | 7 (11.1%) | 4 (10.3%) |
| 8:00 AM to 8:29 AM | 0 (0.0%) | 0 (0.0%) |
| 8:30 AM to 8:59 AM | 0 (0.0%) | 7 (17.9%) |
| 9:00 AM to 9:59 AM | 0 (0.0%) | 0 (0.0%) |
| 10:00 AM to 10:59 AM | 1 (1.6%) | 0 (0.0%) |
| 11:00 AM to 11:59 AM | 1 (1.6%) | 3 (7.7%) |
| 12:00 PM to 3:59 PM | 8 (12.7%) | 5 (12.8%) |
| 4:00 PM to 11:59 PM | 9 (14.3%) | 0 (0.0%) |
| Total | 63 (100.0%) | 39 (100.0%) |
Housing Occupancy in Dorrance
Occupancy by Ownership in Dorrance
Of the total 83 dwellings in Dorrance, owner-occupied units account for 79 (95.2%), while renter-occupied units make up 4 (4.8%).
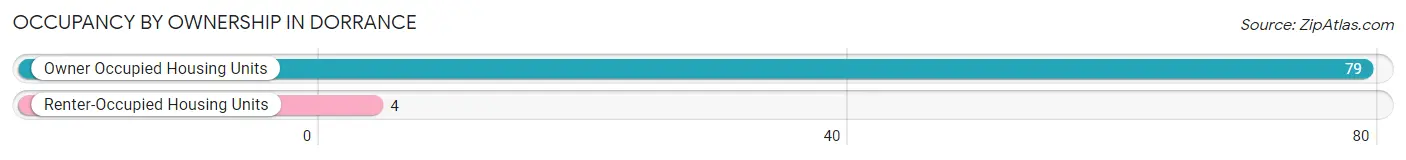
| Occupancy | # Housing Units | % Housing Units |
| Owner Occupied Housing Units | 79 | 95.2% |
| Renter-Occupied Housing Units | 4 | 4.8% |
| Total Occupied Housing Units | 83 | 100.0% |
Occupancy by Household Size in Dorrance
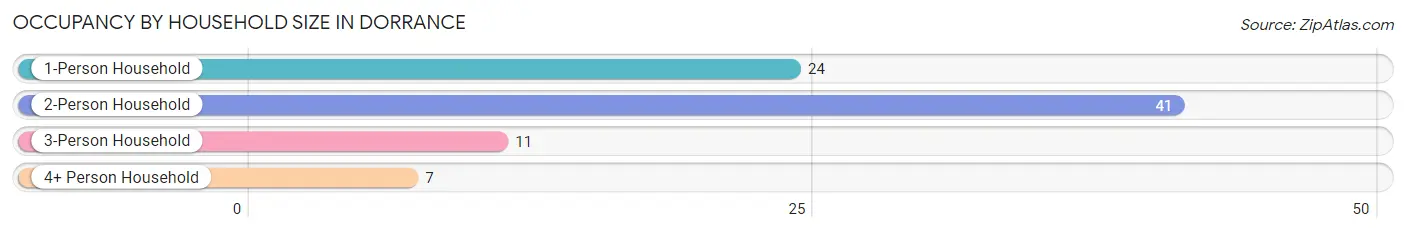
| Household Size | # Housing Units | % Housing Units |
| 1-Person Household | 24 | 28.9% |
| 2-Person Household | 41 | 49.4% |
| 3-Person Household | 11 | 13.3% |
| 4+ Person Household | 7 | 8.4% |
| Total Housing Units | 83 | 100.0% |
Occupancy by Ownership by Household Size in Dorrance
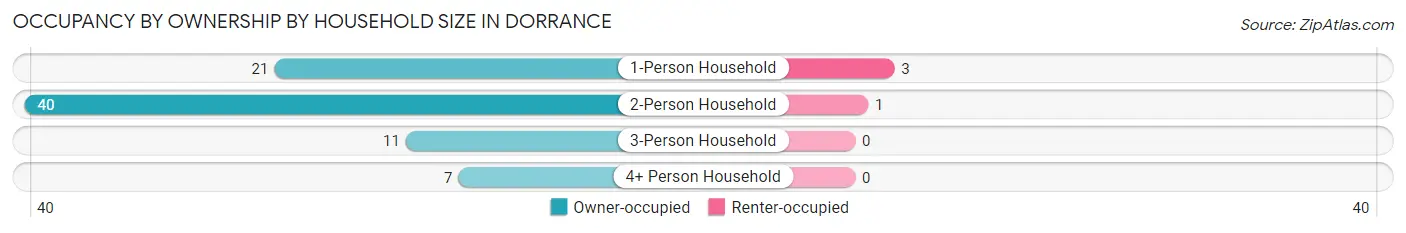
| Household Size | Owner-occupied | Renter-occupied |
| 1-Person Household | 21 (87.5%) | 3 (12.5%) |
| 2-Person Household | 40 (97.6%) | 1 (2.4%) |
| 3-Person Household | 11 (100.0%) | 0 (0.0%) |
| 4+ Person Household | 7 (100.0%) | 0 (0.0%) |
| Total Housing Units | 79 (95.2%) | 4 (4.8%) |
Occupancy by Educational Attainment in Dorrance
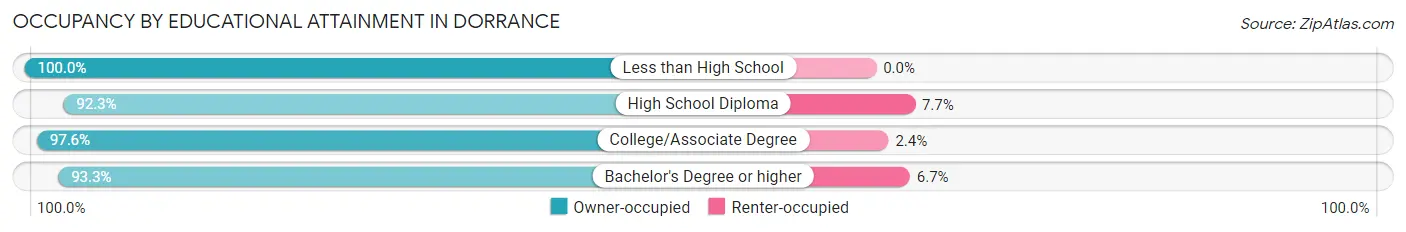
| Household Size | Owner-occupied | Renter-occupied |
| Less than High School | 1 (100.0%) | 0 (0.0%) |
| High School Diploma | 24 (92.3%) | 2 (7.7%) |
| College/Associate Degree | 40 (97.6%) | 1 (2.4%) |
| Bachelor's Degree or higher | 14 (93.3%) | 1 (6.7%) |
Occupancy by Age of Householder in Dorrance
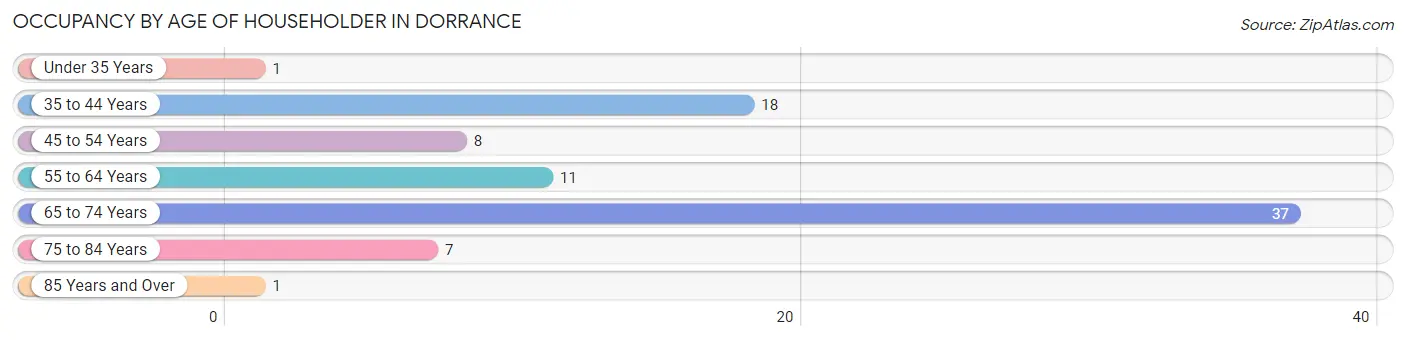
| Age Bracket | # Households | % Households |
| Under 35 Years | 1 | 1.2% |
| 35 to 44 Years | 18 | 21.7% |
| 45 to 54 Years | 8 | 9.6% |
| 55 to 64 Years | 11 | 13.3% |
| 65 to 74 Years | 37 | 44.6% |
| 75 to 84 Years | 7 | 8.4% |
| 85 Years and Over | 1 | 1.2% |
| Total | 83 | 100.0% |
Housing Finances in Dorrance
Median Income by Occupancy in Dorrance
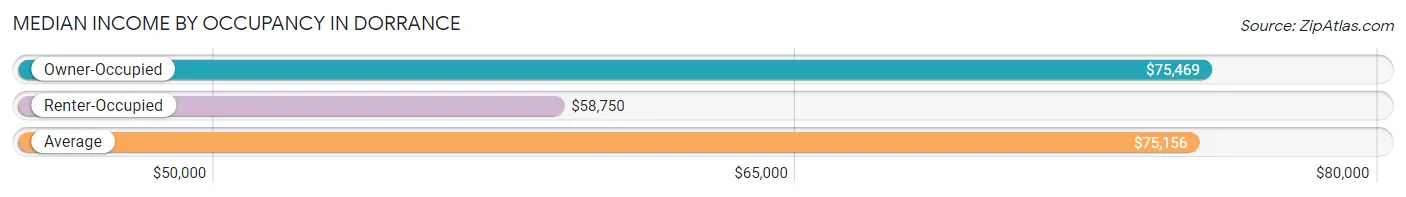
| Occupancy Type | # Households | Median Income |
| Owner-Occupied | 79 (95.2%) | $75,469 |
| Renter-Occupied | 4 (4.8%) | $58,750 |
| Average | 83 (100.0%) | $75,156 |
Occupancy by Householder Income Bracket in Dorrance
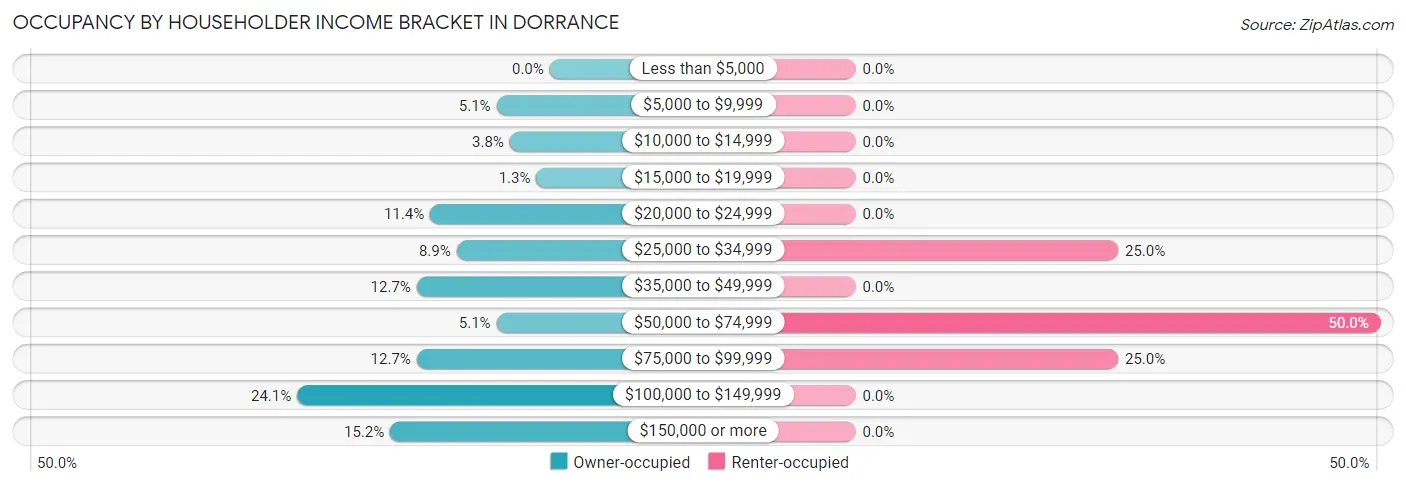
| Income Bracket | Owner-occupied | Renter-occupied |
| Less than $5,000 | 0 (0.0%) | 0 (0.0%) |
| $5,000 to $9,999 | 4 (5.1%) | 0 (0.0%) |
| $10,000 to $14,999 | 3 (3.8%) | 0 (0.0%) |
| $15,000 to $19,999 | 1 (1.3%) | 0 (0.0%) |
| $20,000 to $24,999 | 9 (11.4%) | 0 (0.0%) |
| $25,000 to $34,999 | 7 (8.9%) | 1 (25.0%) |
| $35,000 to $49,999 | 10 (12.7%) | 0 (0.0%) |
| $50,000 to $74,999 | 4 (5.1%) | 2 (50.0%) |
| $75,000 to $99,999 | 10 (12.7%) | 1 (25.0%) |
| $100,000 to $149,999 | 19 (24.0%) | 0 (0.0%) |
| $150,000 or more | 12 (15.2%) | 0 (0.0%) |
| Total | 79 (100.0%) | 4 (100.0%) |
Monthly Housing Cost Tiers in Dorrance
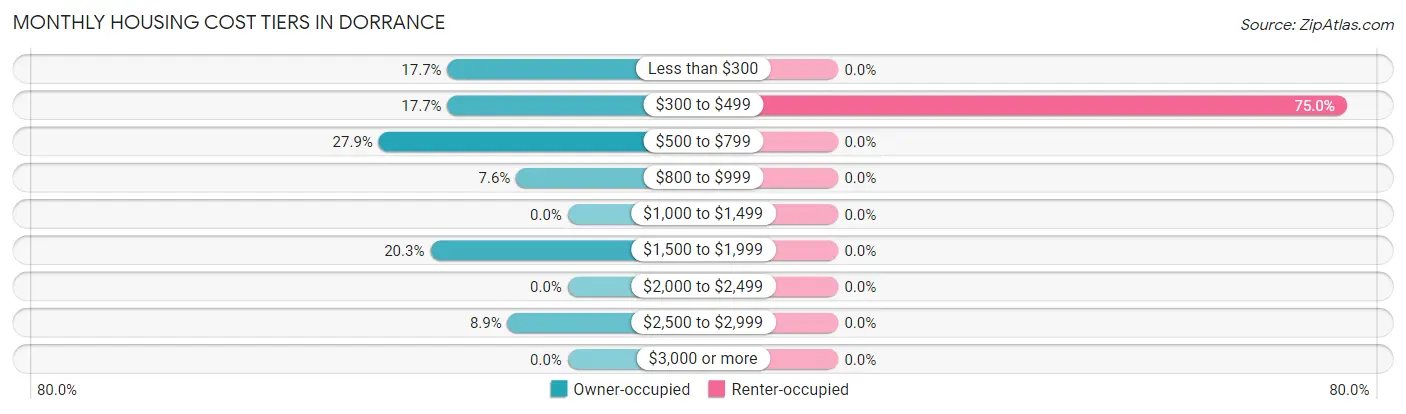
| Monthly Cost | Owner-occupied | Renter-occupied |
| Less than $300 | 14 (17.7%) | 0 (0.0%) |
| $300 to $499 | 14 (17.7%) | 3 (75.0%) |
| $500 to $799 | 22 (27.9%) | 0 (0.0%) |
| $800 to $999 | 6 (7.6%) | 0 (0.0%) |
| $1,000 to $1,499 | 0 (0.0%) | 0 (0.0%) |
| $1,500 to $1,999 | 16 (20.3%) | 0 (0.0%) |
| $2,000 to $2,499 | 0 (0.0%) | 0 (0.0%) |
| $2,500 to $2,999 | 7 (8.9%) | 0 (0.0%) |
| $3,000 or more | 0 (0.0%) | 0 (0.0%) |
| Total | 79 (100.0%) | 4 (100.0%) |
Physical Housing Characteristics in Dorrance
Housing Structures in Dorrance
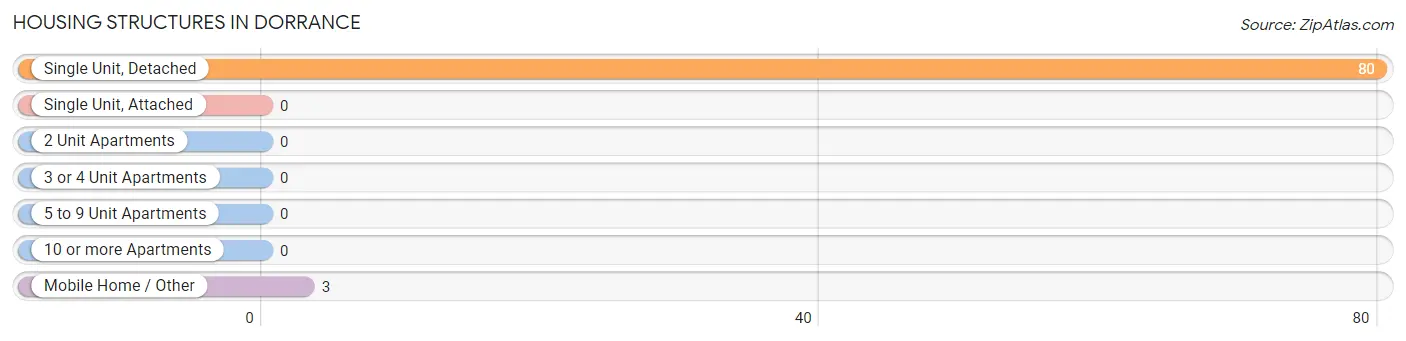
| Structure Type | # Housing Units | % Housing Units |
| Single Unit, Detached | 80 | 96.4% |
| Single Unit, Attached | 0 | 0.0% |
| 2 Unit Apartments | 0 | 0.0% |
| 3 or 4 Unit Apartments | 0 | 0.0% |
| 5 to 9 Unit Apartments | 0 | 0.0% |
| 10 or more Apartments | 0 | 0.0% |
| Mobile Home / Other | 3 | 3.6% |
| Total | 83 | 100.0% |
Housing Structures by Occupancy in Dorrance
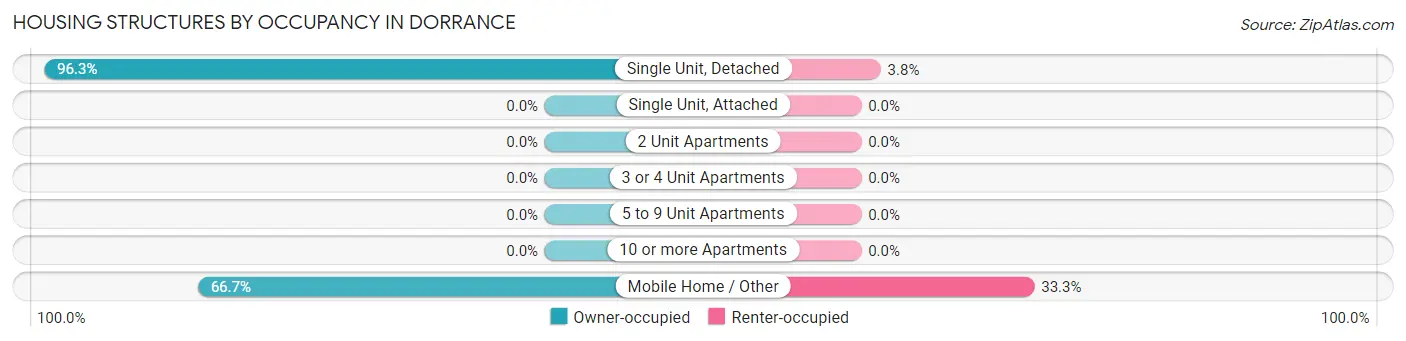
| Structure Type | Owner-occupied | Renter-occupied |
| Single Unit, Detached | 77 (96.3%) | 3 (3.7%) |
| Single Unit, Attached | 0 (0.0%) | 0 (0.0%) |
| 2 Unit Apartments | 0 (0.0%) | 0 (0.0%) |
| 3 or 4 Unit Apartments | 0 (0.0%) | 0 (0.0%) |
| 5 to 9 Unit Apartments | 0 (0.0%) | 0 (0.0%) |
| 10 or more Apartments | 0 (0.0%) | 0 (0.0%) |
| Mobile Home / Other | 2 (66.7%) | 1 (33.3%) |
| Total | 79 (95.2%) | 4 (4.8%) |
Housing Structures by Number of Rooms in Dorrance
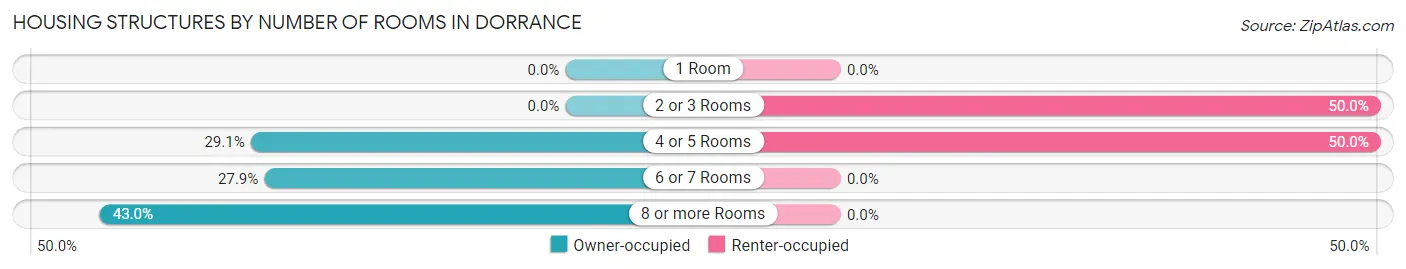
| Number of Rooms | Owner-occupied | Renter-occupied |
| 1 Room | 0 (0.0%) | 0 (0.0%) |
| 2 or 3 Rooms | 0 (0.0%) | 2 (50.0%) |
| 4 or 5 Rooms | 23 (29.1%) | 2 (50.0%) |
| 6 or 7 Rooms | 22 (27.9%) | 0 (0.0%) |
| 8 or more Rooms | 34 (43.0%) | 0 (0.0%) |
| Total | 79 (100.0%) | 4 (100.0%) |
Housing Structure by Heating Type in Dorrance
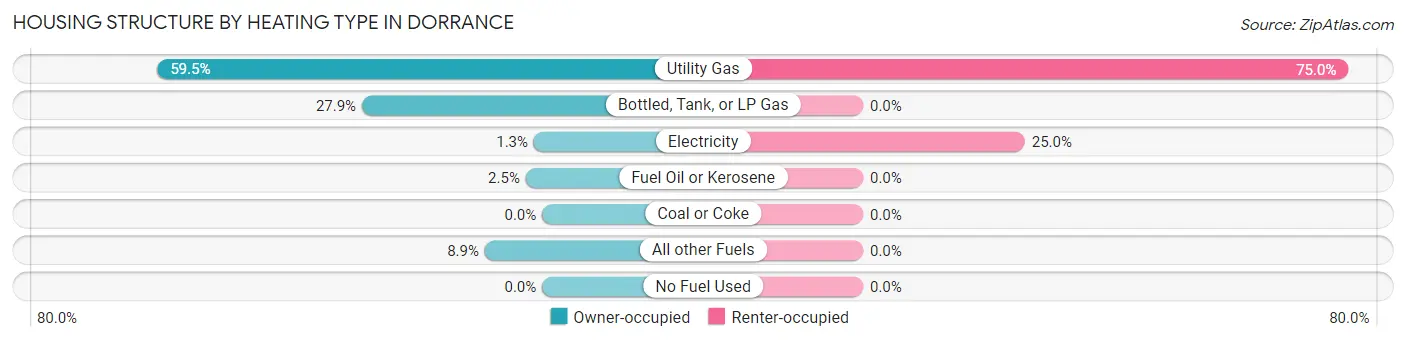
| Heating Type | Owner-occupied | Renter-occupied |
| Utility Gas | 47 (59.5%) | 3 (75.0%) |
| Bottled, Tank, or LP Gas | 22 (27.9%) | 0 (0.0%) |
| Electricity | 1 (1.3%) | 1 (25.0%) |
| Fuel Oil or Kerosene | 2 (2.5%) | 0 (0.0%) |
| Coal or Coke | 0 (0.0%) | 0 (0.0%) |
| All other Fuels | 7 (8.9%) | 0 (0.0%) |
| No Fuel Used | 0 (0.0%) | 0 (0.0%) |
| Total | 79 (100.0%) | 4 (100.0%) |
Household Vehicle Usage in Dorrance
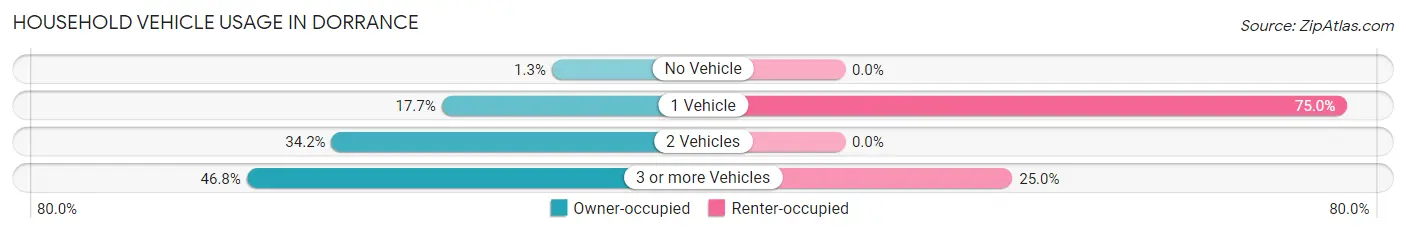
| Vehicles per Household | Owner-occupied | Renter-occupied |
| No Vehicle | 1 (1.3%) | 0 (0.0%) |
| 1 Vehicle | 14 (17.7%) | 3 (75.0%) |
| 2 Vehicles | 27 (34.2%) | 0 (0.0%) |
| 3 or more Vehicles | 37 (46.8%) | 1 (25.0%) |
| Total | 79 (100.0%) | 4 (100.0%) |
Real Estate & Mortgages in Dorrance
Real Estate and Mortgage Overview in Dorrance
| Characteristic | Without Mortgage | With Mortgage |
| Housing Units | 50 | 29 |
| Median Property Value | $70,000 | $162,500 |
| Median Household Income | $44,167 | $8 |
| Monthly Housing Costs | $450 | $0 |
| Real Estate Taxes | $850 | $0 |
Property Value by Mortgage Status in Dorrance
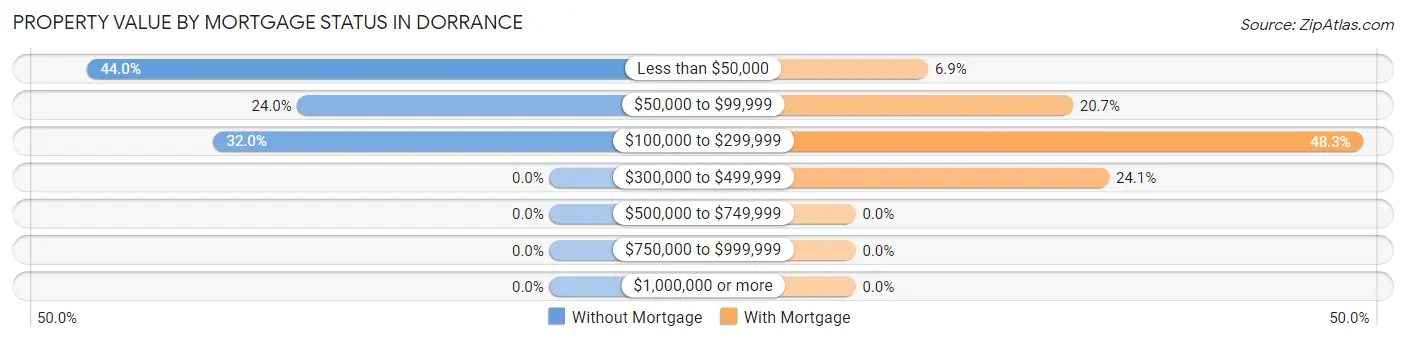
| Property Value | Without Mortgage | With Mortgage |
| Less than $50,000 | 22 (44.0%) | 2 (6.9%) |
| $50,000 to $99,999 | 12 (24.0%) | 6 (20.7%) |
| $100,000 to $299,999 | 16 (32.0%) | 14 (48.3%) |
| $300,000 to $499,999 | 0 (0.0%) | 7 (24.1%) |
| $500,000 to $749,999 | 0 (0.0%) | 0 (0.0%) |
| $750,000 to $999,999 | 0 (0.0%) | 0 (0.0%) |
| $1,000,000 or more | 0 (0.0%) | 0 (0.0%) |
| Total | 50 (100.0%) | 29 (100.0%) |
Household Income by Mortgage Status in Dorrance
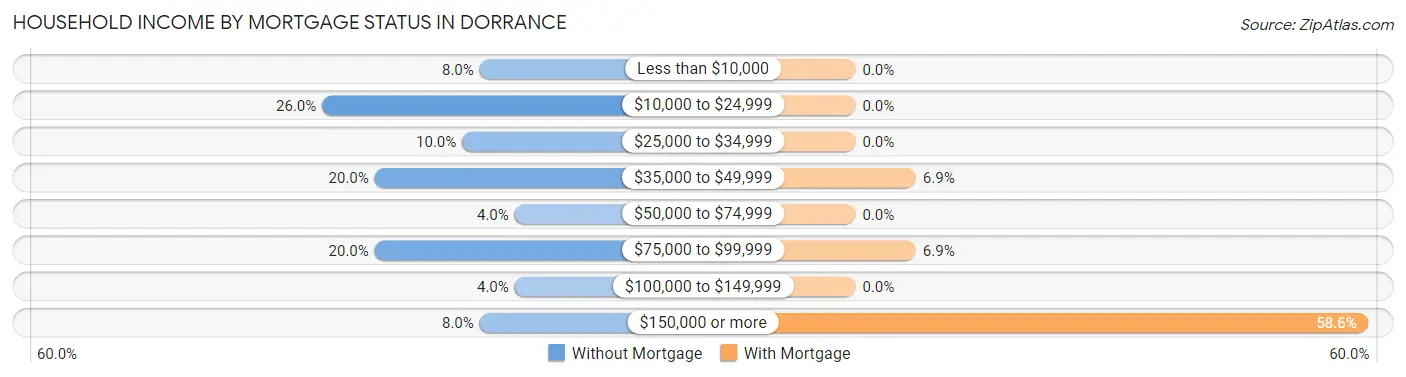
| Household Income | Without Mortgage | With Mortgage |
| Less than $10,000 | 4 (8.0%) | 0 (0.0%) |
| $10,000 to $24,999 | 13 (26.0%) | 0 (0.0%) |
| $25,000 to $34,999 | 5 (10.0%) | 0 (0.0%) |
| $35,000 to $49,999 | 10 (20.0%) | 2 (6.9%) |
| $50,000 to $74,999 | 2 (4.0%) | 0 (0.0%) |
| $75,000 to $99,999 | 10 (20.0%) | 2 (6.9%) |
| $100,000 to $149,999 | 2 (4.0%) | 0 (0.0%) |
| $150,000 or more | 4 (8.0%) | 17 (58.6%) |
| Total | 50 (100.0%) | 29 (100.0%) |
Property Value to Household Income Ratio in Dorrance
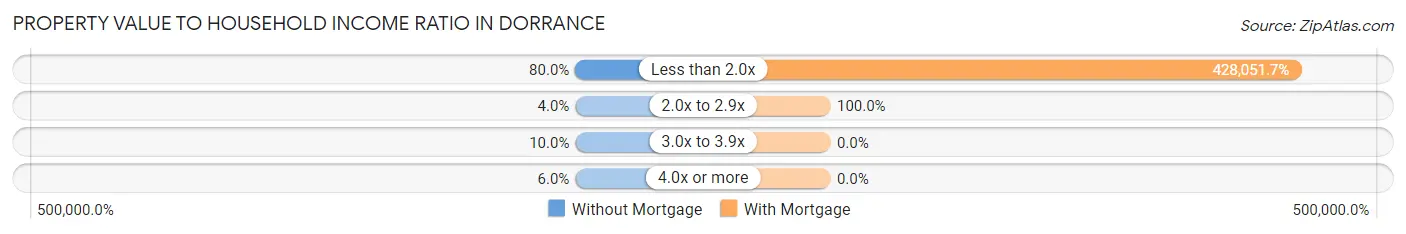
| Value-to-Income Ratio | Without Mortgage | With Mortgage |
| Less than 2.0x | 40 (80.0%) | 124,135 (428,051.7%) |
| 2.0x to 2.9x | 2 (4.0%) | 29 (100.0%) |
| 3.0x to 3.9x | 5 (10.0%) | 0 (0.0%) |
| 4.0x or more | 3 (6.0%) | 0 (0.0%) |
| Total | 50 (100.0%) | 29 (100.0%) |
Real Estate Taxes by Mortgage Status in Dorrance
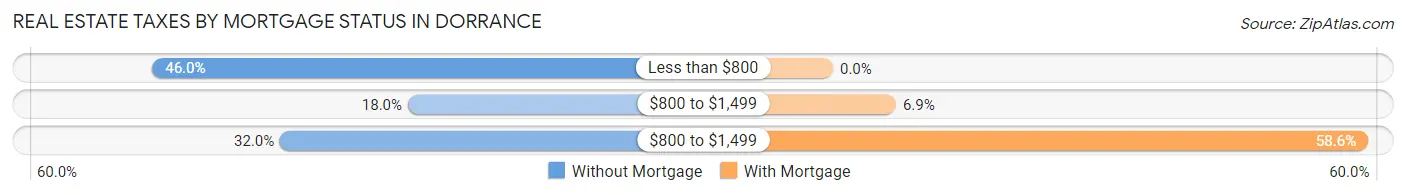
| Property Taxes | Without Mortgage | With Mortgage |
| Less than $800 | 23 (46.0%) | 0 (0.0%) |
| $800 to $1,499 | 9 (18.0%) | 2 (6.9%) |
| $800 to $1,499 | 16 (32.0%) | 17 (58.6%) |
| Total | 50 (100.0%) | 29 (100.0%) |
Health & Disability in Dorrance
Health Insurance Coverage by Age in Dorrance
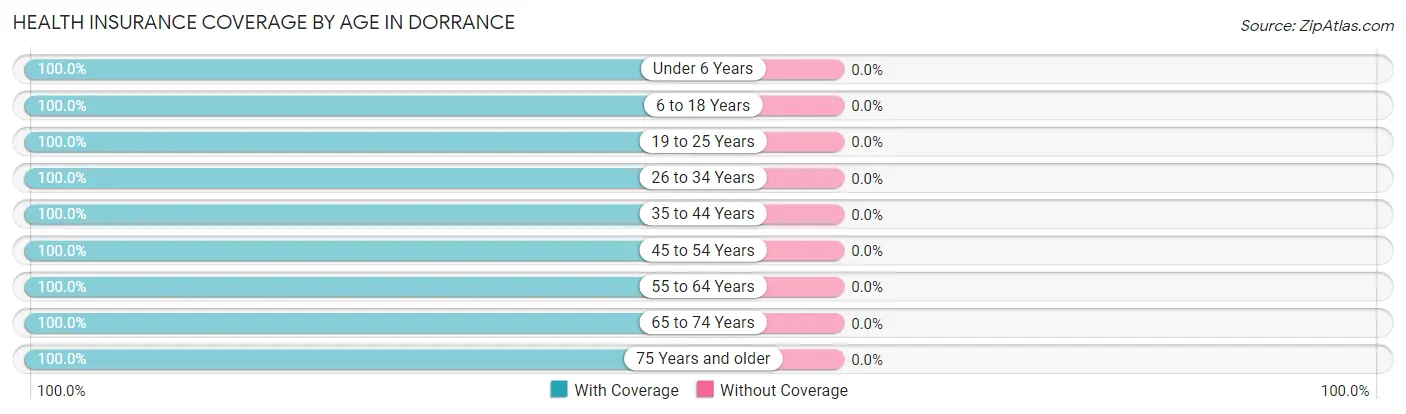
| Age Bracket | With Coverage | Without Coverage |
| Under 6 Years | 3 (100.0%) | 0 (0.0%) |
| 6 to 18 Years | 32 (100.0%) | 0 (0.0%) |
| 19 to 25 Years | 21 (100.0%) | 0 (0.0%) |
| 26 to 34 Years | 12 (100.0%) | 0 (0.0%) |
| 35 to 44 Years | 26 (100.0%) | 0 (0.0%) |
| 45 to 54 Years | 9 (100.0%) | 0 (0.0%) |
| 55 to 64 Years | 27 (100.0%) | 0 (0.0%) |
| 65 to 74 Years | 62 (100.0%) | 0 (0.0%) |
| 75 Years and older | 13 (100.0%) | 0 (0.0%) |
| Total | 205 (100.0%) | 0 (0.0%) |
Health Insurance Coverage by Citizenship Status in Dorrance
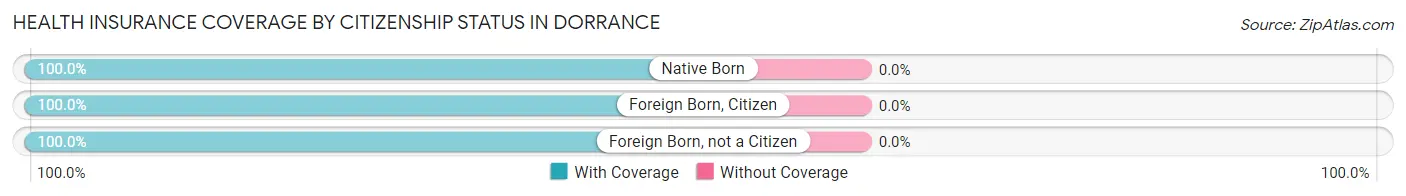
| Citizenship Status | With Coverage | Without Coverage |
| Native Born | 3 (100.0%) | 0 (0.0%) |
| Foreign Born, Citizen | 32 (100.0%) | 0 (0.0%) |
| Foreign Born, not a Citizen | 21 (100.0%) | 0 (0.0%) |
Health Insurance Coverage by Household Income in Dorrance
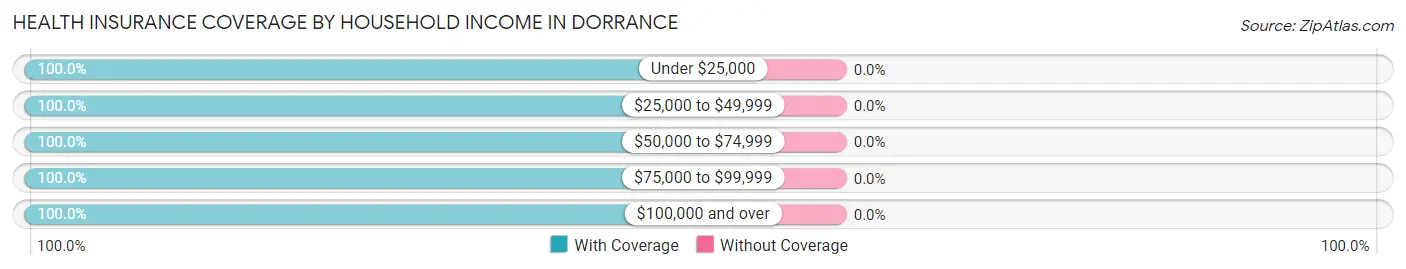
| Household Income | With Coverage | Without Coverage |
| Under $25,000 | 18 (100.0%) | 0 (0.0%) |
| $25,000 to $49,999 | 52 (100.0%) | 0 (0.0%) |
| $50,000 to $74,999 | 25 (100.0%) | 0 (0.0%) |
| $75,000 to $99,999 | 48 (100.0%) | 0 (0.0%) |
| $100,000 and over | 62 (100.0%) | 0 (0.0%) |
Public vs Private Health Insurance Coverage by Age in Dorrance
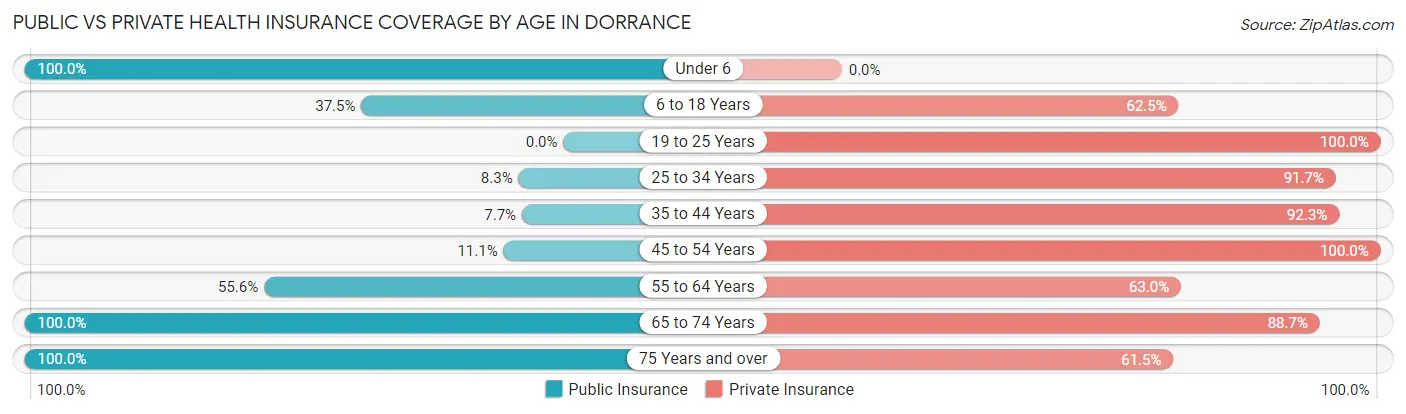
| Age Bracket | Public Insurance | Private Insurance |
| Under 6 | 3 (100.0%) | 0 (0.0%) |
| 6 to 18 Years | 12 (37.5%) | 20 (62.5%) |
| 19 to 25 Years | 0 (0.0%) | 21 (100.0%) |
| 25 to 34 Years | 1 (8.3%) | 11 (91.7%) |
| 35 to 44 Years | 2 (7.7%) | 24 (92.3%) |
| 45 to 54 Years | 1 (11.1%) | 9 (100.0%) |
| 55 to 64 Years | 15 (55.6%) | 17 (63.0%) |
| 65 to 74 Years | 62 (100.0%) | 55 (88.7%) |
| 75 Years and over | 13 (100.0%) | 8 (61.5%) |
| Total | 109 (53.2%) | 165 (80.5%) |
Disability Status by Sex by Age in Dorrance
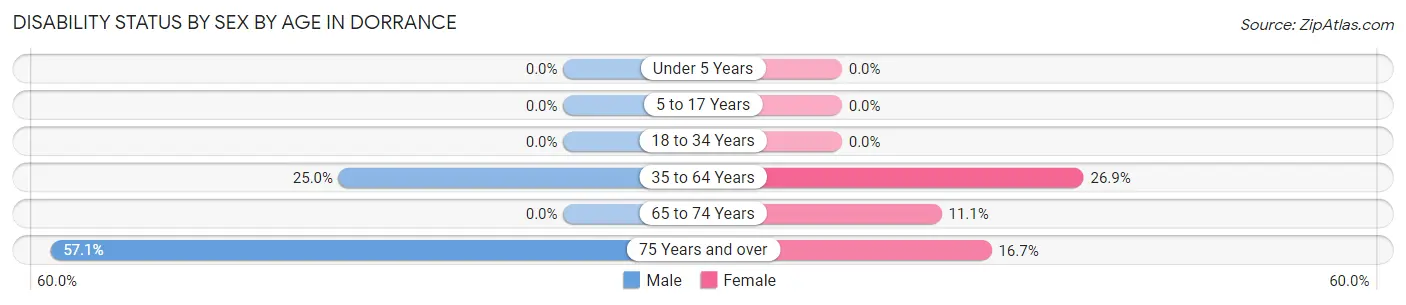
| Age Bracket | Male | Female |
| Under 5 Years | 0 (0.0%) | 0 (0.0%) |
| 5 to 17 Years | 0 (0.0%) | 0 (0.0%) |
| 18 to 34 Years | 0 (0.0%) | 0 (0.0%) |
| 35 to 64 Years | 9 (25.0%) | 7 (26.9%) |
| 65 to 74 Years | 0 (0.0%) | 3 (11.1%) |
| 75 Years and over | 4 (57.1%) | 1 (16.7%) |
Disability Class by Sex by Age in Dorrance
Disability Class: Hearing Difficulty
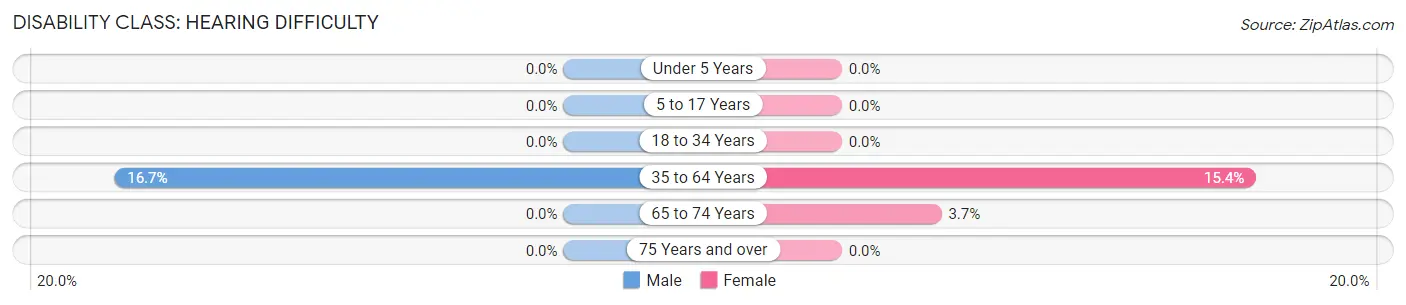
| Age Bracket | Male | Female |
| Under 5 Years | 0 (0.0%) | 0 (0.0%) |
| 5 to 17 Years | 0 (0.0%) | 0 (0.0%) |
| 18 to 34 Years | 0 (0.0%) | 0 (0.0%) |
| 35 to 64 Years | 6 (16.7%) | 4 (15.4%) |
| 65 to 74 Years | 0 (0.0%) | 1 (3.7%) |
| 75 Years and over | 0 (0.0%) | 0 (0.0%) |
Disability Class: Vision Difficulty
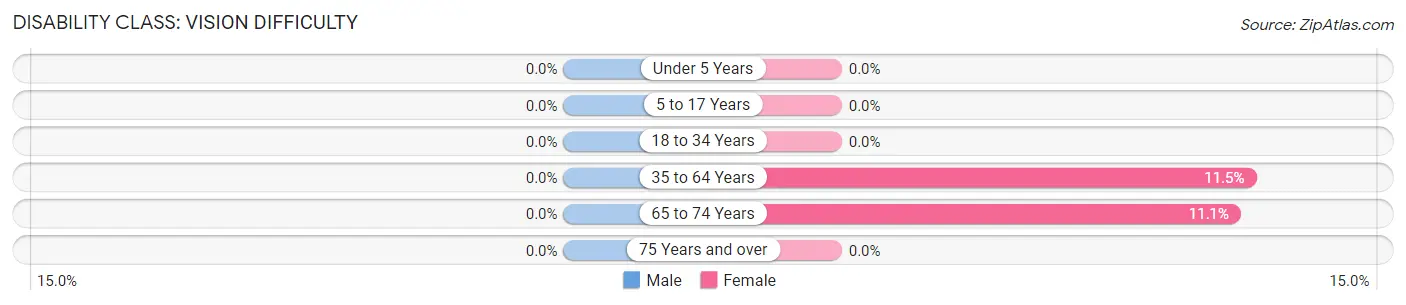
| Age Bracket | Male | Female |
| Under 5 Years | 0 (0.0%) | 0 (0.0%) |
| 5 to 17 Years | 0 (0.0%) | 0 (0.0%) |
| 18 to 34 Years | 0 (0.0%) | 0 (0.0%) |
| 35 to 64 Years | 0 (0.0%) | 3 (11.5%) |
| 65 to 74 Years | 0 (0.0%) | 3 (11.1%) |
| 75 Years and over | 0 (0.0%) | 0 (0.0%) |
Disability Class: Cognitive Difficulty
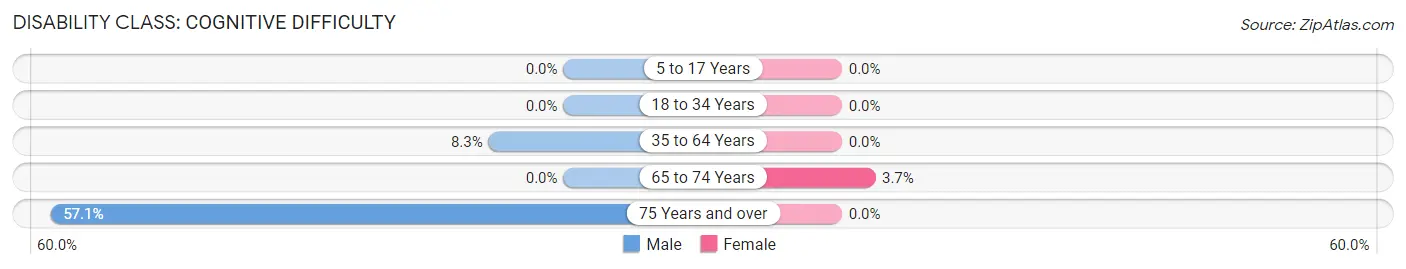
| Age Bracket | Male | Female |
| 5 to 17 Years | 0 (0.0%) | 0 (0.0%) |
| 18 to 34 Years | 0 (0.0%) | 0 (0.0%) |
| 35 to 64 Years | 3 (8.3%) | 0 (0.0%) |
| 65 to 74 Years | 0 (0.0%) | 1 (3.7%) |
| 75 Years and over | 4 (57.1%) | 0 (0.0%) |
Disability Class: Ambulatory Difficulty
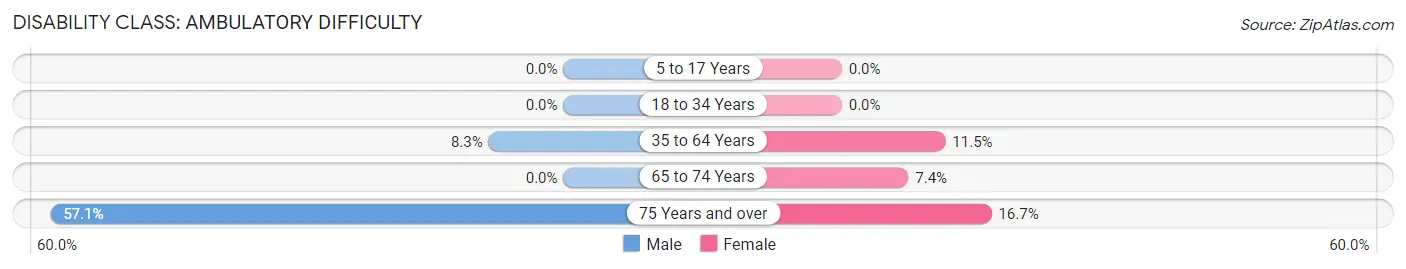
| Age Bracket | Male | Female |
| 5 to 17 Years | 0 (0.0%) | 0 (0.0%) |
| 18 to 34 Years | 0 (0.0%) | 0 (0.0%) |
| 35 to 64 Years | 3 (8.3%) | 3 (11.5%) |
| 65 to 74 Years | 0 (0.0%) | 2 (7.4%) |
| 75 Years and over | 4 (57.1%) | 1 (16.7%) |
Disability Class: Self-Care Difficulty
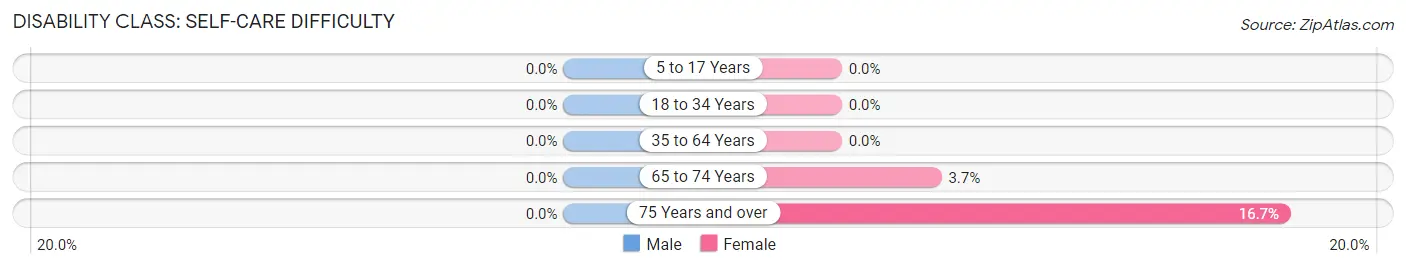
| Age Bracket | Male | Female |
| 5 to 17 Years | 0 (0.0%) | 0 (0.0%) |
| 18 to 34 Years | 0 (0.0%) | 0 (0.0%) |
| 35 to 64 Years | 0 (0.0%) | 0 (0.0%) |
| 65 to 74 Years | 0 (0.0%) | 1 (3.7%) |
| 75 Years and over | 0 (0.0%) | 1 (16.7%) |
Technology Access in Dorrance
Computing Device Access in Dorrance
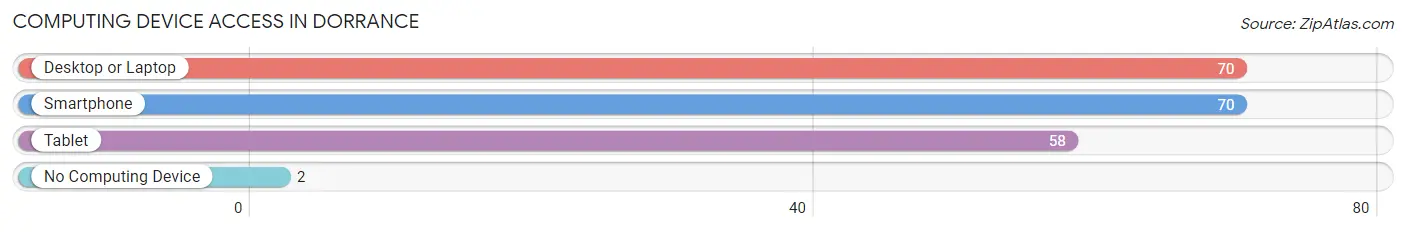
| Device Type | # Households | % Households |
| Desktop or Laptop | 70 | 84.3% |
| Smartphone | 70 | 84.3% |
| Tablet | 58 | 69.9% |
| No Computing Device | 2 | 2.4% |
| Total | 83 | 100.0% |
Internet Access in Dorrance
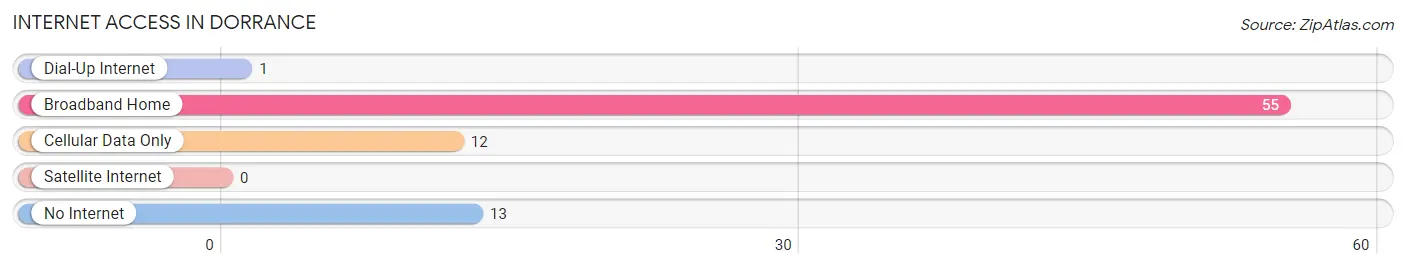
| Internet Type | # Households | % Households |
| Dial-Up Internet | 1 | 1.2% |
| Broadband Home | 55 | 66.3% |
| Cellular Data Only | 12 | 14.5% |
| Satellite Internet | 0 | 0.0% |
| No Internet | 13 | 15.7% |
| Total | 83 | 100.0% |
Dorrance Summary
Dorrance is a small town located in Russell County, Kansas, United States. The population was estimated to be around 200 people in 2020. The town was founded in 1887 and is named after the Dorrance family, who were early settlers in the area.
Geography
Dorrance is located at 38°51'25" North, 98°45'45" West (38.856944, -98.762500). It is situated in the Smoky Hills region of the Great Plains. The town is located on the south side of the Smoky Hill River, which is a tributary of the Arkansas River. The elevation of Dorrance is 1,845 feet (562 m).
The town is located in the Central Standard Time Zone CST and observes Daylight Saving Time
Economy
The economy of Dorrance is largely based on agriculture. The town is home to several farms and ranches, which produce a variety of crops and livestock. The town also has a few small businesses, including a grocery store, a hardware store, and a restaurant.
Demographics
As of the 2010 census, there were 199 people living in Dorrance. The racial makeup of the town was 97.5% White, 0.5% African American, 0.5% Native American, 0.5% Asian, and 1.0% from two or more races. Hispanic or Latino of any race were 0.5% of the population.
The median age in Dorrance was 44.7 years. About 24.1% of residents were under the age of 18, 6.5% were between the ages of 18 and 24, 22.6% were from 25 to 44, 28.1% were from 45 to 64, and 18.6% were 65 years of age or older. The gender makeup of the town was 50.3% male and 49.7% female.
The median income for a household in Dorrance was $41,250, and the median income for a family was $45,625. The per capita income for the town was $19,845. About 8.3% of families and 10.1% of the population were below the poverty line, including 11.1% of those under age 18 and none of those age 65 or over.
Education
Dorrance is served by the Russell County Unified School District. The town has one elementary school, Dorrance Elementary School, which serves students in grades K-5. Students in grades 6-12 attend Russell County High School in Russell, Kansas.
Conclusion
Dorrance is a small town located in Russell County, Kansas. The town was founded in 1887 and is named after the Dorrance family, who were early settlers in the area. The economy of Dorrance is largely based on agriculture, and the town is home to several farms and ranches. The population of Dorrance was estimated to be around 200 people in 2020. The town is served by the Russell County Unified School District, and has one elementary school and one high school.
Common Questions
What is Per Capita Income in Dorrance?
Per Capita income in Dorrance is $34,832.
What is the Median Family Income in Dorrance?
Median Family Income in Dorrance is $121,250.
What is the Median Household income in Dorrance?
Median Household Income in Dorrance is $75,156.
What is Inequality or Gini Index in Dorrance?
Inequality or Gini Index in Dorrance is 0.45.
What is the Total Population of Dorrance?
Total Population of Dorrance is 205.
What is the Total Male Population of Dorrance?
Total Male Population of Dorrance is 128.
What is the Total Female Population of Dorrance?
Total Female Population of Dorrance is 77.
What is the Ratio of Males per 100 Females in Dorrance?
There are 166.23 Males per 100 Females in Dorrance.
What is the Ratio of Females per 100 Males in Dorrance?
There are 60.16 Females per 100 Males in Dorrance.
What is the Median Population Age in Dorrance?
Median Population Age in Dorrance is 52.9 Years.
What is the Average Family Size in Dorrance
Average Family Size in Dorrance is 3.1 People.
What is the Average Household Size in Dorrance
Average Household Size in Dorrance is 2.5 People.
How Large is the Labor Force in Dorrance?
There are 102 People in the Labor Forcein in Dorrance.
What is the Percentage of People in the Labor Force in Dorrance?
53.1% of People are in the Labor Force in Dorrance.