Cities with the Highest Percentage of Population Employed in Computer & Mathematics in Virginia
RELATED REPORTS & OPTIONS
Computer & Mathematics
Virginia
Compare Cities
Map of Cities with the Highest Percentage of Population Employed in Computer & Mathematics in Virginia
0.0%
40.0%
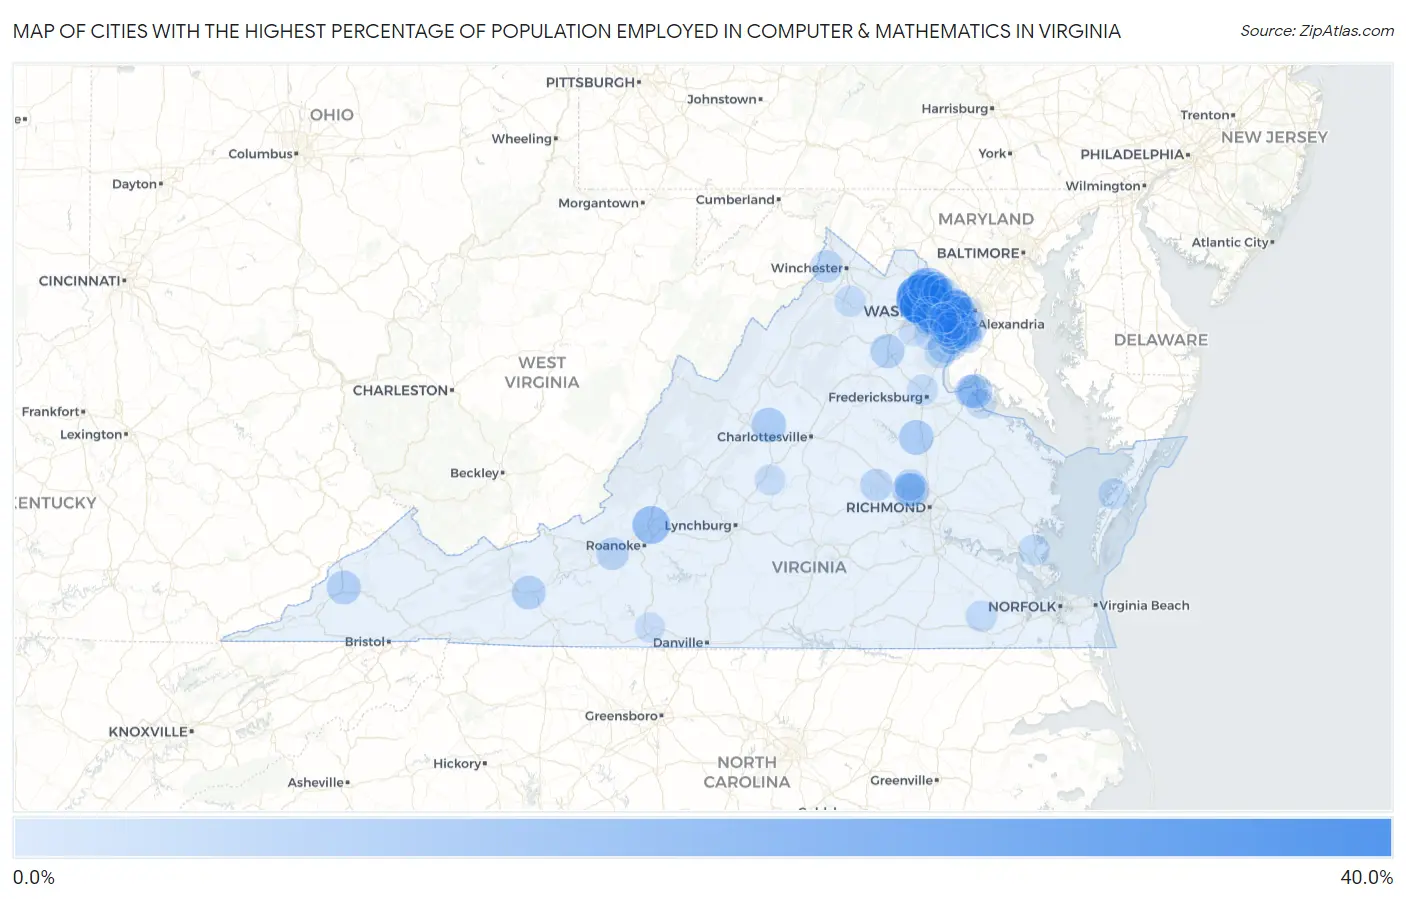
Cities with the Highest Percentage of Population Employed in Computer & Mathematics in Virginia
| City | % Employed | vs State | vs National | |
| 1. | Loudoun Valley Estates | 39.5% | 6.2%(+33.2)#1 | 3.5%(+35.9)#36 |
| 2. | Aldie | 35.7% | 6.2%(+29.5)#2 | 3.5%(+32.2)#47 |
| 3. | Goose Creek | 34.6% | 6.2%(+28.4)#3 | 3.5%(+31.1)#53 |
| 4. | Brandy Station | 28.0% | 6.2%(+21.8)#4 | 3.5%(+24.5)#82 |
| 5. | Moorefield | 27.9% | 6.2%(+21.7)#5 | 3.5%(+24.4)#84 |
| 6. | Brambleton | 26.9% | 6.2%(+20.6)#6 | 3.5%(+23.3)#91 |
| 7. | Navy | 26.9% | 6.2%(+20.6)#7 | 3.5%(+23.3)#92 |
| 8. | Sully Square | 26.5% | 6.2%(+20.2)#8 | 3.5%(+22.9)#93 |
| 9. | Floris | 25.5% | 6.2%(+19.3)#9 | 3.5%(+22.0)#97 |
| 10. | Mcnair | 25.1% | 6.2%(+18.9)#10 | 3.5%(+21.6)#101 |
| 11. | Stevens Creek | 22.9% | 6.2%(+16.6)#11 | 3.5%(+19.3)#123 |
| 12. | Arcola | 22.1% | 6.2%(+15.9)#12 | 3.5%(+18.6)#137 |
| 13. | Greenbriar | 21.7% | 6.2%(+15.5)#13 | 3.5%(+18.2)#142 |
| 14. | Tysons | 21.4% | 6.2%(+15.1)#14 | 3.5%(+17.8)#145 |
| 15. | Troutville | 20.9% | 6.2%(+14.7)#15 | 3.5%(+17.4)#158 |
| 16. | University Center | 19.6% | 6.2%(+13.4)#16 | 3.5%(+16.1)#172 |
| 17. | Rio | 19.6% | 6.2%(+13.4)#17 | 3.5%(+16.1)#174 |
| 18. | Union Mill | 19.5% | 6.2%(+13.3)#18 | 3.5%(+16.0)#176 |
| 19. | Fair Lakes | 19.2% | 6.2%(+13.0)#19 | 3.5%(+15.7)#183 |
| 20. | South Riding | 19.0% | 6.2%(+12.8)#20 | 3.5%(+15.5)#188 |
| 21. | Merrifield | 19.0% | 6.2%(+12.7)#21 | 3.5%(+15.5)#190 |
| 22. | Oak Grove | 18.9% | 6.2%(+12.6)#22 | 3.5%(+15.3)#192 |
| 23. | Broadlands | 18.4% | 6.2%(+12.2)#23 | 3.5%(+14.9)#202 |
| 24. | Pimmit Hills | 17.4% | 6.2%(+11.2)#24 | 3.5%(+13.9)#223 |
| 25. | Waterford | 17.3% | 6.2%(+11.1)#25 | 3.5%(+13.8)#226 |
| 26. | Franconia | 16.6% | 6.2%(+10.3)#26 | 3.5%(+13.0)#247 |
| 27. | One Loudoun | 16.5% | 6.2%(+10.3)#27 | 3.5%(+13.0)#249 |
| 28. | Lake Land Or | 16.5% | 6.2%(+10.3)#28 | 3.5%(+13.0)#251 |
| 29. | Fair Oaks | 16.2% | 6.2%(+9.97)#29 | 3.5%(+12.7)#261 |
| 30. | Dooms | 16.2% | 6.2%(+9.95)#30 | 3.5%(+12.7)#262 |
| 31. | Dahlgren Center | 15.8% | 6.2%(+9.52)#31 | 3.5%(+12.2)#281 |
| 32. | Great Falls Crossing | 15.7% | 6.2%(+9.45)#32 | 3.5%(+12.2)#285 |
| 33. | Hayfield | 15.4% | 6.2%(+9.18)#33 | 3.5%(+11.9)#291 |
| 34. | Cascades | 15.4% | 6.2%(+9.13)#34 | 3.5%(+11.8)#297 |
| 35. | Opal | 15.2% | 6.2%(+8.98)#35 | 3.5%(+11.7)#304 |
| 36. | Dulles Town Center | 15.1% | 6.2%(+8.83)#36 | 3.5%(+11.5)#310 |
| 37. | Wise | 15.1% | 6.2%(+8.82)#37 | 3.5%(+11.5)#312 |
| 38. | Fairfax Station | 15.0% | 6.2%(+8.80)#38 | 3.5%(+11.5)#314 |
| 39. | Fort Chiswell | 15.0% | 6.2%(+8.73)#39 | 3.5%(+11.4)#319 |
| 40. | Reston | 14.9% | 6.2%(+8.68)#40 | 3.5%(+11.4)#321 |
| 41. | Dranesville | 14.9% | 6.2%(+8.67)#41 | 3.5%(+11.4)#323 |
| 42. | Franklin Farm | 14.9% | 6.2%(+8.63)#42 | 3.5%(+11.3)#324 |
| 43. | Innsbrook | 14.7% | 6.2%(+8.47)#43 | 3.5%(+11.2)#331 |
| 44. | Stone Ridge | 14.7% | 6.2%(+8.47)#44 | 3.5%(+11.2)#332 |
| 45. | Potomac Mills | 14.6% | 6.2%(+8.31)#45 | 3.5%(+11.0)#337 |
| 46. | Oakton | 14.5% | 6.2%(+8.24)#46 | 3.5%(+11.0)#344 |
| 47. | Short Pump | 14.4% | 6.2%(+8.17)#47 | 3.5%(+10.9)#349 |
| 48. | Woodburn | 14.2% | 6.2%(+7.92)#48 | 3.5%(+10.6)#360 |
| 49. | Belmont | 13.9% | 6.2%(+7.69)#49 | 3.5%(+10.4)#370 |
| 50. | Braddock | 13.7% | 6.2%(+7.50)#50 | 3.5%(+10.2)#378 |
| 51. | Dahlgren | 13.7% | 6.2%(+7.47)#51 | 3.5%(+10.2)#379 |
| 52. | Idylwood | 13.5% | 6.2%(+7.22)#52 | 3.5%(+9.93)#395 |
| 53. | Ashburn | 13.3% | 6.2%(+7.07)#53 | 3.5%(+9.78)#408 |
| 54. | Elliston | 13.0% | 6.2%(+6.81)#54 | 3.5%(+9.52)#428 |
| 55. | Dunn Loring | 12.9% | 6.2%(+6.70)#55 | 3.5%(+9.41)#436 |
| 56. | Goochland | 12.9% | 6.2%(+6.68)#56 | 3.5%(+9.39)#438 |
| 57. | Huntington | 12.8% | 6.2%(+6.59)#57 | 3.5%(+9.30)#442 |
| 58. | Shawneeland | 12.7% | 6.2%(+6.46)#58 | 3.5%(+9.17)#450 |
| 59. | Newington | 12.3% | 6.2%(+6.11)#59 | 3.5%(+8.82)#466 |
| 60. | Lorton | 12.3% | 6.2%(+6.11)#60 | 3.5%(+8.82)#468 |
| 61. | Centreville | 12.3% | 6.2%(+6.05)#61 | 3.5%(+8.76)#475 |
| 62. | Port Republic | 12.2% | 6.2%(+5.96)#62 | 3.5%(+8.67)#479 |
| 63. | Wyndham | 12.2% | 6.2%(+5.93)#63 | 3.5%(+8.64)#482 |
| 64. | Burke Centre | 12.2% | 6.2%(+5.92)#64 | 3.5%(+8.63)#483 |
| 65. | Countryside | 12.1% | 6.2%(+5.83)#65 | 3.5%(+8.54)#491 |
| 66. | Herndon | 12.1% | 6.2%(+5.81)#66 | 3.5%(+8.53)#493 |
| 67. | Sugarland Run | 11.9% | 6.2%(+5.67)#67 | 3.5%(+8.39)#503 |
| 68. | Falls Church | 11.9% | 6.2%(+5.65)#68 | 3.5%(+8.36)#507 |
| 69. | Kingstowne | 11.8% | 6.2%(+5.55)#69 | 3.5%(+8.26)#516 |
| 70. | Lansdowne | 11.7% | 6.2%(+5.47)#70 | 3.5%(+8.18)#525 |
| 71. | Sedley | 11.5% | 6.2%(+5.25)#71 | 3.5%(+7.96)#541 |
| 72. | Montclair | 11.5% | 6.2%(+5.24)#72 | 3.5%(+7.95)#543 |
| 73. | Chantilly | 11.4% | 6.2%(+5.17)#73 | 3.5%(+7.88)#548 |
| 74. | Yorktown | 11.3% | 6.2%(+5.02)#74 | 3.5%(+7.73)#565 |
| 75. | Laurel Hill | 11.3% | 6.2%(+5.02)#75 | 3.5%(+7.73)#566 |
| 76. | Pungoteague | 11.3% | 6.2%(+5.01)#76 | 3.5%(+7.73)#567 |
| 77. | Lowes Island | 11.2% | 6.2%(+4.97)#77 | 3.5%(+7.68)#569 |
| 78. | Arlington | 11.2% | 6.2%(+4.93)#78 | 3.5%(+7.64)#571 |
| 79. | Shenandoah Shores | 11.1% | 6.2%(+4.91)#79 | 3.5%(+7.62)#572 |
| 80. | Southern Gateway | 11.1% | 6.2%(+4.83)#80 | 3.5%(+7.54)#587 |
| 81. | Kings Park West | 11.0% | 6.2%(+4.79)#81 | 3.5%(+7.50)#588 |
| 82. | Mantua | 10.9% | 6.2%(+4.63)#82 | 3.5%(+7.34)#611 |
| 83. | Great Falls | 10.7% | 6.2%(+4.49)#83 | 3.5%(+7.21)#622 |
| 84. | Newington Forest | 10.6% | 6.2%(+4.40)#84 | 3.5%(+7.11)#637 |
| 85. | South Run | 10.6% | 6.2%(+4.36)#85 | 3.5%(+7.07)#639 |
| 86. | Difficult Run | 10.5% | 6.2%(+4.22)#86 | 3.5%(+6.93)#661 |
| 87. | Shipman | 10.5% | 6.2%(+4.22)#87 | 3.5%(+6.93)#662 |
| 88. | Mclean | 10.4% | 6.2%(+4.19)#88 | 3.5%(+6.91)#667 |
| 89. | Mount Vernon | 10.4% | 6.2%(+4.18)#89 | 3.5%(+6.89)#670 |
| 90. | Ravensworth | 10.4% | 6.2%(+4.16)#90 | 3.5%(+6.87)#671 |
| 91. | Singers Glen | 10.3% | 6.2%(+4.06)#91 | 3.5%(+6.77)#683 |
| 92. | Leesylvania | 10.2% | 6.2%(+3.93)#92 | 3.5%(+6.64)#705 |
| 93. | Rose Hill Cdp Fairfax County | 10.2% | 6.2%(+3.93)#93 | 3.5%(+6.64)#706 |
| 94. | Burke | 10.2% | 6.2%(+3.93)#94 | 3.5%(+6.64)#707 |
| 95. | Villa Heights | 10.0% | 6.2%(+3.76)#95 | 3.5%(+6.48)#731 |
| 96. | Colonial Beach | 9.9% | 6.2%(+3.66)#96 | 3.5%(+6.37)#748 |
| 97. | Fairfax | 9.8% | 6.2%(+3.53)#97 | 3.5%(+6.24)#779 |
| 98. | George Mason | 9.7% | 6.2%(+3.45)#98 | 3.5%(+6.17)#792 |
| 99. | Linton Hall | 9.5% | 6.2%(+3.30)#99 | 3.5%(+6.01)#828 |
| 100. | Buckhall | 9.5% | 6.2%(+3.28)#100 | 3.5%(+5.99)#832 |
Common Questions
What are the Top 10 Cities with the Highest Percentage of Population Employed in Computer & Mathematics in Virginia?
Top 10 Cities with the Highest Percentage of Population Employed in Computer & Mathematics in Virginia are:
#1
39.5%
#2
26.9%
#3
25.5%
#4
25.1%
#5
22.1%
#6
21.7%
#7
21.4%
#8
20.9%
#9
19.6%
#10
19.2%
What city has the Highest Percentage of Population Employed in Computer & Mathematics in Virginia?
Loudoun Valley Estates has the Highest Percentage of Population Employed in Computer & Mathematics in Virginia with 39.5%.
What is the Percentage of Population Employed in Computer & Mathematics in the State of Virginia?
Percentage of Population Employed in Computer & Mathematics in Virginia is 6.2%.
What is the Percentage of Population Employed in Computer & Mathematics in the United States?
Percentage of Population Employed in Computer & Mathematics in the United States is 3.5%.