Wellsville, KS Map & Demographics
Wellsville Map
Wellsville Overview
$32,919
PER CAPITA INCOME
$90,515
AVG FAMILY INCOME
$68,750
AVG HOUSEHOLD INCOME
25.5%
WAGE / INCOME GAP [ % ]
74.5¢/ $1
WAGE / INCOME GAP [ $ ]
0.37
INEQUALITY / GINI INDEX
2,022
TOTAL POPULATION
987
MALE POPULATION
1,035
FEMALE POPULATION
95.36
MALES / 100 FEMALES
104.86
FEMALES / 100 MALES
37.9
MEDIAN AGE
3.1
AVG FAMILY SIZE
2.4
AVG HOUSEHOLD SIZE
948
LABOR FORCE [ PEOPLE ]
60.1%
PERCENT IN LABOR FORCE
1.7%
UNEMPLOYMENT RATE
Wellsville Zip Codes
Wellsville Area Codes
Income in Wellsville
Income Overview in Wellsville
Per Capita Income in Wellsville is $32,919, while median incomes of families and households are $90,515 and $68,750 respectively.
| Characteristic | Number | Measure |
| Per Capita Income | 2,022 | $32,919 |
| Median Family Income | 481 | $90,515 |
| Mean Family Income | 481 | $96,013 |
| Median Household Income | 811 | $68,750 |
| Mean Household Income | 811 | $78,280 |
| Income Deficit | 481 | $0 |
| Wage / Income Gap (%) | 2,022 | 25.47% |
| Wage / Income Gap ($) | 2,022 | 74.53¢ per $1 |
| Gini / Inequality Index | 2,022 | 0.37 |
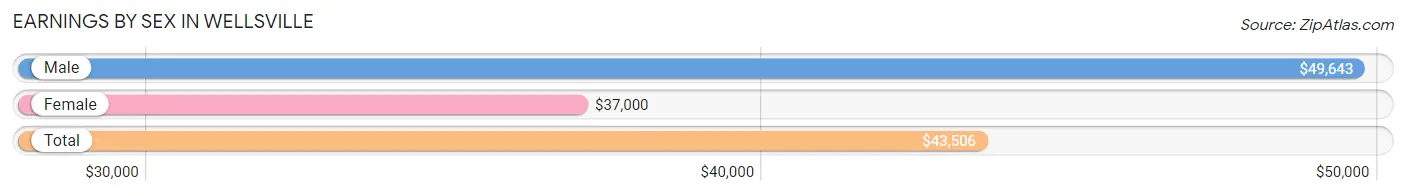
Earnings by Sex in Wellsville
Average Earnings in Wellsville are $43,506, $49,643 for men and $37,000 for women, a difference of 25.5%.
| Sex | Number | Average Earnings |
| Male | 574 (55.8%) | $49,643 |
| Female | 454 (44.2%) | $37,000 |
| Total | 1,028 (100.0%) | $43,506 |
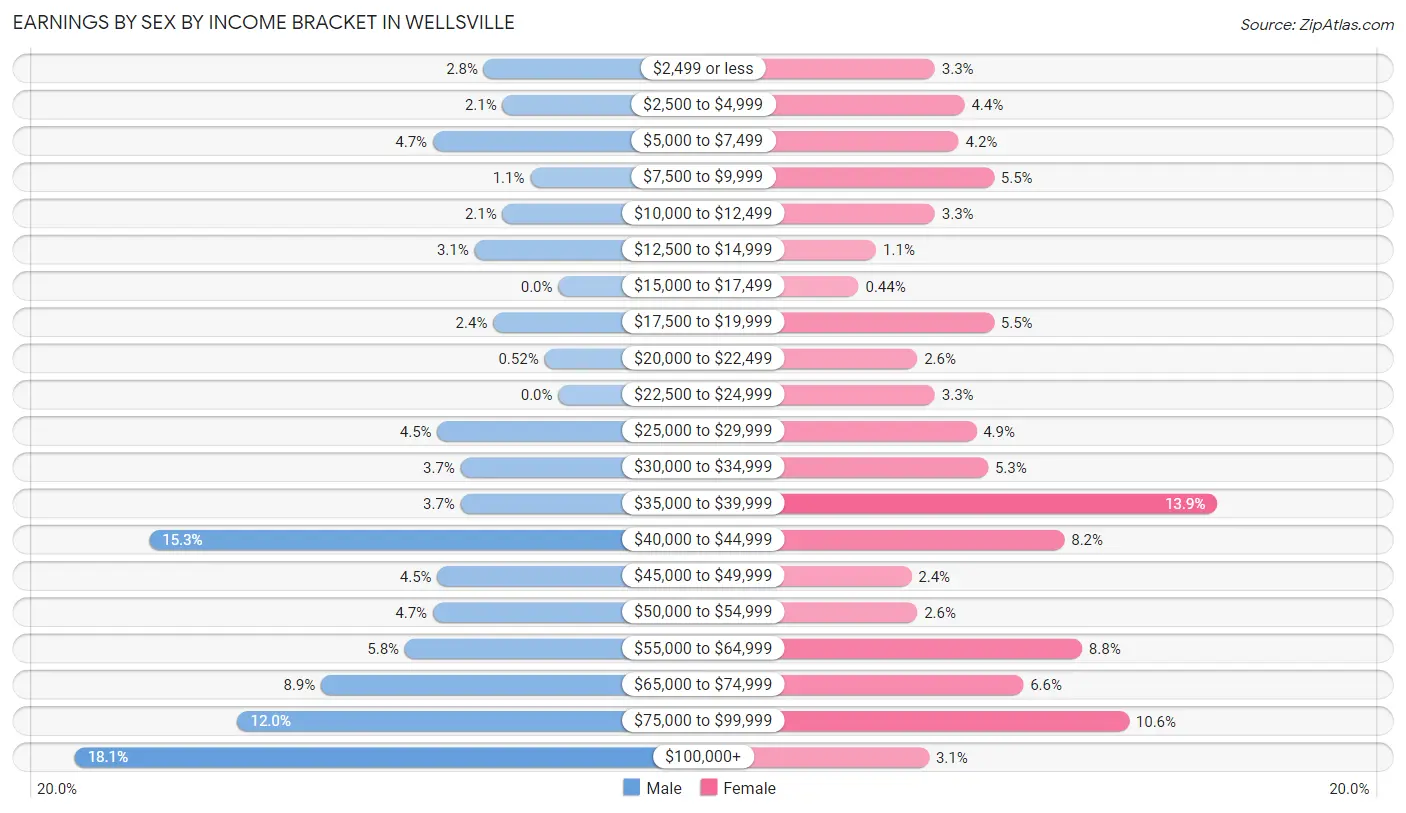
Earnings by Sex by Income Bracket in Wellsville
The most common earnings brackets in Wellsville are $100,000+ for men (104 | 18.1%) and $35,000 to $39,999 for women (63 | 13.9%).
| Income | Male | Female |
| $2,499 or less | 16 (2.8%) | 15 (3.3%) |
| $2,500 to $4,999 | 12 (2.1%) | 20 (4.4%) |
| $5,000 to $7,499 | 27 (4.7%) | 19 (4.2%) |
| $7,500 to $9,999 | 6 (1.1%) | 25 (5.5%) |
| $10,000 to $12,499 | 12 (2.1%) | 15 (3.3%) |
| $12,500 to $14,999 | 18 (3.1%) | 5 (1.1%) |
| $15,000 to $17,499 | 0 (0.0%) | 2 (0.4%) |
| $17,500 to $19,999 | 14 (2.4%) | 25 (5.5%) |
| $20,000 to $22,499 | 3 (0.5%) | 12 (2.6%) |
| $22,500 to $24,999 | 0 (0.0%) | 15 (3.3%) |
| $25,000 to $29,999 | 26 (4.5%) | 22 (4.9%) |
| $30,000 to $34,999 | 21 (3.7%) | 24 (5.3%) |
| $35,000 to $39,999 | 21 (3.7%) | 63 (13.9%) |
| $40,000 to $44,999 | 88 (15.3%) | 37 (8.2%) |
| $45,000 to $49,999 | 26 (4.5%) | 11 (2.4%) |
| $50,000 to $54,999 | 27 (4.7%) | 12 (2.6%) |
| $55,000 to $64,999 | 33 (5.8%) | 40 (8.8%) |
| $65,000 to $74,999 | 51 (8.9%) | 30 (6.6%) |
| $75,000 to $99,999 | 69 (12.0%) | 48 (10.6%) |
| $100,000+ | 104 (18.1%) | 14 (3.1%) |
| Total | 574 (100.0%) | 454 (100.0%) |
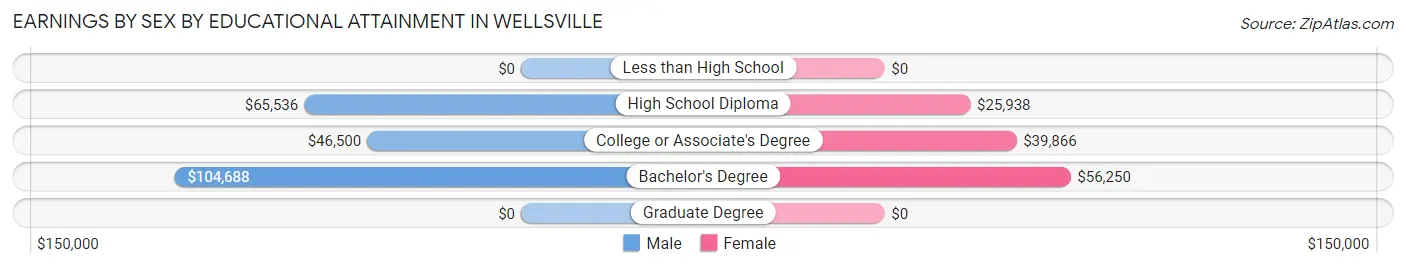
Earnings by Sex by Educational Attainment in Wellsville
Average earnings in Wellsville are $58,229 for men and $38,884 for women, a difference of 33.2%. Men with an educational attainment of bachelor's degree enjoy the highest average annual earnings of $104,688, while those with college or associate's degree education earn the least with $46,500. Women with an educational attainment of bachelor's degree earn the most with the average annual earnings of $56,250, while those with high school diploma education have the smallest earnings of $25,938.
| Educational Attainment | Male Income | Female Income |
| Less than High School | - | - |
| High School Diploma | $65,536 | $25,938 |
| College or Associate's Degree | $46,500 | $39,866 |
| Bachelor's Degree | $104,688 | $56,250 |
| Graduate Degree | - | - |
| Total | $58,229 | $38,884 |
Family Income in Wellsville
Family Income Brackets in Wellsville
According to the Wellsville family income data, there are 125 families falling into the $100,000 to $149,999 income range, which is the most common income bracket and makes up 26.0% of all families. Conversely, the $10,000 to $14,999 income bracket is the least frequent group with only 6 families (1.3%) belonging to this category.
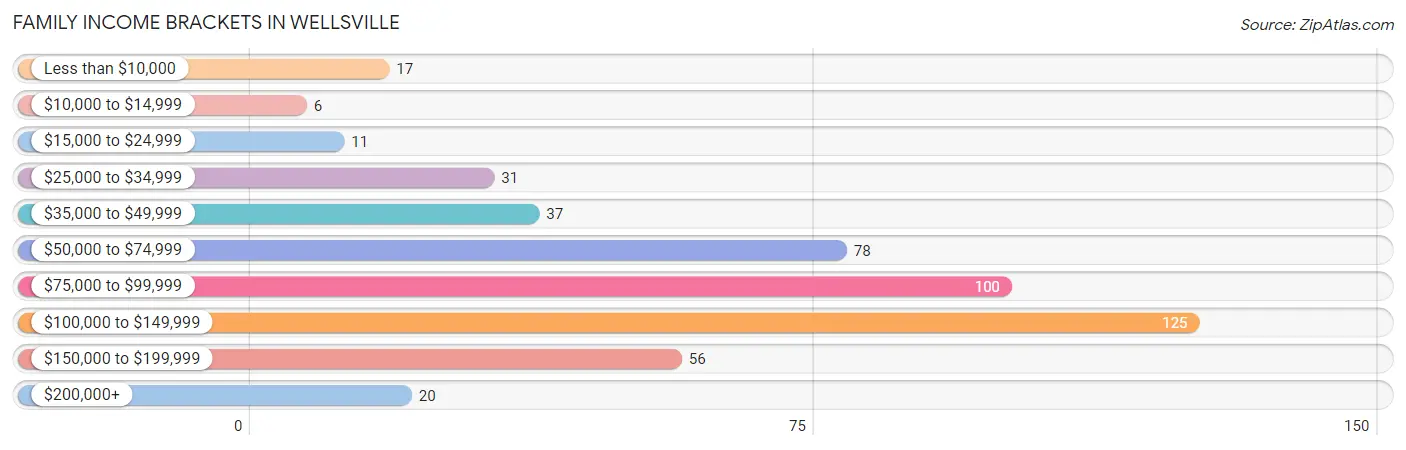
| Income Bracket | # Families | % Families |
| Less than $10,000 | 17 | 3.5% |
| $10,000 to $14,999 | 6 | 1.2% |
| $15,000 to $24,999 | 11 | 2.3% |
| $25,000 to $34,999 | 31 | 6.4% |
| $35,000 to $49,999 | 37 | 7.7% |
| $50,000 to $74,999 | 78 | 16.2% |
| $75,000 to $99,999 | 100 | 20.8% |
| $100,000 to $149,999 | 125 | 26.0% |
| $150,000 to $199,999 | 56 | 11.6% |
| $200,000+ | 20 | 4.2% |
Family Income by Famaliy Size in Wellsville
3-person families (83 | 17.3%) account for the highest median family income in Wellsville with $111,250 per family, while 2-person families (237 | 49.3%) have the highest median income of $40,804 per family member.
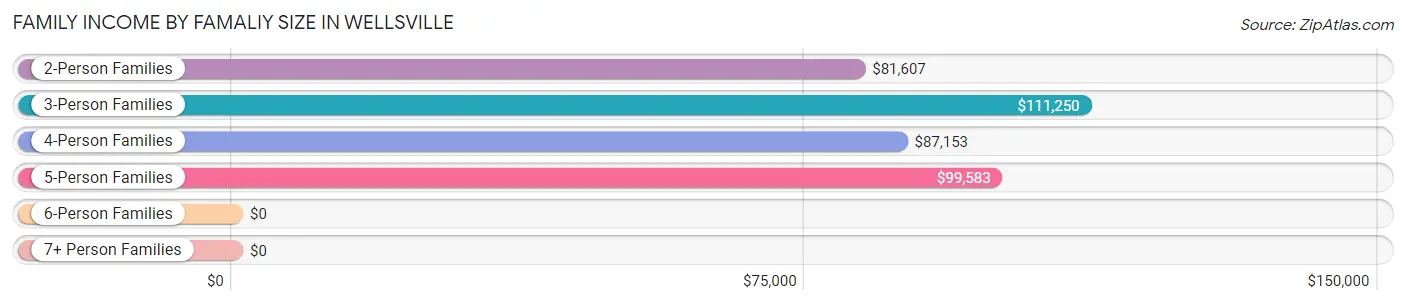
| Income Bracket | # Families | Median Income |
| 2-Person Families | 237 (49.3%) | $81,607 |
| 3-Person Families | 83 (17.3%) | $111,250 |
| 4-Person Families | 83 (17.3%) | $87,153 |
| 5-Person Families | 59 (12.3%) | $99,583 |
| 6-Person Families | 10 (2.1%) | $0 |
| 7+ Person Families | 9 (1.9%) | $0 |
| Total | 481 (100.0%) | $90,515 |
Family Income by Number of Earners in Wellsville
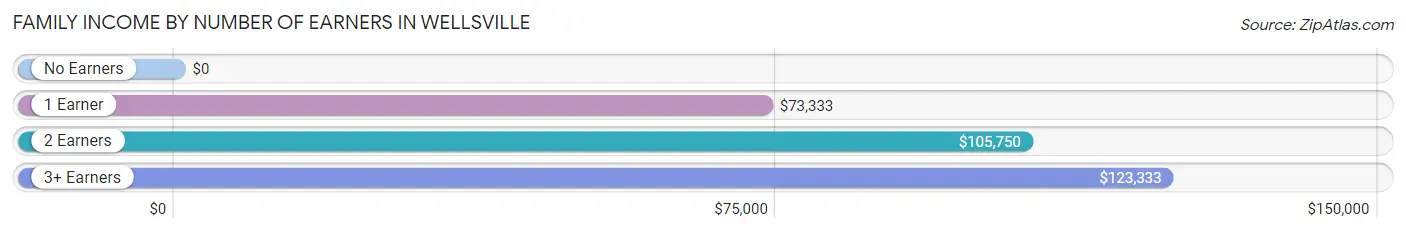
| Number of Earners | # Families | Median Income |
| No Earners | 44 (9.1%) | $0 |
| 1 Earner | 164 (34.1%) | $73,333 |
| 2 Earners | 223 (46.4%) | $105,750 |
| 3+ Earners | 50 (10.4%) | $123,333 |
| Total | 481 (100.0%) | $90,515 |
Household Income in Wellsville
Household Income Brackets in Wellsville
With 165 households falling in the category, the $75,000 to $99,999 income range is the most frequent in Wellsville, accounting for 20.3% of all households. In contrast, only 18 households (2.2%) fall into the $15,000 to $24,999 income bracket, making it the least populous group.
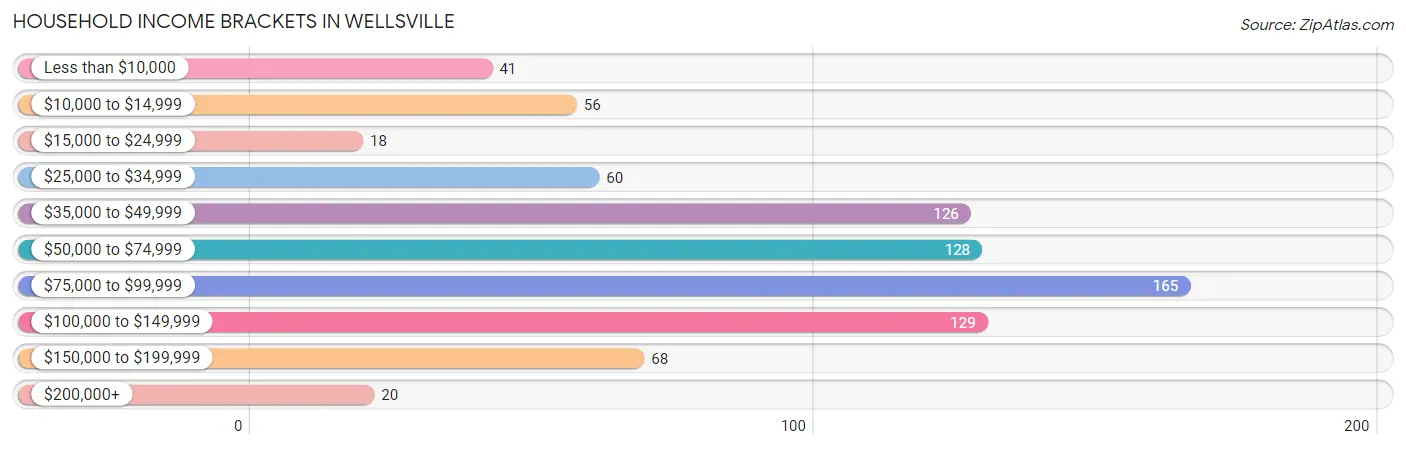
| Income Bracket | # Households | % Households |
| Less than $10,000 | 41 | 5.1% |
| $10,000 to $14,999 | 56 | 6.9% |
| $15,000 to $24,999 | 18 | 2.2% |
| $25,000 to $34,999 | 60 | 7.4% |
| $35,000 to $49,999 | 126 | 15.5% |
| $50,000 to $74,999 | 128 | 15.8% |
| $75,000 to $99,999 | 165 | 20.3% |
| $100,000 to $149,999 | 129 | 15.9% |
| $150,000 to $199,999 | 68 | 8.4% |
| $200,000+ | 20 | 2.5% |
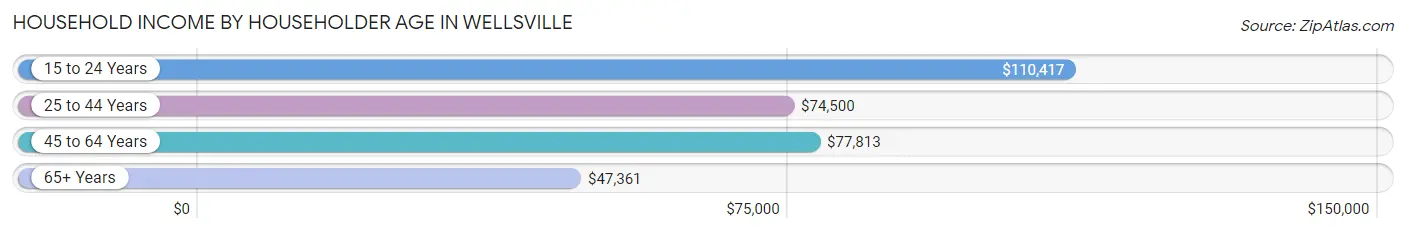
Household Income by Householder Age in Wellsville
The median household income in Wellsville is $68,750, with the highest median household income of $110,417 found in the 15 to 24 years age bracket for the primary householder. A total of 13 households (1.6%) fall into this category. Meanwhile, the 65+ years age bracket for the primary householder has the lowest median household income of $47,361, with 185 households (22.8%) in this group.
| Income Bracket | # Households | Median Income |
| 15 to 24 Years | 13 (1.6%) | $110,417 |
| 25 to 44 Years | 302 (37.2%) | $74,500 |
| 45 to 64 Years | 311 (38.4%) | $77,813 |
| 65+ Years | 185 (22.8%) | $47,361 |
| Total | 811 (100.0%) | $68,750 |
Poverty in Wellsville
Income Below Poverty by Sex and Age in Wellsville
With 11.7% poverty level for males and 7.8% for females among the residents of Wellsville, 16 and 17 year old males and 75 year old and over females are the most vulnerable to poverty, with 16 males (42.1%) and 14 females (25.0%) in their respective age groups living below the poverty level.
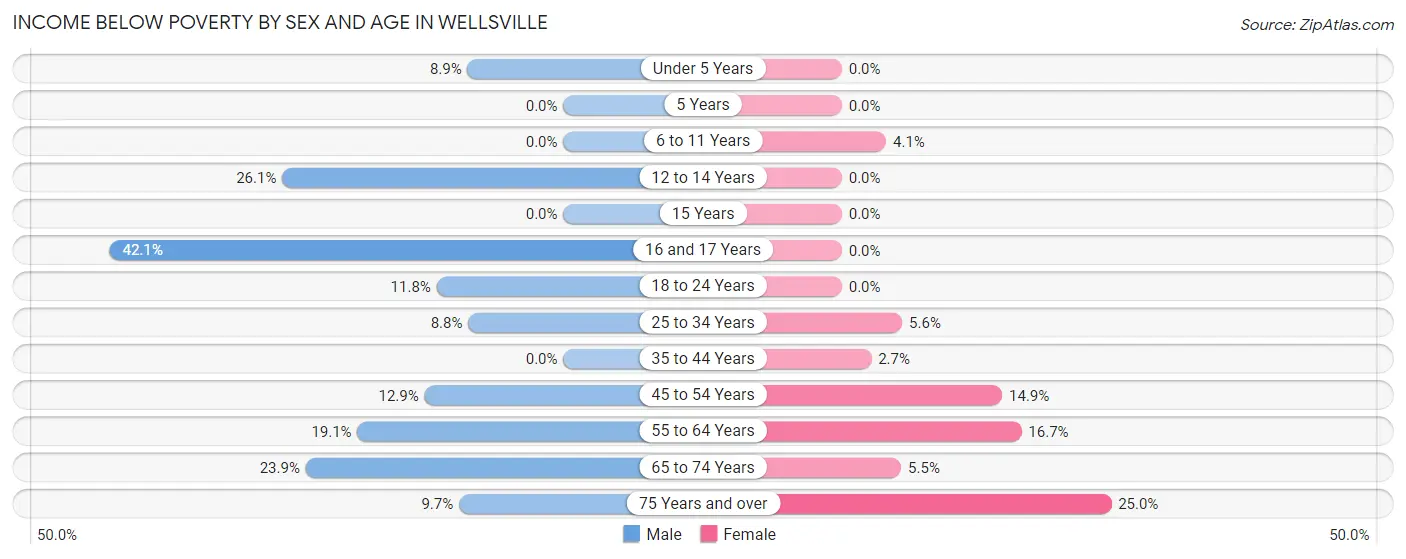
| Age Bracket | Male | Female |
| Under 5 Years | 4 (8.9%) | 0 (0.0%) |
| 5 Years | 0 (0.0%) | 0 (0.0%) |
| 6 to 11 Years | 0 (0.0%) | 3 (4.1%) |
| 12 to 14 Years | 12 (26.1%) | 0 (0.0%) |
| 15 Years | 0 (0.0%) | 0 (0.0%) |
| 16 and 17 Years | 16 (42.1%) | 0 (0.0%) |
| 18 to 24 Years | 8 (11.8%) | 0 (0.0%) |
| 25 to 34 Years | 12 (8.8%) | 7 (5.6%) |
| 35 to 44 Years | 0 (0.0%) | 3 (2.7%) |
| 45 to 54 Years | 17 (12.9%) | 18 (14.9%) |
| 55 to 64 Years | 30 (19.1%) | 24 (16.7%) |
| 65 to 74 Years | 11 (23.9%) | 7 (5.5%) |
| 75 Years and over | 3 (9.7%) | 14 (25.0%) |
| Total | 113 (11.7%) | 76 (7.8%) |
Income Above Poverty by Sex and Age in Wellsville
According to the poverty statistics in Wellsville, males aged 5 years and females aged under 5 years are the age groups that are most secure financially, with 100.0% of males and 100.0% of females in these age groups living above the poverty line.
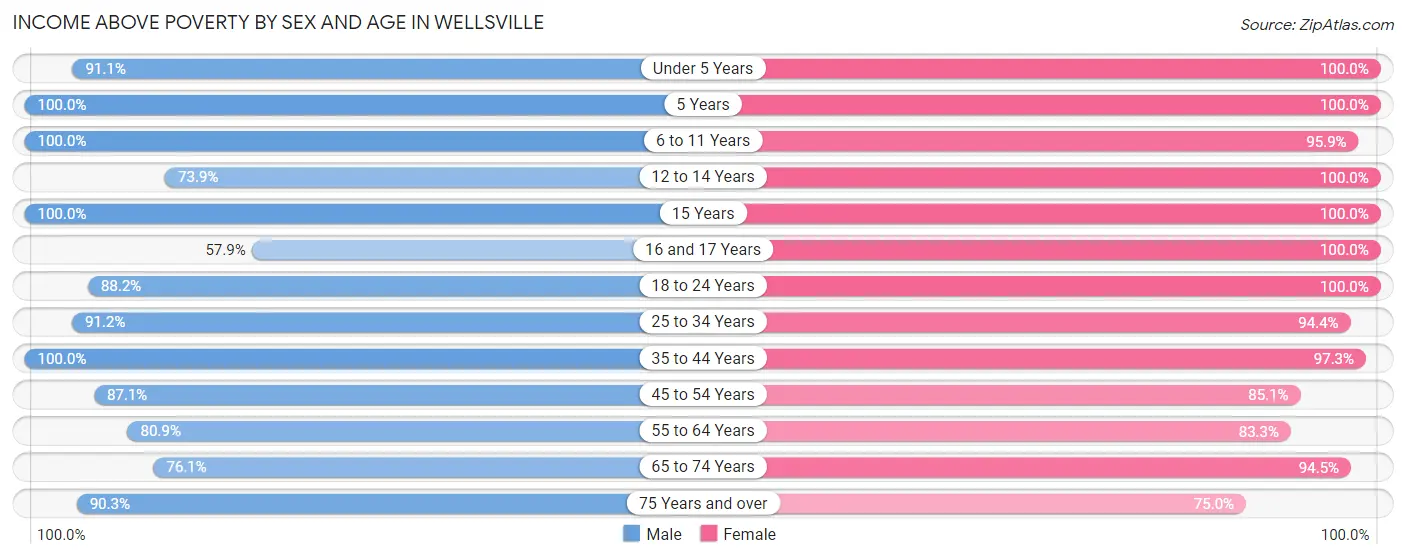
| Age Bracket | Male | Female |
| Under 5 Years | 41 (91.1%) | 86 (100.0%) |
| 5 Years | 7 (100.0%) | 21 (100.0%) |
| 6 to 11 Years | 82 (100.0%) | 70 (95.9%) |
| 12 to 14 Years | 34 (73.9%) | 24 (100.0%) |
| 15 Years | 33 (100.0%) | 6 (100.0%) |
| 16 and 17 Years | 22 (57.9%) | 23 (100.0%) |
| 18 to 24 Years | 60 (88.2%) | 57 (100.0%) |
| 25 to 34 Years | 124 (91.2%) | 118 (94.4%) |
| 35 to 44 Years | 144 (100.0%) | 107 (97.3%) |
| 45 to 54 Years | 115 (87.1%) | 103 (85.1%) |
| 55 to 64 Years | 127 (80.9%) | 120 (83.3%) |
| 65 to 74 Years | 35 (76.1%) | 120 (94.5%) |
| 75 Years and over | 28 (90.3%) | 42 (75.0%) |
| Total | 852 (88.3%) | 897 (92.2%) |
Income Below Poverty Among Married-Couple Families in Wellsville
The poverty statistics for married-couple families in Wellsville show that 0.9% or 3 of the total 334 families live below the poverty line. Families with no children have the highest poverty rate of 1.8%, comprising of 3 families. On the other hand, families with 1 or 2 children have the lowest poverty rate of 0.0%, which includes 0 families.
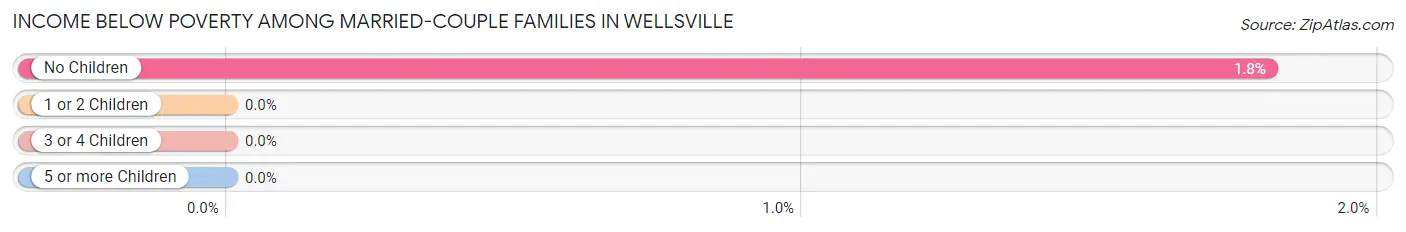
| Children | Above Poverty | Below Poverty |
| No Children | 163 (98.2%) | 3 (1.8%) |
| 1 or 2 Children | 123 (100.0%) | 0 (0.0%) |
| 3 or 4 Children | 45 (100.0%) | 0 (0.0%) |
| 5 or more Children | 0 (0.0%) | 0 (0.0%) |
| Total | 331 (99.1%) | 3 (0.9%) |
Income Below Poverty Among Single-Parent Households in Wellsville
According to the poverty data in Wellsville, 17.5% or 11 single-father households and 14.3% or 12 single-mother households are living below the poverty line. Among single-father households, those with 1 or 2 children have the highest poverty rate, with 11 households (20.4%) experiencing poverty. Likewise, among single-mother households, those with 1 or 2 children have the highest poverty rate, with 9 households (22.5%) falling below the poverty line.
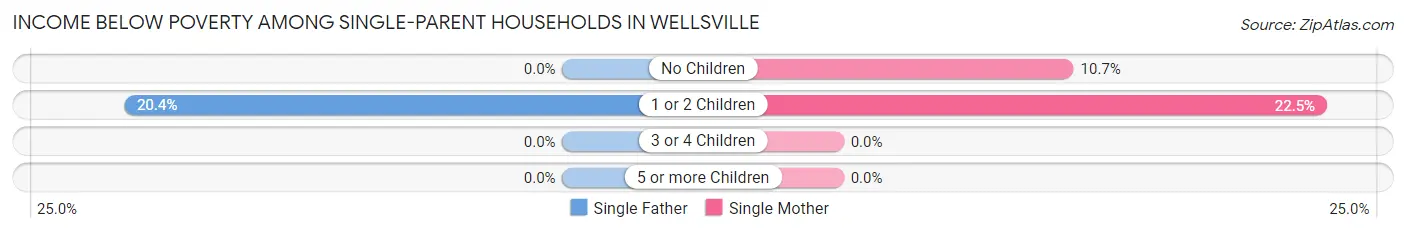
| Children | Single Father | Single Mother |
| No Children | 0 (0.0%) | 3 (10.7%) |
| 1 or 2 Children | 11 (20.4%) | 9 (22.5%) |
| 3 or 4 Children | 0 (0.0%) | 0 (0.0%) |
| 5 or more Children | 0 (0.0%) | 0 (0.0%) |
| Total | 11 (17.5%) | 12 (14.3%) |
Income Below Poverty Among Married-Couple vs Single-Parent Households in Wellsville
The poverty data for Wellsville shows that 3 of the married-couple family households (0.9%) and 23 of the single-parent households (15.7%) are living below the poverty level. Within the married-couple family households, those with no children have the highest poverty rate, with 3 households (1.8%) falling below the poverty line. Among the single-parent households, those with 1 or 2 children have the highest poverty rate, with 20 household (21.3%) living below poverty.
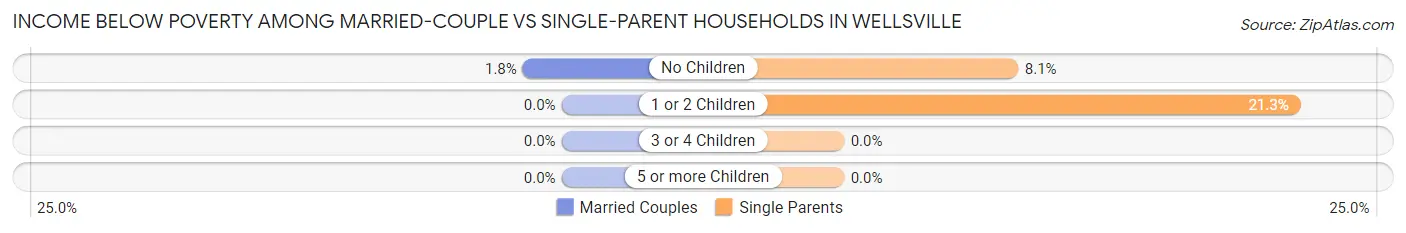
| Children | Married-Couple Families | Single-Parent Households |
| No Children | 3 (1.8%) | 3 (8.1%) |
| 1 or 2 Children | 0 (0.0%) | 20 (21.3%) |
| 3 or 4 Children | 0 (0.0%) | 0 (0.0%) |
| 5 or more Children | 0 (0.0%) | 0 (0.0%) |
| Total | 3 (0.9%) | 23 (15.7%) |
Race in Wellsville
The most populous races in Wellsville are White / Caucasian (1,927 | 95.3%), Hispanic or Latino (116 | 5.7%), and Two or more Races (83 | 4.1%).
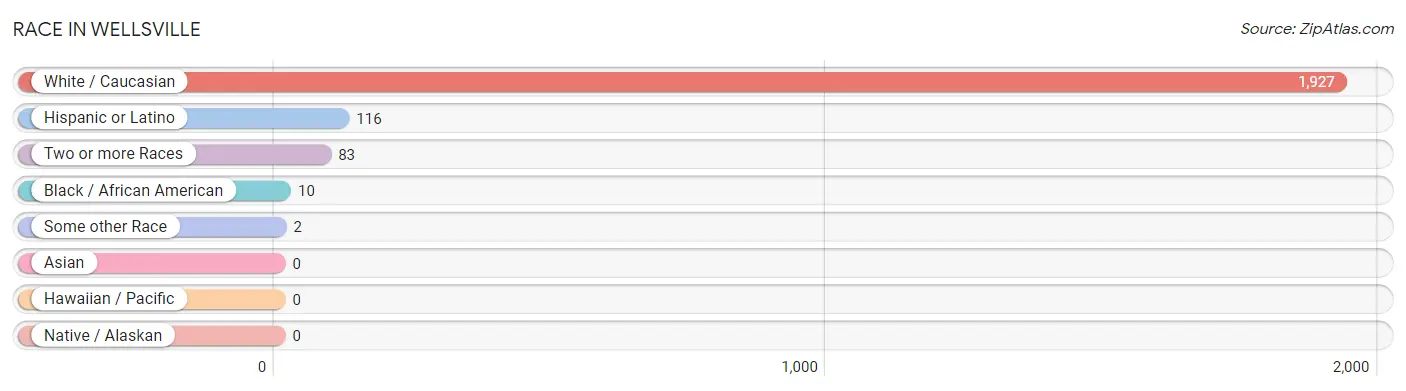
| Race | # Population | % Population |
| Asian | 0 | 0.0% |
| Black / African American | 10 | 0.5% |
| Hawaiian / Pacific | 0 | 0.0% |
| Hispanic or Latino | 116 | 5.7% |
| Native / Alaskan | 0 | 0.0% |
| White / Caucasian | 1,927 | 95.3% |
| Two or more Races | 83 | 4.1% |
| Some other Race | 2 | 0.1% |
| Total | 2,022 | 100.0% |
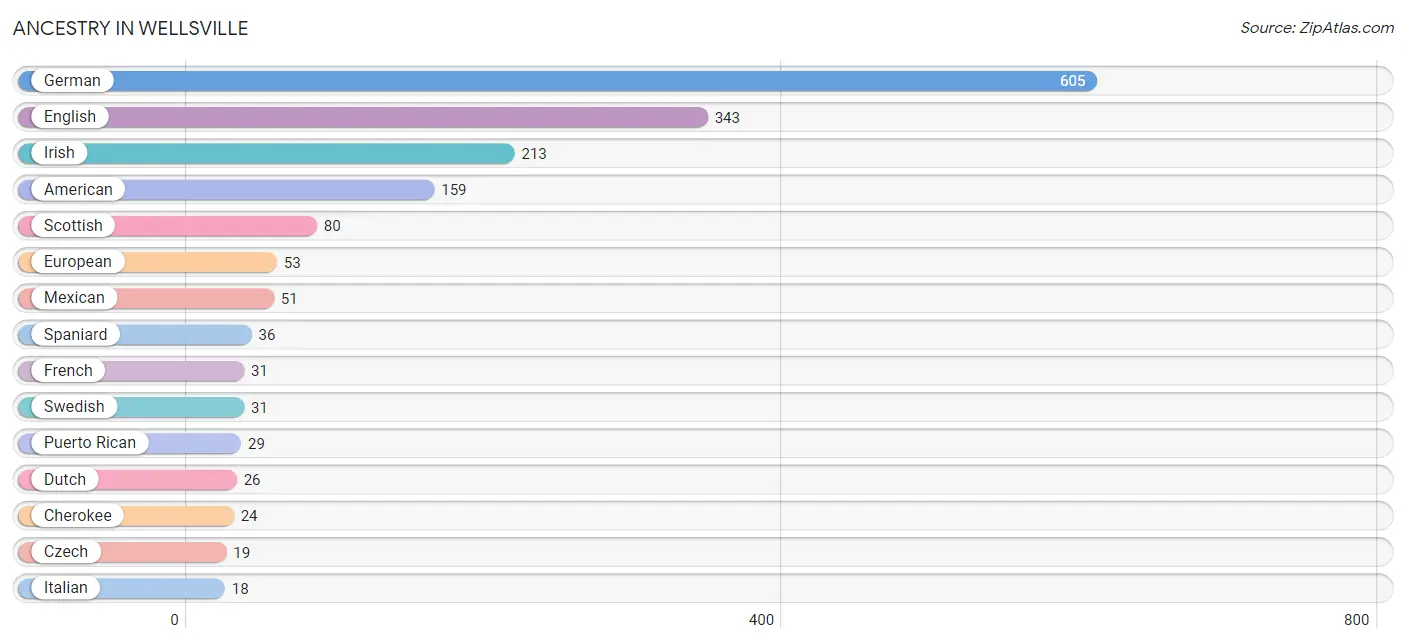
Ancestry in Wellsville
The most populous ancestries reported in Wellsville are German (605 | 29.9%), English (343 | 17.0%), Irish (213 | 10.5%), American (159 | 7.9%), and Scottish (80 | 4.0%), together accounting for 69.2% of all Wellsville residents.
| Ancestry | # Population | % Population |
| African | 7 | 0.4% |
| American | 159 | 7.9% |
| Belgian | 5 | 0.3% |
| British | 5 | 0.3% |
| Cherokee | 24 | 1.2% |
| Czech | 19 | 0.9% |
| Czechoslovakian | 3 | 0.2% |
| Danish | 5 | 0.3% |
| Dutch | 26 | 1.3% |
| English | 343 | 17.0% |
| European | 53 | 2.6% |
| French | 31 | 1.5% |
| French Canadian | 4 | 0.2% |
| German | 605 | 29.9% |
| Greek | 2 | 0.1% |
| Hungarian | 4 | 0.2% |
| Irish | 213 | 10.5% |
| Italian | 18 | 0.9% |
| Mexican | 51 | 2.5% |
| Navajo | 7 | 0.4% |
| Polish | 4 | 0.2% |
| Puerto Rican | 29 | 1.4% |
| Scandinavian | 2 | 0.1% |
| Scotch-Irish | 15 | 0.7% |
| Scottish | 80 | 4.0% |
| Spaniard | 36 | 1.8% |
| Subsaharan African | 7 | 0.4% |
| Swedish | 31 | 1.5% |
| Swiss | 10 | 0.5% |
| Welsh | 4 | 0.2% | View All 30 Rows |
Immigrants in Wellsville
The most numerous immigrant groups reported in Wellsville came from Europe (8 | 0.4%), Western Europe (8 | 0.4%), Central America (7 | 0.4%), Latin America (7 | 0.4%), and Mexico (7 | 0.4%), together accounting for 1.8% of all Wellsville residents.
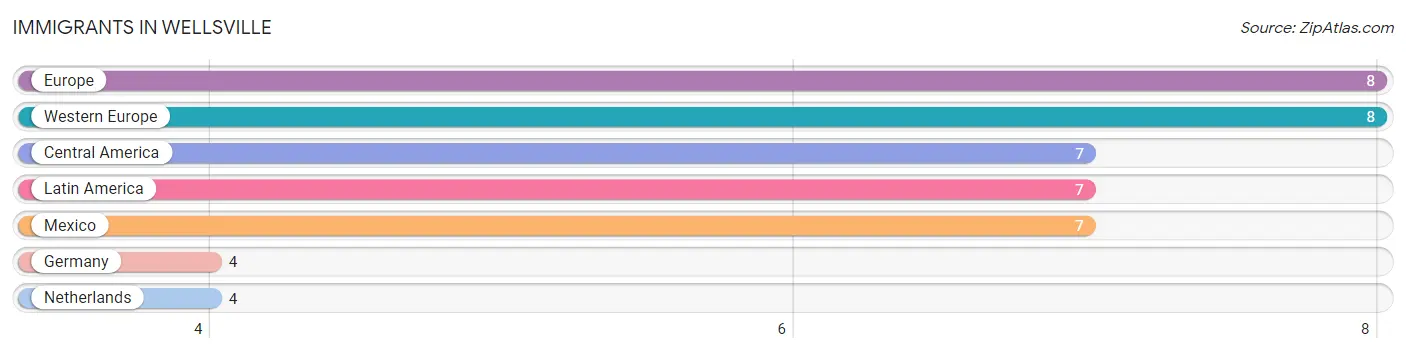
| Immigration Origin | # Population | % Population |
| Central America | 7 | 0.4% |
| Europe | 8 | 0.4% |
| Germany | 4 | 0.2% |
| Latin America | 7 | 0.4% |
| Mexico | 7 | 0.4% |
| Netherlands | 4 | 0.2% |
| Western Europe | 8 | 0.4% | View All 7 Rows |
Sex and Age in Wellsville
Sex and Age in Wellsville
The most populous age groups in Wellsville are 35 to 39 Years (117 | 11.8%) for men and Under 5 Years (93 | 9.0%) for women.
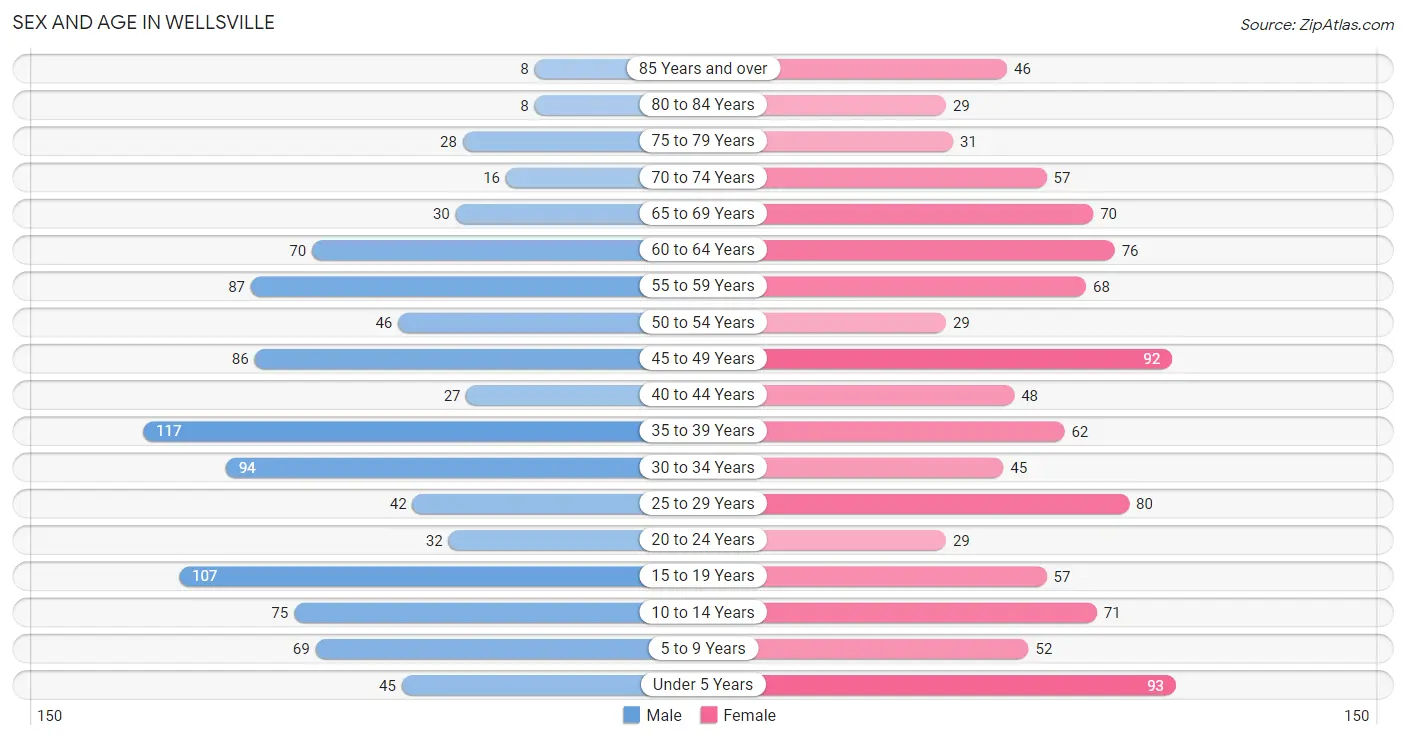
| Age Bracket | Male | Female |
| Under 5 Years | 45 (4.6%) | 93 (9.0%) |
| 5 to 9 Years | 69 (7.0%) | 52 (5.0%) |
| 10 to 14 Years | 75 (7.6%) | 71 (6.9%) |
| 15 to 19 Years | 107 (10.8%) | 57 (5.5%) |
| 20 to 24 Years | 32 (3.2%) | 29 (2.8%) |
| 25 to 29 Years | 42 (4.3%) | 80 (7.7%) |
| 30 to 34 Years | 94 (9.5%) | 45 (4.3%) |
| 35 to 39 Years | 117 (11.8%) | 62 (6.0%) |
| 40 to 44 Years | 27 (2.7%) | 48 (4.6%) |
| 45 to 49 Years | 86 (8.7%) | 92 (8.9%) |
| 50 to 54 Years | 46 (4.7%) | 29 (2.8%) |
| 55 to 59 Years | 87 (8.8%) | 68 (6.6%) |
| 60 to 64 Years | 70 (7.1%) | 76 (7.3%) |
| 65 to 69 Years | 30 (3.0%) | 70 (6.8%) |
| 70 to 74 Years | 16 (1.6%) | 57 (5.5%) |
| 75 to 79 Years | 28 (2.8%) | 31 (3.0%) |
| 80 to 84 Years | 8 (0.8%) | 29 (2.8%) |
| 85 Years and over | 8 (0.8%) | 46 (4.4%) |
| Total | 987 (100.0%) | 1,035 (100.0%) |
Families and Households in Wellsville
Median Family Size in Wellsville
The median family size in Wellsville is 3.09 persons per family, with married-couple families (334 | 69.4%) accounting for the largest median family size of 3.31 persons per family. On the other hand, single male/father families (63 | 13.1%) represent the smallest median family size with 2.08 persons per family.
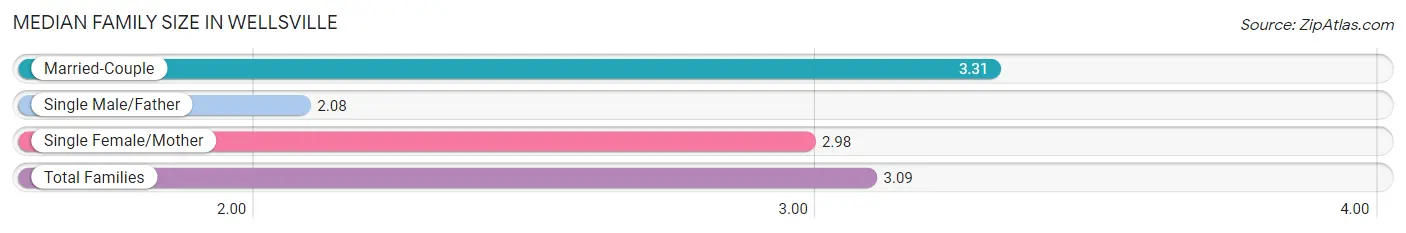
| Family Type | # Families | Family Size |
| Married-Couple | 334 (69.4%) | 3.31 |
| Single Male/Father | 63 (13.1%) | 2.08 |
| Single Female/Mother | 84 (17.5%) | 2.98 |
| Total Families | 481 (100.0%) | 3.09 |
Median Household Size in Wellsville
The median household size in Wellsville is 2.42 persons per household, with married-couple households (334 | 41.2%) accounting for the largest median household size of 3.33 persons per household. non-family households (330 | 40.7%) represent the smallest median household size with 1.23 persons per household.
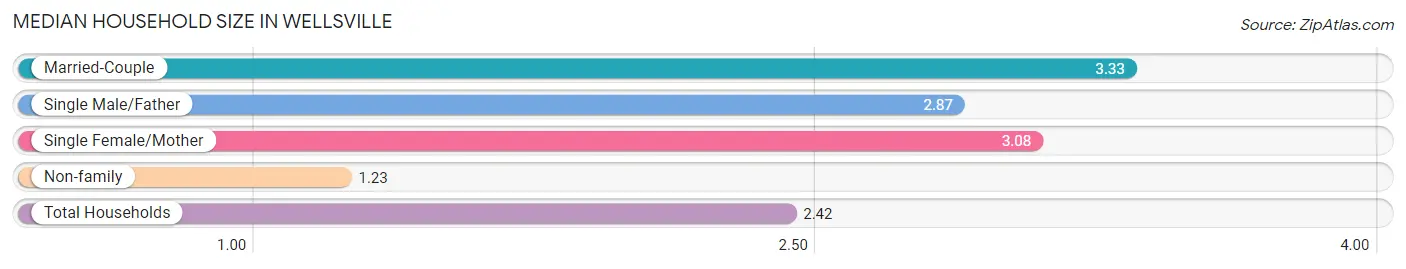
| Household Type | # Households | Household Size |
| Married-Couple | 334 (41.2%) | 3.33 |
| Single Male/Father | 63 (7.8%) | 2.87 |
| Single Female/Mother | 84 (10.4%) | 3.08 |
| Non-family | 330 (40.7%) | 1.23 |
| Total Households | 811 (100.0%) | 2.42 |
Household Size by Marriage Status in Wellsville
Out of a total of 811 households in Wellsville, 481 (59.3%) are family households, while 330 (40.7%) are nonfamily households. The most numerous type of family households are 2-person households, comprising 211, and the most common type of nonfamily households are 1-person households, comprising 273.
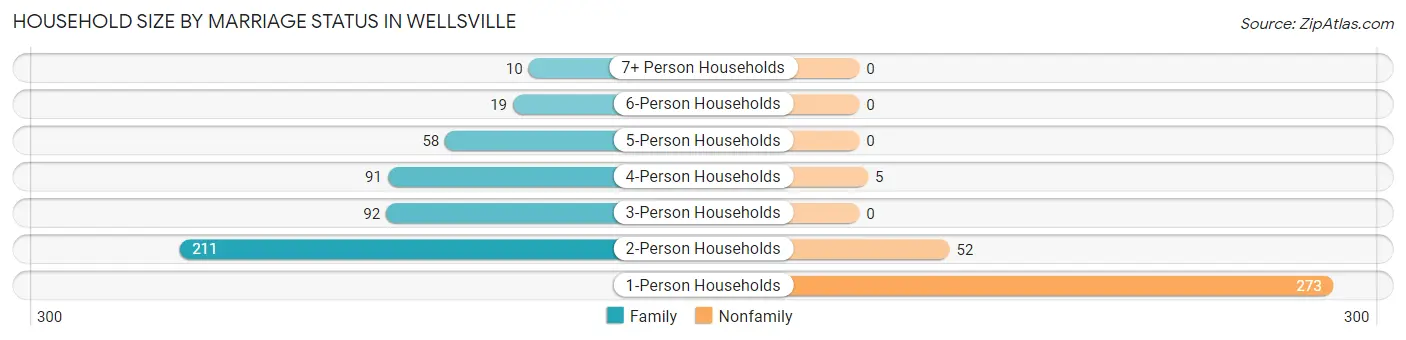
| Household Size | Family Households | Nonfamily Households |
| 1-Person Households | - | 273 (33.7%) |
| 2-Person Households | 211 (26.0%) | 52 (6.4%) |
| 3-Person Households | 92 (11.3%) | 0 (0.0%) |
| 4-Person Households | 91 (11.2%) | 5 (0.6%) |
| 5-Person Households | 58 (7.1%) | 0 (0.0%) |
| 6-Person Households | 19 (2.3%) | 0 (0.0%) |
| 7+ Person Households | 10 (1.2%) | 0 (0.0%) |
| Total | 481 (59.3%) | 330 (40.7%) |
Female Fertility in Wellsville
Fertility by Age in Wellsville
Average fertility rate in Wellsville is 126.0 births per 1,000 women. Women in the age bracket of 35 to 50 years have the highest fertility rate with 163.0 births per 1,000 women. Women in the age bracket of 35 to 50 years acount for 63.5% of all women with births.
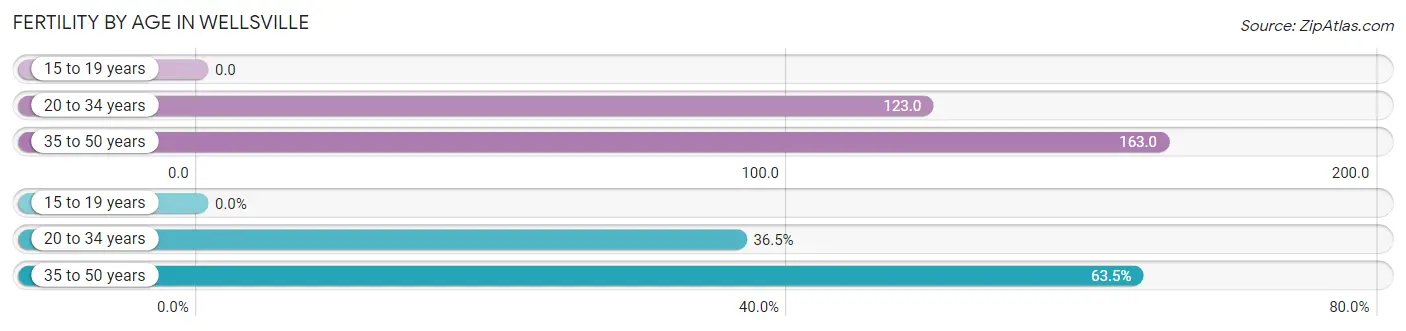
| Age Bracket | Women with Births | Births / 1,000 Women |
| 15 to 19 years | 0 (0.0%) | 0.0 |
| 20 to 34 years | 19 (36.5%) | 123.0 |
| 35 to 50 years | 33 (63.5%) | 163.0 |
| Total | 52 (100.0%) | 126.0 |
Fertility by Age by Marriage Status in Wellsville
23.1% of women with births (52) in Wellsville are married. The highest percentage of unmarried women with births falls into 35 to 50 years age bracket with 100.0% of them unmarried at the time of birth, while the lowest percentage of unmarried women with births belong to 20 to 34 years age bracket with 36.8% of them unmarried.

| Age Bracket | Married | Unmarried |
| 15 to 19 years | 0 (0.0%) | 0 (0.0%) |
| 20 to 34 years | 12 (63.2%) | 7 (36.8%) |
| 35 to 50 years | 0 (0.0%) | 33 (100.0%) |
| Total | 12 (23.1%) | 40 (76.9%) |
Fertility by Education in Wellsville
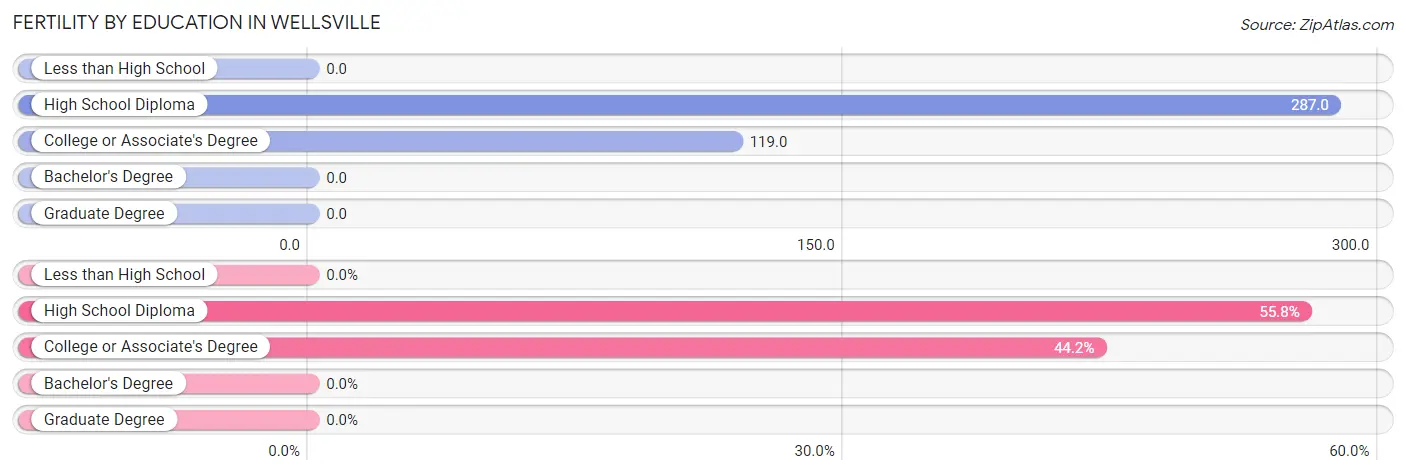
| Educational Attainment | Women with Births | Births / 1,000 Women |
| Less than High School | 0 (0.0%) | 0.0 |
| High School Diploma | 29 (55.8%) | 287.0 |
| College or Associate's Degree | 23 (44.2%) | 119.0 |
| Bachelor's Degree | 0 (0.0%) | 0.0 |
| Graduate Degree | 0 (0.0%) | 0.0 |
| Total | 52 (100.0%) | 126.0 |
Fertility by Education by Marriage Status in Wellsville
76.9% of women with births in Wellsville are unmarried. Women with the educational attainment of college or associate's degree are most likely to be married with 52.2% of them married at childbirth, while women with the educational attainment of high school diploma are least likely to be married with 100.0% of them unmarried at childbirth.
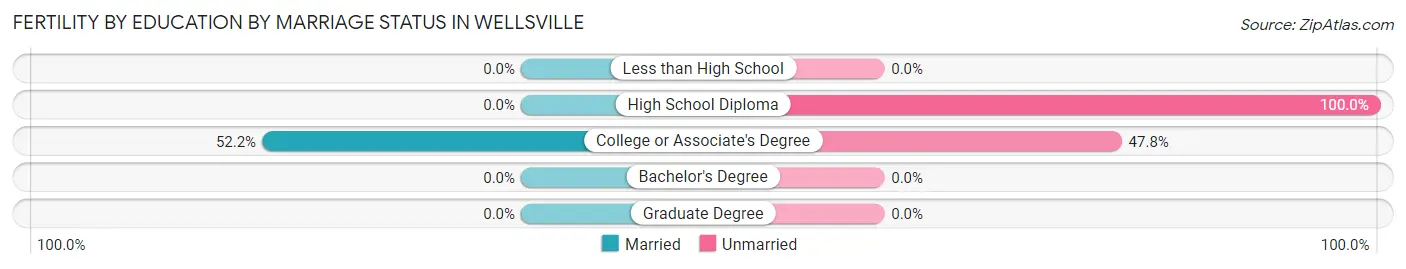
| Educational Attainment | Married | Unmarried |
| Less than High School | 0 (0.0%) | 0 (0.0%) |
| High School Diploma | 0 (0.0%) | 29 (100.0%) |
| College or Associate's Degree | 12 (52.2%) | 11 (47.8%) |
| Bachelor's Degree | 0 (0.0%) | 0 (0.0%) |
| Graduate Degree | 0 (0.0%) | 0 (0.0%) |
| Total | 12 (23.1%) | 40 (76.9%) |
Employment Characteristics in Wellsville
Employment by Class of Employer in Wellsville
Among the 901 employed individuals in Wellsville, private company employees (682 | 75.7%), not-for-profit organizations (70 | 7.8%), and self-employed (not incorporated) (51 | 5.7%) make up the most common classes of employment.
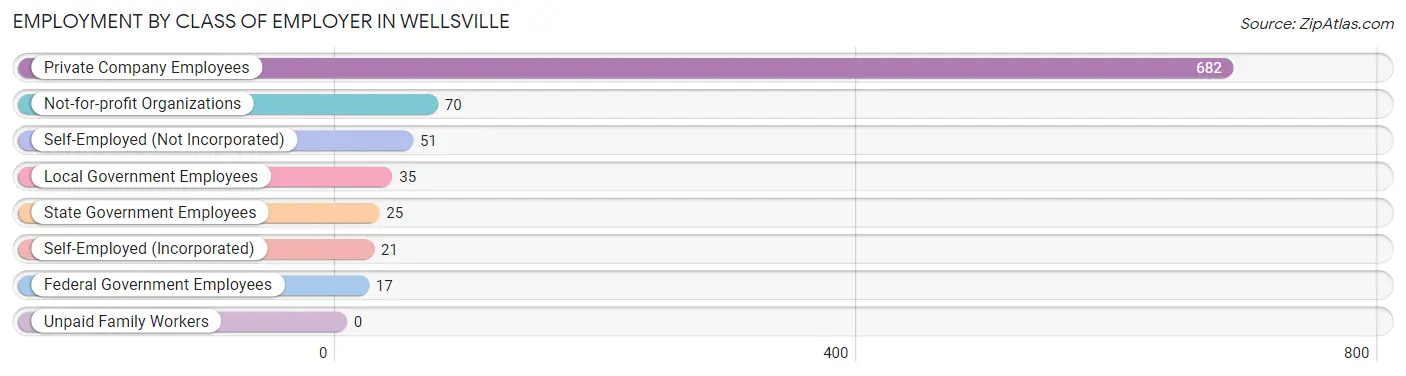
| Employer Class | # Employees | % Employees |
| Private Company Employees | 682 | 75.7% |
| Self-Employed (Incorporated) | 21 | 2.3% |
| Self-Employed (Not Incorporated) | 51 | 5.7% |
| Not-for-profit Organizations | 70 | 7.8% |
| Local Government Employees | 35 | 3.9% |
| State Government Employees | 25 | 2.8% |
| Federal Government Employees | 17 | 1.9% |
| Unpaid Family Workers | 0 | 0.0% |
| Total | 901 | 100.0% |
Employment Status by Age in Wellsville
According to the labor force statistics for Wellsville, out of the total population over 16 years of age (1,578), 60.1% or 948 individuals are in the labor force, with 1.7% or 16 of them unemployed. The age group with the highest labor force participation rate is 30 to 34 years, with 93.5% or 130 individuals in the labor force. Within the labor force, the 60 to 64 years age range has the highest percentage of unemployed individuals, with 12.0% or 6 of them being unemployed.
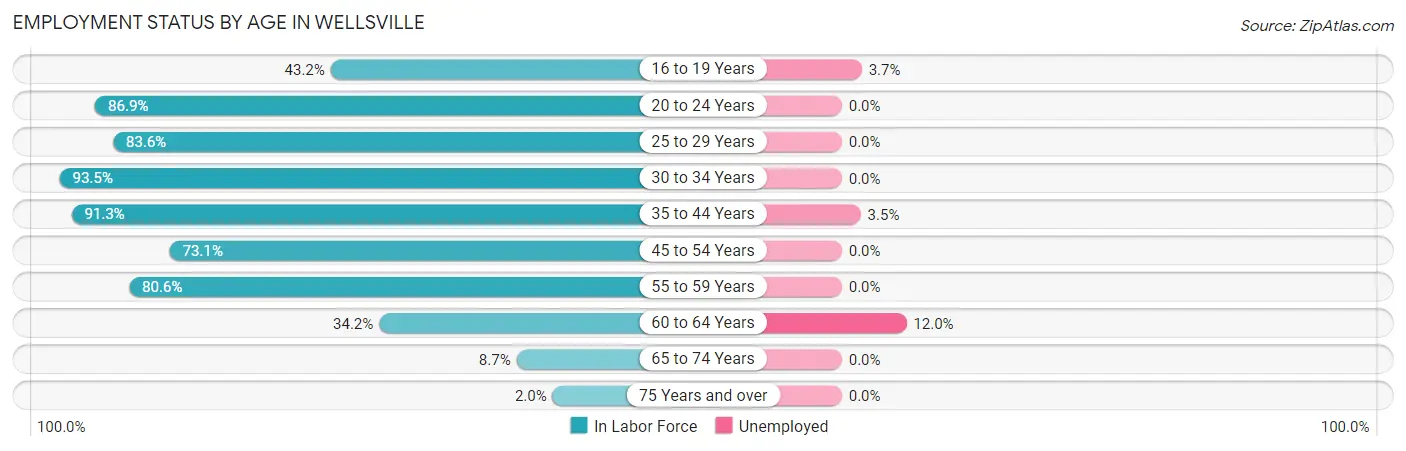
| Age Bracket | In Labor Force | Unemployed |
| 16 to 19 Years | 54 (43.2%) | 2 (3.7%) |
| 20 to 24 Years | 53 (86.9%) | 0 (0.0%) |
| 25 to 29 Years | 102 (83.6%) | 0 (0.0%) |
| 30 to 34 Years | 130 (93.5%) | 0 (0.0%) |
| 35 to 44 Years | 232 (91.3%) | 8 (3.5%) |
| 45 to 54 Years | 185 (73.1%) | 0 (0.0%) |
| 55 to 59 Years | 125 (80.6%) | 0 (0.0%) |
| 60 to 64 Years | 50 (34.2%) | 6 (12.0%) |
| 65 to 74 Years | 15 (8.7%) | 0 (0.0%) |
| 75 Years and over | 3 (2.0%) | 0 (0.0%) |
| Total | 948 (60.1%) | 16 (1.7%) |
Employment Status by Educational Attainment in Wellsville
According to labor force statistics for Wellsville, 77.1% of individuals (824) out of the total population between 25 and 64 years of age (1,069) are in the labor force, with 1.7% or 14 of them being unemployed. The group with the highest labor force participation rate are those with the educational attainment of college / associate degree, with 86.5% or 416 individuals in the labor force. Within the labor force, individuals with bachelor's degree or higher education have the highest percentage of unemployment, with 4.0% or 6 of them being unemployed.
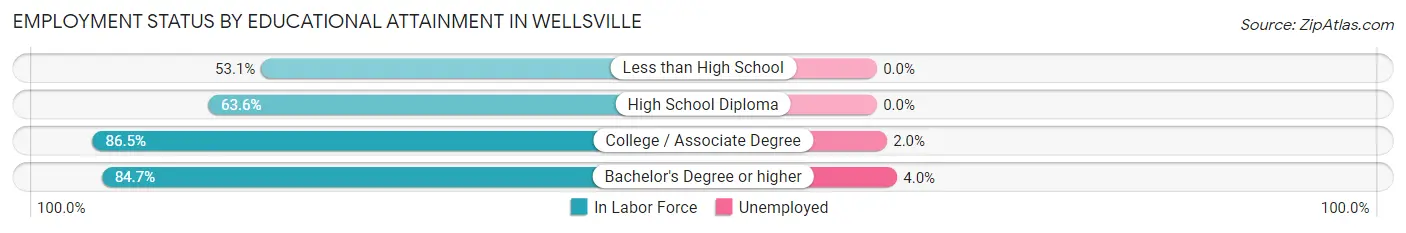
| Educational Attainment | In Labor Force | Unemployed |
| Less than High School | 17 (53.1%) | 0 (0.0%) |
| High School Diploma | 241 (63.6%) | 0 (0.0%) |
| College / Associate Degree | 416 (86.5%) | 10 (2.0%) |
| Bachelor's Degree or higher | 150 (84.7%) | 7 (4.0%) |
| Total | 824 (77.1%) | 18 (1.7%) |
Employment Occupations by Sex in Wellsville
Management, Business, Science and Arts Occupations
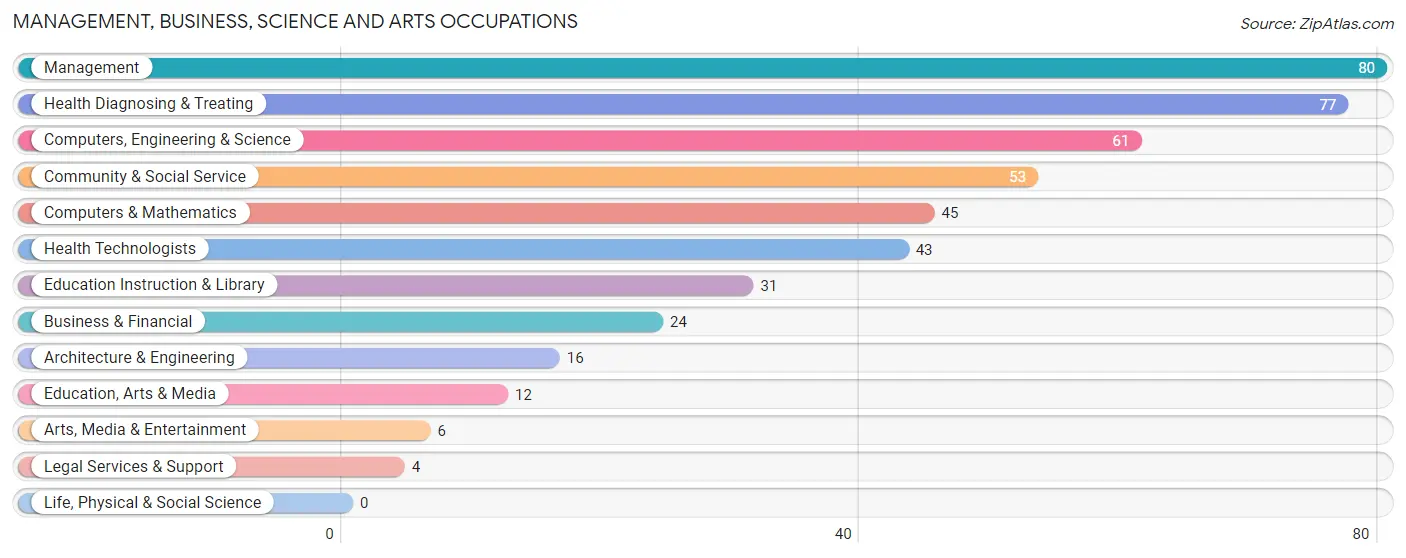
The most common Management, Business, Science and Arts occupations in Wellsville are Management (80 | 8.6%), Health Diagnosing & Treating (77 | 8.3%), Computers, Engineering & Science (61 | 6.6%), Community & Social Service (53 | 5.7%), and Computers & Mathematics (45 | 4.9%).
Management, Business, Science and Arts Occupations by Sex
Within the Management, Business, Science and Arts occupations in Wellsville, the most male-oriented occupations are Computers & Mathematics (100.0%), Legal Services & Support (100.0%), and Computers, Engineering & Science (93.4%), while the most female-oriented occupations are Education, Arts & Media (100.0%), Health Diagnosing & Treating (96.1%), and Health Technologists (93.0%).
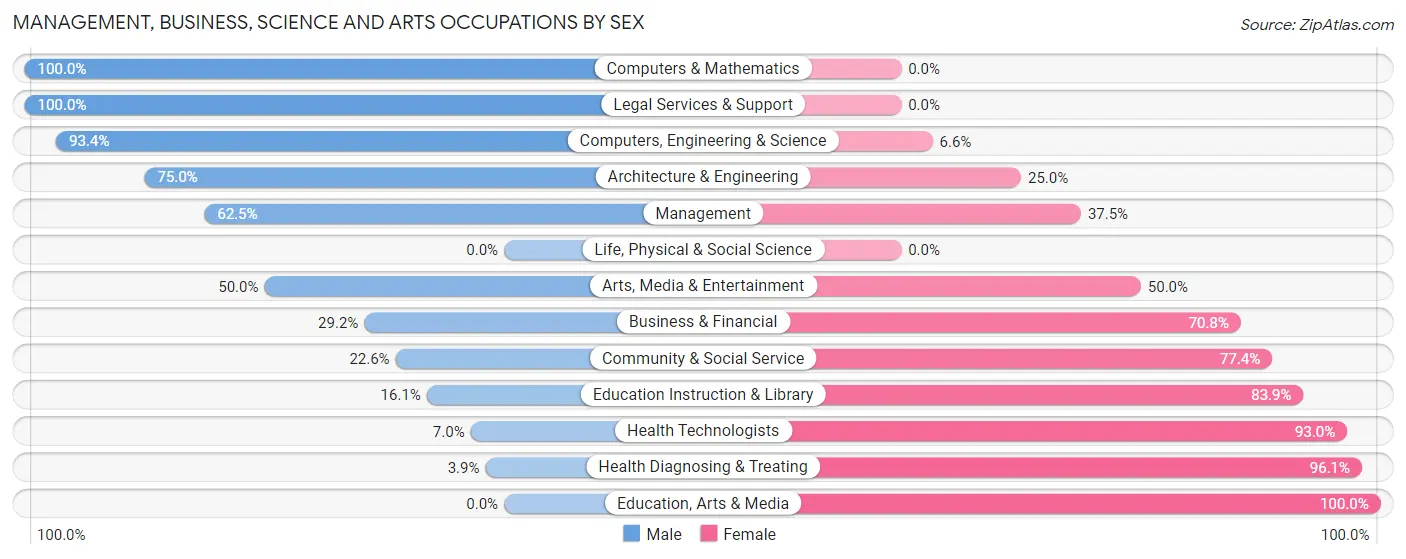
| Occupation | Male | Female |
| Management | 50 (62.5%) | 30 (37.5%) |
| Business & Financial | 7 (29.2%) | 17 (70.8%) |
| Computers, Engineering & Science | 57 (93.4%) | 4 (6.6%) |
| Computers & Mathematics | 45 (100.0%) | 0 (0.0%) |
| Architecture & Engineering | 12 (75.0%) | 4 (25.0%) |
| Life, Physical & Social Science | 0 (0.0%) | 0 (0.0%) |
| Community & Social Service | 12 (22.6%) | 41 (77.4%) |
| Education, Arts & Media | 0 (0.0%) | 12 (100.0%) |
| Legal Services & Support | 4 (100.0%) | 0 (0.0%) |
| Education Instruction & Library | 5 (16.1%) | 26 (83.9%) |
| Arts, Media & Entertainment | 3 (50.0%) | 3 (50.0%) |
| Health Diagnosing & Treating | 3 (3.9%) | 74 (96.1%) |
| Health Technologists | 3 (7.0%) | 40 (93.0%) |
| Total (Category) | 129 (43.7%) | 166 (56.3%) |
| Total (Overall) | 546 (59.0%) | 380 (41.0%) |
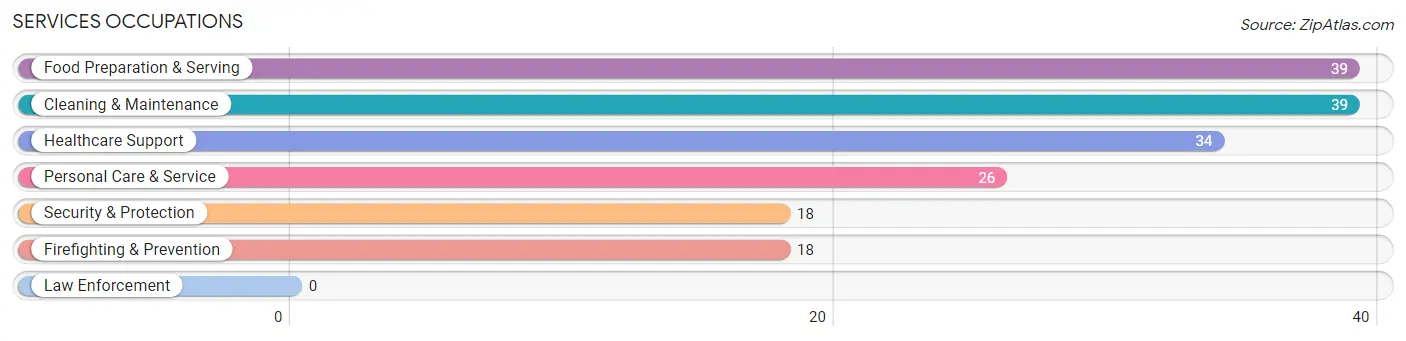
Services Occupations
The most common Services occupations in Wellsville are Food Preparation & Serving (39 | 4.2%), Cleaning & Maintenance (39 | 4.2%), Healthcare Support (34 | 3.7%), Personal Care & Service (26 | 2.8%), and Security & Protection (18 | 1.9%).
Services Occupations by Sex
Within the Services occupations in Wellsville, the most male-oriented occupations are Cleaning & Maintenance (89.7%), Security & Protection (83.3%), and Firefighting & Prevention (83.3%), while the most female-oriented occupations are Healthcare Support (100.0%), Personal Care & Service (50.0%), and Food Preparation & Serving (48.7%).
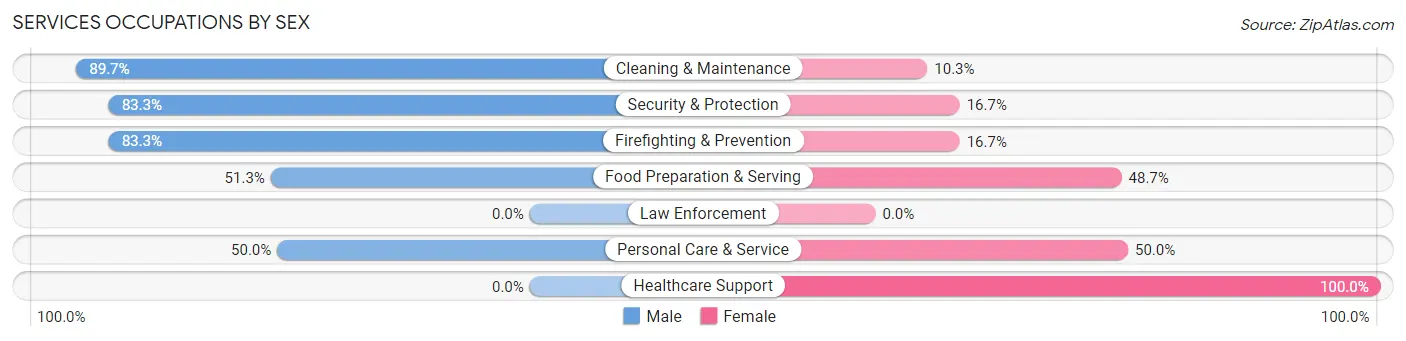
| Occupation | Male | Female |
| Healthcare Support | 0 (0.0%) | 34 (100.0%) |
| Security & Protection | 15 (83.3%) | 3 (16.7%) |
| Firefighting & Prevention | 15 (83.3%) | 3 (16.7%) |
| Law Enforcement | 0 (0.0%) | 0 (0.0%) |
| Food Preparation & Serving | 20 (51.3%) | 19 (48.7%) |
| Cleaning & Maintenance | 35 (89.7%) | 4 (10.3%) |
| Personal Care & Service | 13 (50.0%) | 13 (50.0%) |
| Total (Category) | 83 (53.2%) | 73 (46.8%) |
| Total (Overall) | 546 (59.0%) | 380 (41.0%) |
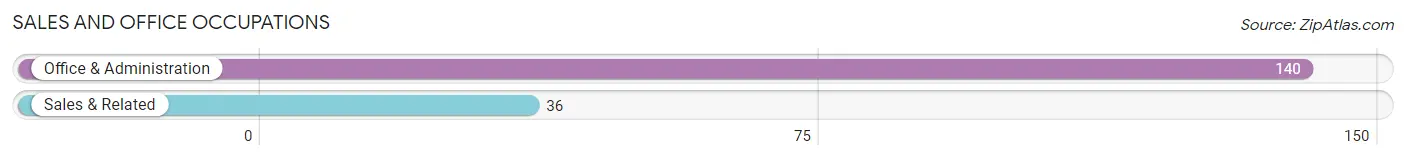
Sales and Office Occupations
The most common Sales and Office occupations in Wellsville are Office & Administration (140 | 15.1%), and Sales & Related (36 | 3.9%).
Sales and Office Occupations by Sex
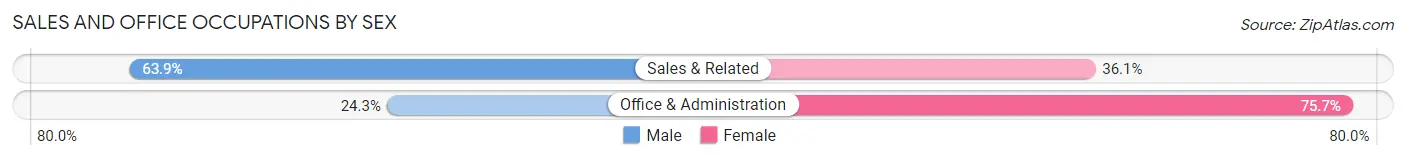
| Occupation | Male | Female |
| Sales & Related | 23 (63.9%) | 13 (36.1%) |
| Office & Administration | 34 (24.3%) | 106 (75.7%) |
| Total (Category) | 57 (32.4%) | 119 (67.6%) |
| Total (Overall) | 546 (59.0%) | 380 (41.0%) |
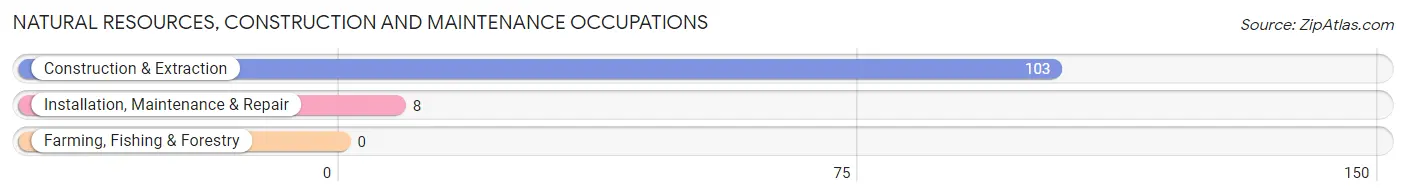
Natural Resources, Construction and Maintenance Occupations
The most common Natural Resources, Construction and Maintenance occupations in Wellsville are Construction & Extraction (103 | 11.1%), and Installation, Maintenance & Repair (8 | 0.9%).
Natural Resources, Construction and Maintenance Occupations by Sex
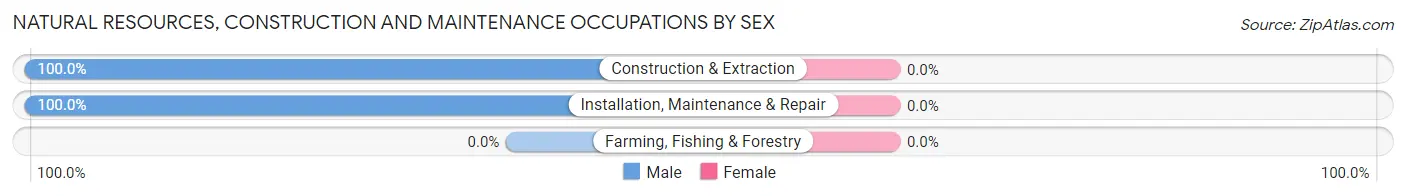
| Occupation | Male | Female |
| Farming, Fishing & Forestry | 0 (0.0%) | 0 (0.0%) |
| Construction & Extraction | 103 (100.0%) | 0 (0.0%) |
| Installation, Maintenance & Repair | 8 (100.0%) | 0 (0.0%) |
| Total (Category) | 111 (100.0%) | 0 (0.0%) |
| Total (Overall) | 546 (59.0%) | 380 (41.0%) |
Production, Transportation and Moving Occupations
The most common Production, Transportation and Moving occupations in Wellsville are Transportation (79 | 8.5%), Production (61 | 6.6%), and Material Moving (48 | 5.2%).
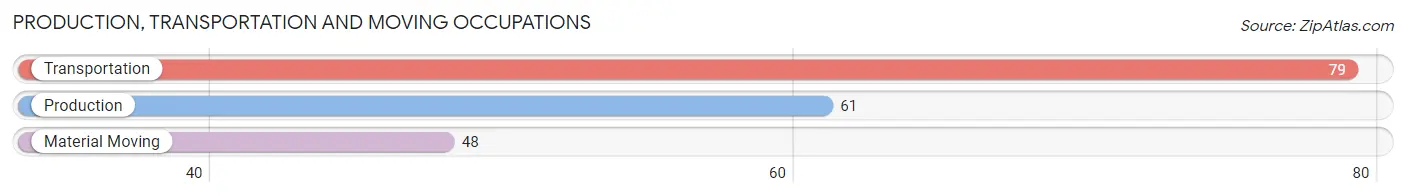
Production, Transportation and Moving Occupations by Sex
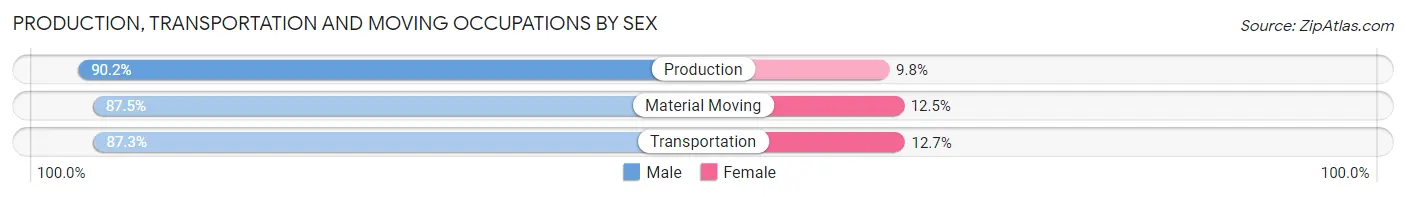
| Occupation | Male | Female |
| Production | 55 (90.2%) | 6 (9.8%) |
| Transportation | 69 (87.3%) | 10 (12.7%) |
| Material Moving | 42 (87.5%) | 6 (12.5%) |
| Total (Category) | 166 (88.3%) | 22 (11.7%) |
| Total (Overall) | 546 (59.0%) | 380 (41.0%) |
Employment Industries by Sex in Wellsville
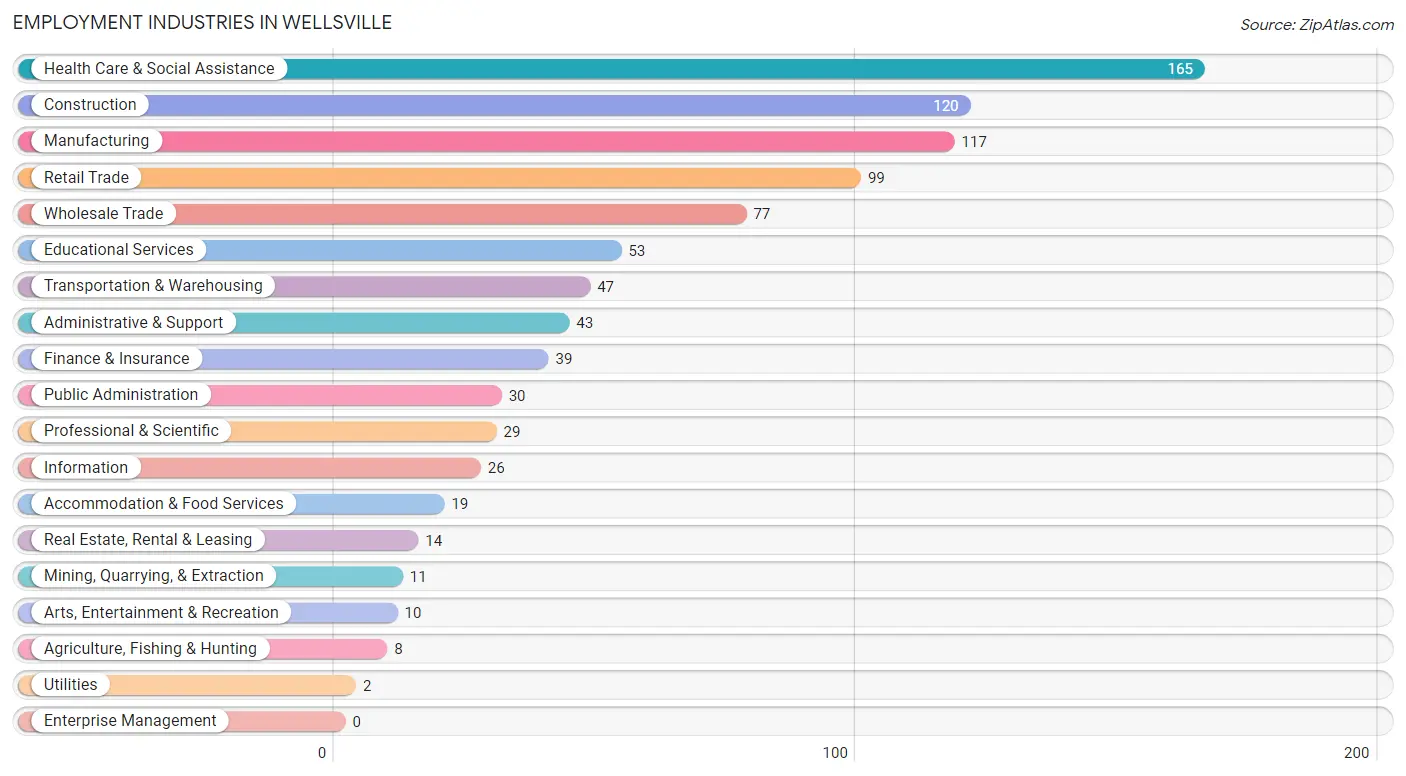
Employment Industries in Wellsville
The major employment industries in Wellsville include Health Care & Social Assistance (165 | 17.8%), Construction (120 | 13.0%), Manufacturing (117 | 12.6%), Retail Trade (99 | 10.7%), and Wholesale Trade (77 | 8.3%).
Employment Industries by Sex in Wellsville
The Wellsville industries that see more men than women are Agriculture, Fishing & Hunting (100.0%), Mining, Quarrying, & Extraction (100.0%), and Arts, Entertainment & Recreation (100.0%), whereas the industries that tend to have a higher number of women are Utilities (100.0%), Health Care & Social Assistance (95.2%), and Educational Services (79.2%).
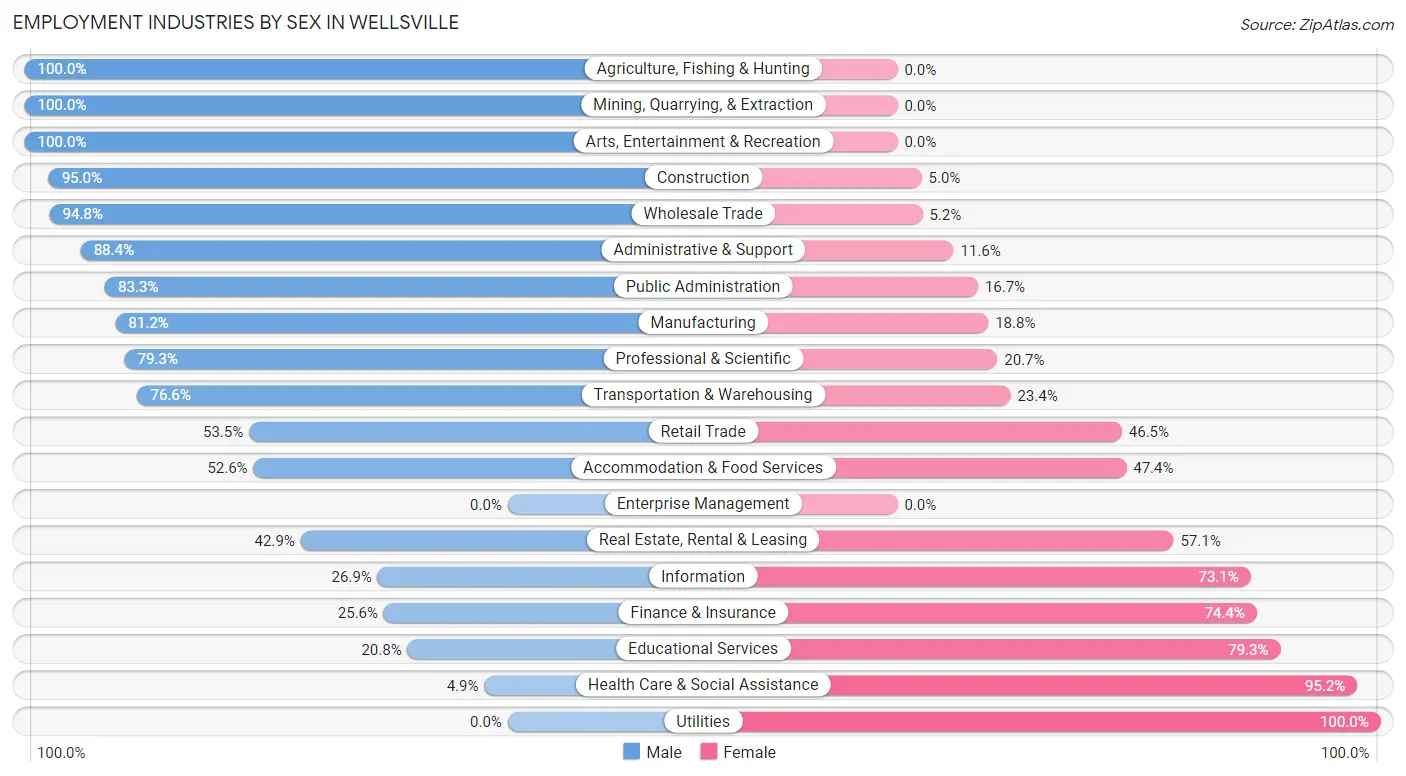
| Industry | Male | Female |
| Agriculture, Fishing & Hunting | 8 (100.0%) | 0 (0.0%) |
| Mining, Quarrying, & Extraction | 11 (100.0%) | 0 (0.0%) |
| Construction | 114 (95.0%) | 6 (5.0%) |
| Manufacturing | 95 (81.2%) | 22 (18.8%) |
| Wholesale Trade | 73 (94.8%) | 4 (5.2%) |
| Retail Trade | 53 (53.5%) | 46 (46.5%) |
| Transportation & Warehousing | 36 (76.6%) | 11 (23.4%) |
| Utilities | 0 (0.0%) | 2 (100.0%) |
| Information | 7 (26.9%) | 19 (73.1%) |
| Finance & Insurance | 10 (25.6%) | 29 (74.4%) |
| Real Estate, Rental & Leasing | 6 (42.9%) | 8 (57.1%) |
| Professional & Scientific | 23 (79.3%) | 6 (20.7%) |
| Enterprise Management | 0 (0.0%) | 0 (0.0%) |
| Administrative & Support | 38 (88.4%) | 5 (11.6%) |
| Educational Services | 11 (20.7%) | 42 (79.2%) |
| Health Care & Social Assistance | 8 (4.9%) | 157 (95.2%) |
| Arts, Entertainment & Recreation | 10 (100.0%) | 0 (0.0%) |
| Accommodation & Food Services | 10 (52.6%) | 9 (47.4%) |
| Public Administration | 25 (83.3%) | 5 (16.7%) |
| Total | 546 (59.0%) | 380 (41.0%) |
Education in Wellsville
School Enrollment in Wellsville
The most common levels of schooling among the 511 students in Wellsville are high school (162 | 31.7%), middle school (107 | 20.9%), and elementary school (81 | 15.9%).
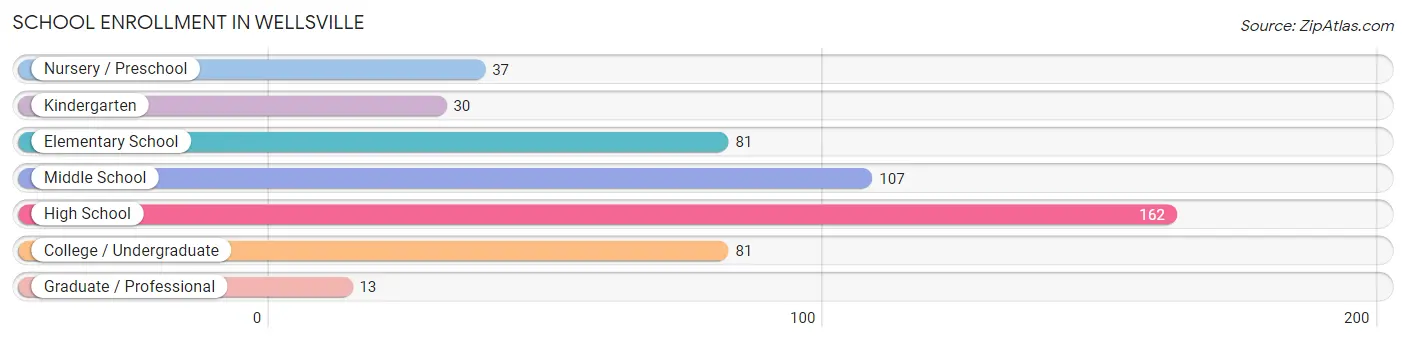
| School Level | # Students | % Students |
| Nursery / Preschool | 37 | 7.2% |
| Kindergarten | 30 | 5.9% |
| Elementary School | 81 | 15.9% |
| Middle School | 107 | 20.9% |
| High School | 162 | 31.7% |
| College / Undergraduate | 81 | 15.9% |
| Graduate / Professional | 13 | 2.5% |
| Total | 511 | 100.0% |
School Enrollment by Age by Funding Source in Wellsville
Out of a total of 511 students who are enrolled in schools in Wellsville, 48 (9.4%) attend a private institution, while the remaining 463 (90.6%) are enrolled in public schools. The age group of 35 years and over has the highest likelihood of being enrolled in private schools, with 8 (72.7% in the age bracket) enrolled. Conversely, the age group of 15 to 17 year olds has the lowest likelihood of being enrolled in a private school, with 94 (100.0% in the age bracket) attending a public institution.
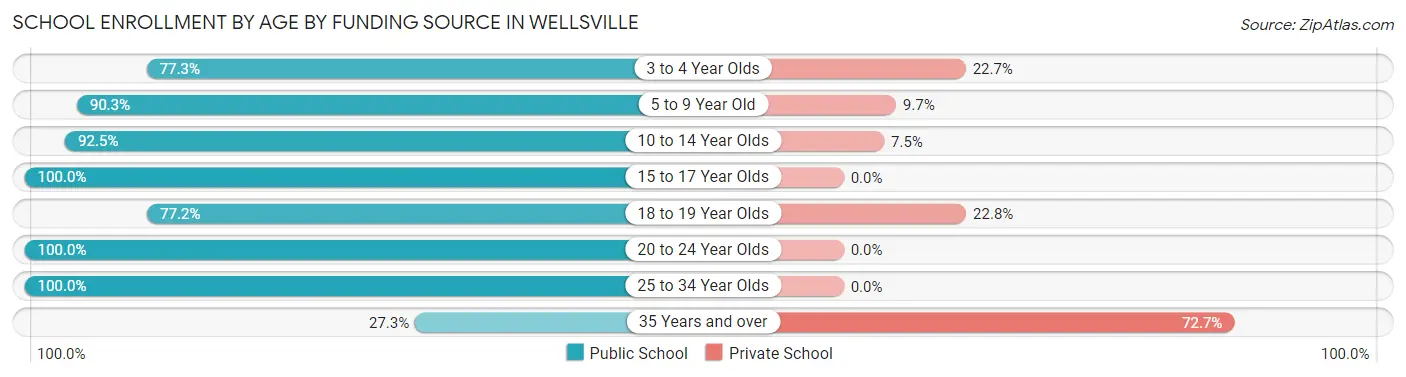
| Age Bracket | Public School | Private School |
| 3 to 4 Year Olds | 17 (77.3%) | 5 (22.7%) |
| 5 to 9 Year Old | 102 (90.3%) | 11 (9.7%) |
| 10 to 14 Year Olds | 135 (92.5%) | 11 (7.5%) |
| 15 to 17 Year Olds | 94 (100.0%) | 0 (0.0%) |
| 18 to 19 Year Olds | 44 (77.2%) | 13 (22.8%) |
| 20 to 24 Year Olds | 18 (100.0%) | 0 (0.0%) |
| 25 to 34 Year Olds | 50 (100.0%) | 0 (0.0%) |
| 35 Years and over | 3 (27.3%) | 8 (72.7%) |
| Total | 463 (90.6%) | 48 (9.4%) |
Educational Attainment by Field of Study in Wellsville
Science & technology (81 | 31.5%), business (45 | 17.5%), education (31 | 12.1%), computers & mathematics (28 | 10.9%), and literature & languages (18 | 7.0%) are the most common fields of study among 257 individuals in Wellsville who have obtained a bachelor's degree or higher.
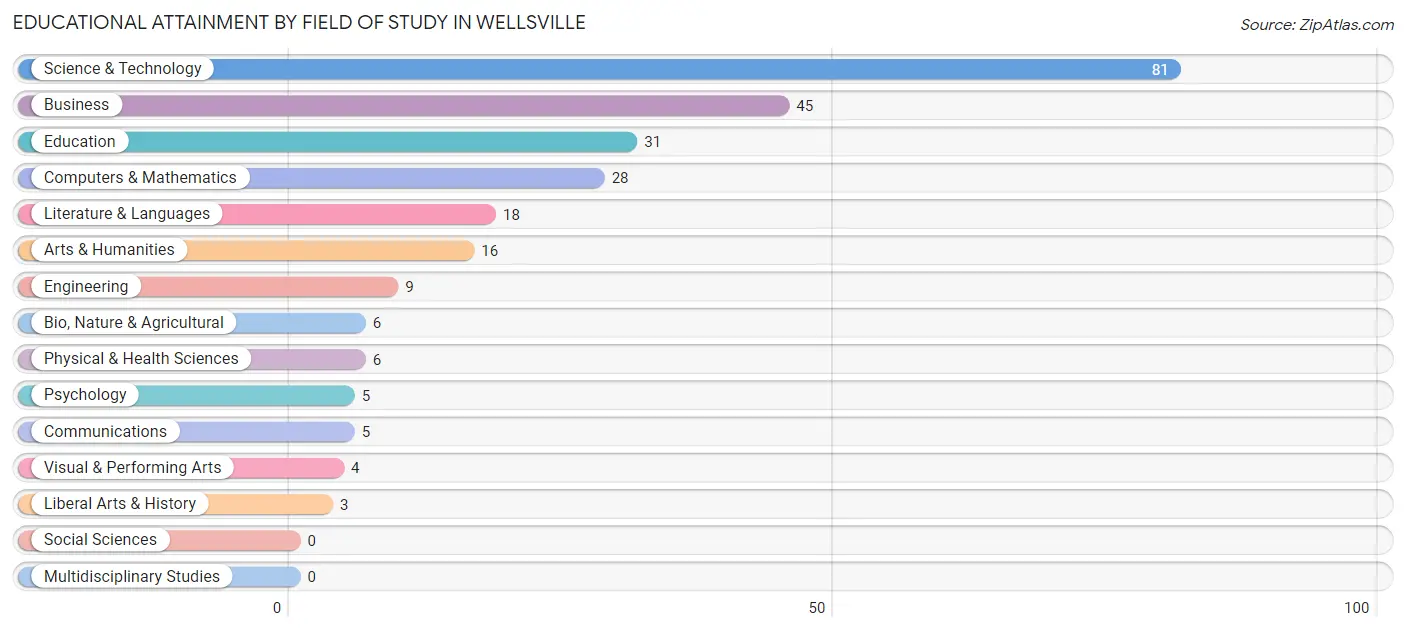
| Field of Study | # Graduates | % Graduates |
| Computers & Mathematics | 28 | 10.9% |
| Bio, Nature & Agricultural | 6 | 2.3% |
| Physical & Health Sciences | 6 | 2.3% |
| Psychology | 5 | 1.9% |
| Social Sciences | 0 | 0.0% |
| Engineering | 9 | 3.5% |
| Multidisciplinary Studies | 0 | 0.0% |
| Science & Technology | 81 | 31.5% |
| Business | 45 | 17.5% |
| Education | 31 | 12.1% |
| Literature & Languages | 18 | 7.0% |
| Liberal Arts & History | 3 | 1.2% |
| Visual & Performing Arts | 4 | 1.6% |
| Communications | 5 | 1.9% |
| Arts & Humanities | 16 | 6.2% |
| Total | 257 | 100.0% |
Transportation & Commute in Wellsville
Vehicle Availability by Sex in Wellsville
The most prevalent vehicle ownership categories in Wellsville are males with 2 vehicles (249, accounting for 46.6%) and females with 2 vehicles (159, making up 67.8%).
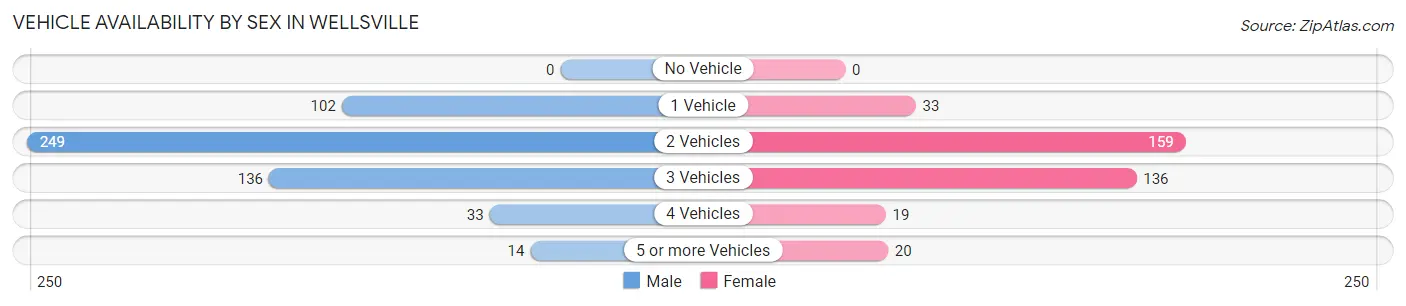
| Vehicles Available | Male | Female |
| No Vehicle | 0 (0.0%) | 0 (0.0%) |
| 1 Vehicle | 102 (19.1%) | 33 (9.0%) |
| 2 Vehicles | 249 (46.6%) | 159 (43.3%) |
| 3 Vehicles | 136 (25.5%) | 136 (37.1%) |
| 4 Vehicles | 33 (6.2%) | 19 (5.2%) |
| 5 or more Vehicles | 14 (2.6%) | 20 (5.4%) |
| Total | 534 (100.0%) | 367 (100.0%) |
Commute Time in Wellsville
The most frequently occuring commute durations in Wellsville are 45 to 59 minutes (121 commuters, 15.1%), 15 to 19 minutes (120 commuters, 14.9%), and less than 5 minutes (101 commuters, 12.6%).
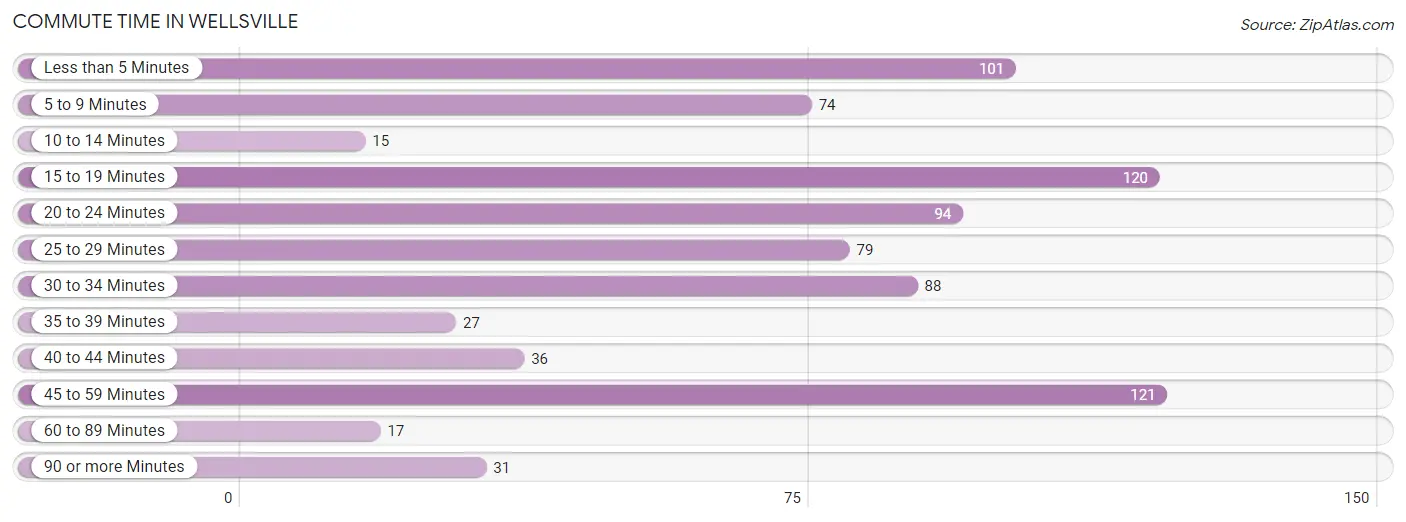
| Commute Time | # Commuters | % Commuters |
| Less than 5 Minutes | 101 | 12.6% |
| 5 to 9 Minutes | 74 | 9.2% |
| 10 to 14 Minutes | 15 | 1.9% |
| 15 to 19 Minutes | 120 | 14.9% |
| 20 to 24 Minutes | 94 | 11.7% |
| 25 to 29 Minutes | 79 | 9.8% |
| 30 to 34 Minutes | 88 | 11.0% |
| 35 to 39 Minutes | 27 | 3.4% |
| 40 to 44 Minutes | 36 | 4.5% |
| 45 to 59 Minutes | 121 | 15.1% |
| 60 to 89 Minutes | 17 | 2.1% |
| 90 or more Minutes | 31 | 3.9% |
Commute Time by Sex in Wellsville
The most common commute times in Wellsville are 45 to 59 minutes (113 commuters, 22.7%) for males and 15 to 19 minutes (61 commuters, 19.9%) for females.
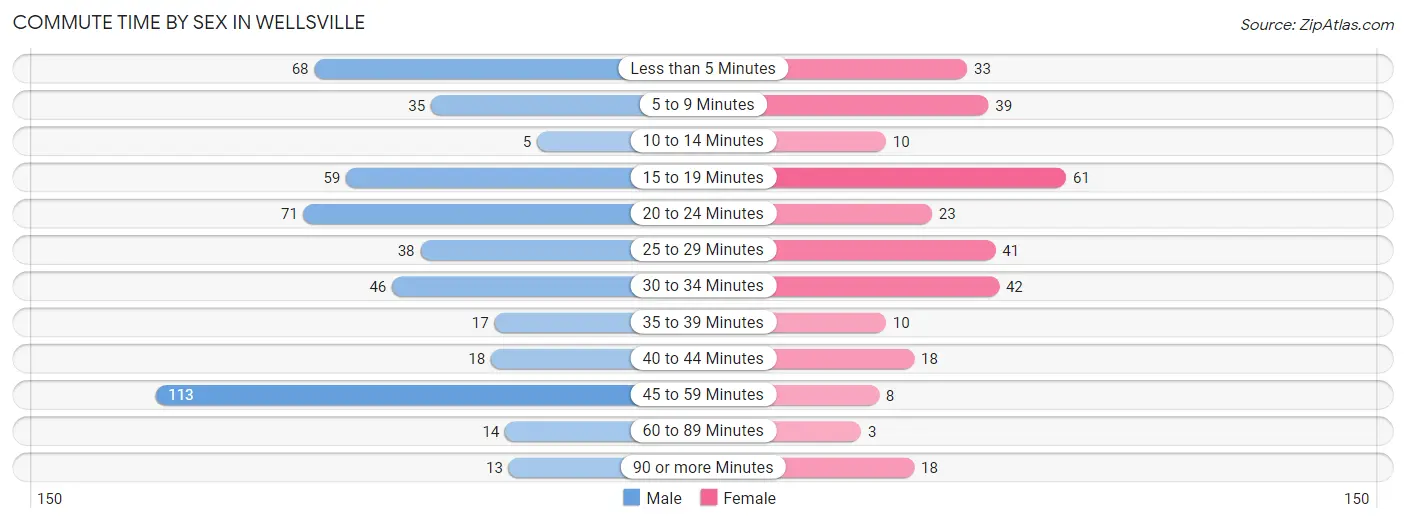
| Commute Time | Male | Female |
| Less than 5 Minutes | 68 (13.7%) | 33 (10.8%) |
| 5 to 9 Minutes | 35 (7.0%) | 39 (12.8%) |
| 10 to 14 Minutes | 5 (1.0%) | 10 (3.3%) |
| 15 to 19 Minutes | 59 (11.9%) | 61 (19.9%) |
| 20 to 24 Minutes | 71 (14.3%) | 23 (7.5%) |
| 25 to 29 Minutes | 38 (7.6%) | 41 (13.4%) |
| 30 to 34 Minutes | 46 (9.3%) | 42 (13.7%) |
| 35 to 39 Minutes | 17 (3.4%) | 10 (3.3%) |
| 40 to 44 Minutes | 18 (3.6%) | 18 (5.9%) |
| 45 to 59 Minutes | 113 (22.7%) | 8 (2.6%) |
| 60 to 89 Minutes | 14 (2.8%) | 3 (1.0%) |
| 90 or more Minutes | 13 (2.6%) | 18 (5.9%) |
Time of Departure to Work by Sex in Wellsville
The most frequent times of departure to work in Wellsville are 6:30 AM to 6:59 AM (145, 29.2%) for males and 7:30 AM to 7:59 AM (61, 19.9%) for females.
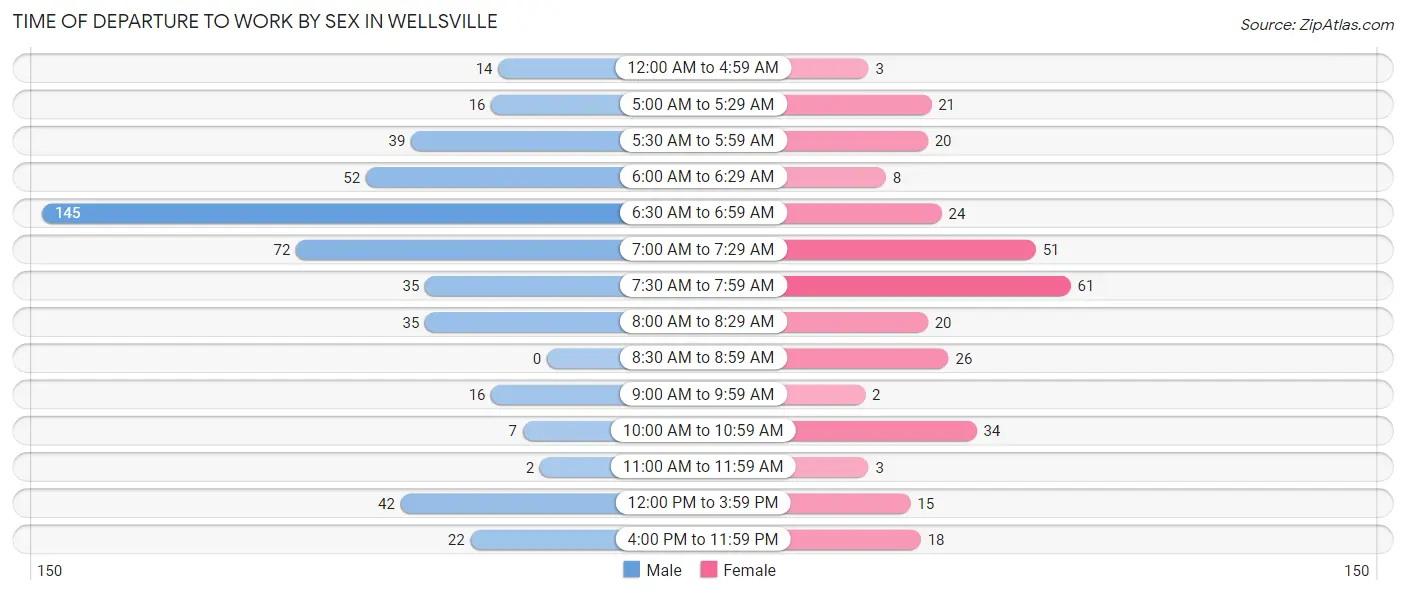
| Time of Departure | Male | Female |
| 12:00 AM to 4:59 AM | 14 (2.8%) | 3 (1.0%) |
| 5:00 AM to 5:29 AM | 16 (3.2%) | 21 (6.9%) |
| 5:30 AM to 5:59 AM | 39 (7.9%) | 20 (6.5%) |
| 6:00 AM to 6:29 AM | 52 (10.5%) | 8 (2.6%) |
| 6:30 AM to 6:59 AM | 145 (29.2%) | 24 (7.8%) |
| 7:00 AM to 7:29 AM | 72 (14.5%) | 51 (16.7%) |
| 7:30 AM to 7:59 AM | 35 (7.0%) | 61 (19.9%) |
| 8:00 AM to 8:29 AM | 35 (7.0%) | 20 (6.5%) |
| 8:30 AM to 8:59 AM | 0 (0.0%) | 26 (8.5%) |
| 9:00 AM to 9:59 AM | 16 (3.2%) | 2 (0.6%) |
| 10:00 AM to 10:59 AM | 7 (1.4%) | 34 (11.1%) |
| 11:00 AM to 11:59 AM | 2 (0.4%) | 3 (1.0%) |
| 12:00 PM to 3:59 PM | 42 (8.5%) | 15 (4.9%) |
| 4:00 PM to 11:59 PM | 22 (4.4%) | 18 (5.9%) |
| Total | 497 (100.0%) | 306 (100.0%) |
Housing Occupancy in Wellsville
Occupancy by Ownership in Wellsville
Of the total 811 dwellings in Wellsville, owner-occupied units account for 557 (68.7%), while renter-occupied units make up 254 (31.3%).
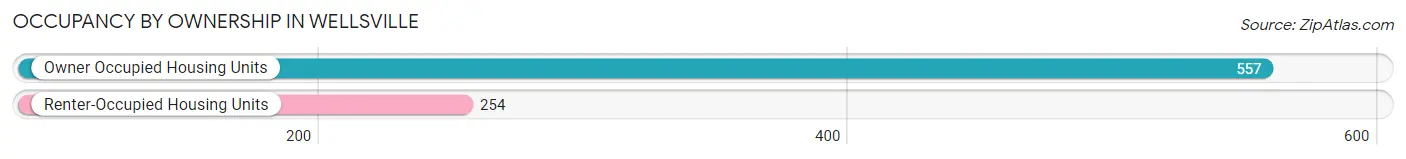
| Occupancy | # Housing Units | % Housing Units |
| Owner Occupied Housing Units | 557 | 68.7% |
| Renter-Occupied Housing Units | 254 | 31.3% |
| Total Occupied Housing Units | 811 | 100.0% |
Occupancy by Household Size in Wellsville
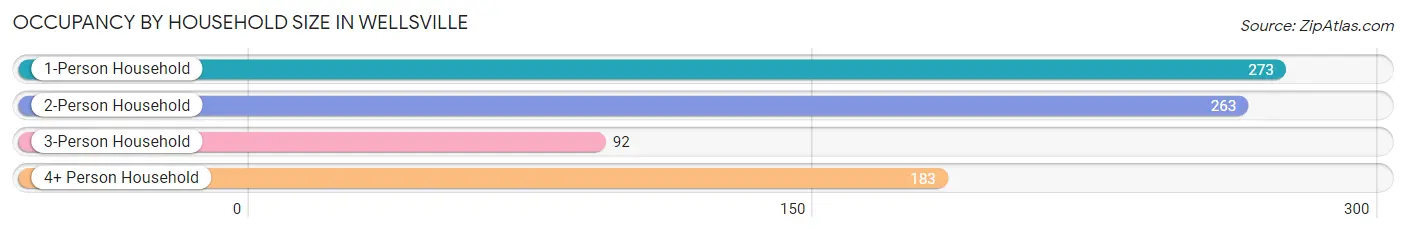
| Household Size | # Housing Units | % Housing Units |
| 1-Person Household | 273 | 33.7% |
| 2-Person Household | 263 | 32.4% |
| 3-Person Household | 92 | 11.3% |
| 4+ Person Household | 183 | 22.6% |
| Total Housing Units | 811 | 100.0% |
Occupancy by Ownership by Household Size in Wellsville
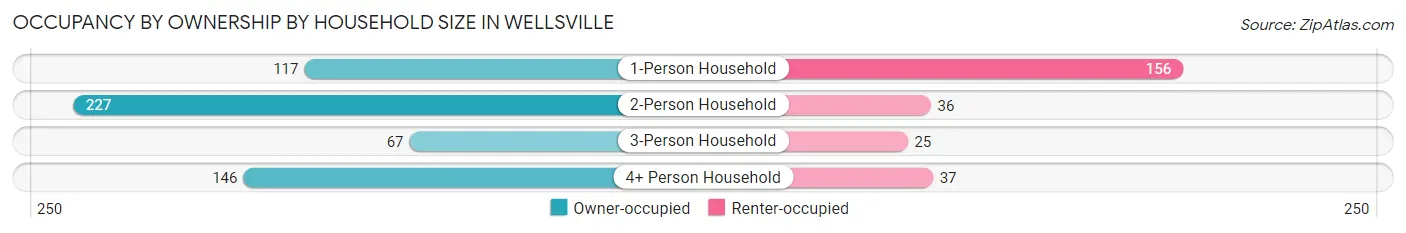
| Household Size | Owner-occupied | Renter-occupied |
| 1-Person Household | 117 (42.9%) | 156 (57.1%) |
| 2-Person Household | 227 (86.3%) | 36 (13.7%) |
| 3-Person Household | 67 (72.8%) | 25 (27.2%) |
| 4+ Person Household | 146 (79.8%) | 37 (20.2%) |
| Total Housing Units | 557 (68.7%) | 254 (31.3%) |
Occupancy by Educational Attainment in Wellsville
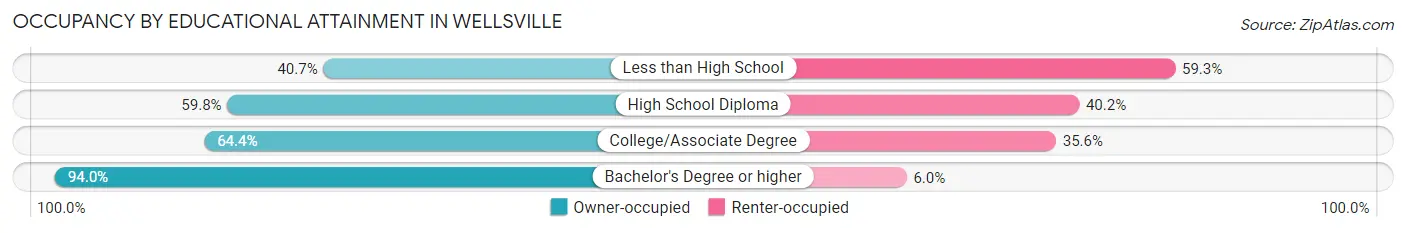
| Household Size | Owner-occupied | Renter-occupied |
| Less than High School | 11 (40.7%) | 16 (59.3%) |
| High School Diploma | 168 (59.8%) | 113 (40.2%) |
| College/Associate Degree | 206 (64.4%) | 114 (35.6%) |
| Bachelor's Degree or higher | 172 (94.0%) | 11 (6.0%) |
Occupancy by Age of Householder in Wellsville
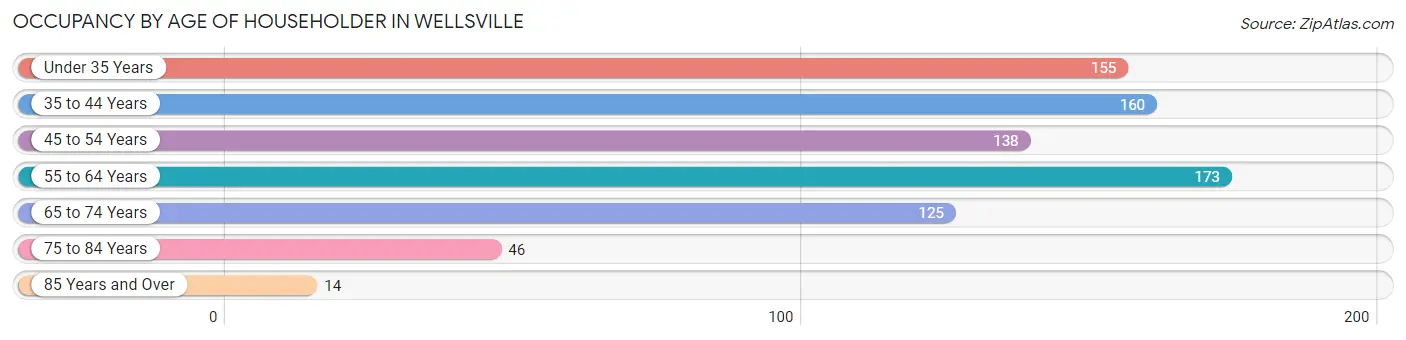
| Age Bracket | # Households | % Households |
| Under 35 Years | 155 | 19.1% |
| 35 to 44 Years | 160 | 19.7% |
| 45 to 54 Years | 138 | 17.0% |
| 55 to 64 Years | 173 | 21.3% |
| 65 to 74 Years | 125 | 15.4% |
| 75 to 84 Years | 46 | 5.7% |
| 85 Years and Over | 14 | 1.7% |
| Total | 811 | 100.0% |
Housing Finances in Wellsville
Median Income by Occupancy in Wellsville
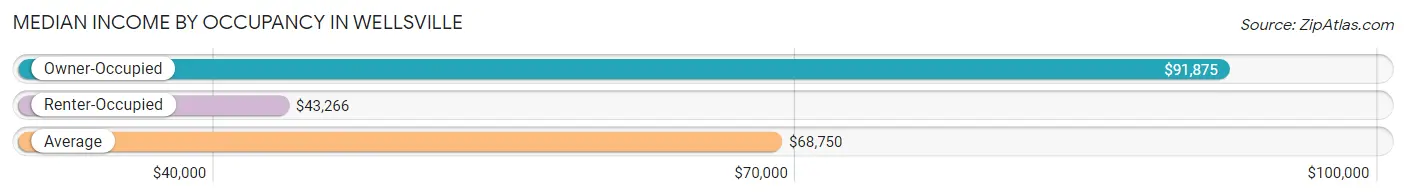
| Occupancy Type | # Households | Median Income |
| Owner-Occupied | 557 (68.7%) | $91,875 |
| Renter-Occupied | 254 (31.3%) | $43,266 |
| Average | 811 (100.0%) | $68,750 |
Occupancy by Householder Income Bracket in Wellsville
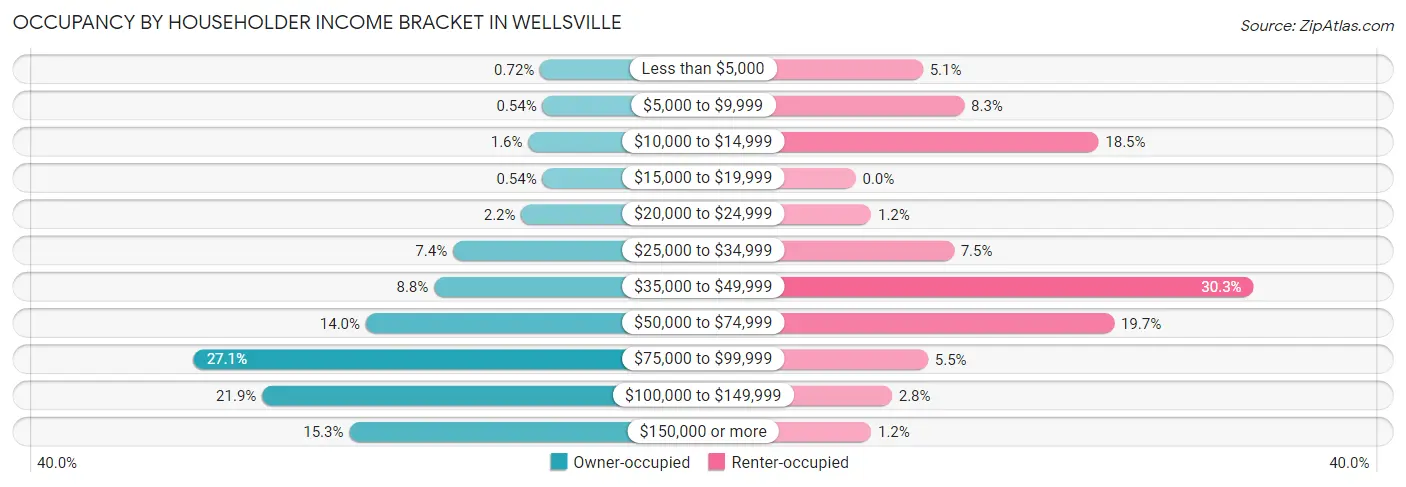
| Income Bracket | Owner-occupied | Renter-occupied |
| Less than $5,000 | 4 (0.7%) | 13 (5.1%) |
| $5,000 to $9,999 | 3 (0.5%) | 21 (8.3%) |
| $10,000 to $14,999 | 9 (1.6%) | 47 (18.5%) |
| $15,000 to $19,999 | 3 (0.5%) | 0 (0.0%) |
| $20,000 to $24,999 | 12 (2.1%) | 3 (1.2%) |
| $25,000 to $34,999 | 41 (7.4%) | 19 (7.5%) |
| $35,000 to $49,999 | 49 (8.8%) | 77 (30.3%) |
| $50,000 to $74,999 | 78 (14.0%) | 50 (19.7%) |
| $75,000 to $99,999 | 151 (27.1%) | 14 (5.5%) |
| $100,000 to $149,999 | 122 (21.9%) | 7 (2.8%) |
| $150,000 or more | 85 (15.3%) | 3 (1.2%) |
| Total | 557 (100.0%) | 254 (100.0%) |
Monthly Housing Cost Tiers in Wellsville
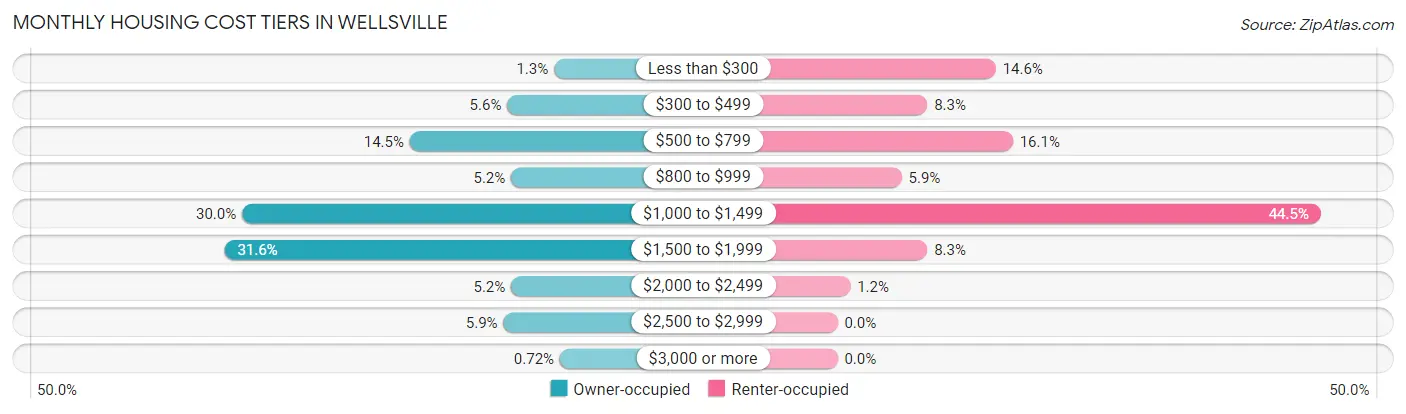
| Monthly Cost | Owner-occupied | Renter-occupied |
| Less than $300 | 7 (1.3%) | 37 (14.6%) |
| $300 to $499 | 31 (5.6%) | 21 (8.3%) |
| $500 to $799 | 81 (14.5%) | 41 (16.1%) |
| $800 to $999 | 29 (5.2%) | 15 (5.9%) |
| $1,000 to $1,499 | 167 (30.0%) | 113 (44.5%) |
| $1,500 to $1,999 | 176 (31.6%) | 21 (8.3%) |
| $2,000 to $2,499 | 29 (5.2%) | 3 (1.2%) |
| $2,500 to $2,999 | 33 (5.9%) | 0 (0.0%) |
| $3,000 or more | 4 (0.7%) | 0 (0.0%) |
| Total | 557 (100.0%) | 254 (100.0%) |
Physical Housing Characteristics in Wellsville
Housing Structures in Wellsville
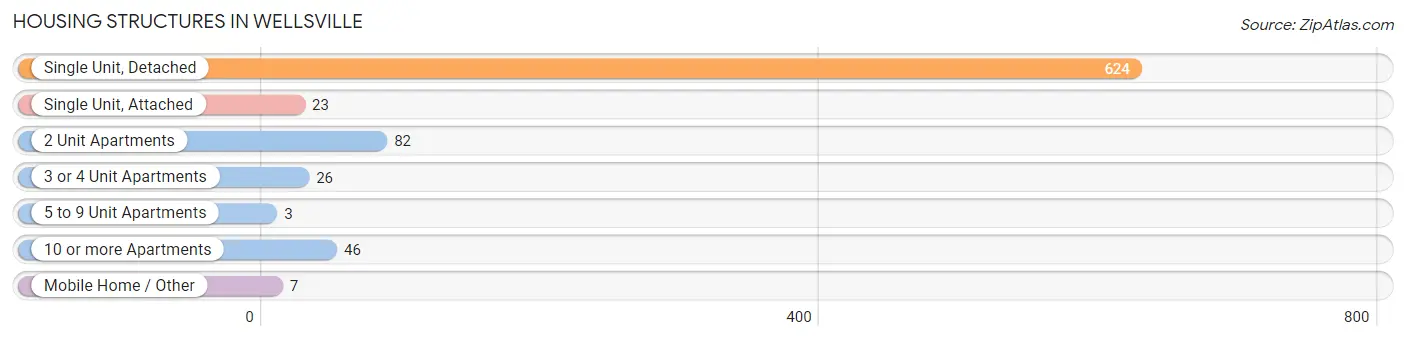
| Structure Type | # Housing Units | % Housing Units |
| Single Unit, Detached | 624 | 76.9% |
| Single Unit, Attached | 23 | 2.8% |
| 2 Unit Apartments | 82 | 10.1% |
| 3 or 4 Unit Apartments | 26 | 3.2% |
| 5 to 9 Unit Apartments | 3 | 0.4% |
| 10 or more Apartments | 46 | 5.7% |
| Mobile Home / Other | 7 | 0.9% |
| Total | 811 | 100.0% |
Housing Structures by Occupancy in Wellsville
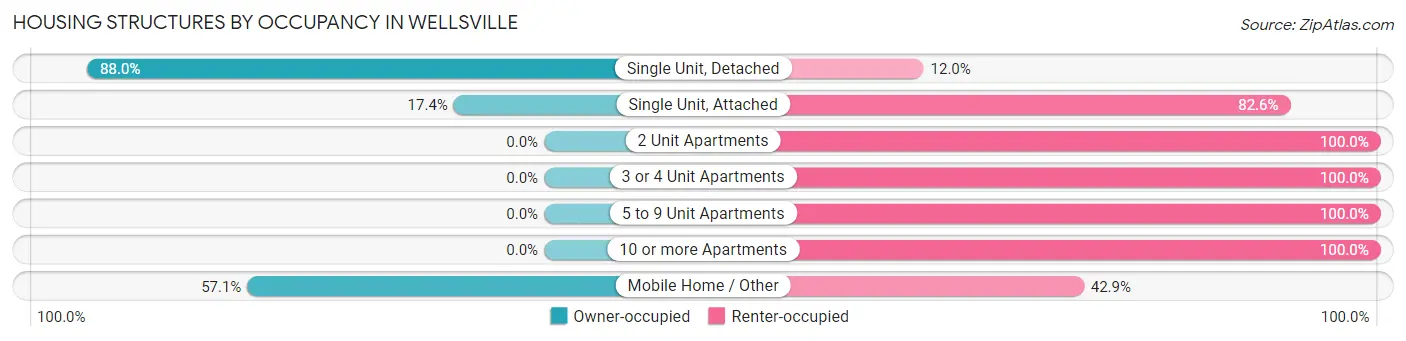
| Structure Type | Owner-occupied | Renter-occupied |
| Single Unit, Detached | 549 (88.0%) | 75 (12.0%) |
| Single Unit, Attached | 4 (17.4%) | 19 (82.6%) |
| 2 Unit Apartments | 0 (0.0%) | 82 (100.0%) |
| 3 or 4 Unit Apartments | 0 (0.0%) | 26 (100.0%) |
| 5 to 9 Unit Apartments | 0 (0.0%) | 3 (100.0%) |
| 10 or more Apartments | 0 (0.0%) | 46 (100.0%) |
| Mobile Home / Other | 4 (57.1%) | 3 (42.9%) |
| Total | 557 (68.7%) | 254 (31.3%) |
Housing Structures by Number of Rooms in Wellsville
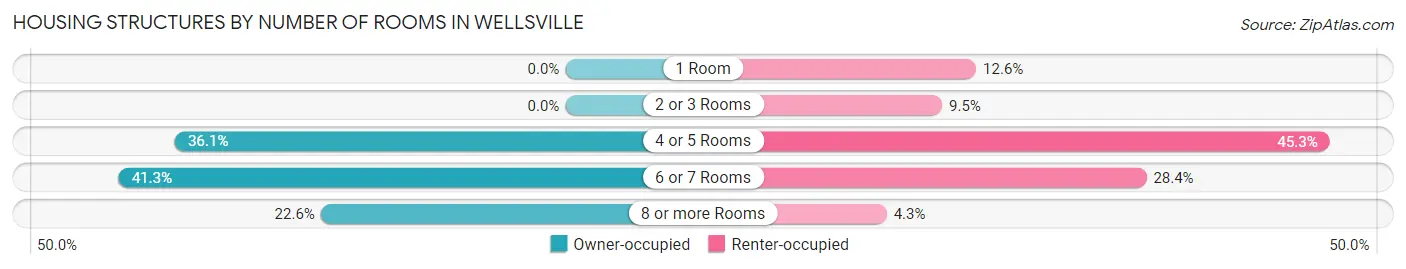
| Number of Rooms | Owner-occupied | Renter-occupied |
| 1 Room | 0 (0.0%) | 32 (12.6%) |
| 2 or 3 Rooms | 0 (0.0%) | 24 (9.5%) |
| 4 or 5 Rooms | 201 (36.1%) | 115 (45.3%) |
| 6 or 7 Rooms | 230 (41.3%) | 72 (28.3%) |
| 8 or more Rooms | 126 (22.6%) | 11 (4.3%) |
| Total | 557 (100.0%) | 254 (100.0%) |
Housing Structure by Heating Type in Wellsville
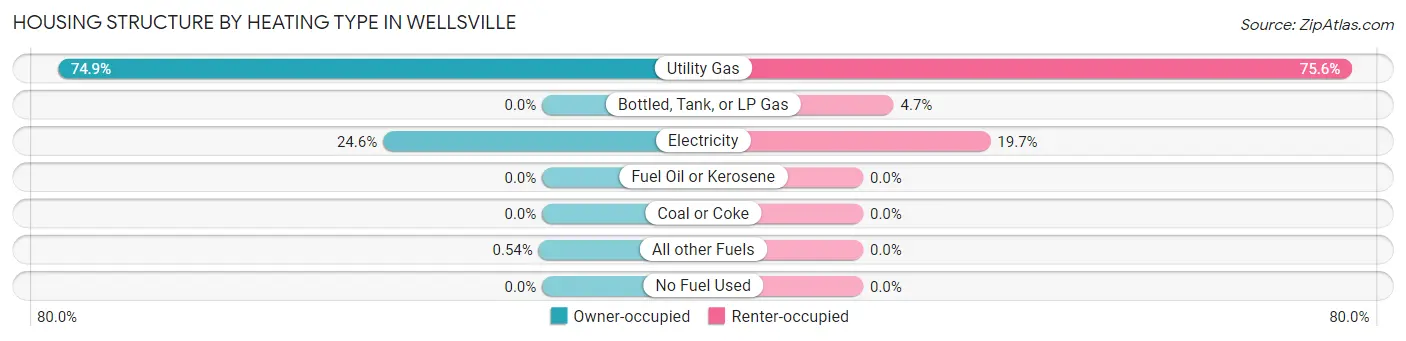
| Heating Type | Owner-occupied | Renter-occupied |
| Utility Gas | 417 (74.9%) | 192 (75.6%) |
| Bottled, Tank, or LP Gas | 0 (0.0%) | 12 (4.7%) |
| Electricity | 137 (24.6%) | 50 (19.7%) |
| Fuel Oil or Kerosene | 0 (0.0%) | 0 (0.0%) |
| Coal or Coke | 0 (0.0%) | 0 (0.0%) |
| All other Fuels | 3 (0.5%) | 0 (0.0%) |
| No Fuel Used | 0 (0.0%) | 0 (0.0%) |
| Total | 557 (100.0%) | 254 (100.0%) |
Household Vehicle Usage in Wellsville
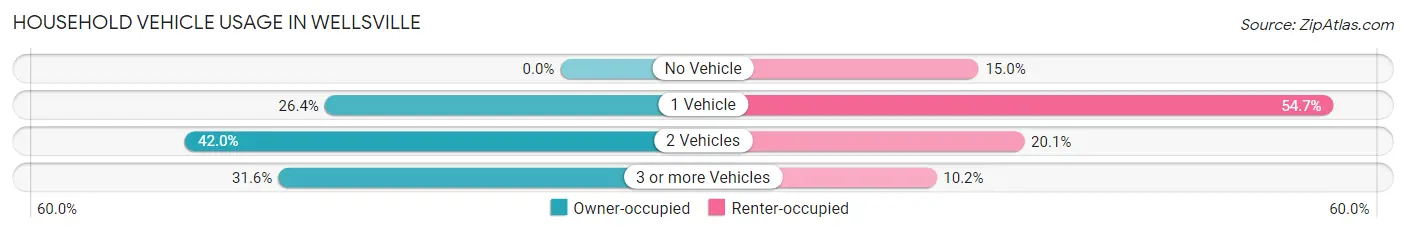
| Vehicles per Household | Owner-occupied | Renter-occupied |
| No Vehicle | 0 (0.0%) | 38 (15.0%) |
| 1 Vehicle | 147 (26.4%) | 139 (54.7%) |
| 2 Vehicles | 234 (42.0%) | 51 (20.1%) |
| 3 or more Vehicles | 176 (31.6%) | 26 (10.2%) |
| Total | 557 (100.0%) | 254 (100.0%) |
Real Estate & Mortgages in Wellsville
Real Estate and Mortgage Overview in Wellsville
| Characteristic | Without Mortgage | With Mortgage |
| Housing Units | 123 | 434 |
| Median Property Value | $132,400 | $168,900 |
| Median Household Income | $47,361 | $77 |
| Monthly Housing Costs | $556 | $4 |
| Real Estate Taxes | $2,244 | $0 |
Property Value by Mortgage Status in Wellsville
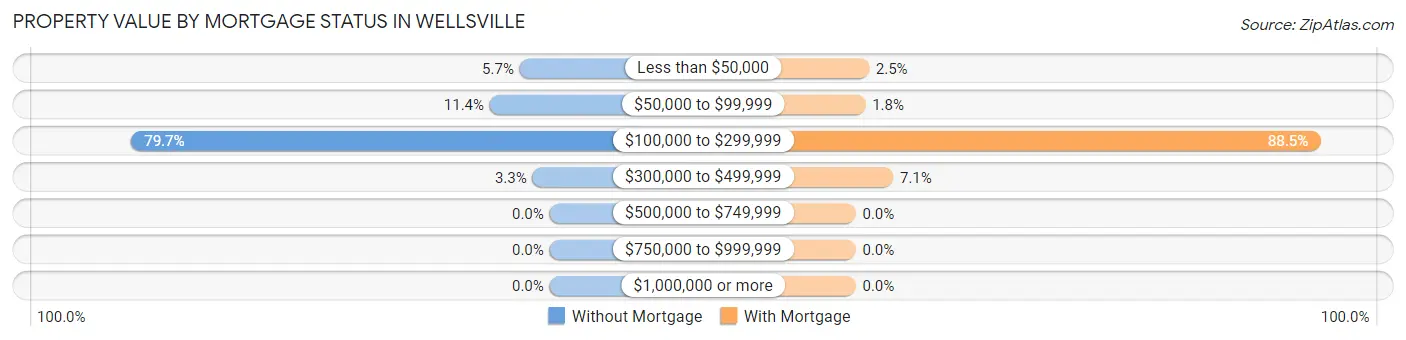
| Property Value | Without Mortgage | With Mortgage |
| Less than $50,000 | 7 (5.7%) | 11 (2.5%) |
| $50,000 to $99,999 | 14 (11.4%) | 8 (1.8%) |
| $100,000 to $299,999 | 98 (79.7%) | 384 (88.5%) |
| $300,000 to $499,999 | 4 (3.3%) | 31 (7.1%) |
| $500,000 to $749,999 | 0 (0.0%) | 0 (0.0%) |
| $750,000 to $999,999 | 0 (0.0%) | 0 (0.0%) |
| $1,000,000 or more | 0 (0.0%) | 0 (0.0%) |
| Total | 123 (100.0%) | 434 (100.0%) |
Household Income by Mortgage Status in Wellsville
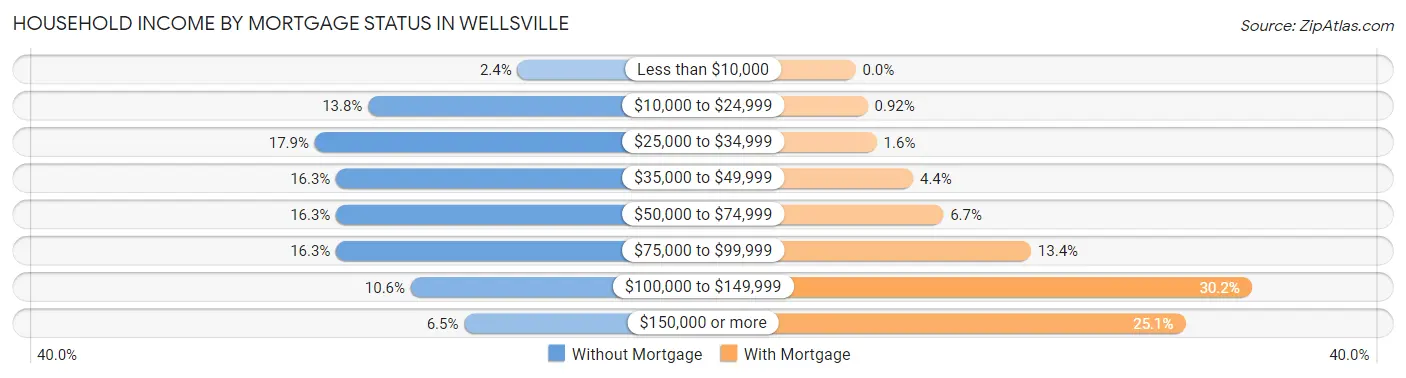
| Household Income | Without Mortgage | With Mortgage |
| Less than $10,000 | 3 (2.4%) | 0 (0.0%) |
| $10,000 to $24,999 | 17 (13.8%) | 4 (0.9%) |
| $25,000 to $34,999 | 22 (17.9%) | 7 (1.6%) |
| $35,000 to $49,999 | 20 (16.3%) | 19 (4.4%) |
| $50,000 to $74,999 | 20 (16.3%) | 29 (6.7%) |
| $75,000 to $99,999 | 20 (16.3%) | 58 (13.4%) |
| $100,000 to $149,999 | 13 (10.6%) | 131 (30.2%) |
| $150,000 or more | 8 (6.5%) | 109 (25.1%) |
| Total | 123 (100.0%) | 434 (100.0%) |
Property Value to Household Income Ratio in Wellsville
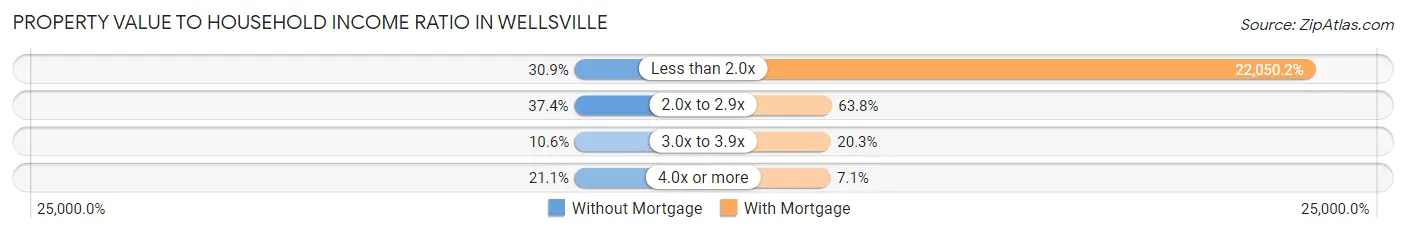
| Value-to-Income Ratio | Without Mortgage | With Mortgage |
| Less than 2.0x | 38 (30.9%) | 95,698 (22,050.2%) |
| 2.0x to 2.9x | 46 (37.4%) | 277 (63.8%) |
| 3.0x to 3.9x | 13 (10.6%) | 88 (20.3%) |
| 4.0x or more | 26 (21.1%) | 31 (7.1%) |
| Total | 123 (100.0%) | 434 (100.0%) |
Real Estate Taxes by Mortgage Status in Wellsville
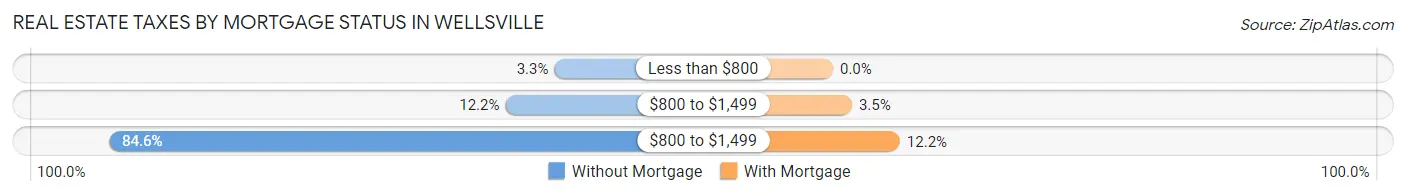
| Property Taxes | Without Mortgage | With Mortgage |
| Less than $800 | 4 (3.3%) | 0 (0.0%) |
| $800 to $1,499 | 15 (12.2%) | 15 (3.5%) |
| $800 to $1,499 | 104 (84.6%) | 53 (12.2%) |
| Total | 123 (100.0%) | 434 (100.0%) |
Health & Disability in Wellsville
Health Insurance Coverage by Age in Wellsville
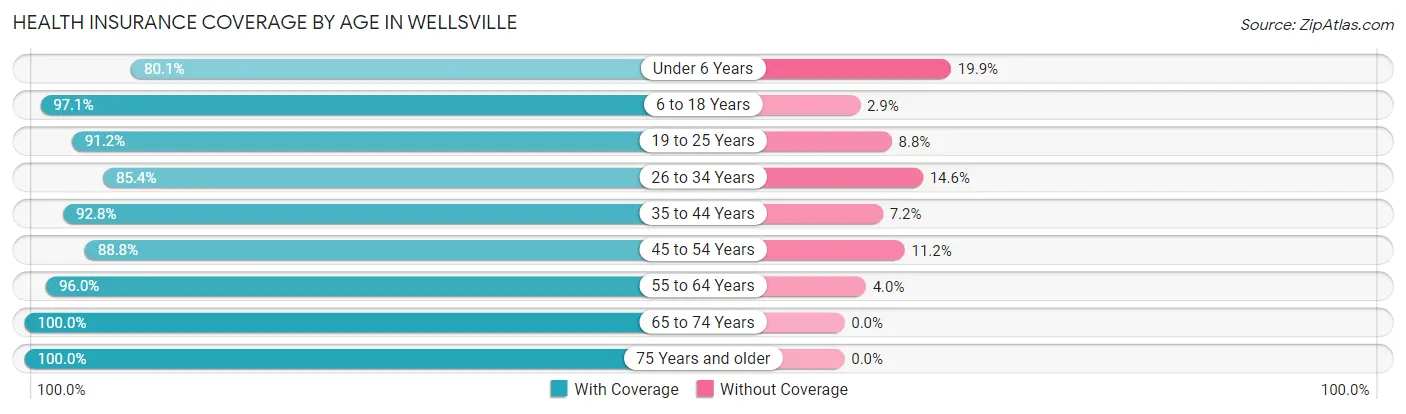
| Age Bracket | With Coverage | Without Coverage |
| Under 6 Years | 133 (80.1%) | 33 (19.9%) |
| 6 to 18 Years | 366 (97.1%) | 11 (2.9%) |
| 19 to 25 Years | 93 (91.2%) | 9 (8.8%) |
| 26 to 34 Years | 210 (85.4%) | 36 (14.6%) |
| 35 to 44 Years | 233 (92.8%) | 18 (7.2%) |
| 45 to 54 Years | 221 (88.8%) | 28 (11.2%) |
| 55 to 64 Years | 289 (96.0%) | 12 (4.0%) |
| 65 to 74 Years | 173 (100.0%) | 0 (0.0%) |
| 75 Years and older | 87 (100.0%) | 0 (0.0%) |
| Total | 1,805 (92.5%) | 147 (7.5%) |
Health Insurance Coverage by Citizenship Status in Wellsville
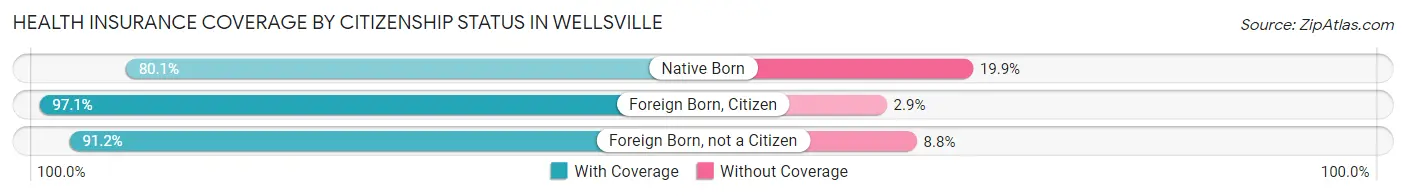
| Citizenship Status | With Coverage | Without Coverage |
| Native Born | 133 (80.1%) | 33 (19.9%) |
| Foreign Born, Citizen | 366 (97.1%) | 11 (2.9%) |
| Foreign Born, not a Citizen | 93 (91.2%) | 9 (8.8%) |
Health Insurance Coverage by Household Income in Wellsville
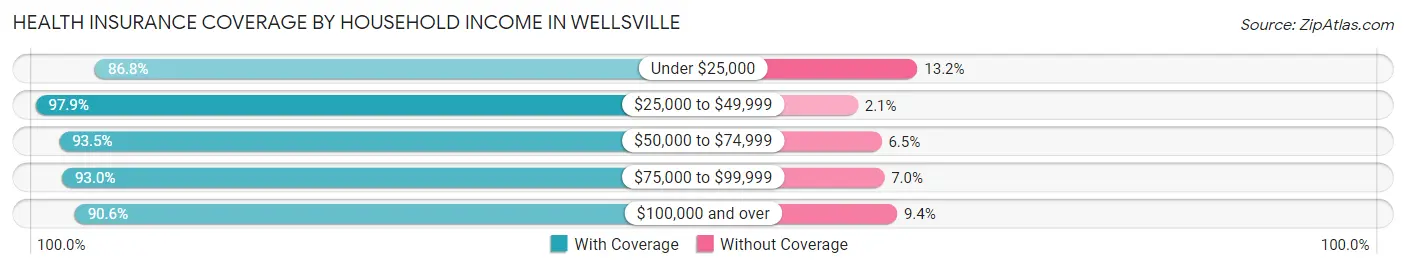
| Household Income | With Coverage | Without Coverage |
| Under $25,000 | 151 (86.8%) | 23 (13.2%) |
| $25,000 to $49,999 | 333 (97.9%) | 7 (2.1%) |
| $50,000 to $74,999 | 288 (93.5%) | 20 (6.5%) |
| $75,000 to $99,999 | 358 (93.0%) | 27 (7.0%) |
| $100,000 and over | 675 (90.6%) | 70 (9.4%) |
Public vs Private Health Insurance Coverage by Age in Wellsville
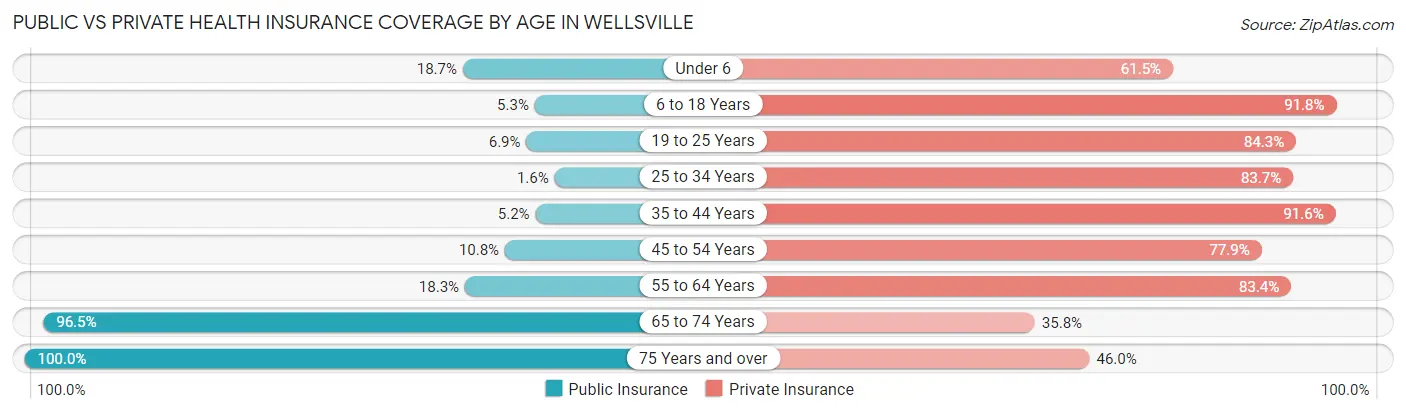
| Age Bracket | Public Insurance | Private Insurance |
| Under 6 | 31 (18.7%) | 102 (61.5%) |
| 6 to 18 Years | 20 (5.3%) | 346 (91.8%) |
| 19 to 25 Years | 7 (6.9%) | 86 (84.3%) |
| 25 to 34 Years | 4 (1.6%) | 206 (83.7%) |
| 35 to 44 Years | 13 (5.2%) | 230 (91.6%) |
| 45 to 54 Years | 27 (10.8%) | 194 (77.9%) |
| 55 to 64 Years | 55 (18.3%) | 251 (83.4%) |
| 65 to 74 Years | 167 (96.5%) | 62 (35.8%) |
| 75 Years and over | 87 (100.0%) | 40 (46.0%) |
| Total | 411 (21.1%) | 1,517 (77.7%) |
Disability Status by Sex by Age in Wellsville
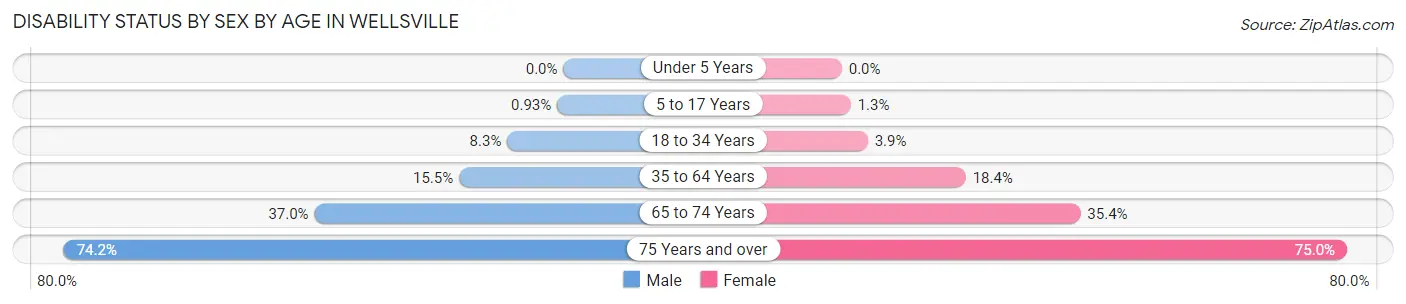
| Age Bracket | Male | Female |
| Under 5 Years | 0 (0.0%) | 0 (0.0%) |
| 5 to 17 Years | 2 (0.9%) | 2 (1.3%) |
| 18 to 34 Years | 17 (8.3%) | 7 (3.8%) |
| 35 to 64 Years | 66 (15.5%) | 69 (18.4%) |
| 65 to 74 Years | 17 (37.0%) | 45 (35.4%) |
| 75 Years and over | 23 (74.2%) | 42 (75.0%) |
Disability Class by Sex by Age in Wellsville
Disability Class: Hearing Difficulty
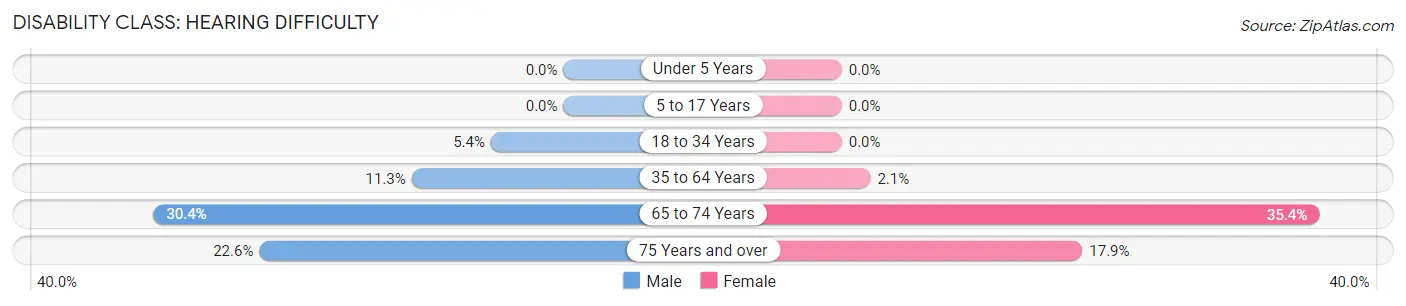
| Age Bracket | Male | Female |
| Under 5 Years | 0 (0.0%) | 0 (0.0%) |
| 5 to 17 Years | 0 (0.0%) | 0 (0.0%) |
| 18 to 34 Years | 11 (5.4%) | 0 (0.0%) |
| 35 to 64 Years | 48 (11.3%) | 8 (2.1%) |
| 65 to 74 Years | 14 (30.4%) | 45 (35.4%) |
| 75 Years and over | 7 (22.6%) | 10 (17.9%) |
Disability Class: Vision Difficulty
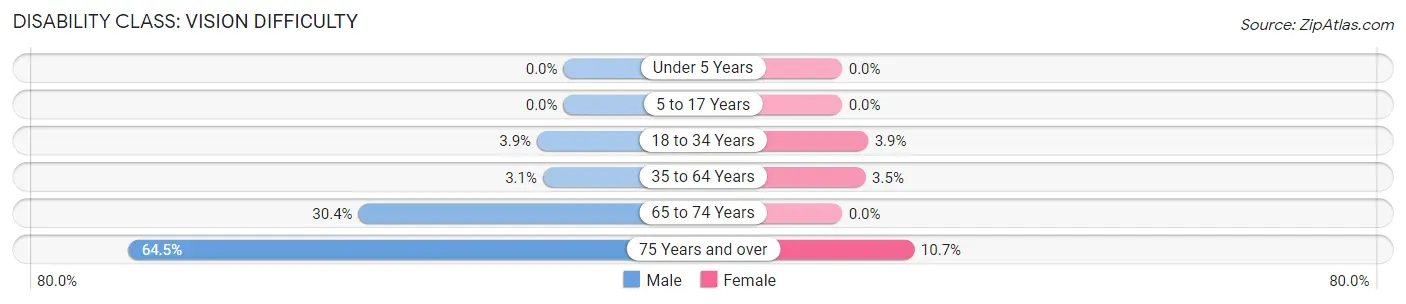
| Age Bracket | Male | Female |
| Under 5 Years | 0 (0.0%) | 0 (0.0%) |
| 5 to 17 Years | 0 (0.0%) | 0 (0.0%) |
| 18 to 34 Years | 8 (3.9%) | 7 (3.8%) |
| 35 to 64 Years | 13 (3.0%) | 13 (3.5%) |
| 65 to 74 Years | 14 (30.4%) | 0 (0.0%) |
| 75 Years and over | 20 (64.5%) | 6 (10.7%) |
Disability Class: Cognitive Difficulty
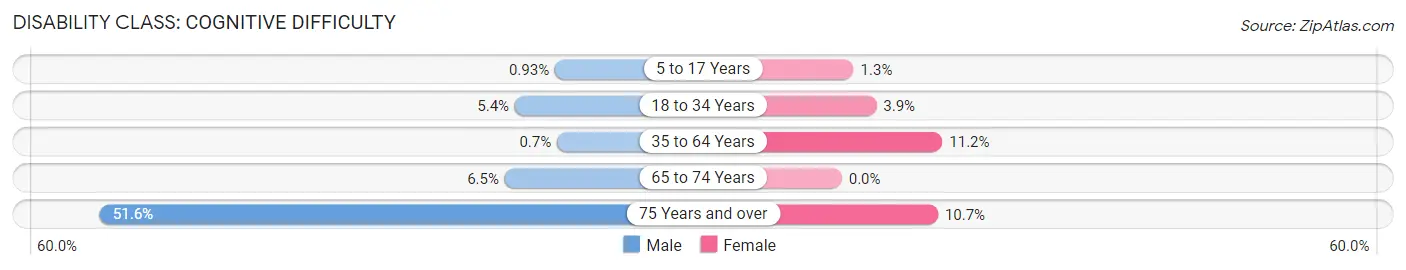
| Age Bracket | Male | Female |
| 5 to 17 Years | 2 (0.9%) | 2 (1.3%) |
| 18 to 34 Years | 11 (5.4%) | 7 (3.8%) |
| 35 to 64 Years | 3 (0.7%) | 42 (11.2%) |
| 65 to 74 Years | 3 (6.5%) | 0 (0.0%) |
| 75 Years and over | 16 (51.6%) | 6 (10.7%) |
Disability Class: Ambulatory Difficulty
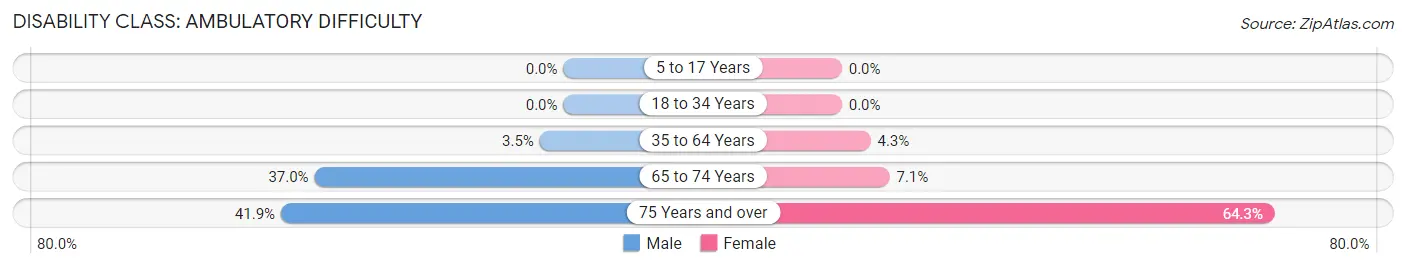
| Age Bracket | Male | Female |
| 5 to 17 Years | 0 (0.0%) | 0 (0.0%) |
| 18 to 34 Years | 0 (0.0%) | 0 (0.0%) |
| 35 to 64 Years | 15 (3.5%) | 16 (4.3%) |
| 65 to 74 Years | 17 (37.0%) | 9 (7.1%) |
| 75 Years and over | 13 (41.9%) | 36 (64.3%) |
Disability Class: Self-Care Difficulty
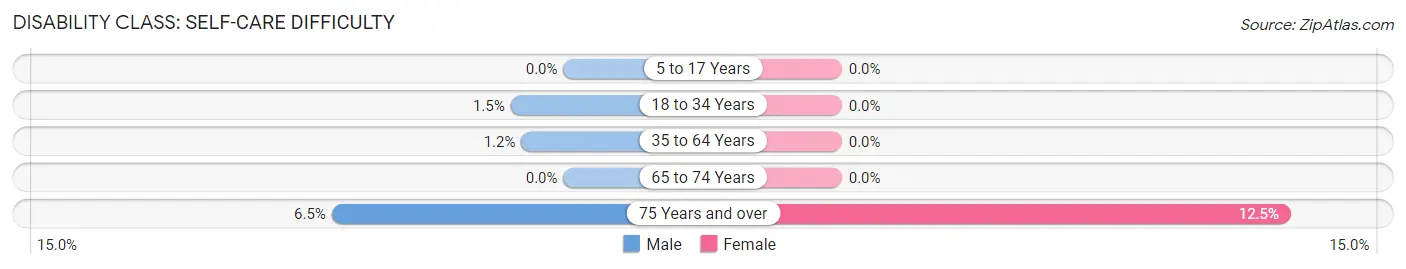
| Age Bracket | Male | Female |
| 5 to 17 Years | 0 (0.0%) | 0 (0.0%) |
| 18 to 34 Years | 3 (1.5%) | 0 (0.0%) |
| 35 to 64 Years | 5 (1.2%) | 0 (0.0%) |
| 65 to 74 Years | 0 (0.0%) | 0 (0.0%) |
| 75 Years and over | 2 (6.5%) | 7 (12.5%) |
Technology Access in Wellsville
Computing Device Access in Wellsville
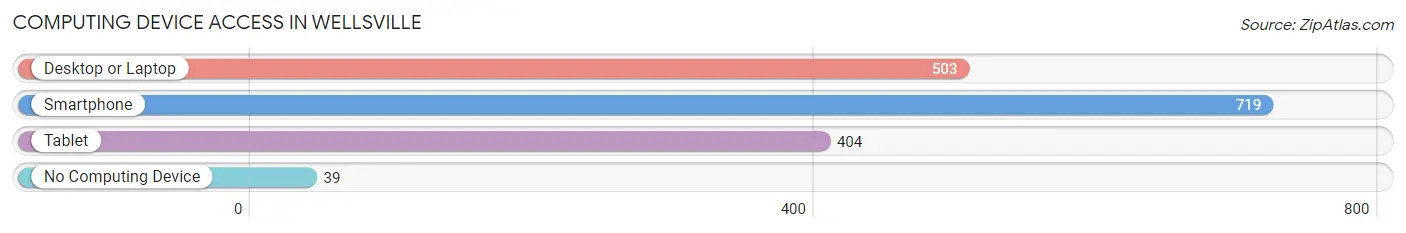
| Device Type | # Households | % Households |
| Desktop or Laptop | 503 | 62.0% |
| Smartphone | 719 | 88.7% |
| Tablet | 404 | 49.8% |
| No Computing Device | 39 | 4.8% |
| Total | 811 | 100.0% |
Internet Access in Wellsville
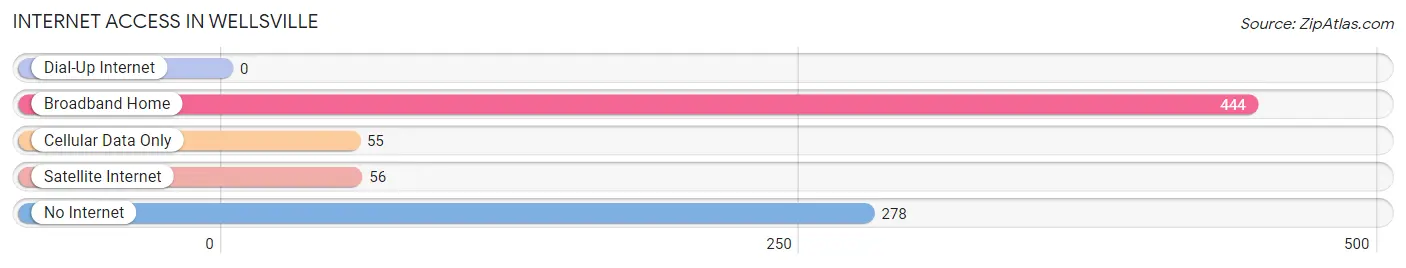
| Internet Type | # Households | % Households |
| Dial-Up Internet | 0 | 0.0% |
| Broadband Home | 444 | 54.7% |
| Cellular Data Only | 55 | 6.8% |
| Satellite Internet | 56 | 6.9% |
| No Internet | 278 | 34.3% |
| Total | 811 | 100.0% |
Wellsville Summary
Wellsville, Kansas is a small city located in Franklin County, Kansas. It is situated on the banks of the Marais des Cygnes River, approximately 25 miles south of Kansas City. The city has a population of approximately 2,500 people and is part of the Lawrence-Douglas County Metropolitan Statistical Area.
History
Wellsville was founded in 1857 by a group of settlers from Ohio. The city was named after the first settler, William Wells, who had previously lived in Ohio. The city was incorporated in 1868 and was the first city in Franklin County.
In the late 19th century, Wellsville was a thriving agricultural community. The city was home to several grain elevators, a flour mill, and a creamery. The city also had a large number of businesses, including a hotel, a bank, a newspaper, and a variety of stores.
In the early 20th century, the city experienced a period of growth and prosperity. The city was home to several manufacturing plants, including a brick factory, a furniture factory, and a canning factory. The city also had a number of churches, schools, and other civic organizations.
Geography
Wellsville is located in the eastern part of Franklin County, Kansas. The city is situated on the banks of the Marais des Cygnes River, approximately 25 miles south of Kansas City. The city has a total area of 1.3 square miles, all of which is land.
The city has a humid continental climate, with hot, humid summers and cold, dry winters. The average annual temperature is 54°F, and the average annual precipitation is 37 inches.
Economy
The economy of Wellsville is largely based on agriculture and manufacturing. The city is home to several grain elevators, a flour mill, and a creamery. The city also has a number of businesses, including a hotel, a bank, a newspaper, and a variety of stores.
The city is also home to several manufacturing plants, including a brick factory, a furniture factory, and a canning factory. The city also has a number of churches, schools, and other civic organizations.
Demographics
As of the 2010 census, the population of Wellsville was 2,500. The racial makeup of the city was 95.2% White, 0.8% African American, 0.4% Native American, 0.4% Asian, 0.2% Pacific Islander, and 2.8% from other races. The median household income was $41,250, and the median family income was $50,000.
The city has a large number of residents who are over the age of 65. The median age of the city is 44.7 years, and the gender ratio is almost even, with 50.2% of the population being male and 49.8% being female.
Conclusion
Wellsville, Kansas is a small city located in Franklin County, Kansas. It is situated on the banks of the Marais des Cygnes River, approximately 25 miles south of Kansas City. The city has a population of approximately 2,500 people and is part of the Lawrence-Douglas County Metropolitan Statistical Area. The economy of Wellsville is largely based on agriculture and manufacturing, and the city is home to several grain elevators, a flour mill, and a creamery. The city also has a number of businesses, including a hotel, a bank, a newspaper, and a variety of stores. The city has a humid continental climate, with hot, humid summers and cold, dry winters. The racial makeup of the city is 95.2% White, 0.8% African American, 0.4% Native American, 0.4% Asian, 0.2% Pacific Islander, and 2.8% from other races. The median household income was $41,250, and the median family income was $50,000.
Common Questions
What is Per Capita Income in Wellsville?
Per Capita income in Wellsville is $32,919.
What is the Median Family Income in Wellsville?
Median Family Income in Wellsville is $90,515.
What is the Median Household income in Wellsville?
Median Household Income in Wellsville is $68,750.
What is Income or Wage Gap in Wellsville?
Income or Wage Gap in Wellsville is 25.5%.
Women in Wellsville earn 74.5 cents for every dollar earned by a man.
What is Inequality or Gini Index in Wellsville?
Inequality or Gini Index in Wellsville is 0.37.
What is the Total Population of Wellsville?
Total Population of Wellsville is 2,022.
What is the Total Male Population of Wellsville?
Total Male Population of Wellsville is 987.
What is the Total Female Population of Wellsville?
Total Female Population of Wellsville is 1,035.
What is the Ratio of Males per 100 Females in Wellsville?
There are 95.36 Males per 100 Females in Wellsville.
What is the Ratio of Females per 100 Males in Wellsville?
There are 104.86 Females per 100 Males in Wellsville.
What is the Median Population Age in Wellsville?
Median Population Age in Wellsville is 37.9 Years.
What is the Average Family Size in Wellsville
Average Family Size in Wellsville is 3.1 People.
What is the Average Household Size in Wellsville
Average Household Size in Wellsville is 2.4 People.
How Large is the Labor Force in Wellsville?
There are 948 People in the Labor Forcein in Wellsville.
What is the Percentage of People in the Labor Force in Wellsville?
60.1% of People are in the Labor Force in Wellsville.
What is the Unemployment Rate in Wellsville?
Unemployment Rate in Wellsville is 1.7%.