Spring Hill, KS Map & Demographics
Spring Hill Map
Spring Hill Overview
$39,315
PER CAPITA INCOME
$118,707
AVG FAMILY INCOME
$105,194
AVG HOUSEHOLD INCOME
38.6%
WAGE / INCOME GAP [ % ]
61.4¢/ $1
WAGE / INCOME GAP [ $ ]
0.35
INEQUALITY / GINI INDEX
8,279
TOTAL POPULATION
4,371
MALE POPULATION
3,908
FEMALE POPULATION
111.85
MALES / 100 FEMALES
89.41
FEMALES / 100 MALES
34.3
MEDIAN AGE
3.2
AVG FAMILY SIZE
2.9
AVG HOUSEHOLD SIZE
4,614
LABOR FORCE [ PEOPLE ]
75.6%
PERCENT IN LABOR FORCE
2.3%
UNEMPLOYMENT RATE
Spring Hill Zip Codes
Spring Hill Area Codes
Income in Spring Hill
Income Overview in Spring Hill
Per Capita Income in Spring Hill is $39,315, while median incomes of families and households are $118,707 and $105,194 respectively.
| Characteristic | Number | Measure |
| Per Capita Income | 8,279 | $39,315 |
| Median Family Income | 2,316 | $118,707 |
| Mean Family Income | 2,316 | $124,961 |
| Median Household Income | 2,859 | $105,194 |
| Mean Household Income | 2,859 | $112,347 |
| Income Deficit | 2,316 | $0 |
| Wage / Income Gap (%) | 8,279 | 38.65% |
| Wage / Income Gap ($) | 8,279 | 61.35¢ per $1 |
| Gini / Inequality Index | 8,279 | 0.35 |
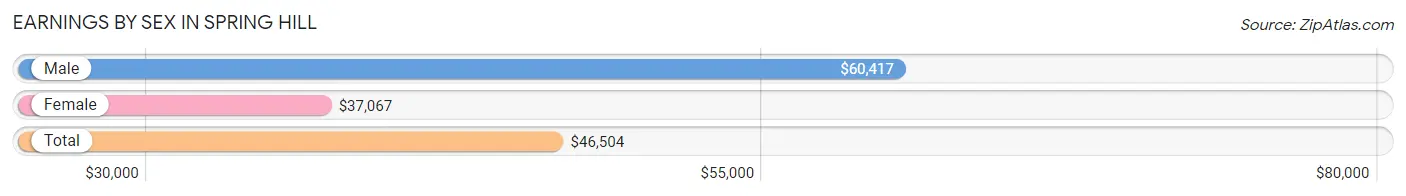
Earnings by Sex in Spring Hill
Average Earnings in Spring Hill are $46,504, $60,417 for men and $37,067 for women, a difference of 38.7%.
| Sex | Number | Average Earnings |
| Male | 2,586 (54.0%) | $60,417 |
| Female | 2,200 (46.0%) | $37,067 |
| Total | 4,786 (100.0%) | $46,504 |
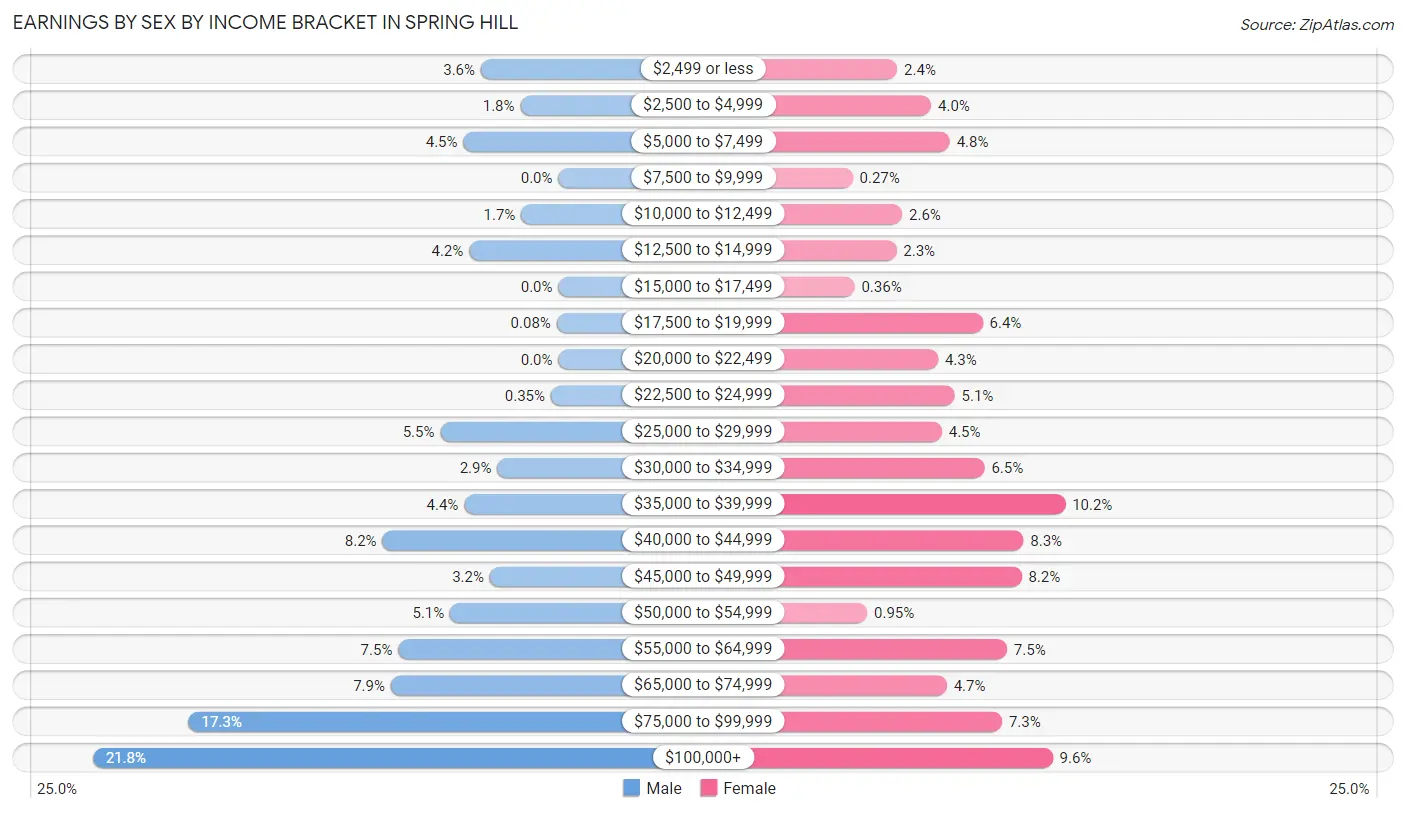
Earnings by Sex by Income Bracket in Spring Hill
The most common earnings brackets in Spring Hill are $100,000+ for men (564 | 21.8%) and $35,000 to $39,999 for women (225 | 10.2%).
| Income | Male | Female |
| $2,499 or less | 94 (3.6%) | 52 (2.4%) |
| $2,500 to $4,999 | 46 (1.8%) | 87 (4.0%) |
| $5,000 to $7,499 | 115 (4.4%) | 106 (4.8%) |
| $7,500 to $9,999 | 0 (0.0%) | 6 (0.3%) |
| $10,000 to $12,499 | 45 (1.7%) | 57 (2.6%) |
| $12,500 to $14,999 | 108 (4.2%) | 51 (2.3%) |
| $15,000 to $17,499 | 0 (0.0%) | 8 (0.4%) |
| $17,500 to $19,999 | 2 (0.1%) | 140 (6.4%) |
| $20,000 to $22,499 | 0 (0.0%) | 94 (4.3%) |
| $22,500 to $24,999 | 9 (0.4%) | 111 (5.1%) |
| $25,000 to $29,999 | 143 (5.5%) | 98 (4.4%) |
| $30,000 to $34,999 | 74 (2.9%) | 142 (6.5%) |
| $35,000 to $39,999 | 114 (4.4%) | 225 (10.2%) |
| $40,000 to $44,999 | 213 (8.2%) | 182 (8.3%) |
| $45,000 to $49,999 | 83 (3.2%) | 180 (8.2%) |
| $50,000 to $54,999 | 131 (5.1%) | 21 (0.9%) |
| $55,000 to $64,999 | 194 (7.5%) | 165 (7.5%) |
| $65,000 to $74,999 | 203 (7.9%) | 103 (4.7%) |
| $75,000 to $99,999 | 448 (17.3%) | 160 (7.3%) |
| $100,000+ | 564 (21.8%) | 212 (9.6%) |
| Total | 2,586 (100.0%) | 2,200 (100.0%) |
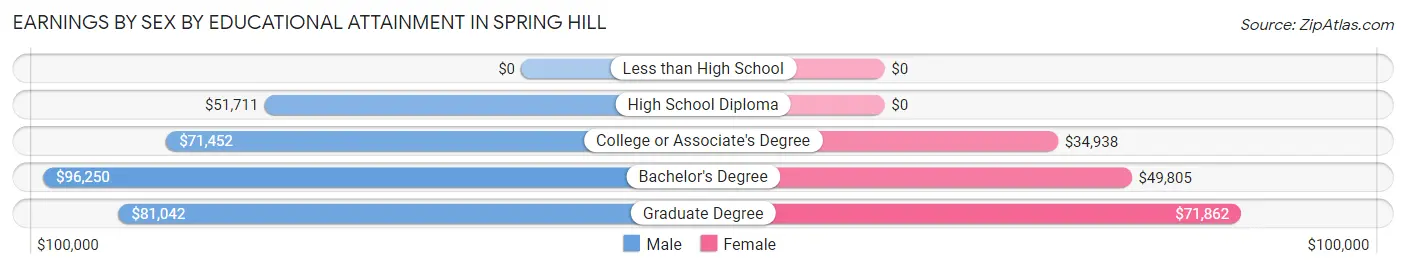
Earnings by Sex by Educational Attainment in Spring Hill
Average earnings in Spring Hill are $73,598 for men and $42,243 for women, a difference of 42.6%. Men with an educational attainment of bachelor's degree enjoy the highest average annual earnings of $96,250, while those with high school diploma education earn the least with $51,711. Women with an educational attainment of graduate degree earn the most with the average annual earnings of $71,862, while those with college or associate's degree education have the smallest earnings of $34,938.
| Educational Attainment | Male Income | Female Income |
| Less than High School | - | - |
| High School Diploma | $51,711 | $0 |
| College or Associate's Degree | $71,452 | $34,938 |
| Bachelor's Degree | $96,250 | $49,805 |
| Graduate Degree | $81,042 | $71,862 |
| Total | $73,598 | $42,243 |
Family Income in Spring Hill
Family Income Brackets in Spring Hill
According to the Spring Hill family income data, there are 746 families falling into the $100,000 to $149,999 income range, which is the most common income bracket and makes up 32.2% of all families. Conversely, the $15,000 to $24,999 income bracket is the least frequent group with only 42 families (1.8%) belonging to this category.
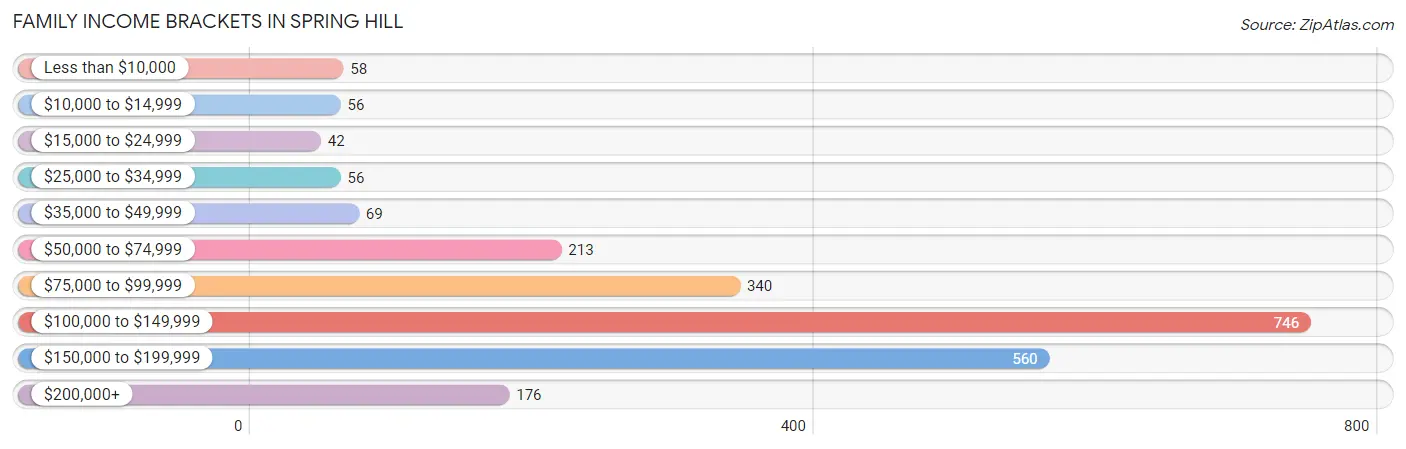
| Income Bracket | # Families | % Families |
| Less than $10,000 | 58 | 2.5% |
| $10,000 to $14,999 | 56 | 2.4% |
| $15,000 to $24,999 | 42 | 1.8% |
| $25,000 to $34,999 | 56 | 2.4% |
| $35,000 to $49,999 | 69 | 3.0% |
| $50,000 to $74,999 | 213 | 9.2% |
| $75,000 to $99,999 | 340 | 14.7% |
| $100,000 to $149,999 | 746 | 32.2% |
| $150,000 to $199,999 | 560 | 24.2% |
| $200,000+ | 176 | 7.6% |
Family Income by Famaliy Size in Spring Hill
6-person families (138 | 6.0%) account for the highest median family income in Spring Hill with $185,531 per family, while 2-person families (947 | 40.9%) have the highest median income of $52,650 per family member.

| Income Bracket | # Families | Median Income |
| 2-Person Families | 947 (40.9%) | $105,299 |
| 3-Person Families | 627 (27.1%) | $113,657 |
| 4-Person Families | 435 (18.8%) | $146,065 |
| 5-Person Families | 136 (5.9%) | $111,071 |
| 6-Person Families | 138 (6.0%) | $185,531 |
| 7+ Person Families | 33 (1.4%) | $150,074 |
| Total | 2,316 (100.0%) | $118,707 |
Family Income by Number of Earners in Spring Hill
The median family income in Spring Hill is $118,707, with families comprising 3+ earners (314) having the highest median family income of $165,968, while families with no earners (224) have the lowest median family income of $62,500, accounting for 13.6% and 9.7% of families, respectively.
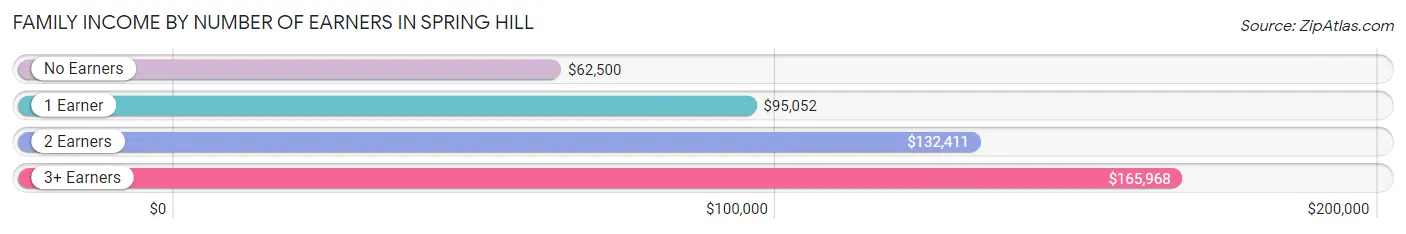
| Number of Earners | # Families | Median Income |
| No Earners | 224 (9.7%) | $62,500 |
| 1 Earner | 593 (25.6%) | $95,052 |
| 2 Earners | 1,185 (51.2%) | $132,411 |
| 3+ Earners | 314 (13.6%) | $165,968 |
| Total | 2,316 (100.0%) | $118,707 |
Household Income in Spring Hill
Household Income Brackets in Spring Hill
With 755 households falling in the category, the $100,000 to $149,999 income range is the most frequent in Spring Hill, accounting for 26.4% of all households. In contrast, only 46 households (1.6%) fall into the $15,000 to $24,999 income bracket, making it the least populous group.
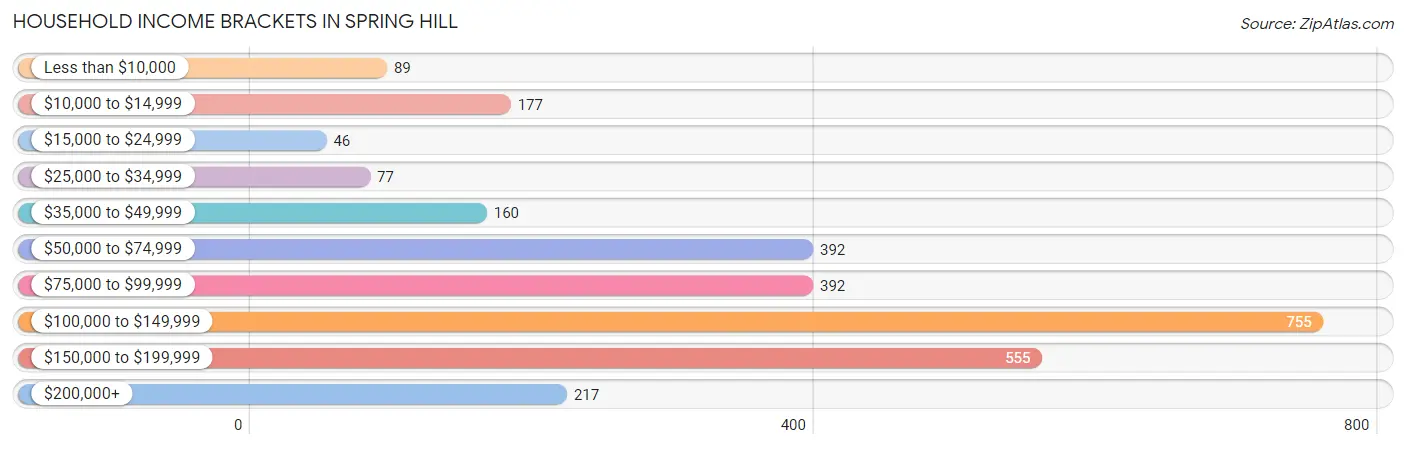
| Income Bracket | # Households | % Households |
| Less than $10,000 | 89 | 3.1% |
| $10,000 to $14,999 | 177 | 6.2% |
| $15,000 to $24,999 | 46 | 1.6% |
| $25,000 to $34,999 | 77 | 2.7% |
| $35,000 to $49,999 | 160 | 5.6% |
| $50,000 to $74,999 | 392 | 13.7% |
| $75,000 to $99,999 | 392 | 13.7% |
| $100,000 to $149,999 | 755 | 26.4% |
| $150,000 to $199,999 | 555 | 19.4% |
| $200,000+ | 217 | 7.6% |
Household Income by Householder Age in Spring Hill
The median household income in Spring Hill is $105,194, with the highest median household income of $127,746 found in the 45 to 64 years age bracket for the primary householder. A total of 1,281 households (44.8%) fall into this category. Meanwhile, the 15 to 24 years age bracket for the primary householder has the lowest median household income of $0, with 94 households (3.3%) in this group.
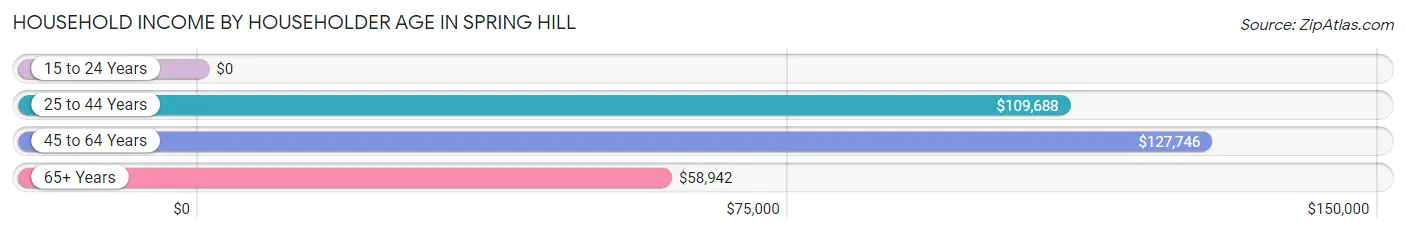
| Income Bracket | # Households | Median Income |
| 15 to 24 Years | 94 (3.3%) | $0 |
| 25 to 44 Years | 1,037 (36.3%) | $109,688 |
| 45 to 64 Years | 1,281 (44.8%) | $127,746 |
| 65+ Years | 447 (15.6%) | $58,942 |
| Total | 2,859 (100.0%) | $105,194 |
Poverty in Spring Hill
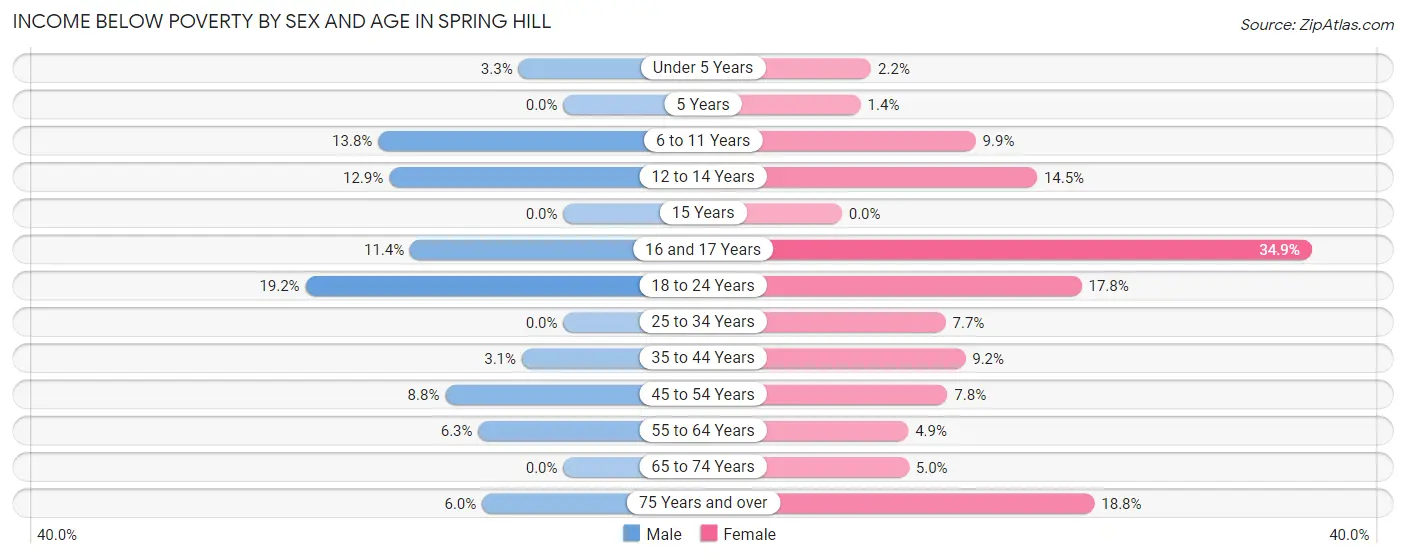
Income Below Poverty by Sex and Age in Spring Hill
With 7.0% poverty level for males and 9.1% for females among the residents of Spring Hill, 18 to 24 year old males and 16 and 17 year old females are the most vulnerable to poverty, with 86 males (19.2%) and 30 females (34.9%) in their respective age groups living below the poverty level.
| Age Bracket | Male | Female |
| Under 5 Years | 7 (3.3%) | 8 (2.2%) |
| 5 Years | 0 (0.0%) | 2 (1.4%) |
| 6 to 11 Years | 48 (13.8%) | 18 (9.9%) |
| 12 to 14 Years | 44 (12.9%) | 31 (14.5%) |
| 15 Years | 0 (0.0%) | 0 (0.0%) |
| 16 and 17 Years | 14 (11.4%) | 30 (34.9%) |
| 18 to 24 Years | 86 (19.2%) | 73 (17.8%) |
| 25 to 34 Years | 0 (0.0%) | 39 (7.7%) |
| 35 to 44 Years | 19 (3.1%) | 44 (9.2%) |
| 45 to 54 Years | 54 (8.8%) | 44 (7.8%) |
| 55 to 64 Years | 27 (6.3%) | 24 (4.9%) |
| 65 to 74 Years | 0 (0.0%) | 12 (5.0%) |
| 75 Years and over | 7 (6.0%) | 30 (18.8%) |
| Total | 306 (7.0%) | 355 (9.1%) |
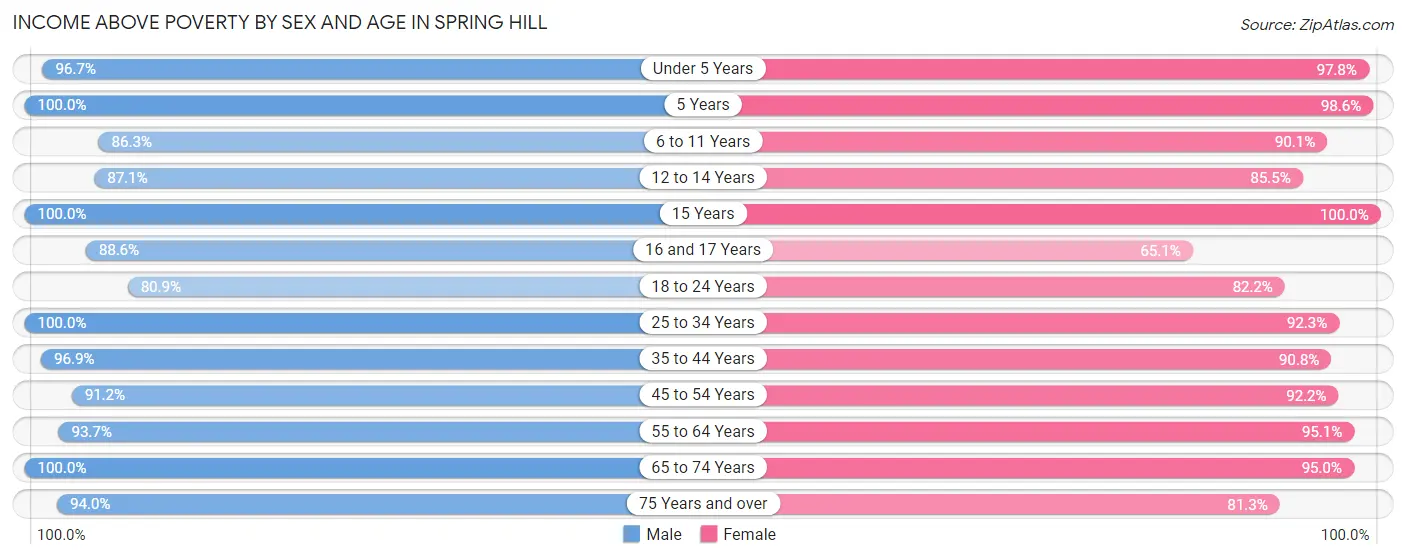
Income Above Poverty by Sex and Age in Spring Hill
According to the poverty statistics in Spring Hill, males aged 5 years and females aged 15 years are the age groups that are most secure financially, with 100.0% of males and 100.0% of females in these age groups living above the poverty line.
| Age Bracket | Male | Female |
| Under 5 Years | 203 (96.7%) | 359 (97.8%) |
| 5 Years | 115 (100.0%) | 141 (98.6%) |
| 6 to 11 Years | 301 (86.3%) | 163 (90.1%) |
| 12 to 14 Years | 296 (87.1%) | 183 (85.5%) |
| 15 Years | 215 (100.0%) | 42 (100.0%) |
| 16 and 17 Years | 109 (88.6%) | 56 (65.1%) |
| 18 to 24 Years | 363 (80.8%) | 337 (82.2%) |
| 25 to 34 Years | 544 (100.0%) | 467 (92.3%) |
| 35 to 44 Years | 598 (96.9%) | 436 (90.8%) |
| 45 to 54 Years | 562 (91.2%) | 517 (92.2%) |
| 55 to 64 Years | 401 (93.7%) | 463 (95.1%) |
| 65 to 74 Years | 224 (100.0%) | 229 (95.0%) |
| 75 Years and over | 109 (94.0%) | 130 (81.2%) |
| Total | 4,040 (93.0%) | 3,523 (90.8%) |
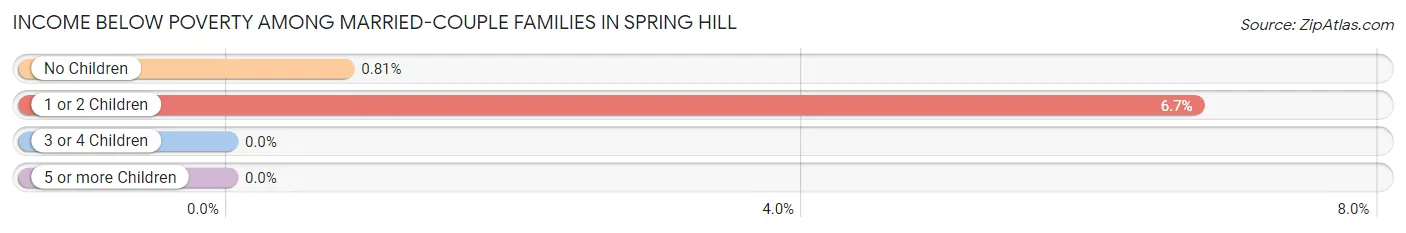
Income Below Poverty Among Married-Couple Families in Spring Hill
The poverty statistics for married-couple families in Spring Hill show that 3.3% or 56 of the total 1,713 families live below the poverty line. Families with 1 or 2 children have the highest poverty rate of 6.7%, comprising of 49 families. On the other hand, families with 3 or 4 children have the lowest poverty rate of 0.0%, which includes 0 families.
| Children | Above Poverty | Below Poverty |
| No Children | 854 (99.2%) | 7 (0.8%) |
| 1 or 2 Children | 679 (93.3%) | 49 (6.7%) |
| 3 or 4 Children | 108 (100.0%) | 0 (0.0%) |
| 5 or more Children | 16 (100.0%) | 0 (0.0%) |
| Total | 1,657 (96.7%) | 56 (3.3%) |
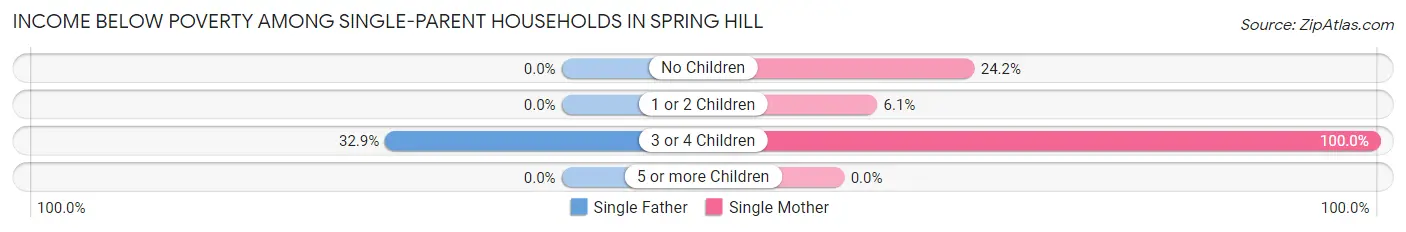
Income Below Poverty Among Single-Parent Households in Spring Hill
According to the poverty data in Spring Hill, 10.0% or 23 single-father households and 14.2% or 53 single-mother households are living below the poverty line. Among single-father households, those with 3 or 4 children have the highest poverty rate, with 23 households (32.9%) experiencing poverty. Likewise, among single-mother households, those with 3 or 4 children have the highest poverty rate, with 13 households (100.0%) falling below the poverty line.
| Children | Single Father | Single Mother |
| No Children | 0 (0.0%) | 24 (24.2%) |
| 1 or 2 Children | 0 (0.0%) | 16 (6.1%) |
| 3 or 4 Children | 23 (32.9%) | 13 (100.0%) |
| 5 or more Children | 0 (0.0%) | 0 (0.0%) |
| Total | 23 (10.0%) | 53 (14.2%) |
Income Below Poverty Among Married-Couple vs Single-Parent Households in Spring Hill
The poverty data for Spring Hill shows that 56 of the married-couple family households (3.3%) and 76 of the single-parent households (12.6%) are living below the poverty level. Within the married-couple family households, those with 1 or 2 children have the highest poverty rate, with 49 households (6.7%) falling below the poverty line. Among the single-parent households, those with 3 or 4 children have the highest poverty rate, with 36 household (43.4%) living below poverty.
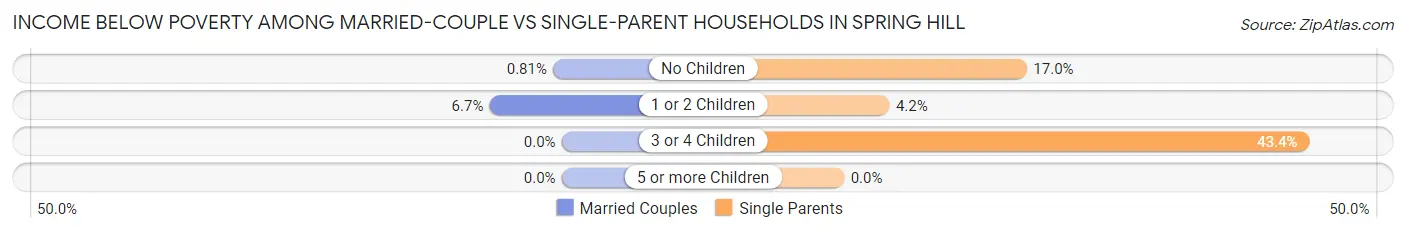
| Children | Married-Couple Families | Single-Parent Households |
| No Children | 7 (0.8%) | 24 (17.0%) |
| 1 or 2 Children | 49 (6.7%) | 16 (4.2%) |
| 3 or 4 Children | 0 (0.0%) | 36 (43.4%) |
| 5 or more Children | 0 (0.0%) | 0 (0.0%) |
| Total | 56 (3.3%) | 76 (12.6%) |
Race in Spring Hill
The most populous races in Spring Hill are White / Caucasian (7,722 | 93.3%), Two or more Races (348 | 4.2%), and Hispanic or Latino (290 | 3.5%).
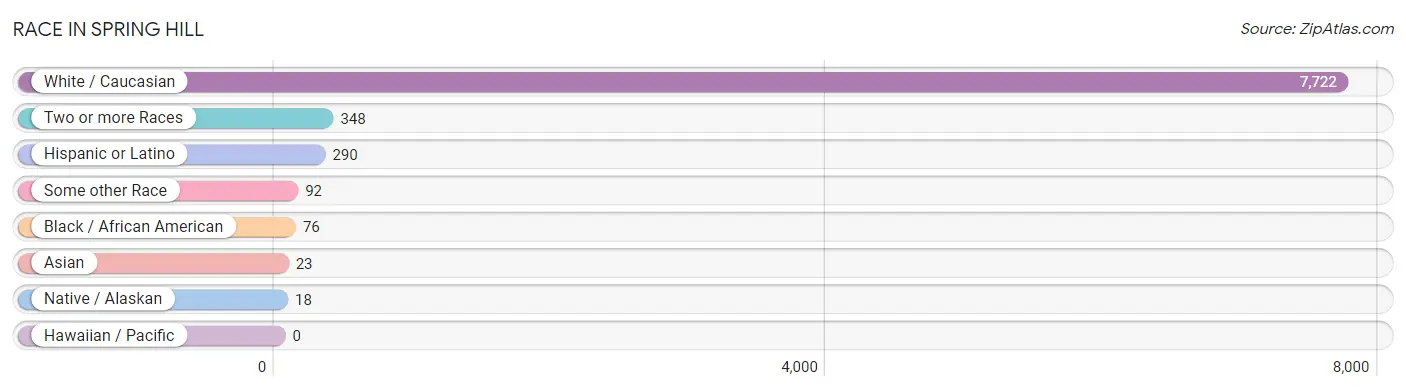
| Race | # Population | % Population |
| Asian | 23 | 0.3% |
| Black / African American | 76 | 0.9% |
| Hawaiian / Pacific | 0 | 0.0% |
| Hispanic or Latino | 290 | 3.5% |
| Native / Alaskan | 18 | 0.2% |
| White / Caucasian | 7,722 | 93.3% |
| Two or more Races | 348 | 4.2% |
| Some other Race | 92 | 1.1% |
| Total | 8,279 | 100.0% |
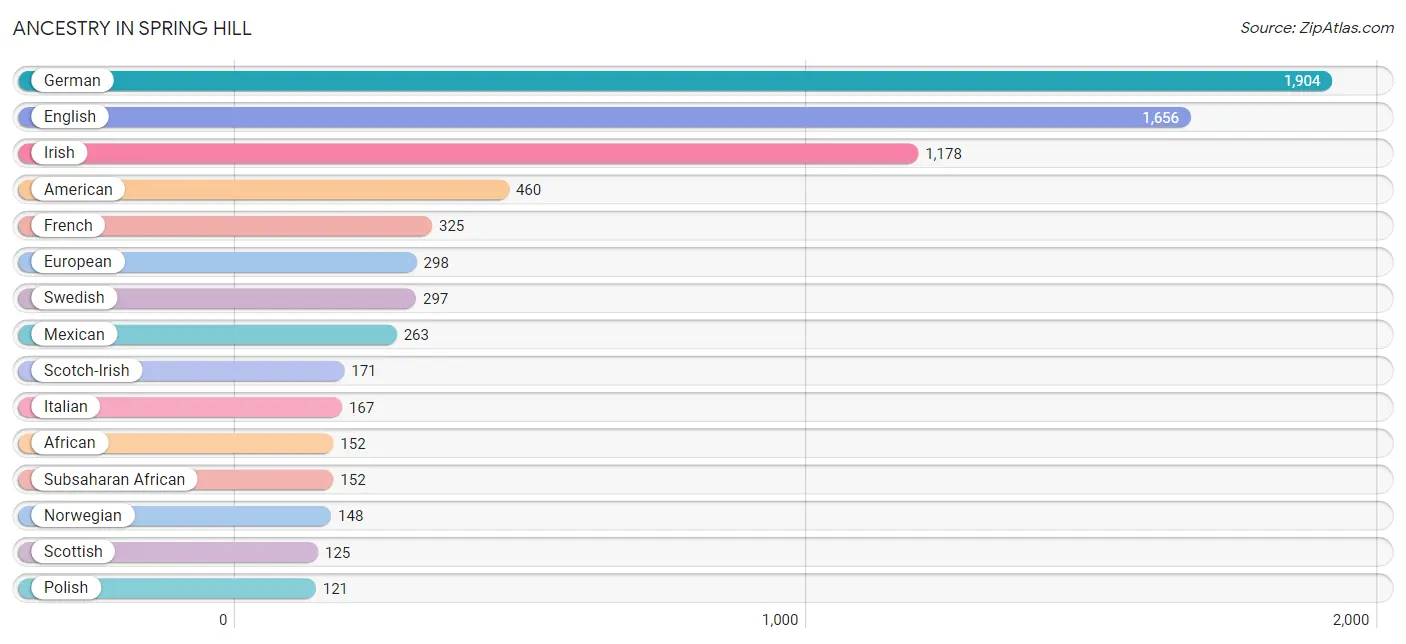
Ancestry in Spring Hill
The most populous ancestries reported in Spring Hill are German (1,904 | 23.0%), English (1,656 | 20.0%), Irish (1,178 | 14.2%), American (460 | 5.6%), and French (325 | 3.9%), together accounting for 66.7% of all Spring Hill residents.
| Ancestry | # Population | % Population |
| African | 152 | 1.8% |
| American | 460 | 5.6% |
| Arab | 7 | 0.1% |
| Austrian | 19 | 0.2% |
| Burmese | 23 | 0.3% |
| Cherokee | 12 | 0.1% |
| Chickasaw | 13 | 0.2% |
| Creek | 18 | 0.2% |
| Croatian | 29 | 0.4% |
| Czech | 35 | 0.4% |
| Danish | 36 | 0.4% |
| Dutch | 44 | 0.5% |
| English | 1,656 | 20.0% |
| European | 298 | 3.6% |
| Finnish | 2 | 0.0% |
| French | 325 | 3.9% |
| German | 1,904 | 23.0% |
| Irish | 1,178 | 14.2% |
| Italian | 167 | 2.0% |
| Mexican | 263 | 3.2% |
| Norwegian | 148 | 1.8% |
| Polish | 121 | 1.5% |
| Portuguese | 9 | 0.1% |
| Romanian | 46 | 0.6% |
| Scandinavian | 67 | 0.8% |
| Scotch-Irish | 171 | 2.1% |
| Scottish | 125 | 1.5% |
| South American | 27 | 0.3% |
| Subsaharan African | 152 | 1.8% |
| Swedish | 297 | 3.6% |
| Swiss | 1 | 0.0% |
| Syrian | 7 | 0.1% |
| Venezuelan | 27 | 0.3% |
| Welsh | 38 | 0.5% | View All 34 Rows |
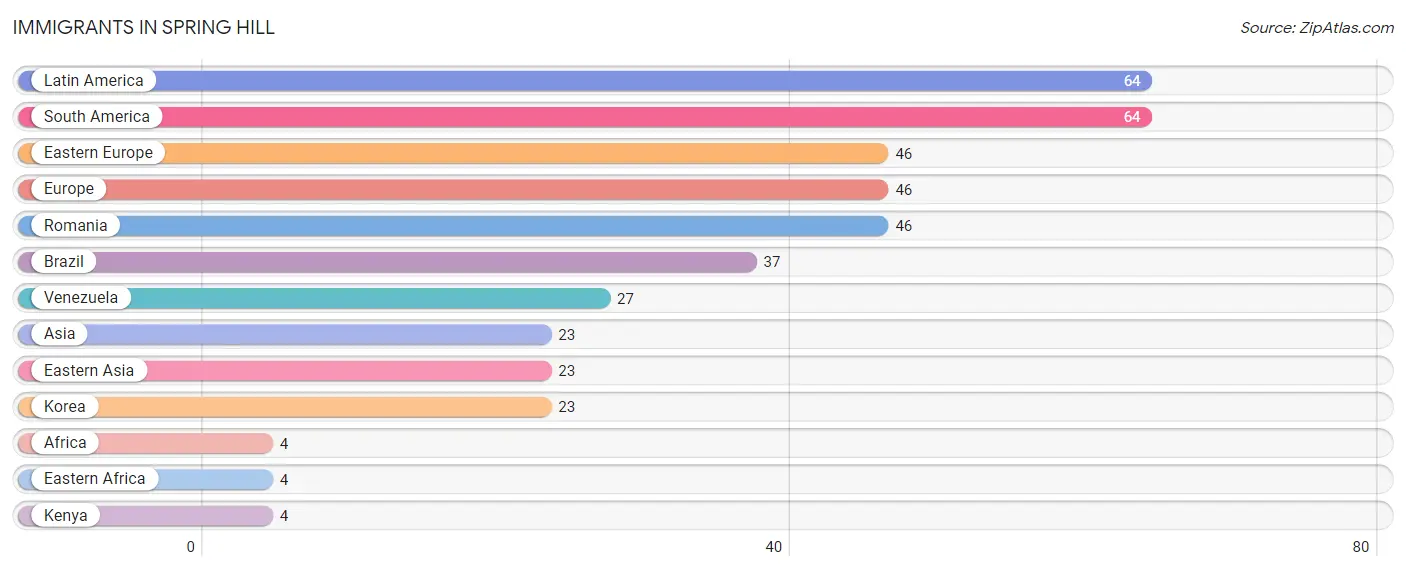
Immigrants in Spring Hill
The most numerous immigrant groups reported in Spring Hill came from Latin America (64 | 0.8%), South America (64 | 0.8%), Eastern Europe (46 | 0.6%), Europe (46 | 0.6%), and Romania (46 | 0.6%), together accounting for 3.2% of all Spring Hill residents.
| Immigration Origin | # Population | % Population |
| Africa | 4 | 0.1% |
| Asia | 23 | 0.3% |
| Brazil | 37 | 0.4% |
| Eastern Africa | 4 | 0.1% |
| Eastern Asia | 23 | 0.3% |
| Eastern Europe | 46 | 0.6% |
| Europe | 46 | 0.6% |
| Kenya | 4 | 0.1% |
| Korea | 23 | 0.3% |
| Latin America | 64 | 0.8% |
| Romania | 46 | 0.6% |
| South America | 64 | 0.8% |
| Venezuela | 27 | 0.3% | View All 13 Rows |
Sex and Age in Spring Hill
Sex and Age in Spring Hill
The most populous age groups in Spring Hill are 15 to 19 Years (475 | 10.9%) for men and Under 5 Years (367 | 9.4%) for women.
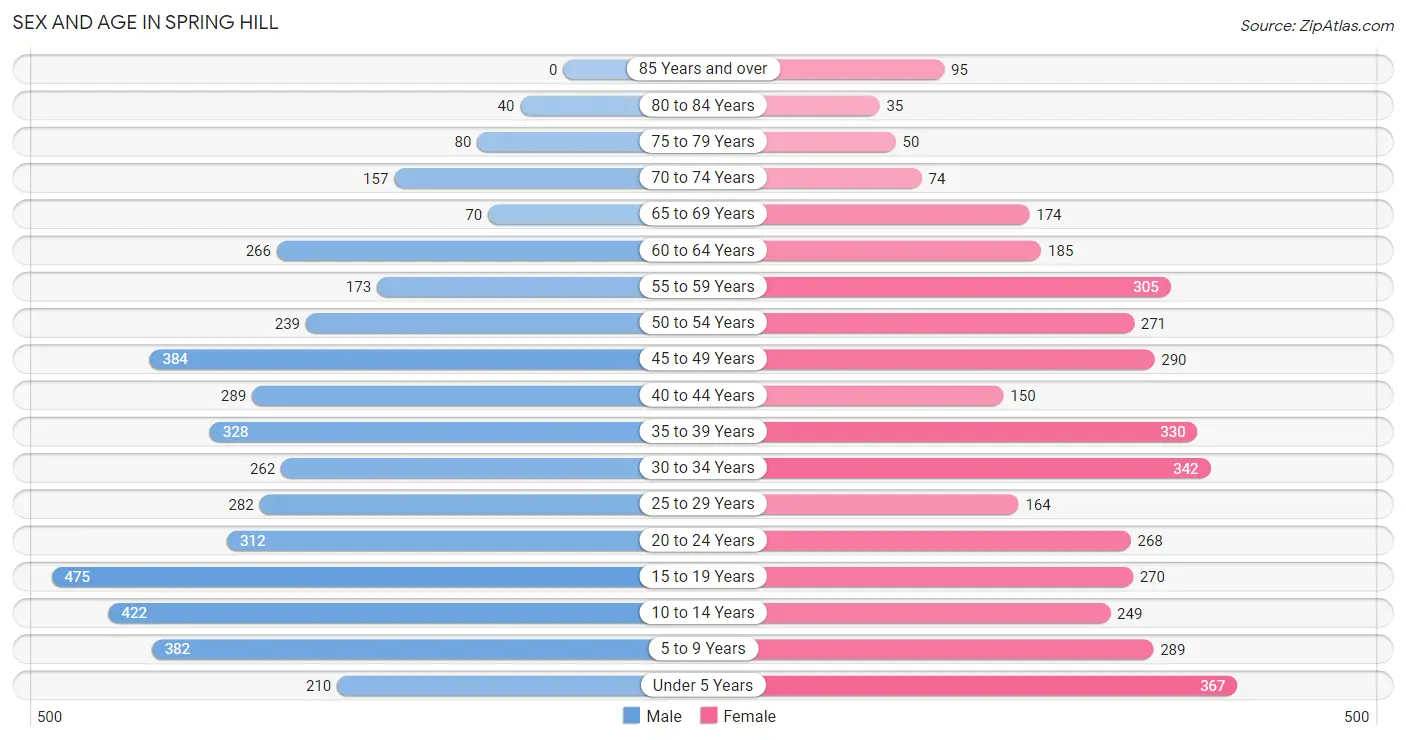
| Age Bracket | Male | Female |
| Under 5 Years | 210 (4.8%) | 367 (9.4%) |
| 5 to 9 Years | 382 (8.7%) | 289 (7.4%) |
| 10 to 14 Years | 422 (9.7%) | 249 (6.4%) |
| 15 to 19 Years | 475 (10.9%) | 270 (6.9%) |
| 20 to 24 Years | 312 (7.1%) | 268 (6.9%) |
| 25 to 29 Years | 282 (6.5%) | 164 (4.2%) |
| 30 to 34 Years | 262 (6.0%) | 342 (8.7%) |
| 35 to 39 Years | 328 (7.5%) | 330 (8.4%) |
| 40 to 44 Years | 289 (6.6%) | 150 (3.8%) |
| 45 to 49 Years | 384 (8.8%) | 290 (7.4%) |
| 50 to 54 Years | 239 (5.5%) | 271 (6.9%) |
| 55 to 59 Years | 173 (4.0%) | 305 (7.8%) |
| 60 to 64 Years | 266 (6.1%) | 185 (4.7%) |
| 65 to 69 Years | 70 (1.6%) | 174 (4.4%) |
| 70 to 74 Years | 157 (3.6%) | 74 (1.9%) |
| 75 to 79 Years | 80 (1.8%) | 50 (1.3%) |
| 80 to 84 Years | 40 (0.9%) | 35 (0.9%) |
| 85 Years and over | 0 (0.0%) | 95 (2.4%) |
| Total | 4,371 (100.0%) | 3,908 (100.0%) |
Families and Households in Spring Hill
Median Family Size in Spring Hill
The median family size in Spring Hill is 3.22 persons per family, with single male/father families (230 | 9.9%) accounting for the largest median family size of 3.96 persons per family. On the other hand, single female/mother families (373 | 16.1%) represent the smallest median family size with 2.56 persons per family.
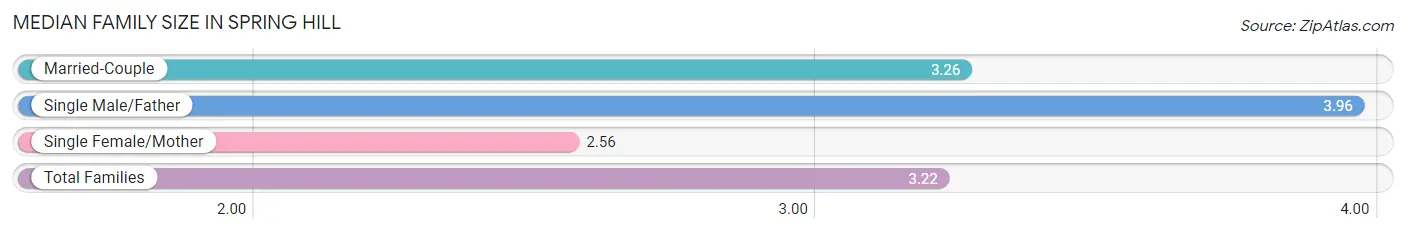
| Family Type | # Families | Family Size |
| Married-Couple | 1,713 (74.0%) | 3.26 |
| Single Male/Father | 230 (9.9%) | 3.96 |
| Single Female/Mother | 373 (16.1%) | 2.56 |
| Total Families | 2,316 (100.0%) | 3.22 |
Median Household Size in Spring Hill
The median household size in Spring Hill is 2.88 persons per household, with single male/father households (230 | 8.0%) accounting for the largest median household size of 4.26 persons per household. non-family households (543 | 19.0%) represent the smallest median household size with 1.17 persons per household.
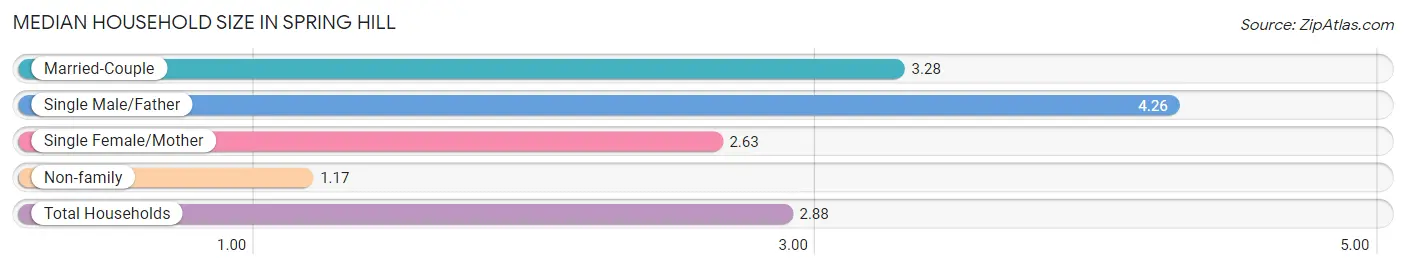
| Household Type | # Households | Household Size |
| Married-Couple | 1,713 (59.9%) | 3.28 |
| Single Male/Father | 230 (8.0%) | 4.26 |
| Single Female/Mother | 373 (13.1%) | 2.63 |
| Non-family | 543 (19.0%) | 1.17 |
| Total Households | 2,859 (100.0%) | 2.88 |
Household Size by Marriage Status in Spring Hill
Out of a total of 2,859 households in Spring Hill, 2,316 (81.0%) are family households, while 543 (19.0%) are nonfamily households. The most numerous type of family households are 2-person households, comprising 898, and the most common type of nonfamily households are 1-person households, comprising 453.
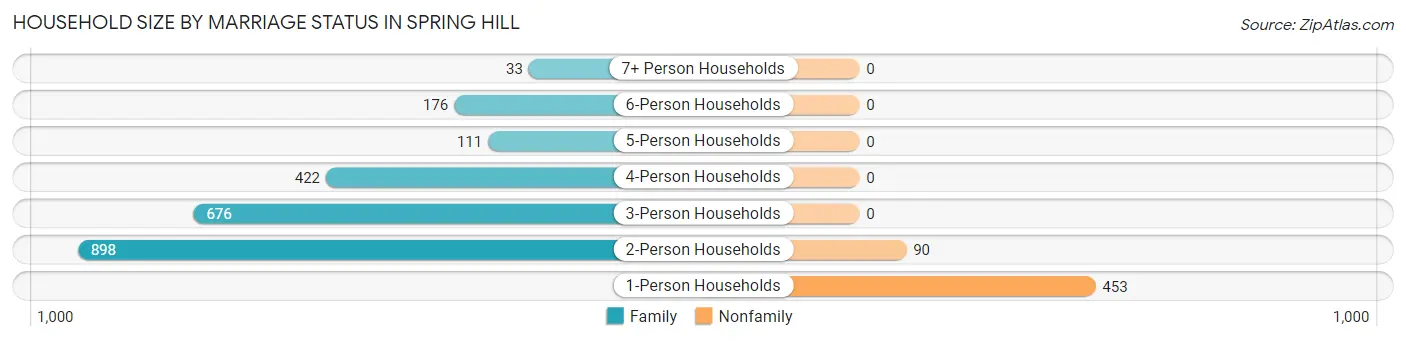
| Household Size | Family Households | Nonfamily Households |
| 1-Person Households | - | 453 (15.8%) |
| 2-Person Households | 898 (31.4%) | 90 (3.2%) |
| 3-Person Households | 676 (23.6%) | 0 (0.0%) |
| 4-Person Households | 422 (14.8%) | 0 (0.0%) |
| 5-Person Households | 111 (3.9%) | 0 (0.0%) |
| 6-Person Households | 176 (6.2%) | 0 (0.0%) |
| 7+ Person Households | 33 (1.1%) | 0 (0.0%) |
| Total | 2,316 (81.0%) | 543 (19.0%) |
Female Fertility in Spring Hill
Fertility by Age in Spring Hill
Average fertility rate in Spring Hill is 71.0 births per 1,000 women. Women in the age bracket of 20 to 34 years have the highest fertility rate with 140.0 births per 1,000 women. Women in the age bracket of 20 to 34 years acount for 81.2% of all women with births.
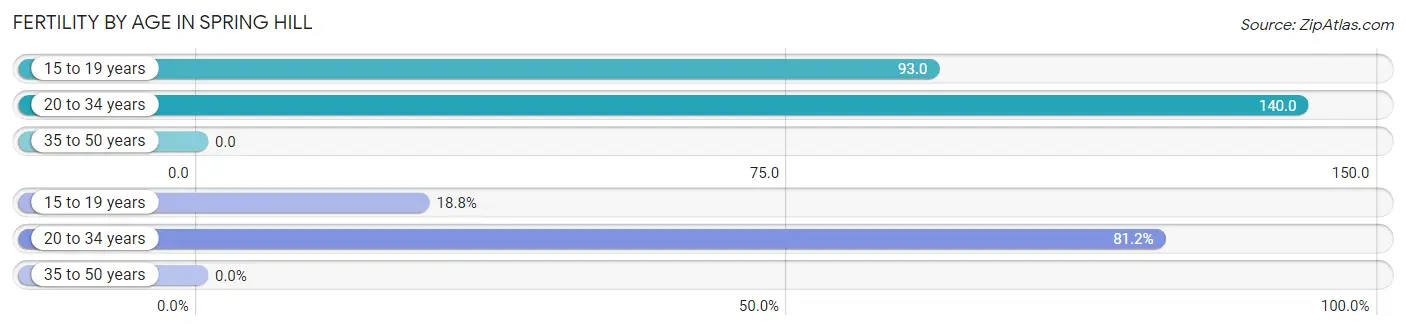
| Age Bracket | Women with Births | Births / 1,000 Women |
| 15 to 19 years | 25 (18.8%) | 93.0 |
| 20 to 34 years | 108 (81.2%) | 140.0 |
| 35 to 50 years | 0 (0.0%) | 0.0 |
| Total | 133 (100.0%) | 71.0 |
Fertility by Age by Marriage Status in Spring Hill
56.4% of women with births (133) in Spring Hill are married. The highest percentage of unmarried women with births falls into 15 to 19 years age bracket with 100.0% of them unmarried at the time of birth, while the lowest percentage of unmarried women with births belong to 20 to 34 years age bracket with 30.6% of them unmarried.
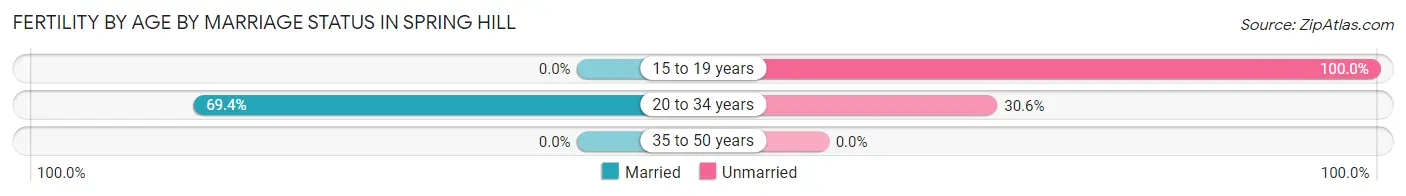
| Age Bracket | Married | Unmarried |
| 15 to 19 years | 0 (0.0%) | 25 (100.0%) |
| 20 to 34 years | 75 (69.4%) | 33 (30.6%) |
| 35 to 50 years | 0 (0.0%) | 0 (0.0%) |
| Total | 75 (56.4%) | 58 (43.6%) |
Fertility by Education in Spring Hill
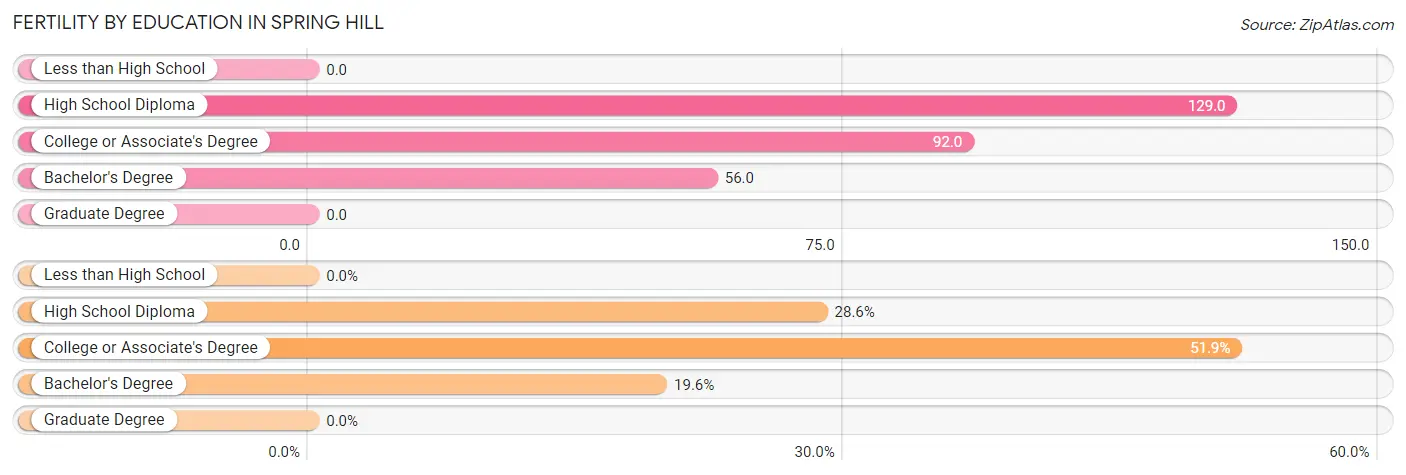
| Educational Attainment | Women with Births | Births / 1,000 Women |
| Less than High School | 0 (0.0%) | 0.0 |
| High School Diploma | 38 (28.6%) | 129.0 |
| College or Associate's Degree | 69 (51.9%) | 92.0 |
| Bachelor's Degree | 26 (19.6%) | 56.0 |
| Graduate Degree | 0 (0.0%) | 0.0 |
| Total | 133 (100.0%) | 71.0 |
Fertility by Education by Marriage Status in Spring Hill
43.6% of women with births in Spring Hill are unmarried. Women with the educational attainment of bachelor's degree are most likely to be married with 100.0% of them married at childbirth, while women with the educational attainment of high school diploma are least likely to be married with 100.0% of them unmarried at childbirth.
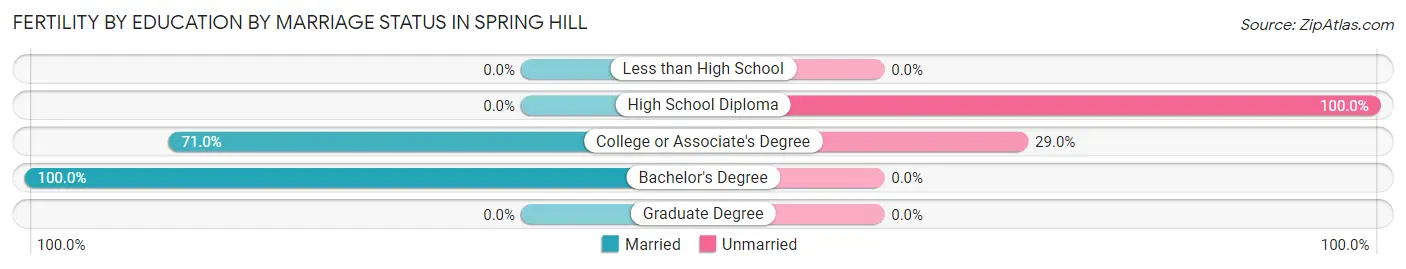
| Educational Attainment | Married | Unmarried |
| Less than High School | 0 (0.0%) | 0 (0.0%) |
| High School Diploma | 0 (0.0%) | 38 (100.0%) |
| College or Associate's Degree | 49 (71.0%) | 20 (29.0%) |
| Bachelor's Degree | 26 (100.0%) | 0 (0.0%) |
| Graduate Degree | 0 (0.0%) | 0 (0.0%) |
| Total | 75 (56.4%) | 58 (43.6%) |
Employment Characteristics in Spring Hill
Employment by Class of Employer in Spring Hill
Among the 4,452 employed individuals in Spring Hill, private company employees (3,166 | 71.1%), local government employees (441 | 9.9%), and not-for-profit organizations (372 | 8.4%) make up the most common classes of employment.
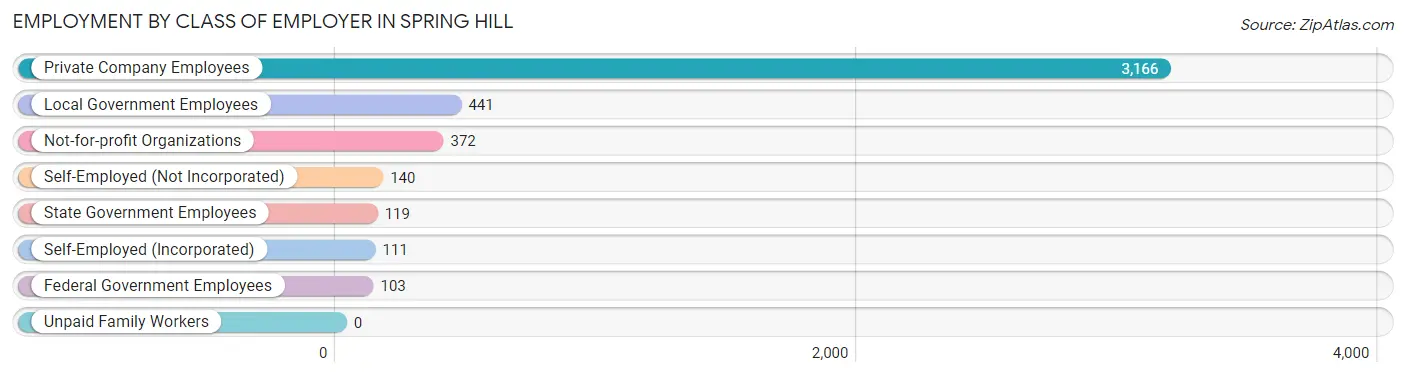
| Employer Class | # Employees | % Employees |
| Private Company Employees | 3,166 | 71.1% |
| Self-Employed (Incorporated) | 111 | 2.5% |
| Self-Employed (Not Incorporated) | 140 | 3.1% |
| Not-for-profit Organizations | 372 | 8.4% |
| Local Government Employees | 441 | 9.9% |
| State Government Employees | 119 | 2.7% |
| Federal Government Employees | 103 | 2.3% |
| Unpaid Family Workers | 0 | 0.0% |
| Total | 4,452 | 100.0% |
Employment Status by Age in Spring Hill
According to the labor force statistics for Spring Hill, out of the total population over 16 years of age (6,103), 75.6% or 4,614 individuals are in the labor force, with 2.3% or 106 of them unemployed. The age group with the highest labor force participation rate is 45 to 54 years, with 94.2% or 1,115 individuals in the labor force. Within the labor force, the 20 to 24 years age range has the highest percentage of unemployed individuals, with 6.9% or 37 of them being unemployed.
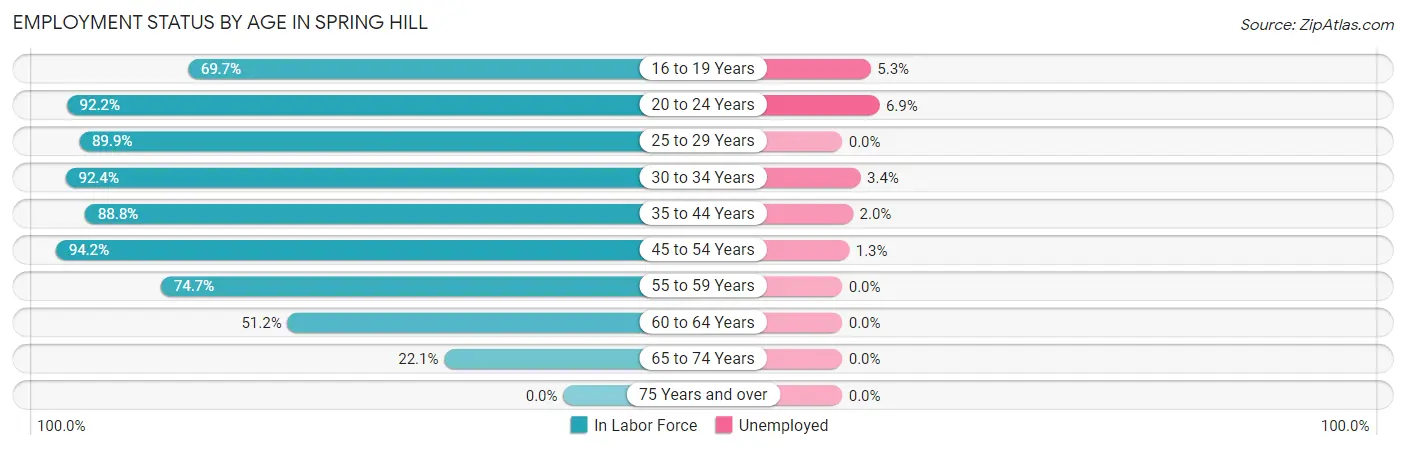
| Age Bracket | In Labor Force | Unemployed |
| 16 to 19 Years | 340 (69.7%) | 18 (5.3%) |
| 20 to 24 Years | 535 (92.2%) | 37 (6.9%) |
| 25 to 29 Years | 401 (89.9%) | 0 (0.0%) |
| 30 to 34 Years | 558 (92.4%) | 19 (3.4%) |
| 35 to 44 Years | 974 (88.8%) | 19 (2.0%) |
| 45 to 54 Years | 1,115 (94.2%) | 14 (1.3%) |
| 55 to 59 Years | 357 (74.7%) | 0 (0.0%) |
| 60 to 64 Years | 231 (51.2%) | 0 (0.0%) |
| 65 to 74 Years | 105 (22.1%) | 0 (0.0%) |
| 75 Years and over | 0 (0.0%) | 0 (0.0%) |
| Total | 4,614 (75.6%) | 106 (2.3%) |
Employment Status by Educational Attainment in Spring Hill
According to labor force statistics for Spring Hill, 85.4% of individuals (3,638) out of the total population between 25 and 64 years of age (4,260) are in the labor force, with 1.4% or 51 of them being unemployed. The group with the highest labor force participation rate are those with the educational attainment of bachelor's degree or higher, with 91.8% or 1,638 individuals in the labor force. Within the labor force, individuals with college / associate degree education have the highest percentage of unemployment, with 3.6% or 53 of them being unemployed.
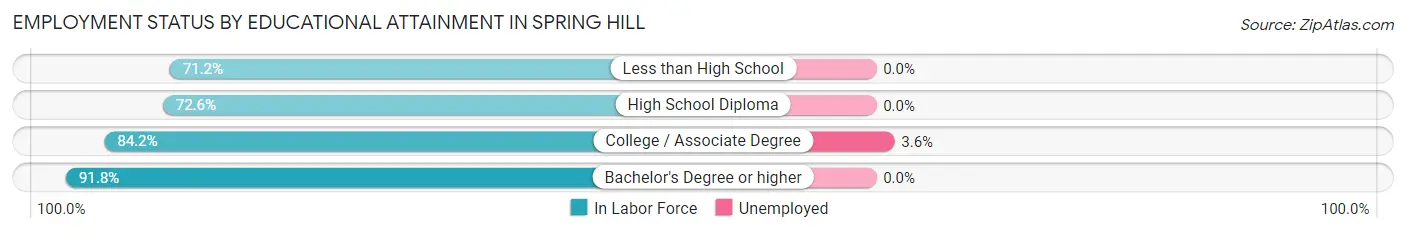
| Educational Attainment | In Labor Force | Unemployed |
| Less than High School | 52 (71.2%) | 0 (0.0%) |
| High School Diploma | 482 (72.6%) | 0 (0.0%) |
| College / Associate Degree | 1,464 (84.2%) | 63 (3.6%) |
| Bachelor's Degree or higher | 1,638 (91.8%) | 0 (0.0%) |
| Total | 3,638 (85.4%) | 60 (1.4%) |
Employment Occupations by Sex in Spring Hill
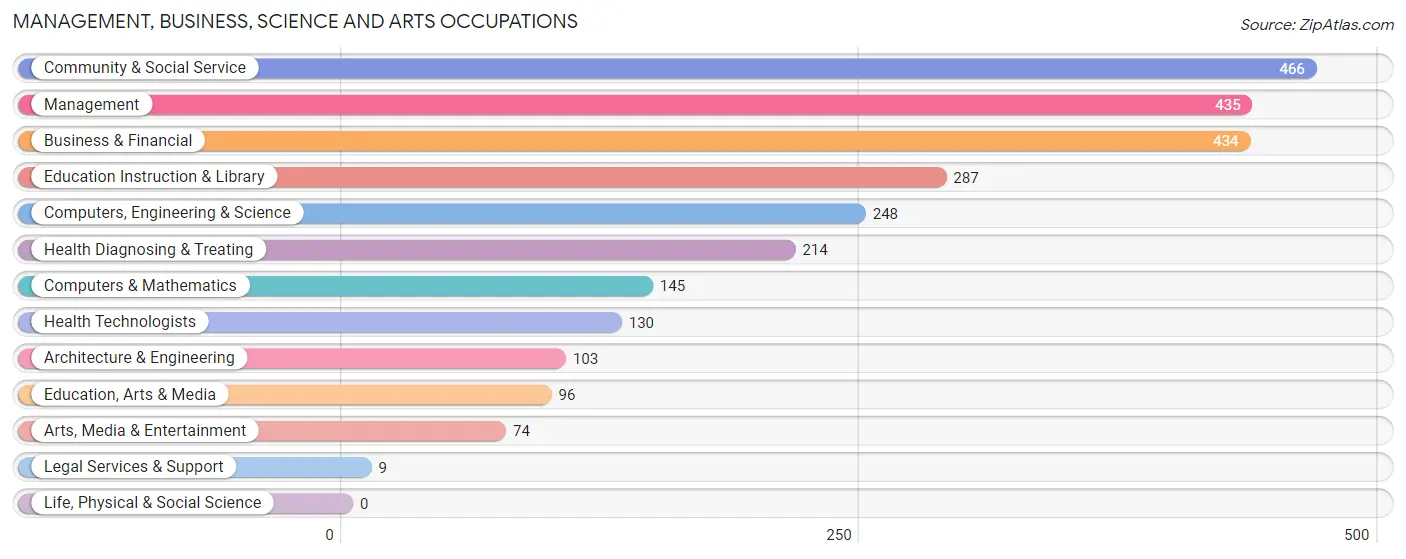
Management, Business, Science and Arts Occupations
The most common Management, Business, Science and Arts occupations in Spring Hill are Community & Social Service (466 | 10.3%), Management (435 | 9.7%), Business & Financial (434 | 9.6%), Education Instruction & Library (287 | 6.4%), and Computers, Engineering & Science (248 | 5.5%).
Management, Business, Science and Arts Occupations by Sex
Within the Management, Business, Science and Arts occupations in Spring Hill, the most male-oriented occupations are Architecture & Engineering (100.0%), Legal Services & Support (100.0%), and Computers, Engineering & Science (94.4%), while the most female-oriented occupations are Health Technologists (100.0%), Health Diagnosing & Treating (93.9%), and Education Instruction & Library (75.6%).
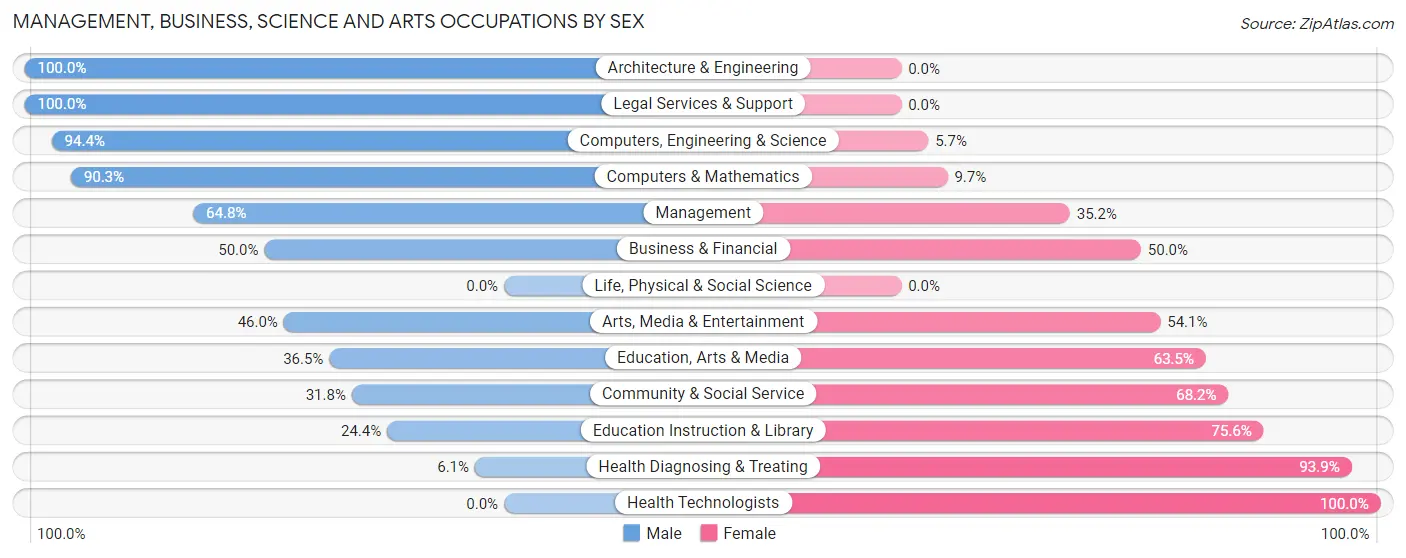
| Occupation | Male | Female |
| Management | 282 (64.8%) | 153 (35.2%) |
| Business & Financial | 217 (50.0%) | 217 (50.0%) |
| Computers, Engineering & Science | 234 (94.4%) | 14 (5.7%) |
| Computers & Mathematics | 131 (90.3%) | 14 (9.7%) |
| Architecture & Engineering | 103 (100.0%) | 0 (0.0%) |
| Life, Physical & Social Science | 0 (0.0%) | 0 (0.0%) |
| Community & Social Service | 148 (31.8%) | 318 (68.2%) |
| Education, Arts & Media | 35 (36.5%) | 61 (63.5%) |
| Legal Services & Support | 9 (100.0%) | 0 (0.0%) |
| Education Instruction & Library | 70 (24.4%) | 217 (75.6%) |
| Arts, Media & Entertainment | 34 (46.0%) | 40 (54.0%) |
| Health Diagnosing & Treating | 13 (6.1%) | 201 (93.9%) |
| Health Technologists | 0 (0.0%) | 130 (100.0%) |
| Total (Category) | 894 (49.7%) | 903 (50.2%) |
| Total (Overall) | 2,439 (54.1%) | 2,070 (45.9%) |
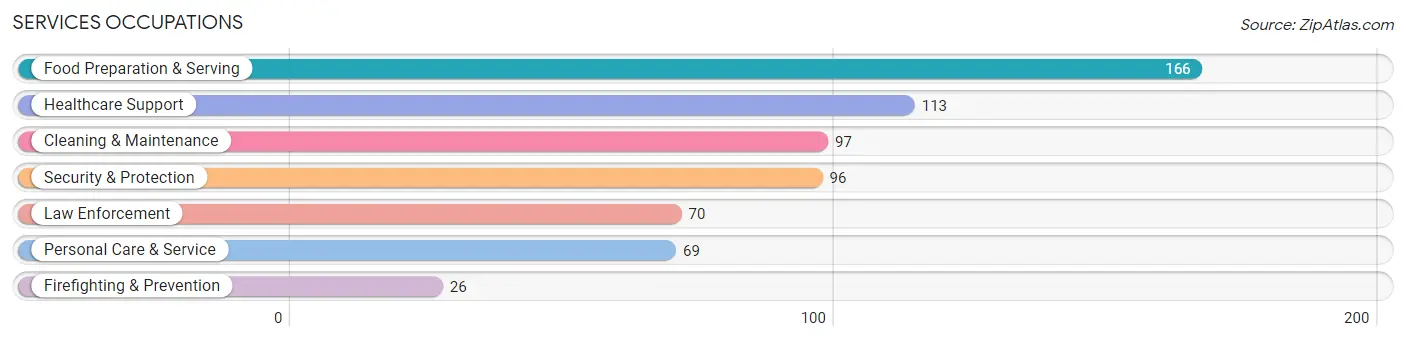
Services Occupations
The most common Services occupations in Spring Hill are Food Preparation & Serving (166 | 3.7%), Healthcare Support (113 | 2.5%), Cleaning & Maintenance (97 | 2.1%), Security & Protection (96 | 2.1%), and Law Enforcement (70 | 1.5%).
Services Occupations by Sex
Within the Services occupations in Spring Hill, the most male-oriented occupations are Firefighting & Prevention (100.0%), Cleaning & Maintenance (100.0%), and Security & Protection (87.5%), while the most female-oriented occupations are Healthcare Support (100.0%), Food Preparation & Serving (85.5%), and Personal Care & Service (62.3%).
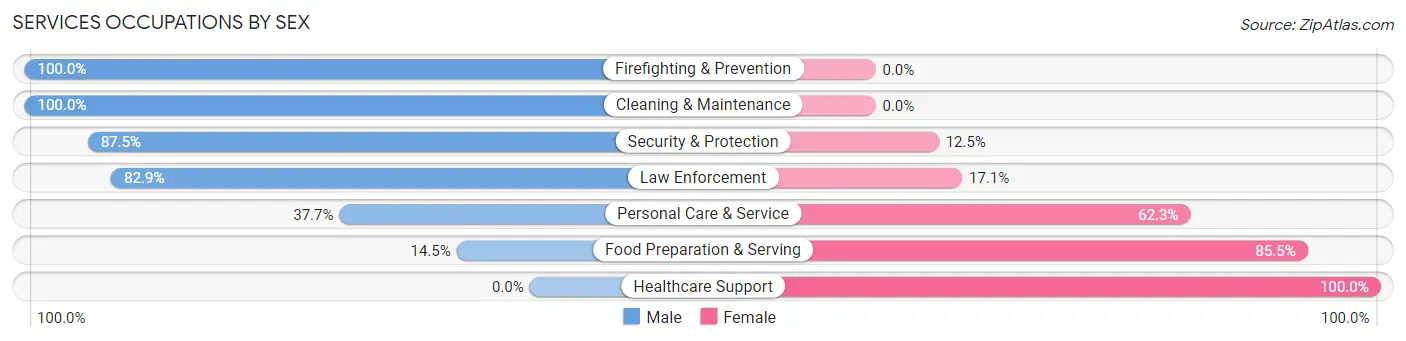
| Occupation | Male | Female |
| Healthcare Support | 0 (0.0%) | 113 (100.0%) |
| Security & Protection | 84 (87.5%) | 12 (12.5%) |
| Firefighting & Prevention | 26 (100.0%) | 0 (0.0%) |
| Law Enforcement | 58 (82.9%) | 12 (17.1%) |
| Food Preparation & Serving | 24 (14.5%) | 142 (85.5%) |
| Cleaning & Maintenance | 97 (100.0%) | 0 (0.0%) |
| Personal Care & Service | 26 (37.7%) | 43 (62.3%) |
| Total (Category) | 231 (42.7%) | 310 (57.3%) |
| Total (Overall) | 2,439 (54.1%) | 2,070 (45.9%) |
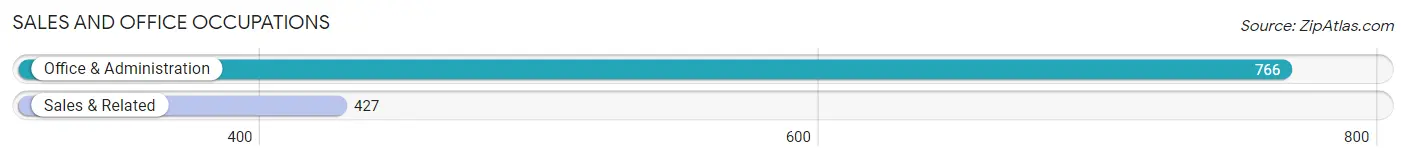
Sales and Office Occupations
The most common Sales and Office occupations in Spring Hill are Office & Administration (766 | 17.0%), and Sales & Related (427 | 9.5%).
Sales and Office Occupations by Sex
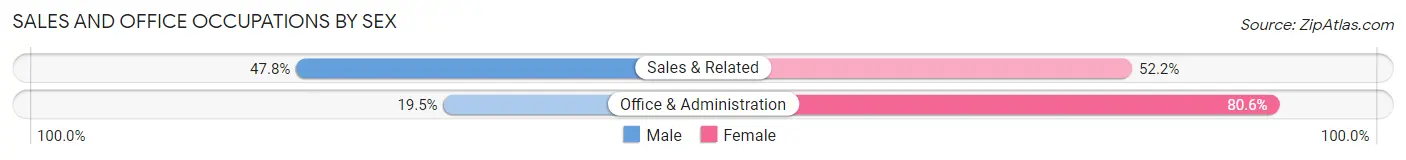
| Occupation | Male | Female |
| Sales & Related | 204 (47.8%) | 223 (52.2%) |
| Office & Administration | 149 (19.5%) | 617 (80.5%) |
| Total (Category) | 353 (29.6%) | 840 (70.4%) |
| Total (Overall) | 2,439 (54.1%) | 2,070 (45.9%) |
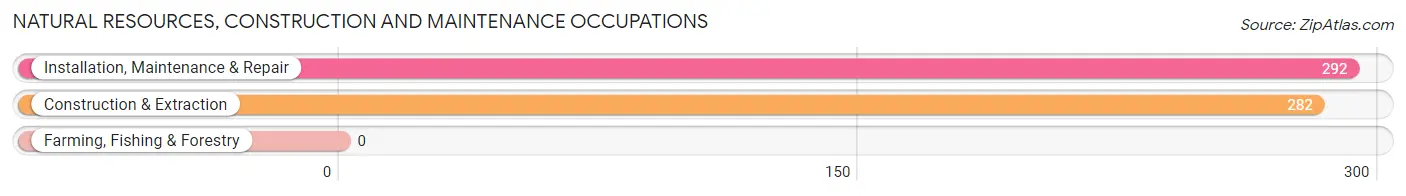
Natural Resources, Construction and Maintenance Occupations
The most common Natural Resources, Construction and Maintenance occupations in Spring Hill are Installation, Maintenance & Repair (292 | 6.5%), and Construction & Extraction (282 | 6.2%).
Natural Resources, Construction and Maintenance Occupations by Sex
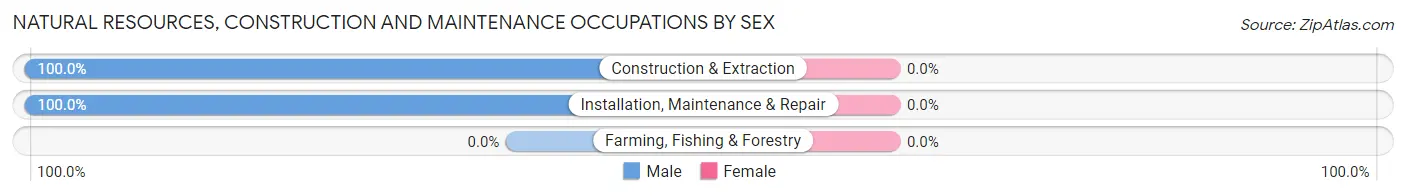
| Occupation | Male | Female |
| Farming, Fishing & Forestry | 0 (0.0%) | 0 (0.0%) |
| Construction & Extraction | 282 (100.0%) | 0 (0.0%) |
| Installation, Maintenance & Repair | 292 (100.0%) | 0 (0.0%) |
| Total (Category) | 574 (100.0%) | 0 (0.0%) |
| Total (Overall) | 2,439 (54.1%) | 2,070 (45.9%) |
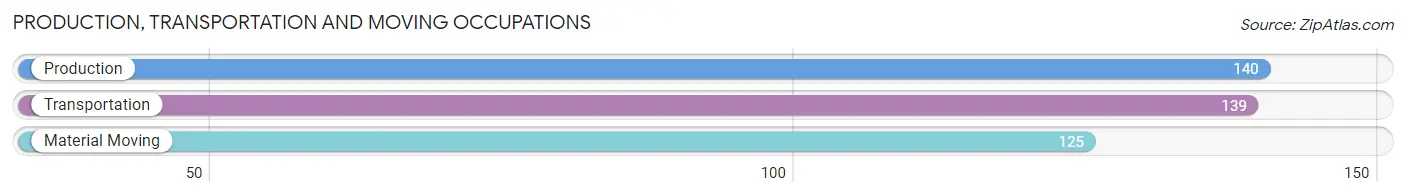
Production, Transportation and Moving Occupations
The most common Production, Transportation and Moving occupations in Spring Hill are Production (140 | 3.1%), Transportation (139 | 3.1%), and Material Moving (125 | 2.8%).
Production, Transportation and Moving Occupations by Sex
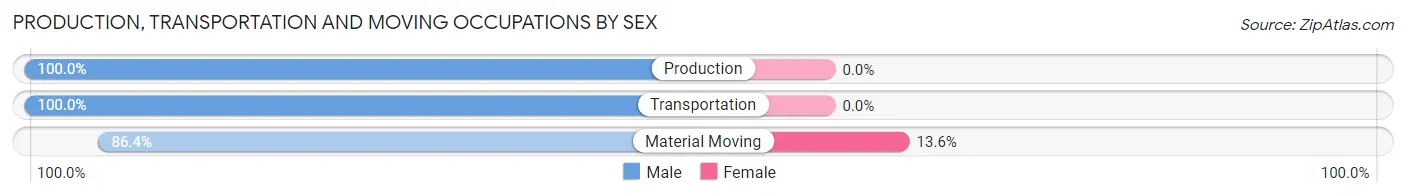
| Occupation | Male | Female |
| Production | 140 (100.0%) | 0 (0.0%) |
| Transportation | 139 (100.0%) | 0 (0.0%) |
| Material Moving | 108 (86.4%) | 17 (13.6%) |
| Total (Category) | 387 (95.8%) | 17 (4.2%) |
| Total (Overall) | 2,439 (54.1%) | 2,070 (45.9%) |
Employment Industries by Sex in Spring Hill
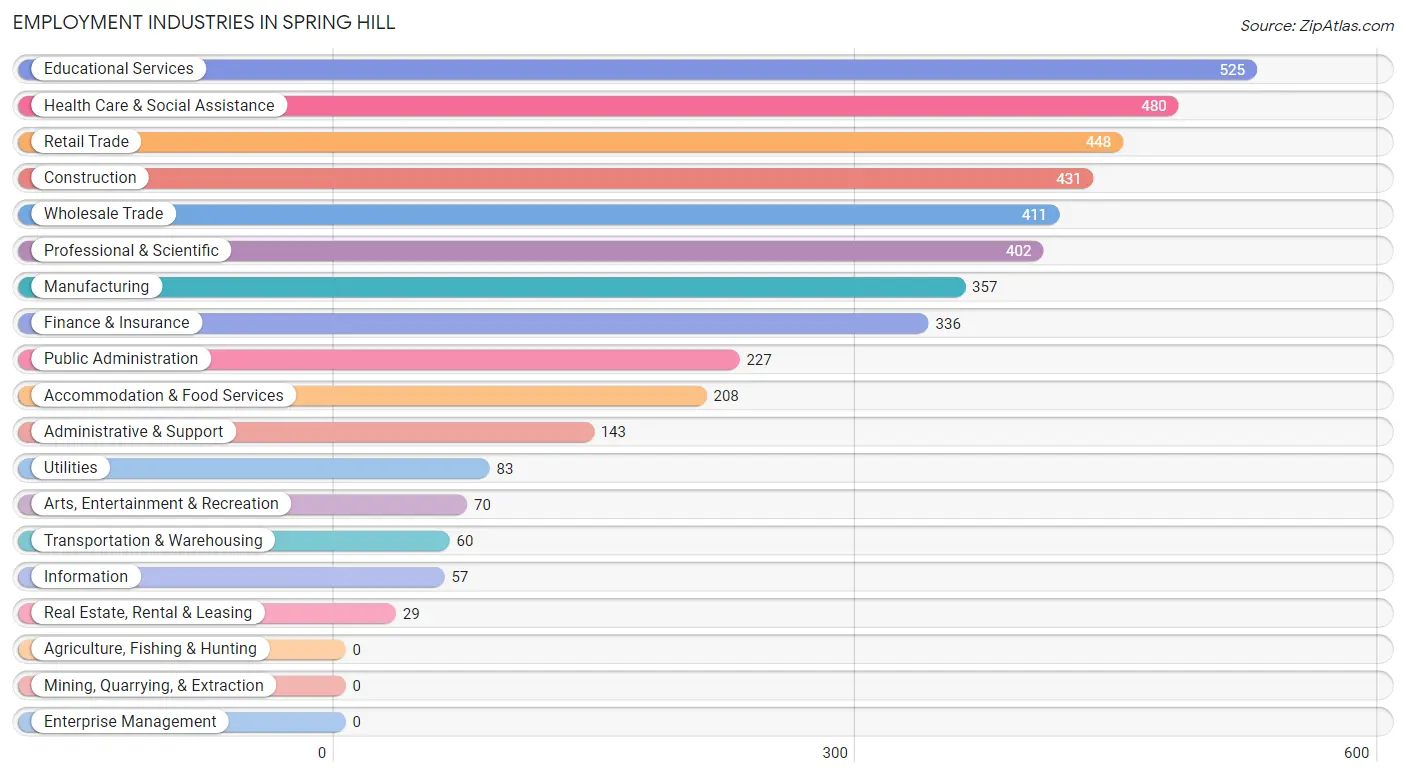
Employment Industries in Spring Hill
The major employment industries in Spring Hill include Educational Services (525 | 11.6%), Health Care & Social Assistance (480 | 10.6%), Retail Trade (448 | 9.9%), Construction (431 | 9.6%), and Wholesale Trade (411 | 9.1%).
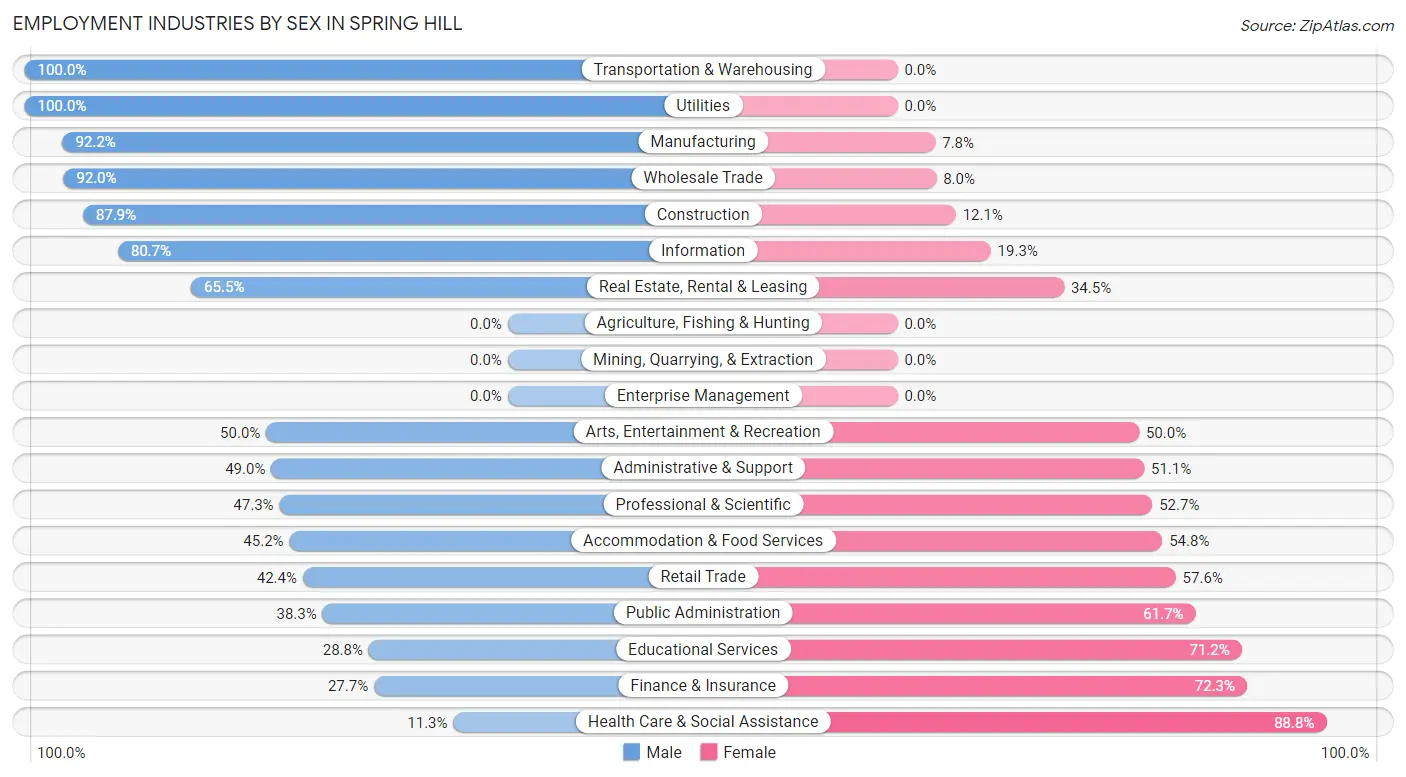
Employment Industries by Sex in Spring Hill
The Spring Hill industries that see more men than women are Transportation & Warehousing (100.0%), Utilities (100.0%), and Manufacturing (92.2%), whereas the industries that tend to have a higher number of women are Health Care & Social Assistance (88.7%), Finance & Insurance (72.3%), and Educational Services (71.2%).
| Industry | Male | Female |
| Agriculture, Fishing & Hunting | 0 (0.0%) | 0 (0.0%) |
| Mining, Quarrying, & Extraction | 0 (0.0%) | 0 (0.0%) |
| Construction | 379 (87.9%) | 52 (12.1%) |
| Manufacturing | 329 (92.2%) | 28 (7.8%) |
| Wholesale Trade | 378 (92.0%) | 33 (8.0%) |
| Retail Trade | 190 (42.4%) | 258 (57.6%) |
| Transportation & Warehousing | 60 (100.0%) | 0 (0.0%) |
| Utilities | 83 (100.0%) | 0 (0.0%) |
| Information | 46 (80.7%) | 11 (19.3%) |
| Finance & Insurance | 93 (27.7%) | 243 (72.3%) |
| Real Estate, Rental & Leasing | 19 (65.5%) | 10 (34.5%) |
| Professional & Scientific | 190 (47.3%) | 212 (52.7%) |
| Enterprise Management | 0 (0.0%) | 0 (0.0%) |
| Administrative & Support | 70 (48.9%) | 73 (51.0%) |
| Educational Services | 151 (28.8%) | 374 (71.2%) |
| Health Care & Social Assistance | 54 (11.3%) | 426 (88.7%) |
| Arts, Entertainment & Recreation | 35 (50.0%) | 35 (50.0%) |
| Accommodation & Food Services | 94 (45.2%) | 114 (54.8%) |
| Public Administration | 87 (38.3%) | 140 (61.7%) |
| Total | 2,439 (54.1%) | 2,070 (45.9%) |
Education in Spring Hill
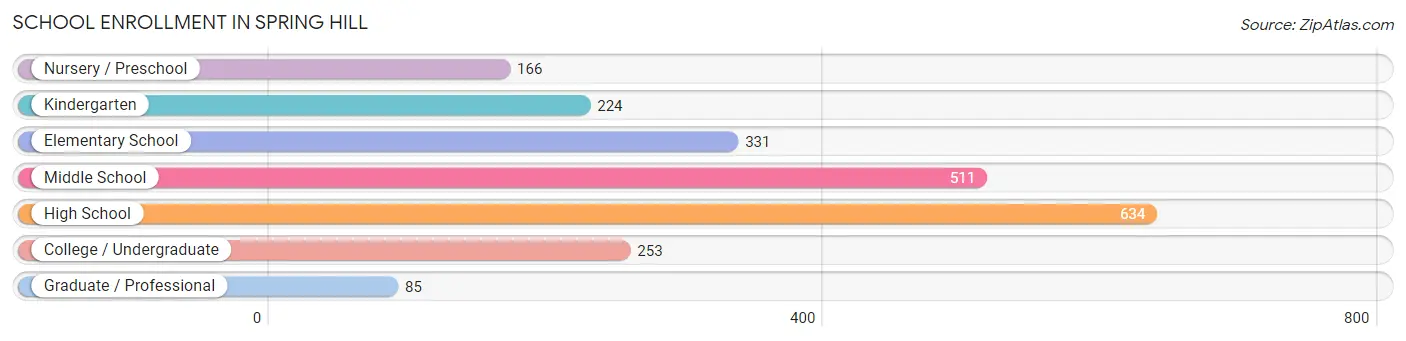
School Enrollment in Spring Hill
The most common levels of schooling among the 2,204 students in Spring Hill are high school (634 | 28.8%), middle school (511 | 23.2%), and elementary school (331 | 15.0%).
| School Level | # Students | % Students |
| Nursery / Preschool | 166 | 7.5% |
| Kindergarten | 224 | 10.2% |
| Elementary School | 331 | 15.0% |
| Middle School | 511 | 23.2% |
| High School | 634 | 28.8% |
| College / Undergraduate | 253 | 11.5% |
| Graduate / Professional | 85 | 3.9% |
| Total | 2,204 | 100.0% |
School Enrollment by Age by Funding Source in Spring Hill
Out of a total of 2,204 students who are enrolled in schools in Spring Hill, 190 (8.6%) attend a private institution, while the remaining 2,014 (91.4%) are enrolled in public schools. The age group of 35 years and over has the highest likelihood of being enrolled in private schools, with 62 (58.5% in the age bracket) enrolled. Conversely, the age group of 5 to 9 year old has the lowest likelihood of being enrolled in a private school, with 636 (100.0% in the age bracket) attending a public institution.
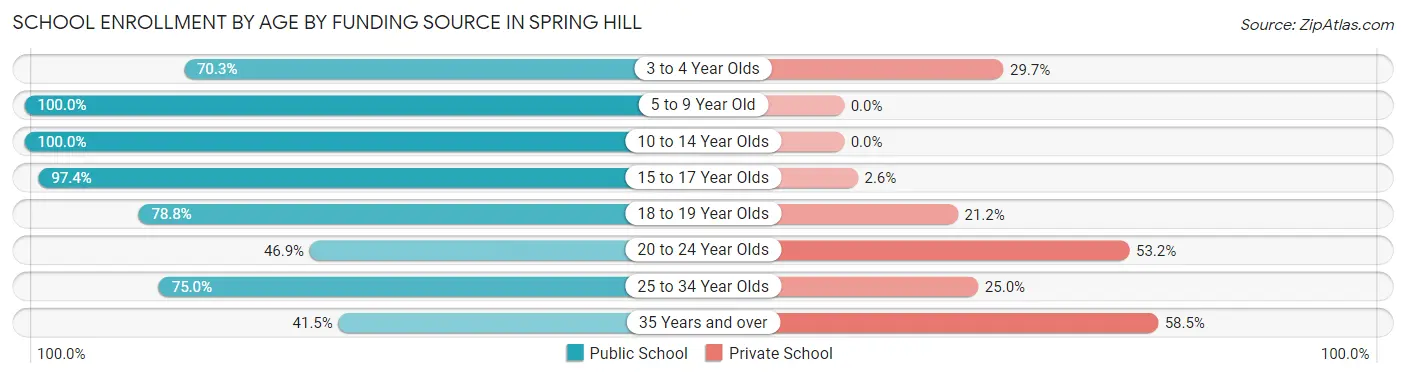
| Age Bracket | Public School | Private School |
| 3 to 4 Year Olds | 45 (70.3%) | 19 (29.7%) |
| 5 to 9 Year Old | 636 (100.0%) | 0 (0.0%) |
| 10 to 14 Year Olds | 649 (100.0%) | 0 (0.0%) |
| 15 to 17 Year Olds | 454 (97.4%) | 12 (2.6%) |
| 18 to 19 Year Olds | 104 (78.8%) | 28 (21.2%) |
| 20 to 24 Year Olds | 52 (46.9%) | 59 (53.1%) |
| 25 to 34 Year Olds | 30 (75.0%) | 10 (25.0%) |
| 35 Years and over | 44 (41.5%) | 62 (58.5%) |
| Total | 2,014 (91.4%) | 190 (8.6%) |
Educational Attainment by Field of Study in Spring Hill
Business (747 | 32.8%), education (272 | 11.9%), science & technology (183 | 8.0%), arts & humanities (161 | 7.1%), and communications (151 | 6.6%) are the most common fields of study among 2,278 individuals in Spring Hill who have obtained a bachelor's degree or higher.
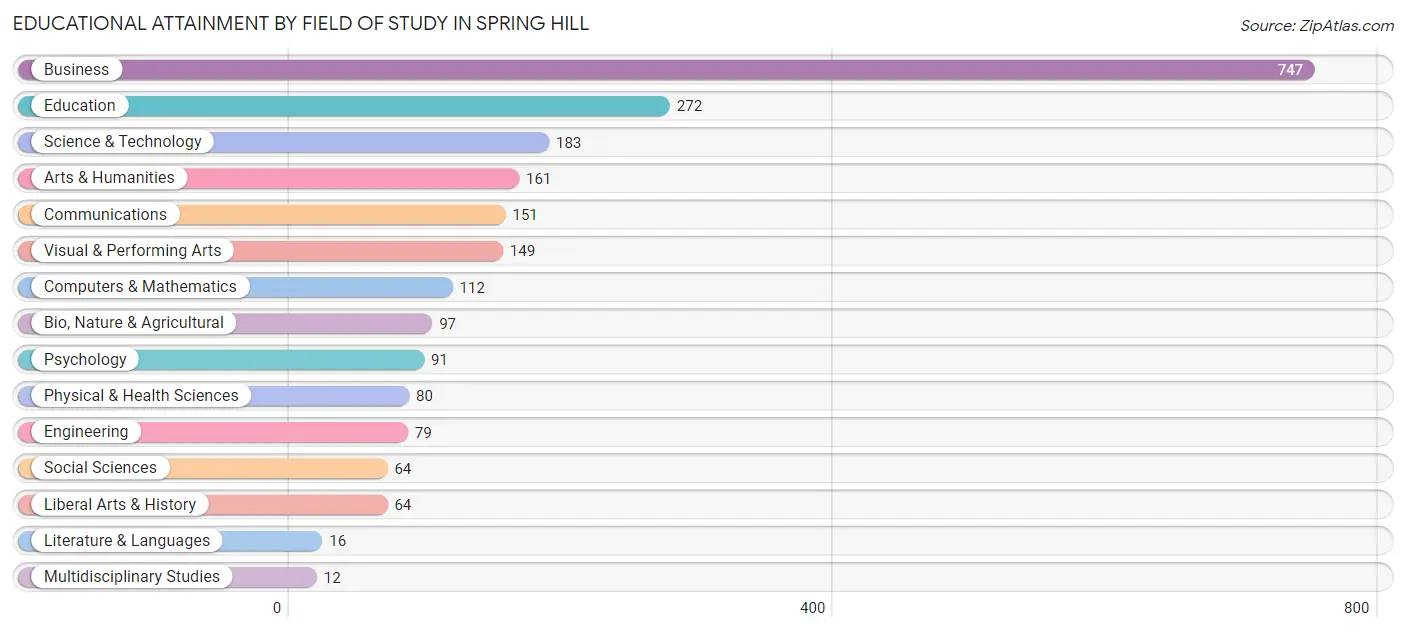
| Field of Study | # Graduates | % Graduates |
| Computers & Mathematics | 112 | 4.9% |
| Bio, Nature & Agricultural | 97 | 4.3% |
| Physical & Health Sciences | 80 | 3.5% |
| Psychology | 91 | 4.0% |
| Social Sciences | 64 | 2.8% |
| Engineering | 79 | 3.5% |
| Multidisciplinary Studies | 12 | 0.5% |
| Science & Technology | 183 | 8.0% |
| Business | 747 | 32.8% |
| Education | 272 | 11.9% |
| Literature & Languages | 16 | 0.7% |
| Liberal Arts & History | 64 | 2.8% |
| Visual & Performing Arts | 149 | 6.5% |
| Communications | 151 | 6.6% |
| Arts & Humanities | 161 | 7.1% |
| Total | 2,278 | 100.0% |
Transportation & Commute in Spring Hill
Vehicle Availability by Sex in Spring Hill
The most prevalent vehicle ownership categories in Spring Hill are males with 2 vehicles (982, accounting for 40.3%) and females with 2 vehicles (865, making up 48.8%).
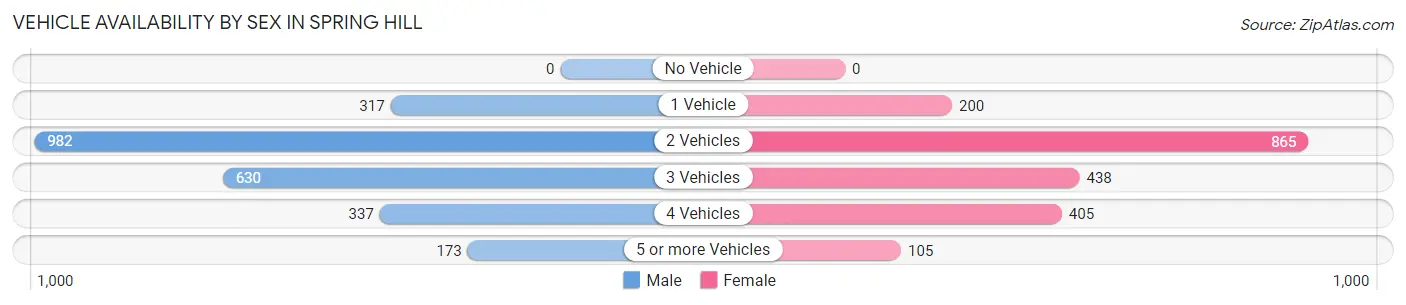
| Vehicles Available | Male | Female |
| No Vehicle | 0 (0.0%) | 0 (0.0%) |
| 1 Vehicle | 317 (13.0%) | 200 (9.9%) |
| 2 Vehicles | 982 (40.3%) | 865 (43.0%) |
| 3 Vehicles | 630 (25.8%) | 438 (21.8%) |
| 4 Vehicles | 337 (13.8%) | 405 (20.1%) |
| 5 or more Vehicles | 173 (7.1%) | 105 (5.2%) |
| Total | 2,439 (100.0%) | 2,013 (100.0%) |
Commute Time in Spring Hill
The most frequently occuring commute durations in Spring Hill are 30 to 34 minutes (672 commuters, 16.8%), 20 to 24 minutes (571 commuters, 14.3%), and 15 to 19 minutes (434 commuters, 10.9%).
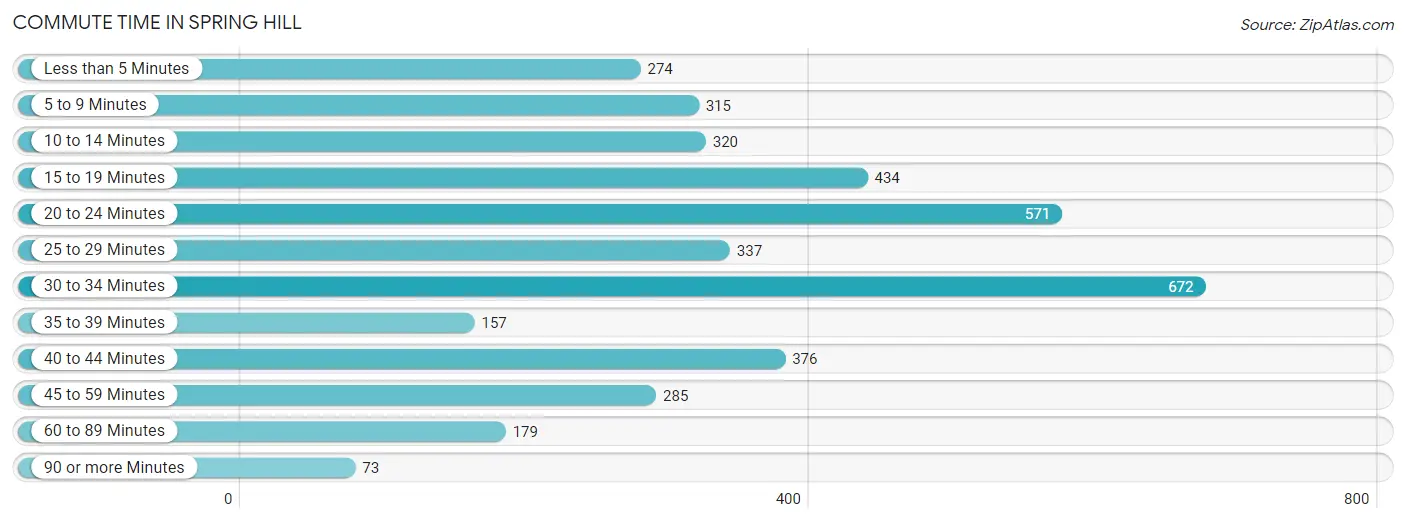
| Commute Time | # Commuters | % Commuters |
| Less than 5 Minutes | 274 | 6.9% |
| 5 to 9 Minutes | 315 | 7.9% |
| 10 to 14 Minutes | 320 | 8.0% |
| 15 to 19 Minutes | 434 | 10.9% |
| 20 to 24 Minutes | 571 | 14.3% |
| 25 to 29 Minutes | 337 | 8.4% |
| 30 to 34 Minutes | 672 | 16.8% |
| 35 to 39 Minutes | 157 | 3.9% |
| 40 to 44 Minutes | 376 | 9.4% |
| 45 to 59 Minutes | 285 | 7.1% |
| 60 to 89 Minutes | 179 | 4.5% |
| 90 or more Minutes | 73 | 1.8% |
Commute Time by Sex in Spring Hill
The most common commute times in Spring Hill are 30 to 34 minutes (317 commuters, 14.3%) for males and 30 to 34 minutes (355 commuters, 19.9%) for females.
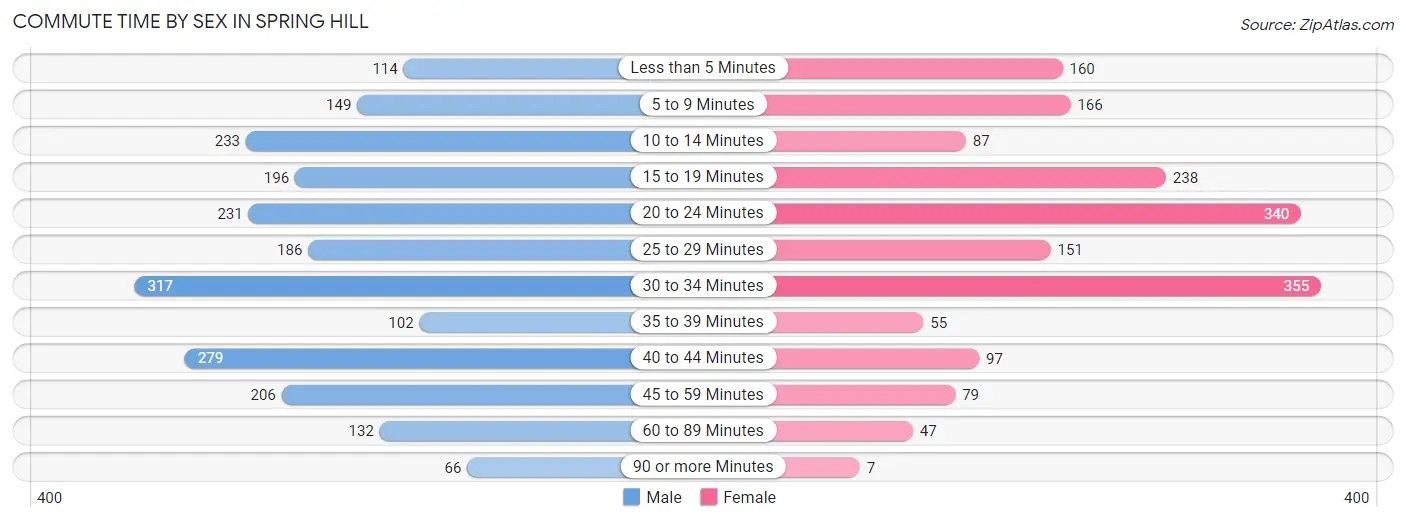
| Commute Time | Male | Female |
| Less than 5 Minutes | 114 (5.2%) | 160 (9.0%) |
| 5 to 9 Minutes | 149 (6.7%) | 166 (9.3%) |
| 10 to 14 Minutes | 233 (10.5%) | 87 (4.9%) |
| 15 to 19 Minutes | 196 (8.9%) | 238 (13.4%) |
| 20 to 24 Minutes | 231 (10.4%) | 340 (19.1%) |
| 25 to 29 Minutes | 186 (8.4%) | 151 (8.5%) |
| 30 to 34 Minutes | 317 (14.3%) | 355 (19.9%) |
| 35 to 39 Minutes | 102 (4.6%) | 55 (3.1%) |
| 40 to 44 Minutes | 279 (12.6%) | 97 (5.4%) |
| 45 to 59 Minutes | 206 (9.3%) | 79 (4.4%) |
| 60 to 89 Minutes | 132 (6.0%) | 47 (2.6%) |
| 90 or more Minutes | 66 (3.0%) | 7 (0.4%) |
Time of Departure to Work by Sex in Spring Hill
The most frequent times of departure to work in Spring Hill are 6:00 AM to 6:29 AM (571, 25.8%) for males and 7:30 AM to 7:59 AM (504, 28.3%) for females.
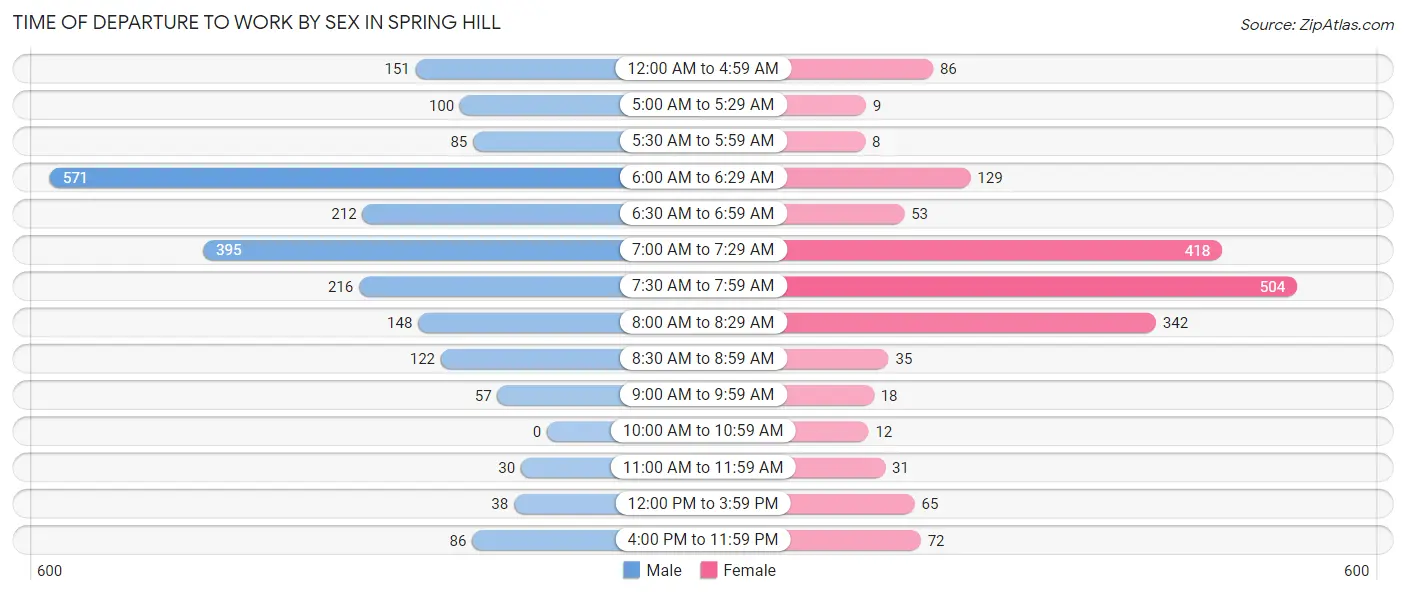
| Time of Departure | Male | Female |
| 12:00 AM to 4:59 AM | 151 (6.8%) | 86 (4.8%) |
| 5:00 AM to 5:29 AM | 100 (4.5%) | 9 (0.5%) |
| 5:30 AM to 5:59 AM | 85 (3.8%) | 8 (0.4%) |
| 6:00 AM to 6:29 AM | 571 (25.8%) | 129 (7.2%) |
| 6:30 AM to 6:59 AM | 212 (9.6%) | 53 (3.0%) |
| 7:00 AM to 7:29 AM | 395 (17.9%) | 418 (23.5%) |
| 7:30 AM to 7:59 AM | 216 (9.8%) | 504 (28.3%) |
| 8:00 AM to 8:29 AM | 148 (6.7%) | 342 (19.2%) |
| 8:30 AM to 8:59 AM | 122 (5.5%) | 35 (2.0%) |
| 9:00 AM to 9:59 AM | 57 (2.6%) | 18 (1.0%) |
| 10:00 AM to 10:59 AM | 0 (0.0%) | 12 (0.7%) |
| 11:00 AM to 11:59 AM | 30 (1.4%) | 31 (1.7%) |
| 12:00 PM to 3:59 PM | 38 (1.7%) | 65 (3.6%) |
| 4:00 PM to 11:59 PM | 86 (3.9%) | 72 (4.0%) |
| Total | 2,211 (100.0%) | 1,782 (100.0%) |
Housing Occupancy in Spring Hill
Occupancy by Ownership in Spring Hill
Of the total 2,859 dwellings in Spring Hill, owner-occupied units account for 2,248 (78.6%), while renter-occupied units make up 611 (21.4%).
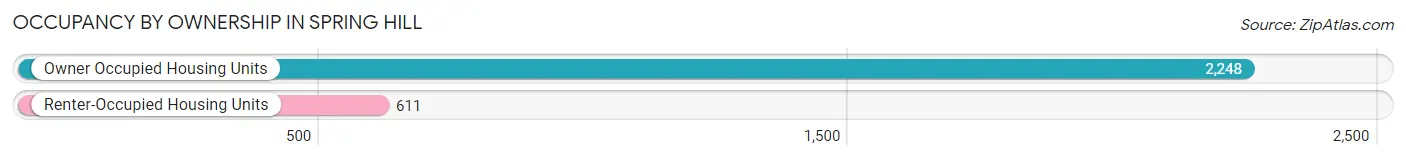
| Occupancy | # Housing Units | % Housing Units |
| Owner Occupied Housing Units | 2,248 | 78.6% |
| Renter-Occupied Housing Units | 611 | 21.4% |
| Total Occupied Housing Units | 2,859 | 100.0% |
Occupancy by Household Size in Spring Hill
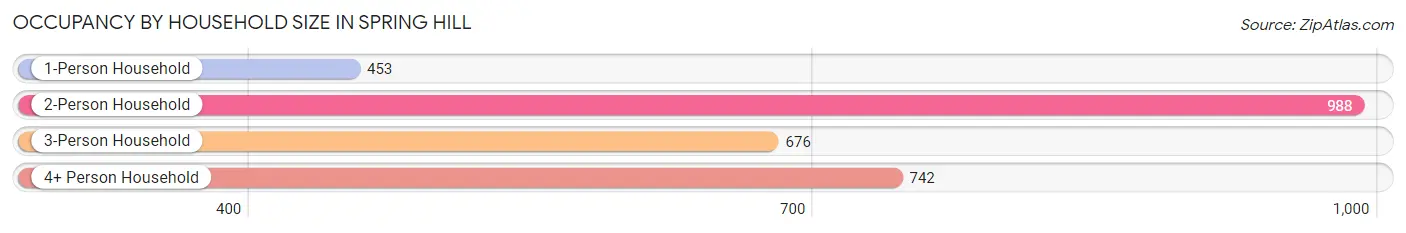
| Household Size | # Housing Units | % Housing Units |
| 1-Person Household | 453 | 15.8% |
| 2-Person Household | 988 | 34.6% |
| 3-Person Household | 676 | 23.6% |
| 4+ Person Household | 742 | 26.0% |
| Total Housing Units | 2,859 | 100.0% |
Occupancy by Ownership by Household Size in Spring Hill
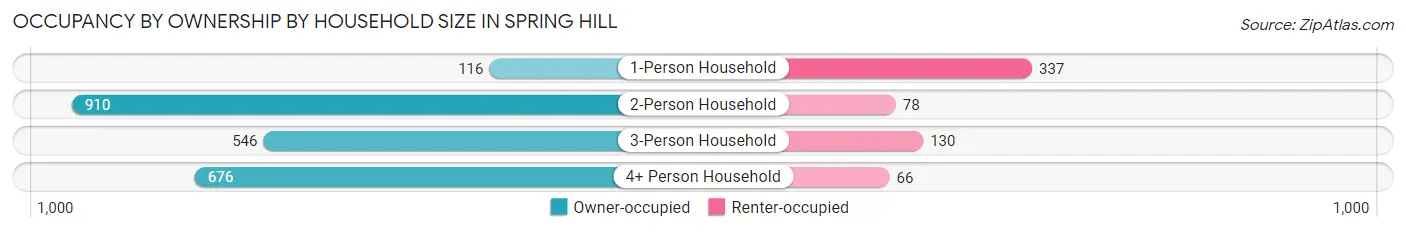
| Household Size | Owner-occupied | Renter-occupied |
| 1-Person Household | 116 (25.6%) | 337 (74.4%) |
| 2-Person Household | 910 (92.1%) | 78 (7.9%) |
| 3-Person Household | 546 (80.8%) | 130 (19.2%) |
| 4+ Person Household | 676 (91.1%) | 66 (8.9%) |
| Total Housing Units | 2,248 (78.6%) | 611 (21.4%) |
Occupancy by Educational Attainment in Spring Hill
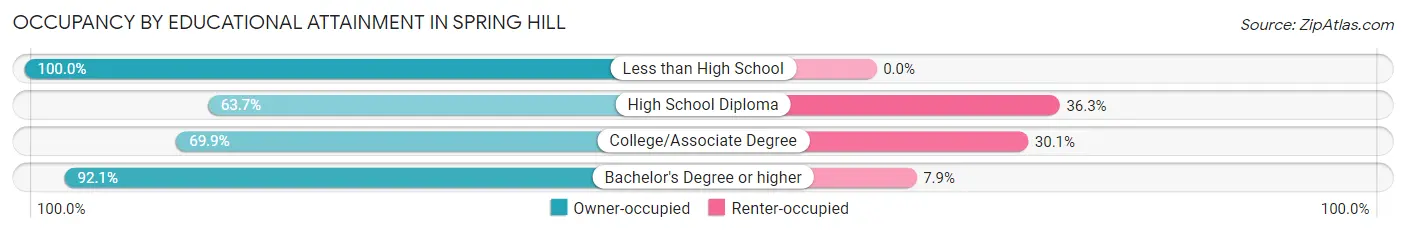
| Household Size | Owner-occupied | Renter-occupied |
| Less than High School | 33 (100.0%) | 0 (0.0%) |
| High School Diploma | 261 (63.7%) | 149 (36.3%) |
| College/Associate Degree | 853 (69.9%) | 367 (30.1%) |
| Bachelor's Degree or higher | 1,101 (92.1%) | 95 (7.9%) |
Occupancy by Age of Householder in Spring Hill
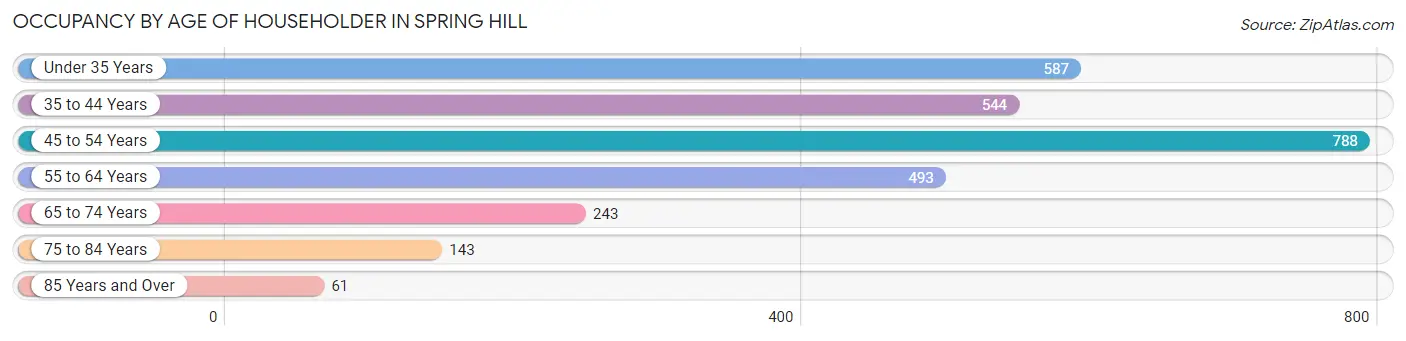
| Age Bracket | # Households | % Households |
| Under 35 Years | 587 | 20.5% |
| 35 to 44 Years | 544 | 19.0% |
| 45 to 54 Years | 788 | 27.6% |
| 55 to 64 Years | 493 | 17.2% |
| 65 to 74 Years | 243 | 8.5% |
| 75 to 84 Years | 143 | 5.0% |
| 85 Years and Over | 61 | 2.1% |
| Total | 2,859 | 100.0% |
Housing Finances in Spring Hill
Median Income by Occupancy in Spring Hill
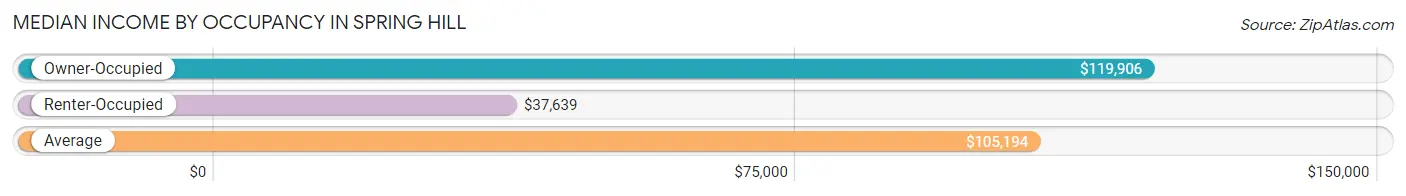
| Occupancy Type | # Households | Median Income |
| Owner-Occupied | 2,248 (78.6%) | $119,906 |
| Renter-Occupied | 611 (21.4%) | $37,639 |
| Average | 2,859 (100.0%) | $105,194 |
Occupancy by Householder Income Bracket in Spring Hill
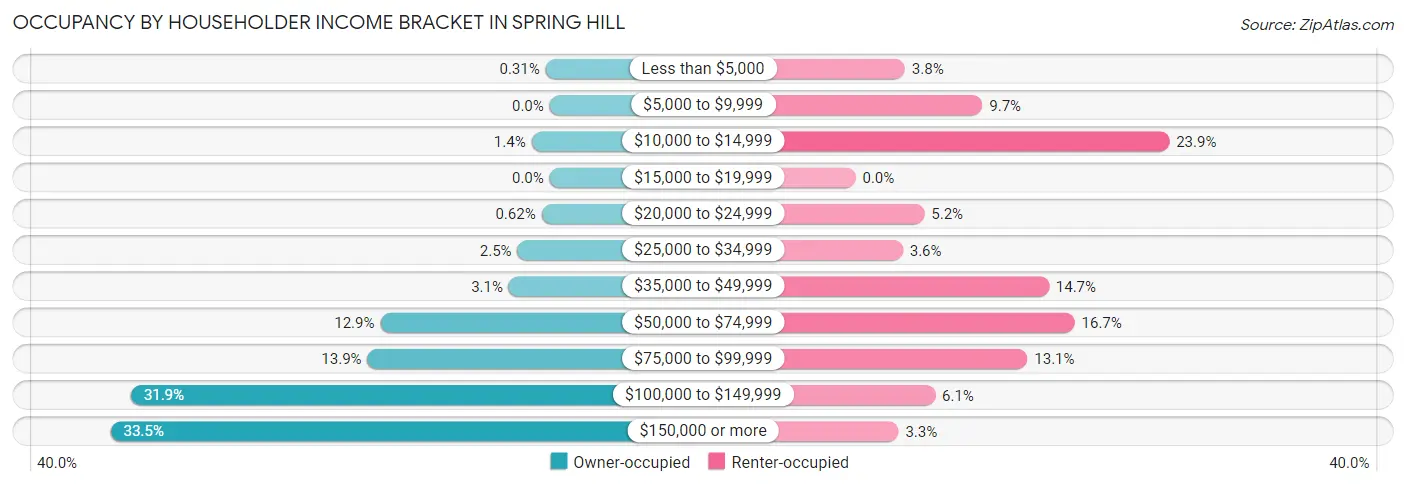
| Income Bracket | Owner-occupied | Renter-occupied |
| Less than $5,000 | 7 (0.3%) | 23 (3.8%) |
| $5,000 to $9,999 | 0 (0.0%) | 59 (9.7%) |
| $10,000 to $14,999 | 31 (1.4%) | 146 (23.9%) |
| $15,000 to $19,999 | 0 (0.0%) | 0 (0.0%) |
| $20,000 to $24,999 | 14 (0.6%) | 32 (5.2%) |
| $25,000 to $34,999 | 55 (2.5%) | 22 (3.6%) |
| $35,000 to $49,999 | 70 (3.1%) | 90 (14.7%) |
| $50,000 to $74,999 | 290 (12.9%) | 102 (16.7%) |
| $75,000 to $99,999 | 312 (13.9%) | 80 (13.1%) |
| $100,000 to $149,999 | 717 (31.9%) | 37 (6.1%) |
| $150,000 or more | 752 (33.5%) | 20 (3.3%) |
| Total | 2,248 (100.0%) | 611 (100.0%) |
Monthly Housing Cost Tiers in Spring Hill
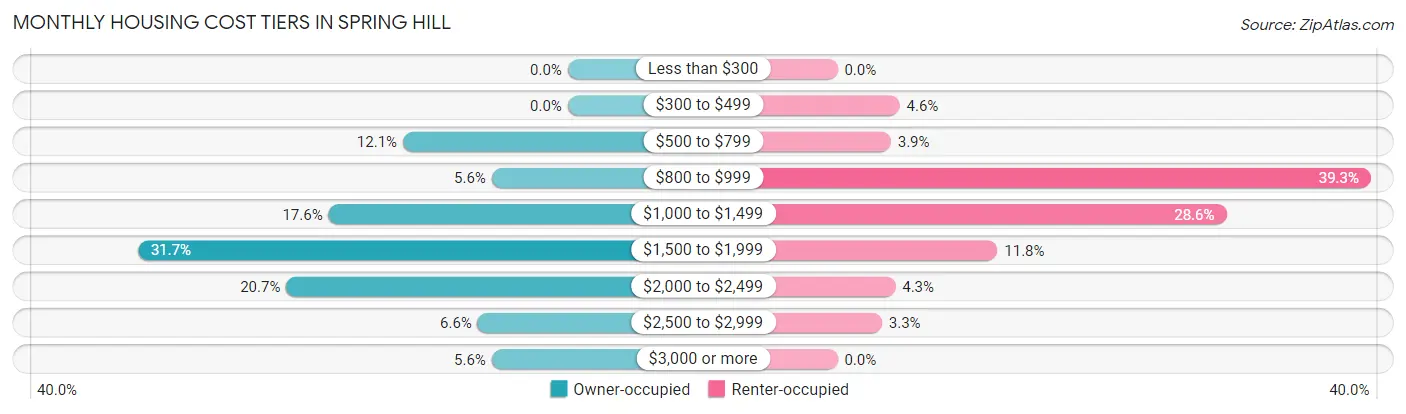
| Monthly Cost | Owner-occupied | Renter-occupied |
| Less than $300 | 0 (0.0%) | 0 (0.0%) |
| $300 to $499 | 0 (0.0%) | 28 (4.6%) |
| $500 to $799 | 273 (12.1%) | 24 (3.9%) |
| $800 to $999 | 126 (5.6%) | 240 (39.3%) |
| $1,000 to $1,499 | 396 (17.6%) | 175 (28.6%) |
| $1,500 to $1,999 | 712 (31.7%) | 72 (11.8%) |
| $2,000 to $2,499 | 466 (20.7%) | 26 (4.3%) |
| $2,500 to $2,999 | 149 (6.6%) | 20 (3.3%) |
| $3,000 or more | 126 (5.6%) | 0 (0.0%) |
| Total | 2,248 (100.0%) | 611 (100.0%) |
Physical Housing Characteristics in Spring Hill
Housing Structures in Spring Hill
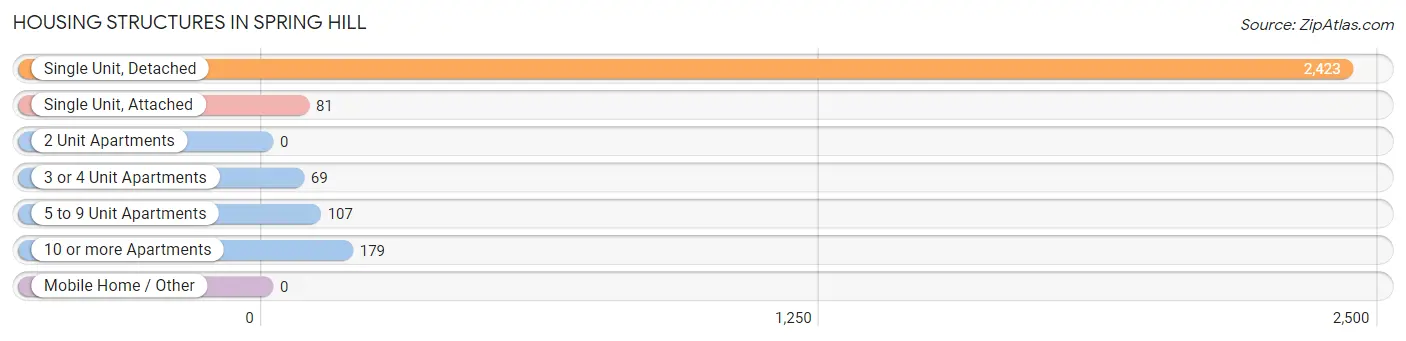
| Structure Type | # Housing Units | % Housing Units |
| Single Unit, Detached | 2,423 | 84.8% |
| Single Unit, Attached | 81 | 2.8% |
| 2 Unit Apartments | 0 | 0.0% |
| 3 or 4 Unit Apartments | 69 | 2.4% |
| 5 to 9 Unit Apartments | 107 | 3.7% |
| 10 or more Apartments | 179 | 6.3% |
| Mobile Home / Other | 0 | 0.0% |
| Total | 2,859 | 100.0% |
Housing Structures by Occupancy in Spring Hill
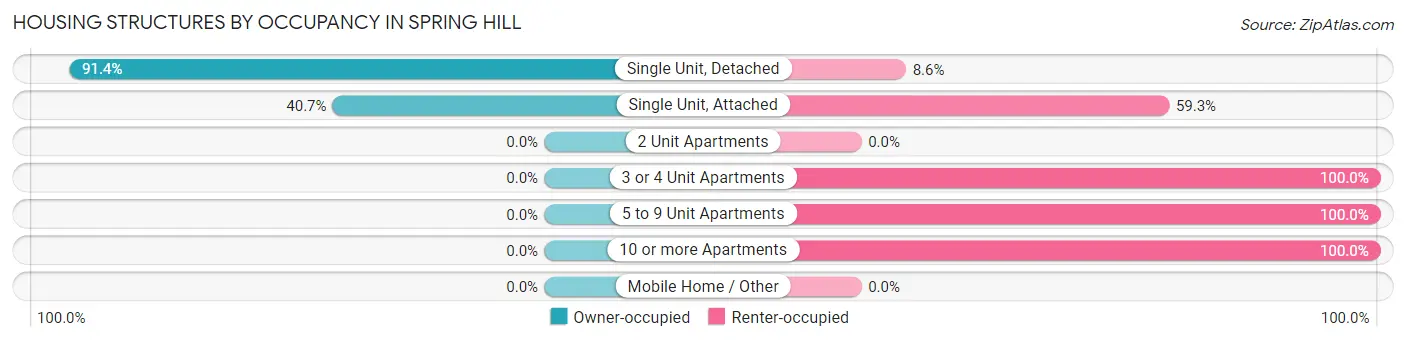
| Structure Type | Owner-occupied | Renter-occupied |
| Single Unit, Detached | 2,215 (91.4%) | 208 (8.6%) |
| Single Unit, Attached | 33 (40.7%) | 48 (59.3%) |
| 2 Unit Apartments | 0 (0.0%) | 0 (0.0%) |
| 3 or 4 Unit Apartments | 0 (0.0%) | 69 (100.0%) |
| 5 to 9 Unit Apartments | 0 (0.0%) | 107 (100.0%) |
| 10 or more Apartments | 0 (0.0%) | 179 (100.0%) |
| Mobile Home / Other | 0 (0.0%) | 0 (0.0%) |
| Total | 2,248 (78.6%) | 611 (21.4%) |
Housing Structures by Number of Rooms in Spring Hill
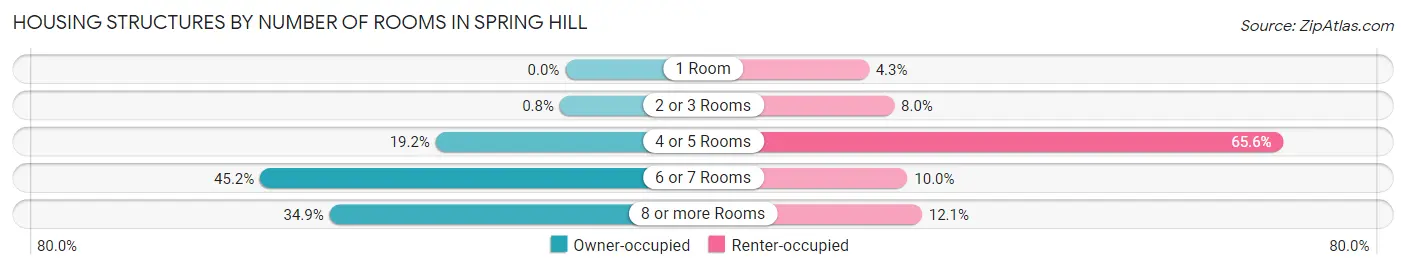
| Number of Rooms | Owner-occupied | Renter-occupied |
| 1 Room | 0 (0.0%) | 26 (4.3%) |
| 2 or 3 Rooms | 18 (0.8%) | 49 (8.0%) |
| 4 or 5 Rooms | 431 (19.2%) | 401 (65.6%) |
| 6 or 7 Rooms | 1,015 (45.2%) | 61 (10.0%) |
| 8 or more Rooms | 784 (34.9%) | 74 (12.1%) |
| Total | 2,248 (100.0%) | 611 (100.0%) |
Housing Structure by Heating Type in Spring Hill
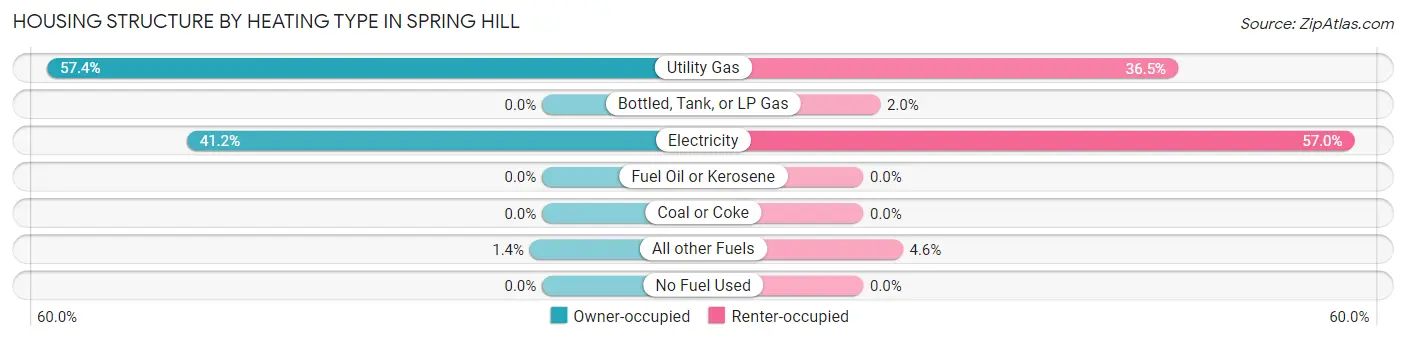
| Heating Type | Owner-occupied | Renter-occupied |
| Utility Gas | 1,290 (57.4%) | 223 (36.5%) |
| Bottled, Tank, or LP Gas | 0 (0.0%) | 12 (2.0%) |
| Electricity | 926 (41.2%) | 348 (57.0%) |
| Fuel Oil or Kerosene | 0 (0.0%) | 0 (0.0%) |
| Coal or Coke | 0 (0.0%) | 0 (0.0%) |
| All other Fuels | 32 (1.4%) | 28 (4.6%) |
| No Fuel Used | 0 (0.0%) | 0 (0.0%) |
| Total | 2,248 (100.0%) | 611 (100.0%) |
Household Vehicle Usage in Spring Hill
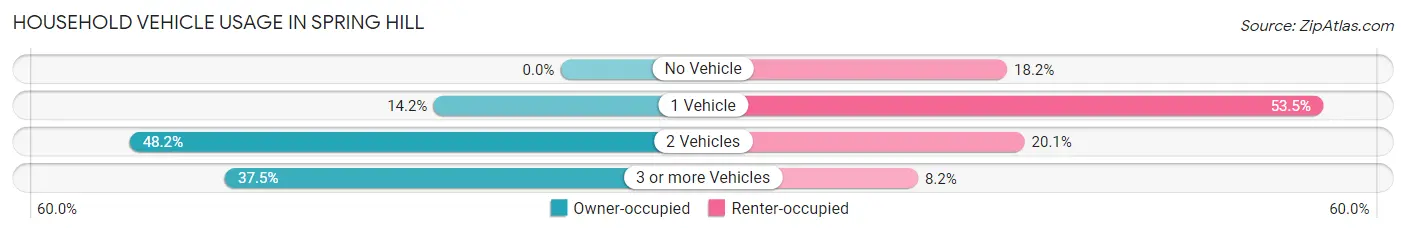
| Vehicles per Household | Owner-occupied | Renter-occupied |
| No Vehicle | 0 (0.0%) | 111 (18.2%) |
| 1 Vehicle | 320 (14.2%) | 327 (53.5%) |
| 2 Vehicles | 1,084 (48.2%) | 123 (20.1%) |
| 3 or more Vehicles | 844 (37.5%) | 50 (8.2%) |
| Total | 2,248 (100.0%) | 611 (100.0%) |
Real Estate & Mortgages in Spring Hill
Real Estate and Mortgage Overview in Spring Hill
| Characteristic | Without Mortgage | With Mortgage |
| Housing Units | 477 | 1,771 |
| Median Property Value | $289,800 | $269,600 |
| Median Household Income | $94,102 | $625 |
| Monthly Housing Costs | $751 | $126 |
| Real Estate Taxes | $4,102 | $42 |
Property Value by Mortgage Status in Spring Hill
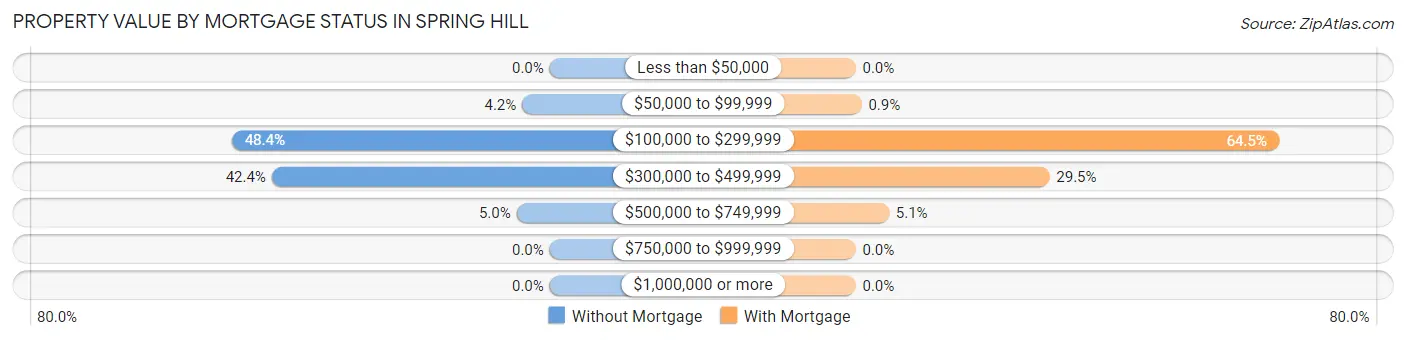
| Property Value | Without Mortgage | With Mortgage |
| Less than $50,000 | 0 (0.0%) | 0 (0.0%) |
| $50,000 to $99,999 | 20 (4.2%) | 16 (0.9%) |
| $100,000 to $299,999 | 231 (48.4%) | 1,142 (64.5%) |
| $300,000 to $499,999 | 202 (42.3%) | 523 (29.5%) |
| $500,000 to $749,999 | 24 (5.0%) | 90 (5.1%) |
| $750,000 to $999,999 | 0 (0.0%) | 0 (0.0%) |
| $1,000,000 or more | 0 (0.0%) | 0 (0.0%) |
| Total | 477 (100.0%) | 1,771 (100.0%) |
Household Income by Mortgage Status in Spring Hill
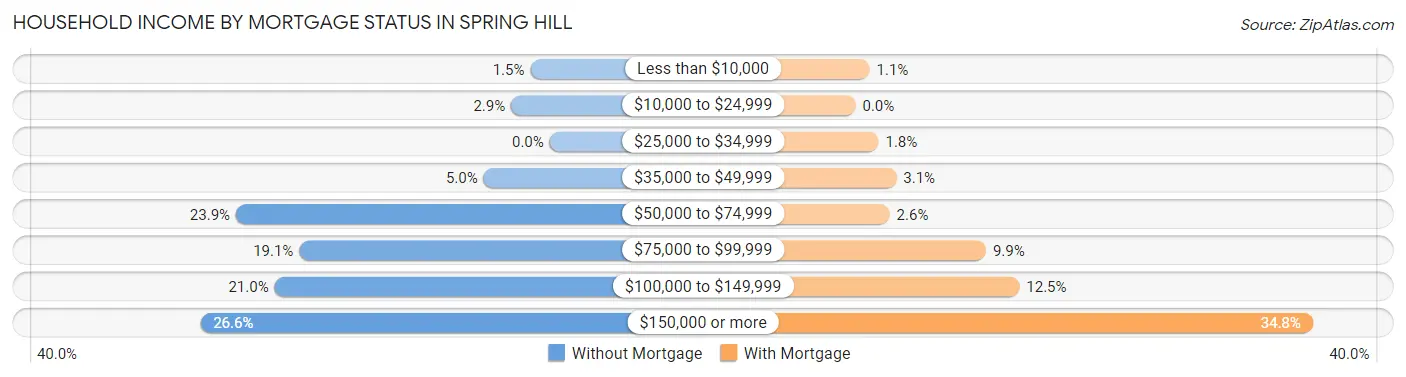
| Household Income | Without Mortgage | With Mortgage |
| Less than $10,000 | 7 (1.5%) | 19 (1.1%) |
| $10,000 to $24,999 | 14 (2.9%) | 0 (0.0%) |
| $25,000 to $34,999 | 0 (0.0%) | 31 (1.8%) |
| $35,000 to $49,999 | 24 (5.0%) | 55 (3.1%) |
| $50,000 to $74,999 | 114 (23.9%) | 46 (2.6%) |
| $75,000 to $99,999 | 91 (19.1%) | 176 (9.9%) |
| $100,000 to $149,999 | 100 (21.0%) | 221 (12.5%) |
| $150,000 or more | 127 (26.6%) | 617 (34.8%) |
| Total | 477 (100.0%) | 1,771 (100.0%) |
Property Value to Household Income Ratio in Spring Hill
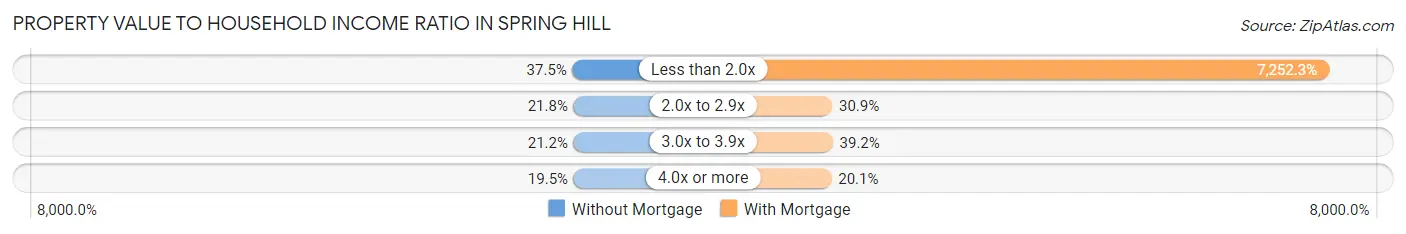
| Value-to-Income Ratio | Without Mortgage | With Mortgage |
| Less than 2.0x | 179 (37.5%) | 128,438 (7,252.3%) |
| 2.0x to 2.9x | 104 (21.8%) | 548 (30.9%) |
| 3.0x to 3.9x | 101 (21.2%) | 695 (39.2%) |
| 4.0x or more | 93 (19.5%) | 356 (20.1%) |
| Total | 477 (100.0%) | 1,771 (100.0%) |
Real Estate Taxes by Mortgage Status in Spring Hill
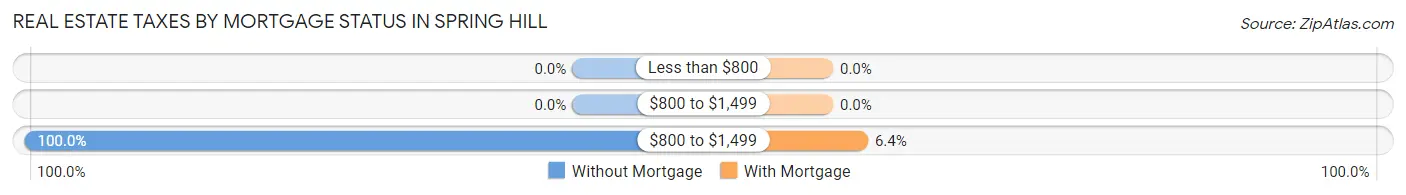
| Property Taxes | Without Mortgage | With Mortgage |
| Less than $800 | 0 (0.0%) | 0 (0.0%) |
| $800 to $1,499 | 0 (0.0%) | 0 (0.0%) |
| $800 to $1,499 | 477 (100.0%) | 113 (6.4%) |
| Total | 477 (100.0%) | 1,771 (100.0%) |
Health & Disability in Spring Hill
Health Insurance Coverage by Age in Spring Hill
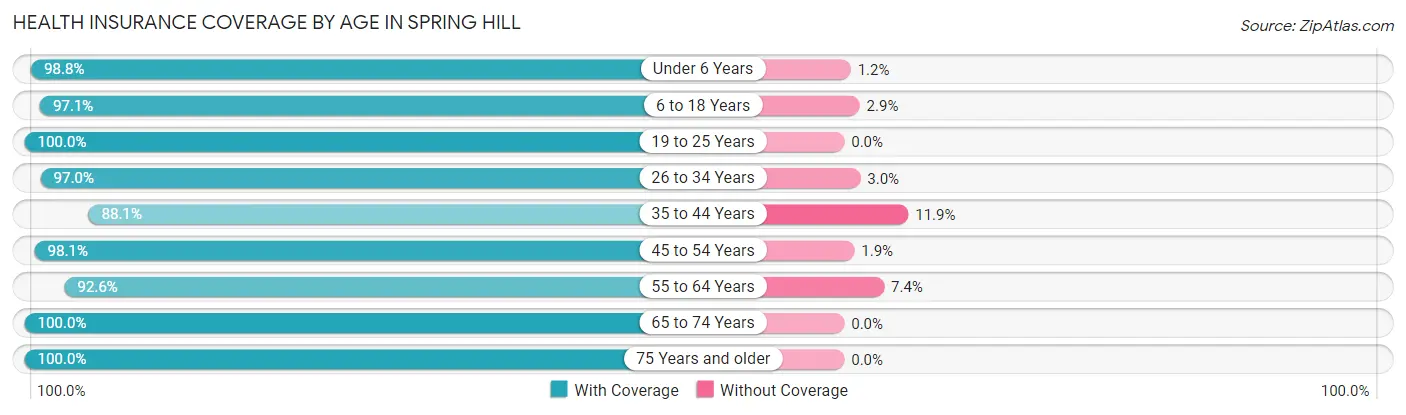
| Age Bracket | With Coverage | Without Coverage |
| Under 6 Years | 825 (98.8%) | 10 (1.2%) |
| 6 to 18 Years | 1,555 (97.1%) | 46 (2.9%) |
| 19 to 25 Years | 854 (100.0%) | 0 (0.0%) |
| 26 to 34 Years | 974 (97.0%) | 30 (3.0%) |
| 35 to 44 Years | 966 (88.1%) | 131 (11.9%) |
| 45 to 54 Years | 1,155 (98.1%) | 22 (1.9%) |
| 55 to 64 Years | 847 (92.6%) | 68 (7.4%) |
| 65 to 74 Years | 465 (100.0%) | 0 (0.0%) |
| 75 Years and older | 276 (100.0%) | 0 (0.0%) |
| Total | 7,917 (96.3%) | 307 (3.7%) |
Health Insurance Coverage by Citizenship Status in Spring Hill
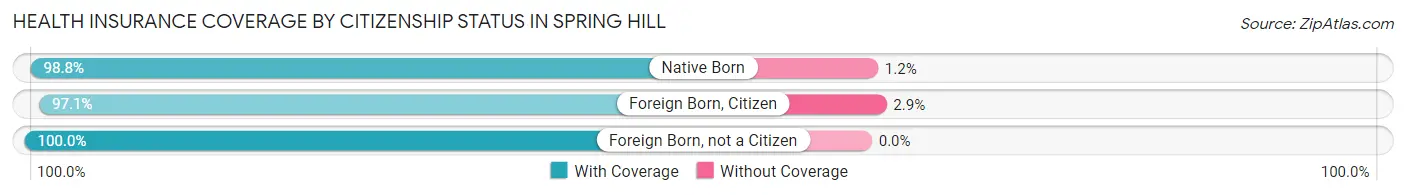
| Citizenship Status | With Coverage | Without Coverage |
| Native Born | 825 (98.8%) | 10 (1.2%) |
| Foreign Born, Citizen | 1,555 (97.1%) | 46 (2.9%) |
| Foreign Born, not a Citizen | 854 (100.0%) | 0 (0.0%) |
Health Insurance Coverage by Household Income in Spring Hill
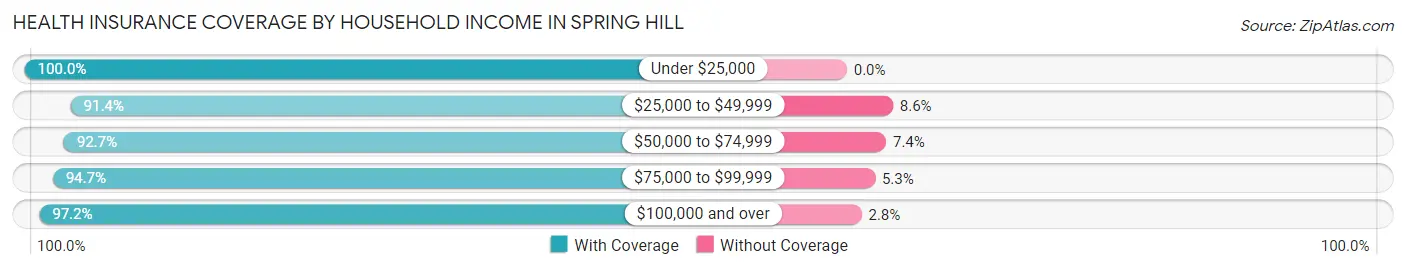
| Household Income | With Coverage | Without Coverage |
| Under $25,000 | 562 (100.0%) | 0 (0.0%) |
| $25,000 to $49,999 | 455 (91.4%) | 43 (8.6%) |
| $50,000 to $74,999 | 781 (92.6%) | 62 (7.3%) |
| $75,000 to $99,999 | 1,041 (94.7%) | 58 (5.3%) |
| $100,000 and over | 5,078 (97.2%) | 144 (2.8%) |
Public vs Private Health Insurance Coverage by Age in Spring Hill
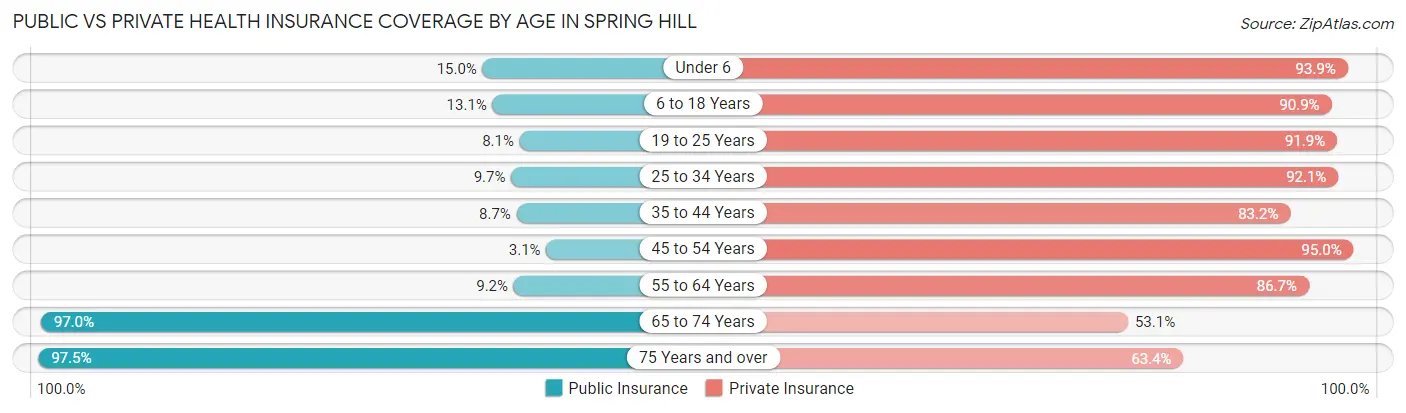
| Age Bracket | Public Insurance | Private Insurance |
| Under 6 | 125 (15.0%) | 784 (93.9%) |
| 6 to 18 Years | 210 (13.1%) | 1,455 (90.9%) |
| 19 to 25 Years | 69 (8.1%) | 785 (91.9%) |
| 25 to 34 Years | 97 (9.7%) | 925 (92.1%) |
| 35 to 44 Years | 95 (8.7%) | 913 (83.2%) |
| 45 to 54 Years | 37 (3.1%) | 1,118 (95.0%) |
| 55 to 64 Years | 84 (9.2%) | 793 (86.7%) |
| 65 to 74 Years | 451 (97.0%) | 247 (53.1%) |
| 75 Years and over | 269 (97.5%) | 175 (63.4%) |
| Total | 1,437 (17.5%) | 7,195 (87.5%) |
Disability Status by Sex by Age in Spring Hill
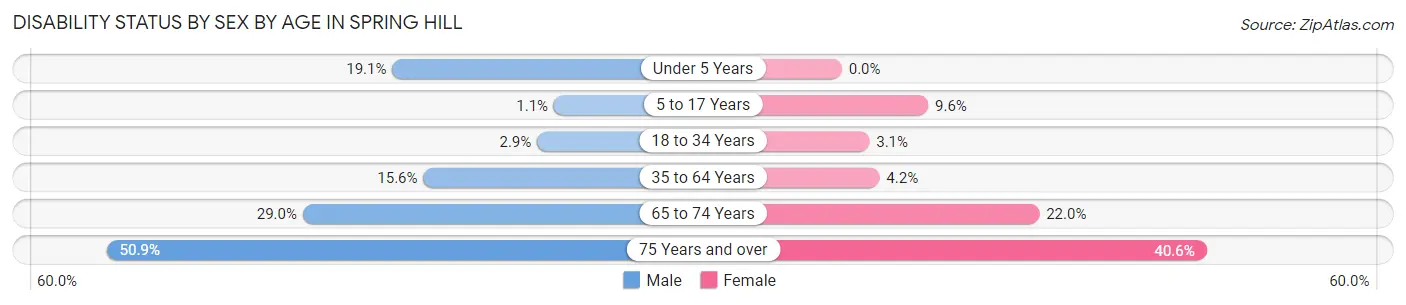
| Age Bracket | Male | Female |
| Under 5 Years | 40 (19.1%) | 0 (0.0%) |
| 5 to 17 Years | 12 (1.1%) | 64 (9.6%) |
| 18 to 34 Years | 29 (2.9%) | 28 (3.1%) |
| 35 to 64 Years | 259 (15.6%) | 64 (4.2%) |
| 65 to 74 Years | 65 (29.0%) | 53 (22.0%) |
| 75 Years and over | 59 (50.9%) | 65 (40.6%) |
Disability Class by Sex by Age in Spring Hill
Disability Class: Hearing Difficulty
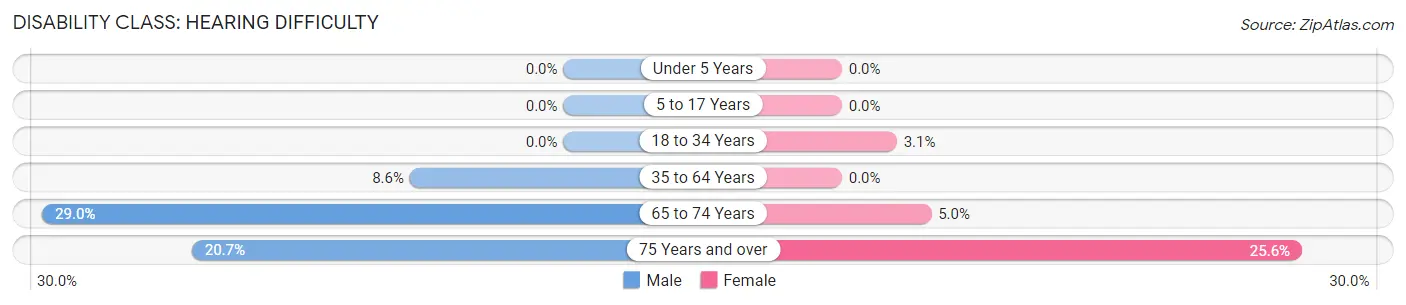
| Age Bracket | Male | Female |
| Under 5 Years | 0 (0.0%) | 0 (0.0%) |
| 5 to 17 Years | 0 (0.0%) | 0 (0.0%) |
| 18 to 34 Years | 0 (0.0%) | 28 (3.1%) |
| 35 to 64 Years | 142 (8.6%) | 0 (0.0%) |
| 65 to 74 Years | 65 (29.0%) | 12 (5.0%) |
| 75 Years and over | 24 (20.7%) | 41 (25.6%) |
Disability Class: Vision Difficulty
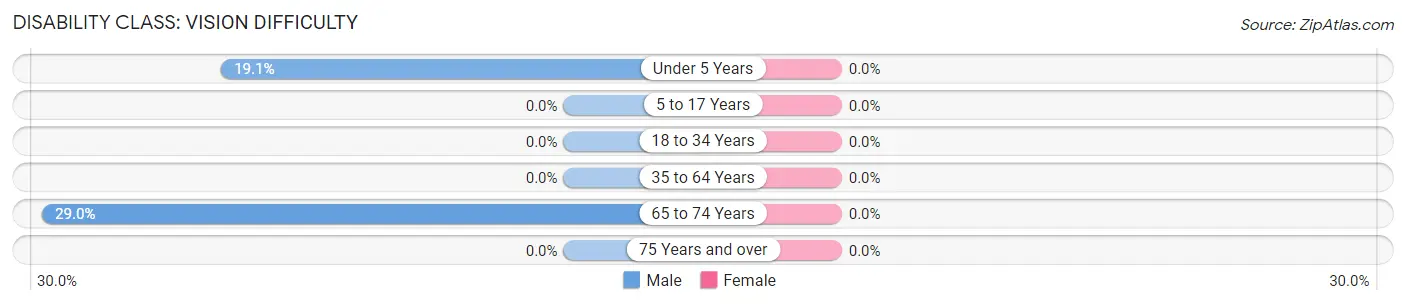
| Age Bracket | Male | Female |
| Under 5 Years | 40 (19.1%) | 0 (0.0%) |
| 5 to 17 Years | 0 (0.0%) | 0 (0.0%) |
| 18 to 34 Years | 0 (0.0%) | 0 (0.0%) |
| 35 to 64 Years | 0 (0.0%) | 0 (0.0%) |
| 65 to 74 Years | 65 (29.0%) | 0 (0.0%) |
| 75 Years and over | 0 (0.0%) | 0 (0.0%) |
Disability Class: Cognitive Difficulty
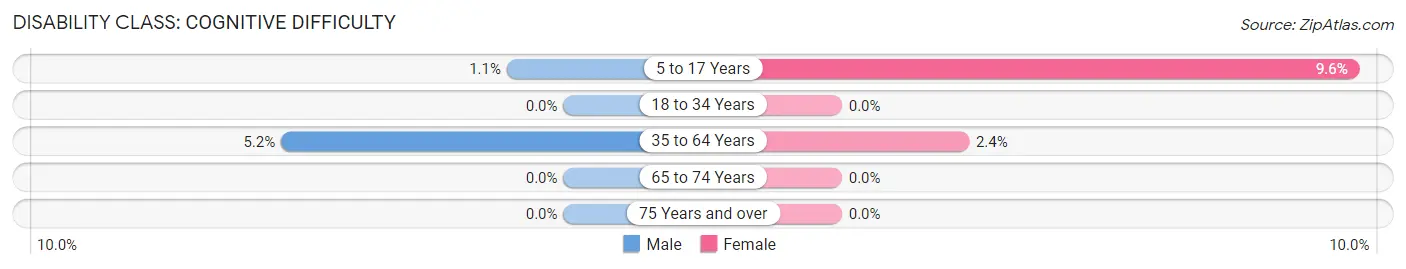
| Age Bracket | Male | Female |
| 5 to 17 Years | 12 (1.1%) | 64 (9.6%) |
| 18 to 34 Years | 0 (0.0%) | 0 (0.0%) |
| 35 to 64 Years | 87 (5.2%) | 36 (2.4%) |
| 65 to 74 Years | 0 (0.0%) | 0 (0.0%) |
| 75 Years and over | 0 (0.0%) | 0 (0.0%) |
Disability Class: Ambulatory Difficulty
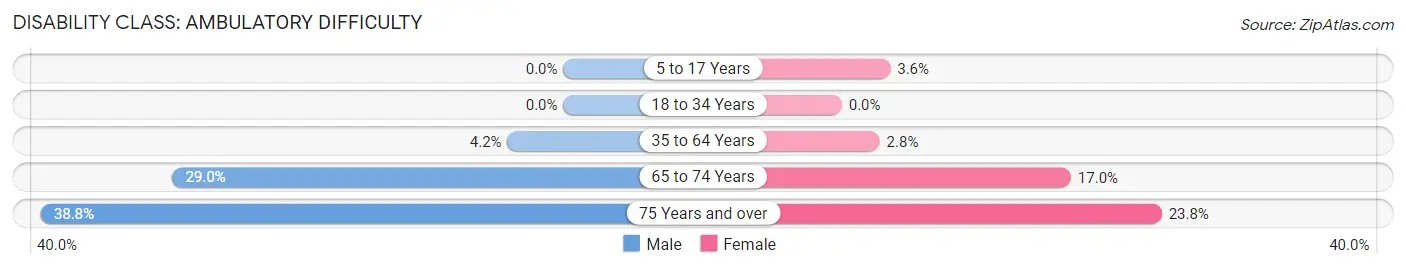
| Age Bracket | Male | Female |
| 5 to 17 Years | 0 (0.0%) | 24 (3.6%) |
| 18 to 34 Years | 0 (0.0%) | 0 (0.0%) |
| 35 to 64 Years | 69 (4.2%) | 43 (2.8%) |
| 65 to 74 Years | 65 (29.0%) | 41 (17.0%) |
| 75 Years and over | 45 (38.8%) | 38 (23.7%) |
Disability Class: Self-Care Difficulty
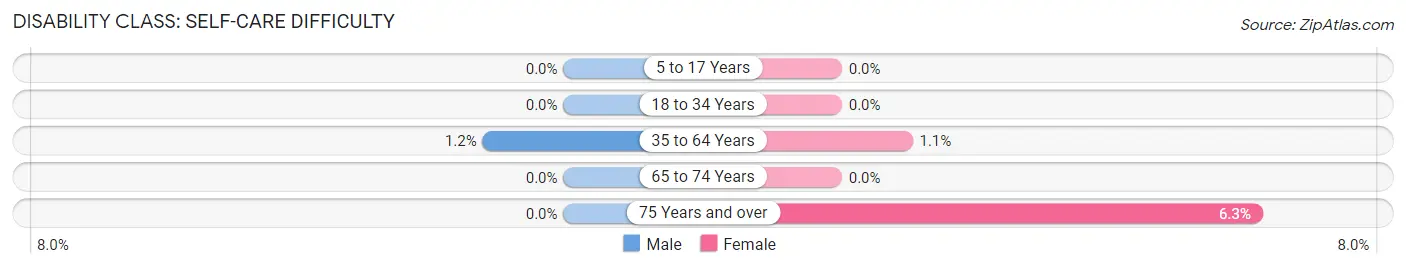
| Age Bracket | Male | Female |
| 5 to 17 Years | 0 (0.0%) | 0 (0.0%) |
| 18 to 34 Years | 0 (0.0%) | 0 (0.0%) |
| 35 to 64 Years | 20 (1.2%) | 16 (1.1%) |
| 65 to 74 Years | 0 (0.0%) | 0 (0.0%) |
| 75 Years and over | 0 (0.0%) | 10 (6.2%) |
Technology Access in Spring Hill
Computing Device Access in Spring Hill
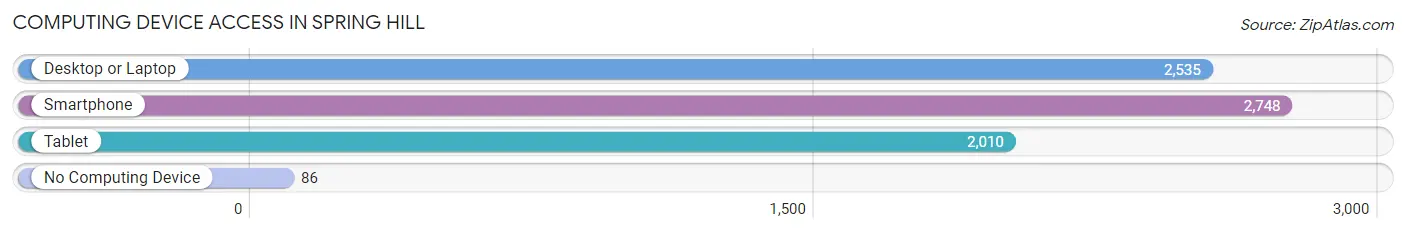
| Device Type | # Households | % Households |
| Desktop or Laptop | 2,535 | 88.7% |
| Smartphone | 2,748 | 96.1% |
| Tablet | 2,010 | 70.3% |
| No Computing Device | 86 | 3.0% |
| Total | 2,859 | 100.0% |
Internet Access in Spring Hill
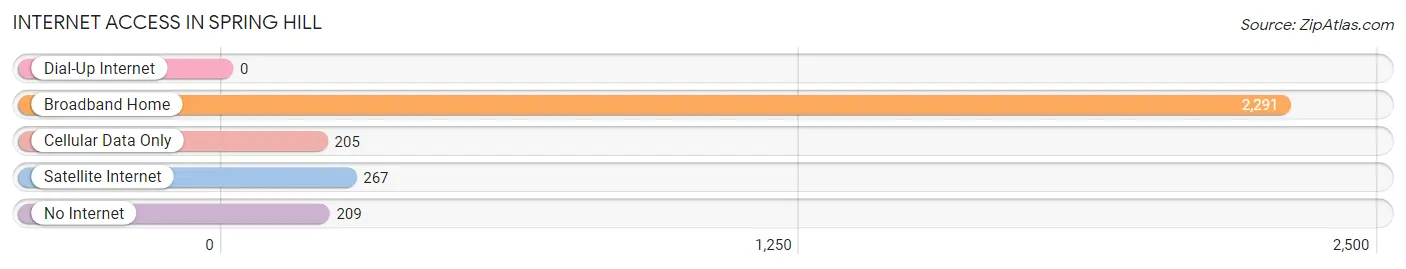
| Internet Type | # Households | % Households |
| Dial-Up Internet | 0 | 0.0% |
| Broadband Home | 2,291 | 80.1% |
| Cellular Data Only | 205 | 7.2% |
| Satellite Internet | 267 | 9.3% |
| No Internet | 209 | 7.3% |
| Total | 2,859 | 100.0% |
Spring Hill Summary
History
Spring Hill, Kansas is a small city located in Johnson County, Kansas. It is situated about 25 miles southwest of Kansas City, Missouri. The city was founded in 1857 by a group of settlers from Ohio, who named it after the nearby Spring Hill Creek. The city was incorporated in 1867 and has since grown to a population of over 5,000 people.
The city has a rich history, which includes the establishment of the first post office in 1858, the first school in 1859, and the first church in 1860. The city was also home to the first railroad in Johnson County, which was built in 1871.
The city has seen its share of growth and development over the years. In the late 1800s, the city was home to several businesses, including a flour mill, a sawmill, a brickyard, and a blacksmith shop. The city also had a hotel, a bank, and a newspaper.
In the early 1900s, the city experienced a period of growth and prosperity. The population increased from 1,000 in 1900 to over 3,000 in 1920. During this time, the city was home to several businesses, including a canning factory, a creamery, a furniture factory, and a shoe factory.
The city experienced a period of decline in the mid-1900s, as many of the businesses closed and the population decreased. However, the city has seen a resurgence in recent years, with the population increasing to over 5,000 in 2020.
Geography
Spring Hill is located in Johnson County, Kansas, about 25 miles southwest of Kansas City, Missouri. The city is situated on the banks of Spring Hill Creek, which flows through the city and into the nearby Kansas River. The city is located in the rolling hills of the Osage Plains, which are characterized by flat to gently rolling terrain.
The city has a total area of 4.2 square miles, all of which is land. The city has a humid continental climate, with hot, humid summers and cold, dry winters. The average annual temperature is around 54°F, with an average high of around 79°F in the summer and an average low of around 28°F in the winter.
Economy
The economy of Spring Hill is largely based on agriculture and manufacturing. The city is home to several large farms, which produce a variety of crops, including corn, soybeans, wheat, and hay. The city is also home to several manufacturing companies, which produce a variety of products, including furniture, clothing, and automotive parts.
The city is also home to several retail stores, restaurants, and other businesses. The city is served by the Johnson County Airport, which provides air transportation to the surrounding area.
Demographics
As of the 2020 census, the population of Spring Hill was 5,072. The racial makeup of the city was 92.3% White, 3.2% African American, 0.7% Native American, 0.7% Asian, 0.1% Pacific Islander, 1.2% from other races, and 2.0% from two or more races. Hispanic or Latino of any race were 4.2% of the population.
The median household income in Spring Hill was $60,938, and the median family income was $71,938. The per capita income was $27,938. About 6.2% of the population was below the poverty line.
Conclusion
Spring Hill, Kansas is a small city located in Johnson County, Kansas. It is situated about 25 miles southwest of Kansas City, Missouri. The city was founded in 1857 and has since grown to a population of over 5,000 people. The city has a rich history, which includes the establishment of the first post office in 1858, the first school in 1859, and the first church in 1860. The city has seen its share of growth and development over the years, and today it is home to several businesses, farms, and manufacturing companies. The city has a humid continental climate, with hot, humid summers and cold, dry winters. The population of Spring Hill is largely White, with a small percentage of African American, Native American, Asian, and Pacific Islander residents. The median household income in Spring Hill is $60,938, and the median family income is $71,938.
Common Questions
What is Per Capita Income in Spring Hill?
Per Capita income in Spring Hill is $39,315.
What is the Median Family Income in Spring Hill?
Median Family Income in Spring Hill is $118,707.
What is the Median Household income in Spring Hill?
Median Household Income in Spring Hill is $105,194.
What is Income or Wage Gap in Spring Hill?
Income or Wage Gap in Spring Hill is 38.6%.
Women in Spring Hill earn 61.4 cents for every dollar earned by a man.
What is Inequality or Gini Index in Spring Hill?
Inequality or Gini Index in Spring Hill is 0.35.
What is the Total Population of Spring Hill?
Total Population of Spring Hill is 8,279.
What is the Total Male Population of Spring Hill?
Total Male Population of Spring Hill is 4,371.
What is the Total Female Population of Spring Hill?
Total Female Population of Spring Hill is 3,908.
What is the Ratio of Males per 100 Females in Spring Hill?
There are 111.85 Males per 100 Females in Spring Hill.
What is the Ratio of Females per 100 Males in Spring Hill?
There are 89.41 Females per 100 Males in Spring Hill.
What is the Median Population Age in Spring Hill?
Median Population Age in Spring Hill is 34.3 Years.
What is the Average Family Size in Spring Hill
Average Family Size in Spring Hill is 3.2 People.
What is the Average Household Size in Spring Hill
Average Household Size in Spring Hill is 2.9 People.
How Large is the Labor Force in Spring Hill?
There are 4,614 People in the Labor Forcein in Spring Hill.
What is the Percentage of People in the Labor Force in Spring Hill?
75.6% of People are in the Labor Force in Spring Hill.
What is the Unemployment Rate in Spring Hill?
Unemployment Rate in Spring Hill is 2.3%.