Humboldt, KS Map & Demographics
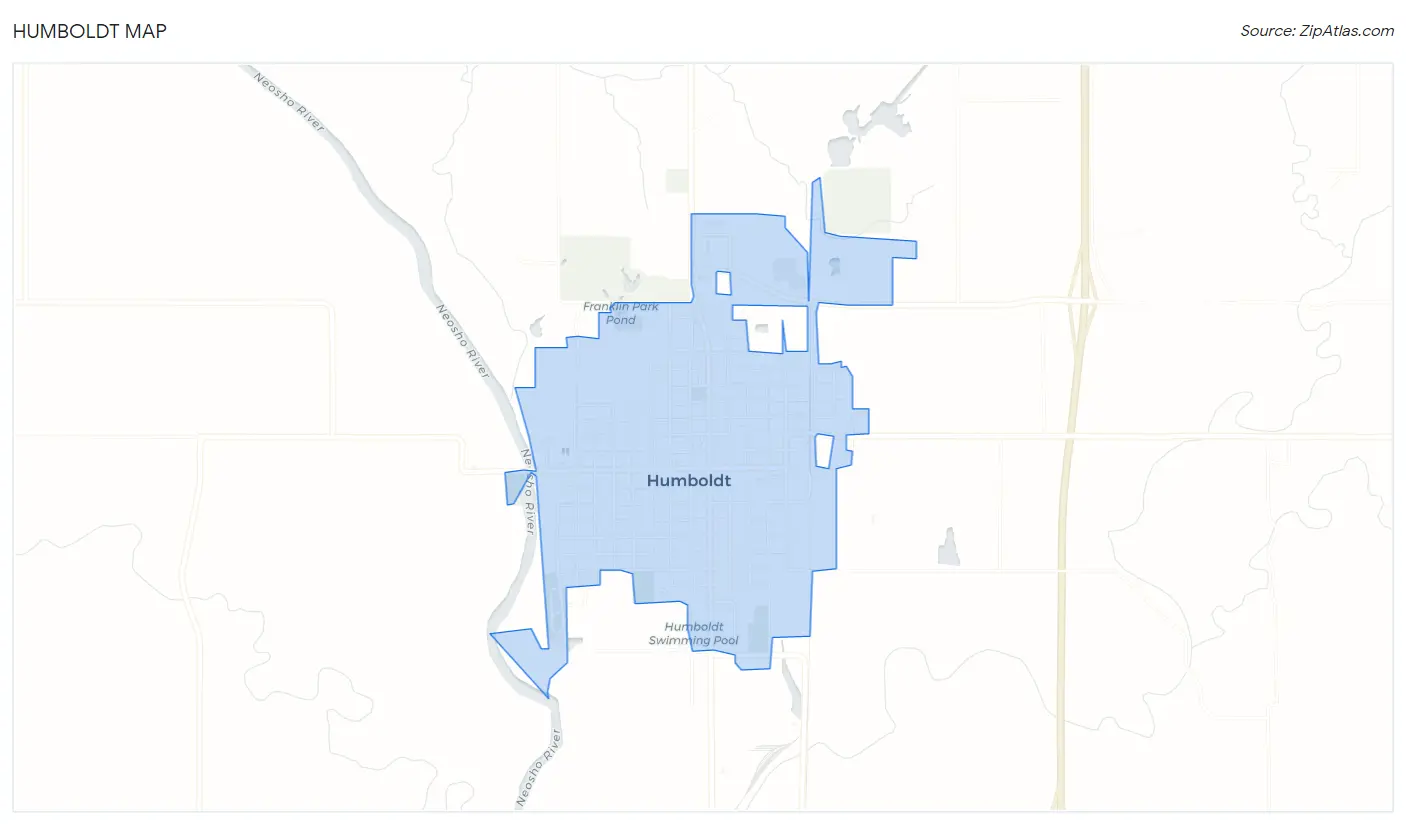
Humboldt Map
Humboldt Overview
$25,512
PER CAPITA INCOME
$53,654
AVG FAMILY INCOME
$43,144
AVG HOUSEHOLD INCOME
30.0%
WAGE / INCOME GAP [ % ]
70.0¢/ $1
WAGE / INCOME GAP [ $ ]
$13,317
FAMILY INCOME DEFICIT
0.44
INEQUALITY / GINI INDEX
1,941
TOTAL POPULATION
909
MALE POPULATION
1,032
FEMALE POPULATION
88.08
MALES / 100 FEMALES
113.53
FEMALES / 100 MALES
48.3
MEDIAN AGE
3.1
AVG FAMILY SIZE
2.5
AVG HOUSEHOLD SIZE
941
LABOR FORCE [ PEOPLE ]
60.3%
PERCENT IN LABOR FORCE
19.1%
UNEMPLOYMENT RATE
Humboldt Zip Codes
Humboldt Area Codes
Income in Humboldt
Income Overview in Humboldt
Per Capita Income in Humboldt is $25,512, while median incomes of families and households are $53,654 and $43,144 respectively.
| Characteristic | Number | Measure |
| Per Capita Income | 1,941 | $25,512 |
| Median Family Income | 506 | $53,654 |
| Mean Family Income | 506 | $62,519 |
| Median Household Income | 767 | $43,144 |
| Mean Household Income | 767 | $56,235 |
| Income Deficit | 506 | $13,317 |
| Wage / Income Gap (%) | 1,941 | 29.99% |
| Wage / Income Gap ($) | 1,941 | 70.01¢ per $1 |
| Gini / Inequality Index | 1,941 | 0.44 |
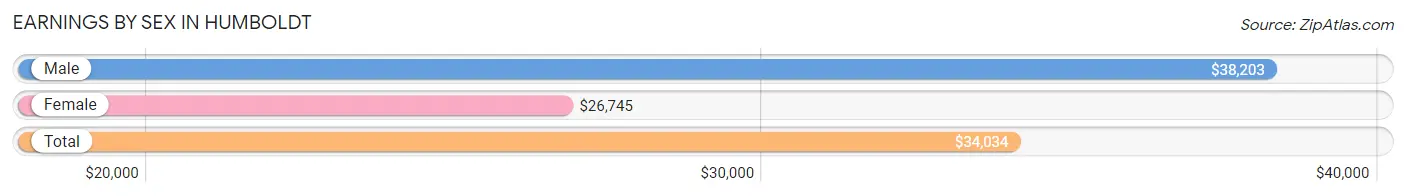
Earnings by Sex in Humboldt
Average Earnings in Humboldt are $34,034, $38,203 for men and $26,745 for women, a difference of 30.0%.
| Sex | Number | Average Earnings |
| Male | 468 (56.9%) | $38,203 |
| Female | 354 (43.1%) | $26,745 |
| Total | 822 (100.0%) | $34,034 |
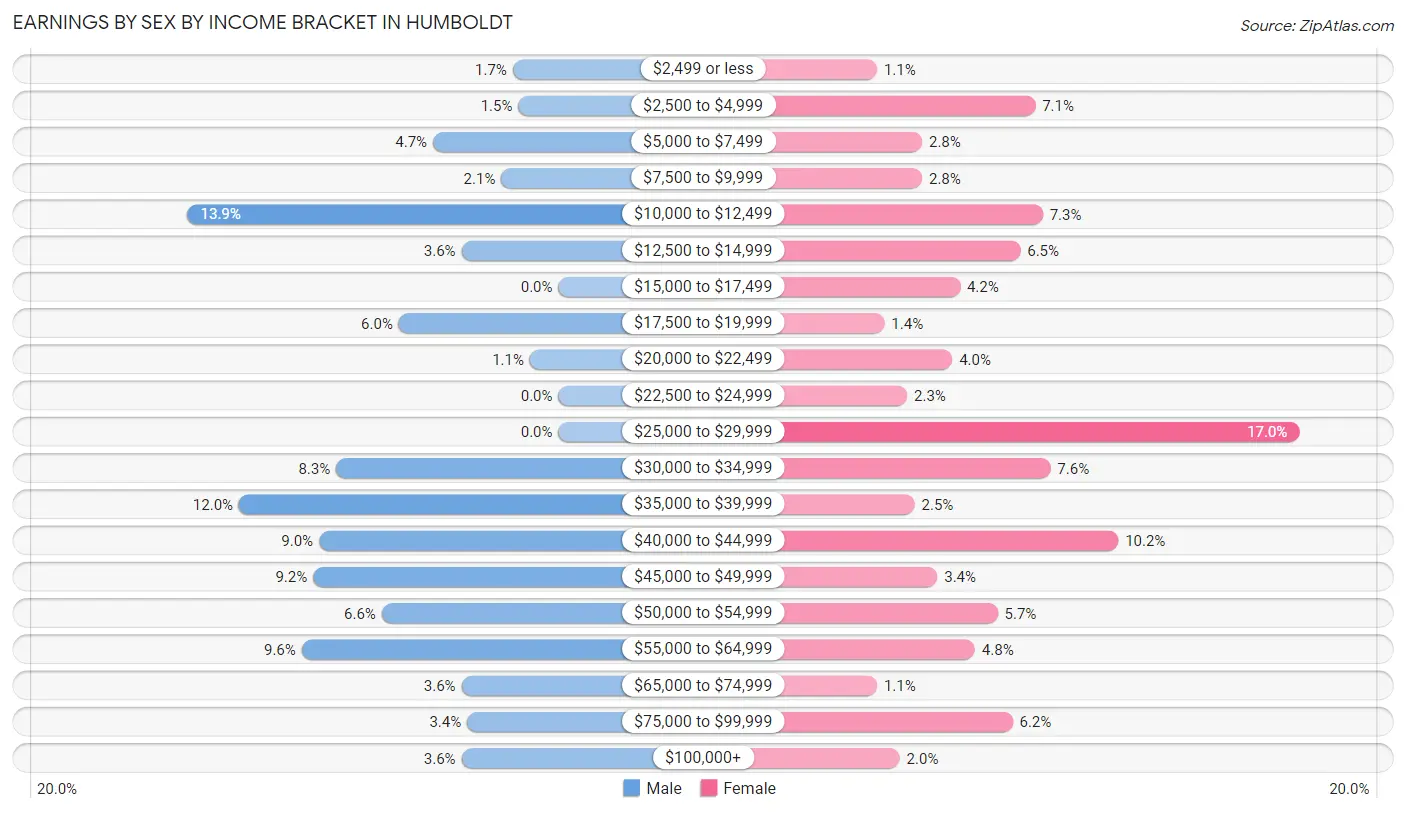
Earnings by Sex by Income Bracket in Humboldt
The most common earnings brackets in Humboldt are $10,000 to $12,499 for men (65 | 13.9%) and $25,000 to $29,999 for women (60 | 17.0%).
| Income | Male | Female |
| $2,499 or less | 8 (1.7%) | 4 (1.1%) |
| $2,500 to $4,999 | 7 (1.5%) | 25 (7.1%) |
| $5,000 to $7,499 | 22 (4.7%) | 10 (2.8%) |
| $7,500 to $9,999 | 10 (2.1%) | 10 (2.8%) |
| $10,000 to $12,499 | 65 (13.9%) | 26 (7.3%) |
| $12,500 to $14,999 | 17 (3.6%) | 23 (6.5%) |
| $15,000 to $17,499 | 0 (0.0%) | 15 (4.2%) |
| $17,500 to $19,999 | 28 (6.0%) | 5 (1.4%) |
| $20,000 to $22,499 | 5 (1.1%) | 14 (4.0%) |
| $22,500 to $24,999 | 0 (0.0%) | 8 (2.3%) |
| $25,000 to $29,999 | 0 (0.0%) | 60 (17.0%) |
| $30,000 to $34,999 | 39 (8.3%) | 27 (7.6%) |
| $35,000 to $39,999 | 56 (12.0%) | 9 (2.5%) |
| $40,000 to $44,999 | 42 (9.0%) | 36 (10.2%) |
| $45,000 to $49,999 | 43 (9.2%) | 12 (3.4%) |
| $50,000 to $54,999 | 31 (6.6%) | 20 (5.7%) |
| $55,000 to $64,999 | 45 (9.6%) | 17 (4.8%) |
| $65,000 to $74,999 | 17 (3.6%) | 4 (1.1%) |
| $75,000 to $99,999 | 16 (3.4%) | 22 (6.2%) |
| $100,000+ | 17 (3.6%) | 7 (2.0%) |
| Total | 468 (100.0%) | 354 (100.0%) |
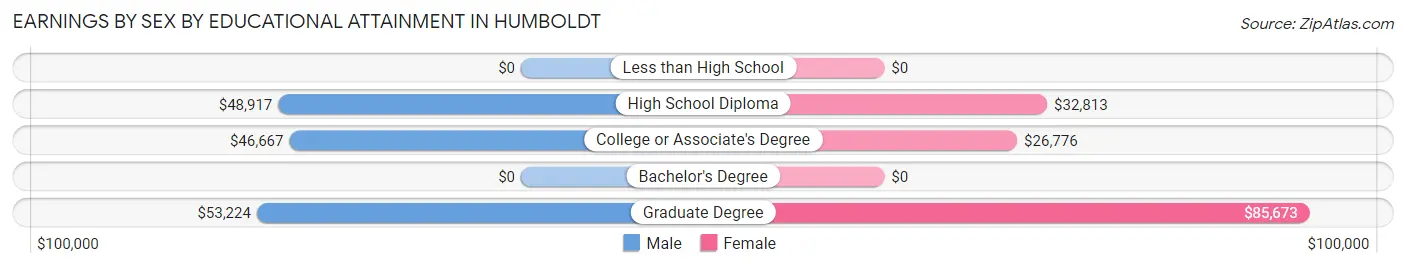
Earnings by Sex by Educational Attainment in Humboldt
Average earnings in Humboldt are $45,313 for men and $27,375 for women, a difference of 39.6%. Men with an educational attainment of graduate degree enjoy the highest average annual earnings of $53,224, while those with college or associate's degree education earn the least with $46,667. Women with an educational attainment of graduate degree earn the most with the average annual earnings of $85,673, while those with college or associate's degree education have the smallest earnings of $26,776.
| Educational Attainment | Male Income | Female Income |
| Less than High School | - | - |
| High School Diploma | $48,917 | $32,813 |
| College or Associate's Degree | $46,667 | $26,776 |
| Bachelor's Degree | - | - |
| Graduate Degree | $53,224 | $85,673 |
| Total | $45,313 | $27,375 |
Family Income in Humboldt
Family Income Brackets in Humboldt
According to the Humboldt family income data, there are 90 families falling into the $100,000 to $149,999 income range, which is the most common income bracket and makes up 17.8% of all families.
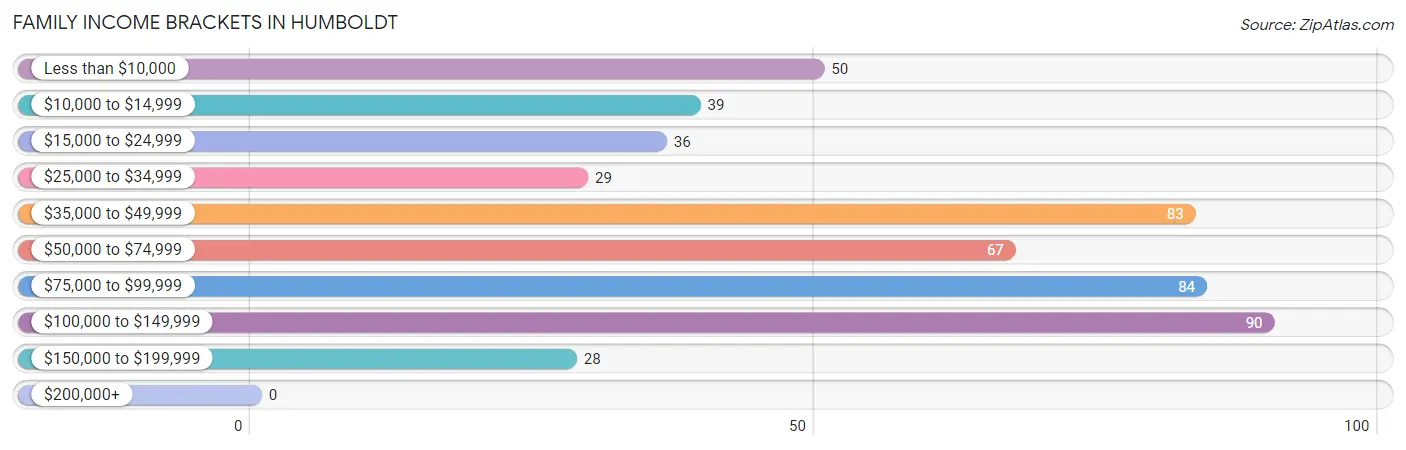
| Income Bracket | # Families | % Families |
| Less than $10,000 | 50 | 9.9% |
| $10,000 to $14,999 | 39 | 7.7% |
| $15,000 to $24,999 | 36 | 7.1% |
| $25,000 to $34,999 | 29 | 5.7% |
| $35,000 to $49,999 | 83 | 16.4% |
| $50,000 to $74,999 | 67 | 13.2% |
| $75,000 to $99,999 | 84 | 16.6% |
| $100,000 to $149,999 | 90 | 17.8% |
| $150,000 to $199,999 | 28 | 5.5% |
| $200,000+ | 0 | 0.0% |
Family Income by Famaliy Size in Humboldt
2-person families (321 | 63.4%) account for the highest median family income in Humboldt with $70,208 per family, while 2-person families (321 | 63.4%) have the highest median income of $35,104 per family member.
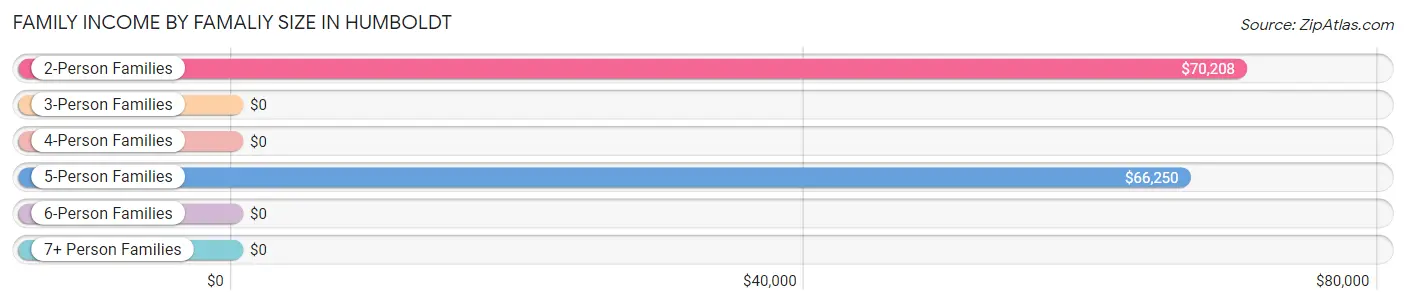
| Income Bracket | # Families | Median Income |
| 2-Person Families | 321 (63.4%) | $70,208 |
| 3-Person Families | 106 (20.9%) | $0 |
| 4-Person Families | 37 (7.3%) | $0 |
| 5-Person Families | 34 (6.7%) | $66,250 |
| 6-Person Families | 8 (1.6%) | $0 |
| 7+ Person Families | 0 (0.0%) | $0 |
| Total | 506 (100.0%) | $53,654 |
Family Income by Number of Earners in Humboldt
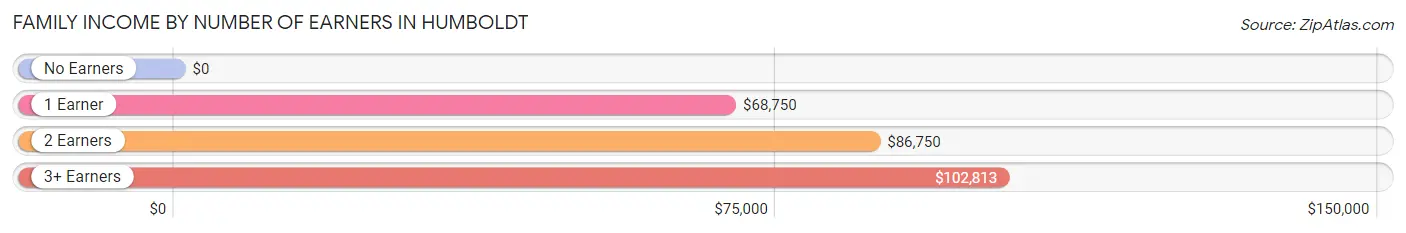
| Number of Earners | # Families | Median Income |
| No Earners | 172 (34.0%) | $0 |
| 1 Earner | 142 (28.1%) | $68,750 |
| 2 Earners | 175 (34.6%) | $86,750 |
| 3+ Earners | 17 (3.4%) | $102,813 |
| Total | 506 (100.0%) | $53,654 |
Household Income in Humboldt
Household Income Brackets in Humboldt
With 128 households falling in the category, the $35,000 to $49,999 income range is the most frequent in Humboldt, accounting for 16.7% of all households. In contrast, only 4 households (0.5%) fall into the $200,000+ income bracket, making it the least populous group.
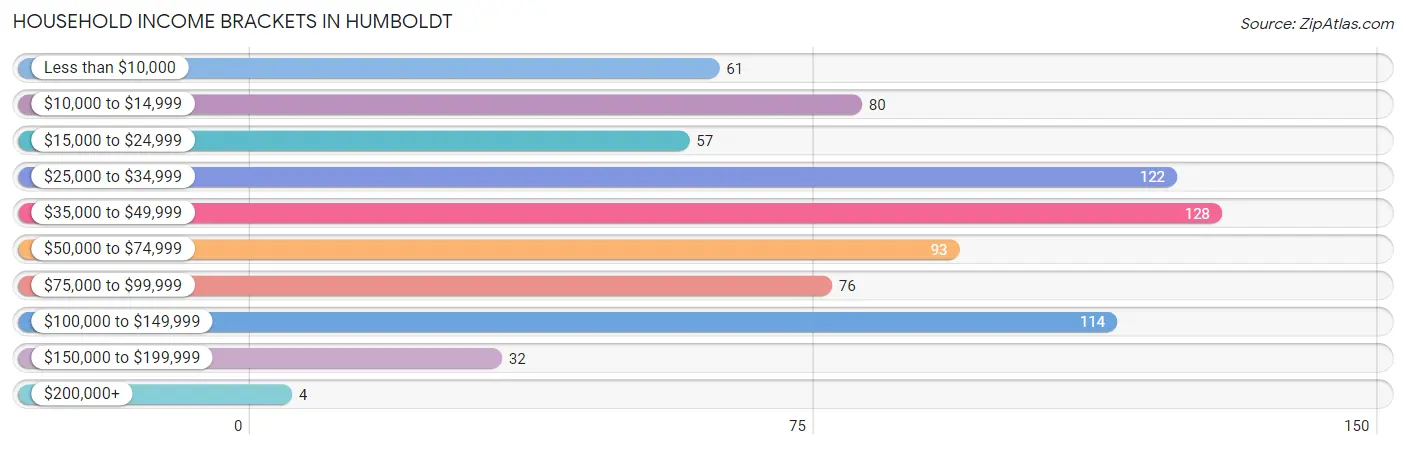
| Income Bracket | # Households | % Households |
| Less than $10,000 | 61 | 8.0% |
| $10,000 to $14,999 | 80 | 10.4% |
| $15,000 to $24,999 | 57 | 7.4% |
| $25,000 to $34,999 | 122 | 15.9% |
| $35,000 to $49,999 | 128 | 16.7% |
| $50,000 to $74,999 | 93 | 12.1% |
| $75,000 to $99,999 | 76 | 9.9% |
| $100,000 to $149,999 | 114 | 14.9% |
| $150,000 to $199,999 | 32 | 4.2% |
| $200,000+ | 4 | 0.5% |
Household Income by Householder Age in Humboldt
The median household income in Humboldt is $43,144, with the highest median household income of $51,250 found in the 25 to 44 years age bracket for the primary householder. A total of 154 households (20.1%) fall into this category. Meanwhile, the 15 to 24 years age bracket for the primary householder has the lowest median household income of $0, with 35 households (4.6%) in this group.
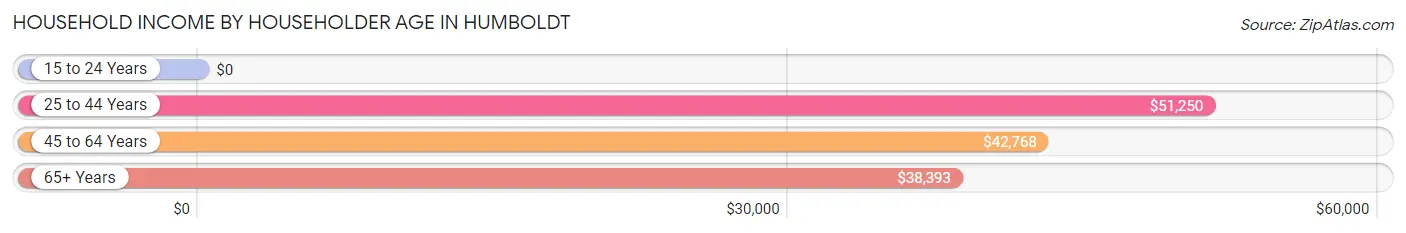
| Income Bracket | # Households | Median Income |
| 15 to 24 Years | 35 (4.6%) | $0 |
| 25 to 44 Years | 154 (20.1%) | $51,250 |
| 45 to 64 Years | 311 (40.6%) | $42,768 |
| 65+ Years | 267 (34.8%) | $38,393 |
| Total | 767 (100.0%) | $43,144 |
Poverty in Humboldt
Income Below Poverty by Sex and Age in Humboldt
With 20.3% poverty level for males and 30.6% for females among the residents of Humboldt, under 5 year old males and 15 year old females are the most vulnerable to poverty, with 90 males (69.2%) and 45 females (86.5%) in their respective age groups living below the poverty level.
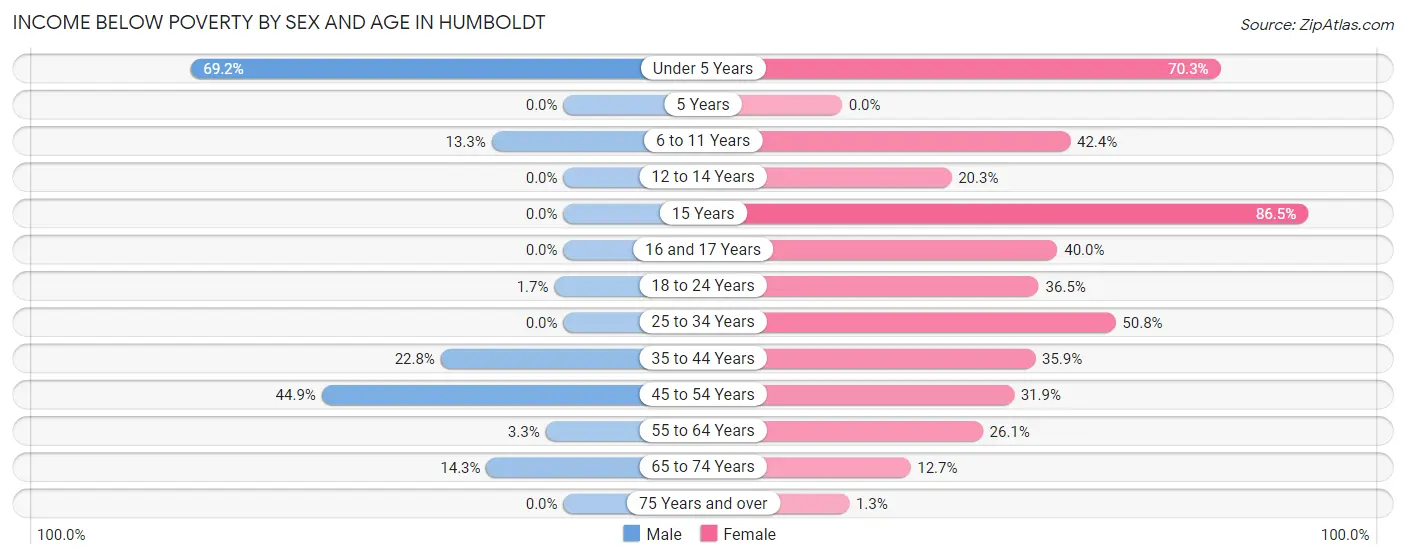
| Age Bracket | Male | Female |
| Under 5 Years | 90 (69.2%) | 26 (70.3%) |
| 5 Years | 0 (0.0%) | 0 (0.0%) |
| 6 to 11 Years | 2 (13.3%) | 25 (42.4%) |
| 12 to 14 Years | 0 (0.0%) | 13 (20.3%) |
| 15 Years | 0 (0.0%) | 45 (86.5%) |
| 16 and 17 Years | 0 (0.0%) | 4 (40.0%) |
| 18 to 24 Years | 2 (1.7%) | 19 (36.5%) |
| 25 to 34 Years | 0 (0.0%) | 32 (50.8%) |
| 35 to 44 Years | 23 (22.8%) | 33 (35.9%) |
| 45 to 54 Years | 48 (44.9%) | 45 (31.9%) |
| 55 to 64 Years | 6 (3.3%) | 46 (26.1%) |
| 65 to 74 Years | 11 (14.3%) | 23 (12.7%) |
| 75 Years and over | 0 (0.0%) | 1 (1.3%) |
| Total | 182 (20.3%) | 312 (30.6%) |
Income Above Poverty by Sex and Age in Humboldt
According to the poverty statistics in Humboldt, males aged 12 to 14 years and females aged 5 years are the age groups that are most secure financially, with 100.0% of males and 100.0% of females in these age groups living above the poverty line.
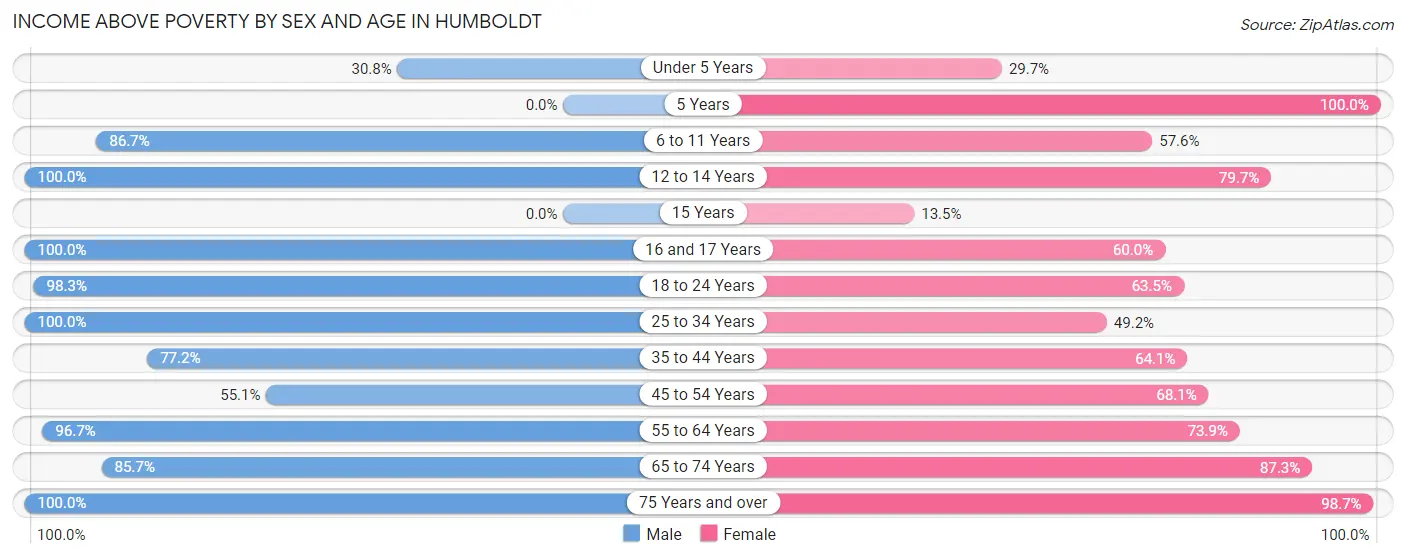
| Age Bracket | Male | Female |
| Under 5 Years | 40 (30.8%) | 11 (29.7%) |
| 5 Years | 0 (0.0%) | 16 (100.0%) |
| 6 to 11 Years | 13 (86.7%) | 34 (57.6%) |
| 12 to 14 Years | 4 (100.0%) | 51 (79.7%) |
| 15 Years | 0 (0.0%) | 7 (13.5%) |
| 16 and 17 Years | 25 (100.0%) | 6 (60.0%) |
| 18 to 24 Years | 117 (98.3%) | 33 (63.5%) |
| 25 to 34 Years | 61 (100.0%) | 31 (49.2%) |
| 35 to 44 Years | 78 (77.2%) | 59 (64.1%) |
| 45 to 54 Years | 59 (55.1%) | 96 (68.1%) |
| 55 to 64 Years | 175 (96.7%) | 130 (73.9%) |
| 65 to 74 Years | 66 (85.7%) | 158 (87.3%) |
| 75 Years and over | 75 (100.0%) | 74 (98.7%) |
| Total | 713 (79.7%) | 706 (69.4%) |
Income Below Poverty Among Married-Couple Families in Humboldt
The poverty statistics for married-couple families in Humboldt show that 14.9% or 43 of the total 289 families live below the poverty line. Families with 1 or 2 children have the highest poverty rate of 20.6%, comprising of 13 families. On the other hand, families with 3 or 4 children have the lowest poverty rate of 0.0%, which includes 0 families.
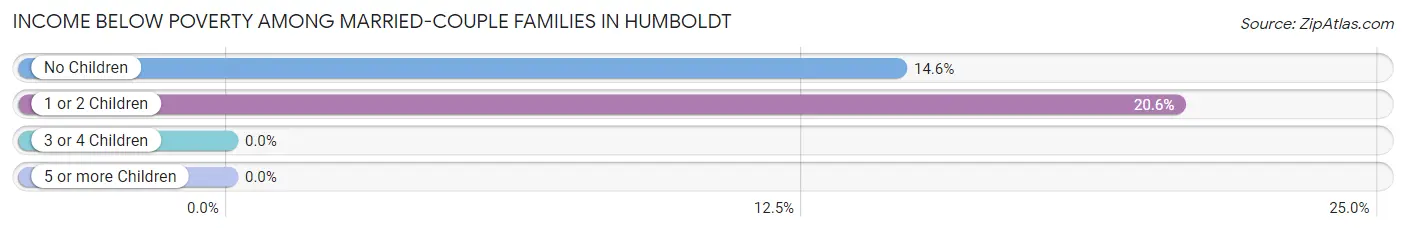
| Children | Above Poverty | Below Poverty |
| No Children | 176 (85.4%) | 30 (14.6%) |
| 1 or 2 Children | 50 (79.4%) | 13 (20.6%) |
| 3 or 4 Children | 20 (100.0%) | 0 (0.0%) |
| 5 or more Children | 0 (0.0%) | 0 (0.0%) |
| Total | 246 (85.1%) | 43 (14.9%) |
Income Below Poverty Among Single-Parent Households in Humboldt
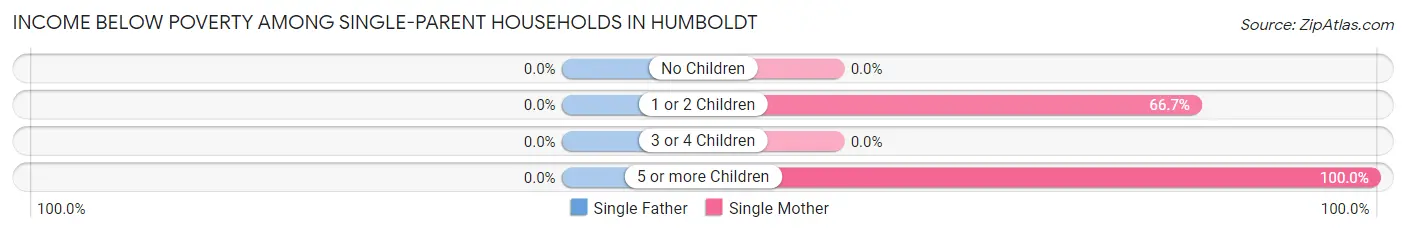
| Children | Single Father | Single Mother |
| No Children | 0 (0.0%) | 0 (0.0%) |
| 1 or 2 Children | 0 (0.0%) | 74 (66.7%) |
| 3 or 4 Children | 0 (0.0%) | 0 (0.0%) |
| 5 or more Children | 0 (0.0%) | 8 (100.0%) |
| Total | 0 (0.0%) | 82 (47.4%) |
Income Below Poverty Among Married-Couple vs Single-Parent Households in Humboldt
The poverty data for Humboldt shows that 43 of the married-couple family households (14.9%) and 82 of the single-parent households (37.8%) are living below the poverty level. Within the married-couple family households, those with 1 or 2 children have the highest poverty rate, with 13 households (20.6%) falling below the poverty line. Among the single-parent households, those with 5 or more children have the highest poverty rate, with 8 household (100.0%) living below poverty.
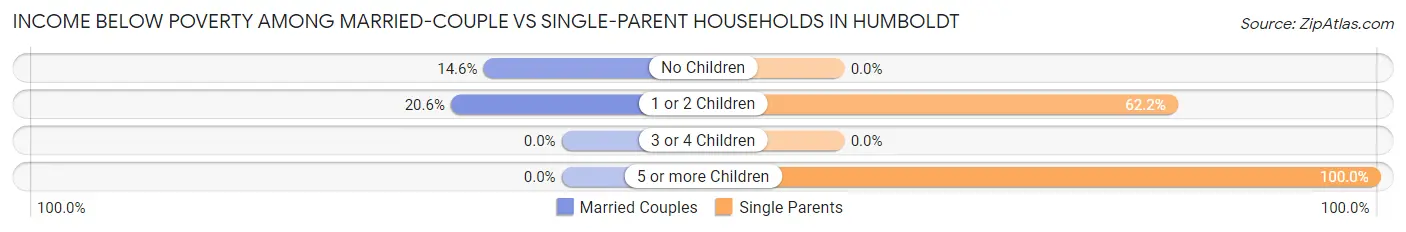
| Children | Married-Couple Families | Single-Parent Households |
| No Children | 30 (14.6%) | 0 (0.0%) |
| 1 or 2 Children | 13 (20.6%) | 74 (62.2%) |
| 3 or 4 Children | 0 (0.0%) | 0 (0.0%) |
| 5 or more Children | 0 (0.0%) | 8 (100.0%) |
| Total | 43 (14.9%) | 82 (37.8%) |
Race in Humboldt
The most populous races in Humboldt are White / Caucasian (1,830 | 94.3%), Hispanic or Latino (81 | 4.2%), and Asian (49 | 2.5%).
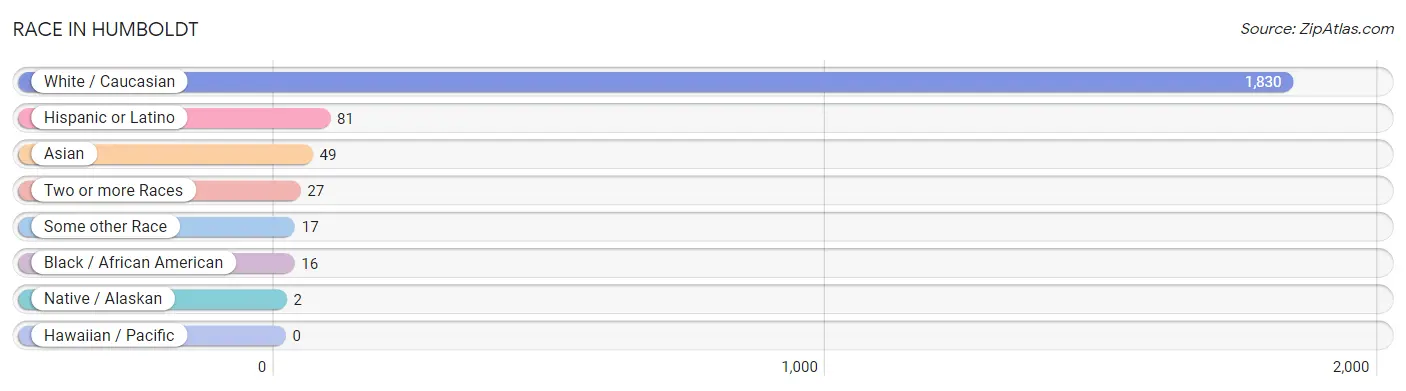
| Race | # Population | % Population |
| Asian | 49 | 2.5% |
| Black / African American | 16 | 0.8% |
| Hawaiian / Pacific | 0 | 0.0% |
| Hispanic or Latino | 81 | 4.2% |
| Native / Alaskan | 2 | 0.1% |
| White / Caucasian | 1,830 | 94.3% |
| Two or more Races | 27 | 1.4% |
| Some other Race | 17 | 0.9% |
| Total | 1,941 | 100.0% |
Ancestry in Humboldt
The most populous ancestries reported in Humboldt are German (592 | 30.5%), English (207 | 10.7%), Irish (168 | 8.7%), American (101 | 5.2%), and European (77 | 4.0%), together accounting for 59.0% of all Humboldt residents.
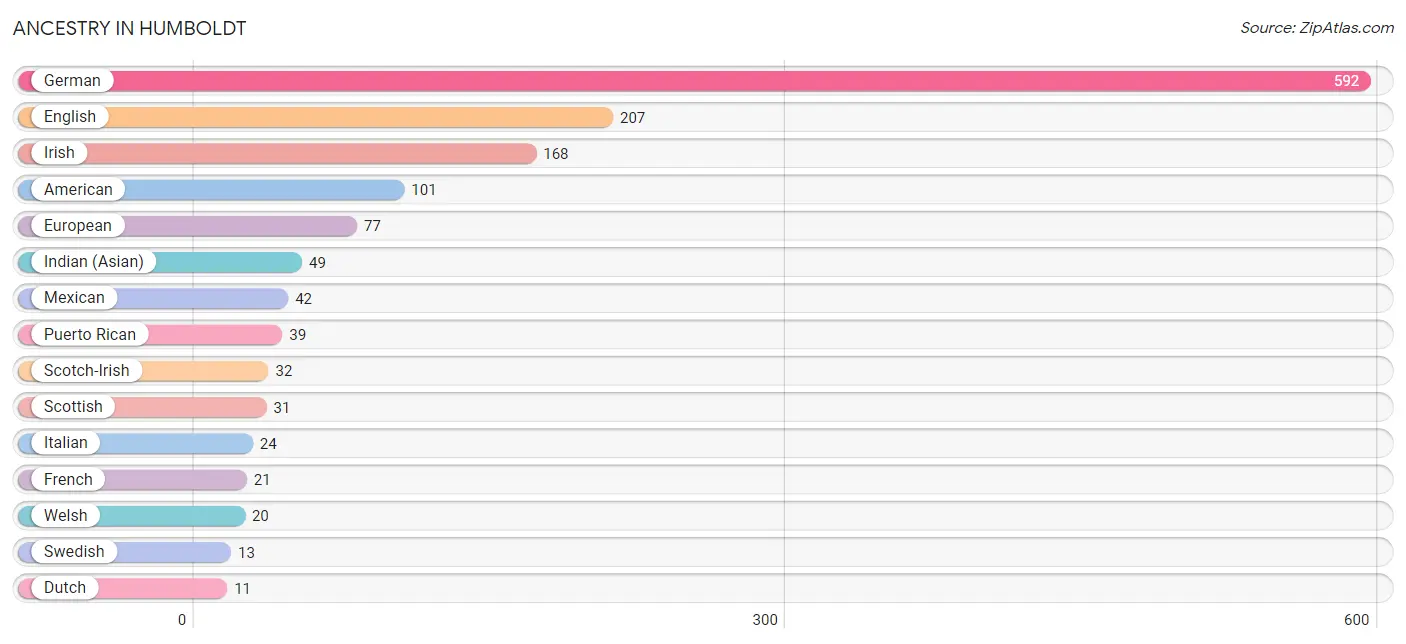
| Ancestry | # Population | % Population |
| American | 101 | 5.2% |
| Cherokee | 1 | 0.1% |
| Danish | 7 | 0.4% |
| Dutch | 11 | 0.6% |
| English | 207 | 10.7% |
| European | 77 | 4.0% |
| French | 21 | 1.1% |
| French Canadian | 4 | 0.2% |
| German | 592 | 30.5% |
| Indian (Asian) | 49 | 2.5% |
| Irish | 168 | 8.7% |
| Italian | 24 | 1.2% |
| Mexican | 42 | 2.2% |
| Norwegian | 5 | 0.3% |
| Polish | 8 | 0.4% |
| Puerto Rican | 39 | 2.0% |
| Russian | 5 | 0.3% |
| Scandinavian | 4 | 0.2% |
| Scotch-Irish | 32 | 1.7% |
| Scottish | 31 | 1.6% |
| Serbian | 4 | 0.2% |
| Swedish | 13 | 0.7% |
| Welsh | 20 | 1.0% | View All 23 Rows |
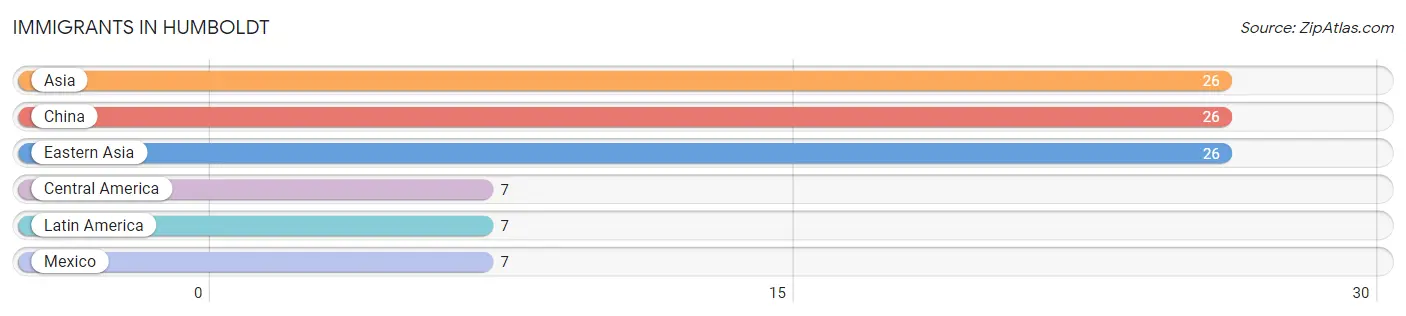
Immigrants in Humboldt
The most numerous immigrant groups reported in Humboldt came from Asia (26 | 1.3%), China (26 | 1.3%), Eastern Asia (26 | 1.3%), Central America (7 | 0.4%), and Latin America (7 | 0.4%), together accounting for 4.7% of all Humboldt residents.
| Immigration Origin | # Population | % Population |
| Asia | 26 | 1.3% |
| Central America | 7 | 0.4% |
| China | 26 | 1.3% |
| Eastern Asia | 26 | 1.3% |
| Latin America | 7 | 0.4% |
| Mexico | 7 | 0.4% | View All 6 Rows |
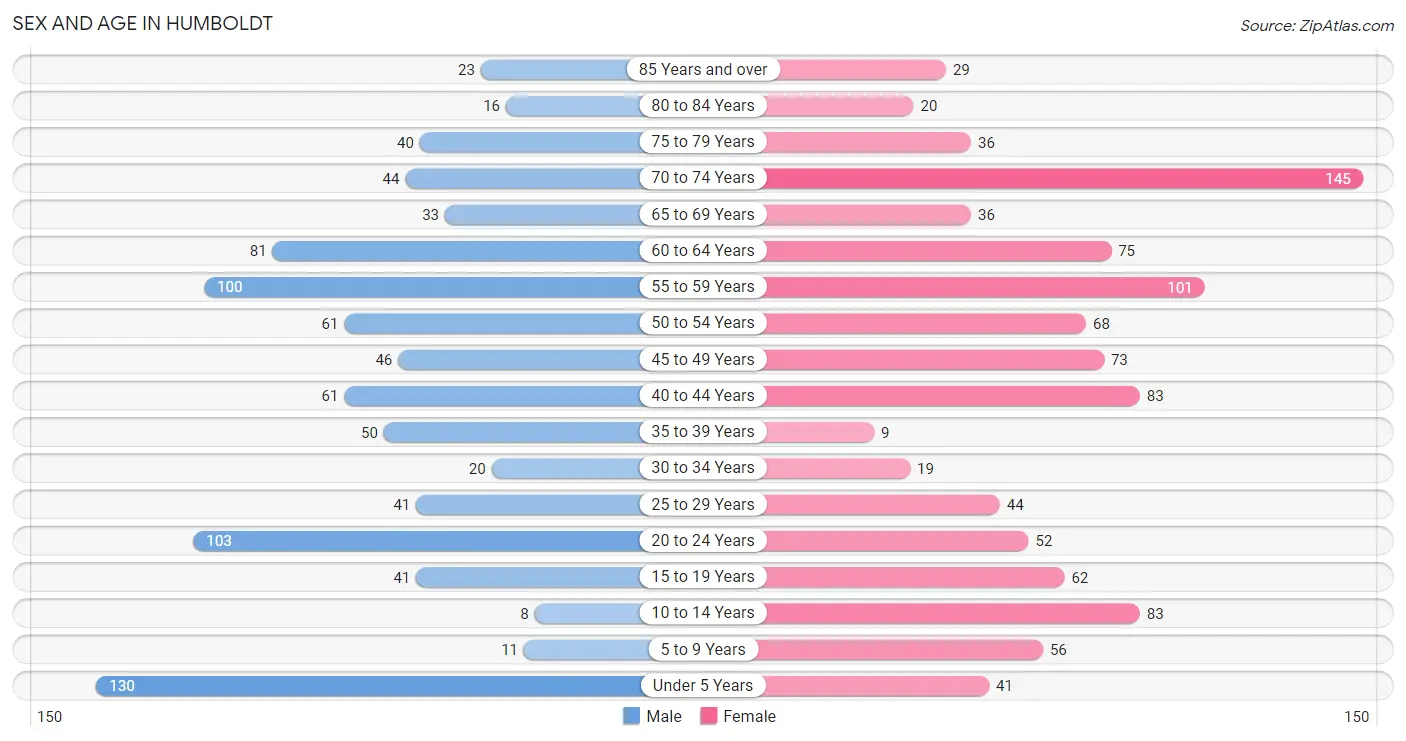
Sex and Age in Humboldt
Sex and Age in Humboldt
The most populous age groups in Humboldt are Under 5 Years (130 | 14.3%) for men and 70 to 74 Years (145 | 14.1%) for women.
| Age Bracket | Male | Female |
| Under 5 Years | 130 (14.3%) | 41 (4.0%) |
| 5 to 9 Years | 11 (1.2%) | 56 (5.4%) |
| 10 to 14 Years | 8 (0.9%) | 83 (8.0%) |
| 15 to 19 Years | 41 (4.5%) | 62 (6.0%) |
| 20 to 24 Years | 103 (11.3%) | 52 (5.0%) |
| 25 to 29 Years | 41 (4.5%) | 44 (4.3%) |
| 30 to 34 Years | 20 (2.2%) | 19 (1.8%) |
| 35 to 39 Years | 50 (5.5%) | 9 (0.9%) |
| 40 to 44 Years | 61 (6.7%) | 83 (8.0%) |
| 45 to 49 Years | 46 (5.1%) | 73 (7.1%) |
| 50 to 54 Years | 61 (6.7%) | 68 (6.6%) |
| 55 to 59 Years | 100 (11.0%) | 101 (9.8%) |
| 60 to 64 Years | 81 (8.9%) | 75 (7.3%) |
| 65 to 69 Years | 33 (3.6%) | 36 (3.5%) |
| 70 to 74 Years | 44 (4.8%) | 145 (14.1%) |
| 75 to 79 Years | 40 (4.4%) | 36 (3.5%) |
| 80 to 84 Years | 16 (1.8%) | 20 (1.9%) |
| 85 Years and over | 23 (2.5%) | 29 (2.8%) |
| Total | 909 (100.0%) | 1,032 (100.0%) |
Families and Households in Humboldt
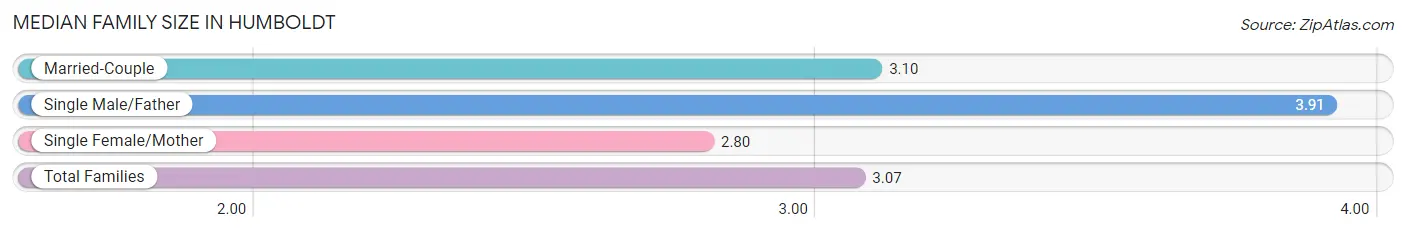
Median Family Size in Humboldt
The median family size in Humboldt is 3.07 persons per family, with single male/father families (44 | 8.7%) accounting for the largest median family size of 3.91 persons per family. On the other hand, single female/mother families (173 | 34.2%) represent the smallest median family size with 2.80 persons per family.
| Family Type | # Families | Family Size |
| Married-Couple | 289 (57.1%) | 3.10 |
| Single Male/Father | 44 (8.7%) | 3.91 |
| Single Female/Mother | 173 (34.2%) | 2.80 |
| Total Families | 506 (100.0%) | 3.07 |
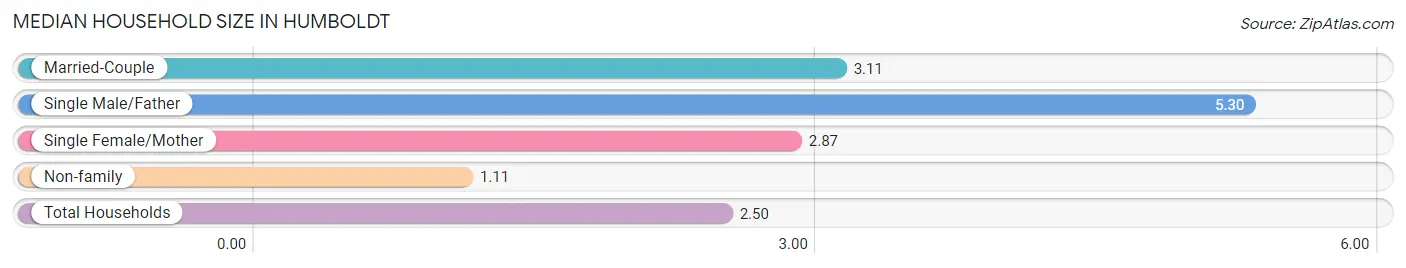
Median Household Size in Humboldt
The median household size in Humboldt is 2.50 persons per household, with single male/father households (44 | 5.7%) accounting for the largest median household size of 5.3 persons per household. non-family households (261 | 34.0%) represent the smallest median household size with 1.11 persons per household.
| Household Type | # Households | Household Size |
| Married-Couple | 289 (37.7%) | 3.11 |
| Single Male/Father | 44 (5.7%) | 5.30 |
| Single Female/Mother | 173 (22.6%) | 2.87 |
| Non-family | 261 (34.0%) | 1.11 |
| Total Households | 767 (100.0%) | 2.50 |
Household Size by Marriage Status in Humboldt
Out of a total of 767 households in Humboldt, 506 (66.0%) are family households, while 261 (34.0%) are nonfamily households. The most numerous type of family households are 2-person households, comprising 279, and the most common type of nonfamily households are 1-person households, comprising 243.
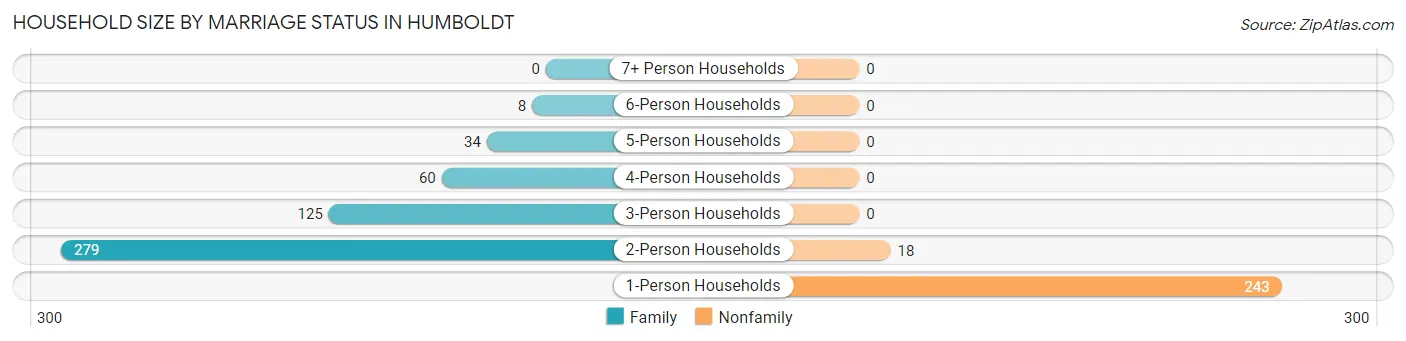
| Household Size | Family Households | Nonfamily Households |
| 1-Person Households | - | 243 (31.7%) |
| 2-Person Households | 279 (36.4%) | 18 (2.4%) |
| 3-Person Households | 125 (16.3%) | 0 (0.0%) |
| 4-Person Households | 60 (7.8%) | 0 (0.0%) |
| 5-Person Households | 34 (4.4%) | 0 (0.0%) |
| 6-Person Households | 8 (1.0%) | 0 (0.0%) |
| 7+ Person Households | 0 (0.0%) | 0 (0.0%) |
| Total | 506 (66.0%) | 261 (34.0%) |
Female Fertility in Humboldt
Fertility by Age in Humboldt
Average fertility rate in Humboldt is 103.0 births per 1,000 women. Women in the age bracket of 20 to 34 years have the highest fertility rate with 322.0 births per 1,000 women. Women in the age bracket of 20 to 34 years acount for 100.0% of all women with births.
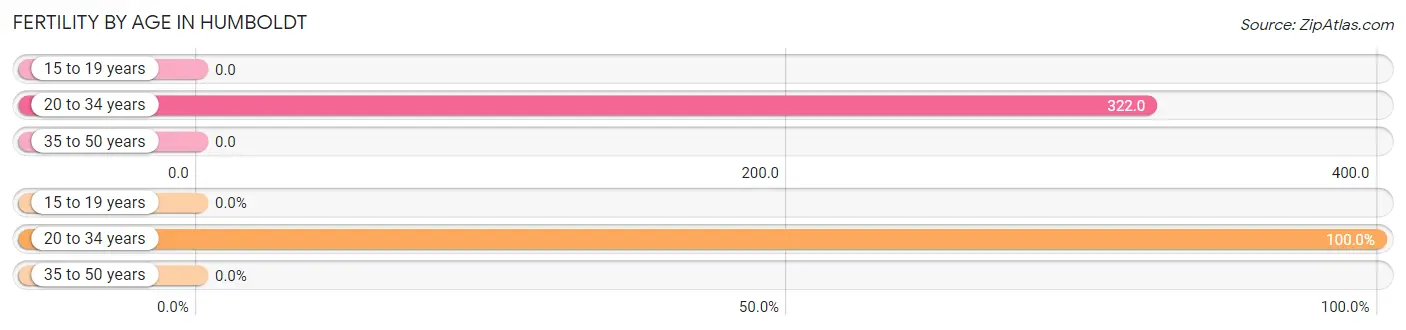
| Age Bracket | Women with Births | Births / 1,000 Women |
| 15 to 19 years | 0 (0.0%) | 0.0 |
| 20 to 34 years | 37 (100.0%) | 322.0 |
| 35 to 50 years | 0 (0.0%) | 0.0 |
| Total | 37 (100.0%) | 103.0 |
Fertility by Age by Marriage Status in Humboldt
35.1% of women with births (37) in Humboldt are married. The highest percentage of unmarried women with births falls into 20 to 34 years age bracket with 64.9% of them unmarried at the time of birth, while the lowest percentage of unmarried women with births belong to 20 to 34 years age bracket with 64.9% of them unmarried.
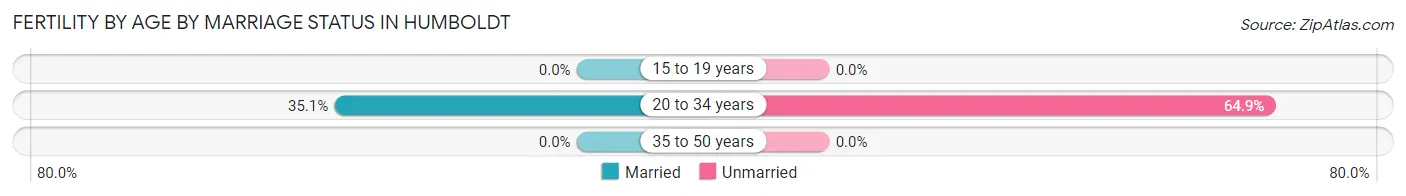
| Age Bracket | Married | Unmarried |
| 15 to 19 years | 0 (0.0%) | 0 (0.0%) |
| 20 to 34 years | 13 (35.1%) | 24 (64.9%) |
| 35 to 50 years | 0 (0.0%) | 0 (0.0%) |
| Total | 13 (35.1%) | 24 (64.9%) |
Fertility by Education in Humboldt
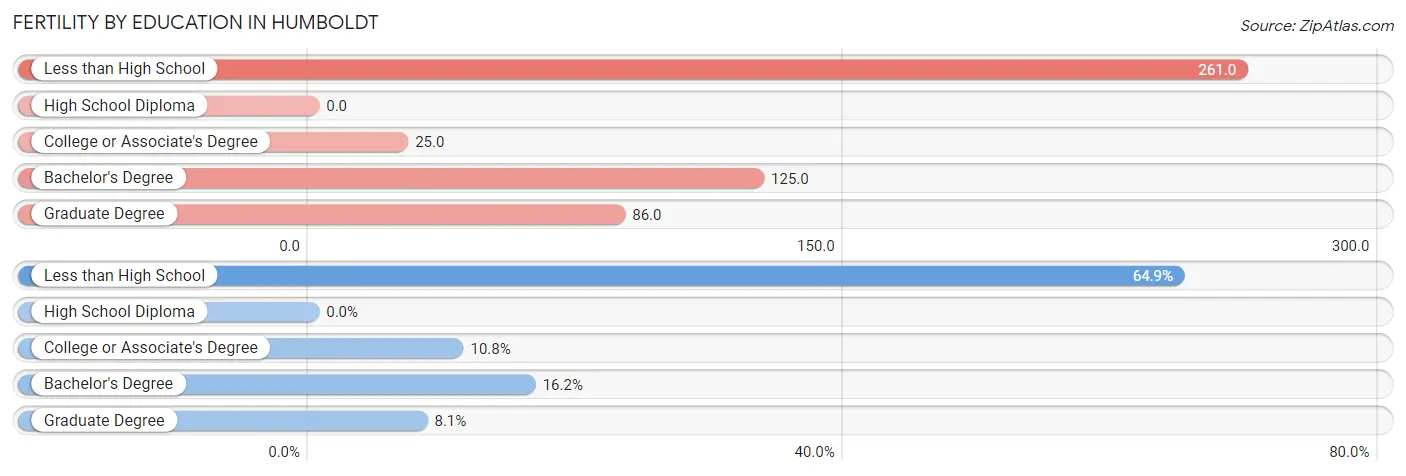
| Educational Attainment | Women with Births | Births / 1,000 Women |
| Less than High School | 24 (64.9%) | 261.0 |
| High School Diploma | 0 (0.0%) | 0.0 |
| College or Associate's Degree | 4 (10.8%) | 25.0 |
| Bachelor's Degree | 6 (16.2%) | 125.0 |
| Graduate Degree | 3 (8.1%) | 86.0 |
| Total | 37 (100.0%) | 103.0 |
Fertility by Education by Marriage Status in Humboldt
64.9% of women with births in Humboldt are unmarried. Women with the educational attainment of college or associate's degree are most likely to be married with 100.0% of them married at childbirth, while women with the educational attainment of less than high school are least likely to be married with 100.0% of them unmarried at childbirth.
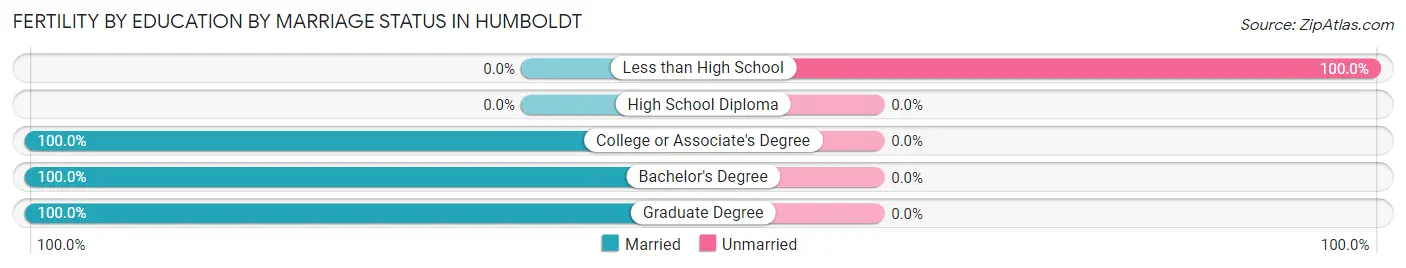
| Educational Attainment | Married | Unmarried |
| Less than High School | 0 (0.0%) | 24 (100.0%) |
| High School Diploma | 0 (0.0%) | 0 (0.0%) |
| College or Associate's Degree | 4 (100.0%) | 0 (0.0%) |
| Bachelor's Degree | 6 (100.0%) | 0 (0.0%) |
| Graduate Degree | 3 (100.0%) | 0 (0.0%) |
| Total | 13 (35.1%) | 24 (64.9%) |
Employment Characteristics in Humboldt
Employment by Class of Employer in Humboldt
Among the 755 employed individuals in Humboldt, private company employees (520 | 68.9%), self-employed (not incorporated) (81 | 10.7%), and not-for-profit organizations (50 | 6.6%) make up the most common classes of employment.
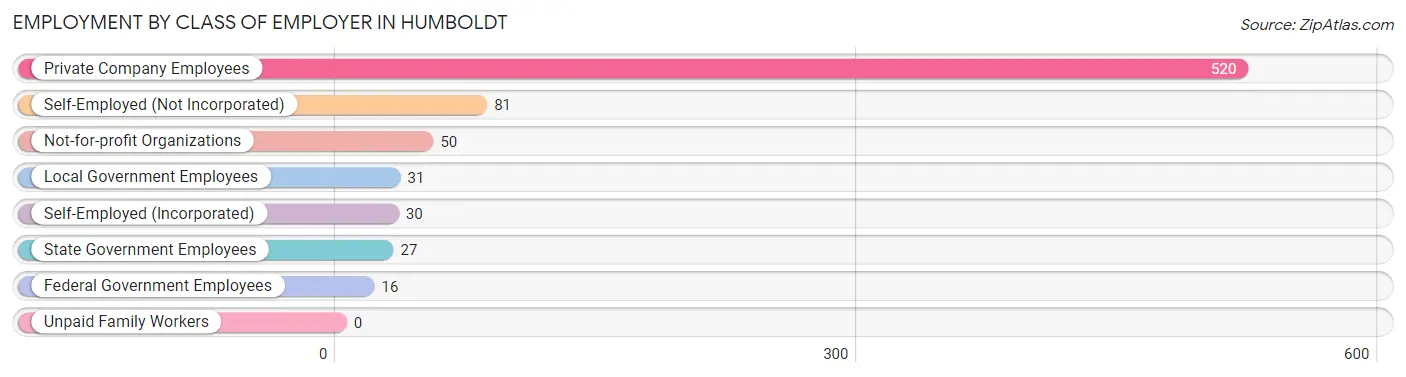
| Employer Class | # Employees | % Employees |
| Private Company Employees | 520 | 68.9% |
| Self-Employed (Incorporated) | 30 | 4.0% |
| Self-Employed (Not Incorporated) | 81 | 10.7% |
| Not-for-profit Organizations | 50 | 6.6% |
| Local Government Employees | 31 | 4.1% |
| State Government Employees | 27 | 3.6% |
| Federal Government Employees | 16 | 2.1% |
| Unpaid Family Workers | 0 | 0.0% |
| Total | 755 | 100.0% |
Employment Status by Age in Humboldt
According to the labor force statistics for Humboldt, out of the total population over 16 years of age (1,560), 60.3% or 941 individuals are in the labor force, with 19.1% or 180 of them unemployed. The age group with the highest labor force participation rate is 55 to 59 years, with 98.0% or 197 individuals in the labor force. Within the labor force, the 55 to 59 years age range has the highest percentage of unemployed individuals, with 35.0% or 69 of them being unemployed.
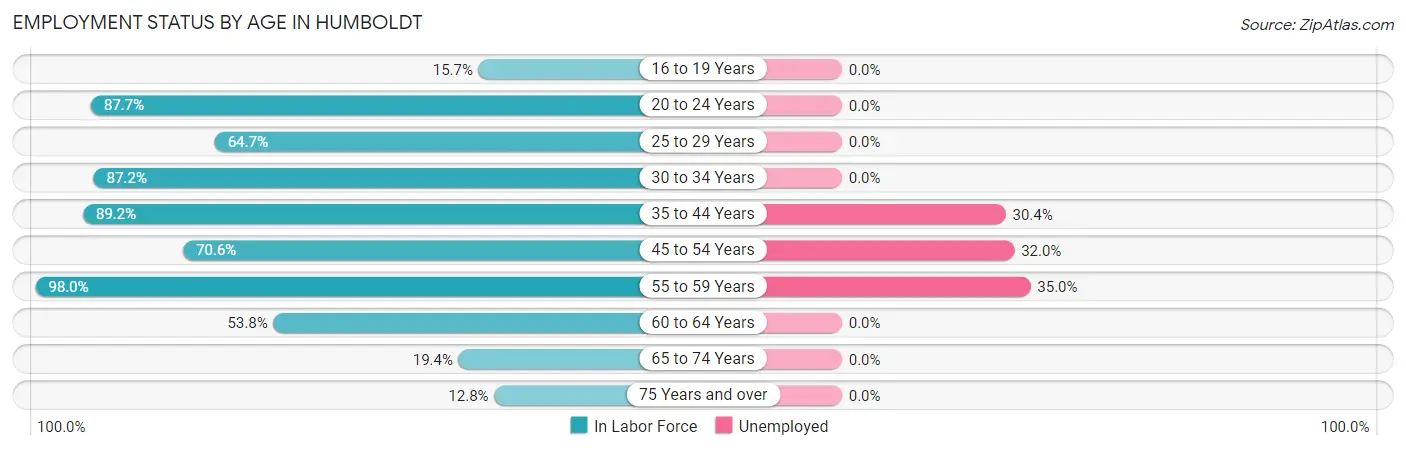
| Age Bracket | In Labor Force | Unemployed |
| 16 to 19 Years | 8 (15.7%) | 0 (0.0%) |
| 20 to 24 Years | 136 (87.7%) | 0 (0.0%) |
| 25 to 29 Years | 55 (64.7%) | 0 (0.0%) |
| 30 to 34 Years | 34 (87.2%) | 0 (0.0%) |
| 35 to 44 Years | 181 (89.2%) | 55 (30.4%) |
| 45 to 54 Years | 175 (70.6%) | 56 (32.0%) |
| 55 to 59 Years | 197 (98.0%) | 69 (35.0%) |
| 60 to 64 Years | 84 (53.8%) | 0 (0.0%) |
| 65 to 74 Years | 50 (19.4%) | 0 (0.0%) |
| 75 Years and over | 21 (12.8%) | 0 (0.0%) |
| Total | 941 (60.3%) | 180 (19.1%) |
Employment Status by Educational Attainment in Humboldt
According to labor force statistics for Humboldt, 77.9% of individuals (726) out of the total population between 25 and 64 years of age (932) are in the labor force, with 24.8% or 180 of them being unemployed. The group with the highest labor force participation rate are those with the educational attainment of college / associate degree, with 86.2% or 370 individuals in the labor force. Within the labor force, individuals with less than high school education have the highest percentage of unemployment, with 81.0% or 47 of them being unemployed.
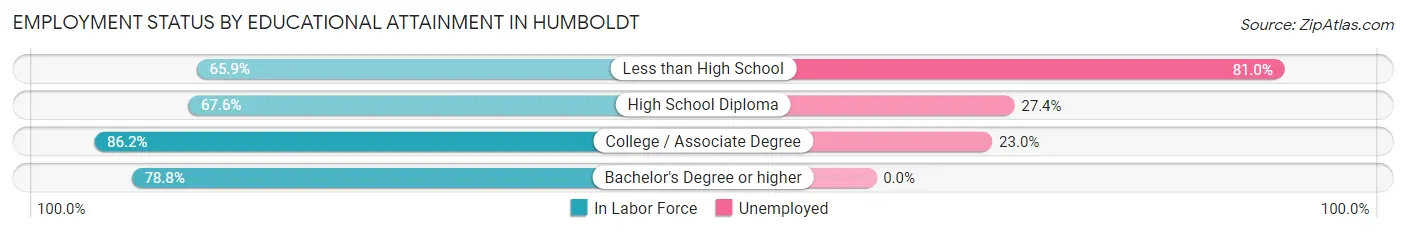
| Educational Attainment | In Labor Force | Unemployed |
| Less than High School | 58 (65.9%) | 71 (81.0%) |
| High School Diploma | 175 (67.6%) | 71 (27.4%) |
| College / Associate Degree | 370 (86.2%) | 99 (23.0%) |
| Bachelor's Degree or higher | 123 (78.8%) | 0 (0.0%) |
| Total | 726 (77.9%) | 231 (24.8%) |
Employment Occupations by Sex in Humboldt
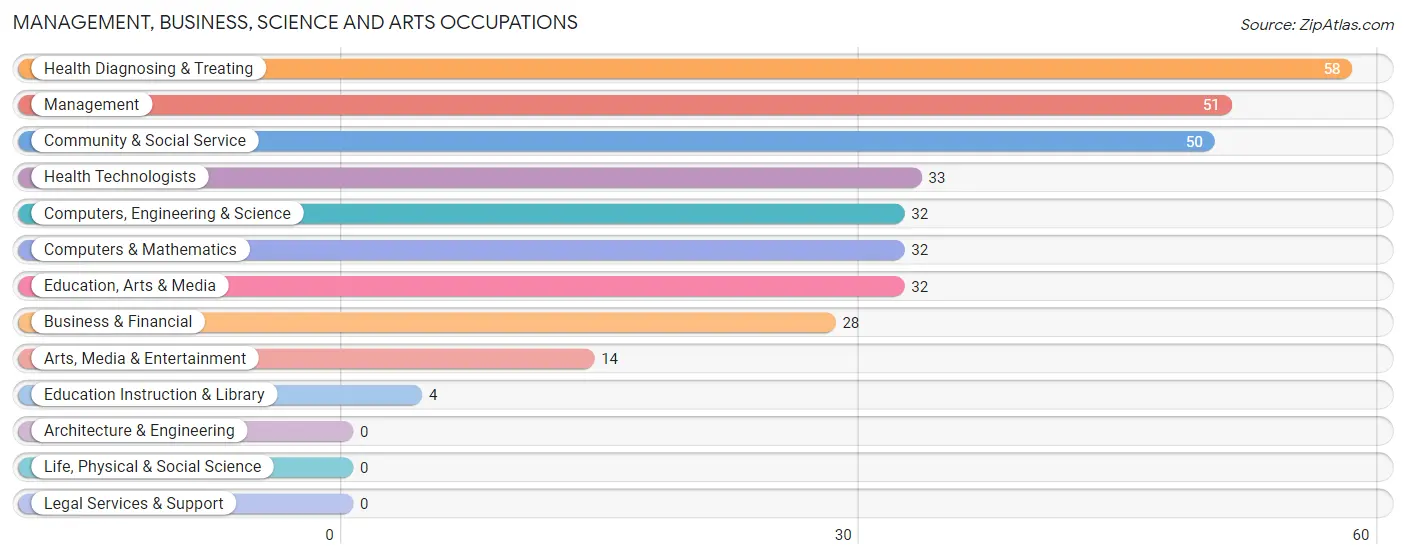
Management, Business, Science and Arts Occupations
The most common Management, Business, Science and Arts occupations in Humboldt are Health Diagnosing & Treating (58 | 7.6%), Management (51 | 6.7%), Community & Social Service (50 | 6.6%), Health Technologists (33 | 4.3%), and Computers, Engineering & Science (32 | 4.2%).
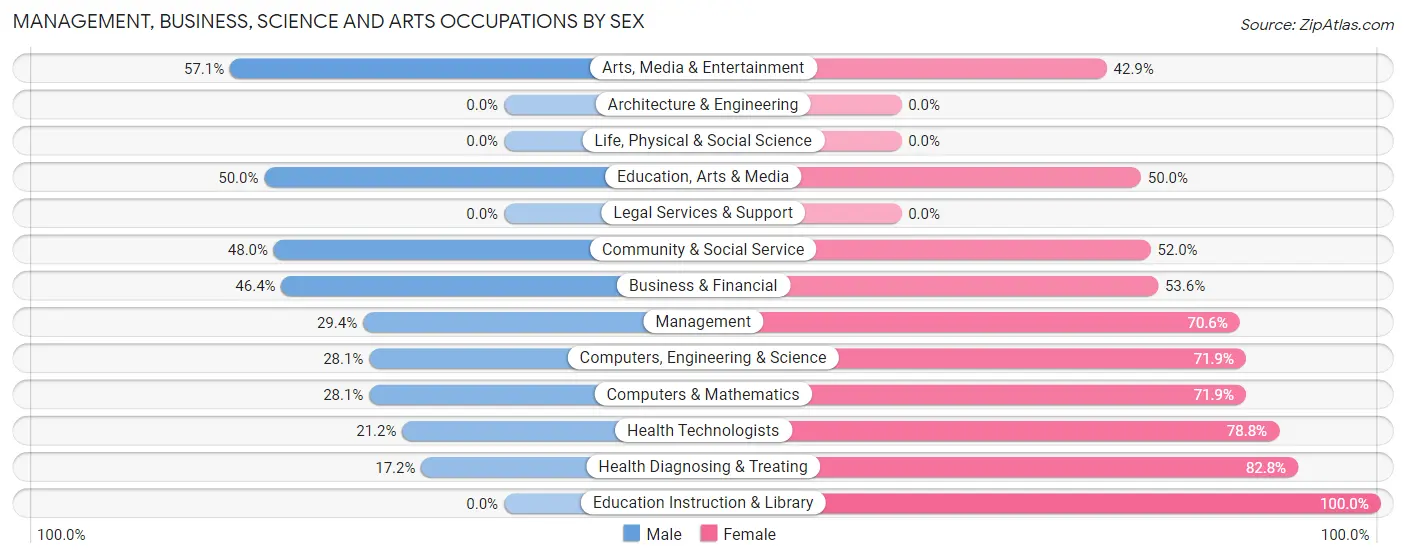
Management, Business, Science and Arts Occupations by Sex
Within the Management, Business, Science and Arts occupations in Humboldt, the most male-oriented occupations are Arts, Media & Entertainment (57.1%), Education, Arts & Media (50.0%), and Community & Social Service (48.0%), while the most female-oriented occupations are Education Instruction & Library (100.0%), Health Diagnosing & Treating (82.8%), and Health Technologists (78.8%).
| Occupation | Male | Female |
| Management | 15 (29.4%) | 36 (70.6%) |
| Business & Financial | 13 (46.4%) | 15 (53.6%) |
| Computers, Engineering & Science | 9 (28.1%) | 23 (71.9%) |
| Computers & Mathematics | 9 (28.1%) | 23 (71.9%) |
| Architecture & Engineering | 0 (0.0%) | 0 (0.0%) |
| Life, Physical & Social Science | 0 (0.0%) | 0 (0.0%) |
| Community & Social Service | 24 (48.0%) | 26 (52.0%) |
| Education, Arts & Media | 16 (50.0%) | 16 (50.0%) |
| Legal Services & Support | 0 (0.0%) | 0 (0.0%) |
| Education Instruction & Library | 0 (0.0%) | 4 (100.0%) |
| Arts, Media & Entertainment | 8 (57.1%) | 6 (42.9%) |
| Health Diagnosing & Treating | 10 (17.2%) | 48 (82.8%) |
| Health Technologists | 7 (21.2%) | 26 (78.8%) |
| Total (Category) | 71 (32.4%) | 148 (67.6%) |
| Total (Overall) | 418 (54.9%) | 343 (45.1%) |
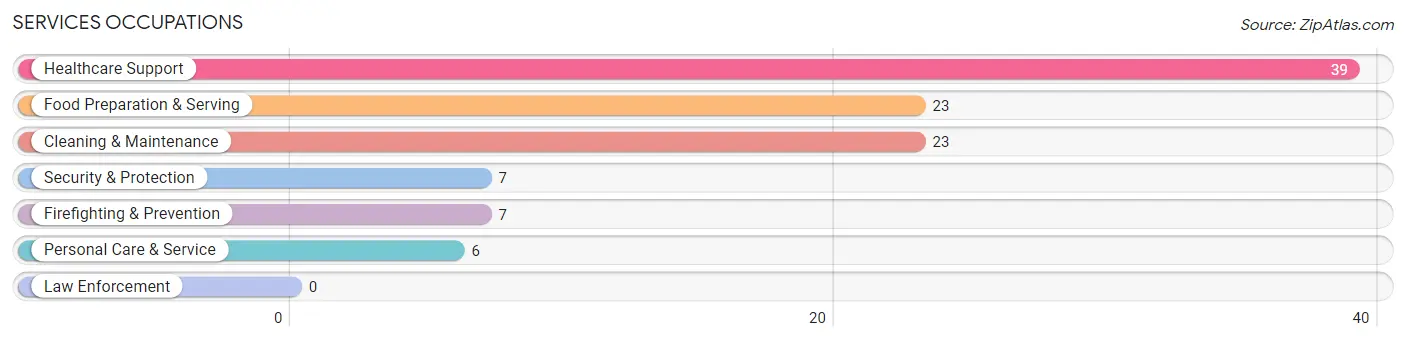
Services Occupations
The most common Services occupations in Humboldt are Healthcare Support (39 | 5.1%), Food Preparation & Serving (23 | 3.0%), Cleaning & Maintenance (23 | 3.0%), Security & Protection (7 | 0.9%), and Firefighting & Prevention (7 | 0.9%).
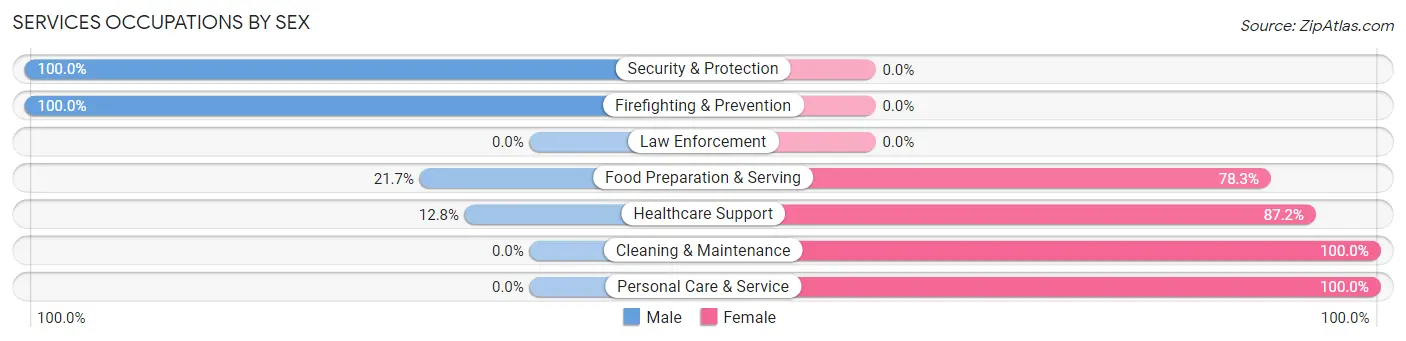
Services Occupations by Sex
Within the Services occupations in Humboldt, the most male-oriented occupations are Security & Protection (100.0%), Firefighting & Prevention (100.0%), and Food Preparation & Serving (21.7%), while the most female-oriented occupations are Cleaning & Maintenance (100.0%), Personal Care & Service (100.0%), and Healthcare Support (87.2%).
| Occupation | Male | Female |
| Healthcare Support | 5 (12.8%) | 34 (87.2%) |
| Security & Protection | 7 (100.0%) | 0 (0.0%) |
| Firefighting & Prevention | 7 (100.0%) | 0 (0.0%) |
| Law Enforcement | 0 (0.0%) | 0 (0.0%) |
| Food Preparation & Serving | 5 (21.7%) | 18 (78.3%) |
| Cleaning & Maintenance | 0 (0.0%) | 23 (100.0%) |
| Personal Care & Service | 0 (0.0%) | 6 (100.0%) |
| Total (Category) | 17 (17.3%) | 81 (82.7%) |
| Total (Overall) | 418 (54.9%) | 343 (45.1%) |
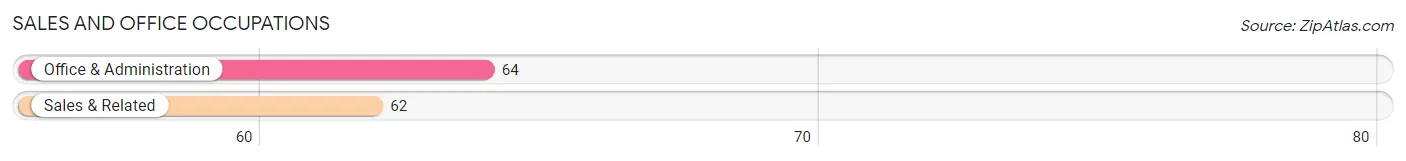
Sales and Office Occupations
The most common Sales and Office occupations in Humboldt are Office & Administration (64 | 8.4%), and Sales & Related (62 | 8.2%).
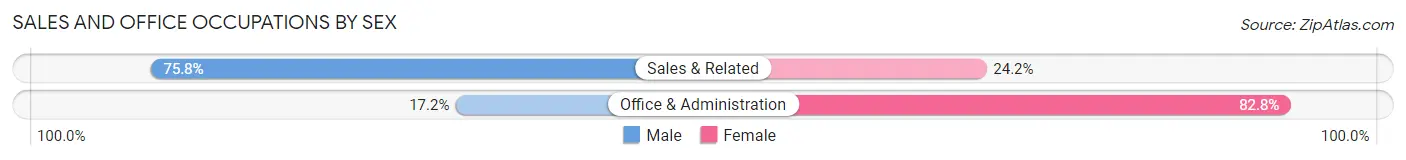
Sales and Office Occupations by Sex
| Occupation | Male | Female |
| Sales & Related | 47 (75.8%) | 15 (24.2%) |
| Office & Administration | 11 (17.2%) | 53 (82.8%) |
| Total (Category) | 58 (46.0%) | 68 (54.0%) |
| Total (Overall) | 418 (54.9%) | 343 (45.1%) |
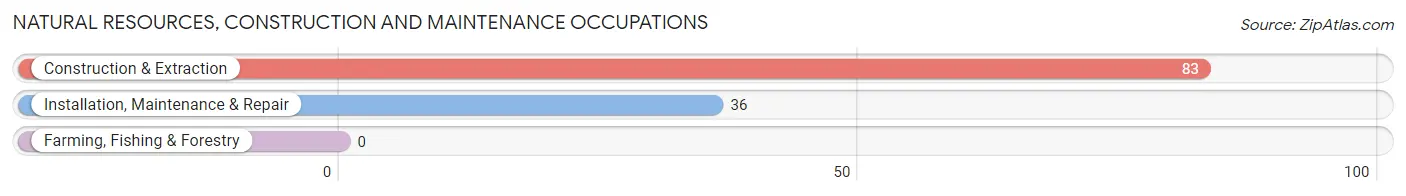
Natural Resources, Construction and Maintenance Occupations
The most common Natural Resources, Construction and Maintenance occupations in Humboldt are Construction & Extraction (83 | 10.9%), and Installation, Maintenance & Repair (36 | 4.7%).
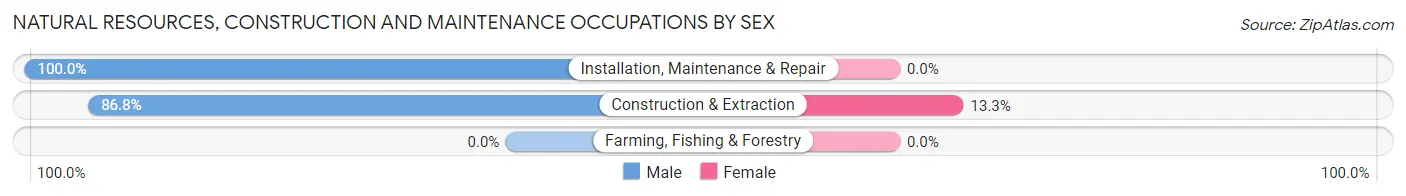
Natural Resources, Construction and Maintenance Occupations by Sex
| Occupation | Male | Female |
| Farming, Fishing & Forestry | 0 (0.0%) | 0 (0.0%) |
| Construction & Extraction | 72 (86.8%) | 11 (13.3%) |
| Installation, Maintenance & Repair | 36 (100.0%) | 0 (0.0%) |
| Total (Category) | 108 (90.8%) | 11 (9.2%) |
| Total (Overall) | 418 (54.9%) | 343 (45.1%) |
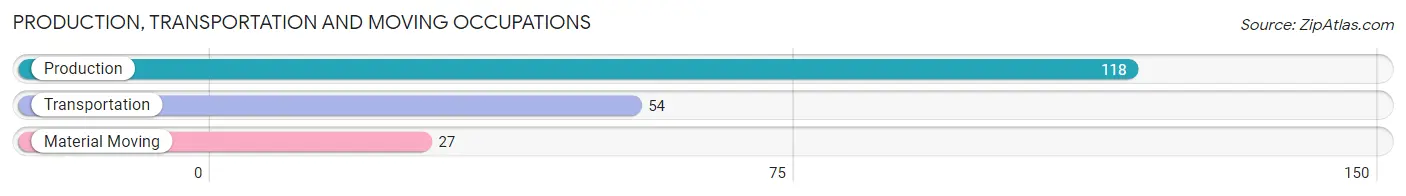
Production, Transportation and Moving Occupations
The most common Production, Transportation and Moving occupations in Humboldt are Production (118 | 15.5%), Transportation (54 | 7.1%), and Material Moving (27 | 3.5%).
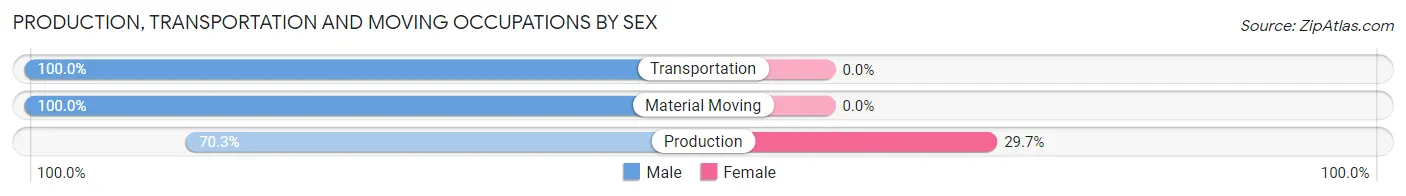
Production, Transportation and Moving Occupations by Sex
| Occupation | Male | Female |
| Production | 83 (70.3%) | 35 (29.7%) |
| Transportation | 54 (100.0%) | 0 (0.0%) |
| Material Moving | 27 (100.0%) | 0 (0.0%) |
| Total (Category) | 164 (82.4%) | 35 (17.6%) |
| Total (Overall) | 418 (54.9%) | 343 (45.1%) |
Employment Industries by Sex in Humboldt
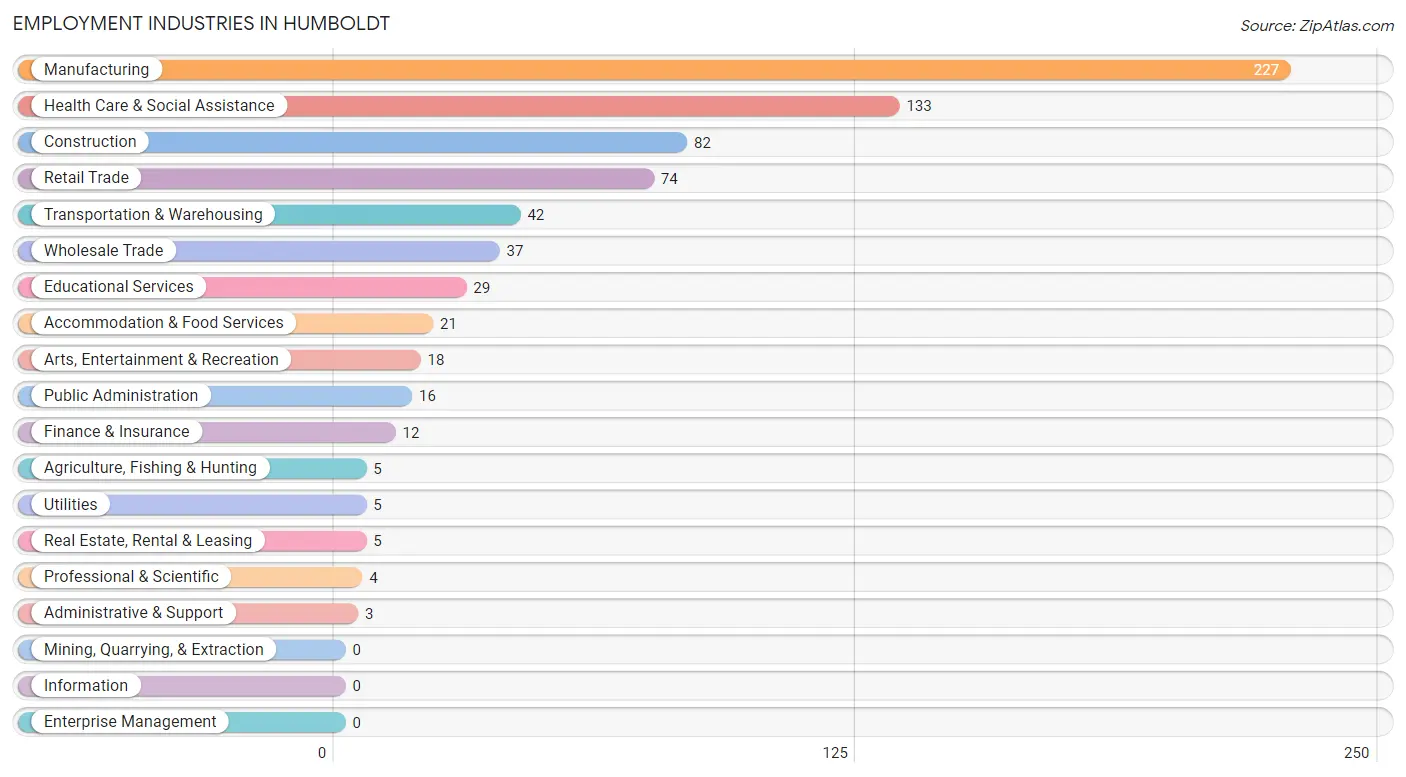
Employment Industries in Humboldt
The major employment industries in Humboldt include Manufacturing (227 | 29.8%), Health Care & Social Assistance (133 | 17.5%), Construction (82 | 10.8%), Retail Trade (74 | 9.7%), and Transportation & Warehousing (42 | 5.5%).
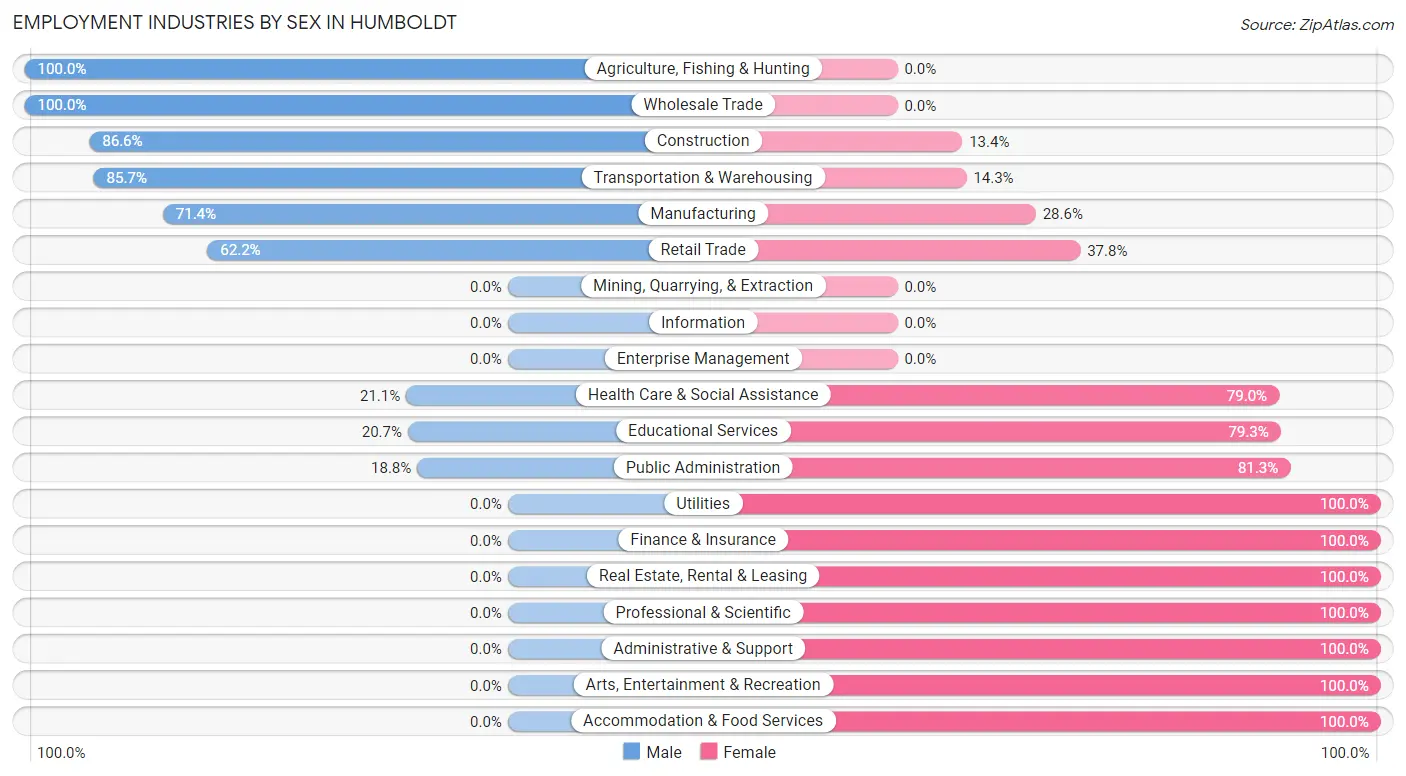
Employment Industries by Sex in Humboldt
The Humboldt industries that see more men than women are Agriculture, Fishing & Hunting (100.0%), Wholesale Trade (100.0%), and Construction (86.6%), whereas the industries that tend to have a higher number of women are Utilities (100.0%), Finance & Insurance (100.0%), and Real Estate, Rental & Leasing (100.0%).
| Industry | Male | Female |
| Agriculture, Fishing & Hunting | 5 (100.0%) | 0 (0.0%) |
| Mining, Quarrying, & Extraction | 0 (0.0%) | 0 (0.0%) |
| Construction | 71 (86.6%) | 11 (13.4%) |
| Manufacturing | 162 (71.4%) | 65 (28.6%) |
| Wholesale Trade | 37 (100.0%) | 0 (0.0%) |
| Retail Trade | 46 (62.2%) | 28 (37.8%) |
| Transportation & Warehousing | 36 (85.7%) | 6 (14.3%) |
| Utilities | 0 (0.0%) | 5 (100.0%) |
| Information | 0 (0.0%) | 0 (0.0%) |
| Finance & Insurance | 0 (0.0%) | 12 (100.0%) |
| Real Estate, Rental & Leasing | 0 (0.0%) | 5 (100.0%) |
| Professional & Scientific | 0 (0.0%) | 4 (100.0%) |
| Enterprise Management | 0 (0.0%) | 0 (0.0%) |
| Administrative & Support | 0 (0.0%) | 3 (100.0%) |
| Educational Services | 6 (20.7%) | 23 (79.3%) |
| Health Care & Social Assistance | 28 (21.0%) | 105 (78.9%) |
| Arts, Entertainment & Recreation | 0 (0.0%) | 18 (100.0%) |
| Accommodation & Food Services | 0 (0.0%) | 21 (100.0%) |
| Public Administration | 3 (18.8%) | 13 (81.2%) |
| Total | 418 (54.9%) | 343 (45.1%) |
Education in Humboldt
School Enrollment in Humboldt
The most common levels of schooling among the 312 students in Humboldt are high school (97 | 31.1%), middle school (72 | 23.1%), and elementary school (46 | 14.7%).
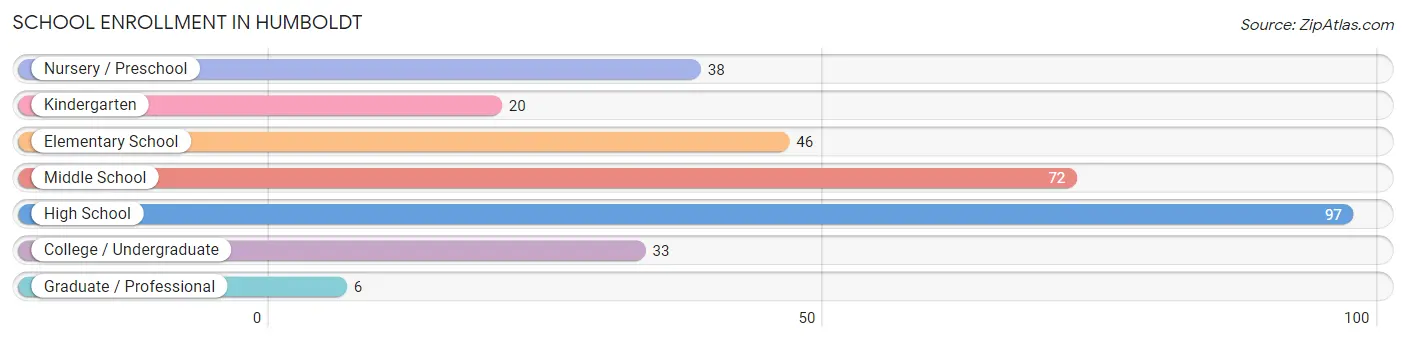
| School Level | # Students | % Students |
| Nursery / Preschool | 38 | 12.2% |
| Kindergarten | 20 | 6.4% |
| Elementary School | 46 | 14.7% |
| Middle School | 72 | 23.1% |
| High School | 97 | 31.1% |
| College / Undergraduate | 33 | 10.6% |
| Graduate / Professional | 6 | 1.9% |
| Total | 312 | 100.0% |
School Enrollment by Age by Funding Source in Humboldt
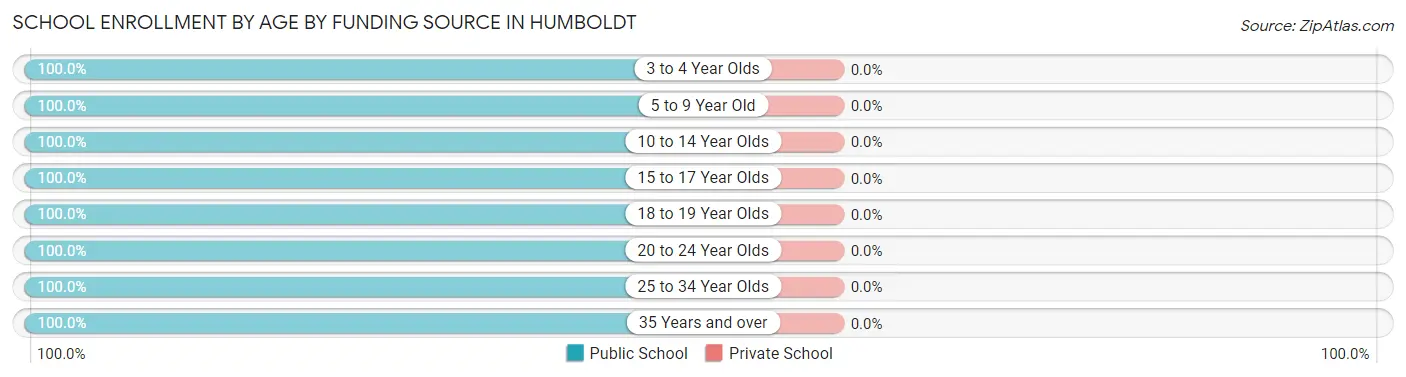
| Age Bracket | Public School | Private School |
| 3 to 4 Year Olds | 22 (100.0%) | 0 (0.0%) |
| 5 to 9 Year Old | 67 (100.0%) | 0 (0.0%) |
| 10 to 14 Year Olds | 91 (100.0%) | 0 (0.0%) |
| 15 to 17 Year Olds | 87 (100.0%) | 0 (0.0%) |
| 18 to 19 Year Olds | 16 (100.0%) | 0 (0.0%) |
| 20 to 24 Year Olds | 8 (100.0%) | 0 (0.0%) |
| 25 to 34 Year Olds | 10 (100.0%) | 0 (0.0%) |
| 35 Years and over | 11 (100.0%) | 0 (0.0%) |
| Total | 312 (100.0%) | 0 (0.0%) |
Educational Attainment by Field of Study in Humboldt
Education (76 | 25.0%), business (55 | 18.1%), science & technology (40 | 13.2%), physical & health sciences (35 | 11.5%), and liberal arts & history (32 | 10.5%) are the most common fields of study among 304 individuals in Humboldt who have obtained a bachelor's degree or higher.
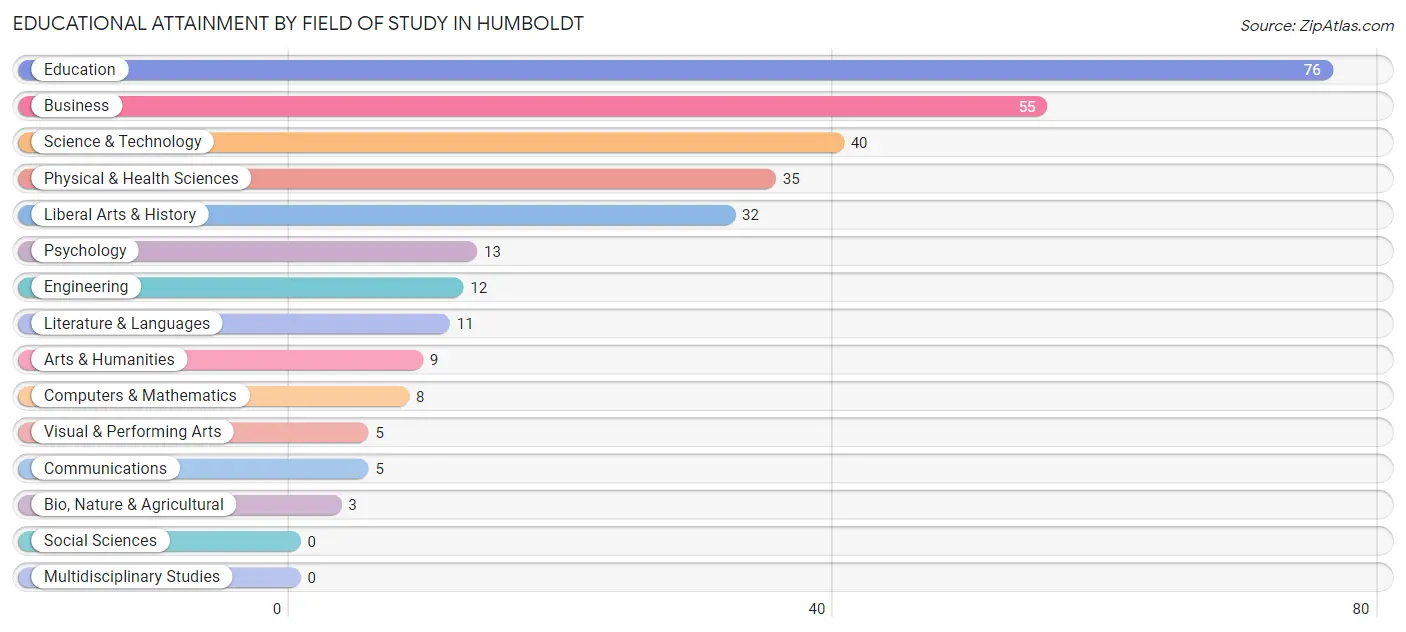
| Field of Study | # Graduates | % Graduates |
| Computers & Mathematics | 8 | 2.6% |
| Bio, Nature & Agricultural | 3 | 1.0% |
| Physical & Health Sciences | 35 | 11.5% |
| Psychology | 13 | 4.3% |
| Social Sciences | 0 | 0.0% |
| Engineering | 12 | 4.0% |
| Multidisciplinary Studies | 0 | 0.0% |
| Science & Technology | 40 | 13.2% |
| Business | 55 | 18.1% |
| Education | 76 | 25.0% |
| Literature & Languages | 11 | 3.6% |
| Liberal Arts & History | 32 | 10.5% |
| Visual & Performing Arts | 5 | 1.6% |
| Communications | 5 | 1.6% |
| Arts & Humanities | 9 | 3.0% |
| Total | 304 | 100.0% |
Transportation & Commute in Humboldt
Vehicle Availability by Sex in Humboldt
The most prevalent vehicle ownership categories in Humboldt are males with 2 vehicles (168, accounting for 40.8%) and females with 2 vehicles (173, making up 49.0%).
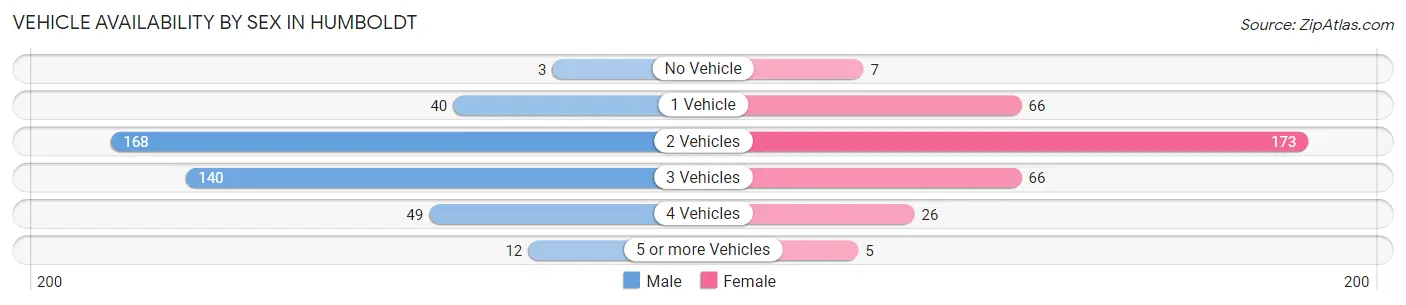
| Vehicles Available | Male | Female |
| No Vehicle | 3 (0.7%) | 7 (2.0%) |
| 1 Vehicle | 40 (9.7%) | 66 (19.2%) |
| 2 Vehicles | 168 (40.8%) | 173 (50.4%) |
| 3 Vehicles | 140 (34.0%) | 66 (19.2%) |
| 4 Vehicles | 49 (11.9%) | 26 (7.6%) |
| 5 or more Vehicles | 12 (2.9%) | 5 (1.5%) |
| Total | 412 (100.0%) | 343 (100.0%) |
Commute Time in Humboldt
The most frequently occuring commute durations in Humboldt are 15 to 19 minutes (231 commuters, 32.1%), 5 to 9 minutes (155 commuters, 21.5%), and 20 to 24 minutes (138 commuters, 19.2%).
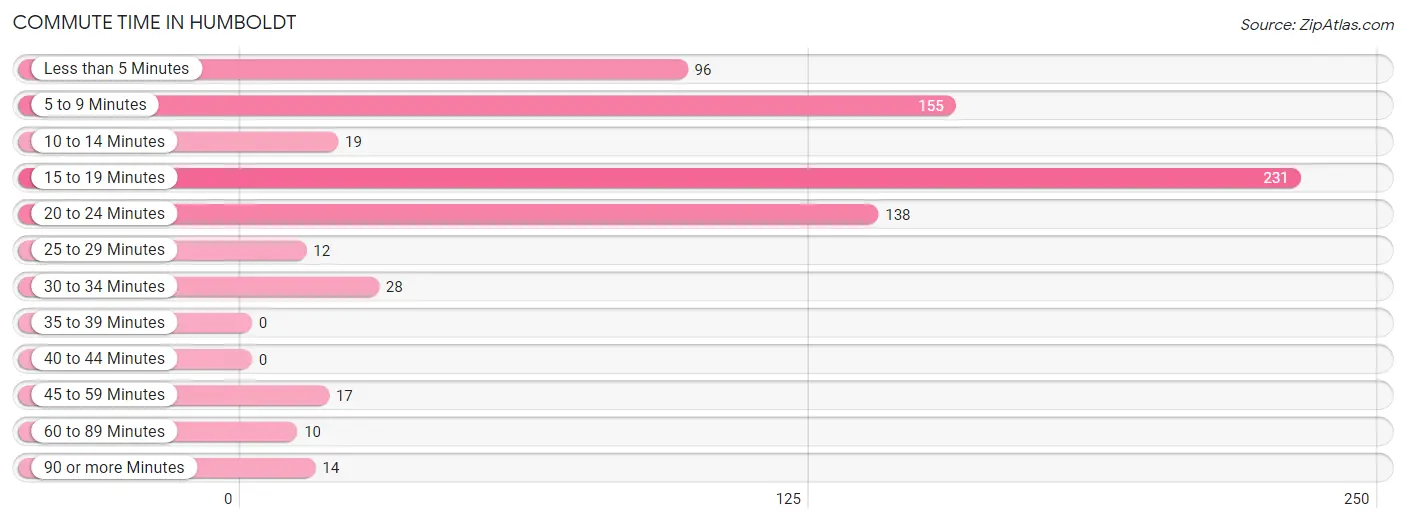
| Commute Time | # Commuters | % Commuters |
| Less than 5 Minutes | 96 | 13.3% |
| 5 to 9 Minutes | 155 | 21.5% |
| 10 to 14 Minutes | 19 | 2.6% |
| 15 to 19 Minutes | 231 | 32.1% |
| 20 to 24 Minutes | 138 | 19.2% |
| 25 to 29 Minutes | 12 | 1.7% |
| 30 to 34 Minutes | 28 | 3.9% |
| 35 to 39 Minutes | 0 | 0.0% |
| 40 to 44 Minutes | 0 | 0.0% |
| 45 to 59 Minutes | 17 | 2.4% |
| 60 to 89 Minutes | 10 | 1.4% |
| 90 or more Minutes | 14 | 1.9% |
Commute Time by Sex in Humboldt
The most common commute times in Humboldt are 15 to 19 minutes (146 commuters, 37.1%) for males and 20 to 24 minutes (87 commuters, 26.6%) for females.
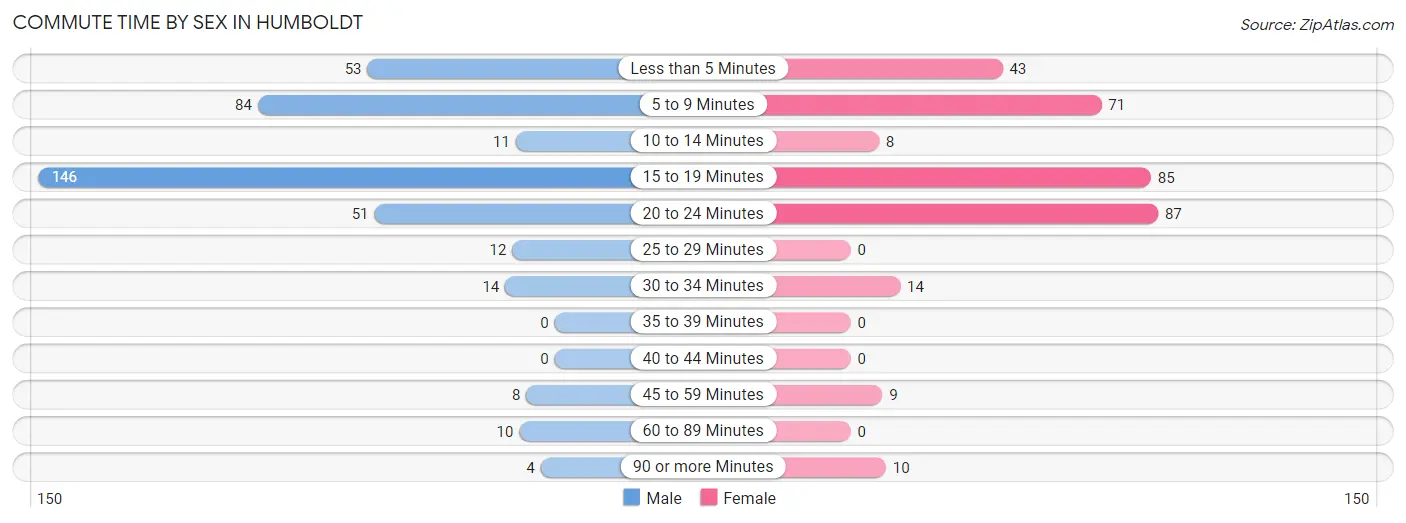
| Commute Time | Male | Female |
| Less than 5 Minutes | 53 (13.5%) | 43 (13.2%) |
| 5 to 9 Minutes | 84 (21.4%) | 71 (21.7%) |
| 10 to 14 Minutes | 11 (2.8%) | 8 (2.5%) |
| 15 to 19 Minutes | 146 (37.1%) | 85 (26.0%) |
| 20 to 24 Minutes | 51 (13.0%) | 87 (26.6%) |
| 25 to 29 Minutes | 12 (3.0%) | 0 (0.0%) |
| 30 to 34 Minutes | 14 (3.6%) | 14 (4.3%) |
| 35 to 39 Minutes | 0 (0.0%) | 0 (0.0%) |
| 40 to 44 Minutes | 0 (0.0%) | 0 (0.0%) |
| 45 to 59 Minutes | 8 (2.0%) | 9 (2.8%) |
| 60 to 89 Minutes | 10 (2.5%) | 0 (0.0%) |
| 90 or more Minutes | 4 (1.0%) | 10 (3.1%) |
Time of Departure to Work by Sex in Humboldt
The most frequent times of departure to work in Humboldt are 7:30 AM to 7:59 AM (97, 24.7%) for males and 7:30 AM to 7:59 AM (93, 28.4%) for females.
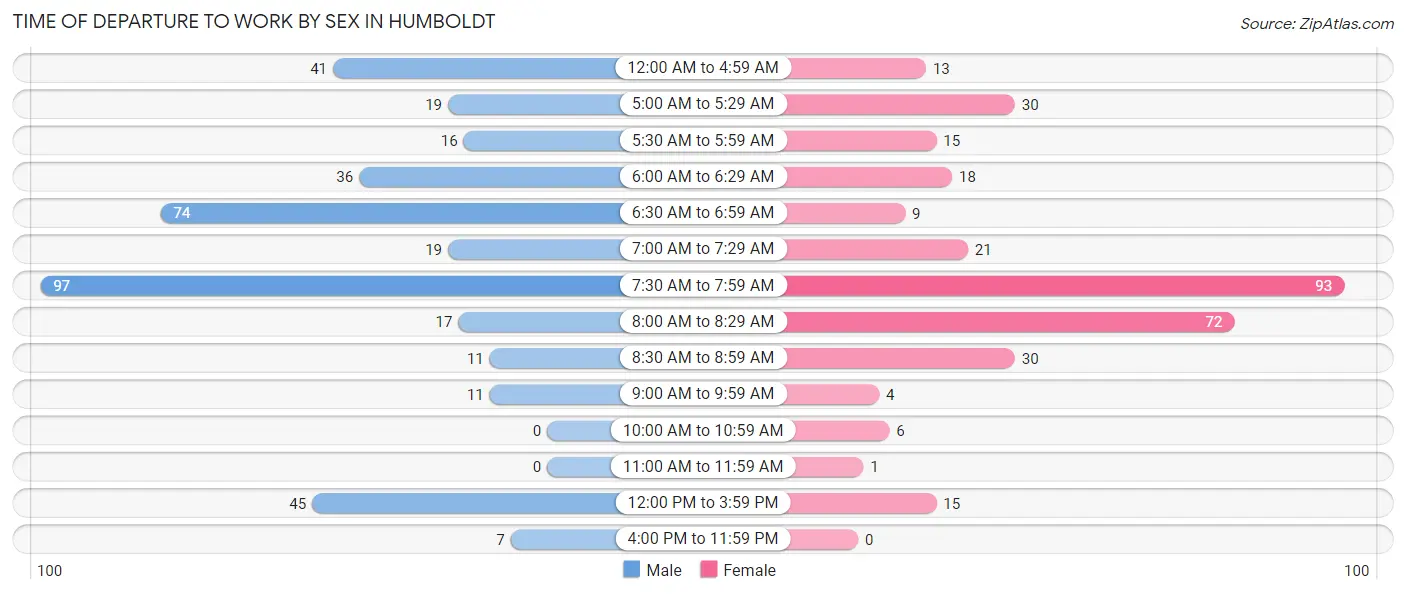
| Time of Departure | Male | Female |
| 12:00 AM to 4:59 AM | 41 (10.4%) | 13 (4.0%) |
| 5:00 AM to 5:29 AM | 19 (4.8%) | 30 (9.2%) |
| 5:30 AM to 5:59 AM | 16 (4.1%) | 15 (4.6%) |
| 6:00 AM to 6:29 AM | 36 (9.2%) | 18 (5.5%) |
| 6:30 AM to 6:59 AM | 74 (18.8%) | 9 (2.8%) |
| 7:00 AM to 7:29 AM | 19 (4.8%) | 21 (6.4%) |
| 7:30 AM to 7:59 AM | 97 (24.7%) | 93 (28.4%) |
| 8:00 AM to 8:29 AM | 17 (4.3%) | 72 (22.0%) |
| 8:30 AM to 8:59 AM | 11 (2.8%) | 30 (9.2%) |
| 9:00 AM to 9:59 AM | 11 (2.8%) | 4 (1.2%) |
| 10:00 AM to 10:59 AM | 0 (0.0%) | 6 (1.8%) |
| 11:00 AM to 11:59 AM | 0 (0.0%) | 1 (0.3%) |
| 12:00 PM to 3:59 PM | 45 (11.5%) | 15 (4.6%) |
| 4:00 PM to 11:59 PM | 7 (1.8%) | 0 (0.0%) |
| Total | 393 (100.0%) | 327 (100.0%) |
Housing Occupancy in Humboldt
Occupancy by Ownership in Humboldt
Of the total 767 dwellings in Humboldt, owner-occupied units account for 578 (75.4%), while renter-occupied units make up 189 (24.6%).
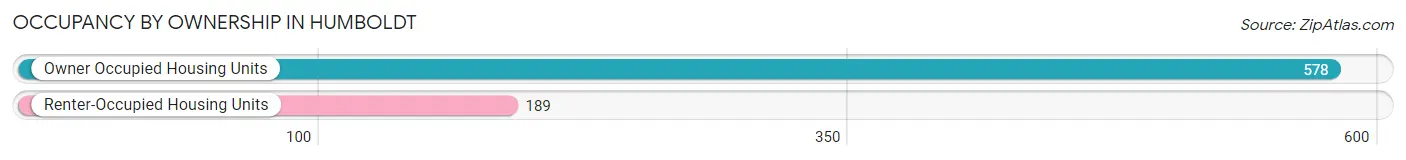
| Occupancy | # Housing Units | % Housing Units |
| Owner Occupied Housing Units | 578 | 75.4% |
| Renter-Occupied Housing Units | 189 | 24.6% |
| Total Occupied Housing Units | 767 | 100.0% |
Occupancy by Household Size in Humboldt

| Household Size | # Housing Units | % Housing Units |
| 1-Person Household | 243 | 31.7% |
| 2-Person Household | 297 | 38.7% |
| 3-Person Household | 125 | 16.3% |
| 4+ Person Household | 102 | 13.3% |
| Total Housing Units | 767 | 100.0% |
Occupancy by Ownership by Household Size in Humboldt
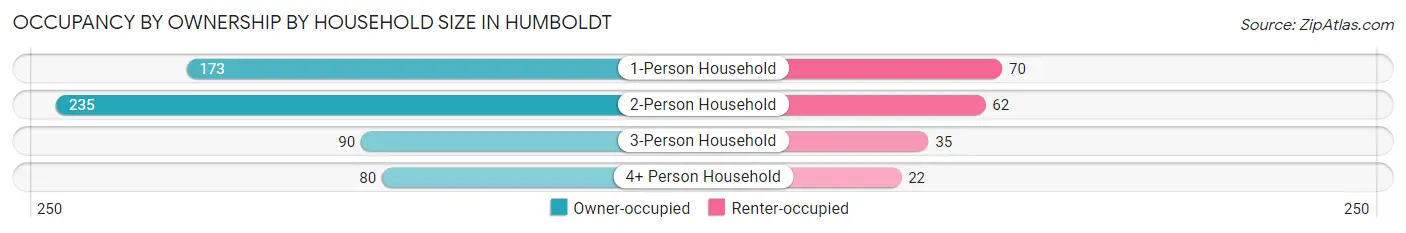
| Household Size | Owner-occupied | Renter-occupied |
| 1-Person Household | 173 (71.2%) | 70 (28.8%) |
| 2-Person Household | 235 (79.1%) | 62 (20.9%) |
| 3-Person Household | 90 (72.0%) | 35 (28.0%) |
| 4+ Person Household | 80 (78.4%) | 22 (21.6%) |
| Total Housing Units | 578 (75.4%) | 189 (24.6%) |
Occupancy by Educational Attainment in Humboldt
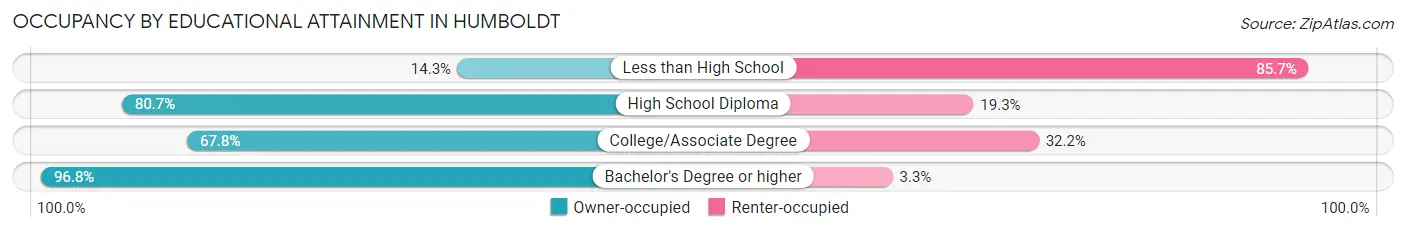
| Household Size | Owner-occupied | Renter-occupied |
| Less than High School | 5 (14.3%) | 30 (85.7%) |
| High School Diploma | 201 (80.7%) | 48 (19.3%) |
| College/Associate Degree | 223 (67.8%) | 106 (32.2%) |
| Bachelor's Degree or higher | 149 (96.8%) | 5 (3.3%) |
Occupancy by Age of Householder in Humboldt
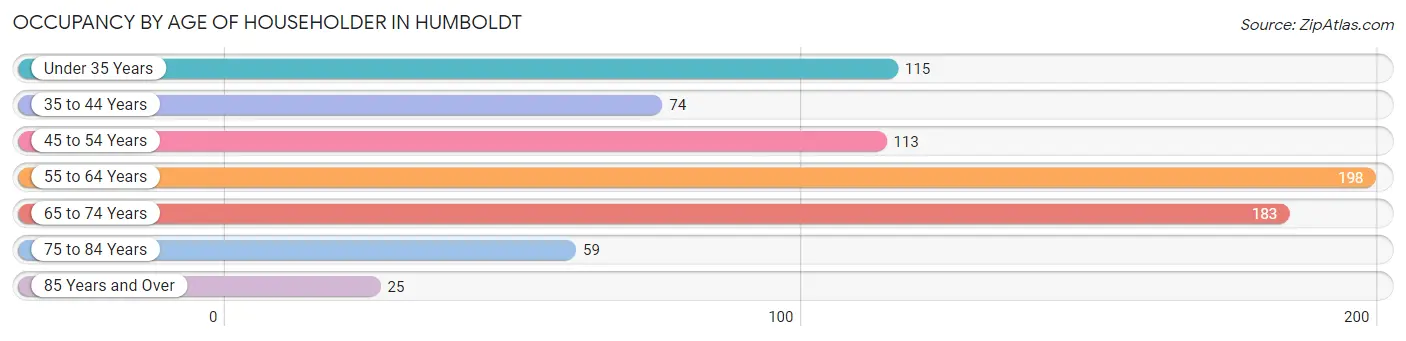
| Age Bracket | # Households | % Households |
| Under 35 Years | 115 | 15.0% |
| 35 to 44 Years | 74 | 9.7% |
| 45 to 54 Years | 113 | 14.7% |
| 55 to 64 Years | 198 | 25.8% |
| 65 to 74 Years | 183 | 23.9% |
| 75 to 84 Years | 59 | 7.7% |
| 85 Years and Over | 25 | 3.3% |
| Total | 767 | 100.0% |
Housing Finances in Humboldt
Median Income by Occupancy in Humboldt
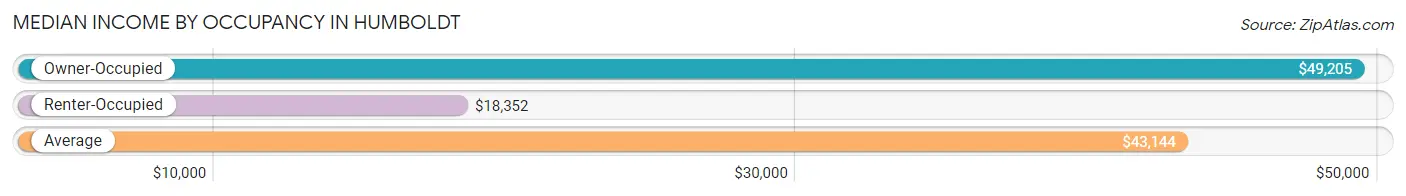
| Occupancy Type | # Households | Median Income |
| Owner-Occupied | 578 (75.4%) | $49,205 |
| Renter-Occupied | 189 (24.6%) | $18,352 |
| Average | 767 (100.0%) | $43,144 |
Occupancy by Householder Income Bracket in Humboldt
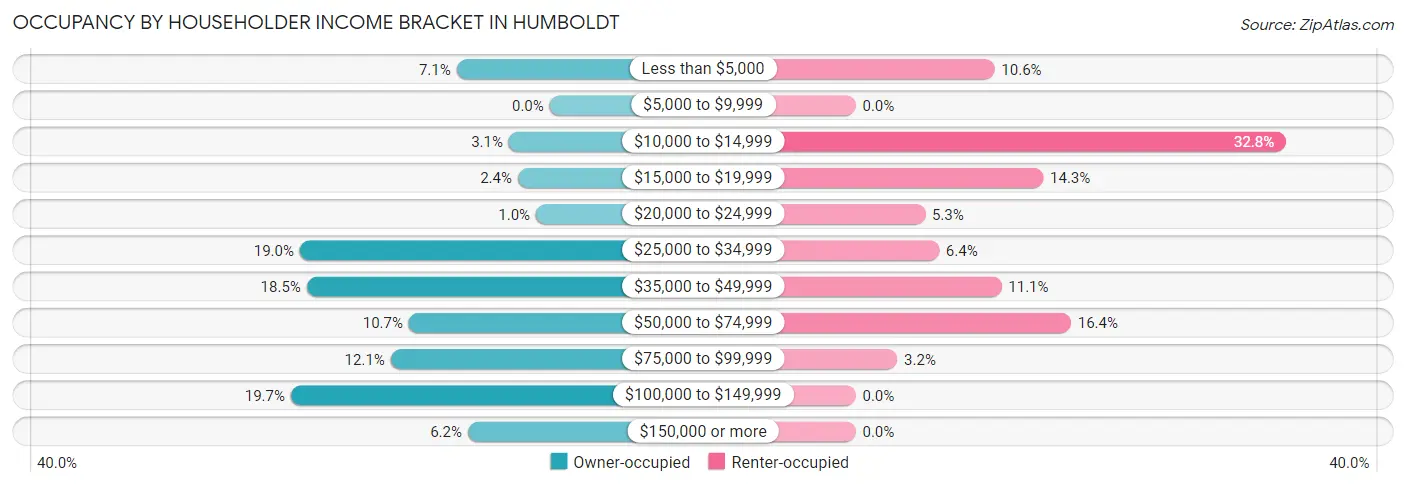
| Income Bracket | Owner-occupied | Renter-occupied |
| Less than $5,000 | 41 (7.1%) | 20 (10.6%) |
| $5,000 to $9,999 | 0 (0.0%) | 0 (0.0%) |
| $10,000 to $14,999 | 18 (3.1%) | 62 (32.8%) |
| $15,000 to $19,999 | 14 (2.4%) | 27 (14.3%) |
| $20,000 to $24,999 | 6 (1.0%) | 10 (5.3%) |
| $25,000 to $34,999 | 110 (19.0%) | 12 (6.4%) |
| $35,000 to $49,999 | 107 (18.5%) | 21 (11.1%) |
| $50,000 to $74,999 | 62 (10.7%) | 31 (16.4%) |
| $75,000 to $99,999 | 70 (12.1%) | 6 (3.2%) |
| $100,000 to $149,999 | 114 (19.7%) | 0 (0.0%) |
| $150,000 or more | 36 (6.2%) | 0 (0.0%) |
| Total | 578 (100.0%) | 189 (100.0%) |
Monthly Housing Cost Tiers in Humboldt
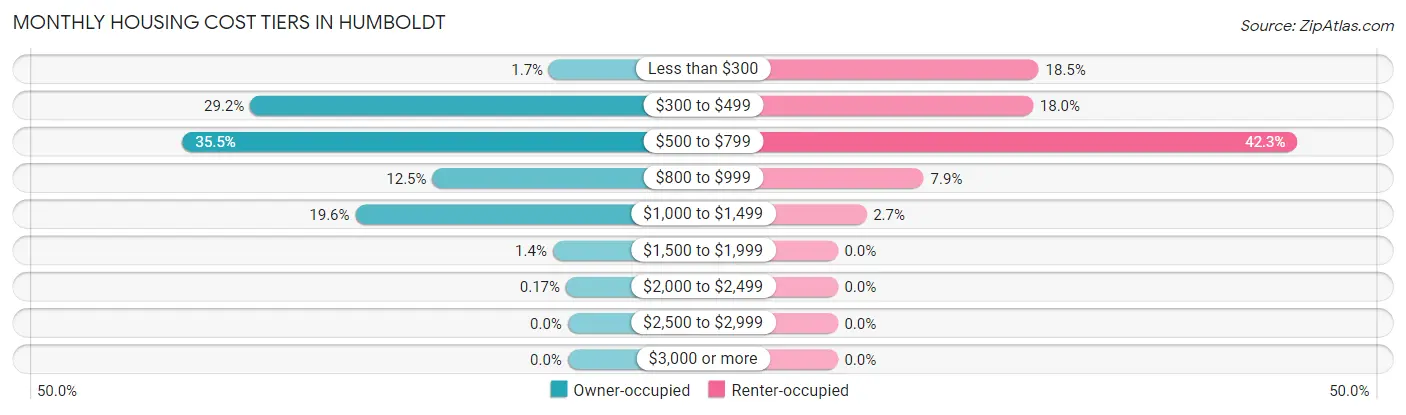
| Monthly Cost | Owner-occupied | Renter-occupied |
| Less than $300 | 10 (1.7%) | 35 (18.5%) |
| $300 to $499 | 169 (29.2%) | 34 (18.0%) |
| $500 to $799 | 205 (35.5%) | 80 (42.3%) |
| $800 to $999 | 72 (12.5%) | 15 (7.9%) |
| $1,000 to $1,499 | 113 (19.6%) | 5 (2.6%) |
| $1,500 to $1,999 | 8 (1.4%) | 0 (0.0%) |
| $2,000 to $2,499 | 1 (0.2%) | 0 (0.0%) |
| $2,500 to $2,999 | 0 (0.0%) | 0 (0.0%) |
| $3,000 or more | 0 (0.0%) | 0 (0.0%) |
| Total | 578 (100.0%) | 189 (100.0%) |
Physical Housing Characteristics in Humboldt
Housing Structures in Humboldt
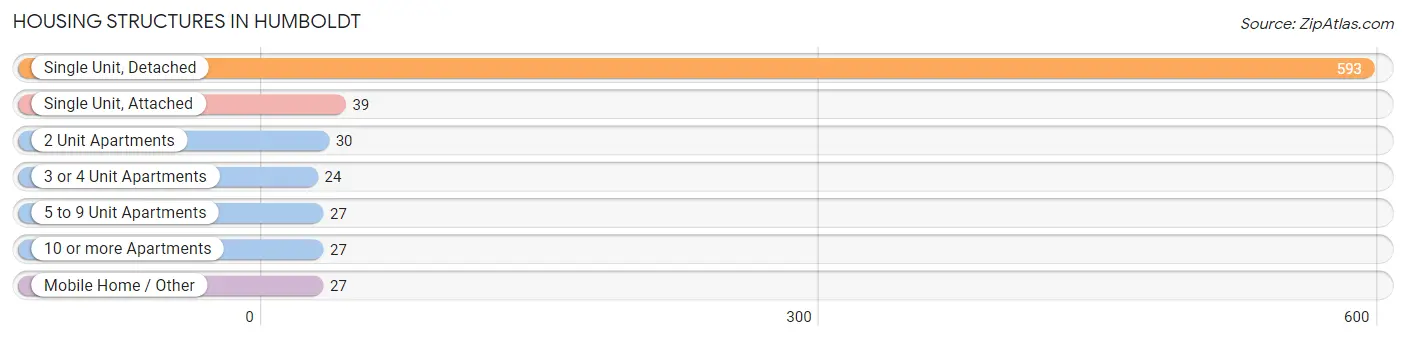
| Structure Type | # Housing Units | % Housing Units |
| Single Unit, Detached | 593 | 77.3% |
| Single Unit, Attached | 39 | 5.1% |
| 2 Unit Apartments | 30 | 3.9% |
| 3 or 4 Unit Apartments | 24 | 3.1% |
| 5 to 9 Unit Apartments | 27 | 3.5% |
| 10 or more Apartments | 27 | 3.5% |
| Mobile Home / Other | 27 | 3.5% |
| Total | 767 | 100.0% |
Housing Structures by Occupancy in Humboldt
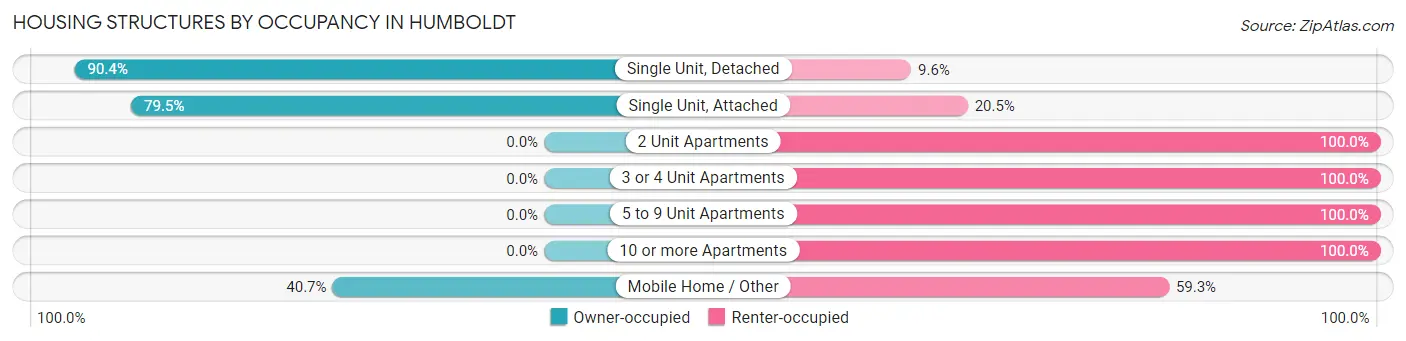
| Structure Type | Owner-occupied | Renter-occupied |
| Single Unit, Detached | 536 (90.4%) | 57 (9.6%) |
| Single Unit, Attached | 31 (79.5%) | 8 (20.5%) |
| 2 Unit Apartments | 0 (0.0%) | 30 (100.0%) |
| 3 or 4 Unit Apartments | 0 (0.0%) | 24 (100.0%) |
| 5 to 9 Unit Apartments | 0 (0.0%) | 27 (100.0%) |
| 10 or more Apartments | 0 (0.0%) | 27 (100.0%) |
| Mobile Home / Other | 11 (40.7%) | 16 (59.3%) |
| Total | 578 (75.4%) | 189 (24.6%) |
Housing Structures by Number of Rooms in Humboldt
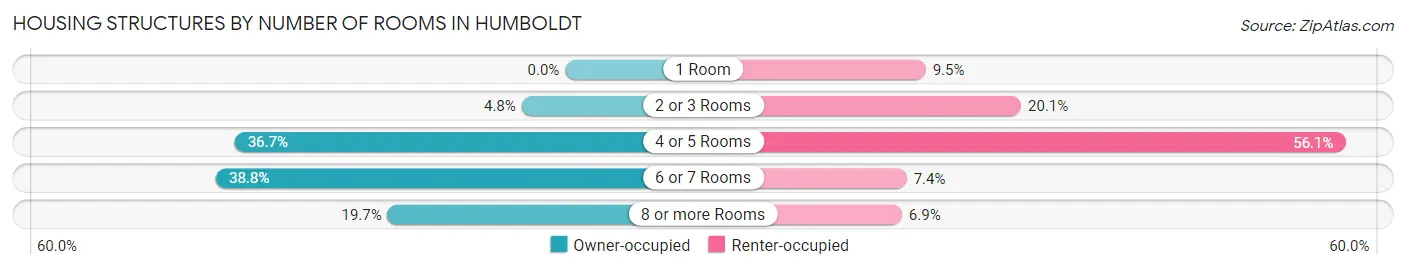
| Number of Rooms | Owner-occupied | Renter-occupied |
| 1 Room | 0 (0.0%) | 18 (9.5%) |
| 2 or 3 Rooms | 28 (4.8%) | 38 (20.1%) |
| 4 or 5 Rooms | 212 (36.7%) | 106 (56.1%) |
| 6 or 7 Rooms | 224 (38.8%) | 14 (7.4%) |
| 8 or more Rooms | 114 (19.7%) | 13 (6.9%) |
| Total | 578 (100.0%) | 189 (100.0%) |
Housing Structure by Heating Type in Humboldt
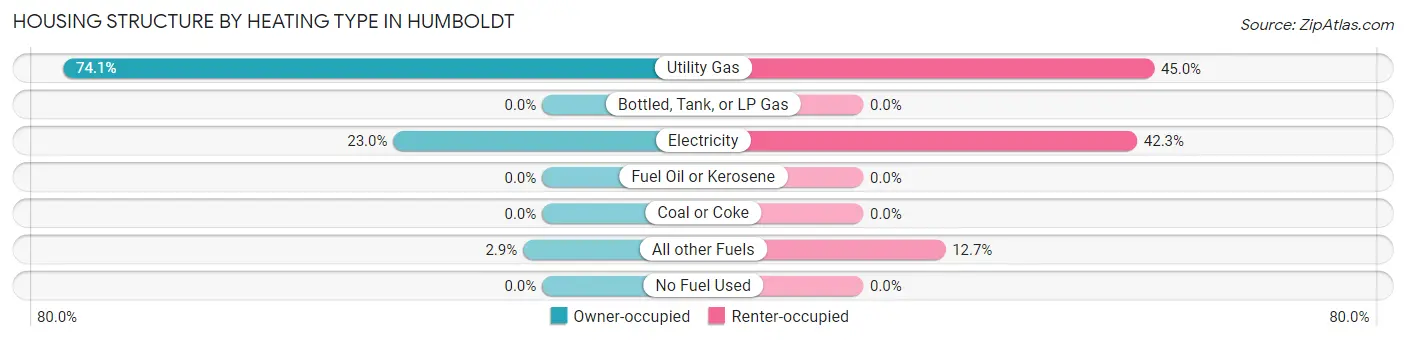
| Heating Type | Owner-occupied | Renter-occupied |
| Utility Gas | 428 (74.1%) | 85 (45.0%) |
| Bottled, Tank, or LP Gas | 0 (0.0%) | 0 (0.0%) |
| Electricity | 133 (23.0%) | 80 (42.3%) |
| Fuel Oil or Kerosene | 0 (0.0%) | 0 (0.0%) |
| Coal or Coke | 0 (0.0%) | 0 (0.0%) |
| All other Fuels | 17 (2.9%) | 24 (12.7%) |
| No Fuel Used | 0 (0.0%) | 0 (0.0%) |
| Total | 578 (100.0%) | 189 (100.0%) |
Household Vehicle Usage in Humboldt
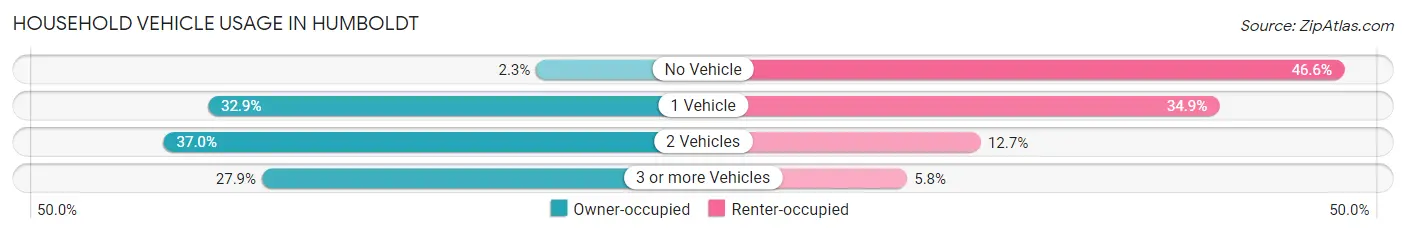
| Vehicles per Household | Owner-occupied | Renter-occupied |
| No Vehicle | 13 (2.2%) | 88 (46.6%) |
| 1 Vehicle | 190 (32.9%) | 66 (34.9%) |
| 2 Vehicles | 214 (37.0%) | 24 (12.7%) |
| 3 or more Vehicles | 161 (27.9%) | 11 (5.8%) |
| Total | 578 (100.0%) | 189 (100.0%) |
Real Estate & Mortgages in Humboldt
Real Estate and Mortgage Overview in Humboldt
| Characteristic | Without Mortgage | With Mortgage |
| Housing Units | 372 | 206 |
| Median Property Value | $93,800 | $82,200 |
| Median Household Income | $47,794 | $4 |
| Monthly Housing Costs | $510 | $0 |
| Real Estate Taxes | $1,774 | $0 |
Property Value by Mortgage Status in Humboldt
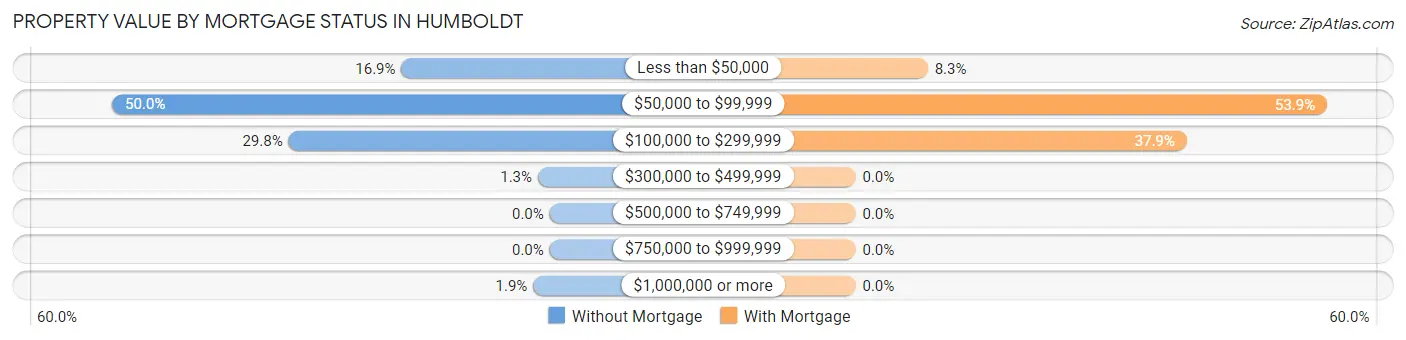
| Property Value | Without Mortgage | With Mortgage |
| Less than $50,000 | 63 (16.9%) | 17 (8.3%) |
| $50,000 to $99,999 | 186 (50.0%) | 111 (53.9%) |
| $100,000 to $299,999 | 111 (29.8%) | 78 (37.9%) |
| $300,000 to $499,999 | 5 (1.3%) | 0 (0.0%) |
| $500,000 to $749,999 | 0 (0.0%) | 0 (0.0%) |
| $750,000 to $999,999 | 0 (0.0%) | 0 (0.0%) |
| $1,000,000 or more | 7 (1.9%) | 0 (0.0%) |
| Total | 372 (100.0%) | 206 (100.0%) |
Household Income by Mortgage Status in Humboldt
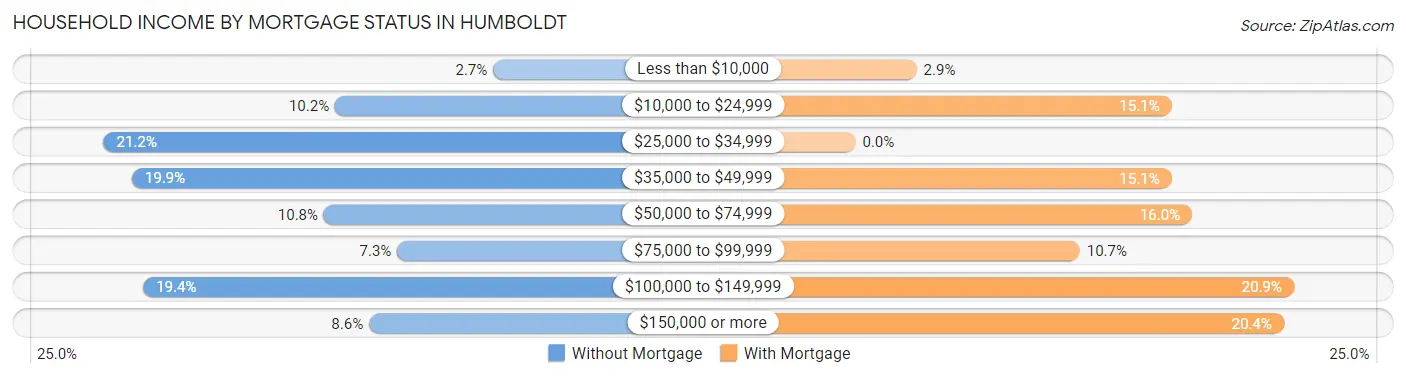
| Household Income | Without Mortgage | With Mortgage |
| Less than $10,000 | 10 (2.7%) | 6 (2.9%) |
| $10,000 to $24,999 | 38 (10.2%) | 31 (15.0%) |
| $25,000 to $34,999 | 79 (21.2%) | 0 (0.0%) |
| $35,000 to $49,999 | 74 (19.9%) | 31 (15.0%) |
| $50,000 to $74,999 | 40 (10.7%) | 33 (16.0%) |
| $75,000 to $99,999 | 27 (7.3%) | 22 (10.7%) |
| $100,000 to $149,999 | 72 (19.4%) | 43 (20.9%) |
| $150,000 or more | 32 (8.6%) | 42 (20.4%) |
| Total | 372 (100.0%) | 206 (100.0%) |
Property Value to Household Income Ratio in Humboldt
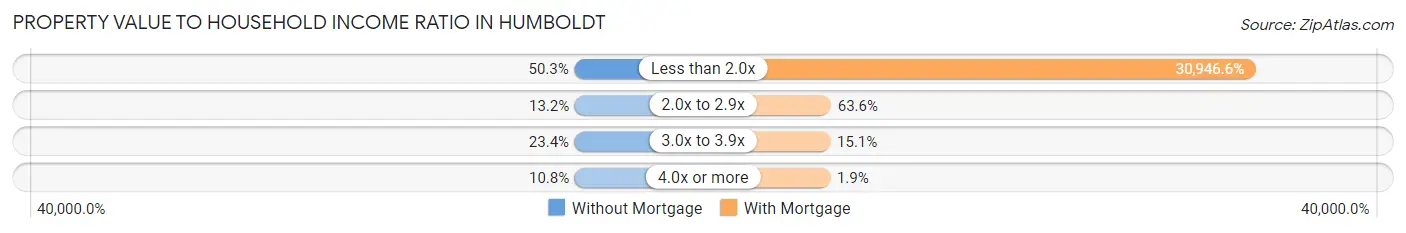
| Value-to-Income Ratio | Without Mortgage | With Mortgage |
| Less than 2.0x | 187 (50.3%) | 63,750 (30,946.6%) |
| 2.0x to 2.9x | 49 (13.2%) | 131 (63.6%) |
| 3.0x to 3.9x | 87 (23.4%) | 31 (15.0%) |
| 4.0x or more | 40 (10.7%) | 4 (1.9%) |
| Total | 372 (100.0%) | 206 (100.0%) |
Real Estate Taxes by Mortgage Status in Humboldt
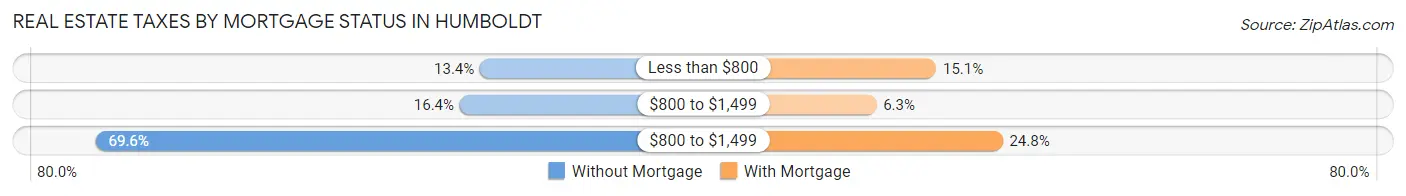
| Property Taxes | Without Mortgage | With Mortgage |
| Less than $800 | 50 (13.4%) | 31 (15.0%) |
| $800 to $1,499 | 61 (16.4%) | 13 (6.3%) |
| $800 to $1,499 | 259 (69.6%) | 51 (24.8%) |
| Total | 372 (100.0%) | 206 (100.0%) |
Health & Disability in Humboldt
Health Insurance Coverage by Age in Humboldt
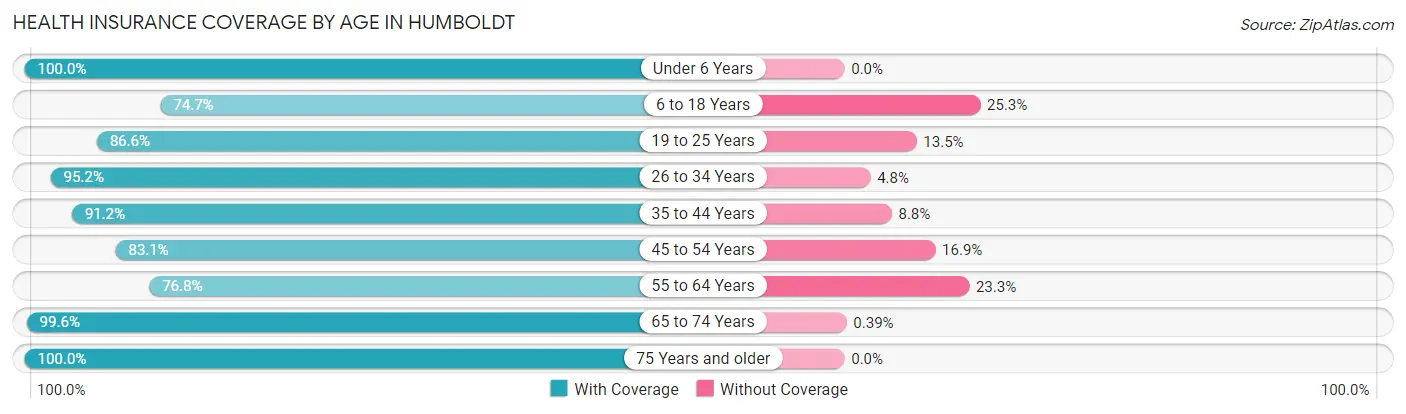
| Age Bracket | With Coverage | Without Coverage |
| Under 6 Years | 187 (100.0%) | 0 (0.0%) |
| 6 to 18 Years | 171 (74.7%) | 58 (25.3%) |
| 19 to 25 Years | 148 (86.6%) | 23 (13.5%) |
| 26 to 34 Years | 118 (95.2%) | 6 (4.8%) |
| 35 to 44 Years | 176 (91.2%) | 17 (8.8%) |
| 45 to 54 Years | 206 (83.1%) | 42 (16.9%) |
| 55 to 64 Years | 274 (76.7%) | 83 (23.3%) |
| 65 to 74 Years | 257 (99.6%) | 1 (0.4%) |
| 75 Years and older | 150 (100.0%) | 0 (0.0%) |
| Total | 1,687 (88.0%) | 230 (12.0%) |
Health Insurance Coverage by Citizenship Status in Humboldt
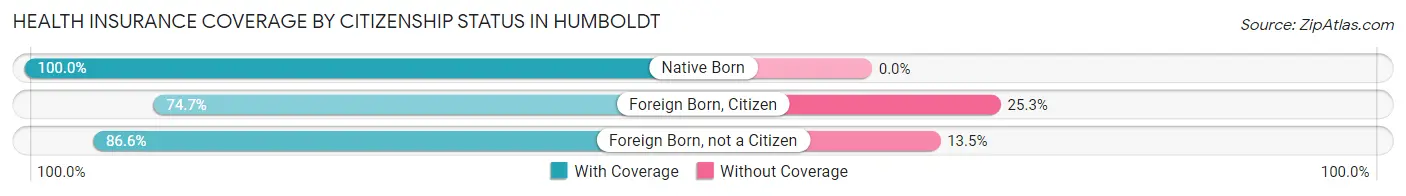
| Citizenship Status | With Coverage | Without Coverage |
| Native Born | 187 (100.0%) | 0 (0.0%) |
| Foreign Born, Citizen | 171 (74.7%) | 58 (25.3%) |
| Foreign Born, not a Citizen | 148 (86.6%) | 23 (13.5%) |
Health Insurance Coverage by Household Income in Humboldt
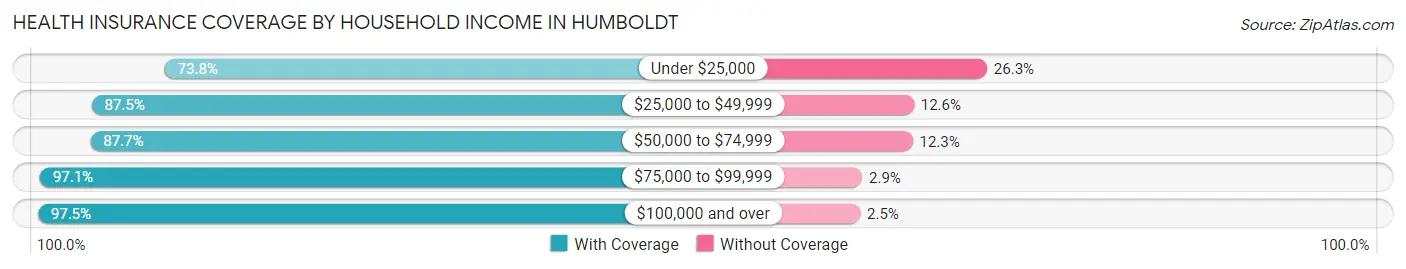
| Household Income | With Coverage | Without Coverage |
| Under $25,000 | 295 (73.8%) | 105 (26.3%) |
| $25,000 to $49,999 | 467 (87.5%) | 67 (12.6%) |
| $50,000 to $74,999 | 292 (87.7%) | 41 (12.3%) |
| $75,000 to $99,999 | 203 (97.1%) | 6 (2.9%) |
| $100,000 and over | 430 (97.5%) | 11 (2.5%) |
Public vs Private Health Insurance Coverage by Age in Humboldt
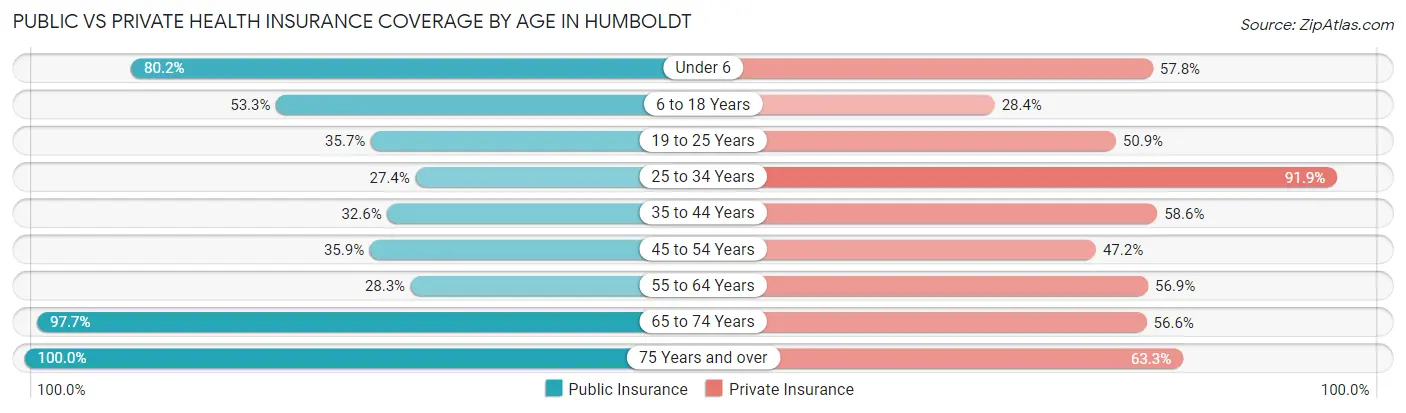
| Age Bracket | Public Insurance | Private Insurance |
| Under 6 | 150 (80.2%) | 108 (57.8%) |
| 6 to 18 Years | 122 (53.3%) | 65 (28.4%) |
| 19 to 25 Years | 61 (35.7%) | 87 (50.9%) |
| 25 to 34 Years | 34 (27.4%) | 114 (91.9%) |
| 35 to 44 Years | 63 (32.6%) | 113 (58.6%) |
| 45 to 54 Years | 89 (35.9%) | 117 (47.2%) |
| 55 to 64 Years | 101 (28.3%) | 203 (56.9%) |
| 65 to 74 Years | 252 (97.7%) | 146 (56.6%) |
| 75 Years and over | 150 (100.0%) | 95 (63.3%) |
| Total | 1,022 (53.3%) | 1,048 (54.7%) |
Disability Status by Sex by Age in Humboldt
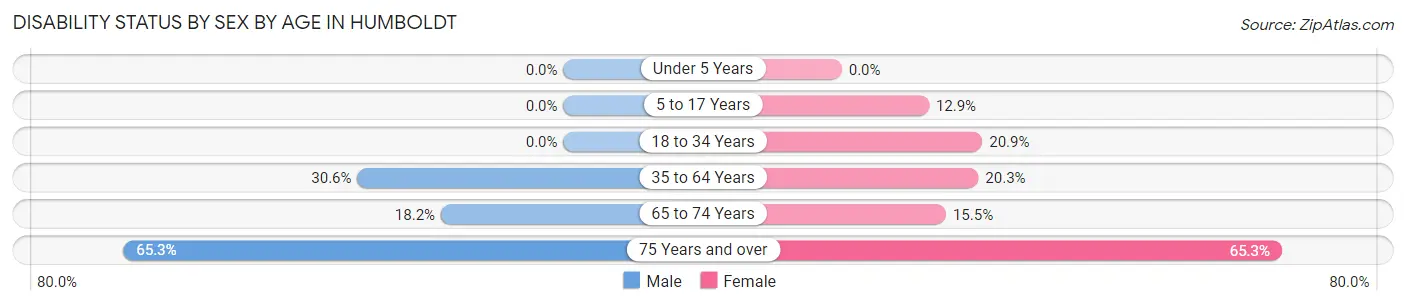
| Age Bracket | Male | Female |
| Under 5 Years | 0 (0.0%) | 0 (0.0%) |
| 5 to 17 Years | 0 (0.0%) | 26 (12.9%) |
| 18 to 34 Years | 0 (0.0%) | 24 (20.9%) |
| 35 to 64 Years | 119 (30.6%) | 83 (20.3%) |
| 65 to 74 Years | 14 (18.2%) | 28 (15.5%) |
| 75 Years and over | 49 (65.3%) | 49 (65.3%) |
Disability Class by Sex by Age in Humboldt
Disability Class: Hearing Difficulty
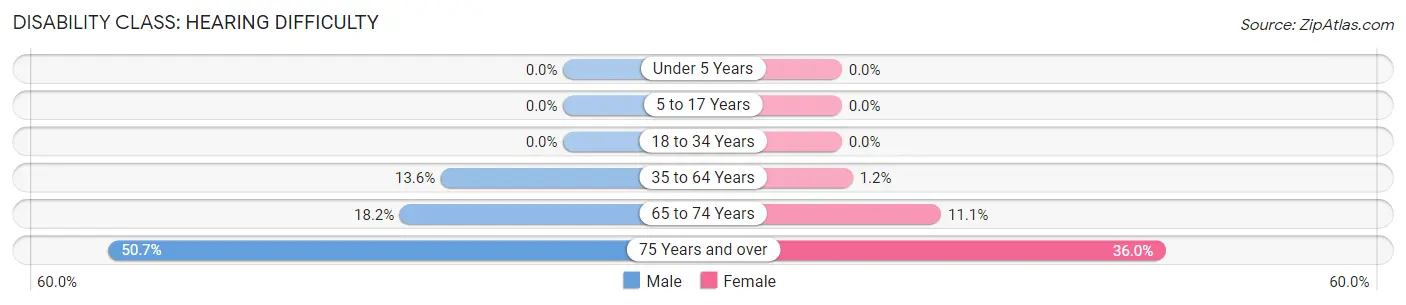
| Age Bracket | Male | Female |
| Under 5 Years | 0 (0.0%) | 0 (0.0%) |
| 5 to 17 Years | 0 (0.0%) | 0 (0.0%) |
| 18 to 34 Years | 0 (0.0%) | 0 (0.0%) |
| 35 to 64 Years | 53 (13.6%) | 5 (1.2%) |
| 65 to 74 Years | 14 (18.2%) | 20 (11.1%) |
| 75 Years and over | 38 (50.7%) | 27 (36.0%) |
Disability Class: Vision Difficulty
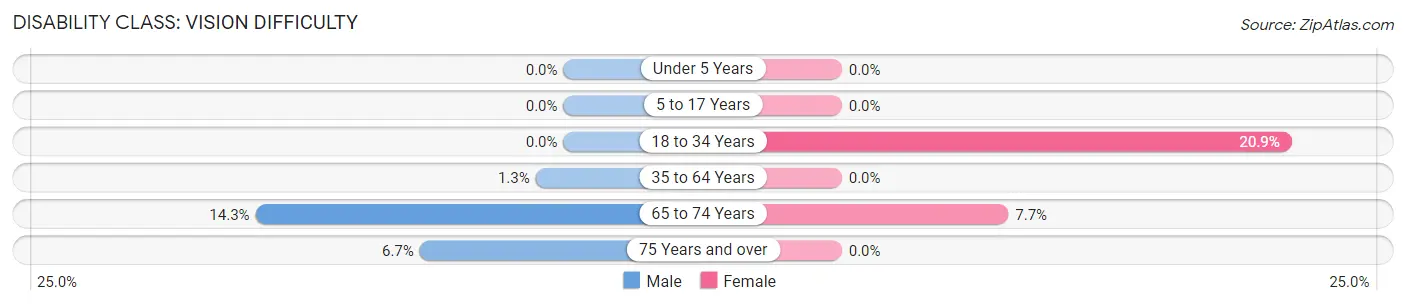
| Age Bracket | Male | Female |
| Under 5 Years | 0 (0.0%) | 0 (0.0%) |
| 5 to 17 Years | 0 (0.0%) | 0 (0.0%) |
| 18 to 34 Years | 0 (0.0%) | 24 (20.9%) |
| 35 to 64 Years | 5 (1.3%) | 0 (0.0%) |
| 65 to 74 Years | 11 (14.3%) | 14 (7.7%) |
| 75 Years and over | 5 (6.7%) | 0 (0.0%) |
Disability Class: Cognitive Difficulty
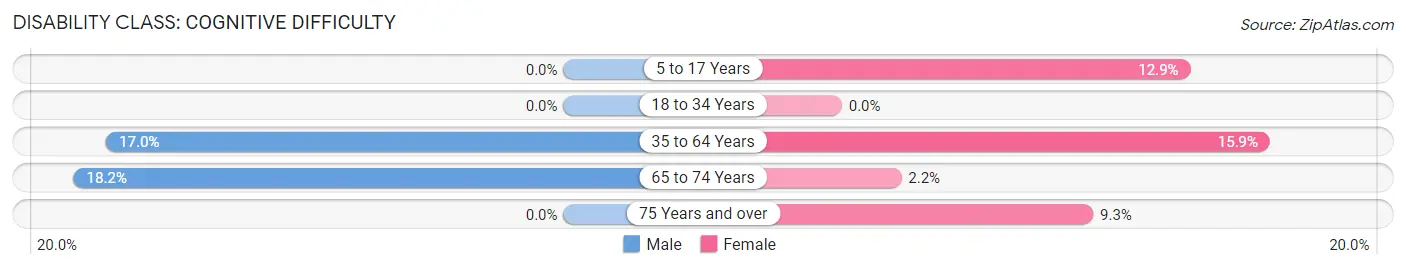
| Age Bracket | Male | Female |
| 5 to 17 Years | 0 (0.0%) | 26 (12.9%) |
| 18 to 34 Years | 0 (0.0%) | 0 (0.0%) |
| 35 to 64 Years | 66 (17.0%) | 65 (15.9%) |
| 65 to 74 Years | 14 (18.2%) | 4 (2.2%) |
| 75 Years and over | 0 (0.0%) | 7 (9.3%) |
Disability Class: Ambulatory Difficulty
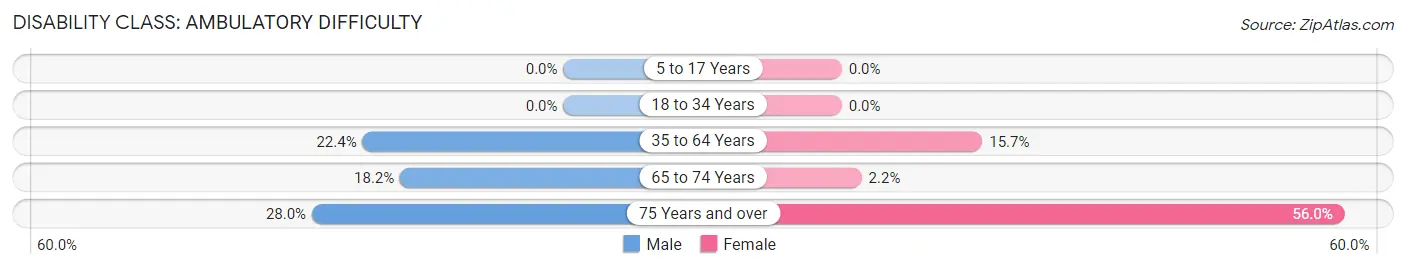
| Age Bracket | Male | Female |
| 5 to 17 Years | 0 (0.0%) | 0 (0.0%) |
| 18 to 34 Years | 0 (0.0%) | 0 (0.0%) |
| 35 to 64 Years | 87 (22.4%) | 64 (15.7%) |
| 65 to 74 Years | 14 (18.2%) | 4 (2.2%) |
| 75 Years and over | 21 (28.0%) | 42 (56.0%) |
Disability Class: Self-Care Difficulty
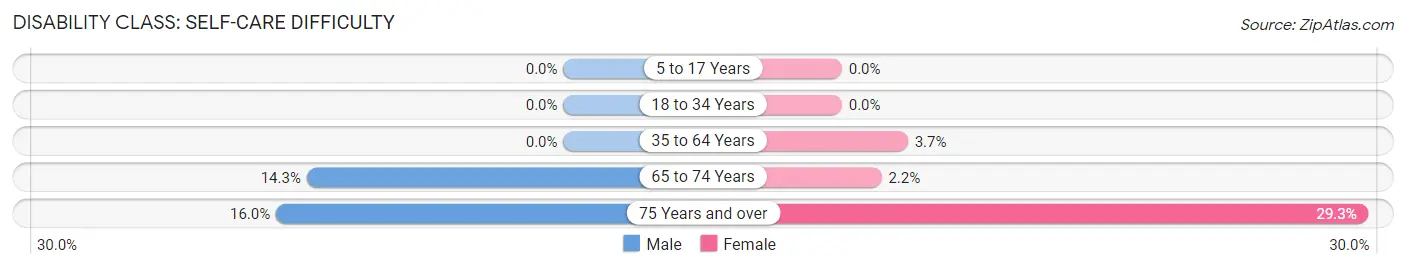
| Age Bracket | Male | Female |
| 5 to 17 Years | 0 (0.0%) | 0 (0.0%) |
| 18 to 34 Years | 0 (0.0%) | 0 (0.0%) |
| 35 to 64 Years | 0 (0.0%) | 15 (3.7%) |
| 65 to 74 Years | 11 (14.3%) | 4 (2.2%) |
| 75 Years and over | 12 (16.0%) | 22 (29.3%) |
Technology Access in Humboldt
Computing Device Access in Humboldt
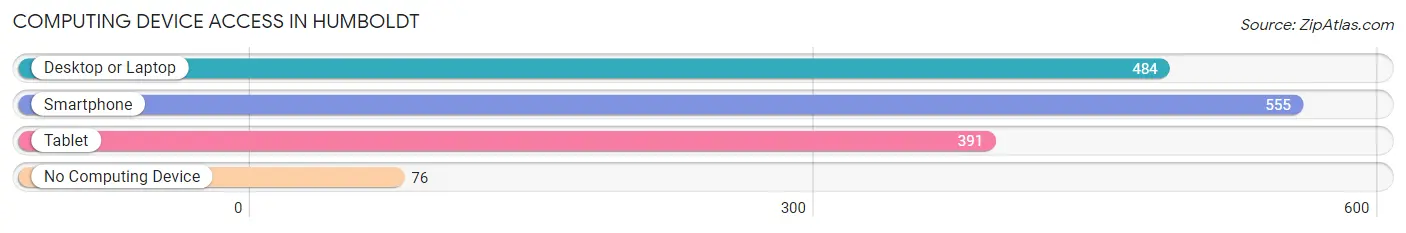
| Device Type | # Households | % Households |
| Desktop or Laptop | 484 | 63.1% |
| Smartphone | 555 | 72.4% |
| Tablet | 391 | 51.0% |
| No Computing Device | 76 | 9.9% |
| Total | 767 | 100.0% |
Internet Access in Humboldt
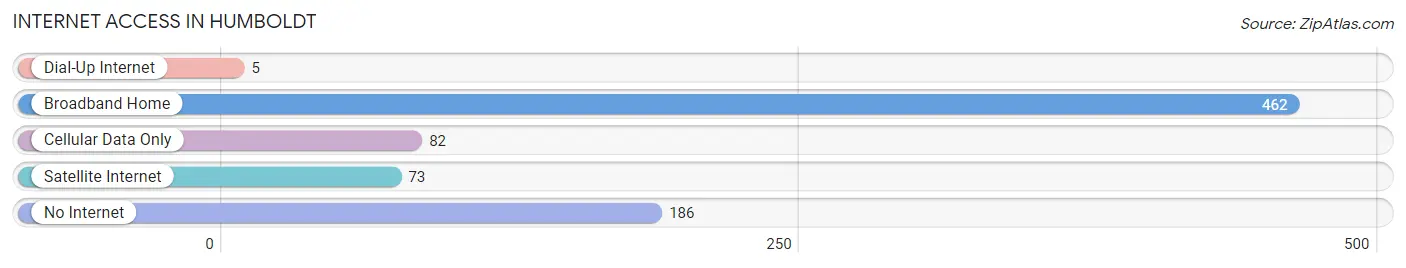
| Internet Type | # Households | % Households |
| Dial-Up Internet | 5 | 0.6% |
| Broadband Home | 462 | 60.2% |
| Cellular Data Only | 82 | 10.7% |
| Satellite Internet | 73 | 9.5% |
| No Internet | 186 | 24.2% |
| Total | 767 | 100.0% |
Humboldt Summary
Humboldt, Kansas is a small city located in Allen County, Kansas. It is situated in the southeastern corner of the state, approximately 30 miles south of the state capital of Topeka. The city has a population of approximately 2,500 people and is the county seat of Allen County.
History
Humboldt was founded in 1857 by a group of settlers from Ohio. The city was named after the German naturalist and explorer Alexander von Humboldt. The city was incorporated in 1872 and was the first city in Allen County.
In the late 19th century, Humboldt was a thriving agricultural center. The city was home to several grain elevators, a flour mill, and a creamery. The city also had a large number of businesses, including a hotel, a bank, a newspaper, and a variety of stores.
In the early 20th century, Humboldt experienced a period of growth and prosperity. The city was home to several manufacturing plants, including a canning factory, a furniture factory, and a brickyard. The city also had a number of churches, schools, and other civic organizations.
Geography
Humboldt is located in the southeastern corner of Allen County, Kansas. The city is situated on the Neosho River, which flows through the city. The city is surrounded by rolling hills and farmland. The city is located approximately 30 miles south of the state capital of Topeka.
The climate in Humboldt is typical of the Midwest. Summers are hot and humid, with temperatures reaching into the 90s. Winters are cold and snowy, with temperatures dropping into the teens.
Economy
Humboldt’s economy is largely based on agriculture. The city is home to several grain elevators, a flour mill, and a creamery. The city also has a number of businesses, including a hotel, a bank, a newspaper, and a variety of stores.
The city is also home to several manufacturing plants, including a canning factory, a furniture factory, and a brickyard. The city also has a number of churches, schools, and other civic organizations.
Demographics
As of the 2010 census, the population of Humboldt was 2,500. The racial makeup of the city was 95.2% White, 0.8% African American, 0.4% Native American, 0.4% Asian, 0.2% Pacific Islander, and 2.8% from other races. Hispanic or Latino of any race were 4.4% of the population.
The median household income in Humboldt was $37,500, and the median family income was $45,000. The per capita income was $18,000. About 11.2% of families and 14.2% of the population were below the poverty line, including 18.2% of those under age 18 and 8.2% of those age 65 or over.
Common Questions
What is Per Capita Income in Humboldt?
Per Capita income in Humboldt is $25,512.
What is the Median Family Income in Humboldt?
Median Family Income in Humboldt is $53,654.
What is the Median Household income in Humboldt?
Median Household Income in Humboldt is $43,144.
What is Income or Wage Gap in Humboldt?
Income or Wage Gap in Humboldt is 30.0%.
Women in Humboldt earn 70.0 cents for every dollar earned by a man.
What is Family Income Deficit in Humboldt?
Family Income Deficit in Humboldt is $13,317.
Families that are below poverty line in Humboldt earn $13,317 less on average than the poverty threshold level.
What is Inequality or Gini Index in Humboldt?
Inequality or Gini Index in Humboldt is 0.44.
What is the Total Population of Humboldt?
Total Population of Humboldt is 1,941.
What is the Total Male Population of Humboldt?
Total Male Population of Humboldt is 909.
What is the Total Female Population of Humboldt?
Total Female Population of Humboldt is 1,032.
What is the Ratio of Males per 100 Females in Humboldt?
There are 88.08 Males per 100 Females in Humboldt.
What is the Ratio of Females per 100 Males in Humboldt?
There are 113.53 Females per 100 Males in Humboldt.
What is the Median Population Age in Humboldt?
Median Population Age in Humboldt is 48.3 Years.
What is the Average Family Size in Humboldt
Average Family Size in Humboldt is 3.1 People.
What is the Average Household Size in Humboldt
Average Household Size in Humboldt is 2.5 People.
How Large is the Labor Force in Humboldt?
There are 941 People in the Labor Forcein in Humboldt.
What is the Percentage of People in the Labor Force in Humboldt?
60.3% of People are in the Labor Force in Humboldt.
What is the Unemployment Rate in Humboldt?
Unemployment Rate in Humboldt is 19.1%.