Lawrence, KS Map & Demographics
Lawrence Map
Lawrence Overview
$36,032
PER CAPITA INCOME
$97,893
AVG FAMILY INCOME
$59,834
AVG HOUSEHOLD INCOME
24.0%
WAGE / INCOME GAP [ % ]
76.0¢/ $1
WAGE / INCOME GAP [ $ ]
$12,382
FAMILY INCOME DEFICIT
0.47
INEQUALITY / GINI INDEX
95,103
TOTAL POPULATION
47,089
MALE POPULATION
48,014
FEMALE POPULATION
98.07
MALES / 100 FEMALES
101.96
FEMALES / 100 MALES
28.8
MEDIAN AGE
2.8
AVG FAMILY SIZE
2.1
AVG HOUSEHOLD SIZE
58,008
LABOR FORCE [ PEOPLE ]
71.8%
PERCENT IN LABOR FORCE
5.2%
UNEMPLOYMENT RATE
Lawrence Area Codes
Income in Lawrence
Income Overview in Lawrence
Per Capita Income in Lawrence is $36,032, while median incomes of families and households are $97,893 and $59,834 respectively.
| Characteristic | Number | Measure |
| Per Capita Income | 95,103 | $36,032 |
| Median Family Income | 18,934 | $97,893 |
| Mean Family Income | 18,934 | $119,197 |
| Median Household Income | 40,786 | $59,834 |
| Mean Household Income | 40,786 | $84,236 |
| Income Deficit | 18,934 | $12,382 |
| Wage / Income Gap (%) | 95,103 | 23.95% |
| Wage / Income Gap ($) | 95,103 | 76.05¢ per $1 |
| Gini / Inequality Index | 95,103 | 0.47 |
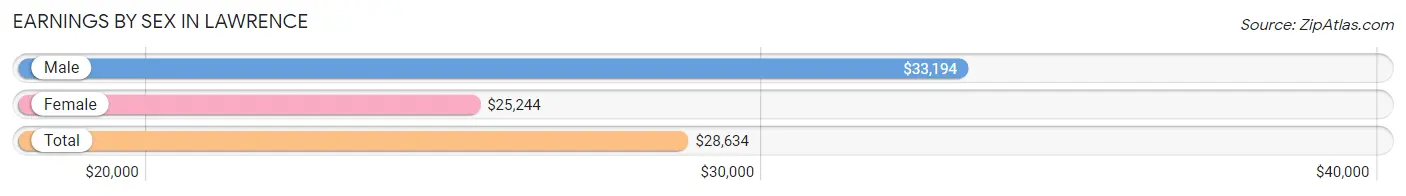
Earnings by Sex in Lawrence
Average Earnings in Lawrence are $28,634, $33,194 for men and $25,244 for women, a difference of 23.9%.
| Sex | Number | Average Earnings |
| Male | 32,638 (51.5%) | $33,194 |
| Female | 30,715 (48.5%) | $25,244 |
| Total | 63,353 (100.0%) | $28,634 |
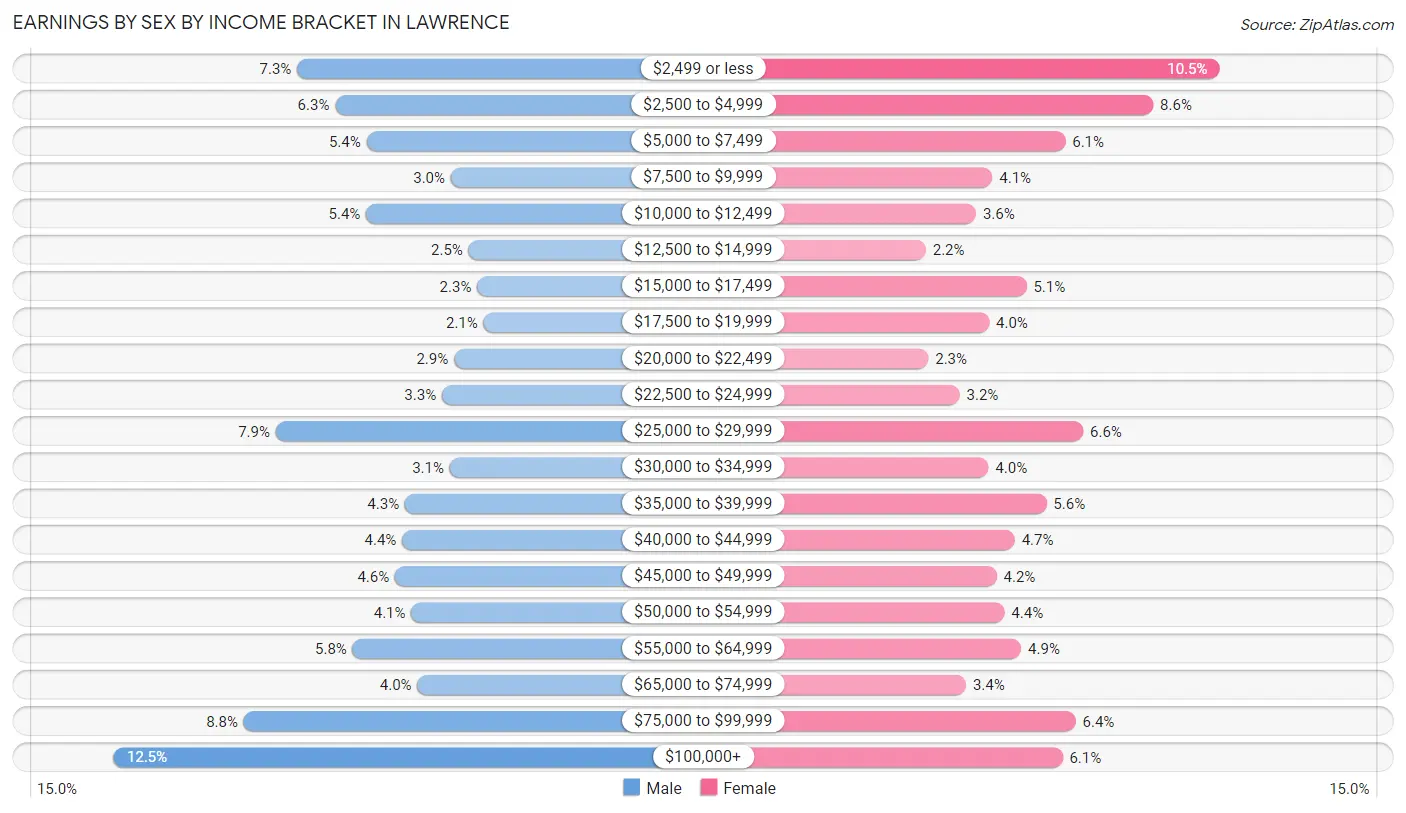
Earnings by Sex by Income Bracket in Lawrence
The most common earnings brackets in Lawrence are $100,000+ for men (4,077 | 12.5%) and $2,499 or less for women (3,216 | 10.5%).
| Income | Male | Female |
| $2,499 or less | 2,395 (7.3%) | 3,216 (10.5%) |
| $2,500 to $4,999 | 2,048 (6.3%) | 2,644 (8.6%) |
| $5,000 to $7,499 | 1,760 (5.4%) | 1,886 (6.1%) |
| $7,500 to $9,999 | 985 (3.0%) | 1,255 (4.1%) |
| $10,000 to $12,499 | 1,762 (5.4%) | 1,115 (3.6%) |
| $12,500 to $14,999 | 821 (2.5%) | 683 (2.2%) |
| $15,000 to $17,499 | 745 (2.3%) | 1,550 (5.1%) |
| $17,500 to $19,999 | 687 (2.1%) | 1,229 (4.0%) |
| $20,000 to $22,499 | 956 (2.9%) | 703 (2.3%) |
| $22,500 to $24,999 | 1,066 (3.3%) | 975 (3.2%) |
| $25,000 to $29,999 | 2,591 (7.9%) | 2,040 (6.6%) |
| $30,000 to $34,999 | 995 (3.0%) | 1,222 (4.0%) |
| $35,000 to $39,999 | 1,407 (4.3%) | 1,723 (5.6%) |
| $40,000 to $44,999 | 1,433 (4.4%) | 1,449 (4.7%) |
| $45,000 to $49,999 | 1,497 (4.6%) | 1,294 (4.2%) |
| $50,000 to $54,999 | 1,348 (4.1%) | 1,362 (4.4%) |
| $55,000 to $64,999 | 1,888 (5.8%) | 1,505 (4.9%) |
| $65,000 to $74,999 | 1,291 (4.0%) | 1,028 (3.4%) |
| $75,000 to $99,999 | 2,886 (8.8%) | 1,974 (6.4%) |
| $100,000+ | 4,077 (12.5%) | 1,862 (6.1%) |
| Total | 32,638 (100.0%) | 30,715 (100.0%) |
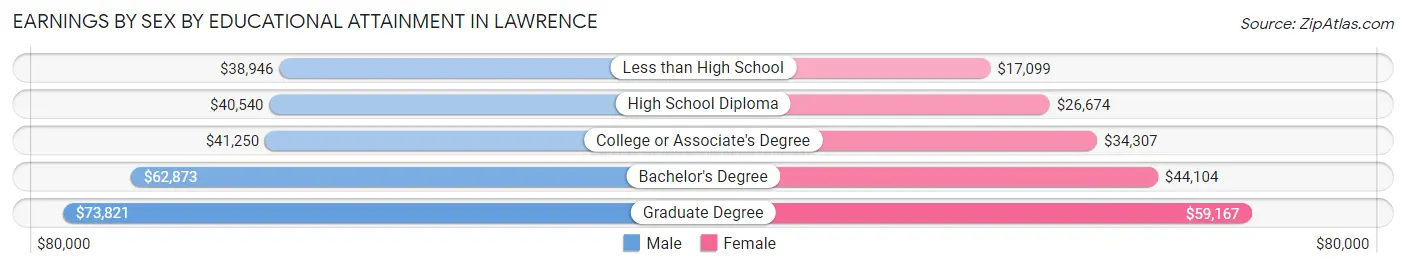
Earnings by Sex by Educational Attainment in Lawrence
Average earnings in Lawrence are $50,318 for men and $41,547 for women, a difference of 17.4%. Men with an educational attainment of graduate degree enjoy the highest average annual earnings of $73,821, while those with less than high school education earn the least with $38,946. Women with an educational attainment of graduate degree earn the most with the average annual earnings of $59,167, while those with less than high school education have the smallest earnings of $17,099.
| Educational Attainment | Male Income | Female Income |
| Less than High School | $38,946 | $17,099 |
| High School Diploma | $40,540 | $26,674 |
| College or Associate's Degree | $41,250 | $34,307 |
| Bachelor's Degree | $62,873 | $44,104 |
| Graduate Degree | $73,821 | $59,167 |
| Total | $50,318 | $41,547 |
Family Income in Lawrence
Family Income Brackets in Lawrence
According to the Lawrence family income data, there are 3,938 families falling into the $100,000 to $149,999 income range, which is the most common income bracket and makes up 20.8% of all families. Conversely, the $10,000 to $14,999 income bracket is the least frequent group with only 246 families (1.3%) belonging to this category.
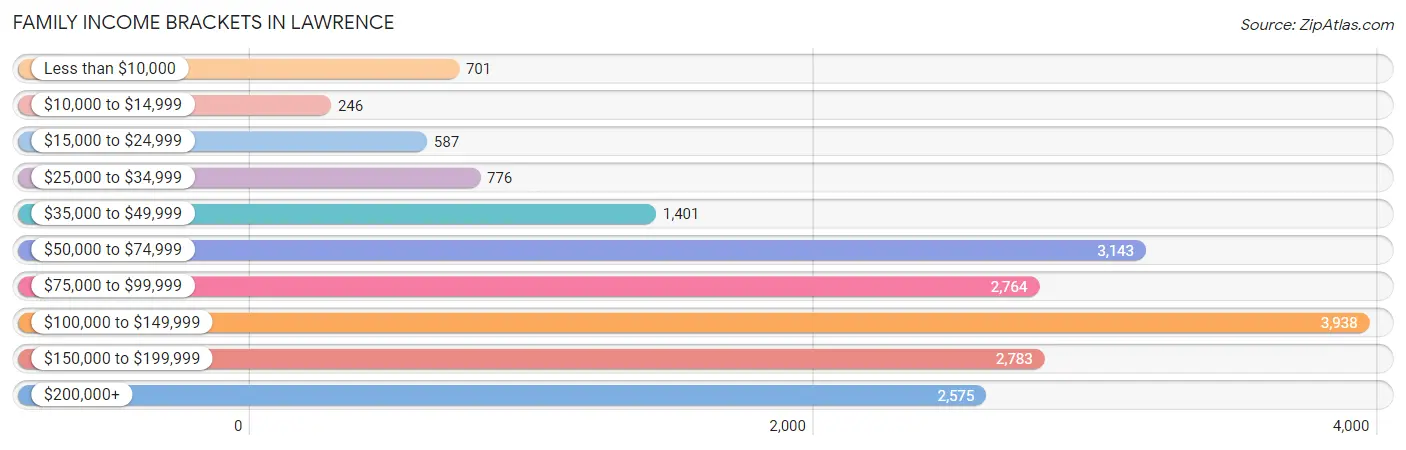
| Income Bracket | # Families | % Families |
| Less than $10,000 | 701 | 3.7% |
| $10,000 to $14,999 | 246 | 1.3% |
| $15,000 to $24,999 | 587 | 3.1% |
| $25,000 to $34,999 | 776 | 4.1% |
| $35,000 to $49,999 | 1,401 | 7.4% |
| $50,000 to $74,999 | 3,143 | 16.6% |
| $75,000 to $99,999 | 2,764 | 14.6% |
| $100,000 to $149,999 | 3,938 | 20.8% |
| $150,000 to $199,999 | 2,783 | 14.7% |
| $200,000+ | 2,575 | 13.6% |
Family Income by Famaliy Size in Lawrence
7+ person families (90 | 0.5%) account for the highest median family income in Lawrence with $205,491 per family, while 2-person families (10,388 | 54.9%) have the highest median income of $44,152 per family member.
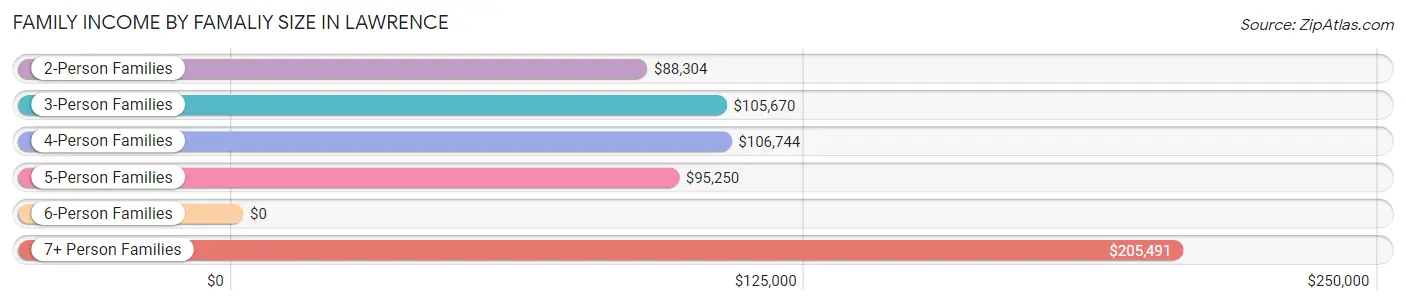
| Income Bracket | # Families | Median Income |
| 2-Person Families | 10,388 (54.9%) | $88,304 |
| 3-Person Families | 3,687 (19.5%) | $105,670 |
| 4-Person Families | 3,246 (17.1%) | $106,744 |
| 5-Person Families | 1,029 (5.4%) | $95,250 |
| 6-Person Families | 494 (2.6%) | $0 |
| 7+ Person Families | 90 (0.5%) | $205,491 |
| Total | 18,934 (100.0%) | $97,893 |
Family Income by Number of Earners in Lawrence
The median family income in Lawrence is $97,893, with families comprising 3+ earners (1,575) having the highest median family income of $139,265, while families with 1 earner (5,023) have the lowest median family income of $60,899, accounting for 8.3% and 26.5% of families, respectively.
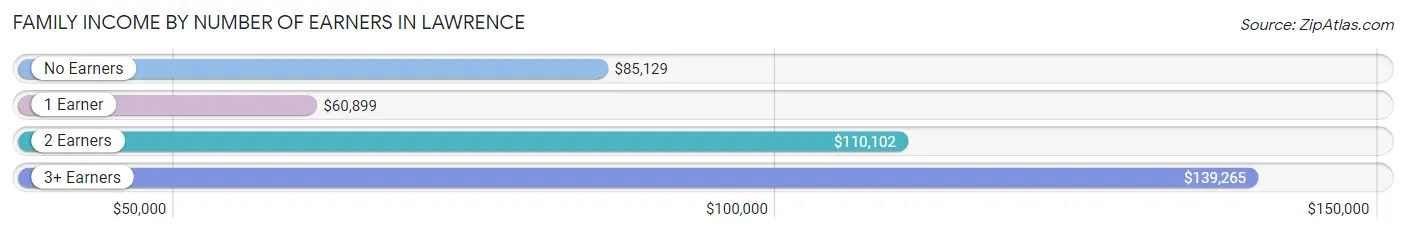
| Number of Earners | # Families | Median Income |
| No Earners | 2,651 (14.0%) | $85,129 |
| 1 Earner | 5,023 (26.5%) | $60,899 |
| 2 Earners | 9,685 (51.1%) | $110,102 |
| 3+ Earners | 1,575 (8.3%) | $139,265 |
| Total | 18,934 (100.0%) | $97,893 |
Household Income in Lawrence
Household Income Brackets in Lawrence
With 7,015 households falling in the category, the $50,000 to $74,999 income range is the most frequent in Lawrence, accounting for 17.2% of all households. In contrast, only 1,428 households (3.5%) fall into the $10,000 to $14,999 income bracket, making it the least populous group.
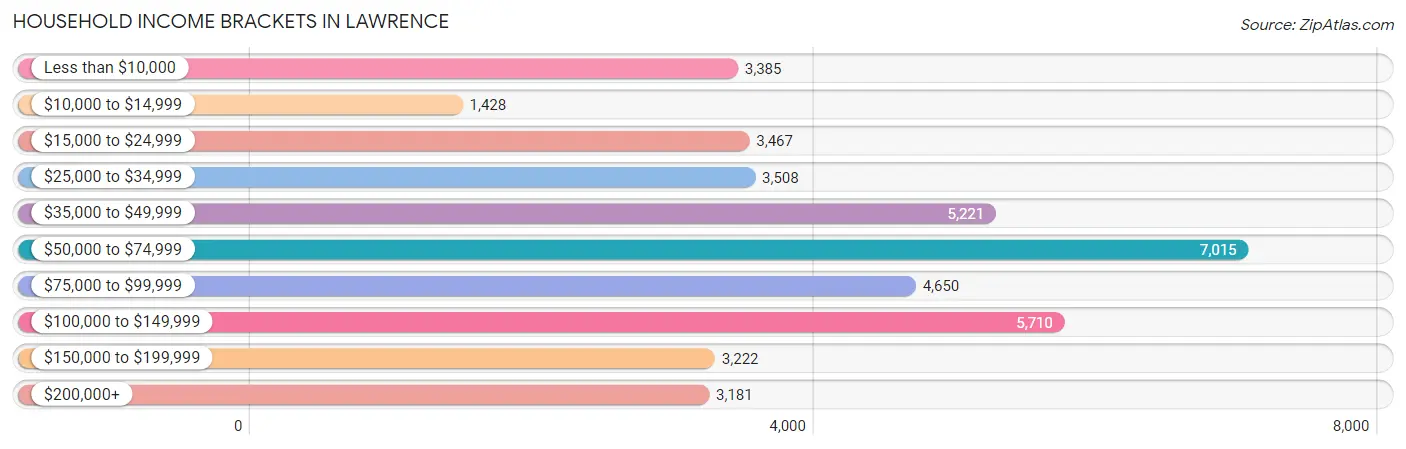
| Income Bracket | # Households | % Households |
| Less than $10,000 | 3,385 | 8.3% |
| $10,000 to $14,999 | 1,428 | 3.5% |
| $15,000 to $24,999 | 3,467 | 8.5% |
| $25,000 to $34,999 | 3,508 | 8.6% |
| $35,000 to $49,999 | 5,221 | 12.8% |
| $50,000 to $74,999 | 7,015 | 17.2% |
| $75,000 to $99,999 | 4,650 | 11.4% |
| $100,000 to $149,999 | 5,710 | 14.0% |
| $150,000 to $199,999 | 3,222 | 7.9% |
| $200,000+ | 3,181 | 7.8% |
Household Income by Householder Age in Lawrence
The median household income in Lawrence is $59,834, with the highest median household income of $87,016 found in the 45 to 64 years age bracket for the primary householder. A total of 9,495 households (23.3%) fall into this category. Meanwhile, the 15 to 24 years age bracket for the primary householder has the lowest median household income of $30,417, with 8,517 households (20.9%) in this group.
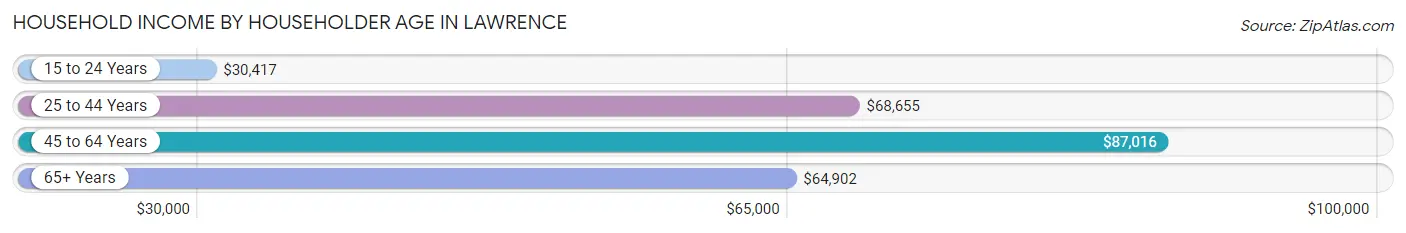
| Income Bracket | # Households | Median Income |
| 15 to 24 Years | 8,517 (20.9%) | $30,417 |
| 25 to 44 Years | 14,612 (35.8%) | $68,655 |
| 45 to 64 Years | 9,495 (23.3%) | $87,016 |
| 65+ Years | 8,162 (20.0%) | $64,902 |
| Total | 40,786 (100.0%) | $59,834 |
Poverty in Lawrence
Income Below Poverty by Sex and Age in Lawrence
With 19.0% poverty level for males and 18.7% for females among the residents of Lawrence, 18 to 24 year old males and 18 to 24 year old females are the most vulnerable to poverty, with 5,286 males (54.5%) and 4,770 females (51.5%) in their respective age groups living below the poverty level.
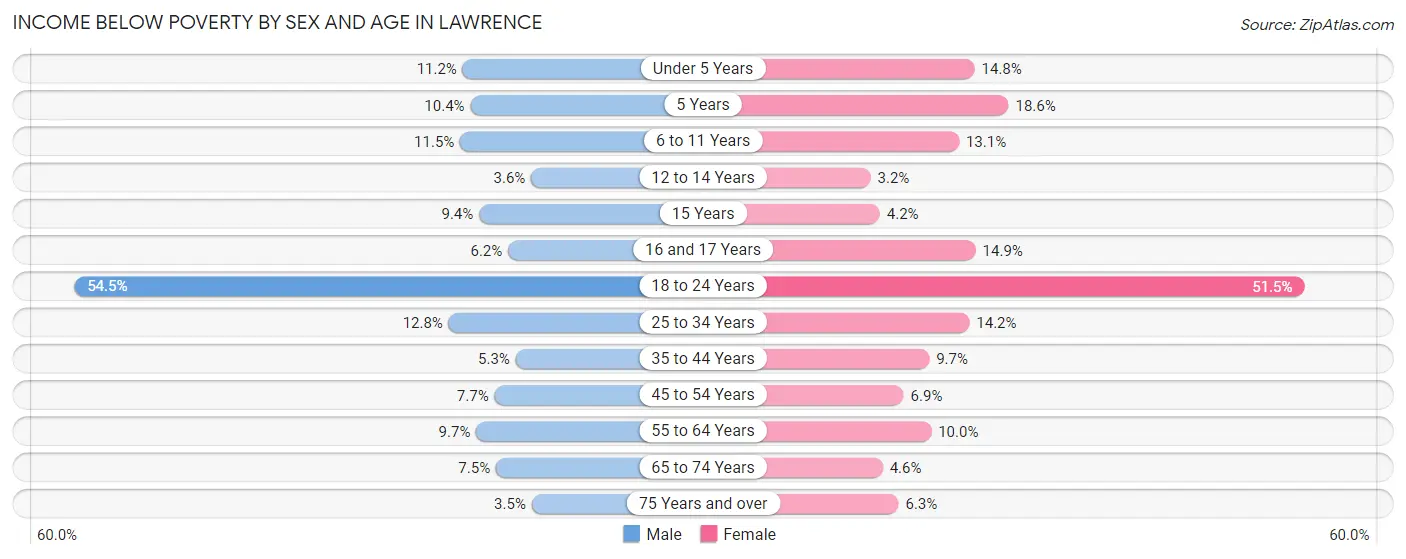
| Age Bracket | Male | Female |
| Under 5 Years | 240 (11.2%) | 308 (14.8%) |
| 5 Years | 53 (10.3%) | 117 (18.6%) |
| 6 to 11 Years | 279 (11.5%) | 380 (13.1%) |
| 12 to 14 Years | 40 (3.6%) | 40 (3.2%) |
| 15 Years | 66 (9.4%) | 19 (4.2%) |
| 16 and 17 Years | 41 (6.1%) | 79 (14.9%) |
| 18 to 24 Years | 5,286 (54.5%) | 4,770 (51.5%) |
| 25 to 34 Years | 984 (12.8%) | 974 (14.2%) |
| 35 to 44 Years | 314 (5.3%) | 521 (9.7%) |
| 45 to 54 Years | 326 (7.7%) | 312 (6.9%) |
| 55 to 64 Years | 339 (9.7%) | 353 (10.0%) |
| 65 to 74 Years | 230 (7.5%) | 179 (4.6%) |
| 75 Years and over | 64 (3.5%) | 175 (6.3%) |
| Total | 8,262 (19.0%) | 8,227 (18.7%) |
Income Above Poverty by Sex and Age in Lawrence
According to the poverty statistics in Lawrence, males aged 75 years and over and females aged 12 to 14 years are the age groups that are most secure financially, with 96.5% of males and 96.8% of females in these age groups living above the poverty line.
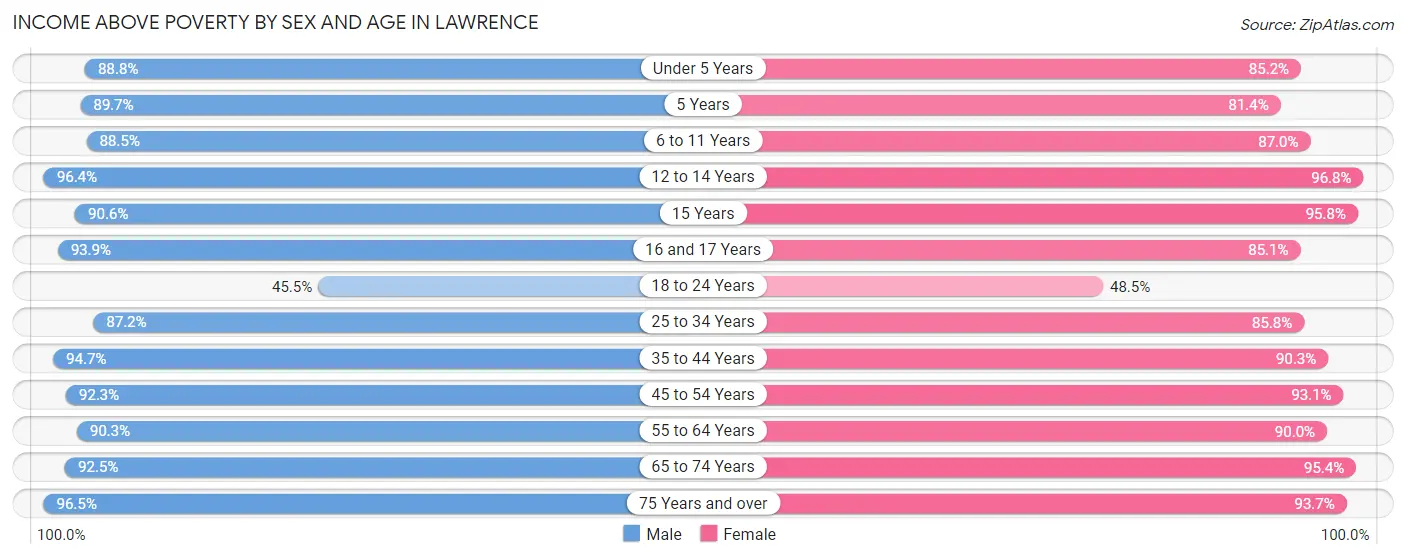
| Age Bracket | Male | Female |
| Under 5 Years | 1,900 (88.8%) | 1,774 (85.2%) |
| 5 Years | 459 (89.6%) | 513 (81.4%) |
| 6 to 11 Years | 2,149 (88.5%) | 2,532 (87.0%) |
| 12 to 14 Years | 1,077 (96.4%) | 1,206 (96.8%) |
| 15 Years | 638 (90.6%) | 429 (95.8%) |
| 16 and 17 Years | 626 (93.9%) | 451 (85.1%) |
| 18 to 24 Years | 4,418 (45.5%) | 4,490 (48.5%) |
| 25 to 34 Years | 6,722 (87.2%) | 5,881 (85.8%) |
| 35 to 44 Years | 5,594 (94.7%) | 4,827 (90.3%) |
| 45 to 54 Years | 3,925 (92.3%) | 4,218 (93.1%) |
| 55 to 64 Years | 3,157 (90.3%) | 3,192 (90.0%) |
| 65 to 74 Years | 2,837 (92.5%) | 3,748 (95.4%) |
| 75 Years and over | 1,752 (96.5%) | 2,594 (93.7%) |
| Total | 35,254 (81.0%) | 35,855 (81.3%) |
Income Below Poverty Among Married-Couple Families in Lawrence
The poverty statistics for married-couple families in Lawrence show that 2.0% or 296 of the total 14,802 families live below the poverty line. Families with 3 or 4 children have the highest poverty rate of 4.0%, comprising of 41 families. On the other hand, families with 5 or more children have the lowest poverty rate of 0.0%, which includes 0 families.
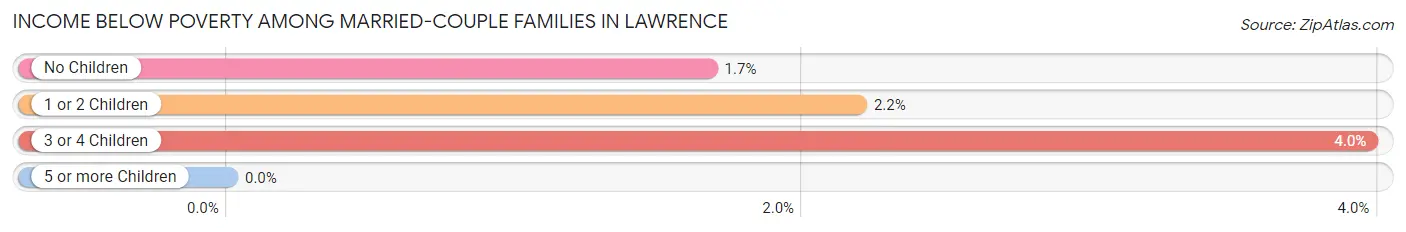
| Children | Above Poverty | Below Poverty |
| No Children | 8,730 (98.3%) | 148 (1.7%) |
| 1 or 2 Children | 4,772 (97.8%) | 107 (2.2%) |
| 3 or 4 Children | 993 (96.0%) | 41 (4.0%) |
| 5 or more Children | 11 (100.0%) | 0 (0.0%) |
| Total | 14,506 (98.0%) | 296 (2.0%) |
Income Below Poverty Among Single-Parent Households in Lawrence
According to the poverty data in Lawrence, 17.6% or 202 single-father households and 28.5% or 849 single-mother households are living below the poverty line. Among single-father households, those with 3 or 4 children have the highest poverty rate, with 18 households (41.9%) experiencing poverty. Likewise, among single-mother households, those with 3 or 4 children have the highest poverty rate, with 174 households (60.4%) falling below the poverty line.
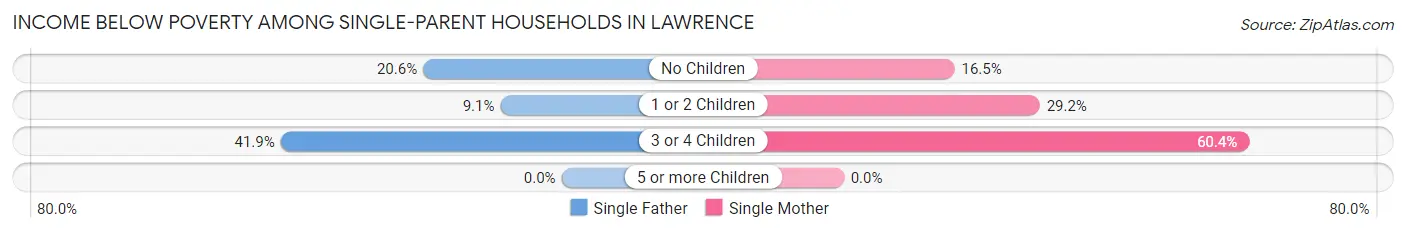
| Children | Single Father | Single Mother |
| No Children | 149 (20.6%) | 146 (16.5%) |
| 1 or 2 Children | 35 (9.1%) | 529 (29.2%) |
| 3 or 4 Children | 18 (41.9%) | 174 (60.4%) |
| 5 or more Children | 0 (0.0%) | 0 (0.0%) |
| Total | 202 (17.6%) | 849 (28.5%) |
Income Below Poverty Among Married-Couple vs Single-Parent Households in Lawrence
The poverty data for Lawrence shows that 296 of the married-couple family households (2.0%) and 1,051 of the single-parent households (25.4%) are living below the poverty level. Within the married-couple family households, those with 3 or 4 children have the highest poverty rate, with 41 households (4.0%) falling below the poverty line. Among the single-parent households, those with 3 or 4 children have the highest poverty rate, with 192 household (58.0%) living below poverty.
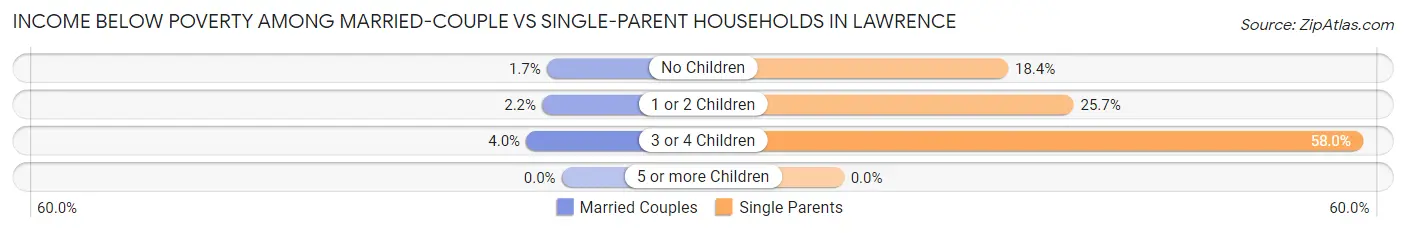
| Children | Married-Couple Families | Single-Parent Households |
| No Children | 148 (1.7%) | 295 (18.4%) |
| 1 or 2 Children | 107 (2.2%) | 564 (25.7%) |
| 3 or 4 Children | 41 (4.0%) | 192 (58.0%) |
| 5 or more Children | 0 (0.0%) | 0 (0.0%) |
| Total | 296 (2.0%) | 1,051 (25.4%) |
Race in Lawrence
The most populous races in Lawrence are White / Caucasian (73,450 | 77.2%), Two or more Races (8,452 | 8.9%), and Hispanic or Latino (6,921 | 7.3%).
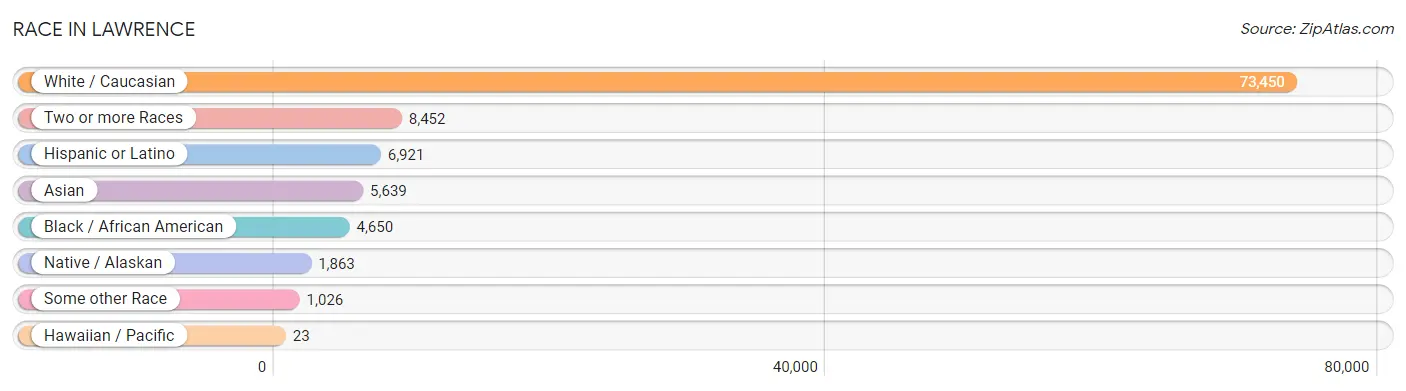
| Race | # Population | % Population |
| Asian | 5,639 | 5.9% |
| Black / African American | 4,650 | 4.9% |
| Hawaiian / Pacific | 23 | 0.0% |
| Hispanic or Latino | 6,921 | 7.3% |
| Native / Alaskan | 1,863 | 2.0% |
| White / Caucasian | 73,450 | 77.2% |
| Two or more Races | 8,452 | 8.9% |
| Some other Race | 1,026 | 1.1% |
| Total | 95,103 | 100.0% |
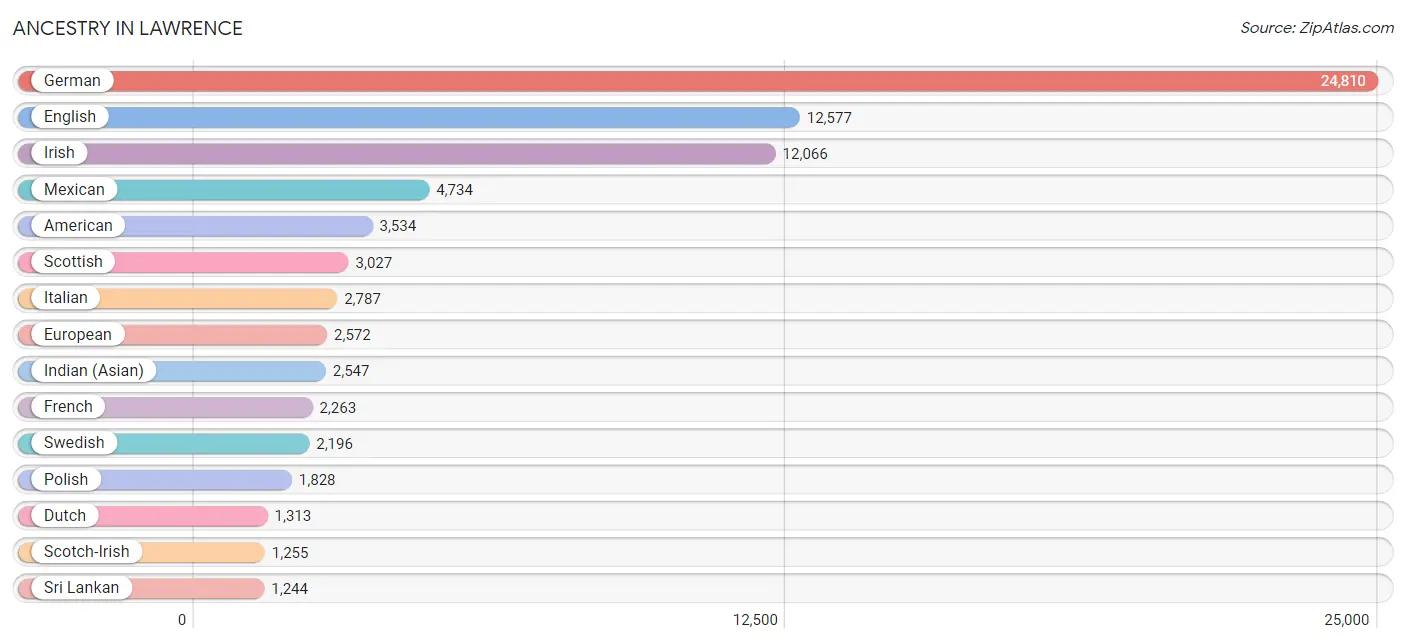
Ancestry in Lawrence
The most populous ancestries reported in Lawrence are German (24,810 | 26.1%), English (12,577 | 13.2%), Irish (12,066 | 12.7%), Mexican (4,734 | 5.0%), and American (3,534 | 3.7%), together accounting for 60.7% of all Lawrence residents.
| Ancestry | # Population | % Population |
| African | 190 | 0.2% |
| American | 3,534 | 3.7% |
| Apache | 31 | 0.0% |
| Arab | 894 | 0.9% |
| Argentinean | 53 | 0.1% |
| Australian | 18 | 0.0% |
| Austrian | 268 | 0.3% |
| Belgian | 280 | 0.3% |
| Bhutanese | 221 | 0.2% |
| Blackfeet | 193 | 0.2% |
| Brazilian | 97 | 0.1% |
| British | 774 | 0.8% |
| Burmese | 472 | 0.5% |
| Canadian | 127 | 0.1% |
| Cape Verdean | 7 | 0.0% |
| Carpatho Rusyn | 9 | 0.0% |
| Celtic | 32 | 0.0% |
| Central American | 287 | 0.3% |
| Central American Indian | 40 | 0.0% |
| Cherokee | 622 | 0.6% |
| Cheyenne | 84 | 0.1% |
| Chickasaw | 88 | 0.1% |
| Chippewa | 74 | 0.1% |
| Choctaw | 142 | 0.2% |
| Colombian | 135 | 0.1% |
| Comanche | 116 | 0.1% |
| Costa Rican | 48 | 0.1% |
| Creek | 194 | 0.2% |
| Croatian | 232 | 0.2% |
| Crow | 83 | 0.1% |
| Cuban | 96 | 0.1% |
| Czech | 1,134 | 1.2% |
| Czechoslovakian | 202 | 0.2% |
| Danish | 475 | 0.5% |
| Delaware | 82 | 0.1% |
| Dominican | 42 | 0.0% |
| Dutch | 1,313 | 1.4% |
| Eastern European | 196 | 0.2% |
| Ecuadorian | 29 | 0.0% |
| Egyptian | 69 | 0.1% |
| English | 12,577 | 13.2% |
| Ethiopian | 27 | 0.0% |
| European | 2,572 | 2.7% |
| Filipino | 58 | 0.1% |
| Finnish | 109 | 0.1% |
| French | 2,263 | 2.4% |
| French American Indian | 77 | 0.1% |
| French Canadian | 189 | 0.2% |
| German | 24,810 | 26.1% |
| German Russian | 11 | 0.0% |
| Greek | 304 | 0.3% |
| Guatemalan | 21 | 0.0% |
| Honduran | 102 | 0.1% |
| Hungarian | 363 | 0.4% |
| Indian (Asian) | 2,547 | 2.7% |
| Indonesian | 29 | 0.0% |
| Inupiat | 8 | 0.0% |
| Iranian | 122 | 0.1% |
| Iraqi | 391 | 0.4% |
| Irish | 12,066 | 12.7% |
| Iroquois | 42 | 0.0% |
| Israeli | 12 | 0.0% |
| Italian | 2,787 | 2.9% |
| Jamaican | 132 | 0.1% |
| Japanese | 30 | 0.0% |
| Jordanian | 80 | 0.1% |
| Kiowa | 86 | 0.1% |
| Korean | 694 | 0.7% |
| Lebanese | 30 | 0.0% |
| Lithuanian | 60 | 0.1% |
| Macedonian | 23 | 0.0% |
| Malaysian | 410 | 0.4% |
| Mexican | 4,734 | 5.0% |
| Mexican American Indian | 32 | 0.0% |
| Mongolian | 33 | 0.0% |
| Native Hawaiian | 108 | 0.1% |
| Navajo | 275 | 0.3% |
| Nicaraguan | 17 | 0.0% |
| Nigerian | 197 | 0.2% |
| Northern European | 210 | 0.2% |
| Norwegian | 1,128 | 1.2% |
| Osage | 2 | 0.0% |
| Paiute | 21 | 0.0% |
| Pakistani | 133 | 0.1% |
| Palestinian | 29 | 0.0% |
| Panamanian | 23 | 0.0% |
| Pennsylvania German | 17 | 0.0% |
| Peruvian | 104 | 0.1% |
| Polish | 1,828 | 1.9% |
| Portuguese | 58 | 0.1% |
| Potawatomi | 121 | 0.1% |
| Pueblo | 80 | 0.1% |
| Puerto Rican | 653 | 0.7% |
| Romanian | 19 | 0.0% |
| Russian | 631 | 0.7% |
| Salvadoran | 76 | 0.1% |
| Samoan | 36 | 0.0% |
| Scandinavian | 398 | 0.4% |
| Scotch-Irish | 1,255 | 1.3% |
| Scottish | 3,027 | 3.2% |
| Seminole | 38 | 0.0% |
| Senegalese | 426 | 0.4% |
| Serbian | 35 | 0.0% |
| Shoshone | 23 | 0.0% |
| Sioux | 460 | 0.5% |
| Slavic | 80 | 0.1% |
| Slovak | 31 | 0.0% |
| Slovene | 44 | 0.1% |
| South American | 494 | 0.5% |
| South American Indian | 22 | 0.0% |
| Spaniard | 295 | 0.3% |
| Spanish | 80 | 0.1% |
| Sri Lankan | 1,244 | 1.3% |
| Subsaharan African | 834 | 0.9% |
| Swedish | 2,196 | 2.3% |
| Swiss | 534 | 0.6% |
| Syrian | 159 | 0.2% |
| Thai | 702 | 0.7% |
| Tohono O'Odham | 12 | 0.0% |
| Tongan | 4 | 0.0% |
| Turkish | 54 | 0.1% |
| Ukrainian | 238 | 0.3% |
| Venezuelan | 161 | 0.2% |
| Vietnamese | 30 | 0.0% |
| Welsh | 867 | 0.9% |
| Yakama | 3 | 0.0% |
| Yugoslavian | 17 | 0.0% |
| Yuman | 34 | 0.0% |
| Yup'ik | 25 | 0.0% | View All 129 Rows |
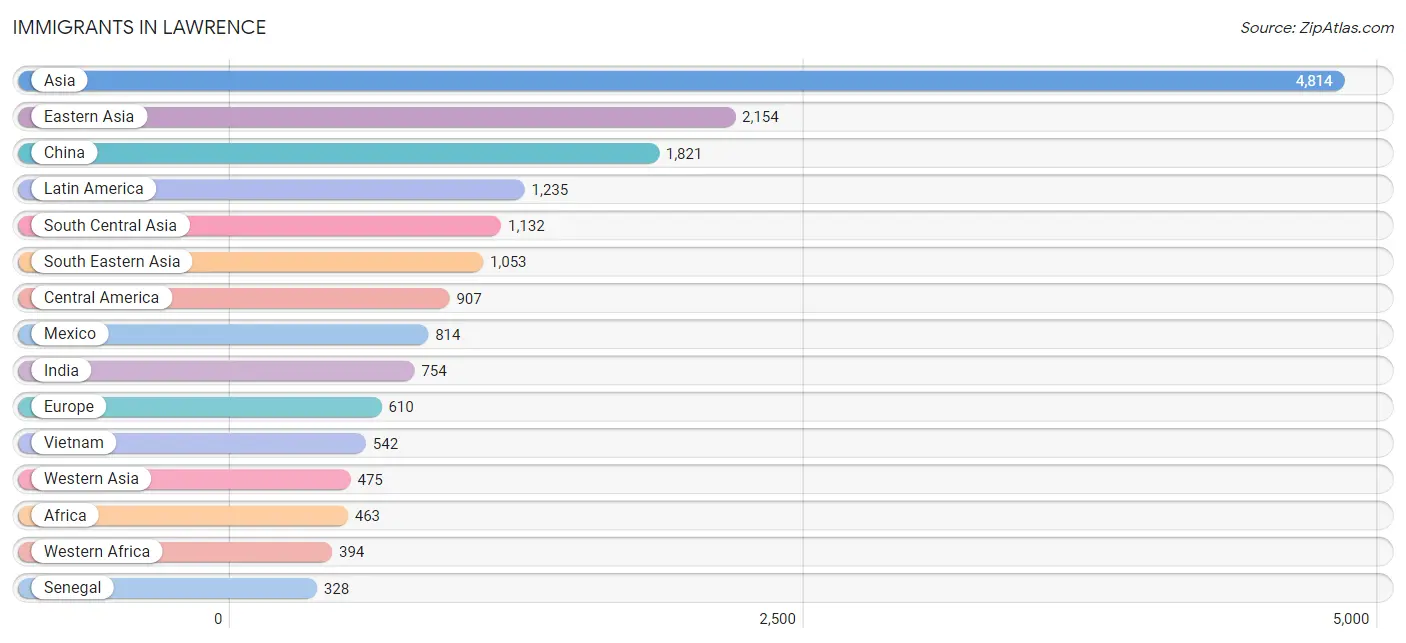
Immigrants in Lawrence
The most numerous immigrant groups reported in Lawrence came from Asia (4,814 | 5.1%), Eastern Asia (2,154 | 2.3%), China (1,821 | 1.9%), Latin America (1,235 | 1.3%), and South Central Asia (1,132 | 1.2%), together accounting for 11.7% of all Lawrence residents.
| Immigration Origin | # Population | % Population |
| Africa | 463 | 0.5% |
| Asia | 4,814 | 5.1% |
| Bolivia | 12 | 0.0% |
| Brazil | 115 | 0.1% |
| Canada | 222 | 0.2% |
| Caribbean | 33 | 0.0% |
| Central America | 907 | 0.9% |
| China | 1,821 | 1.9% |
| Colombia | 47 | 0.1% |
| Cuba | 33 | 0.0% |
| Czechoslovakia | 18 | 0.0% |
| Eastern Africa | 45 | 0.1% |
| Eastern Asia | 2,154 | 2.3% |
| Eastern Europe | 271 | 0.3% |
| Ecuador | 29 | 0.0% |
| El Salvador | 26 | 0.0% |
| England | 86 | 0.1% |
| Ethiopia | 24 | 0.0% |
| Europe | 610 | 0.6% |
| France | 23 | 0.0% |
| Germany | 113 | 0.1% |
| Honduras | 50 | 0.1% |
| India | 754 | 0.8% |
| Iran | 113 | 0.1% |
| Iraq | 96 | 0.1% |
| Japan | 171 | 0.2% |
| Jordan | 80 | 0.1% |
| Kazakhstan | 19 | 0.0% |
| Kenya | 12 | 0.0% |
| Korea | 162 | 0.2% |
| Kuwait | 112 | 0.1% |
| Laos | 226 | 0.2% |
| Latin America | 1,235 | 1.3% |
| Lebanon | 18 | 0.0% |
| Malaysia | 33 | 0.0% |
| Mexico | 814 | 0.9% |
| Nepal | 134 | 0.1% |
| Nicaragua | 17 | 0.0% |
| Nigeria | 57 | 0.1% |
| Northern Europe | 196 | 0.2% |
| Pakistan | 87 | 0.1% |
| Philippines | 198 | 0.2% |
| Poland | 50 | 0.1% |
| Romania | 11 | 0.0% |
| Russia | 56 | 0.1% |
| Saudi Arabia | 21 | 0.0% |
| Scotland | 39 | 0.0% |
| Senegal | 328 | 0.3% |
| Serbia | 35 | 0.0% |
| Singapore | 33 | 0.0% |
| South Africa | 24 | 0.0% |
| South America | 295 | 0.3% |
| South Central Asia | 1,132 | 1.2% |
| South Eastern Asia | 1,053 | 1.1% |
| Southern Europe | 7 | 0.0% |
| Spain | 7 | 0.0% |
| Sri Lanka | 8 | 0.0% |
| Syria | 38 | 0.0% |
| Thailand | 21 | 0.0% |
| Ukraine | 35 | 0.0% |
| Uzbekistan | 2 | 0.0% |
| Venezuela | 92 | 0.1% |
| Vietnam | 542 | 0.6% |
| Western Africa | 394 | 0.4% |
| Western Asia | 475 | 0.5% |
| Western Europe | 136 | 0.1% |
| Zimbabwe | 9 | 0.0% | View All 67 Rows |
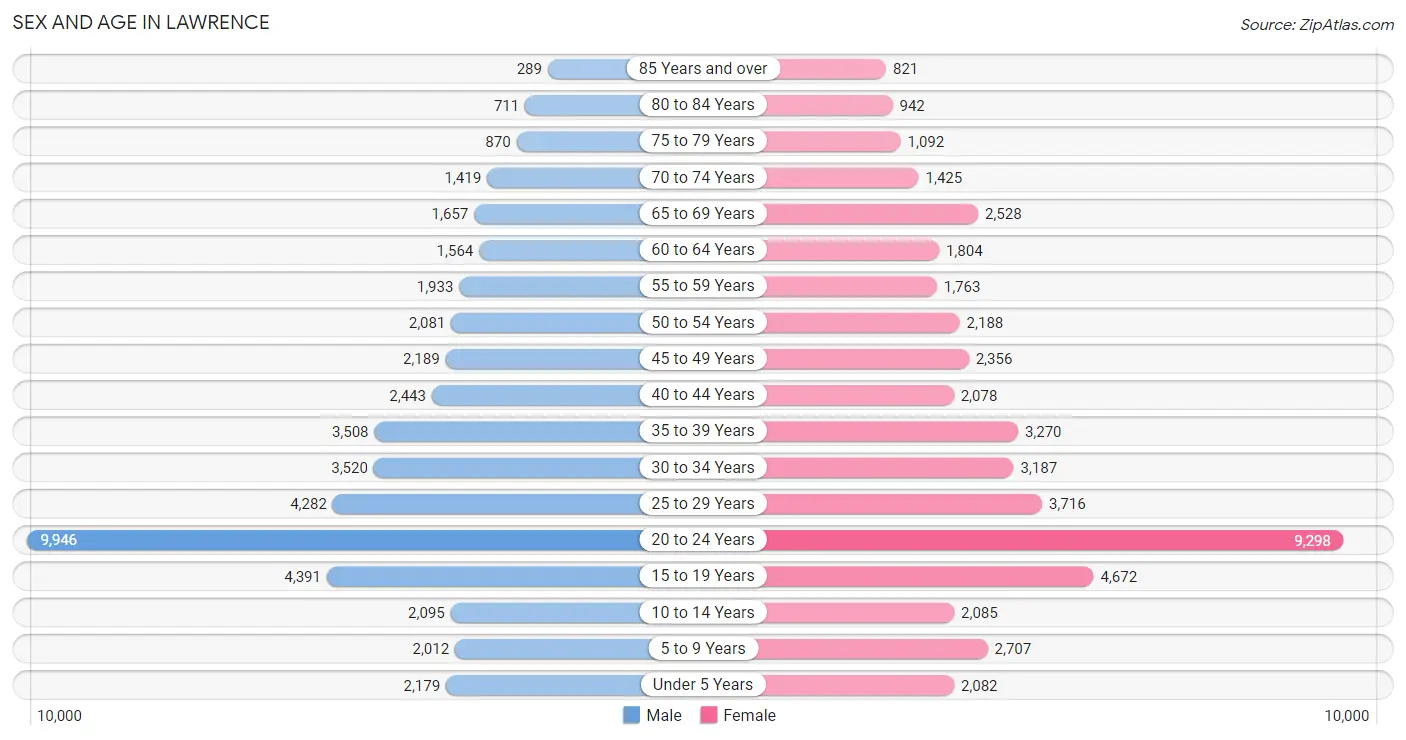
Sex and Age in Lawrence
Sex and Age in Lawrence
The most populous age groups in Lawrence are 20 to 24 Years (9,946 | 21.1%) for men and 20 to 24 Years (9,298 | 19.4%) for women.
| Age Bracket | Male | Female |
| Under 5 Years | 2,179 (4.6%) | 2,082 (4.3%) |
| 5 to 9 Years | 2,012 (4.3%) | 2,707 (5.6%) |
| 10 to 14 Years | 2,095 (4.4%) | 2,085 (4.3%) |
| 15 to 19 Years | 4,391 (9.3%) | 4,672 (9.7%) |
| 20 to 24 Years | 9,946 (21.1%) | 9,298 (19.4%) |
| 25 to 29 Years | 4,282 (9.1%) | 3,716 (7.7%) |
| 30 to 34 Years | 3,520 (7.5%) | 3,187 (6.6%) |
| 35 to 39 Years | 3,508 (7.4%) | 3,270 (6.8%) |
| 40 to 44 Years | 2,443 (5.2%) | 2,078 (4.3%) |
| 45 to 49 Years | 2,189 (4.6%) | 2,356 (4.9%) |
| 50 to 54 Years | 2,081 (4.4%) | 2,188 (4.6%) |
| 55 to 59 Years | 1,933 (4.1%) | 1,763 (3.7%) |
| 60 to 64 Years | 1,564 (3.3%) | 1,804 (3.8%) |
| 65 to 69 Years | 1,657 (3.5%) | 2,528 (5.3%) |
| 70 to 74 Years | 1,419 (3.0%) | 1,425 (3.0%) |
| 75 to 79 Years | 870 (1.8%) | 1,092 (2.3%) |
| 80 to 84 Years | 711 (1.5%) | 942 (2.0%) |
| 85 Years and over | 289 (0.6%) | 821 (1.7%) |
| Total | 47,089 (100.0%) | 48,014 (100.0%) |
Families and Households in Lawrence
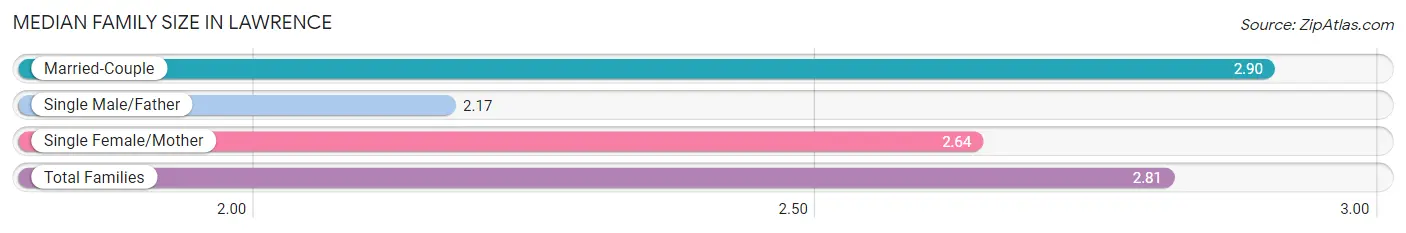
Median Family Size in Lawrence
The median family size in Lawrence is 2.81 persons per family, with married-couple families (14,802 | 78.2%) accounting for the largest median family size of 2.9 persons per family. On the other hand, single male/father families (1,149 | 6.1%) represent the smallest median family size with 2.17 persons per family.
| Family Type | # Families | Family Size |
| Married-Couple | 14,802 (78.2%) | 2.90 |
| Single Male/Father | 1,149 (6.1%) | 2.17 |
| Single Female/Mother | 2,983 (15.8%) | 2.64 |
| Total Families | 18,934 (100.0%) | 2.81 |
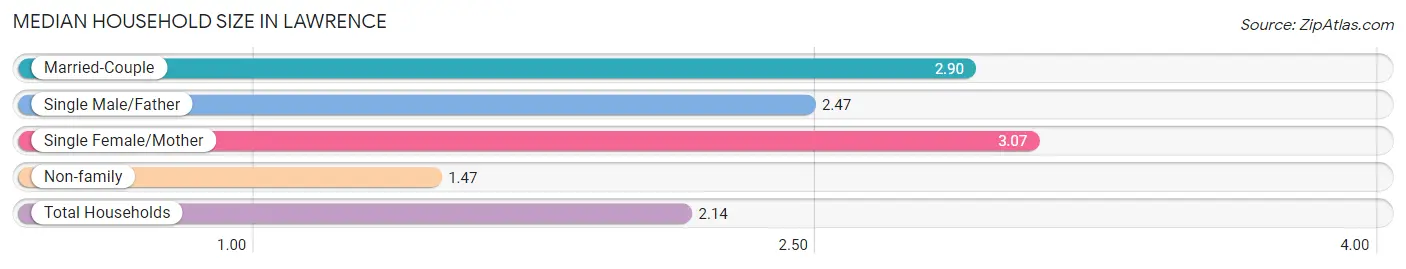
Median Household Size in Lawrence
The median household size in Lawrence is 2.14 persons per household, with single female/mother households (2,983 | 7.3%) accounting for the largest median household size of 3.07 persons per household. non-family households (21,852 | 53.6%) represent the smallest median household size with 1.47 persons per household.
| Household Type | # Households | Household Size |
| Married-Couple | 14,802 (36.3%) | 2.90 |
| Single Male/Father | 1,149 (2.8%) | 2.47 |
| Single Female/Mother | 2,983 (7.3%) | 3.07 |
| Non-family | 21,852 (53.6%) | 1.47 |
| Total Households | 40,786 (100.0%) | 2.14 |
Household Size by Marriage Status in Lawrence
Out of a total of 40,786 households in Lawrence, 18,934 (46.4%) are family households, while 21,852 (53.6%) are nonfamily households. The most numerous type of family households are 2-person households, comprising 9,312, and the most common type of nonfamily households are 1-person households, comprising 13,768.
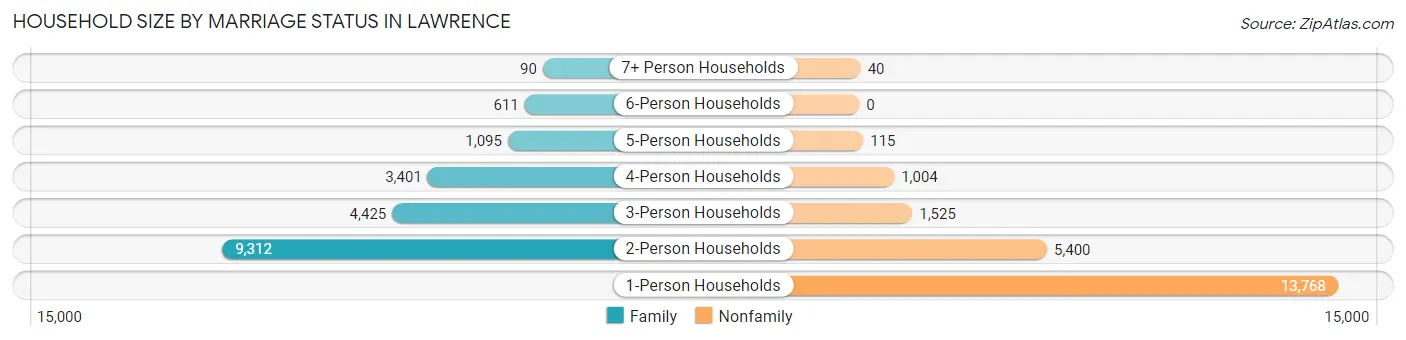
| Household Size | Family Households | Nonfamily Households |
| 1-Person Households | - | 13,768 (33.8%) |
| 2-Person Households | 9,312 (22.8%) | 5,400 (13.2%) |
| 3-Person Households | 4,425 (10.8%) | 1,525 (3.7%) |
| 4-Person Households | 3,401 (8.3%) | 1,004 (2.5%) |
| 5-Person Households | 1,095 (2.7%) | 115 (0.3%) |
| 6-Person Households | 611 (1.5%) | 0 (0.0%) |
| 7+ Person Households | 90 (0.2%) | 40 (0.1%) |
| Total | 18,934 (46.4%) | 21,852 (53.6%) |
Female Fertility in Lawrence
Fertility by Age in Lawrence
Average fertility rate in Lawrence is 36.0 births per 1,000 women. Women in the age bracket of 20 to 34 years have the highest fertility rate with 44.0 births per 1,000 women. Women in the age bracket of 20 to 34 years acount for 68.9% of all women with births.
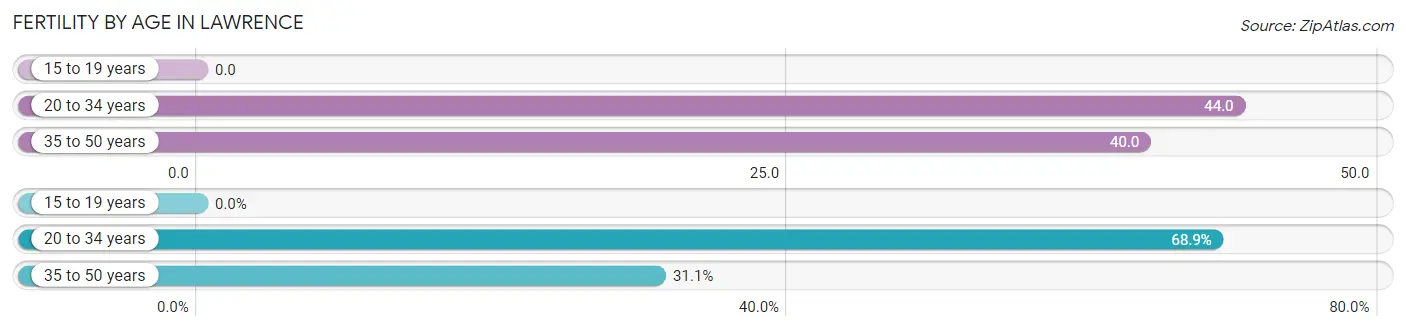
| Age Bracket | Women with Births | Births / 1,000 Women |
| 15 to 19 years | 0 (0.0%) | 0.0 |
| 20 to 34 years | 718 (68.9%) | 44.0 |
| 35 to 50 years | 324 (31.1%) | 40.0 |
| Total | 1,042 (100.0%) | 36.0 |
Fertility by Age by Marriage Status in Lawrence
87.6% of women with births (1,042) in Lawrence are married. The highest percentage of unmarried women with births falls into 20 to 34 years age bracket with 14.2% of them unmarried at the time of birth, while the lowest percentage of unmarried women with births belong to 35 to 50 years age bracket with 8.3% of them unmarried.
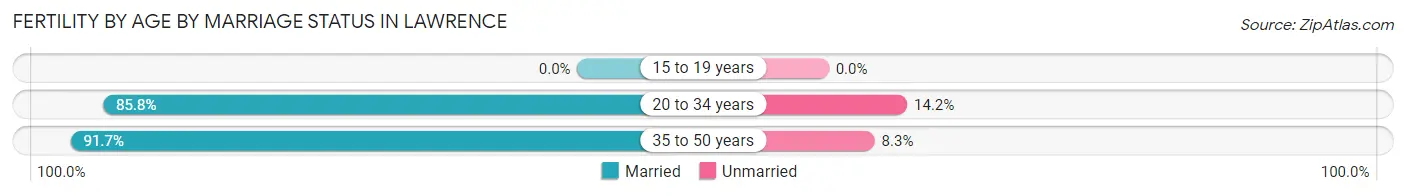
| Age Bracket | Married | Unmarried |
| 15 to 19 years | 0 (0.0%) | 0 (0.0%) |
| 20 to 34 years | 616 (85.8%) | 102 (14.2%) |
| 35 to 50 years | 297 (91.7%) | 27 (8.3%) |
| Total | 913 (87.6%) | 129 (12.4%) |
Fertility by Education in Lawrence
Average fertility rate in Lawrence is 36.0 births per 1,000 women. Women with the education attainment of graduate degree have the highest fertility rate of 83.0 births per 1,000 women, while women with the education attainment of less than high school have the lowest fertility at 4.0 births per 1,000 women. Women with the education attainment of bachelor's degree represent 47.5% of all women with births.
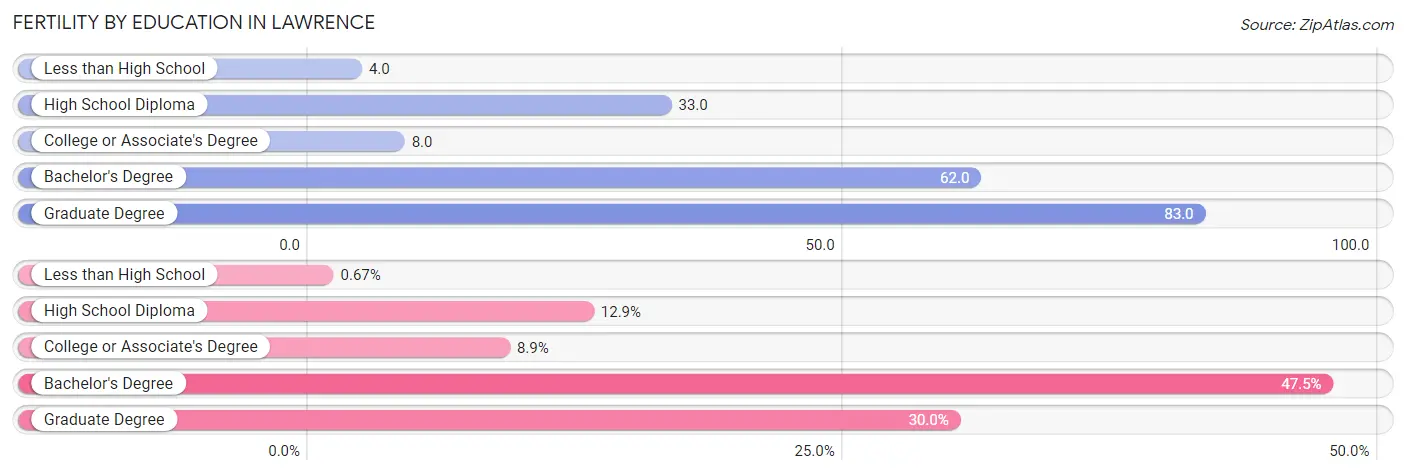
| Educational Attainment | Women with Births | Births / 1,000 Women |
| Less than High School | 7 (0.7%) | 4.0 |
| High School Diploma | 134 (12.9%) | 33.0 |
| College or Associate's Degree | 93 (8.9%) | 8.0 |
| Bachelor's Degree | 495 (47.5%) | 62.0 |
| Graduate Degree | 313 (30.0%) | 83.0 |
| Total | 1,042 (100.0%) | 36.0 |
Fertility by Education by Marriage Status in Lawrence
12.4% of women with births in Lawrence are unmarried. Women with the educational attainment of graduate degree are most likely to be married with 100.0% of them married at childbirth, while women with the educational attainment of less than high school are least likely to be married with 100.0% of them unmarried at childbirth.
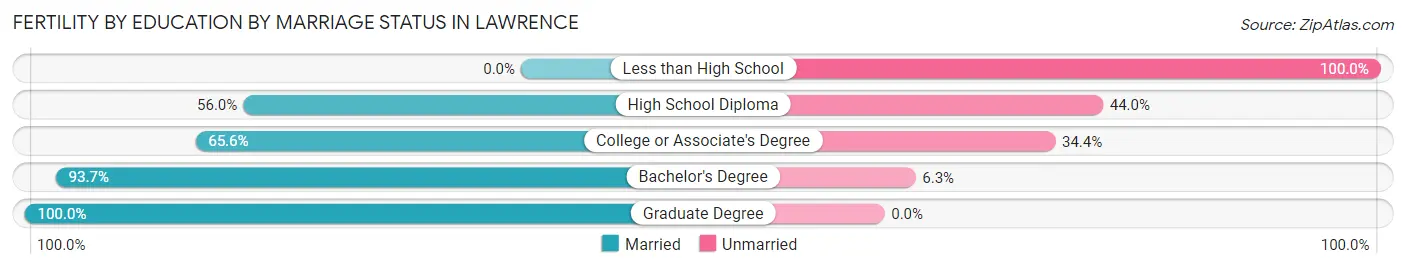
| Educational Attainment | Married | Unmarried |
| Less than High School | 0 (0.0%) | 7 (100.0%) |
| High School Diploma | 75 (56.0%) | 59 (44.0%) |
| College or Associate's Degree | 61 (65.6%) | 32 (34.4%) |
| Bachelor's Degree | 464 (93.7%) | 31 (6.3%) |
| Graduate Degree | 313 (100.0%) | 0 (0.0%) |
| Total | 913 (87.6%) | 129 (12.4%) |
Employment Characteristics in Lawrence
Employment by Class of Employer in Lawrence
Among the 53,833 employed individuals in Lawrence, private company employees (33,084 | 61.5%), state government employees (7,697 | 14.3%), and not-for-profit organizations (5,780 | 10.7%) make up the most common classes of employment.
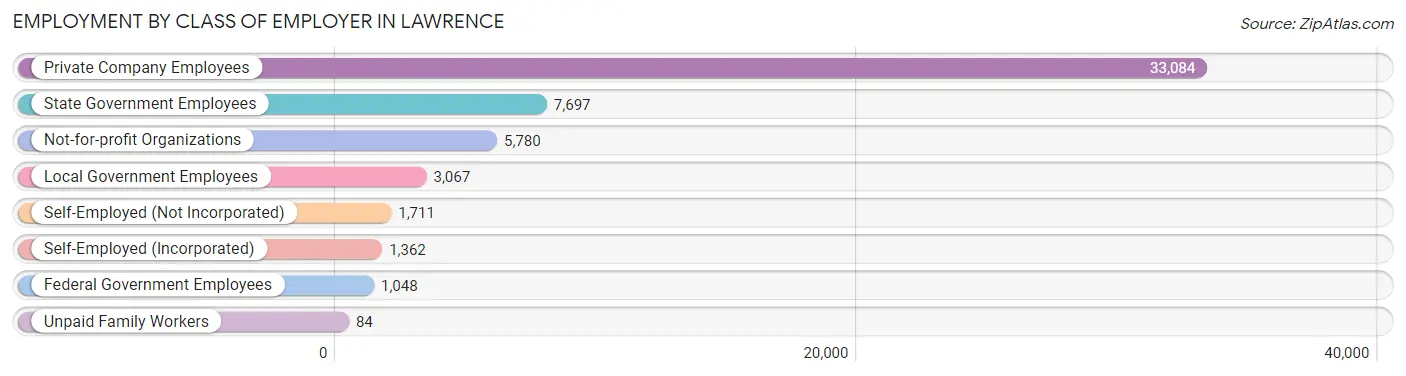
| Employer Class | # Employees | % Employees |
| Private Company Employees | 33,084 | 61.5% |
| Self-Employed (Incorporated) | 1,362 | 2.5% |
| Self-Employed (Not Incorporated) | 1,711 | 3.2% |
| Not-for-profit Organizations | 5,780 | 10.7% |
| Local Government Employees | 3,067 | 5.7% |
| State Government Employees | 7,697 | 14.3% |
| Federal Government Employees | 1,048 | 1.9% |
| Unpaid Family Workers | 84 | 0.2% |
| Total | 53,833 | 100.0% |
Employment Status by Age in Lawrence
According to the labor force statistics for Lawrence, out of the total population over 16 years of age (80,791), 71.8% or 58,008 individuals are in the labor force, with 5.2% or 3,016 of them unemployed. The age group with the highest labor force participation rate is 30 to 34 years, with 90.6% or 6,077 individuals in the labor force. Within the labor force, the 16 to 19 years age range has the highest percentage of unemployed individuals, with 13.4% or 459 of them being unemployed.
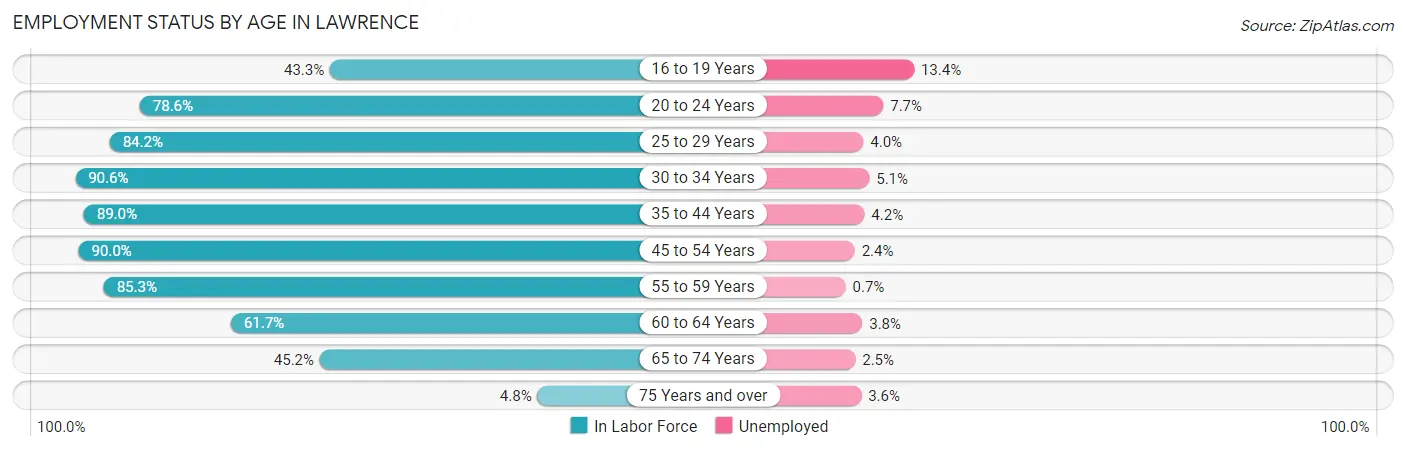
| Age Bracket | In Labor Force | Unemployed |
| 16 to 19 Years | 3,425 (43.3%) | 459 (13.4%) |
| 20 to 24 Years | 15,126 (78.6%) | 1,165 (7.7%) |
| 25 to 29 Years | 6,734 (84.2%) | 269 (4.0%) |
| 30 to 34 Years | 6,077 (90.6%) | 310 (5.1%) |
| 35 to 44 Years | 10,056 (89.0%) | 422 (4.2%) |
| 45 to 54 Years | 7,933 (90.0%) | 190 (2.4%) |
| 55 to 59 Years | 3,153 (85.3%) | 22 (0.7%) |
| 60 to 64 Years | 2,078 (61.7%) | 79 (3.8%) |
| 65 to 74 Years | 3,177 (45.2%) | 79 (2.5%) |
| 75 Years and over | 227 (4.8%) | 8 (3.6%) |
| Total | 58,008 (71.8%) | 3,016 (5.2%) |
Employment Status by Educational Attainment in Lawrence
According to labor force statistics for Lawrence, 86.0% of individuals (36,019) out of the total population between 25 and 64 years of age (41,882) are in the labor force, with 3.6% or 1,297 of them being unemployed. The group with the highest labor force participation rate are those with the educational attainment of bachelor's degree or higher, with 89.2% or 21,128 individuals in the labor force. Within the labor force, individuals with less than high school education have the highest percentage of unemployment, with 8.1% or 102 of them being unemployed.
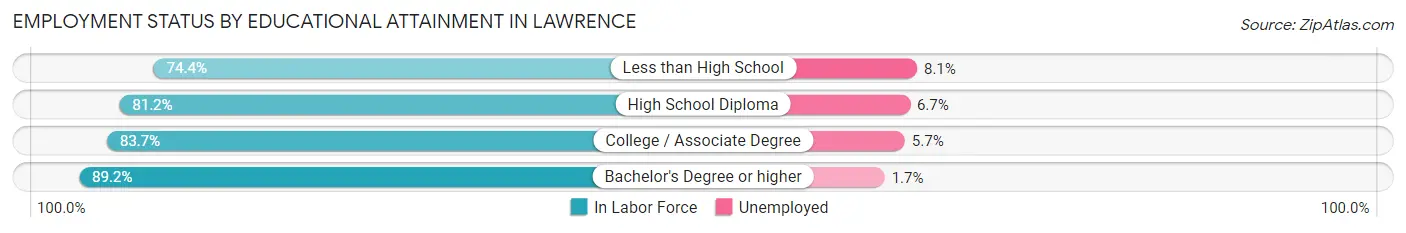
| Educational Attainment | In Labor Force | Unemployed |
| Less than High School | 1,260 (74.4%) | 137 (8.1%) |
| High School Diploma | 5,413 (81.2%) | 447 (6.7%) |
| College / Associate Degree | 8,233 (83.7%) | 561 (5.7%) |
| Bachelor's Degree or higher | 21,128 (89.2%) | 403 (1.7%) |
| Total | 36,019 (86.0%) | 1,508 (3.6%) |
Employment Occupations by Sex in Lawrence
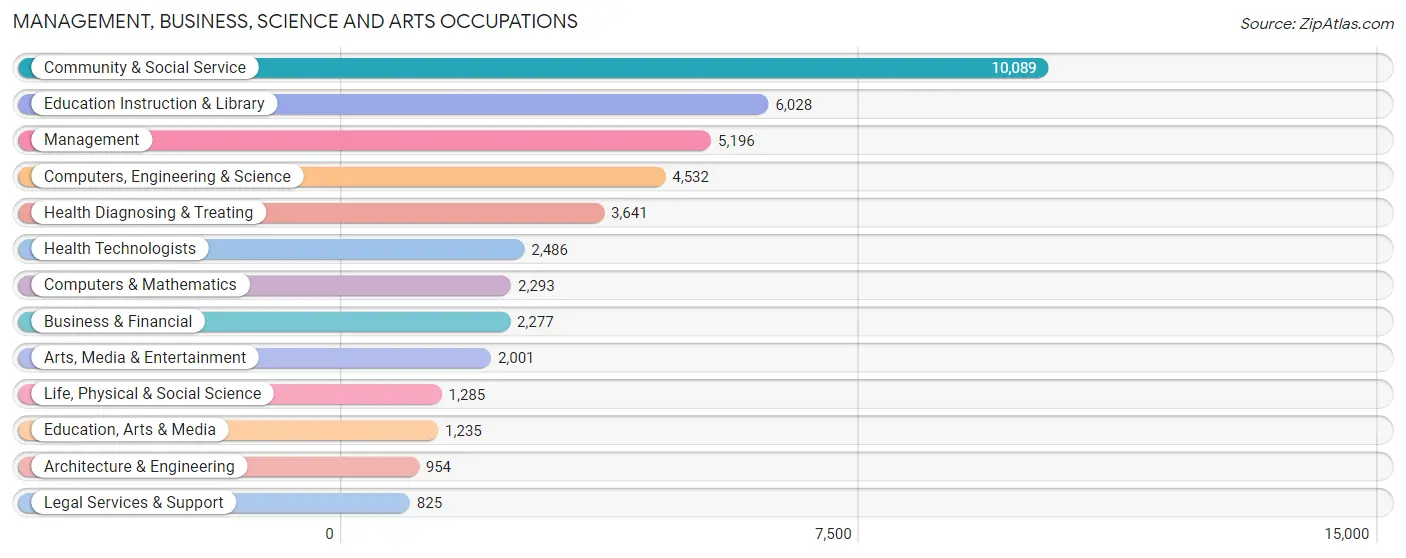
Management, Business, Science and Arts Occupations
The most common Management, Business, Science and Arts occupations in Lawrence are Community & Social Service (10,089 | 18.4%), Education Instruction & Library (6,028 | 11.0%), Management (5,196 | 9.5%), Computers, Engineering & Science (4,532 | 8.3%), and Health Diagnosing & Treating (3,641 | 6.6%).
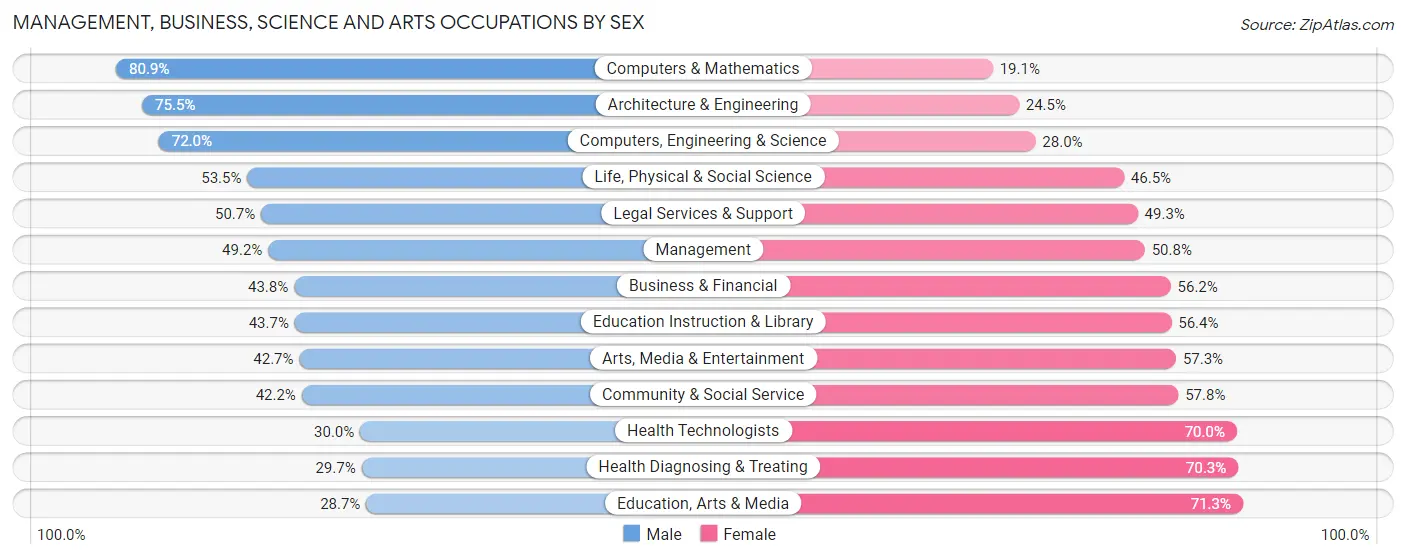
Management, Business, Science and Arts Occupations by Sex
Within the Management, Business, Science and Arts occupations in Lawrence, the most male-oriented occupations are Computers & Mathematics (80.9%), Architecture & Engineering (75.5%), and Computers, Engineering & Science (72.0%), while the most female-oriented occupations are Education, Arts & Media (71.3%), Health Diagnosing & Treating (70.3%), and Health Technologists (70.0%).
| Occupation | Male | Female |
| Management | 2,556 (49.2%) | 2,640 (50.8%) |
| Business & Financial | 997 (43.8%) | 1,280 (56.2%) |
| Computers, Engineering & Science | 3,263 (72.0%) | 1,269 (28.0%) |
| Computers & Mathematics | 1,855 (80.9%) | 438 (19.1%) |
| Architecture & Engineering | 720 (75.5%) | 234 (24.5%) |
| Life, Physical & Social Science | 688 (53.5%) | 597 (46.5%) |
| Community & Social Service | 4,258 (42.2%) | 5,831 (57.8%) |
| Education, Arts & Media | 355 (28.7%) | 880 (71.3%) |
| Legal Services & Support | 418 (50.7%) | 407 (49.3%) |
| Education Instruction & Library | 2,631 (43.6%) | 3,397 (56.4%) |
| Arts, Media & Entertainment | 854 (42.7%) | 1,147 (57.3%) |
| Health Diagnosing & Treating | 1,082 (29.7%) | 2,559 (70.3%) |
| Health Technologists | 746 (30.0%) | 1,740 (70.0%) |
| Total (Category) | 12,156 (47.2%) | 13,579 (52.8%) |
| Total (Overall) | 27,801 (50.7%) | 27,055 (49.3%) |
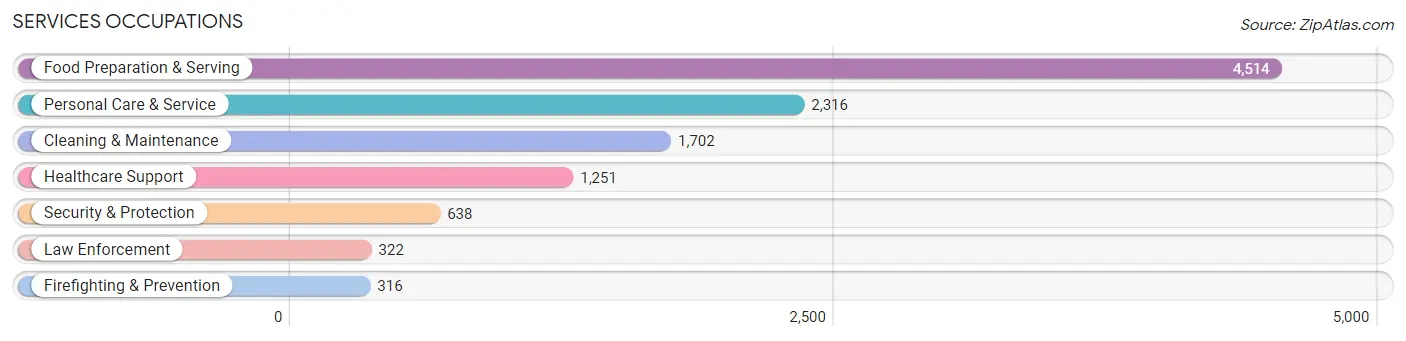
Services Occupations
The most common Services occupations in Lawrence are Food Preparation & Serving (4,514 | 8.2%), Personal Care & Service (2,316 | 4.2%), Cleaning & Maintenance (1,702 | 3.1%), Healthcare Support (1,251 | 2.3%), and Security & Protection (638 | 1.2%).
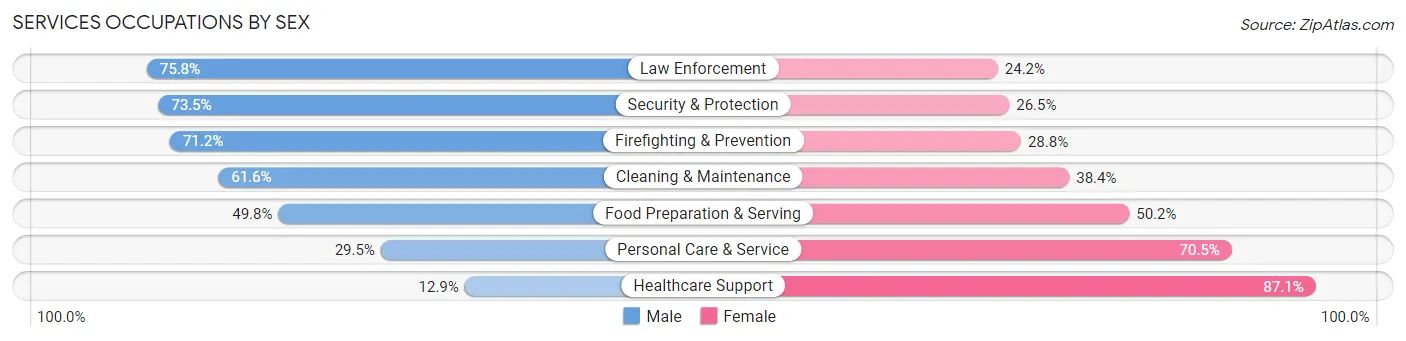
Services Occupations by Sex
Within the Services occupations in Lawrence, the most male-oriented occupations are Law Enforcement (75.8%), Security & Protection (73.5%), and Firefighting & Prevention (71.2%), while the most female-oriented occupations are Healthcare Support (87.1%), Personal Care & Service (70.5%), and Food Preparation & Serving (50.2%).
| Occupation | Male | Female |
| Healthcare Support | 161 (12.9%) | 1,090 (87.1%) |
| Security & Protection | 469 (73.5%) | 169 (26.5%) |
| Firefighting & Prevention | 225 (71.2%) | 91 (28.8%) |
| Law Enforcement | 244 (75.8%) | 78 (24.2%) |
| Food Preparation & Serving | 2,246 (49.8%) | 2,268 (50.2%) |
| Cleaning & Maintenance | 1,049 (61.6%) | 653 (38.4%) |
| Personal Care & Service | 683 (29.5%) | 1,633 (70.5%) |
| Total (Category) | 4,608 (44.2%) | 5,813 (55.8%) |
| Total (Overall) | 27,801 (50.7%) | 27,055 (49.3%) |
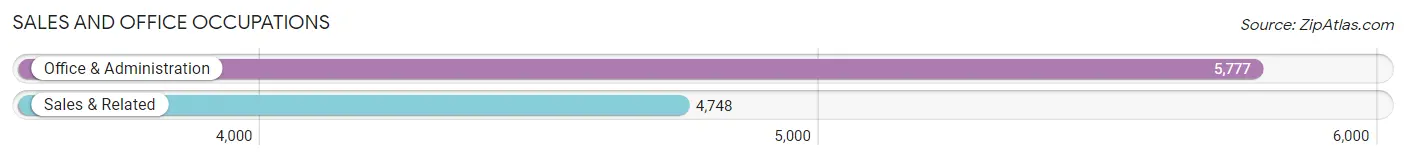
Sales and Office Occupations
The most common Sales and Office occupations in Lawrence are Office & Administration (5,777 | 10.5%), and Sales & Related (4,748 | 8.7%).
Sales and Office Occupations by Sex
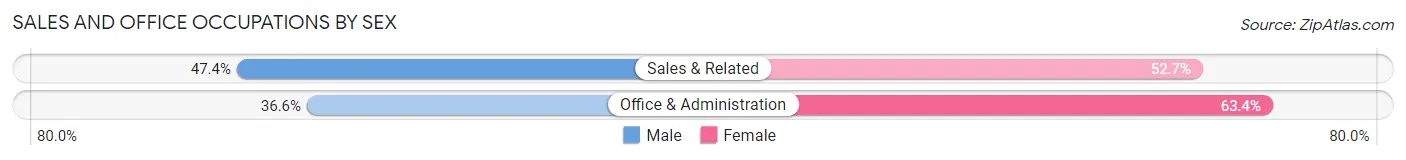
| Occupation | Male | Female |
| Sales & Related | 2,248 (47.3%) | 2,500 (52.6%) |
| Office & Administration | 2,113 (36.6%) | 3,664 (63.4%) |
| Total (Category) | 4,361 (41.4%) | 6,164 (58.6%) |
| Total (Overall) | 27,801 (50.7%) | 27,055 (49.3%) |
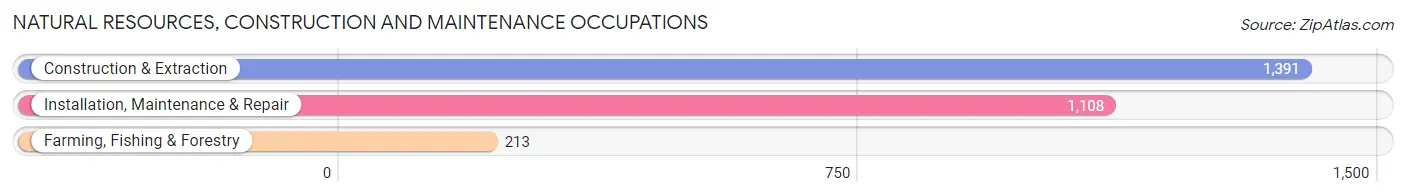
Natural Resources, Construction and Maintenance Occupations
The most common Natural Resources, Construction and Maintenance occupations in Lawrence are Construction & Extraction (1,391 | 2.5%), Installation, Maintenance & Repair (1,108 | 2.0%), and Farming, Fishing & Forestry (213 | 0.4%).
Natural Resources, Construction and Maintenance Occupations by Sex
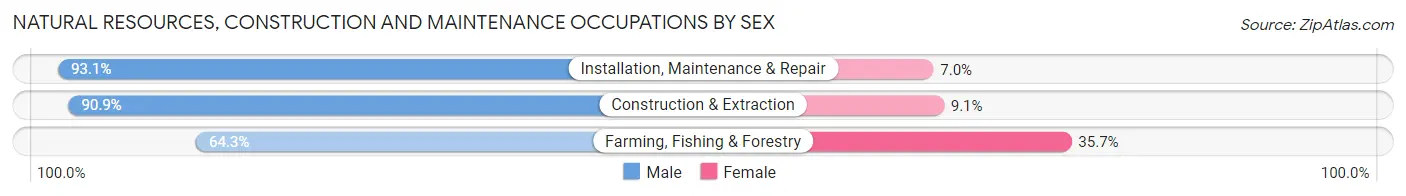
| Occupation | Male | Female |
| Farming, Fishing & Forestry | 137 (64.3%) | 76 (35.7%) |
| Construction & Extraction | 1,264 (90.9%) | 127 (9.1%) |
| Installation, Maintenance & Repair | 1,031 (93.0%) | 77 (7.0%) |
| Total (Category) | 2,432 (89.7%) | 280 (10.3%) |
| Total (Overall) | 27,801 (50.7%) | 27,055 (49.3%) |
Production, Transportation and Moving Occupations
The most common Production, Transportation and Moving occupations in Lawrence are Production (2,217 | 4.0%), Material Moving (1,793 | 3.3%), and Transportation (1,453 | 2.6%).
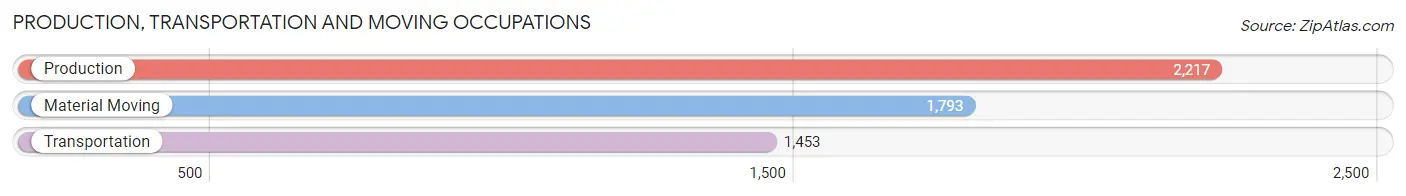
Production, Transportation and Moving Occupations by Sex
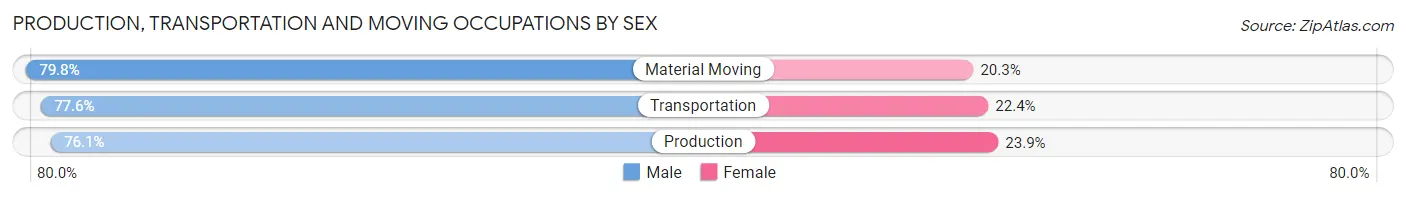
| Occupation | Male | Female |
| Production | 1,687 (76.1%) | 530 (23.9%) |
| Transportation | 1,127 (77.6%) | 326 (22.4%) |
| Material Moving | 1,430 (79.7%) | 363 (20.3%) |
| Total (Category) | 4,244 (77.7%) | 1,219 (22.3%) |
| Total (Overall) | 27,801 (50.7%) | 27,055 (49.3%) |
Employment Industries by Sex in Lawrence
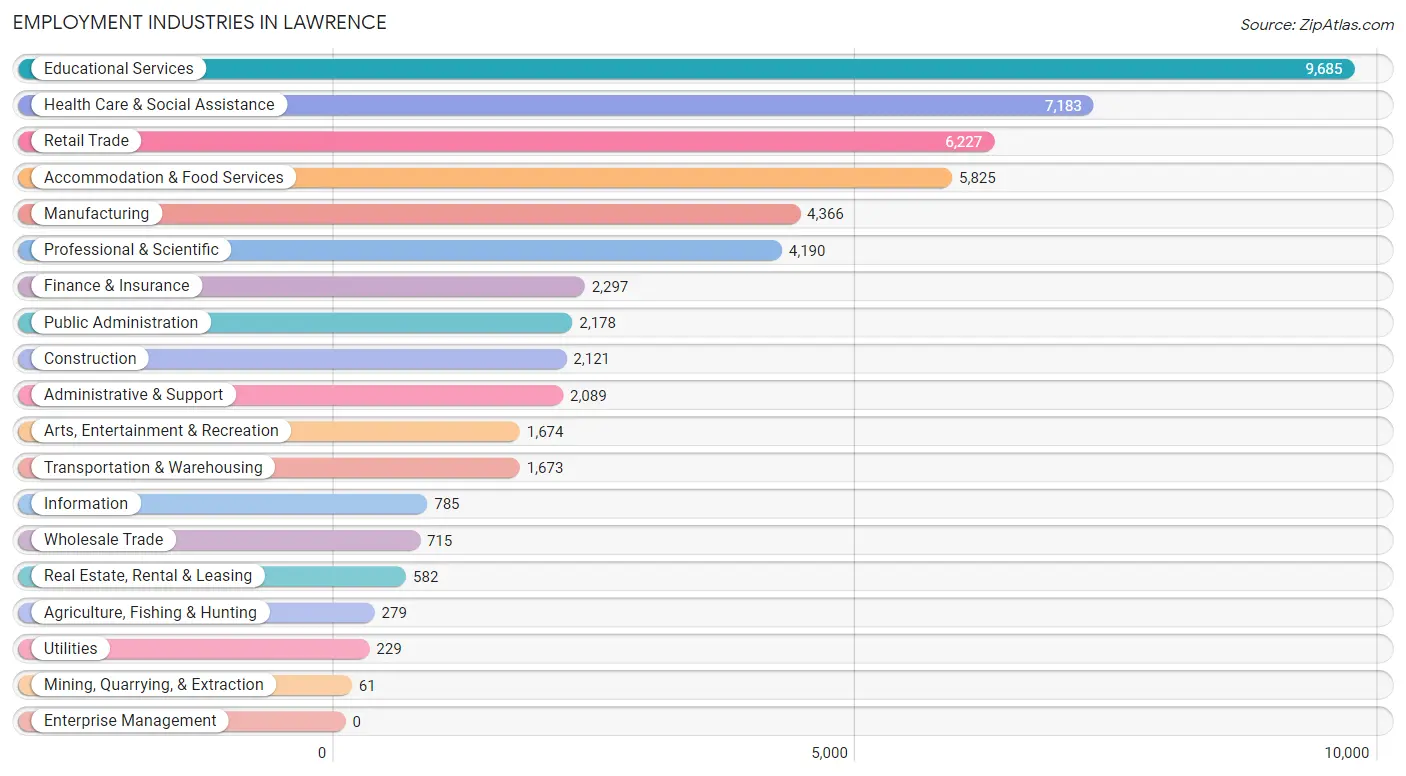
Employment Industries in Lawrence
The major employment industries in Lawrence include Educational Services (9,685 | 17.7%), Health Care & Social Assistance (7,183 | 13.1%), Retail Trade (6,227 | 11.4%), Accommodation & Food Services (5,825 | 10.6%), and Manufacturing (4,366 | 8.0%).
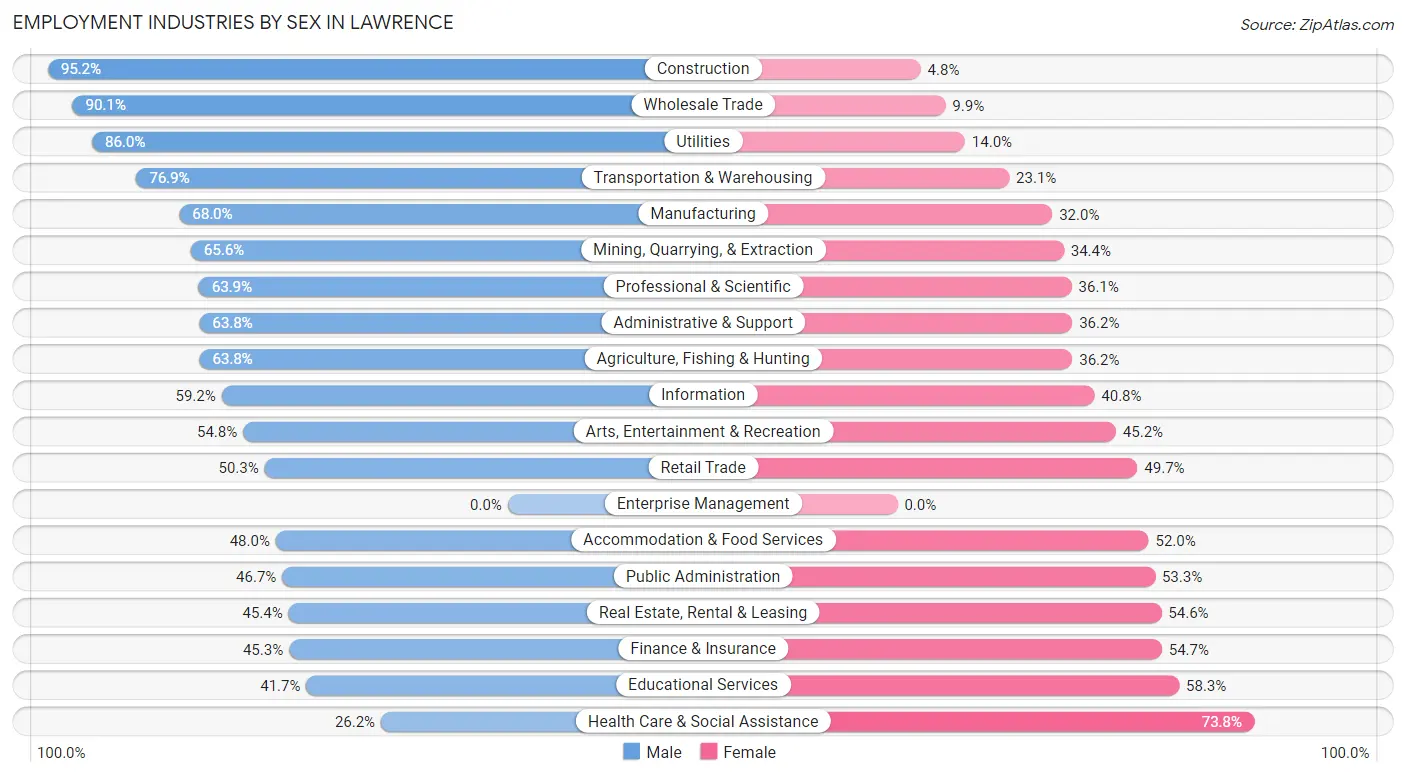
Employment Industries by Sex in Lawrence
The Lawrence industries that see more men than women are Construction (95.2%), Wholesale Trade (90.1%), and Utilities (86.0%), whereas the industries that tend to have a higher number of women are Health Care & Social Assistance (73.8%), Educational Services (58.3%), and Finance & Insurance (54.7%).
| Industry | Male | Female |
| Agriculture, Fishing & Hunting | 178 (63.8%) | 101 (36.2%) |
| Mining, Quarrying, & Extraction | 40 (65.6%) | 21 (34.4%) |
| Construction | 2,019 (95.2%) | 102 (4.8%) |
| Manufacturing | 2,967 (68.0%) | 1,399 (32.0%) |
| Wholesale Trade | 644 (90.1%) | 71 (9.9%) |
| Retail Trade | 3,134 (50.3%) | 3,093 (49.7%) |
| Transportation & Warehousing | 1,286 (76.9%) | 387 (23.1%) |
| Utilities | 197 (86.0%) | 32 (14.0%) |
| Information | 465 (59.2%) | 320 (40.8%) |
| Finance & Insurance | 1,040 (45.3%) | 1,257 (54.7%) |
| Real Estate, Rental & Leasing | 264 (45.4%) | 318 (54.6%) |
| Professional & Scientific | 2,679 (63.9%) | 1,511 (36.1%) |
| Enterprise Management | 0 (0.0%) | 0 (0.0%) |
| Administrative & Support | 1,333 (63.8%) | 756 (36.2%) |
| Educational Services | 4,038 (41.7%) | 5,647 (58.3%) |
| Health Care & Social Assistance | 1,885 (26.2%) | 5,298 (73.8%) |
| Arts, Entertainment & Recreation | 917 (54.8%) | 757 (45.2%) |
| Accommodation & Food Services | 2,797 (48.0%) | 3,028 (52.0%) |
| Public Administration | 1,017 (46.7%) | 1,161 (53.3%) |
| Total | 27,801 (50.7%) | 27,055 (49.3%) |
Education in Lawrence
School Enrollment in Lawrence
The most common levels of schooling among the 36,143 students in Lawrence are college / undergraduate (18,944 | 52.4%), graduate / professional (5,133 | 14.2%), and elementary school (3,456 | 9.6%).
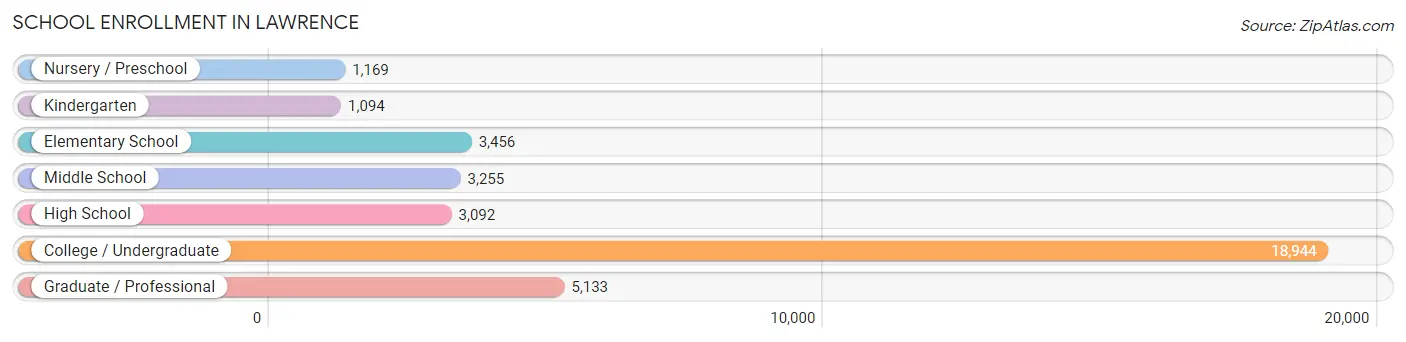
| School Level | # Students | % Students |
| Nursery / Preschool | 1,169 | 3.2% |
| Kindergarten | 1,094 | 3.0% |
| Elementary School | 3,456 | 9.6% |
| Middle School | 3,255 | 9.0% |
| High School | 3,092 | 8.6% |
| College / Undergraduate | 18,944 | 52.4% |
| Graduate / Professional | 5,133 | 14.2% |
| Total | 36,143 | 100.0% |
School Enrollment by Age by Funding Source in Lawrence
Out of a total of 36,143 students who are enrolled in schools in Lawrence, 3,578 (9.9%) attend a private institution, while the remaining 32,565 (90.1%) are enrolled in public schools. The age group of 3 to 4 year olds has the highest likelihood of being enrolled in private schools, with 355 (44.8% in the age bracket) enrolled. Conversely, the age group of 20 to 24 year olds has the lowest likelihood of being enrolled in a private school, with 12,938 (94.3% in the age bracket) attending a public institution.
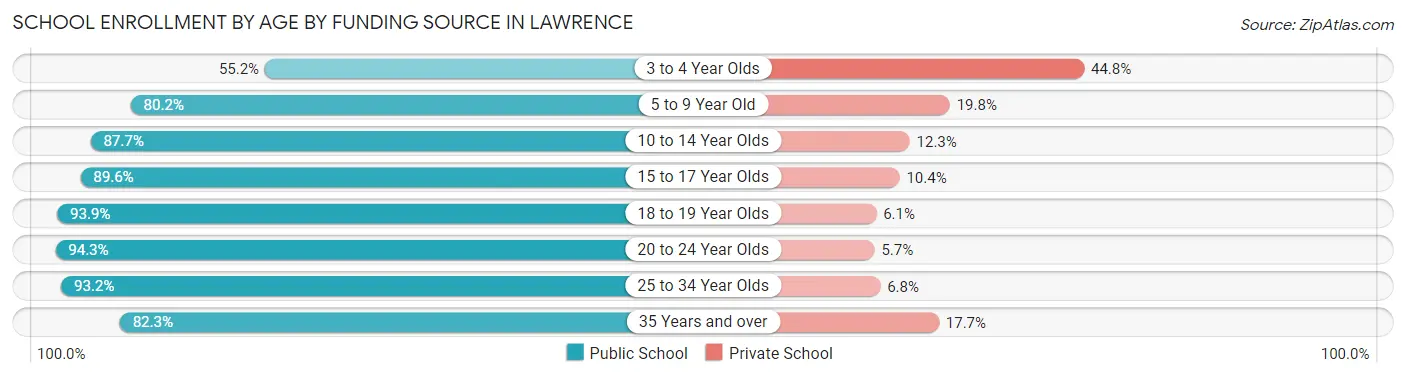
| Age Bracket | Public School | Private School |
| 3 to 4 Year Olds | 438 (55.2%) | 355 (44.8%) |
| 5 to 9 Year Old | 3,541 (80.2%) | 872 (19.8%) |
| 10 to 14 Year Olds | 3,586 (87.7%) | 502 (12.3%) |
| 15 to 17 Year Olds | 2,058 (89.6%) | 239 (10.4%) |
| 18 to 19 Year Olds | 5,813 (93.9%) | 375 (6.1%) |
| 20 to 24 Year Olds | 12,938 (94.3%) | 787 (5.7%) |
| 25 to 34 Year Olds | 3,057 (93.2%) | 223 (6.8%) |
| 35 Years and over | 1,118 (82.3%) | 241 (17.7%) |
| Total | 32,565 (90.1%) | 3,578 (9.9%) |
Educational Attainment by Field of Study in Lawrence
Business (4,391 | 13.5%), education (3,895 | 12.0%), science & technology (2,886 | 8.9%), literature & languages (2,719 | 8.4%), and social sciences (2,529 | 7.8%) are the most common fields of study among 32,470 individuals in Lawrence who have obtained a bachelor's degree or higher.
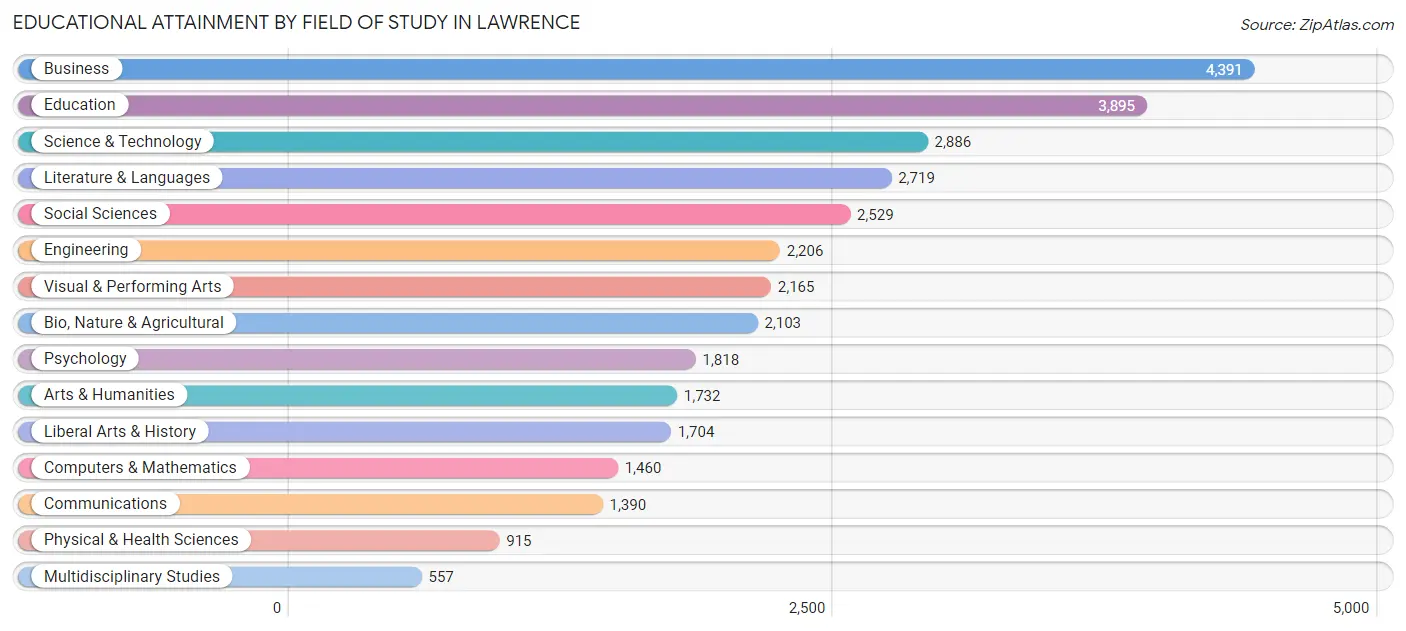
| Field of Study | # Graduates | % Graduates |
| Computers & Mathematics | 1,460 | 4.5% |
| Bio, Nature & Agricultural | 2,103 | 6.5% |
| Physical & Health Sciences | 915 | 2.8% |
| Psychology | 1,818 | 5.6% |
| Social Sciences | 2,529 | 7.8% |
| Engineering | 2,206 | 6.8% |
| Multidisciplinary Studies | 557 | 1.7% |
| Science & Technology | 2,886 | 8.9% |
| Business | 4,391 | 13.5% |
| Education | 3,895 | 12.0% |
| Literature & Languages | 2,719 | 8.4% |
| Liberal Arts & History | 1,704 | 5.2% |
| Visual & Performing Arts | 2,165 | 6.7% |
| Communications | 1,390 | 4.3% |
| Arts & Humanities | 1,732 | 5.3% |
| Total | 32,470 | 100.0% |
Transportation & Commute in Lawrence
Vehicle Availability by Sex in Lawrence
The most prevalent vehicle ownership categories in Lawrence are males with 2 vehicles (11,685, accounting for 44.6%) and females with 2 vehicles (10,618, making up 46.6%).
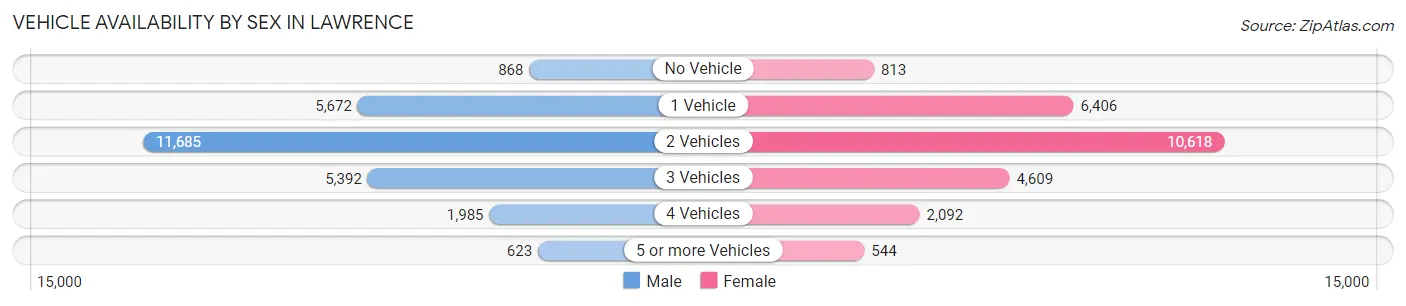
| Vehicles Available | Male | Female |
| No Vehicle | 868 (3.3%) | 813 (3.2%) |
| 1 Vehicle | 5,672 (21.6%) | 6,406 (25.5%) |
| 2 Vehicles | 11,685 (44.6%) | 10,618 (42.3%) |
| 3 Vehicles | 5,392 (20.6%) | 4,609 (18.4%) |
| 4 Vehicles | 1,985 (7.6%) | 2,092 (8.3%) |
| 5 or more Vehicles | 623 (2.4%) | 544 (2.2%) |
| Total | 26,225 (100.0%) | 25,082 (100.0%) |
Commute Time in Lawrence
The most frequently occuring commute durations in Lawrence are 10 to 14 minutes (11,349 commuters, 23.9%), 5 to 9 minutes (8,748 commuters, 18.4%), and 15 to 19 minutes (8,080 commuters, 17.0%).
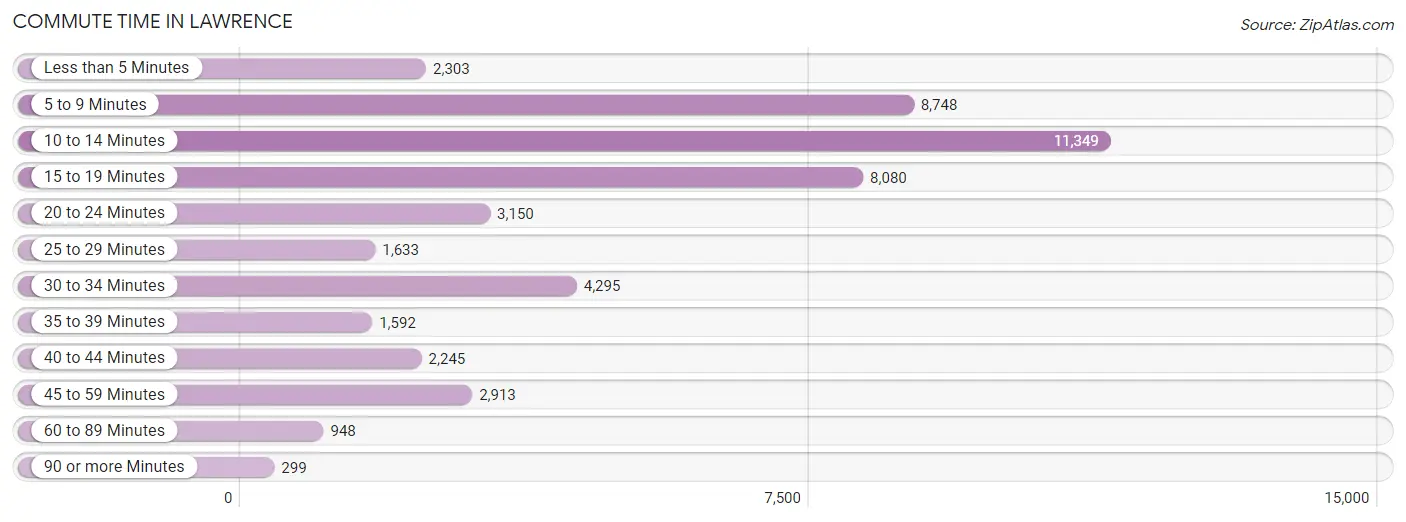
| Commute Time | # Commuters | % Commuters |
| Less than 5 Minutes | 2,303 | 4.8% |
| 5 to 9 Minutes | 8,748 | 18.4% |
| 10 to 14 Minutes | 11,349 | 23.9% |
| 15 to 19 Minutes | 8,080 | 17.0% |
| 20 to 24 Minutes | 3,150 | 6.6% |
| 25 to 29 Minutes | 1,633 | 3.4% |
| 30 to 34 Minutes | 4,295 | 9.0% |
| 35 to 39 Minutes | 1,592 | 3.4% |
| 40 to 44 Minutes | 2,245 | 4.7% |
| 45 to 59 Minutes | 2,913 | 6.1% |
| 60 to 89 Minutes | 948 | 2.0% |
| 90 or more Minutes | 299 | 0.6% |
Commute Time by Sex in Lawrence
The most common commute times in Lawrence are 10 to 14 minutes (5,552 commuters, 22.8%) for males and 10 to 14 minutes (5,797 commuters, 24.9%) for females.
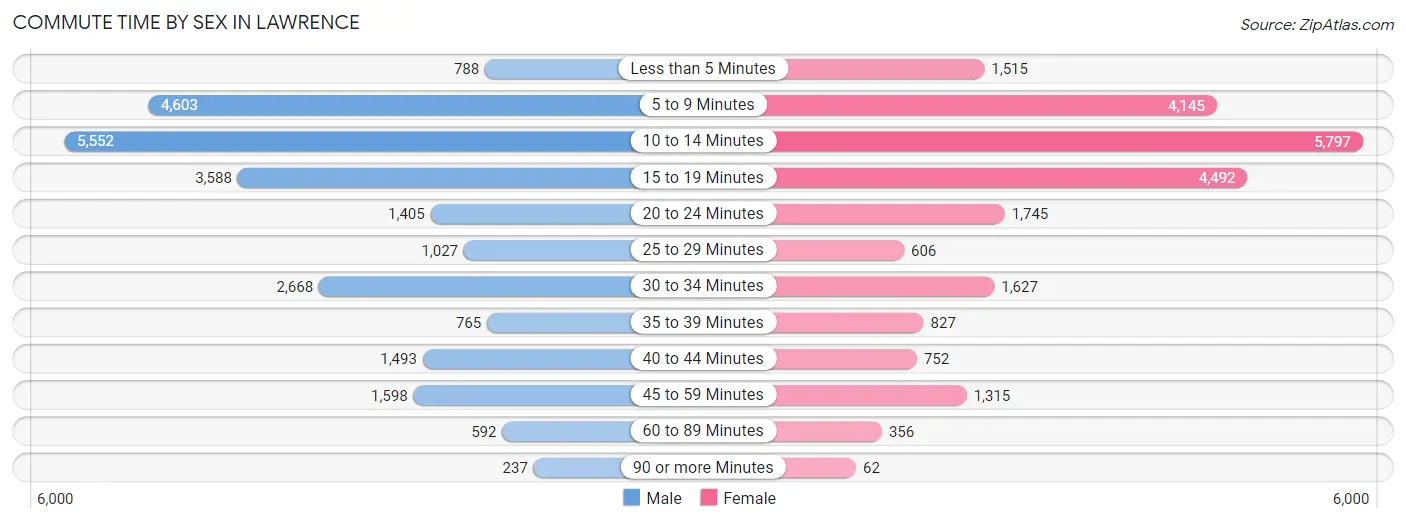
| Commute Time | Male | Female |
| Less than 5 Minutes | 788 (3.2%) | 1,515 (6.5%) |
| 5 to 9 Minutes | 4,603 (18.9%) | 4,145 (17.8%) |
| 10 to 14 Minutes | 5,552 (22.8%) | 5,797 (24.9%) |
| 15 to 19 Minutes | 3,588 (14.8%) | 4,492 (19.3%) |
| 20 to 24 Minutes | 1,405 (5.8%) | 1,745 (7.5%) |
| 25 to 29 Minutes | 1,027 (4.2%) | 606 (2.6%) |
| 30 to 34 Minutes | 2,668 (11.0%) | 1,627 (7.0%) |
| 35 to 39 Minutes | 765 (3.2%) | 827 (3.6%) |
| 40 to 44 Minutes | 1,493 (6.1%) | 752 (3.2%) |
| 45 to 59 Minutes | 1,598 (6.6%) | 1,315 (5.7%) |
| 60 to 89 Minutes | 592 (2.4%) | 356 (1.5%) |
| 90 or more Minutes | 237 (1.0%) | 62 (0.3%) |
Time of Departure to Work by Sex in Lawrence
The most frequent times of departure to work in Lawrence are 7:30 AM to 7:59 AM (3,832, 15.8%) for males and 7:30 AM to 7:59 AM (4,422, 19.0%) for females.
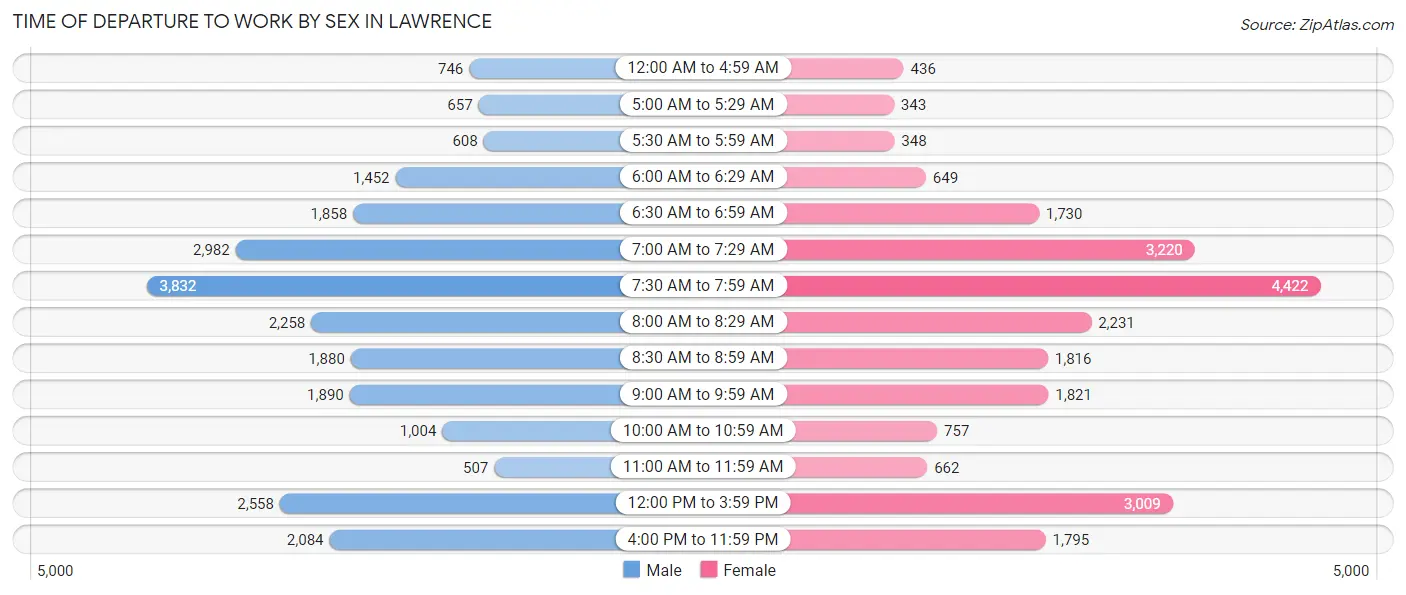
| Time of Departure | Male | Female |
| 12:00 AM to 4:59 AM | 746 (3.1%) | 436 (1.9%) |
| 5:00 AM to 5:29 AM | 657 (2.7%) | 343 (1.5%) |
| 5:30 AM to 5:59 AM | 608 (2.5%) | 348 (1.5%) |
| 6:00 AM to 6:29 AM | 1,452 (6.0%) | 649 (2.8%) |
| 6:30 AM to 6:59 AM | 1,858 (7.6%) | 1,730 (7.4%) |
| 7:00 AM to 7:29 AM | 2,982 (12.3%) | 3,220 (13.9%) |
| 7:30 AM to 7:59 AM | 3,832 (15.8%) | 4,422 (19.0%) |
| 8:00 AM to 8:29 AM | 2,258 (9.3%) | 2,231 (9.6%) |
| 8:30 AM to 8:59 AM | 1,880 (7.7%) | 1,816 (7.8%) |
| 9:00 AM to 9:59 AM | 1,890 (7.8%) | 1,821 (7.8%) |
| 10:00 AM to 10:59 AM | 1,004 (4.1%) | 757 (3.3%) |
| 11:00 AM to 11:59 AM | 507 (2.1%) | 662 (2.9%) |
| 12:00 PM to 3:59 PM | 2,558 (10.5%) | 3,009 (13.0%) |
| 4:00 PM to 11:59 PM | 2,084 (8.6%) | 1,795 (7.7%) |
| Total | 24,316 (100.0%) | 23,239 (100.0%) |
Housing Occupancy in Lawrence
Occupancy by Ownership in Lawrence
Of the total 40,786 dwellings in Lawrence, owner-occupied units account for 17,833 (43.7%), while renter-occupied units make up 22,953 (56.3%).
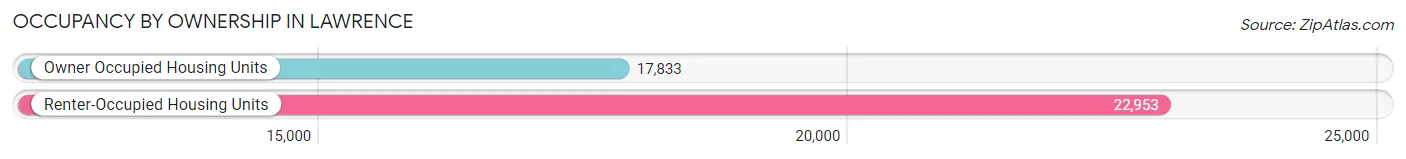
| Occupancy | # Housing Units | % Housing Units |
| Owner Occupied Housing Units | 17,833 | 43.7% |
| Renter-Occupied Housing Units | 22,953 | 56.3% |
| Total Occupied Housing Units | 40,786 | 100.0% |
Occupancy by Household Size in Lawrence
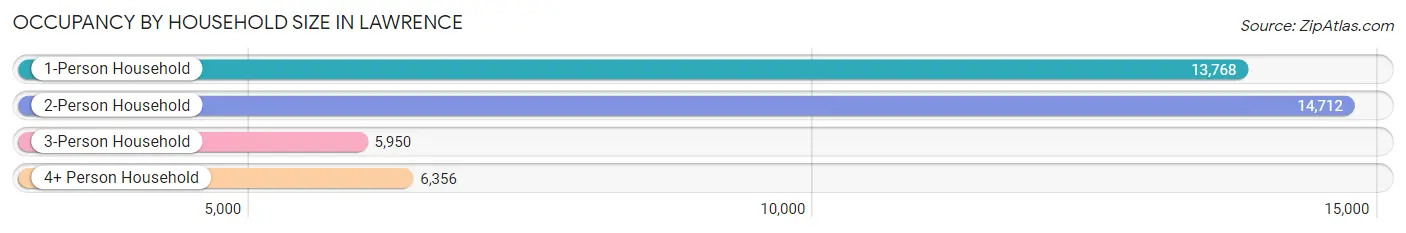
| Household Size | # Housing Units | % Housing Units |
| 1-Person Household | 13,768 | 33.8% |
| 2-Person Household | 14,712 | 36.1% |
| 3-Person Household | 5,950 | 14.6% |
| 4+ Person Household | 6,356 | 15.6% |
| Total Housing Units | 40,786 | 100.0% |
Occupancy by Ownership by Household Size in Lawrence
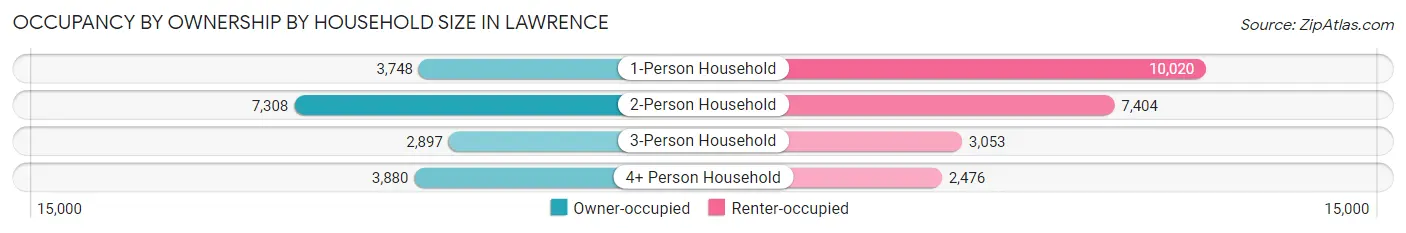
| Household Size | Owner-occupied | Renter-occupied |
| 1-Person Household | 3,748 (27.2%) | 10,020 (72.8%) |
| 2-Person Household | 7,308 (49.7%) | 7,404 (50.3%) |
| 3-Person Household | 2,897 (48.7%) | 3,053 (51.3%) |
| 4+ Person Household | 3,880 (61.0%) | 2,476 (39.0%) |
| Total Housing Units | 17,833 (43.7%) | 22,953 (56.3%) |
Occupancy by Educational Attainment in Lawrence
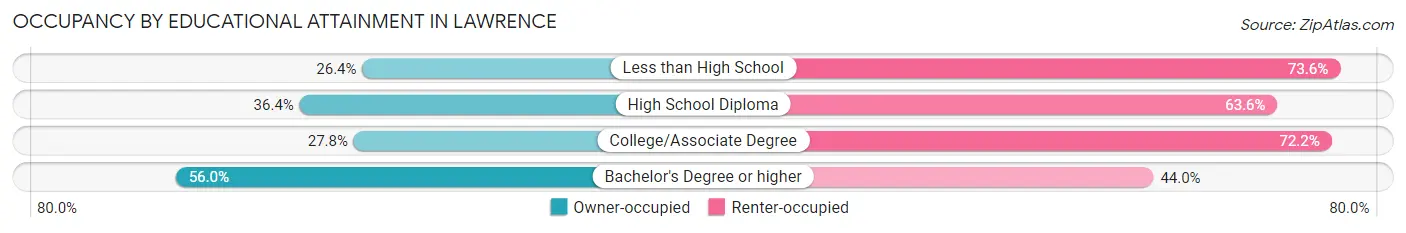
| Household Size | Owner-occupied | Renter-occupied |
| Less than High School | 268 (26.4%) | 746 (73.6%) |
| High School Diploma | 2,230 (36.4%) | 3,901 (63.6%) |
| College/Associate Degree | 3,453 (27.8%) | 8,979 (72.2%) |
| Bachelor's Degree or higher | 11,882 (56.0%) | 9,327 (44.0%) |
Occupancy by Age of Householder in Lawrence
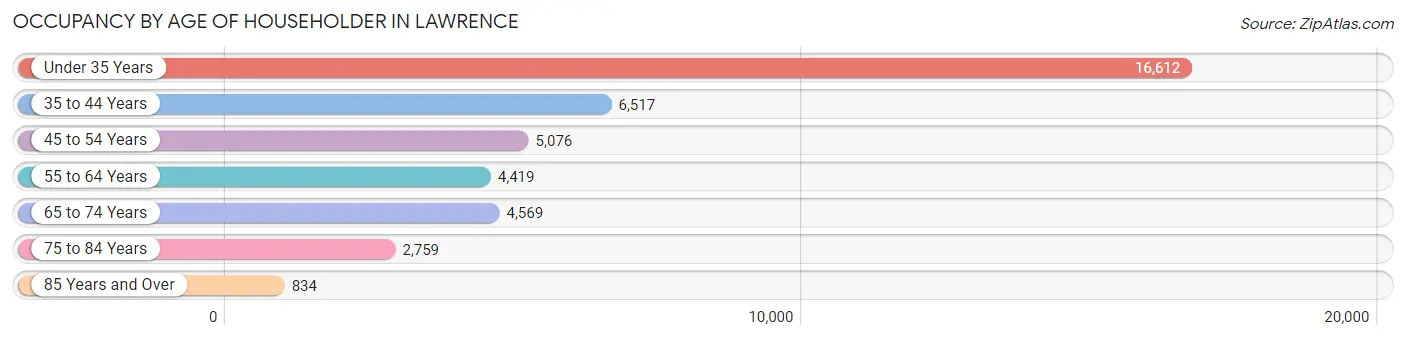
| Age Bracket | # Households | % Households |
| Under 35 Years | 16,612 | 40.7% |
| 35 to 44 Years | 6,517 | 16.0% |
| 45 to 54 Years | 5,076 | 12.4% |
| 55 to 64 Years | 4,419 | 10.8% |
| 65 to 74 Years | 4,569 | 11.2% |
| 75 to 84 Years | 2,759 | 6.8% |
| 85 Years and Over | 834 | 2.0% |
| Total | 40,786 | 100.0% |
Housing Finances in Lawrence
Median Income by Occupancy in Lawrence
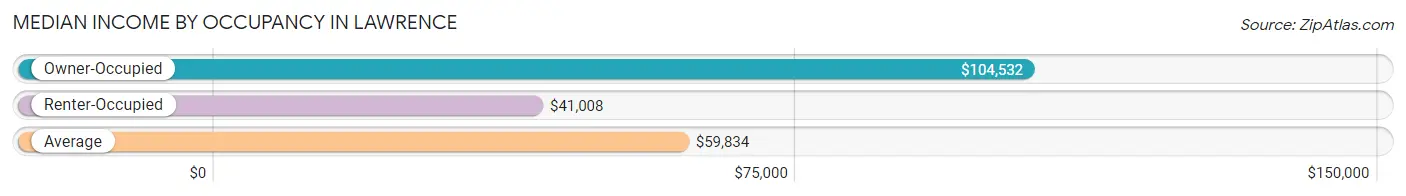
| Occupancy Type | # Households | Median Income |
| Owner-Occupied | 17,833 (43.7%) | $104,532 |
| Renter-Occupied | 22,953 (56.3%) | $41,008 |
| Average | 40,786 (100.0%) | $59,834 |
Occupancy by Householder Income Bracket in Lawrence
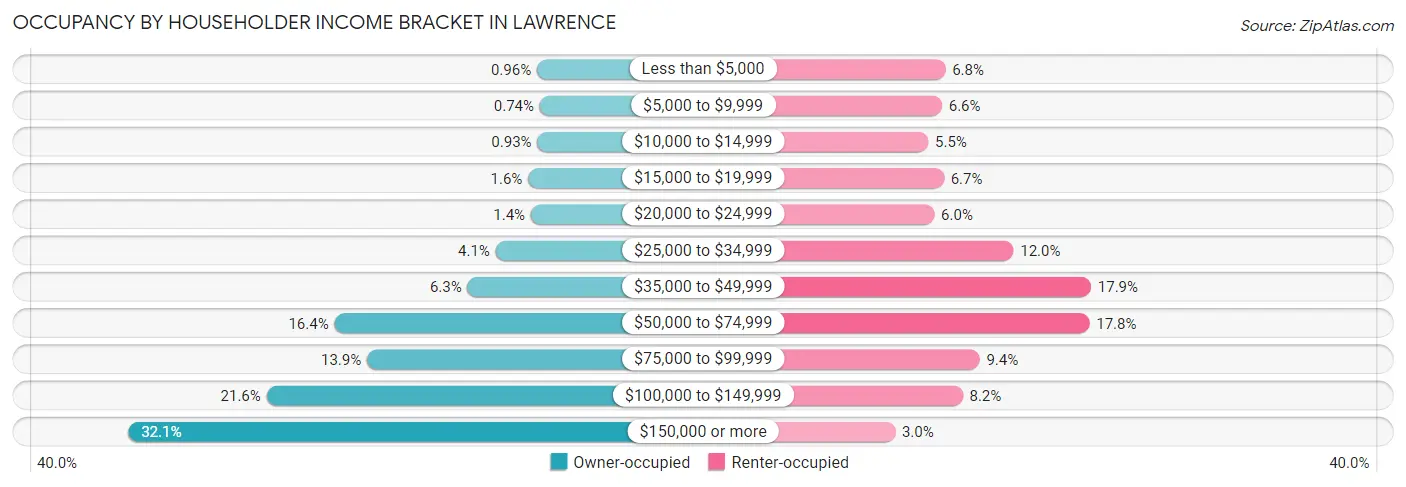
| Income Bracket | Owner-occupied | Renter-occupied |
| Less than $5,000 | 172 (1.0%) | 1,567 (6.8%) |
| $5,000 to $9,999 | 132 (0.7%) | 1,509 (6.6%) |
| $10,000 to $14,999 | 166 (0.9%) | 1,270 (5.5%) |
| $15,000 to $19,999 | 291 (1.6%) | 1,542 (6.7%) |
| $20,000 to $24,999 | 254 (1.4%) | 1,376 (6.0%) |
| $25,000 to $34,999 | 733 (4.1%) | 2,758 (12.0%) |
| $35,000 to $49,999 | 1,115 (6.2%) | 4,115 (17.9%) |
| $50,000 to $74,999 | 2,922 (16.4%) | 4,089 (17.8%) |
| $75,000 to $99,999 | 2,480 (13.9%) | 2,167 (9.4%) |
| $100,000 to $149,999 | 3,844 (21.6%) | 1,871 (8.2%) |
| $150,000 or more | 5,724 (32.1%) | 689 (3.0%) |
| Total | 17,833 (100.0%) | 22,953 (100.0%) |
Monthly Housing Cost Tiers in Lawrence
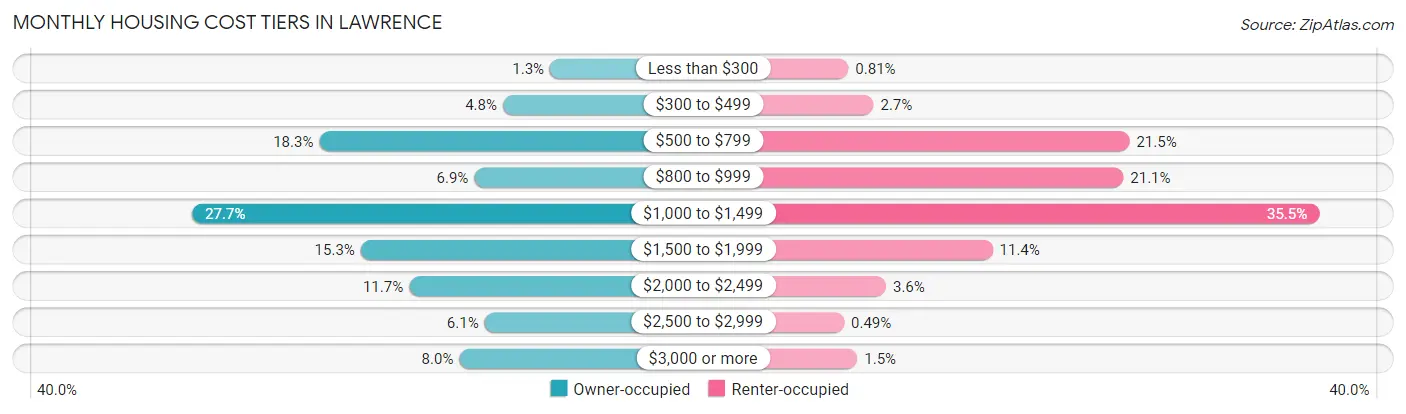
| Monthly Cost | Owner-occupied | Renter-occupied |
| Less than $300 | 233 (1.3%) | 186 (0.8%) |
| $300 to $499 | 853 (4.8%) | 611 (2.7%) |
| $500 to $799 | 3,264 (18.3%) | 4,938 (21.5%) |
| $800 to $999 | 1,228 (6.9%) | 4,833 (21.1%) |
| $1,000 to $1,499 | 4,934 (27.7%) | 8,142 (35.5%) |
| $1,500 to $1,999 | 2,719 (15.2%) | 2,623 (11.4%) |
| $2,000 to $2,499 | 2,084 (11.7%) | 822 (3.6%) |
| $2,500 to $2,999 | 1,093 (6.1%) | 112 (0.5%) |
| $3,000 or more | 1,425 (8.0%) | 337 (1.5%) |
| Total | 17,833 (100.0%) | 22,953 (100.0%) |
Physical Housing Characteristics in Lawrence
Housing Structures in Lawrence
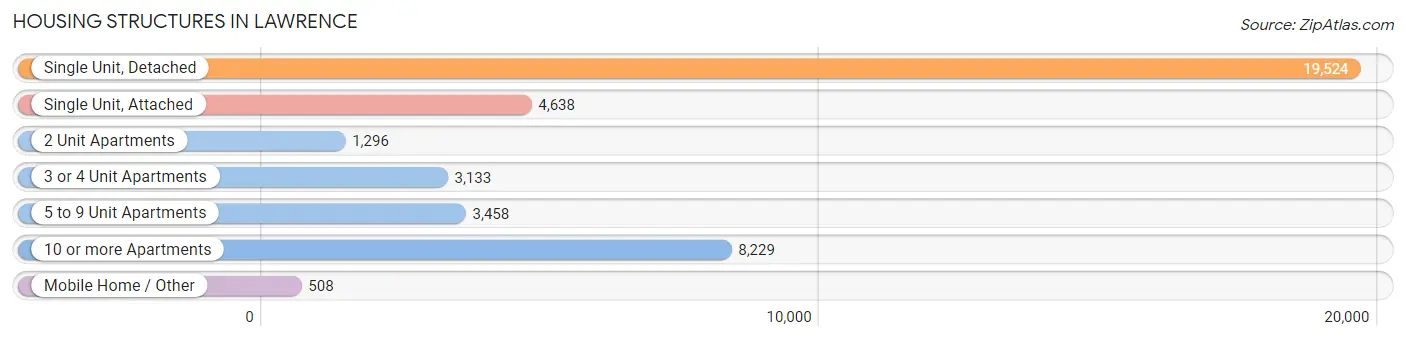
| Structure Type | # Housing Units | % Housing Units |
| Single Unit, Detached | 19,524 | 47.9% |
| Single Unit, Attached | 4,638 | 11.4% |
| 2 Unit Apartments | 1,296 | 3.2% |
| 3 or 4 Unit Apartments | 3,133 | 7.7% |
| 5 to 9 Unit Apartments | 3,458 | 8.5% |
| 10 or more Apartments | 8,229 | 20.2% |
| Mobile Home / Other | 508 | 1.3% |
| Total | 40,786 | 100.0% |
Housing Structures by Occupancy in Lawrence
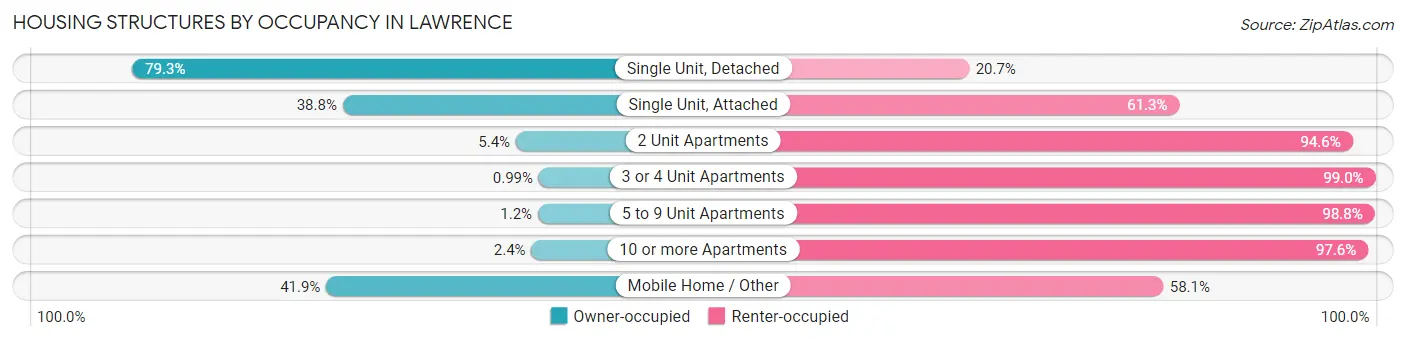
| Structure Type | Owner-occupied | Renter-occupied |
| Single Unit, Detached | 15,483 (79.3%) | 4,041 (20.7%) |
| Single Unit, Attached | 1,797 (38.8%) | 2,841 (61.3%) |
| 2 Unit Apartments | 70 (5.4%) | 1,226 (94.6%) |
| 3 or 4 Unit Apartments | 31 (1.0%) | 3,102 (99.0%) |
| 5 to 9 Unit Apartments | 40 (1.2%) | 3,418 (98.8%) |
| 10 or more Apartments | 199 (2.4%) | 8,030 (97.6%) |
| Mobile Home / Other | 213 (41.9%) | 295 (58.1%) |
| Total | 17,833 (43.7%) | 22,953 (56.3%) |
Housing Structures by Number of Rooms in Lawrence
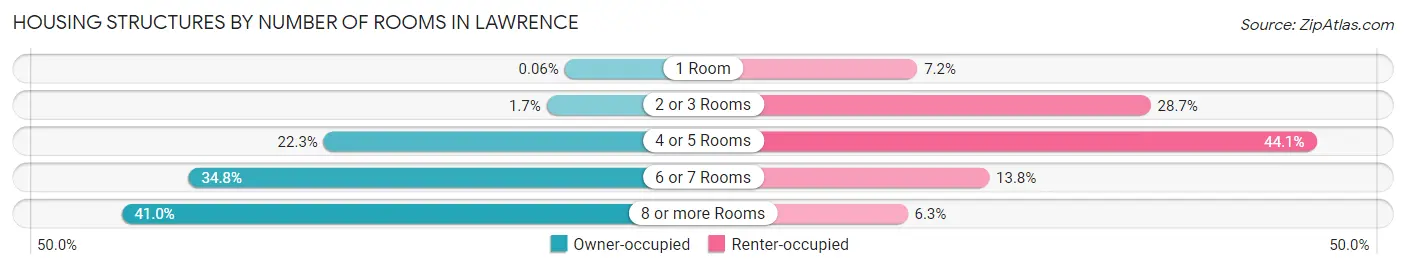
| Number of Rooms | Owner-occupied | Renter-occupied |
| 1 Room | 11 (0.1%) | 1,642 (7.1%) |
| 2 or 3 Rooms | 308 (1.7%) | 6,597 (28.7%) |
| 4 or 5 Rooms | 3,984 (22.3%) | 10,112 (44.1%) |
| 6 or 7 Rooms | 6,212 (34.8%) | 3,167 (13.8%) |
| 8 or more Rooms | 7,318 (41.0%) | 1,435 (6.2%) |
| Total | 17,833 (100.0%) | 22,953 (100.0%) |
Housing Structure by Heating Type in Lawrence
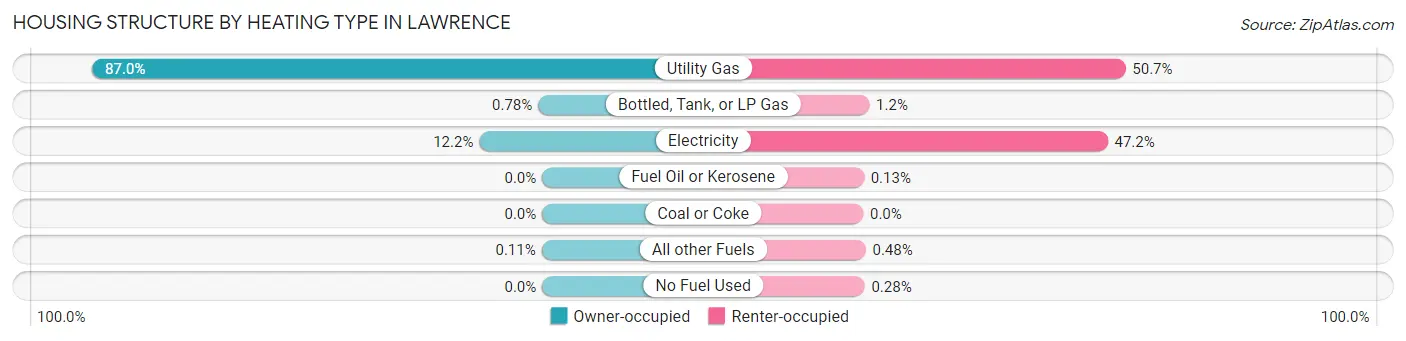
| Heating Type | Owner-occupied | Renter-occupied |
| Utility Gas | 15,509 (87.0%) | 11,634 (50.7%) |
| Bottled, Tank, or LP Gas | 139 (0.8%) | 271 (1.2%) |
| Electricity | 2,166 (12.1%) | 10,843 (47.2%) |
| Fuel Oil or Kerosene | 0 (0.0%) | 30 (0.1%) |
| Coal or Coke | 0 (0.0%) | 0 (0.0%) |
| All other Fuels | 19 (0.1%) | 111 (0.5%) |
| No Fuel Used | 0 (0.0%) | 64 (0.3%) |
| Total | 17,833 (100.0%) | 22,953 (100.0%) |
Household Vehicle Usage in Lawrence
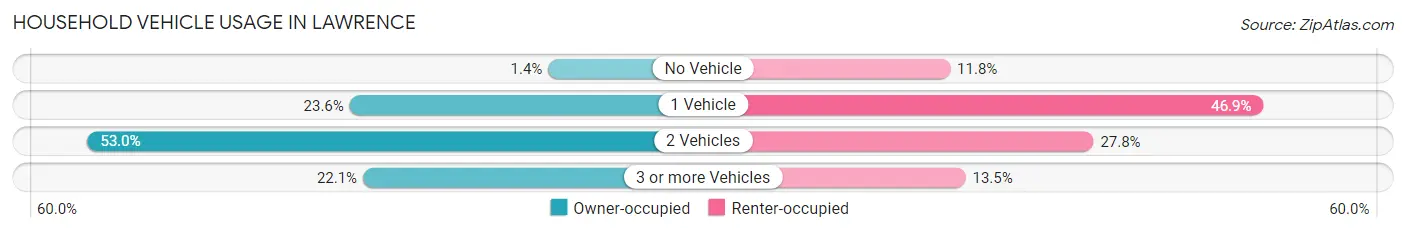
| Vehicles per Household | Owner-occupied | Renter-occupied |
| No Vehicle | 240 (1.3%) | 2,706 (11.8%) |
| 1 Vehicle | 4,206 (23.6%) | 10,757 (46.9%) |
| 2 Vehicles | 9,446 (53.0%) | 6,390 (27.8%) |
| 3 or more Vehicles | 3,941 (22.1%) | 3,100 (13.5%) |
| Total | 17,833 (100.0%) | 22,953 (100.0%) |
Real Estate & Mortgages in Lawrence
Real Estate and Mortgage Overview in Lawrence
| Characteristic | Without Mortgage | With Mortgage |
| Housing Units | 6,061 | 11,772 |
| Median Property Value | $244,400 | $249,000 |
| Median Household Income | $90,934 | $3,809 |
| Monthly Housing Costs | $685 | $1,425 |
| Real Estate Taxes | $3,113 | $275 |
Property Value by Mortgage Status in Lawrence
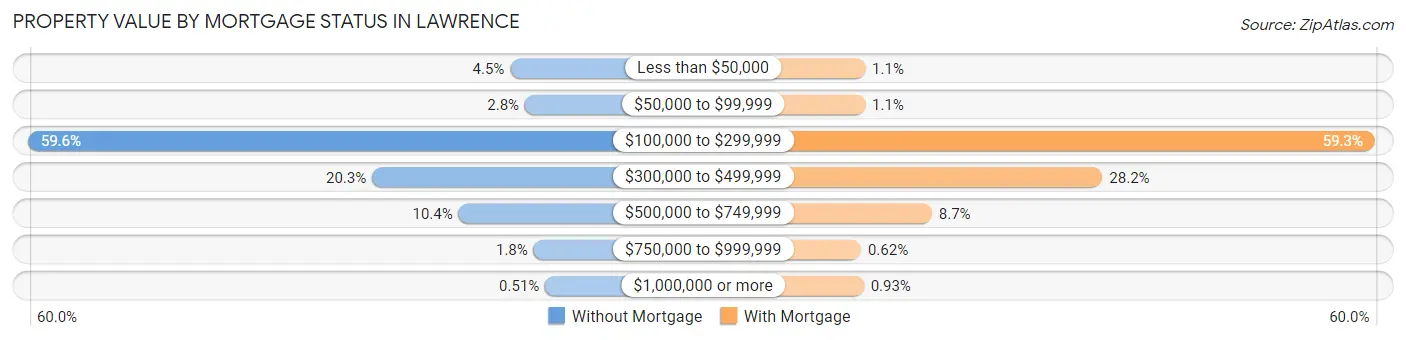
| Property Value | Without Mortgage | With Mortgage |
| Less than $50,000 | 273 (4.5%) | 129 (1.1%) |
| $50,000 to $99,999 | 171 (2.8%) | 128 (1.1%) |
| $100,000 to $299,999 | 3,614 (59.6%) | 6,986 (59.3%) |
| $300,000 to $499,999 | 1,230 (20.3%) | 3,321 (28.2%) |
| $500,000 to $749,999 | 631 (10.4%) | 1,026 (8.7%) |
| $750,000 to $999,999 | 111 (1.8%) | 73 (0.6%) |
| $1,000,000 or more | 31 (0.5%) | 109 (0.9%) |
| Total | 6,061 (100.0%) | 11,772 (100.0%) |
Household Income by Mortgage Status in Lawrence
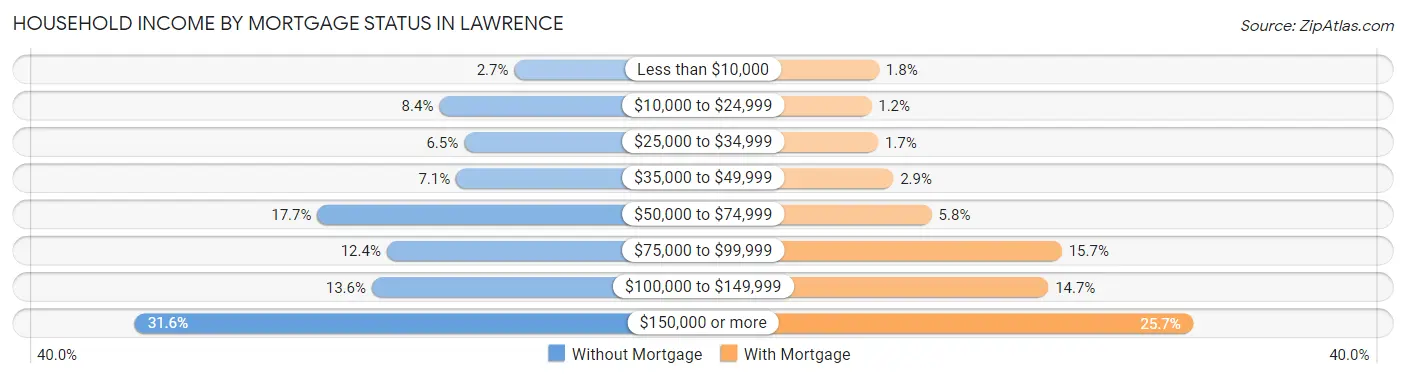
| Household Income | Without Mortgage | With Mortgage |
| Less than $10,000 | 163 (2.7%) | 210 (1.8%) |
| $10,000 to $24,999 | 510 (8.4%) | 141 (1.2%) |
| $25,000 to $34,999 | 395 (6.5%) | 201 (1.7%) |
| $35,000 to $49,999 | 432 (7.1%) | 338 (2.9%) |
| $50,000 to $74,999 | 1,073 (17.7%) | 683 (5.8%) |
| $75,000 to $99,999 | 752 (12.4%) | 1,849 (15.7%) |
| $100,000 to $149,999 | 821 (13.6%) | 1,728 (14.7%) |
| $150,000 or more | 1,915 (31.6%) | 3,023 (25.7%) |
| Total | 6,061 (100.0%) | 11,772 (100.0%) |
Property Value to Household Income Ratio in Lawrence
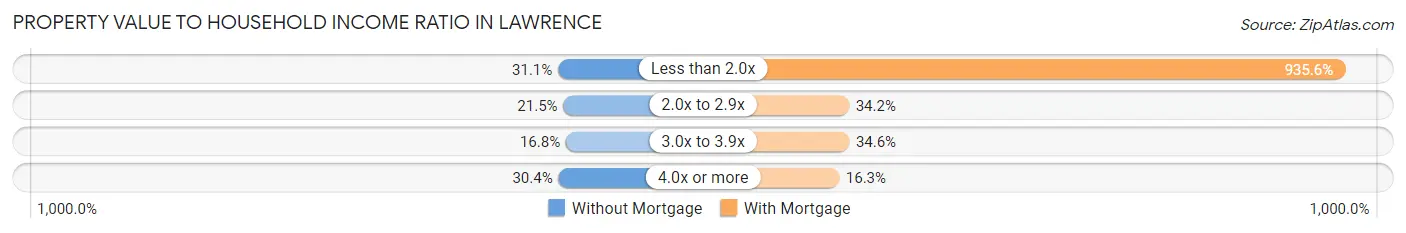
| Value-to-Income Ratio | Without Mortgage | With Mortgage |
| Less than 2.0x | 1,884 (31.1%) | 110,136 (935.6%) |
| 2.0x to 2.9x | 1,300 (21.4%) | 4,022 (34.2%) |
| 3.0x to 3.9x | 1,019 (16.8%) | 4,068 (34.6%) |
| 4.0x or more | 1,842 (30.4%) | 1,913 (16.3%) |
| Total | 6,061 (100.0%) | 11,772 (100.0%) |
Real Estate Taxes by Mortgage Status in Lawrence
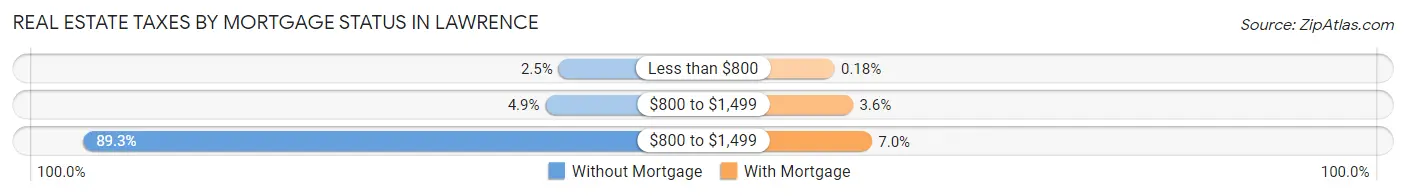
| Property Taxes | Without Mortgage | With Mortgage |
| Less than $800 | 150 (2.5%) | 21 (0.2%) |
| $800 to $1,499 | 297 (4.9%) | 418 (3.5%) |
| $800 to $1,499 | 5,412 (89.3%) | 823 (7.0%) |
| Total | 6,061 (100.0%) | 11,772 (100.0%) |
Health & Disability in Lawrence
Health Insurance Coverage by Age in Lawrence
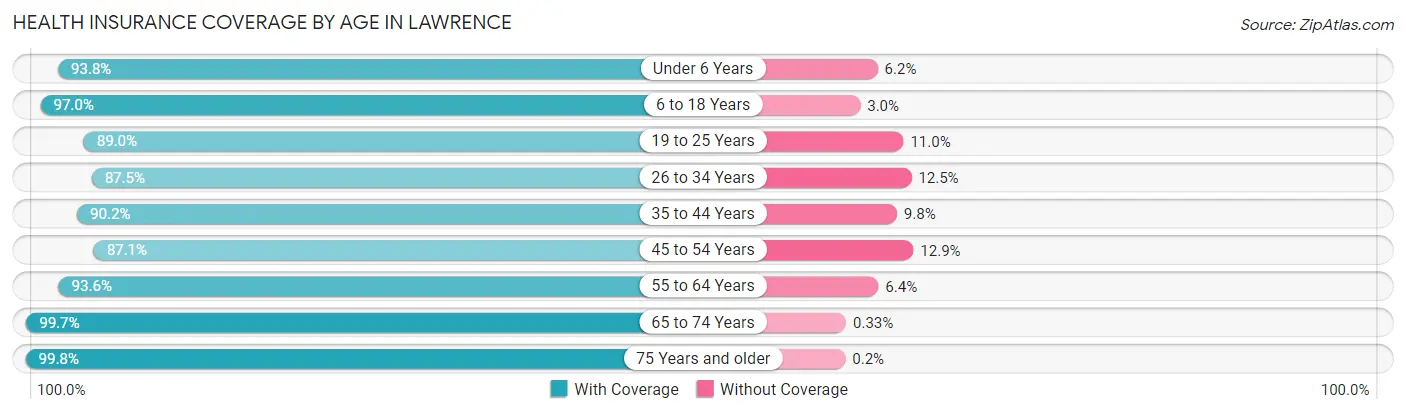
| Age Bracket | With Coverage | Without Coverage |
| Under 6 Years | 5,067 (93.8%) | 336 (6.2%) |
| 6 to 18 Years | 12,709 (97.0%) | 391 (3.0%) |
| 19 to 25 Years | 22,052 (89.0%) | 2,738 (11.0%) |
| 26 to 34 Years | 11,147 (87.5%) | 1,595 (12.5%) |
| 35 to 44 Years | 10,124 (90.2%) | 1,101 (9.8%) |
| 45 to 54 Years | 7,609 (87.1%) | 1,126 (12.9%) |
| 55 to 64 Years | 6,593 (93.6%) | 448 (6.4%) |
| 65 to 74 Years | 6,971 (99.7%) | 23 (0.3%) |
| 75 Years and older | 4,576 (99.8%) | 9 (0.2%) |
| Total | 86,848 (91.8%) | 7,767 (8.2%) |
Health Insurance Coverage by Citizenship Status in Lawrence
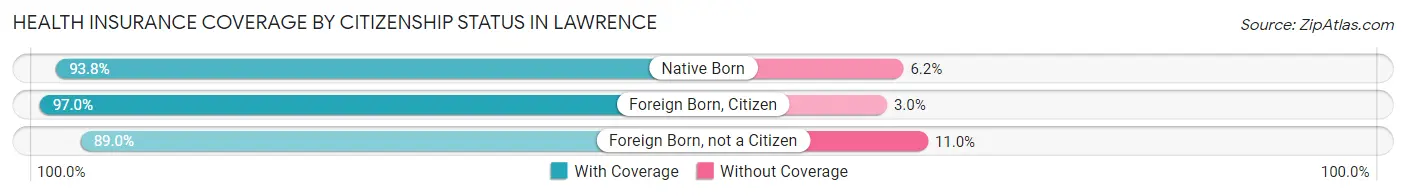
| Citizenship Status | With Coverage | Without Coverage |
| Native Born | 5,067 (93.8%) | 336 (6.2%) |
| Foreign Born, Citizen | 12,709 (97.0%) | 391 (3.0%) |
| Foreign Born, not a Citizen | 22,052 (89.0%) | 2,738 (11.0%) |
Health Insurance Coverage by Household Income in Lawrence
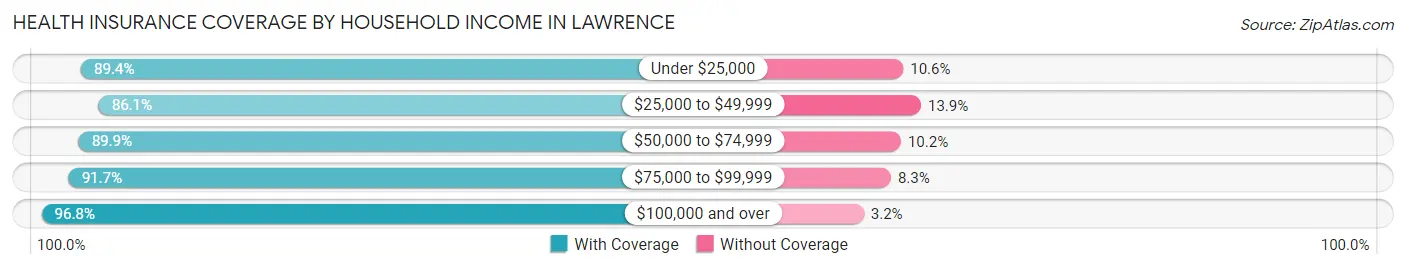
| Household Income | With Coverage | Without Coverage |
| Under $25,000 | 11,313 (89.4%) | 1,339 (10.6%) |
| $25,000 to $49,999 | 12,725 (86.1%) | 2,056 (13.9%) |
| $50,000 to $74,999 | 14,275 (89.8%) | 1,613 (10.2%) |
| $75,000 to $99,999 | 10,696 (91.7%) | 966 (8.3%) |
| $100,000 and over | 30,968 (96.8%) | 1,020 (3.2%) |
Public vs Private Health Insurance Coverage by Age in Lawrence
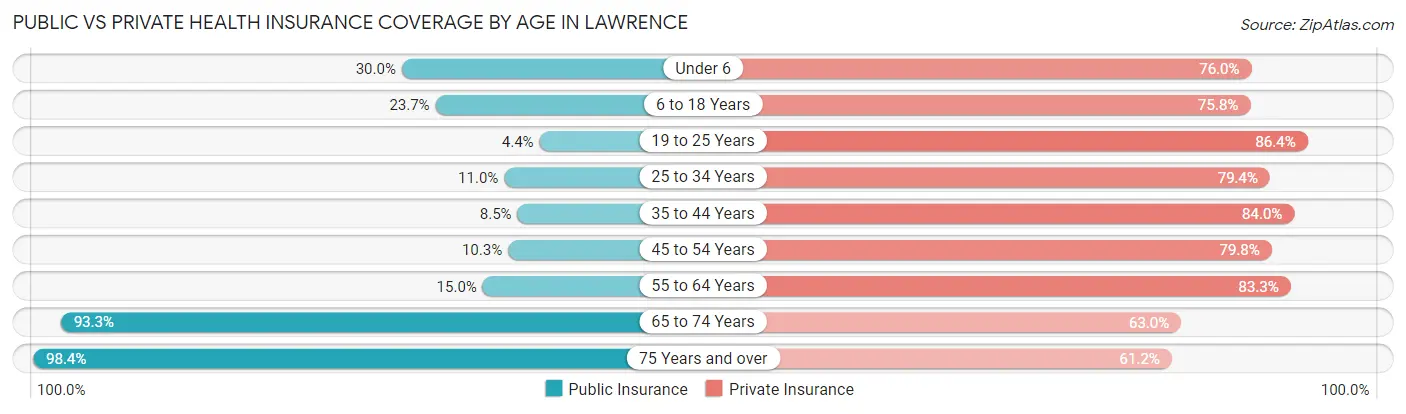
| Age Bracket | Public Insurance | Private Insurance |
| Under 6 | 1,621 (30.0%) | 4,107 (76.0%) |
| 6 to 18 Years | 3,110 (23.7%) | 9,928 (75.8%) |
| 19 to 25 Years | 1,101 (4.4%) | 21,425 (86.4%) |
| 25 to 34 Years | 1,400 (11.0%) | 10,122 (79.4%) |
| 35 to 44 Years | 956 (8.5%) | 9,424 (84.0%) |
| 45 to 54 Years | 898 (10.3%) | 6,968 (79.8%) |
| 55 to 64 Years | 1,055 (15.0%) | 5,865 (83.3%) |
| 65 to 74 Years | 6,525 (93.3%) | 4,404 (63.0%) |
| 75 Years and over | 4,512 (98.4%) | 2,807 (61.2%) |
| Total | 21,178 (22.4%) | 75,050 (79.3%) |
Disability Status by Sex by Age in Lawrence
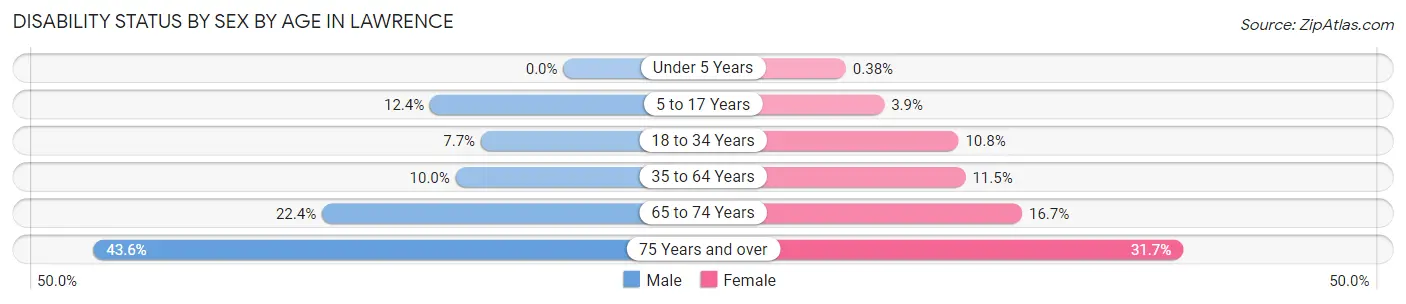
| Age Bracket | Male | Female |
| Under 5 Years | 0 (0.0%) | 8 (0.4%) |
| 5 to 17 Years | 679 (12.4%) | 227 (3.9%) |
| 18 to 34 Years | 1,578 (7.6%) | 2,153 (10.8%) |
| 35 to 64 Years | 1,359 (10.0%) | 1,540 (11.5%) |
| 65 to 74 Years | 687 (22.4%) | 657 (16.7%) |
| 75 Years and over | 792 (43.6%) | 877 (31.7%) |
Disability Class by Sex by Age in Lawrence
Disability Class: Hearing Difficulty
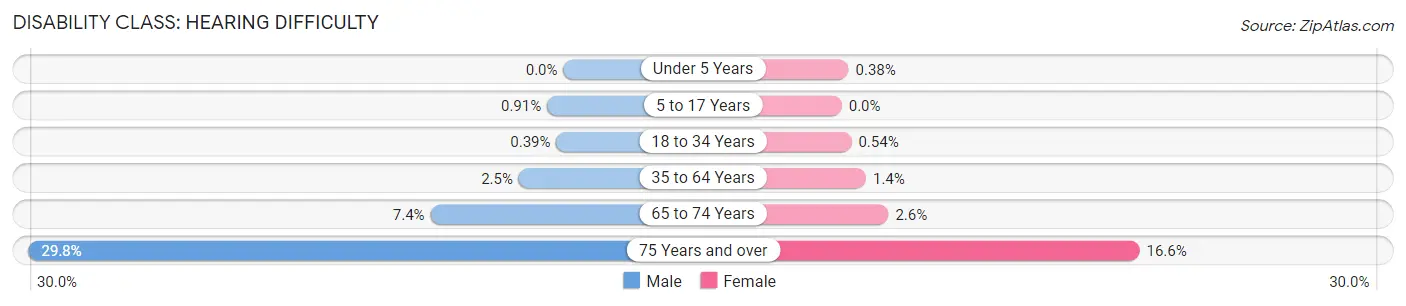
| Age Bracket | Male | Female |
| Under 5 Years | 0 (0.0%) | 8 (0.4%) |
| 5 to 17 Years | 50 (0.9%) | 0 (0.0%) |
| 18 to 34 Years | 81 (0.4%) | 107 (0.5%) |
| 35 to 64 Years | 337 (2.5%) | 181 (1.3%) |
| 65 to 74 Years | 227 (7.4%) | 102 (2.6%) |
| 75 Years and over | 541 (29.8%) | 459 (16.6%) |
Disability Class: Vision Difficulty
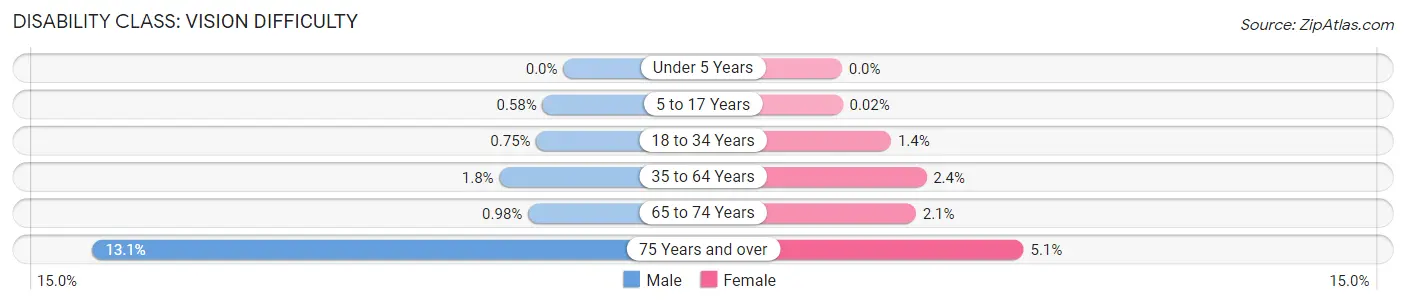
| Age Bracket | Male | Female |
| Under 5 Years | 0 (0.0%) | 0 (0.0%) |
| 5 to 17 Years | 32 (0.6%) | 1 (0.0%) |
| 18 to 34 Years | 154 (0.7%) | 273 (1.4%) |
| 35 to 64 Years | 242 (1.8%) | 315 (2.4%) |
| 65 to 74 Years | 30 (1.0%) | 81 (2.1%) |
| 75 Years and over | 238 (13.1%) | 140 (5.1%) |
Disability Class: Cognitive Difficulty
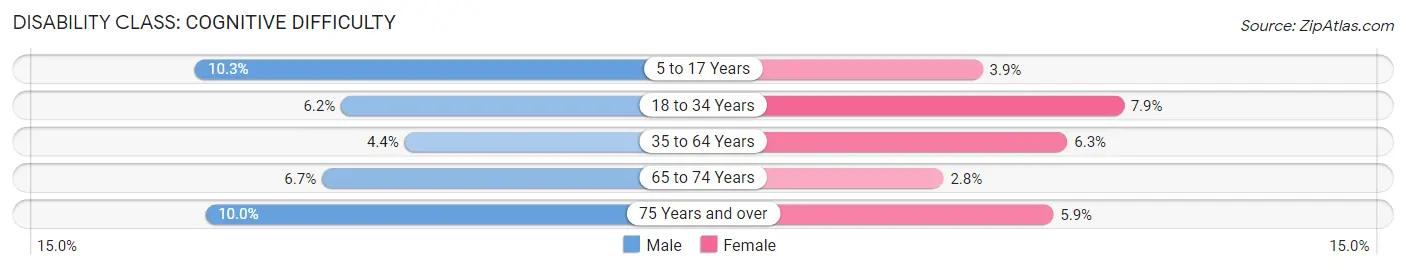
| Age Bracket | Male | Female |
| 5 to 17 Years | 563 (10.2%) | 226 (3.9%) |
| 18 to 34 Years | 1,277 (6.2%) | 1,561 (7.9%) |
| 35 to 64 Years | 601 (4.4%) | 842 (6.3%) |
| 65 to 74 Years | 206 (6.7%) | 111 (2.8%) |
| 75 Years and over | 181 (10.0%) | 163 (5.9%) |
Disability Class: Ambulatory Difficulty
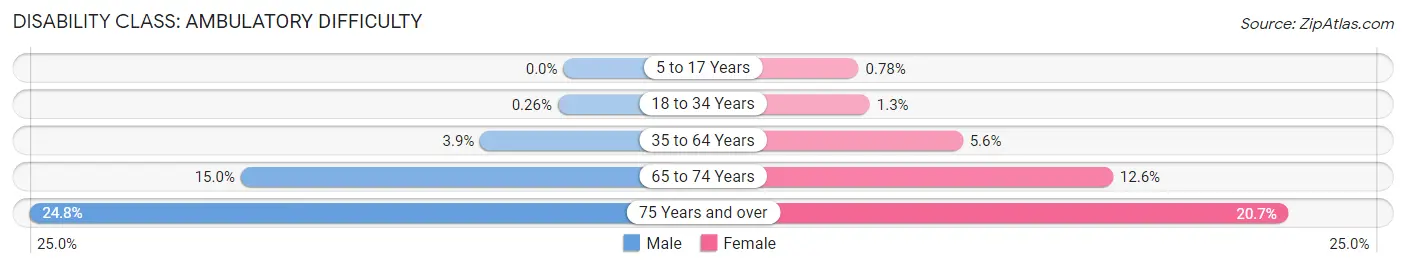
| Age Bracket | Male | Female |
| 5 to 17 Years | 0 (0.0%) | 45 (0.8%) |
| 18 to 34 Years | 53 (0.3%) | 259 (1.3%) |
| 35 to 64 Years | 525 (3.9%) | 753 (5.6%) |
| 65 to 74 Years | 459 (15.0%) | 494 (12.6%) |
| 75 Years and over | 450 (24.8%) | 574 (20.7%) |
Disability Class: Self-Care Difficulty
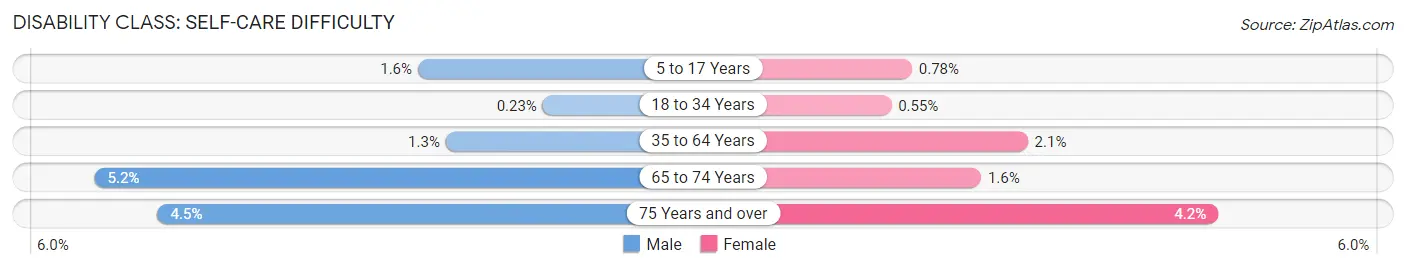
| Age Bracket | Male | Female |
| 5 to 17 Years | 89 (1.6%) | 45 (0.8%) |
| 18 to 34 Years | 47 (0.2%) | 110 (0.5%) |
| 35 to 64 Years | 178 (1.3%) | 277 (2.1%) |
| 65 to 74 Years | 160 (5.2%) | 61 (1.5%) |
| 75 Years and over | 82 (4.5%) | 116 (4.2%) |
Technology Access in Lawrence
Computing Device Access in Lawrence
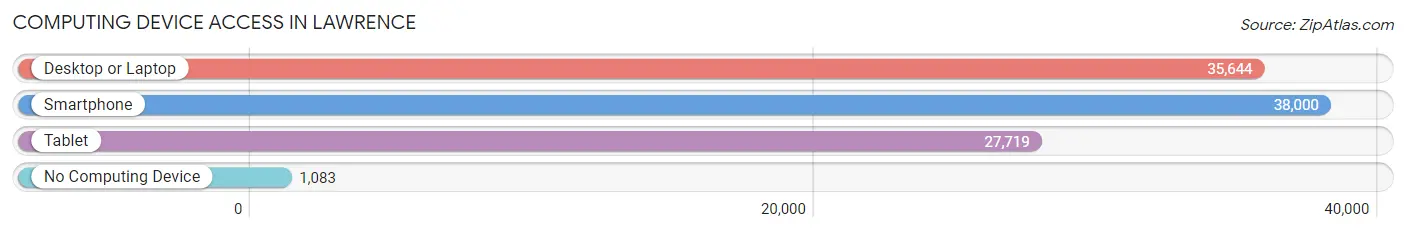
| Device Type | # Households | % Households |
| Desktop or Laptop | 35,644 | 87.4% |
| Smartphone | 38,000 | 93.2% |
| Tablet | 27,719 | 68.0% |
| No Computing Device | 1,083 | 2.7% |
| Total | 40,786 | 100.0% |
Internet Access in Lawrence
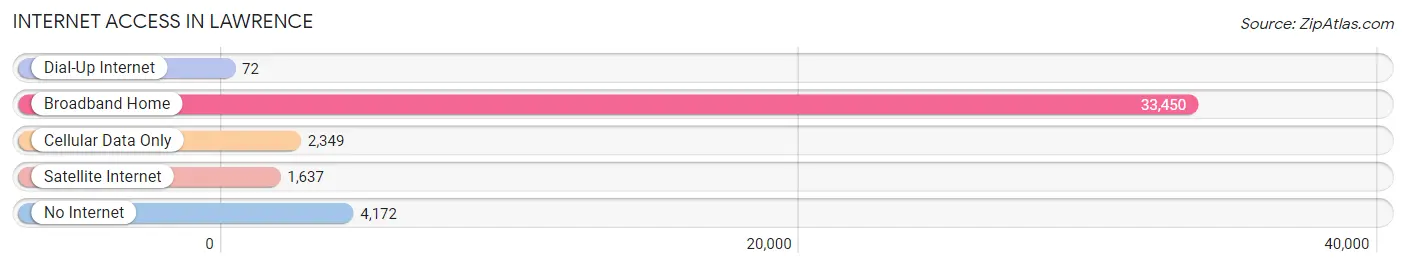
| Internet Type | # Households | % Households |
| Dial-Up Internet | 72 | 0.2% |
| Broadband Home | 33,450 | 82.0% |
| Cellular Data Only | 2,349 | 5.8% |
| Satellite Internet | 1,637 | 4.0% |
| No Internet | 4,172 | 10.2% |
| Total | 40,786 | 100.0% |
Lawrence Summary
Lawrence, Kansas is a city located in the northeastern part of the state, in Douglas County. It is the county seat and the sixth-largest city in the state. Lawrence is situated along the Kansas River, and is home to the University of Kansas. The city has a population of around 93,000 people, and is part of the Lawrence, Kansas Metropolitan Statistical Area.
History
The area that is now Lawrence was first settled in 1854 by a group of New Englanders who were looking for a place to settle and build a new town. The group was led by Charles Robinson, who had been appointed by the New England Emigrant Aid Company to lead the group. The town was named after Amos Lawrence, a prominent Boston businessman who had donated money to the Emigrant Aid Company.
The town quickly grew, and by the time of the Civil War, it had become a major center of abolitionist activity. During the war, Lawrence was the site of the infamous Lawrence Massacre, in which Confederate guerrillas attacked the town and killed over 150 people.
After the war, Lawrence continued to grow, and by the late 19th century, it had become an important industrial center. The city was home to several factories, including a paper mill, a flour mill, and a woolen mill.
Geography
Lawrence is located in northeastern Kansas, in Douglas County. It is situated along the Kansas River, and is about 25 miles west of Kansas City. The city has a total area of 28.3 square miles, of which 28.2 square miles is land and 0.1 square miles is water.
The city is located in the humid continental climate zone, with hot, humid summers and cold, dry winters. The average annual temperature is around 54°F, and the average annual precipitation is around 37 inches.
Economy
Lawrence has a diverse economy, with a mix of manufacturing, retail, and service industries. The city is home to several major employers, including the University of Kansas, the Lawrence Public Schools, and the Lawrence Memorial Hospital.
The city is also home to several major corporations, including Hallmark Cards, Sprint, and the World Company. The city is also home to several smaller businesses, including several restaurants, bars, and retail stores.
Demographics
As of the 2010 census, Lawrence had a population of 87,643 people. The racial makeup of the city was 79.2% White, 8.3% African American, 0.7% Native American, 4.2% Asian, 0.1% Pacific Islander, 4.3% from other races, and 3.2% from two or more races. Hispanic or Latino of any race were 11.2% of the population.
The median income for a household in the city was $37,837, and the median income for a family was $50,919. The per capita income for the city was $22,945. About 15.2% of the population was below the poverty line.
Lawrence is a diverse city, with a mix of cultures and backgrounds. The city is home to several universities and colleges, and is a popular destination for students and young professionals. The city is also home to several major employers, and has a strong economy. Lawrence is a great place to live, work, and play.
Common Questions
What is Per Capita Income in Lawrence?
Per Capita income in Lawrence is $36,032.
What is the Median Family Income in Lawrence?
Median Family Income in Lawrence is $97,893.
What is the Median Household income in Lawrence?
Median Household Income in Lawrence is $59,834.
What is Income or Wage Gap in Lawrence?
Income or Wage Gap in Lawrence is 24.0%.
Women in Lawrence earn 76.0 cents for every dollar earned by a man.
What is Family Income Deficit in Lawrence?
Family Income Deficit in Lawrence is $12,382.
Families that are below poverty line in Lawrence earn $12,382 less on average than the poverty threshold level.
What is Inequality or Gini Index in Lawrence?
Inequality or Gini Index in Lawrence is 0.47.
What is the Total Population of Lawrence?
Total Population of Lawrence is 95,103.
What is the Total Male Population of Lawrence?
Total Male Population of Lawrence is 47,089.
What is the Total Female Population of Lawrence?
Total Female Population of Lawrence is 48,014.
What is the Ratio of Males per 100 Females in Lawrence?
There are 98.07 Males per 100 Females in Lawrence.
What is the Ratio of Females per 100 Males in Lawrence?
There are 101.96 Females per 100 Males in Lawrence.
What is the Median Population Age in Lawrence?
Median Population Age in Lawrence is 28.8 Years.
What is the Average Family Size in Lawrence
Average Family Size in Lawrence is 2.8 People.
What is the Average Household Size in Lawrence
Average Household Size in Lawrence is 2.1 People.
How Large is the Labor Force in Lawrence?
There are 58,008 People in the Labor Forcein in Lawrence.
What is the Percentage of People in the Labor Force in Lawrence?
71.8% of People are in the Labor Force in Lawrence.
What is the Unemployment Rate in Lawrence?
Unemployment Rate in Lawrence is 5.2%.