Baldwin City, KS Map & Demographics
Baldwin City Map
Baldwin City Overview
$32,115
PER CAPITA INCOME
$98,865
AVG FAMILY INCOME
$87,133
AVG HOUSEHOLD INCOME
50.4%
WAGE / INCOME GAP [ % ]
49.6¢/ $1
WAGE / INCOME GAP [ $ ]
$8,077
FAMILY INCOME DEFICIT
0.37
INEQUALITY / GINI INDEX
4,845
TOTAL POPULATION
2,322
MALE POPULATION
2,523
FEMALE POPULATION
92.03
MALES / 100 FEMALES
108.66
FEMALES / 100 MALES
31.8
MEDIAN AGE
3.0
AVG FAMILY SIZE
2.5
AVG HOUSEHOLD SIZE
2,337
LABOR FORCE [ PEOPLE ]
58.8%
PERCENT IN LABOR FORCE
4.9%
UNEMPLOYMENT RATE
Baldwin City Zip Codes
Baldwin City Area Codes
Income in Baldwin City
Income Overview in Baldwin City
Per Capita Income in Baldwin City is $32,115, while median incomes of families and households are $98,865 and $87,133 respectively.
| Characteristic | Number | Measure |
| Per Capita Income | 4,845 | $32,115 |
| Median Family Income | 1,141 | $98,865 |
| Mean Family Income | 1,141 | $111,513 |
| Median Household Income | 1,596 | $87,133 |
| Mean Household Income | 1,596 | $93,384 |
| Income Deficit | 1,141 | $8,077 |
| Wage / Income Gap (%) | 4,845 | 50.37% |
| Wage / Income Gap ($) | 4,845 | 49.63¢ per $1 |
| Gini / Inequality Index | 4,845 | 0.37 |
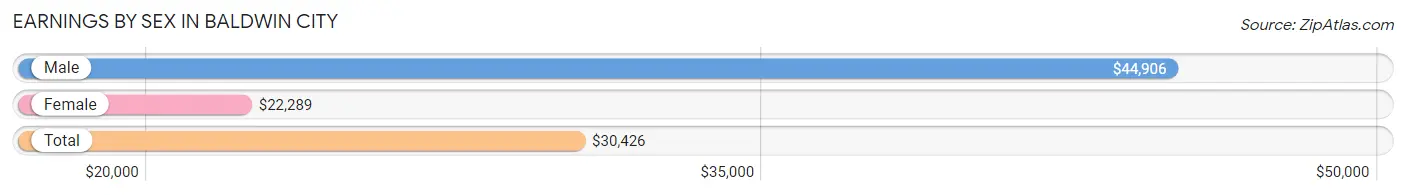
Earnings by Sex in Baldwin City
Average Earnings in Baldwin City are $30,426, $44,906 for men and $22,289 for women, a difference of 50.4%.
| Sex | Number | Average Earnings |
| Male | 1,379 (49.8%) | $44,906 |
| Female | 1,388 (50.2%) | $22,289 |
| Total | 2,767 (100.0%) | $30,426 |
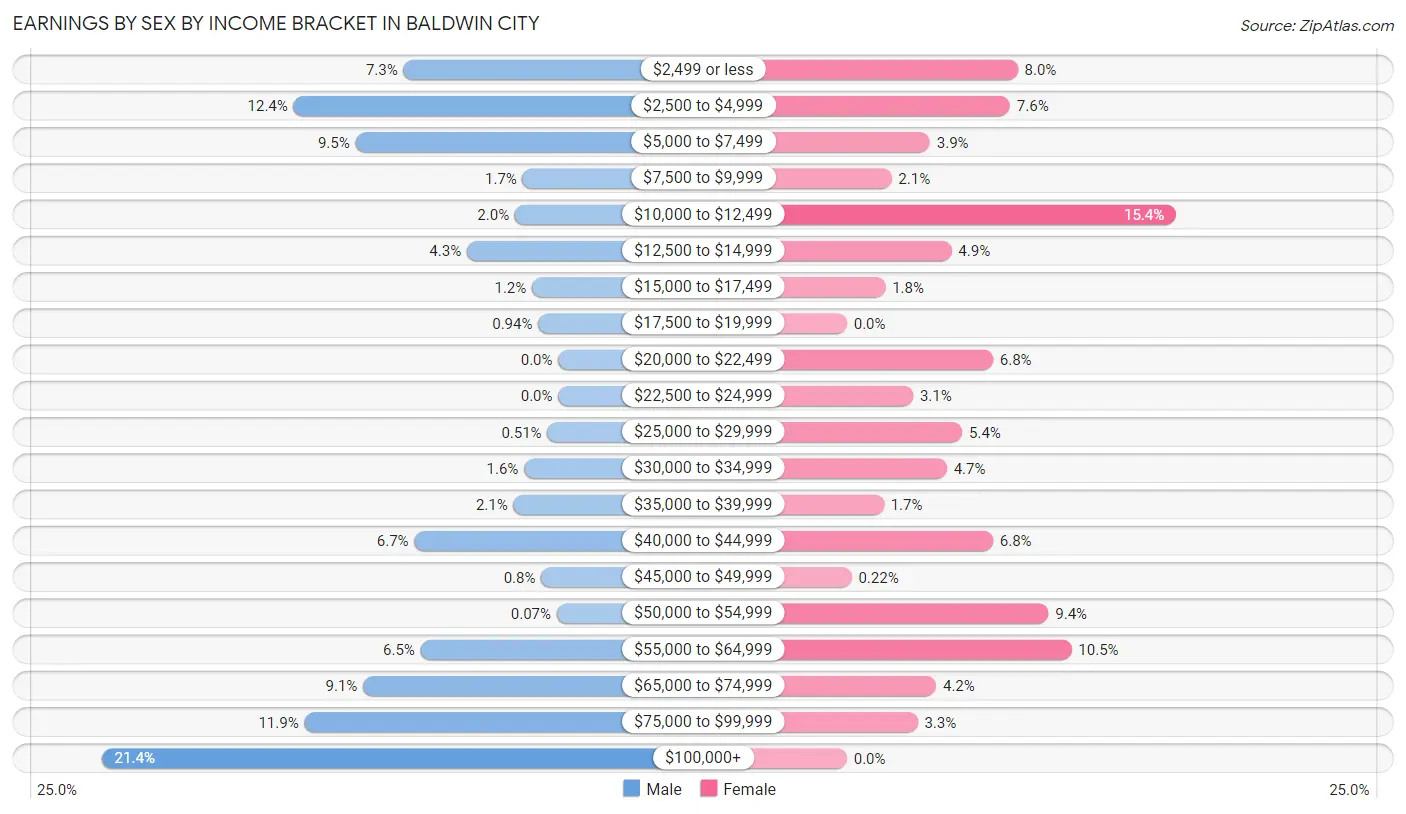
Earnings by Sex by Income Bracket in Baldwin City
The most common earnings brackets in Baldwin City are $100,000+ for men (295 | 21.4%) and $10,000 to $12,499 for women (214 | 15.4%).
| Income | Male | Female |
| $2,499 or less | 100 (7.2%) | 111 (8.0%) |
| $2,500 to $4,999 | 171 (12.4%) | 106 (7.6%) |
| $5,000 to $7,499 | 131 (9.5%) | 54 (3.9%) |
| $7,500 to $9,999 | 23 (1.7%) | 29 (2.1%) |
| $10,000 to $12,499 | 28 (2.0%) | 214 (15.4%) |
| $12,500 to $14,999 | 59 (4.3%) | 68 (4.9%) |
| $15,000 to $17,499 | 17 (1.2%) | 25 (1.8%) |
| $17,500 to $19,999 | 13 (0.9%) | 0 (0.0%) |
| $20,000 to $22,499 | 0 (0.0%) | 95 (6.8%) |
| $22,500 to $24,999 | 0 (0.0%) | 43 (3.1%) |
| $25,000 to $29,999 | 7 (0.5%) | 75 (5.4%) |
| $30,000 to $34,999 | 22 (1.6%) | 65 (4.7%) |
| $35,000 to $39,999 | 29 (2.1%) | 24 (1.7%) |
| $40,000 to $44,999 | 93 (6.7%) | 95 (6.8%) |
| $45,000 to $49,999 | 11 (0.8%) | 3 (0.2%) |
| $50,000 to $54,999 | 1 (0.1%) | 131 (9.4%) |
| $55,000 to $64,999 | 89 (6.5%) | 146 (10.5%) |
| $65,000 to $74,999 | 126 (9.1%) | 58 (4.2%) |
| $75,000 to $99,999 | 164 (11.9%) | 46 (3.3%) |
| $100,000+ | 295 (21.4%) | 0 (0.0%) |
| Total | 1,379 (100.0%) | 1,388 (100.0%) |
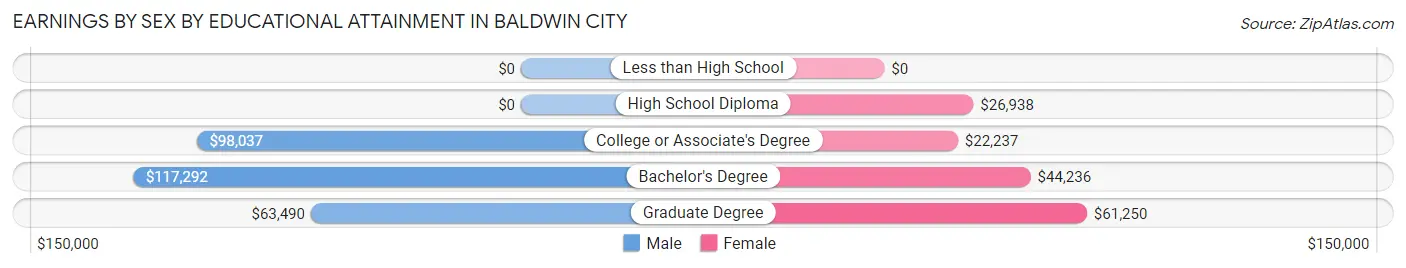
Earnings by Sex by Educational Attainment in Baldwin City
Average earnings in Baldwin City are $74,032 for men and $43,079 for women, a difference of 41.8%. Men with an educational attainment of bachelor's degree enjoy the highest average annual earnings of $117,292, while those with graduate degree education earn the least with $63,490. Women with an educational attainment of graduate degree earn the most with the average annual earnings of $61,250, while those with college or associate's degree education have the smallest earnings of $22,237.
| Educational Attainment | Male Income | Female Income |
| Less than High School | - | - |
| High School Diploma | - | - |
| College or Associate's Degree | $98,037 | $22,237 |
| Bachelor's Degree | $117,292 | $44,236 |
| Graduate Degree | $63,490 | $61,250 |
| Total | $74,032 | $43,079 |
Family Income in Baldwin City
Family Income Brackets in Baldwin City
According to the Baldwin City family income data, there are 280 families falling into the $75,000 to $99,999 income range, which is the most common income bracket and makes up 24.5% of all families.
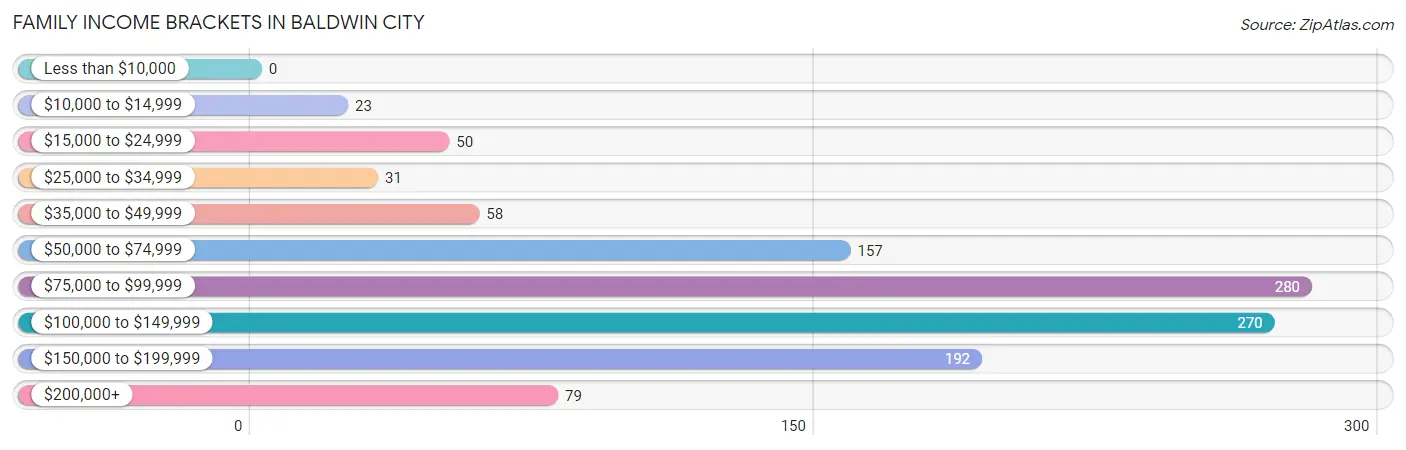
| Income Bracket | # Families | % Families |
| Less than $10,000 | 0 | 0.0% |
| $10,000 to $14,999 | 23 | 2.0% |
| $15,000 to $24,999 | 50 | 4.4% |
| $25,000 to $34,999 | 31 | 2.7% |
| $35,000 to $49,999 | 58 | 5.1% |
| $50,000 to $74,999 | 157 | 13.8% |
| $75,000 to $99,999 | 280 | 24.5% |
| $100,000 to $149,999 | 270 | 23.7% |
| $150,000 to $199,999 | 192 | 16.8% |
| $200,000+ | 79 | 6.9% |
Family Income by Famaliy Size in Baldwin City
3-person families (371 | 32.5%) account for the highest median family income in Baldwin City with $119,538 per family, while 2-person families (511 | 44.8%) have the highest median income of $41,995 per family member.
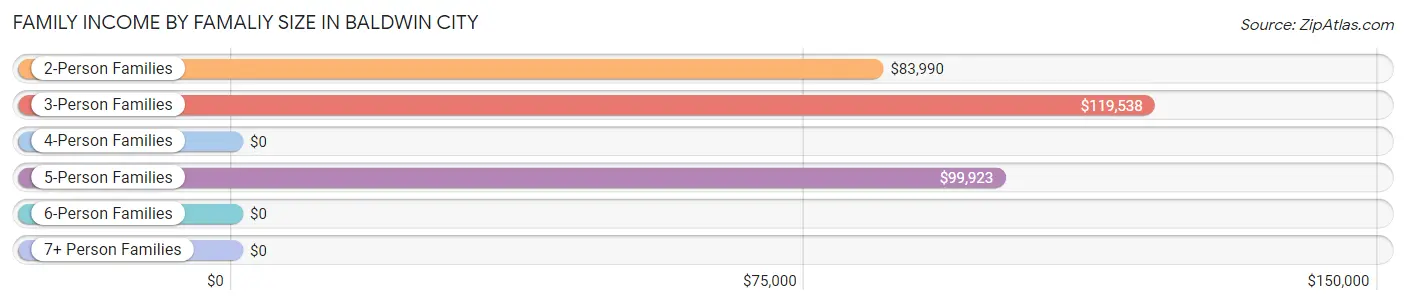
| Income Bracket | # Families | Median Income |
| 2-Person Families | 511 (44.8%) | $83,990 |
| 3-Person Families | 371 (32.5%) | $119,538 |
| 4-Person Families | 106 (9.3%) | $0 |
| 5-Person Families | 126 (11.0%) | $99,923 |
| 6-Person Families | 27 (2.4%) | $0 |
| 7+ Person Families | 0 (0.0%) | $0 |
| Total | 1,141 (100.0%) | $98,865 |
Family Income by Number of Earners in Baldwin City
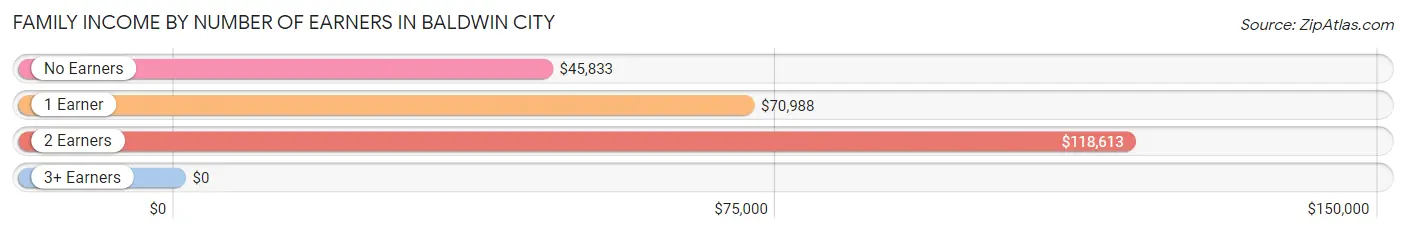
| Number of Earners | # Families | Median Income |
| No Earners | 178 (15.6%) | $45,833 |
| 1 Earner | 217 (19.0%) | $70,988 |
| 2 Earners | 681 (59.7%) | $118,613 |
| 3+ Earners | 65 (5.7%) | $0 |
| Total | 1,141 (100.0%) | $98,865 |
Household Income in Baldwin City
Household Income Brackets in Baldwin City
With 397 households falling in the category, the $75,000 to $99,999 income range is the most frequent in Baldwin City, accounting for 24.9% of all households. In contrast, only 37 households (2.3%) fall into the less than $10,000 income bracket, making it the least populous group.
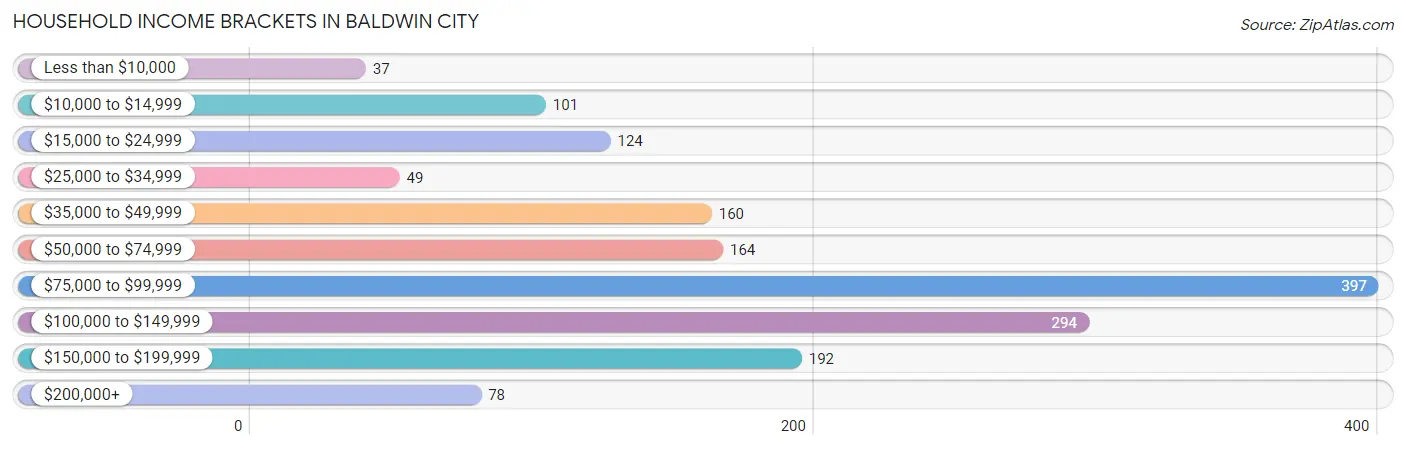
| Income Bracket | # Households | % Households |
| Less than $10,000 | 37 | 2.3% |
| $10,000 to $14,999 | 101 | 6.3% |
| $15,000 to $24,999 | 124 | 7.8% |
| $25,000 to $34,999 | 49 | 3.1% |
| $35,000 to $49,999 | 160 | 10.0% |
| $50,000 to $74,999 | 164 | 10.3% |
| $75,000 to $99,999 | 397 | 24.9% |
| $100,000 to $149,999 | 294 | 18.4% |
| $150,000 to $199,999 | 192 | 12.0% |
| $200,000+ | 78 | 4.9% |
Household Income by Householder Age in Baldwin City
The median household income in Baldwin City is $87,133, with the highest median household income of $114,840 found in the 25 to 44 years age bracket for the primary householder. A total of 511 households (32.0%) fall into this category. Meanwhile, the 15 to 24 years age bracket for the primary householder has the lowest median household income of $0, with 57 households (3.6%) in this group.
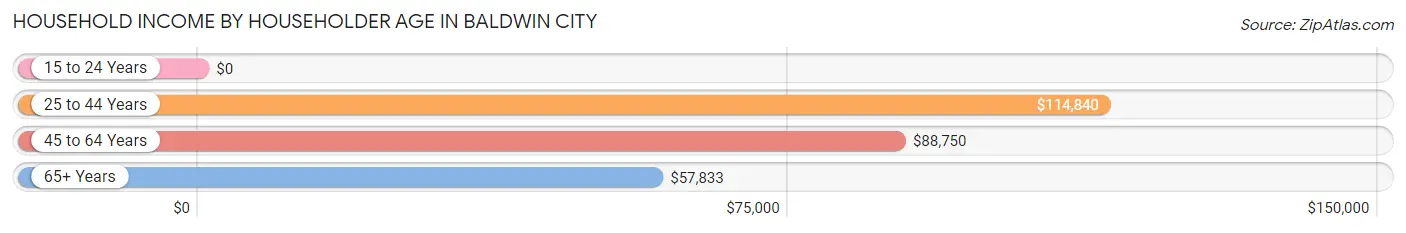
| Income Bracket | # Households | Median Income |
| 15 to 24 Years | 57 (3.6%) | $0 |
| 25 to 44 Years | 511 (32.0%) | $114,840 |
| 45 to 64 Years | 682 (42.7%) | $88,750 |
| 65+ Years | 346 (21.7%) | $57,833 |
| Total | 1,596 (100.0%) | $87,133 |
Poverty in Baldwin City
Income Below Poverty by Sex and Age in Baldwin City
With 6.5% poverty level for males and 10.9% for females among the residents of Baldwin City, under 5 year old males and 6 to 11 year old females are the most vulnerable to poverty, with 94 males (73.4%) and 42 females (100.0%) in their respective age groups living below the poverty level.
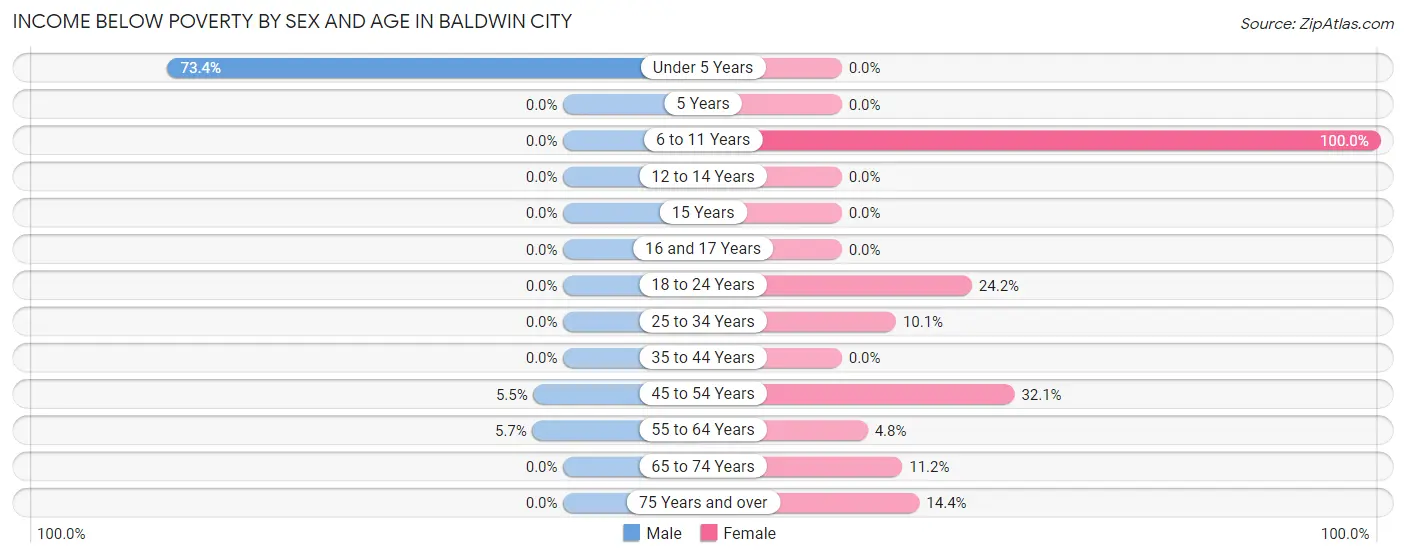
| Age Bracket | Male | Female |
| Under 5 Years | 94 (73.4%) | 0 (0.0%) |
| 5 Years | 0 (0.0%) | 0 (0.0%) |
| 6 to 11 Years | 0 (0.0%) | 42 (100.0%) |
| 12 to 14 Years | 0 (0.0%) | 0 (0.0%) |
| 15 Years | 0 (0.0%) | 0 (0.0%) |
| 16 and 17 Years | 0 (0.0%) | 0 (0.0%) |
| 18 to 24 Years | 0 (0.0%) | 57 (24.1%) |
| 25 to 34 Years | 0 (0.0%) | 21 (10.1%) |
| 35 to 44 Years | 0 (0.0%) | 0 (0.0%) |
| 45 to 54 Years | 12 (5.5%) | 50 (32.1%) |
| 55 to 64 Years | 18 (5.7%) | 23 (4.8%) |
| 65 to 74 Years | 0 (0.0%) | 21 (11.2%) |
| 75 Years and over | 0 (0.0%) | 17 (14.4%) |
| Total | 124 (6.5%) | 231 (10.9%) |
Income Above Poverty by Sex and Age in Baldwin City
According to the poverty statistics in Baldwin City, males aged 6 to 11 years and females aged under 5 years are the age groups that are most secure financially, with 100.0% of males and 100.0% of females in these age groups living above the poverty line.
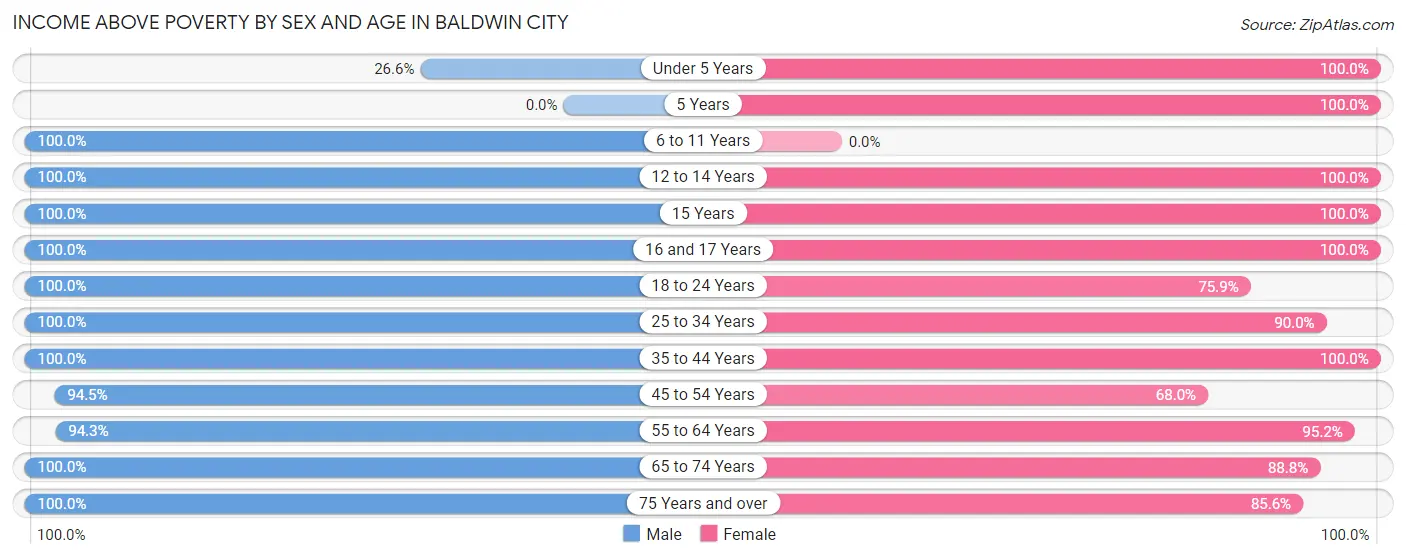
| Age Bracket | Male | Female |
| Under 5 Years | 34 (26.6%) | 110 (100.0%) |
| 5 Years | 0 (0.0%) | 21 (100.0%) |
| 6 to 11 Years | 223 (100.0%) | 0 (0.0%) |
| 12 to 14 Years | 108 (100.0%) | 71 (100.0%) |
| 15 Years | 28 (100.0%) | 80 (100.0%) |
| 16 and 17 Years | 78 (100.0%) | 54 (100.0%) |
| 18 to 24 Years | 107 (100.0%) | 179 (75.8%) |
| 25 to 34 Years | 180 (100.0%) | 188 (89.9%) |
| 35 to 44 Years | 279 (100.0%) | 351 (100.0%) |
| 45 to 54 Years | 205 (94.5%) | 106 (67.9%) |
| 55 to 64 Years | 298 (94.3%) | 455 (95.2%) |
| 65 to 74 Years | 106 (100.0%) | 166 (88.8%) |
| 75 Years and over | 129 (100.0%) | 101 (85.6%) |
| Total | 1,775 (93.5%) | 1,882 (89.1%) |
Income Below Poverty Among Married-Couple Families in Baldwin City
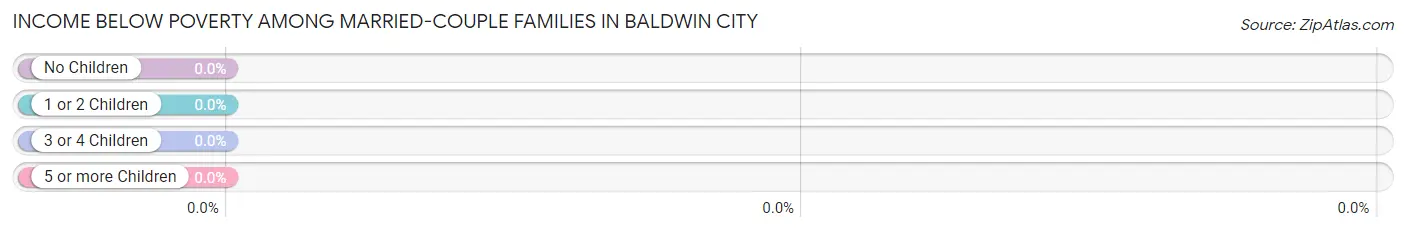
| Children | Above Poverty | Below Poverty |
| No Children | 396 (100.0%) | 0 (0.0%) |
| 1 or 2 Children | 368 (100.0%) | 0 (0.0%) |
| 3 or 4 Children | 66 (100.0%) | 0 (0.0%) |
| 5 or more Children | 0 (0.0%) | 0 (0.0%) |
| Total | 830 (100.0%) | 0 (0.0%) |
Income Below Poverty Among Single-Parent Households in Baldwin City
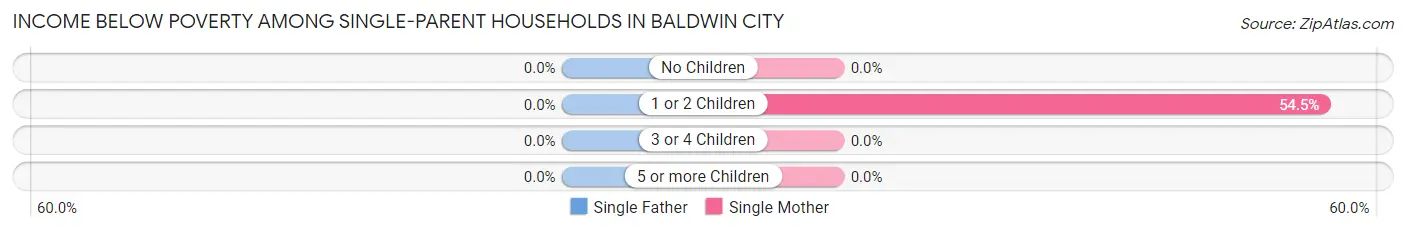
| Children | Single Father | Single Mother |
| No Children | 0 (0.0%) | 0 (0.0%) |
| 1 or 2 Children | 0 (0.0%) | 73 (54.5%) |
| 3 or 4 Children | 0 (0.0%) | 0 (0.0%) |
| 5 or more Children | 0 (0.0%) | 0 (0.0%) |
| Total | 0 (0.0%) | 73 (46.2%) |
Income Below Poverty Among Married-Couple vs Single-Parent Households in Baldwin City
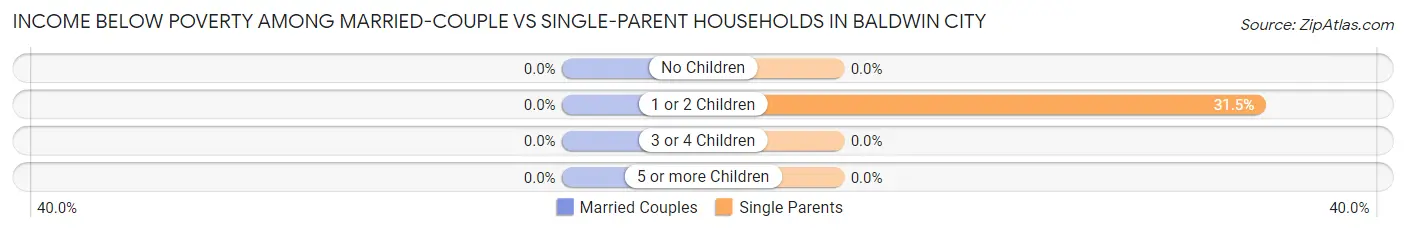
| Children | Married-Couple Families | Single-Parent Households |
| No Children | 0 (0.0%) | 0 (0.0%) |
| 1 or 2 Children | 0 (0.0%) | 73 (31.5%) |
| 3 or 4 Children | 0 (0.0%) | 0 (0.0%) |
| 5 or more Children | 0 (0.0%) | 0 (0.0%) |
| Total | 0 (0.0%) | 73 (23.5%) |
Race in Baldwin City
The most populous races in Baldwin City are White / Caucasian (4,379 | 90.4%), Hispanic or Latino (324 | 6.7%), and Asian (157 | 3.2%).
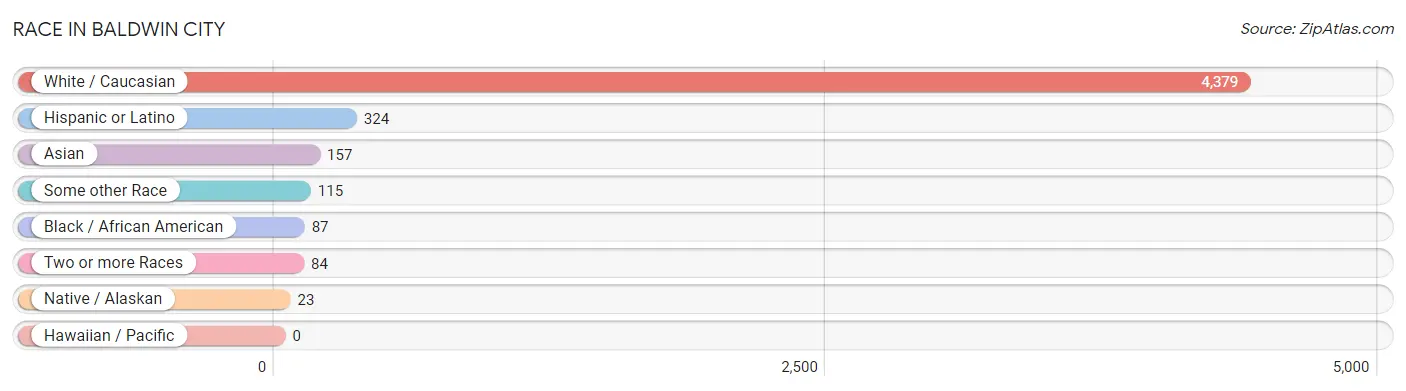
| Race | # Population | % Population |
| Asian | 157 | 3.2% |
| Black / African American | 87 | 1.8% |
| Hawaiian / Pacific | 0 | 0.0% |
| Hispanic or Latino | 324 | 6.7% |
| Native / Alaskan | 23 | 0.5% |
| White / Caucasian | 4,379 | 90.4% |
| Two or more Races | 84 | 1.7% |
| Some other Race | 115 | 2.4% |
| Total | 4,845 | 100.0% |
Ancestry in Baldwin City
The most populous ancestries reported in Baldwin City are German (1,631 | 33.7%), English (1,055 | 21.8%), Irish (668 | 13.8%), American (287 | 5.9%), and Mexican (230 | 4.8%), together accounting for 79.9% of all Baldwin City residents.
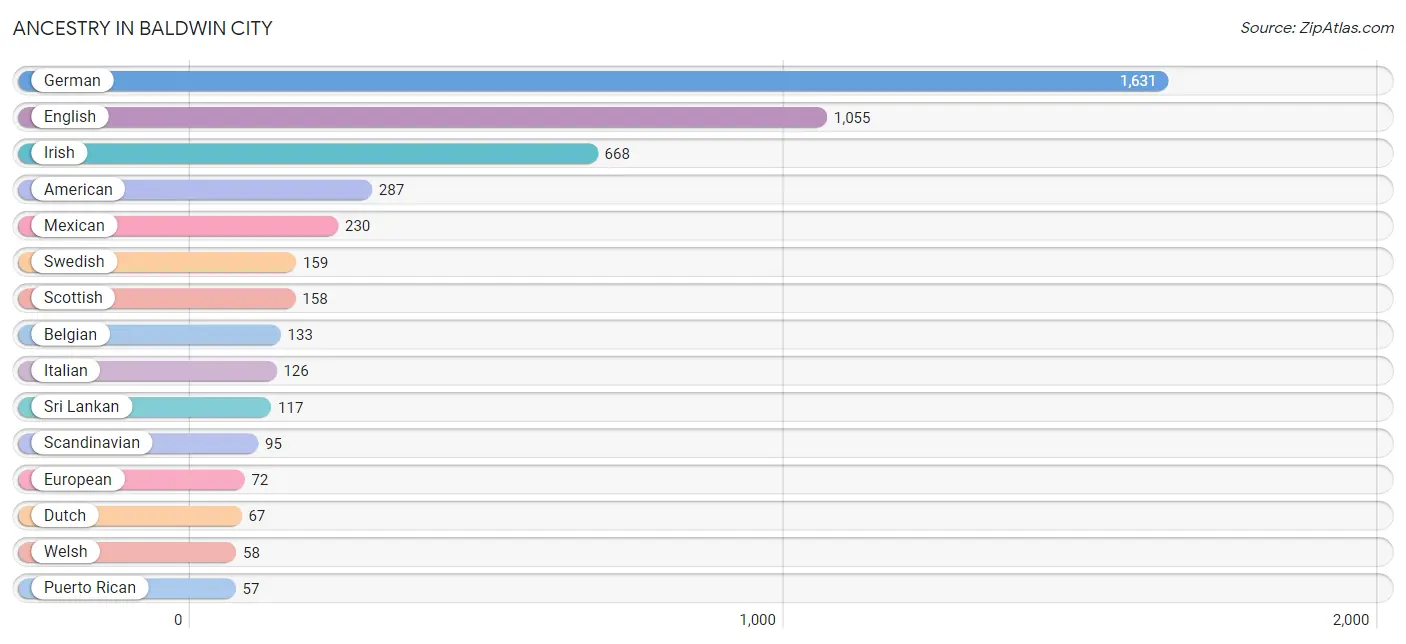
| Ancestry | # Population | % Population |
| American | 287 | 5.9% |
| Belgian | 133 | 2.8% |
| Bhutanese | 10 | 0.2% |
| British | 7 | 0.1% |
| Burmese | 2 | 0.0% |
| Central American | 6 | 0.1% |
| Cherokee | 26 | 0.5% |
| Costa Rican | 2 | 0.0% |
| Czech | 35 | 0.7% |
| Danish | 36 | 0.7% |
| Dutch | 67 | 1.4% |
| English | 1,055 | 21.8% |
| European | 72 | 1.5% |
| French | 41 | 0.9% |
| German | 1,631 | 33.7% |
| Indian (Asian) | 28 | 0.6% |
| Irish | 668 | 13.8% |
| Italian | 126 | 2.6% |
| Japanese | 9 | 0.2% |
| Malaysian | 11 | 0.2% |
| Mexican | 230 | 4.8% |
| Norwegian | 40 | 0.8% |
| Panamanian | 4 | 0.1% |
| Polish | 39 | 0.8% |
| Puerto Rican | 57 | 1.2% |
| Russian | 34 | 0.7% |
| Scandinavian | 95 | 2.0% |
| Scotch-Irish | 57 | 1.2% |
| Scottish | 158 | 3.3% |
| Sioux | 17 | 0.4% |
| Sri Lankan | 117 | 2.4% |
| Swedish | 159 | 3.3% |
| Swiss | 22 | 0.4% |
| Thai | 23 | 0.5% |
| Tohono O'Odham | 6 | 0.1% |
| Welsh | 58 | 1.2% | View All 36 Rows |
Immigrants in Baldwin City
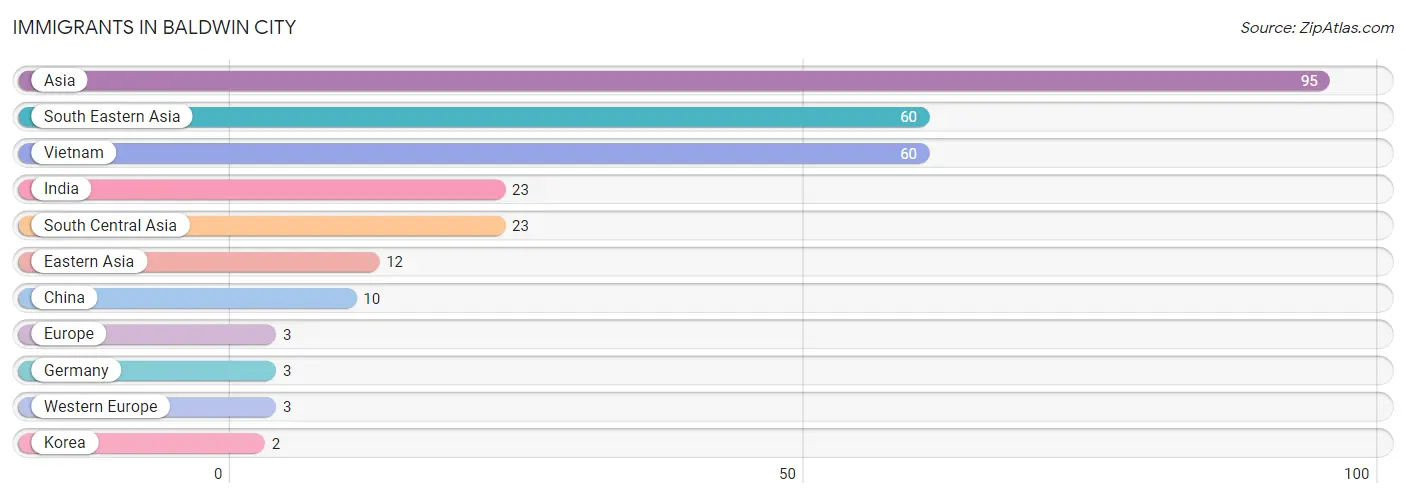
The most numerous immigrant groups reported in Baldwin City came from Asia (95 | 2.0%), South Eastern Asia (60 | 1.2%), Vietnam (60 | 1.2%), India (23 | 0.5%), and South Central Asia (23 | 0.5%), together accounting for 5.4% of all Baldwin City residents.
| Immigration Origin | # Population | % Population |
| Asia | 95 | 2.0% |
| China | 10 | 0.2% |
| Eastern Asia | 12 | 0.3% |
| Europe | 3 | 0.1% |
| Germany | 3 | 0.1% |
| India | 23 | 0.5% |
| Korea | 2 | 0.0% |
| South Central Asia | 23 | 0.5% |
| South Eastern Asia | 60 | 1.2% |
| Vietnam | 60 | 1.2% |
| Western Europe | 3 | 0.1% | View All 11 Rows |
Sex and Age in Baldwin City
Sex and Age in Baldwin City
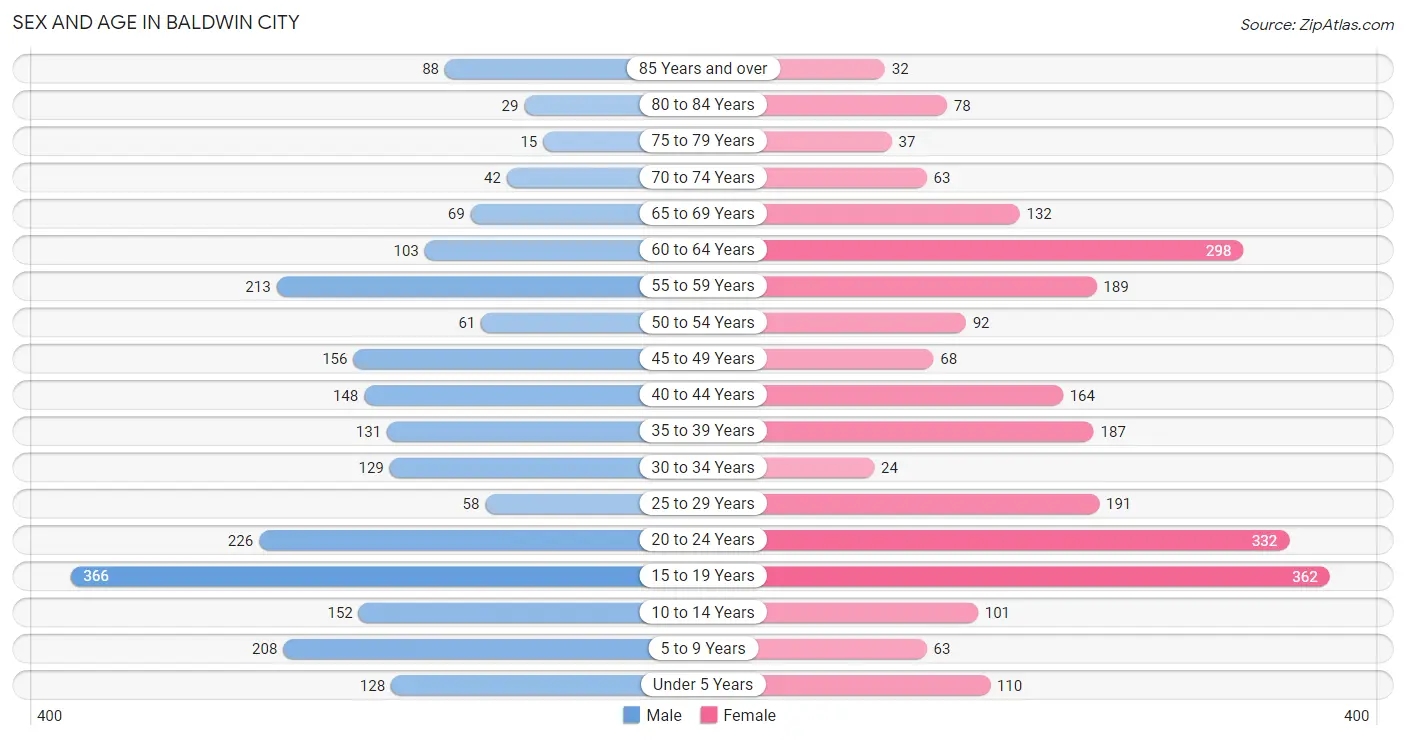
The most populous age groups in Baldwin City are 15 to 19 Years (366 | 15.8%) for men and 15 to 19 Years (362 | 14.3%) for women.
| Age Bracket | Male | Female |
| Under 5 Years | 128 (5.5%) | 110 (4.4%) |
| 5 to 9 Years | 208 (9.0%) | 63 (2.5%) |
| 10 to 14 Years | 152 (6.6%) | 101 (4.0%) |
| 15 to 19 Years | 366 (15.8%) | 362 (14.3%) |
| 20 to 24 Years | 226 (9.7%) | 332 (13.2%) |
| 25 to 29 Years | 58 (2.5%) | 191 (7.6%) |
| 30 to 34 Years | 129 (5.6%) | 24 (0.9%) |
| 35 to 39 Years | 131 (5.6%) | 187 (7.4%) |
| 40 to 44 Years | 148 (6.4%) | 164 (6.5%) |
| 45 to 49 Years | 156 (6.7%) | 68 (2.7%) |
| 50 to 54 Years | 61 (2.6%) | 92 (3.6%) |
| 55 to 59 Years | 213 (9.2%) | 189 (7.5%) |
| 60 to 64 Years | 103 (4.4%) | 298 (11.8%) |
| 65 to 69 Years | 69 (3.0%) | 132 (5.2%) |
| 70 to 74 Years | 42 (1.8%) | 63 (2.5%) |
| 75 to 79 Years | 15 (0.6%) | 37 (1.5%) |
| 80 to 84 Years | 29 (1.3%) | 78 (3.1%) |
| 85 Years and over | 88 (3.8%) | 32 (1.3%) |
| Total | 2,322 (100.0%) | 2,523 (100.0%) |
Families and Households in Baldwin City
Median Family Size in Baldwin City
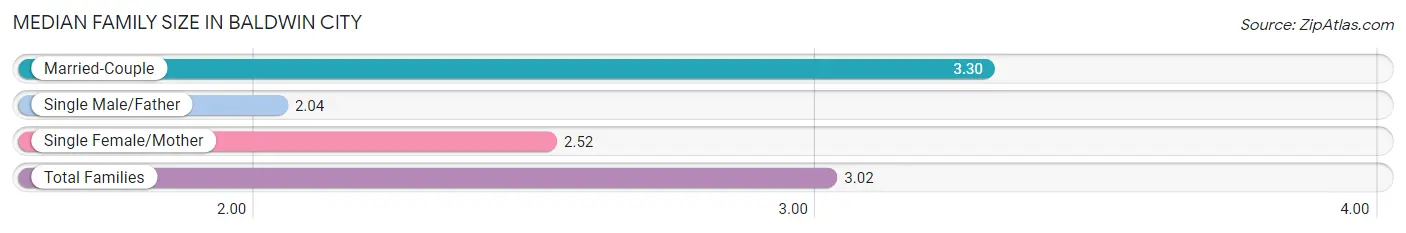
The median family size in Baldwin City is 3.02 persons per family, with married-couple families (830 | 72.7%) accounting for the largest median family size of 3.3 persons per family. On the other hand, single male/father families (153 | 13.4%) represent the smallest median family size with 2.04 persons per family.
| Family Type | # Families | Family Size |
| Married-Couple | 830 (72.7%) | 3.30 |
| Single Male/Father | 153 (13.4%) | 2.04 |
| Single Female/Mother | 158 (13.9%) | 2.52 |
| Total Families | 1,141 (100.0%) | 3.02 |
Median Household Size in Baldwin City
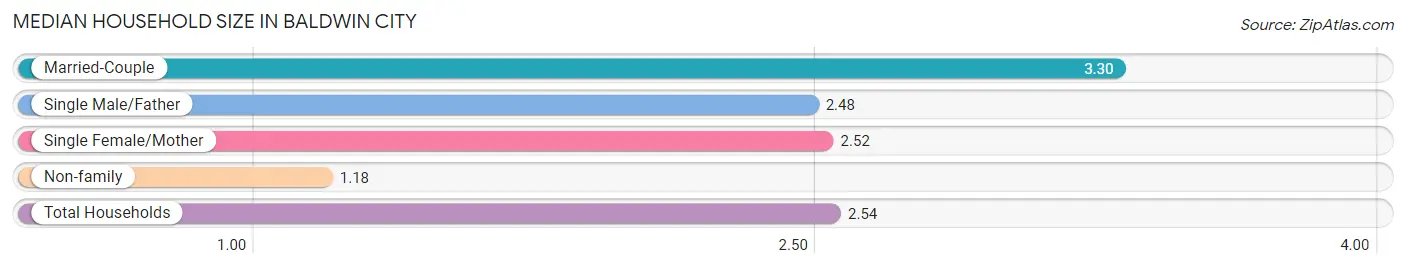
The median household size in Baldwin City is 2.54 persons per household, with married-couple households (830 | 52.0%) accounting for the largest median household size of 3.3 persons per household. non-family households (455 | 28.5%) represent the smallest median household size with 1.18 persons per household.
| Household Type | # Households | Household Size |
| Married-Couple | 830 (52.0%) | 3.30 |
| Single Male/Father | 153 (9.6%) | 2.48 |
| Single Female/Mother | 158 (9.9%) | 2.52 |
| Non-family | 455 (28.5%) | 1.18 |
| Total Households | 1,596 (100.0%) | 2.54 |
Household Size by Marriage Status in Baldwin City
Out of a total of 1,596 households in Baldwin City, 1,141 (71.5%) are family households, while 455 (28.5%) are nonfamily households. The most numerous type of family households are 3-person households, comprising 442, and the most common type of nonfamily households are 1-person households, comprising 422.
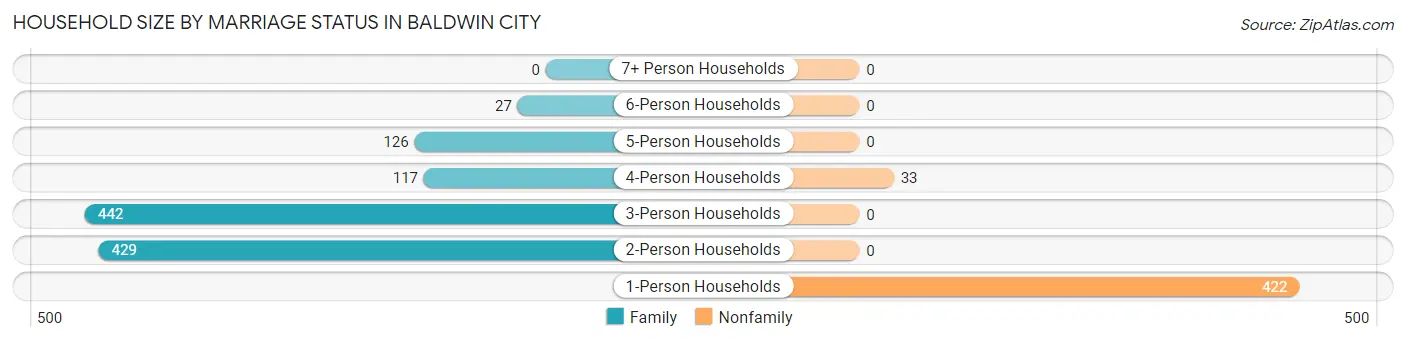
| Household Size | Family Households | Nonfamily Households |
| 1-Person Households | - | 422 (26.4%) |
| 2-Person Households | 429 (26.9%) | 0 (0.0%) |
| 3-Person Households | 442 (27.7%) | 0 (0.0%) |
| 4-Person Households | 117 (7.3%) | 33 (2.1%) |
| 5-Person Households | 126 (7.9%) | 0 (0.0%) |
| 6-Person Households | 27 (1.7%) | 0 (0.0%) |
| 7+ Person Households | 0 (0.0%) | 0 (0.0%) |
| Total | 1,141 (71.5%) | 455 (28.5%) |
Female Fertility in Baldwin City
Fertility by Age in Baldwin City
Average fertility rate in Baldwin City is 13.0 births per 1,000 women. Women in the age bracket of 15 to 19 years have the highest fertility rate with 50.0 births per 1,000 women. Women in the age bracket of 15 to 19 years acount for 100.0% of all women with births.
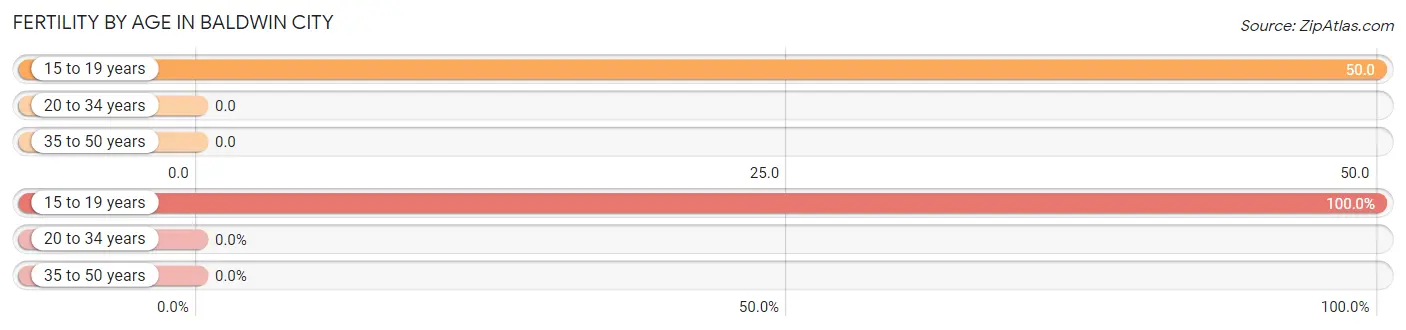
| Age Bracket | Women with Births | Births / 1,000 Women |
| 15 to 19 years | 18 (100.0%) | 50.0 |
| 20 to 34 years | 0 (0.0%) | 0.0 |
| 35 to 50 years | 0 (0.0%) | 0.0 |
| Total | 18 (100.0%) | 13.0 |
Fertility by Age by Marriage Status in Baldwin City
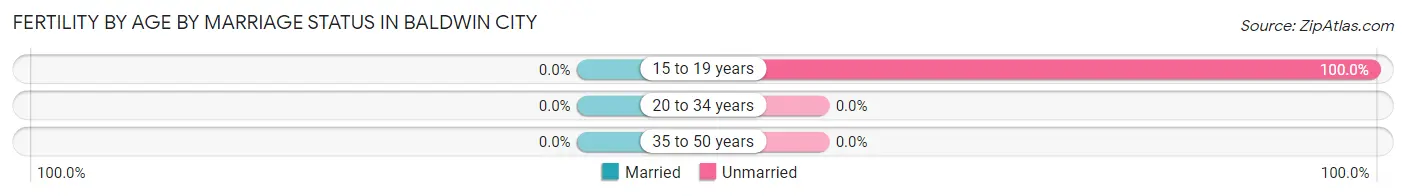
| Age Bracket | Married | Unmarried |
| 15 to 19 years | 0 (0.0%) | 18 (100.0%) |
| 20 to 34 years | 0 (0.0%) | 0 (0.0%) |
| 35 to 50 years | 0 (0.0%) | 0 (0.0%) |
| Total | 0 (0.0%) | 18 (100.0%) |
Fertility by Education in Baldwin City
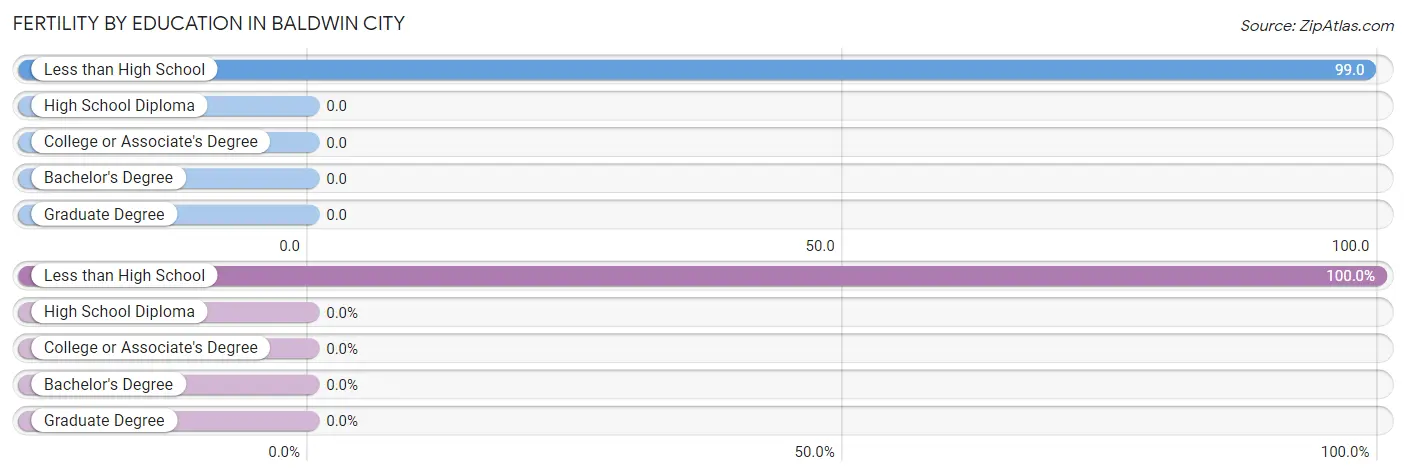
| Educational Attainment | Women with Births | Births / 1,000 Women |
| Less than High School | 18 (100.0%) | 99.0 |
| High School Diploma | 0 (0.0%) | 0.0 |
| College or Associate's Degree | 0 (0.0%) | 0.0 |
| Bachelor's Degree | 0 (0.0%) | 0.0 |
| Graduate Degree | 0 (0.0%) | 0.0 |
| Total | 18 (100.0%) | 13.0 |
Fertility by Education by Marriage Status in Baldwin City
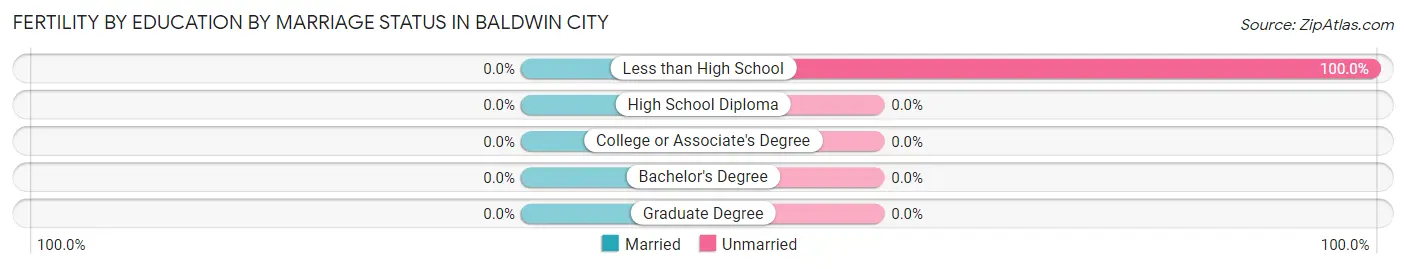
| Educational Attainment | Married | Unmarried |
| Less than High School | 0 (0.0%) | 18 (100.0%) |
| High School Diploma | 0 (0.0%) | 0 (0.0%) |
| College or Associate's Degree | 0 (0.0%) | 0 (0.0%) |
| Bachelor's Degree | 0 (0.0%) | 0 (0.0%) |
| Graduate Degree | 0 (0.0%) | 0 (0.0%) |
| Total | 0 (0.0%) | 18 (100.0%) |
Employment Characteristics in Baldwin City
Employment by Class of Employer in Baldwin City
Among the 2,209 employed individuals in Baldwin City, private company employees (1,343 | 60.8%), not-for-profit organizations (302 | 13.7%), and local government employees (233 | 10.5%) make up the most common classes of employment.
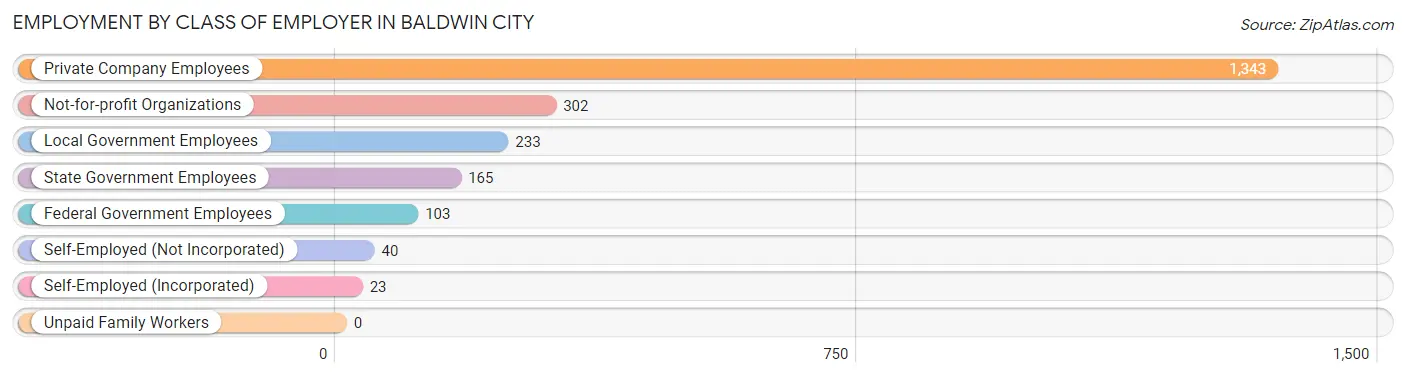
| Employer Class | # Employees | % Employees |
| Private Company Employees | 1,343 | 60.8% |
| Self-Employed (Incorporated) | 23 | 1.0% |
| Self-Employed (Not Incorporated) | 40 | 1.8% |
| Not-for-profit Organizations | 302 | 13.7% |
| Local Government Employees | 233 | 10.5% |
| State Government Employees | 165 | 7.5% |
| Federal Government Employees | 103 | 4.7% |
| Unpaid Family Workers | 0 | 0.0% |
| Total | 2,209 | 100.0% |
Employment Status by Age in Baldwin City
According to the labor force statistics for Baldwin City, out of the total population over 16 years of age (3,975), 58.8% or 2,337 individuals are in the labor force, with 4.9% or 115 of them unemployed. The age group with the highest labor force participation rate is 30 to 34 years, with 100.0% or 153 individuals in the labor force. Within the labor force, the 20 to 24 years age range has the highest percentage of unemployed individuals, with 15.9% or 69 of them being unemployed.
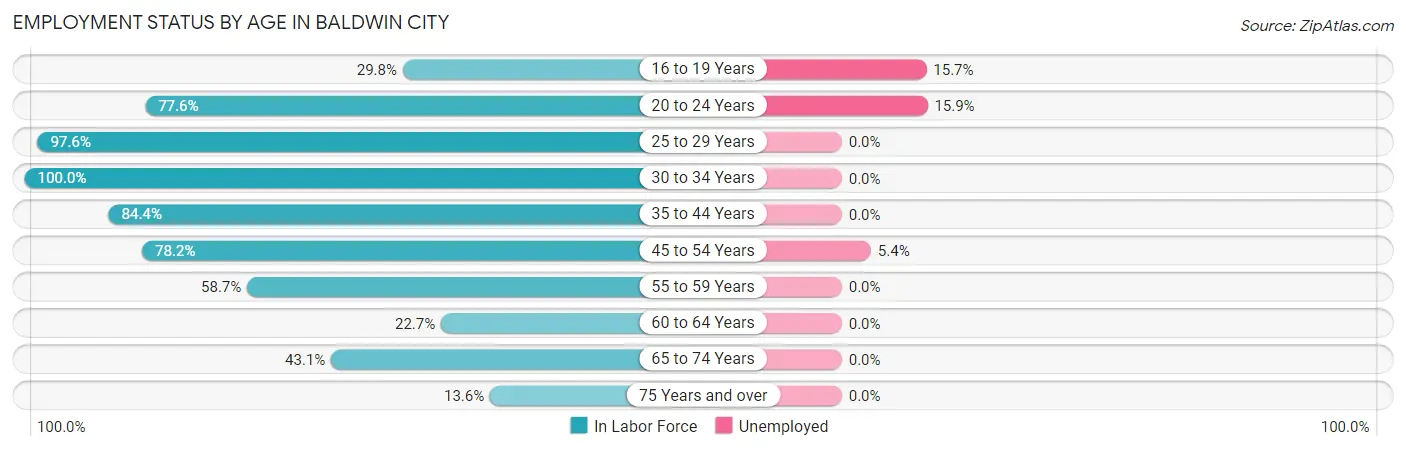
| Age Bracket | In Labor Force | Unemployed |
| 16 to 19 Years | 185 (29.8%) | 29 (15.7%) |
| 20 to 24 Years | 433 (77.6%) | 69 (15.9%) |
| 25 to 29 Years | 243 (97.6%) | 0 (0.0%) |
| 30 to 34 Years | 153 (100.0%) | 0 (0.0%) |
| 35 to 44 Years | 532 (84.4%) | 0 (0.0%) |
| 45 to 54 Years | 295 (78.2%) | 16 (5.4%) |
| 55 to 59 Years | 236 (58.7%) | 0 (0.0%) |
| 60 to 64 Years | 91 (22.7%) | 0 (0.0%) |
| 65 to 74 Years | 132 (43.1%) | 0 (0.0%) |
| 75 Years and over | 38 (13.6%) | 0 (0.0%) |
| Total | 2,337 (58.8%) | 115 (4.9%) |
Employment Status by Educational Attainment in Baldwin City
According to labor force statistics for Baldwin City, 70.1% of individuals (1,551) out of the total population between 25 and 64 years of age (2,212) are in the labor force, with 1.0% or 16 of them being unemployed. The group with the highest labor force participation rate are those with the educational attainment of college / associate degree, with 77.3% or 600 individuals in the labor force. Within the labor force, individuals with high school diploma education have the highest percentage of unemployment, with 6.3% or 15 of them being unemployed.

| Educational Attainment | In Labor Force | Unemployed |
| Less than High School | 0 (0.0%) | 0 (0.0%) |
| High School Diploma | 240 (57.1%) | 26 (6.3%) |
| College / Associate Degree | 600 (77.3%) | 0 (0.0%) |
| Bachelor's Degree or higher | 710 (70.2%) | 0 (0.0%) |
| Total | 1,551 (70.1%) | 22 (1.0%) |
Employment Occupations by Sex in Baldwin City
Management, Business, Science and Arts Occupations
The most common Management, Business, Science and Arts occupations in Baldwin City are Community & Social Service (316 | 14.5%), Computers, Engineering & Science (268 | 12.3%), Education Instruction & Library (199 | 9.1%), Health Diagnosing & Treating (164 | 7.5%), and Computers & Mathematics (142 | 6.5%).
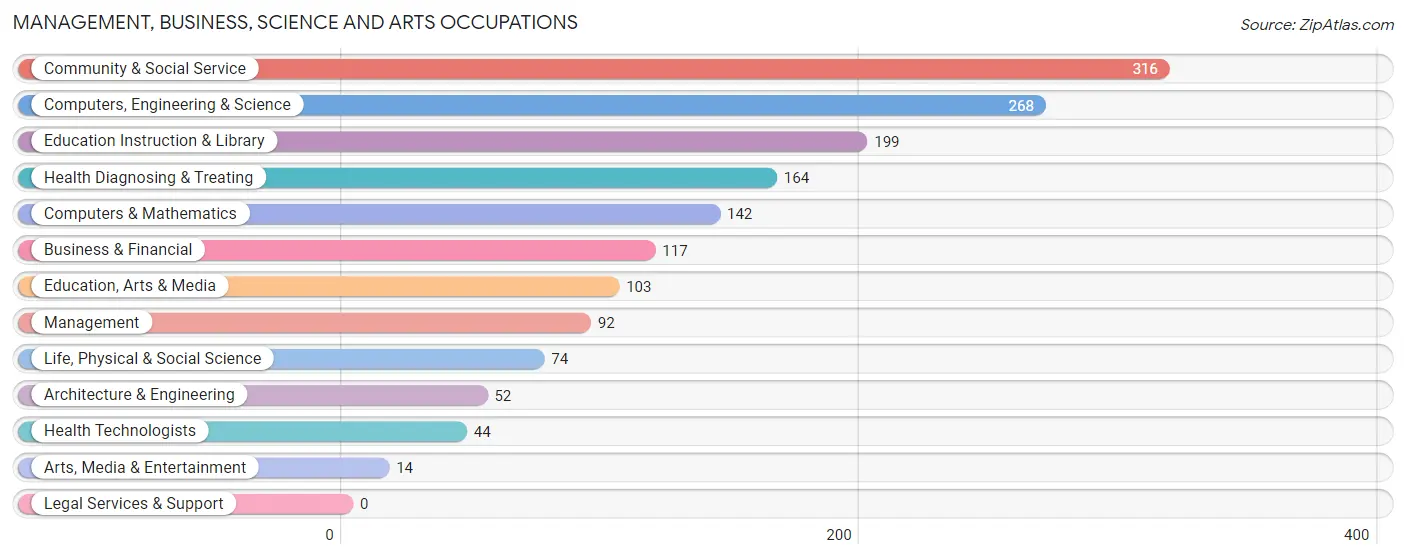
Management, Business, Science and Arts Occupations by Sex
Within the Management, Business, Science and Arts occupations in Baldwin City, the most male-oriented occupations are Arts, Media & Entertainment (100.0%), Computers & Mathematics (95.1%), and Computers, Engineering & Science (86.9%), while the most female-oriented occupations are Education Instruction & Library (86.4%), Health Diagnosing & Treating (81.1%), and Community & Social Service (69.6%).
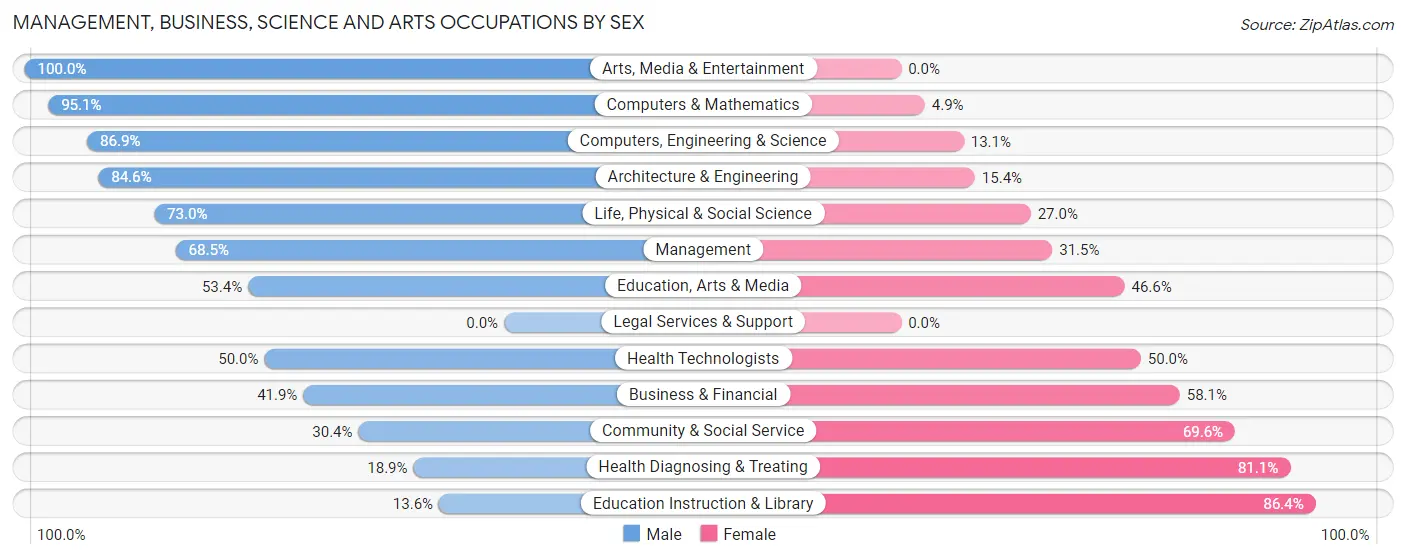
| Occupation | Male | Female |
| Management | 63 (68.5%) | 29 (31.5%) |
| Business & Financial | 49 (41.9%) | 68 (58.1%) |
| Computers, Engineering & Science | 233 (86.9%) | 35 (13.1%) |
| Computers & Mathematics | 135 (95.1%) | 7 (4.9%) |
| Architecture & Engineering | 44 (84.6%) | 8 (15.4%) |
| Life, Physical & Social Science | 54 (73.0%) | 20 (27.0%) |
| Community & Social Service | 96 (30.4%) | 220 (69.6%) |
| Education, Arts & Media | 55 (53.4%) | 48 (46.6%) |
| Legal Services & Support | 0 (0.0%) | 0 (0.0%) |
| Education Instruction & Library | 27 (13.6%) | 172 (86.4%) |
| Arts, Media & Entertainment | 14 (100.0%) | 0 (0.0%) |
| Health Diagnosing & Treating | 31 (18.9%) | 133 (81.1%) |
| Health Technologists | 22 (50.0%) | 22 (50.0%) |
| Total (Category) | 472 (49.3%) | 485 (50.7%) |
| Total (Overall) | 1,043 (47.9%) | 1,133 (52.1%) |
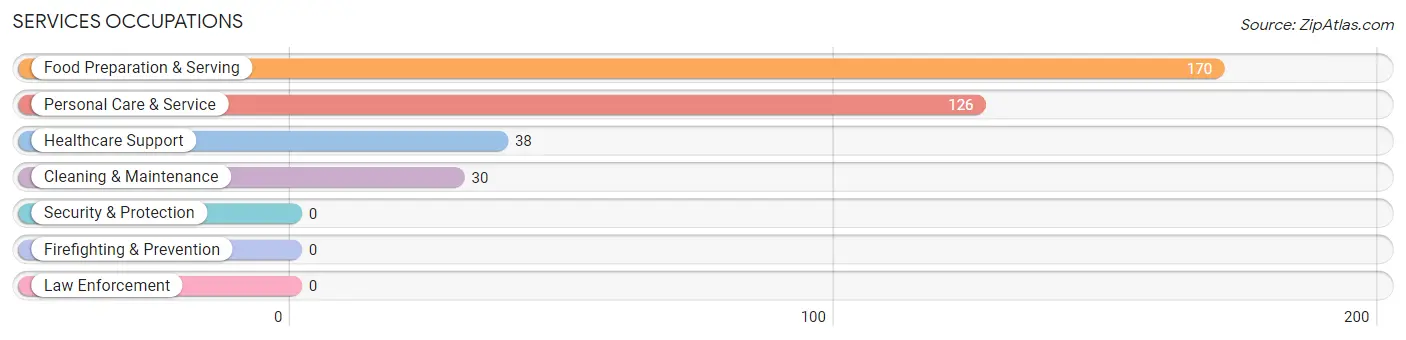
Services Occupations
The most common Services occupations in Baldwin City are Food Preparation & Serving (170 | 7.8%), Personal Care & Service (126 | 5.8%), Healthcare Support (38 | 1.8%), and Cleaning & Maintenance (30 | 1.4%).
Services Occupations by Sex
Within the Services occupations in Baldwin City, the most male-oriented occupations are Cleaning & Maintenance (70.0%), Food Preparation & Serving (45.9%), and Personal Care & Service (29.4%), while the most female-oriented occupations are Healthcare Support (100.0%), Personal Care & Service (70.6%), and Food Preparation & Serving (54.1%).
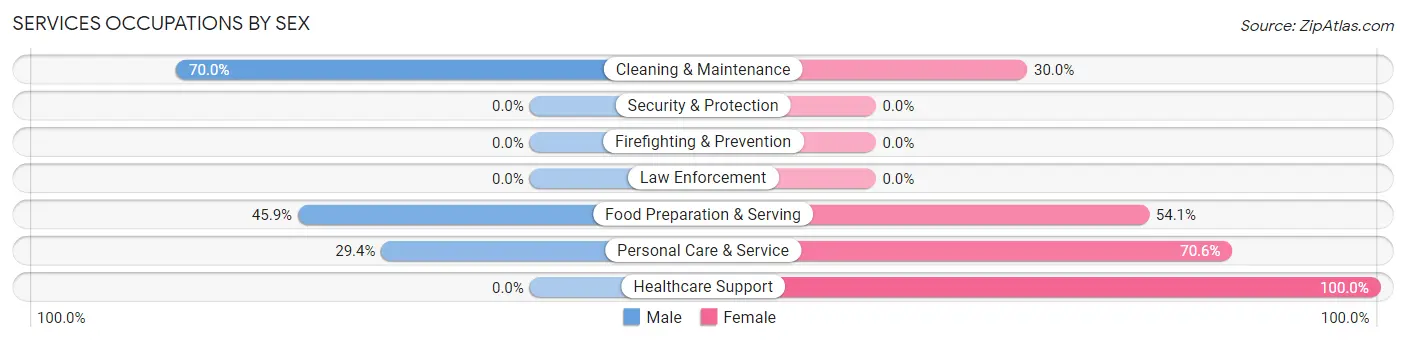
| Occupation | Male | Female |
| Healthcare Support | 0 (0.0%) | 38 (100.0%) |
| Security & Protection | 0 (0.0%) | 0 (0.0%) |
| Firefighting & Prevention | 0 (0.0%) | 0 (0.0%) |
| Law Enforcement | 0 (0.0%) | 0 (0.0%) |
| Food Preparation & Serving | 78 (45.9%) | 92 (54.1%) |
| Cleaning & Maintenance | 21 (70.0%) | 9 (30.0%) |
| Personal Care & Service | 37 (29.4%) | 89 (70.6%) |
| Total (Category) | 136 (37.4%) | 228 (62.6%) |
| Total (Overall) | 1,043 (47.9%) | 1,133 (52.1%) |
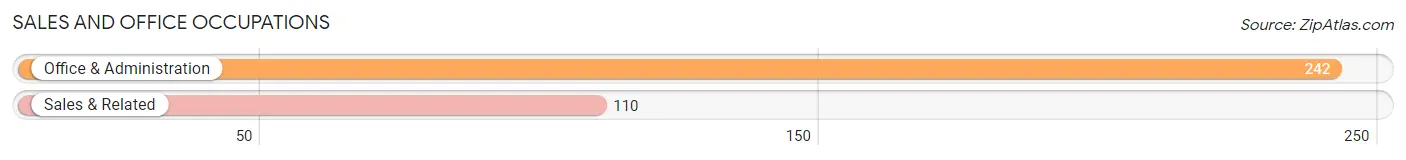
Sales and Office Occupations
The most common Sales and Office occupations in Baldwin City are Office & Administration (242 | 11.1%), and Sales & Related (110 | 5.1%).
Sales and Office Occupations by Sex
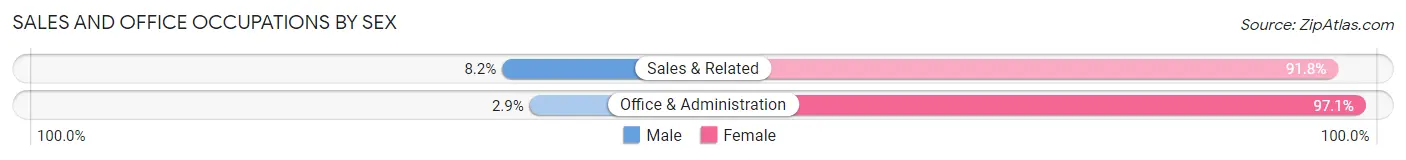
| Occupation | Male | Female |
| Sales & Related | 9 (8.2%) | 101 (91.8%) |
| Office & Administration | 7 (2.9%) | 235 (97.1%) |
| Total (Category) | 16 (4.5%) | 336 (95.5%) |
| Total (Overall) | 1,043 (47.9%) | 1,133 (52.1%) |
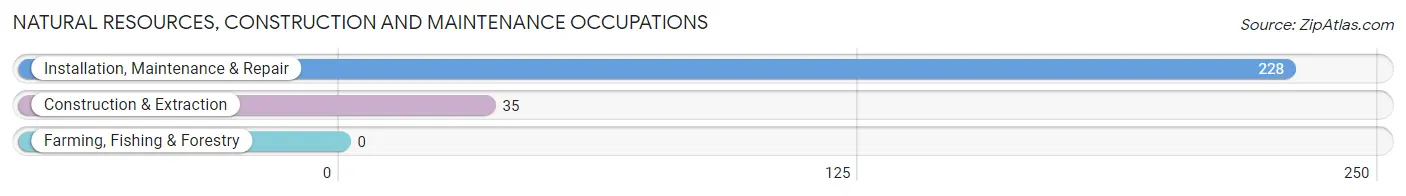
Natural Resources, Construction and Maintenance Occupations
The most common Natural Resources, Construction and Maintenance occupations in Baldwin City are Installation, Maintenance & Repair (228 | 10.5%), and Construction & Extraction (35 | 1.6%).
Natural Resources, Construction and Maintenance Occupations by Sex
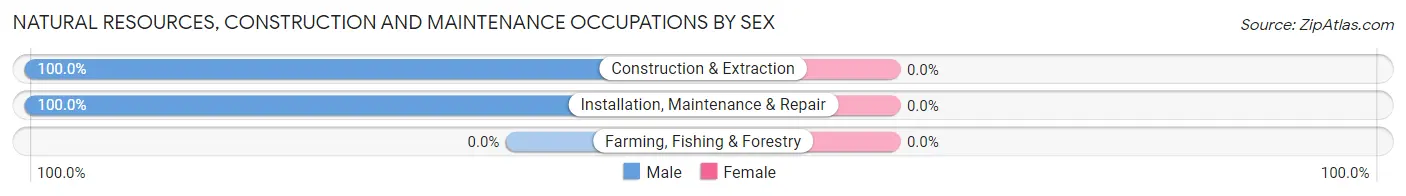
| Occupation | Male | Female |
| Farming, Fishing & Forestry | 0 (0.0%) | 0 (0.0%) |
| Construction & Extraction | 35 (100.0%) | 0 (0.0%) |
| Installation, Maintenance & Repair | 228 (100.0%) | 0 (0.0%) |
| Total (Category) | 263 (100.0%) | 0 (0.0%) |
| Total (Overall) | 1,043 (47.9%) | 1,133 (52.1%) |
Production, Transportation and Moving Occupations
The most common Production, Transportation and Moving occupations in Baldwin City are Material Moving (92 | 4.2%), Transportation (87 | 4.0%), and Production (61 | 2.8%).
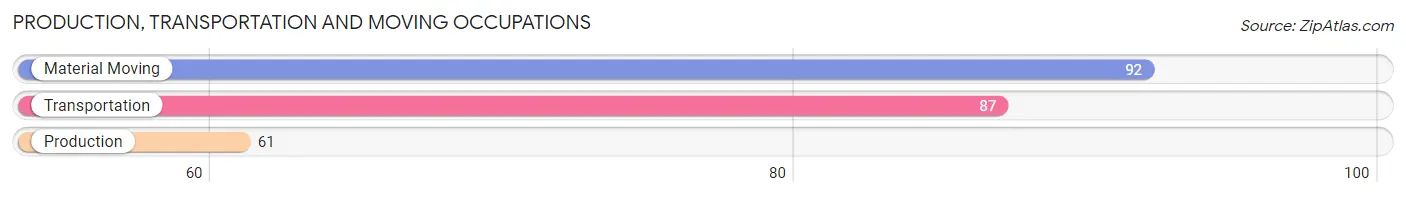
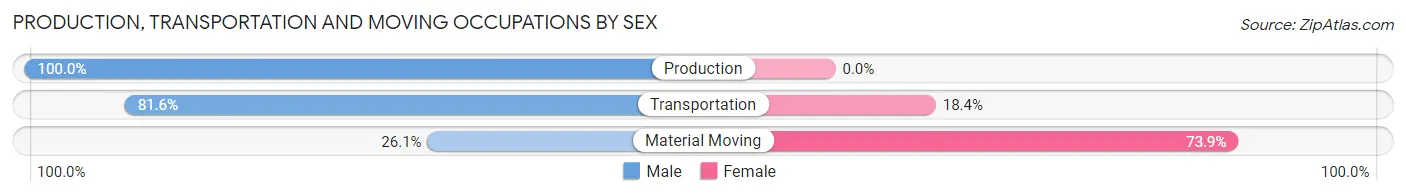
Production, Transportation and Moving Occupations by Sex
| Occupation | Male | Female |
| Production | 61 (100.0%) | 0 (0.0%) |
| Transportation | 71 (81.6%) | 16 (18.4%) |
| Material Moving | 24 (26.1%) | 68 (73.9%) |
| Total (Category) | 156 (65.0%) | 84 (35.0%) |
| Total (Overall) | 1,043 (47.9%) | 1,133 (52.1%) |
Employment Industries by Sex in Baldwin City
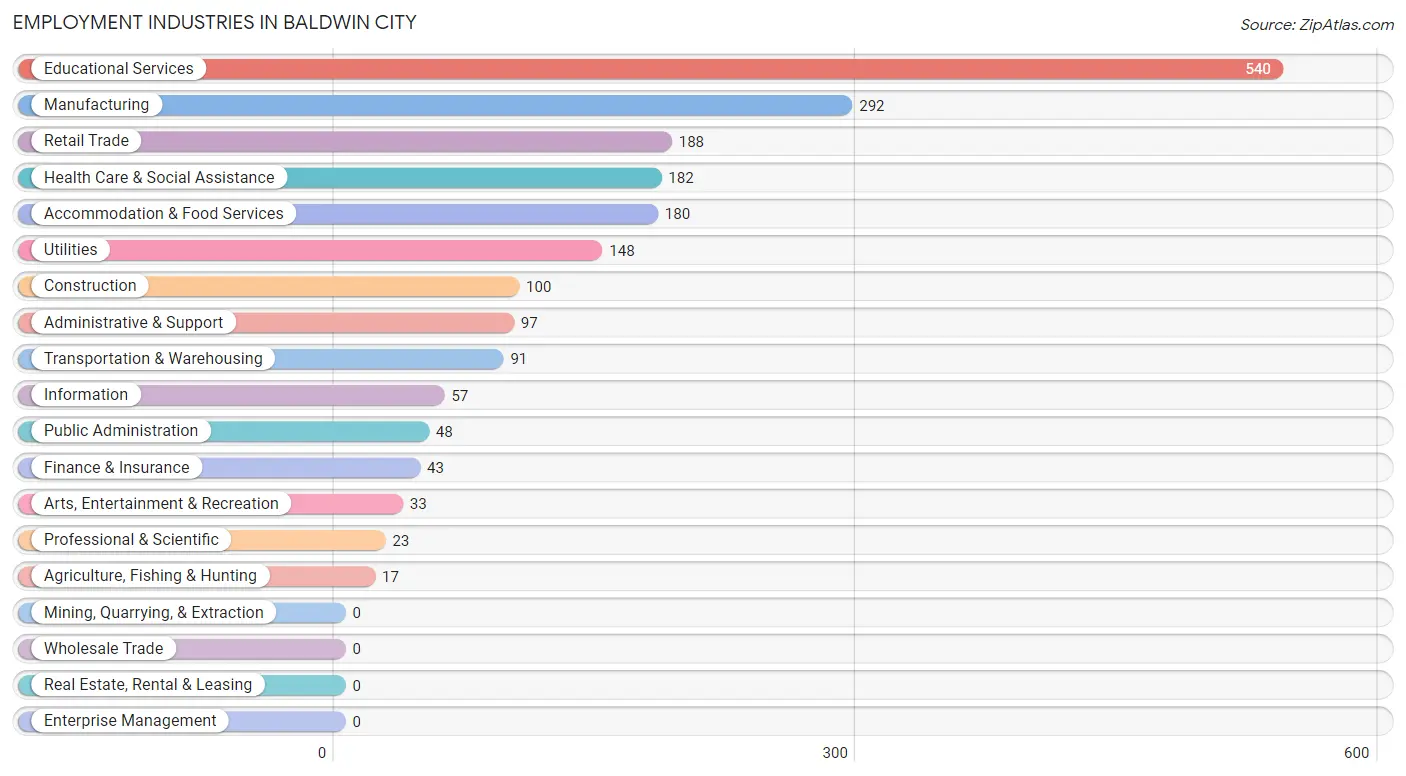
Employment Industries in Baldwin City
The major employment industries in Baldwin City include Educational Services (540 | 24.8%), Manufacturing (292 | 13.4%), Retail Trade (188 | 8.6%), Health Care & Social Assistance (182 | 8.4%), and Accommodation & Food Services (180 | 8.3%).
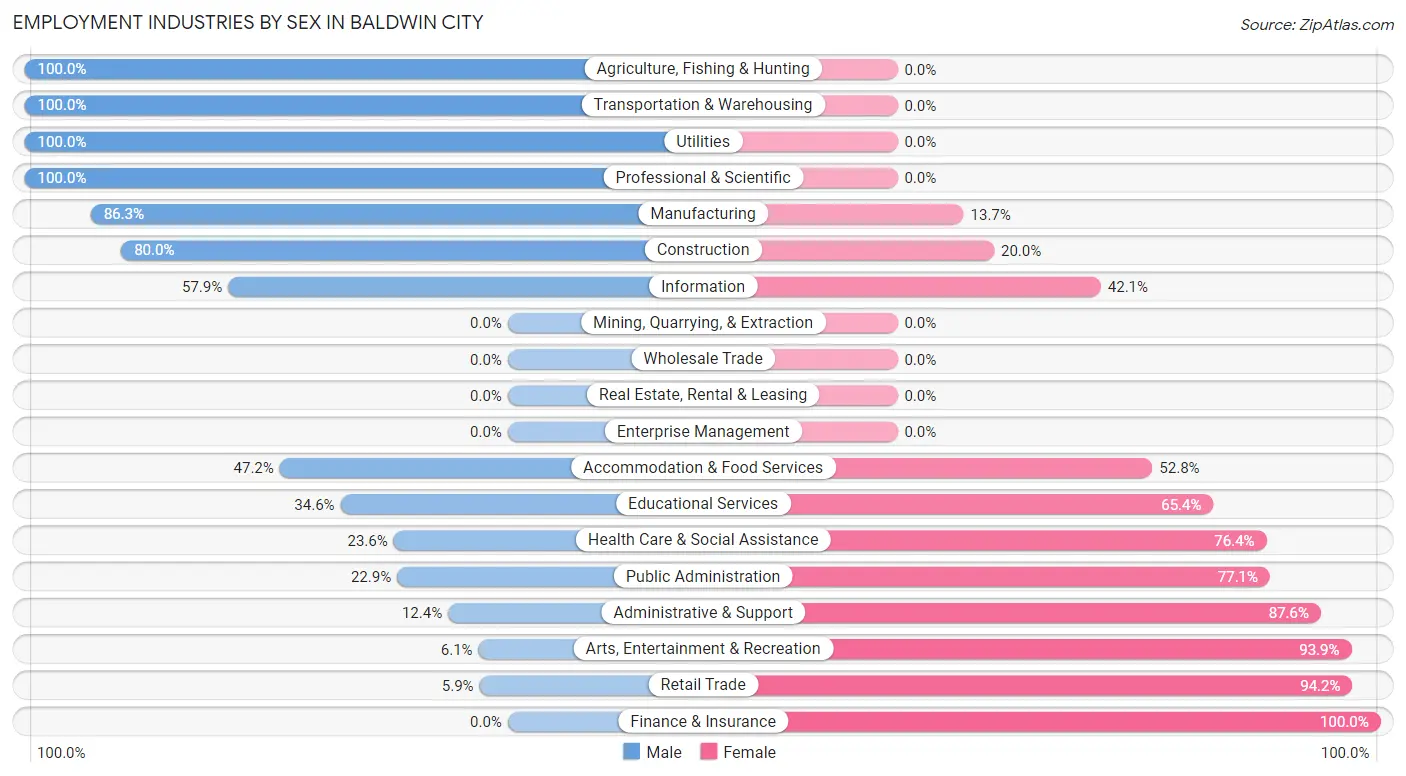
Employment Industries by Sex in Baldwin City
The Baldwin City industries that see more men than women are Agriculture, Fishing & Hunting (100.0%), Transportation & Warehousing (100.0%), and Utilities (100.0%), whereas the industries that tend to have a higher number of women are Finance & Insurance (100.0%), Retail Trade (94.2%), and Arts, Entertainment & Recreation (93.9%).
| Industry | Male | Female |
| Agriculture, Fishing & Hunting | 17 (100.0%) | 0 (0.0%) |
| Mining, Quarrying, & Extraction | 0 (0.0%) | 0 (0.0%) |
| Construction | 80 (80.0%) | 20 (20.0%) |
| Manufacturing | 252 (86.3%) | 40 (13.7%) |
| Wholesale Trade | 0 (0.0%) | 0 (0.0%) |
| Retail Trade | 11 (5.9%) | 177 (94.2%) |
| Transportation & Warehousing | 91 (100.0%) | 0 (0.0%) |
| Utilities | 148 (100.0%) | 0 (0.0%) |
| Information | 33 (57.9%) | 24 (42.1%) |
| Finance & Insurance | 0 (0.0%) | 43 (100.0%) |
| Real Estate, Rental & Leasing | 0 (0.0%) | 0 (0.0%) |
| Professional & Scientific | 23 (100.0%) | 0 (0.0%) |
| Enterprise Management | 0 (0.0%) | 0 (0.0%) |
| Administrative & Support | 12 (12.4%) | 85 (87.6%) |
| Educational Services | 187 (34.6%) | 353 (65.4%) |
| Health Care & Social Assistance | 43 (23.6%) | 139 (76.4%) |
| Arts, Entertainment & Recreation | 2 (6.1%) | 31 (93.9%) |
| Accommodation & Food Services | 85 (47.2%) | 95 (52.8%) |
| Public Administration | 11 (22.9%) | 37 (77.1%) |
| Total | 1,043 (47.9%) | 1,133 (52.1%) |
Education in Baldwin City
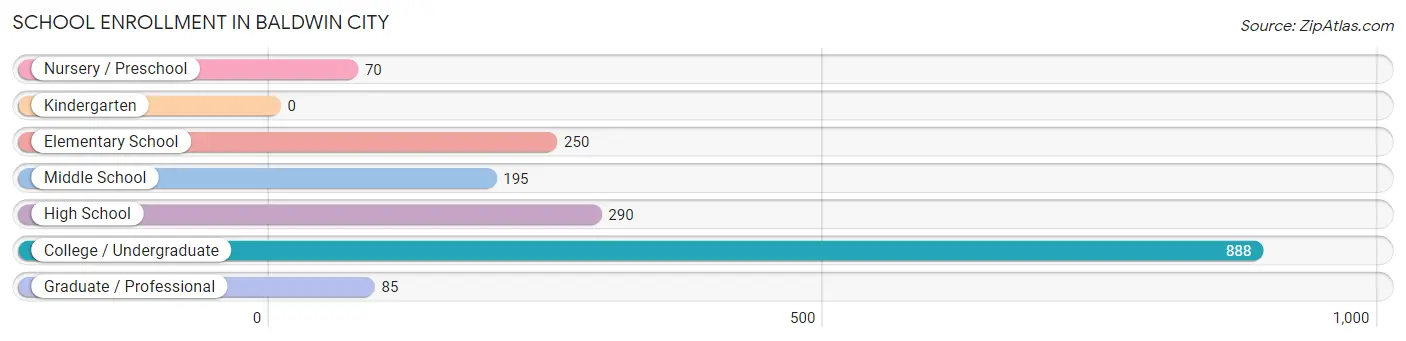
School Enrollment in Baldwin City
The most common levels of schooling among the 1,778 students in Baldwin City are college / undergraduate (888 | 49.9%), high school (290 | 16.3%), and elementary school (250 | 14.1%).
| School Level | # Students | % Students |
| Nursery / Preschool | 70 | 3.9% |
| Kindergarten | 0 | 0.0% |
| Elementary School | 250 | 14.1% |
| Middle School | 195 | 11.0% |
| High School | 290 | 16.3% |
| College / Undergraduate | 888 | 49.9% |
| Graduate / Professional | 85 | 4.8% |
| Total | 1,778 | 100.0% |
School Enrollment by Age by Funding Source in Baldwin City
Out of a total of 1,778 students who are enrolled in schools in Baldwin City, 348 (19.6%) attend a private institution, while the remaining 1,430 (80.4%) are enrolled in public schools. The age group of 20 to 24 year olds has the highest likelihood of being enrolled in private schools, with 186 (49.9% in the age bracket) enrolled. Conversely, the age group of 3 to 4 year olds has the lowest likelihood of being enrolled in a private school, with 49 (100.0% in the age bracket) attending a public institution.
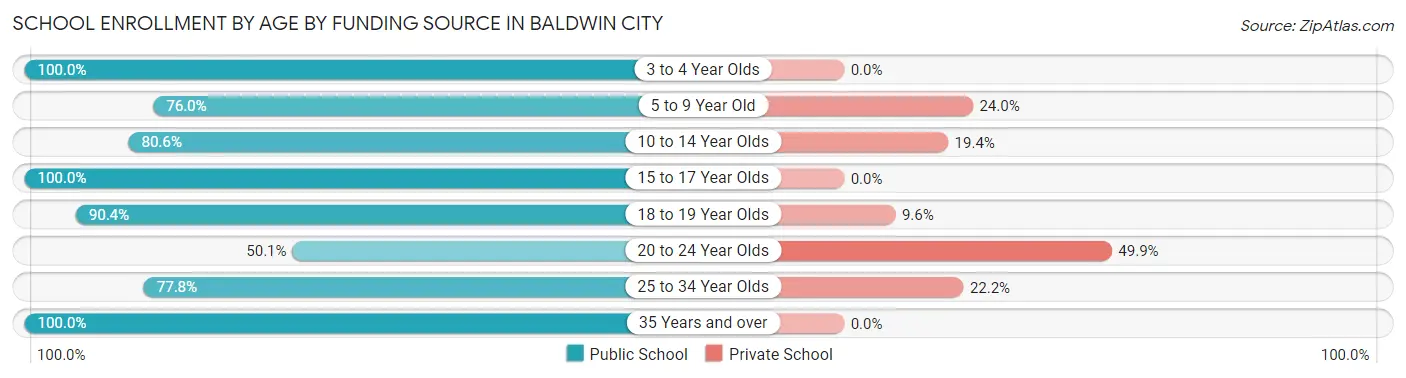
| Age Bracket | Public School | Private School |
| 3 to 4 Year Olds | 49 (100.0%) | 0 (0.0%) |
| 5 to 9 Year Old | 206 (76.0%) | 65 (24.0%) |
| 10 to 14 Year Olds | 204 (80.6%) | 49 (19.4%) |
| 15 to 17 Year Olds | 203 (100.0%) | 0 (0.0%) |
| 18 to 19 Year Olds | 407 (90.4%) | 43 (9.6%) |
| 20 to 24 Year Olds | 187 (50.1%) | 186 (49.9%) |
| 25 to 34 Year Olds | 21 (77.8%) | 6 (22.2%) |
| 35 Years and over | 152 (100.0%) | 0 (0.0%) |
| Total | 1,430 (80.4%) | 348 (19.6%) |
Educational Attainment by Field of Study in Baldwin City
Arts & humanities (248 | 20.0%), education (240 | 19.4%), business (166 | 13.4%), science & technology (164 | 13.2%), and bio, nature & agricultural (154 | 12.4%) are the most common fields of study among 1,240 individuals in Baldwin City who have obtained a bachelor's degree or higher.
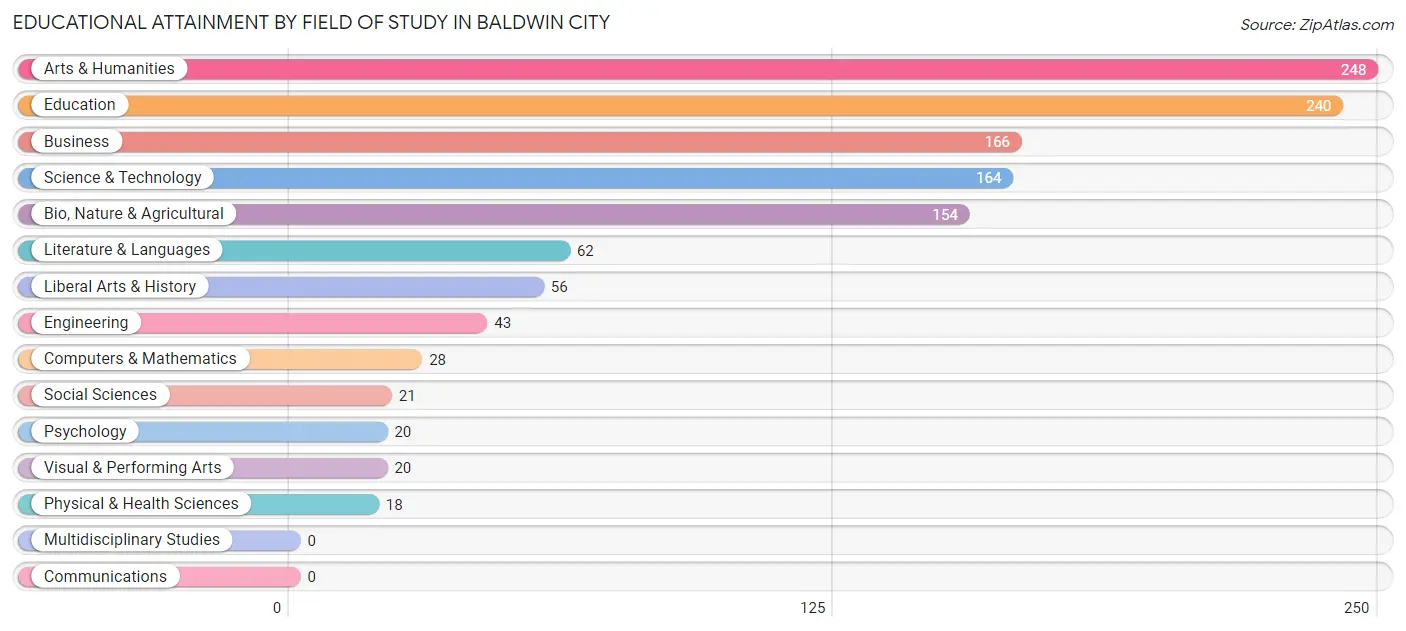
| Field of Study | # Graduates | % Graduates |
| Computers & Mathematics | 28 | 2.3% |
| Bio, Nature & Agricultural | 154 | 12.4% |
| Physical & Health Sciences | 18 | 1.5% |
| Psychology | 20 | 1.6% |
| Social Sciences | 21 | 1.7% |
| Engineering | 43 | 3.5% |
| Multidisciplinary Studies | 0 | 0.0% |
| Science & Technology | 164 | 13.2% |
| Business | 166 | 13.4% |
| Education | 240 | 19.4% |
| Literature & Languages | 62 | 5.0% |
| Liberal Arts & History | 56 | 4.5% |
| Visual & Performing Arts | 20 | 1.6% |
| Communications | 0 | 0.0% |
| Arts & Humanities | 248 | 20.0% |
| Total | 1,240 | 100.0% |
Transportation & Commute in Baldwin City
Vehicle Availability by Sex in Baldwin City
The most prevalent vehicle ownership categories in Baldwin City are males with 2 vehicles (561, accounting for 60.1%) and females with 2 vehicles (574, making up 55.8%).
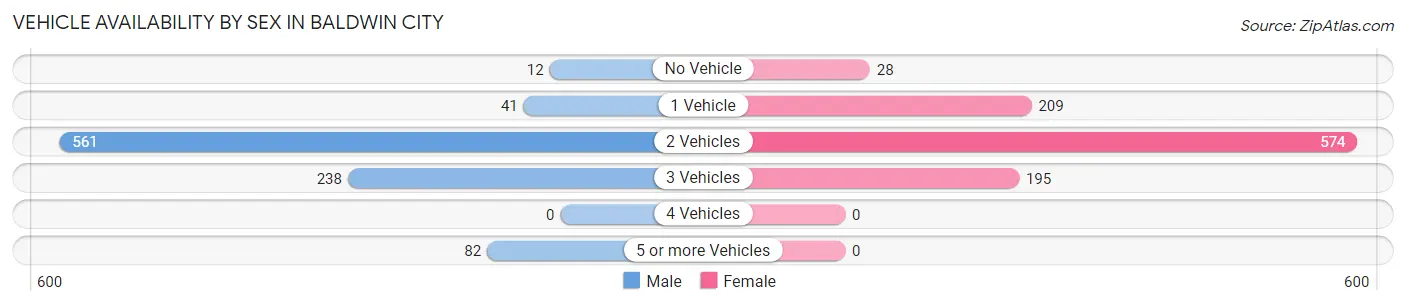
| Vehicles Available | Male | Female |
| No Vehicle | 12 (1.3%) | 28 (2.8%) |
| 1 Vehicle | 41 (4.4%) | 209 (20.8%) |
| 2 Vehicles | 561 (60.1%) | 574 (57.1%) |
| 3 Vehicles | 238 (25.5%) | 195 (19.4%) |
| 4 Vehicles | 0 (0.0%) | 0 (0.0%) |
| 5 or more Vehicles | 82 (8.8%) | 0 (0.0%) |
| Total | 934 (100.0%) | 1,006 (100.0%) |
Commute Time in Baldwin City
The most frequently occuring commute durations in Baldwin City are 20 to 24 minutes (343 commuters, 16.7%), less than 5 minutes (336 commuters, 16.4%), and 10 to 14 minutes (257 commuters, 12.5%).
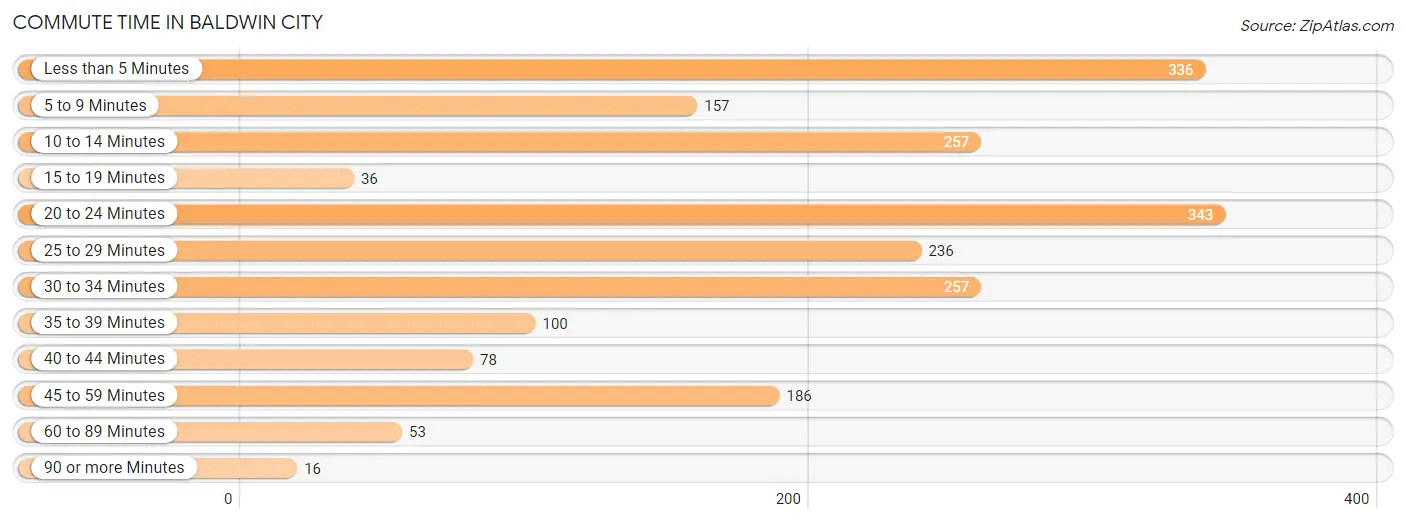
| Commute Time | # Commuters | % Commuters |
| Less than 5 Minutes | 336 | 16.4% |
| 5 to 9 Minutes | 157 | 7.6% |
| 10 to 14 Minutes | 257 | 12.5% |
| 15 to 19 Minutes | 36 | 1.8% |
| 20 to 24 Minutes | 343 | 16.7% |
| 25 to 29 Minutes | 236 | 11.5% |
| 30 to 34 Minutes | 257 | 12.5% |
| 35 to 39 Minutes | 100 | 4.9% |
| 40 to 44 Minutes | 78 | 3.8% |
| 45 to 59 Minutes | 186 | 9.0% |
| 60 to 89 Minutes | 53 | 2.6% |
| 90 or more Minutes | 16 | 0.8% |
Commute Time by Sex in Baldwin City
The most common commute times in Baldwin City are 20 to 24 minutes (266 commuters, 26.3%) for males and less than 5 minutes (322 commuters, 30.8%) for females.
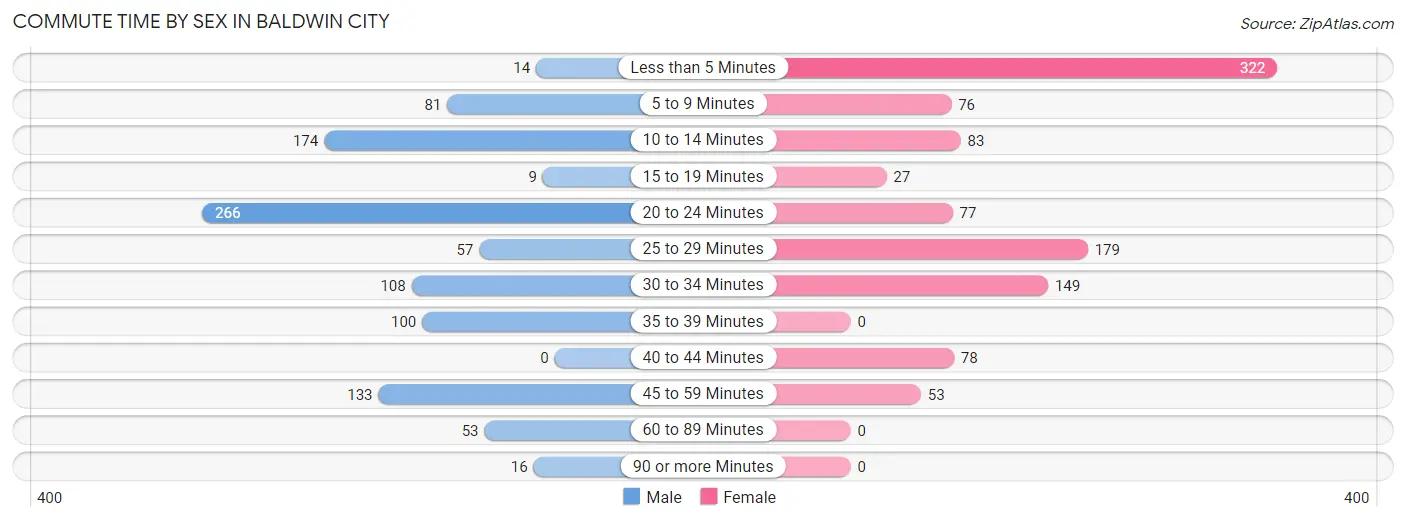
| Commute Time | Male | Female |
| Less than 5 Minutes | 14 (1.4%) | 322 (30.8%) |
| 5 to 9 Minutes | 81 (8.0%) | 76 (7.3%) |
| 10 to 14 Minutes | 174 (17.2%) | 83 (8.0%) |
| 15 to 19 Minutes | 9 (0.9%) | 27 (2.6%) |
| 20 to 24 Minutes | 266 (26.3%) | 77 (7.4%) |
| 25 to 29 Minutes | 57 (5.6%) | 179 (17.2%) |
| 30 to 34 Minutes | 108 (10.7%) | 149 (14.3%) |
| 35 to 39 Minutes | 100 (9.9%) | 0 (0.0%) |
| 40 to 44 Minutes | 0 (0.0%) | 78 (7.5%) |
| 45 to 59 Minutes | 133 (13.2%) | 53 (5.1%) |
| 60 to 89 Minutes | 53 (5.2%) | 0 (0.0%) |
| 90 or more Minutes | 16 (1.6%) | 0 (0.0%) |
Time of Departure to Work by Sex in Baldwin City
The most frequent times of departure to work in Baldwin City are 6:00 AM to 6:29 AM (189, 18.7%) for males and 8:00 AM to 8:29 AM (314, 30.1%) for females.
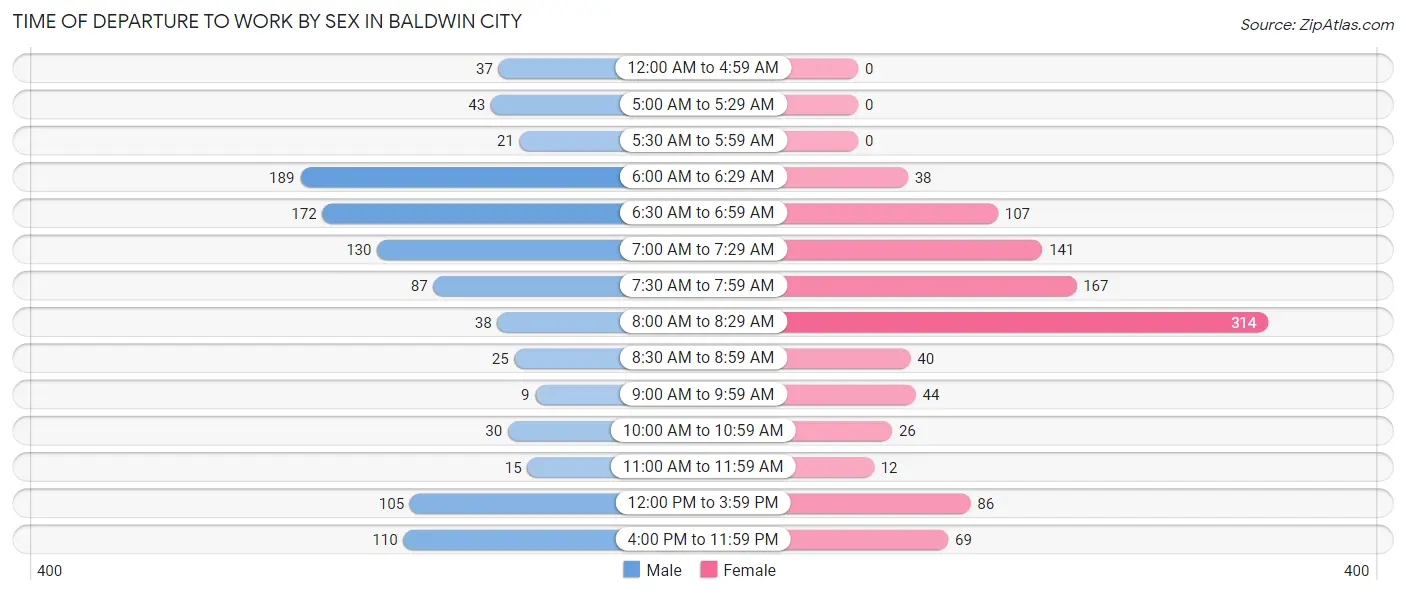
| Time of Departure | Male | Female |
| 12:00 AM to 4:59 AM | 37 (3.7%) | 0 (0.0%) |
| 5:00 AM to 5:29 AM | 43 (4.3%) | 0 (0.0%) |
| 5:30 AM to 5:59 AM | 21 (2.1%) | 0 (0.0%) |
| 6:00 AM to 6:29 AM | 189 (18.7%) | 38 (3.6%) |
| 6:30 AM to 6:59 AM | 172 (17.0%) | 107 (10.2%) |
| 7:00 AM to 7:29 AM | 130 (12.9%) | 141 (13.5%) |
| 7:30 AM to 7:59 AM | 87 (8.6%) | 167 (16.0%) |
| 8:00 AM to 8:29 AM | 38 (3.8%) | 314 (30.1%) |
| 8:30 AM to 8:59 AM | 25 (2.5%) | 40 (3.8%) |
| 9:00 AM to 9:59 AM | 9 (0.9%) | 44 (4.2%) |
| 10:00 AM to 10:59 AM | 30 (3.0%) | 26 (2.5%) |
| 11:00 AM to 11:59 AM | 15 (1.5%) | 12 (1.1%) |
| 12:00 PM to 3:59 PM | 105 (10.4%) | 86 (8.2%) |
| 4:00 PM to 11:59 PM | 110 (10.9%) | 69 (6.6%) |
| Total | 1,011 (100.0%) | 1,044 (100.0%) |
Housing Occupancy in Baldwin City
Occupancy by Ownership in Baldwin City
Of the total 1,596 dwellings in Baldwin City, owner-occupied units account for 1,102 (69.1%), while renter-occupied units make up 494 (30.9%).
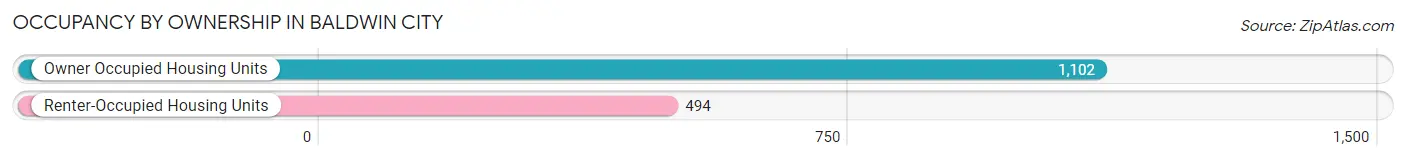
| Occupancy | # Housing Units | % Housing Units |
| Owner Occupied Housing Units | 1,102 | 69.1% |
| Renter-Occupied Housing Units | 494 | 30.9% |
| Total Occupied Housing Units | 1,596 | 100.0% |
Occupancy by Household Size in Baldwin City
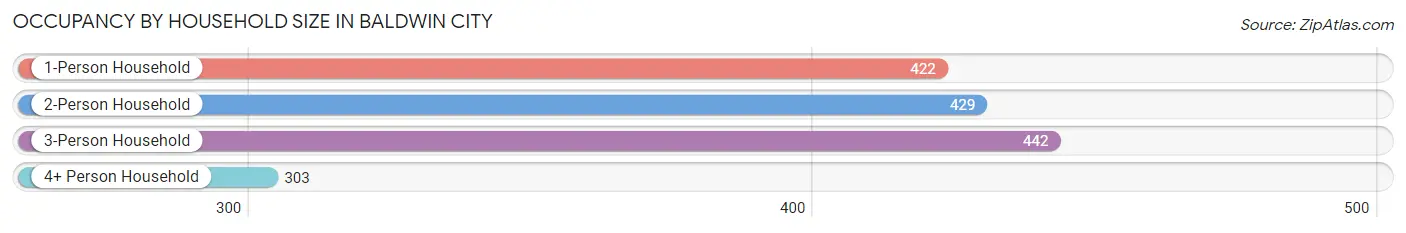
| Household Size | # Housing Units | % Housing Units |
| 1-Person Household | 422 | 26.4% |
| 2-Person Household | 429 | 26.9% |
| 3-Person Household | 442 | 27.7% |
| 4+ Person Household | 303 | 19.0% |
| Total Housing Units | 1,596 | 100.0% |
Occupancy by Ownership by Household Size in Baldwin City
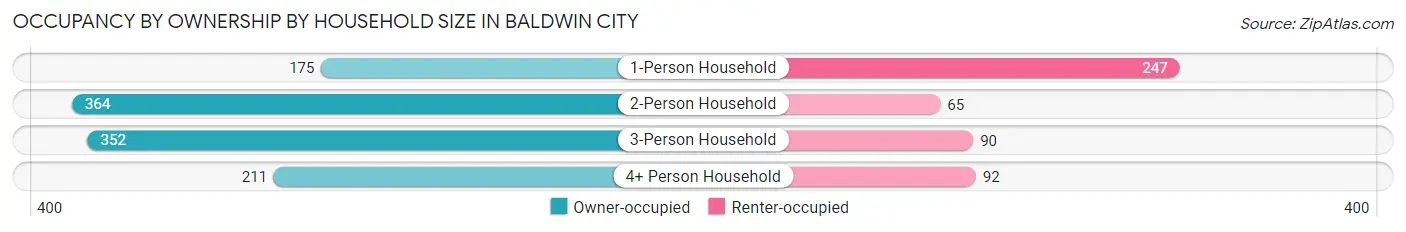
| Household Size | Owner-occupied | Renter-occupied |
| 1-Person Household | 175 (41.5%) | 247 (58.5%) |
| 2-Person Household | 364 (84.9%) | 65 (15.1%) |
| 3-Person Household | 352 (79.6%) | 90 (20.4%) |
| 4+ Person Household | 211 (69.6%) | 92 (30.4%) |
| Total Housing Units | 1,102 (69.1%) | 494 (30.9%) |
Occupancy by Educational Attainment in Baldwin City
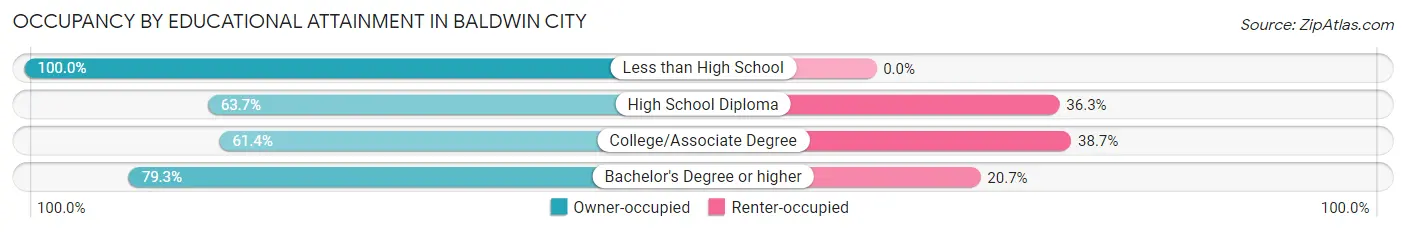
| Household Size | Owner-occupied | Renter-occupied |
| Less than High School | 20 (100.0%) | 0 (0.0%) |
| High School Diploma | 198 (63.7%) | 113 (36.3%) |
| College/Associate Degree | 408 (61.4%) | 257 (38.7%) |
| Bachelor's Degree or higher | 476 (79.3%) | 124 (20.7%) |
Occupancy by Age of Householder in Baldwin City
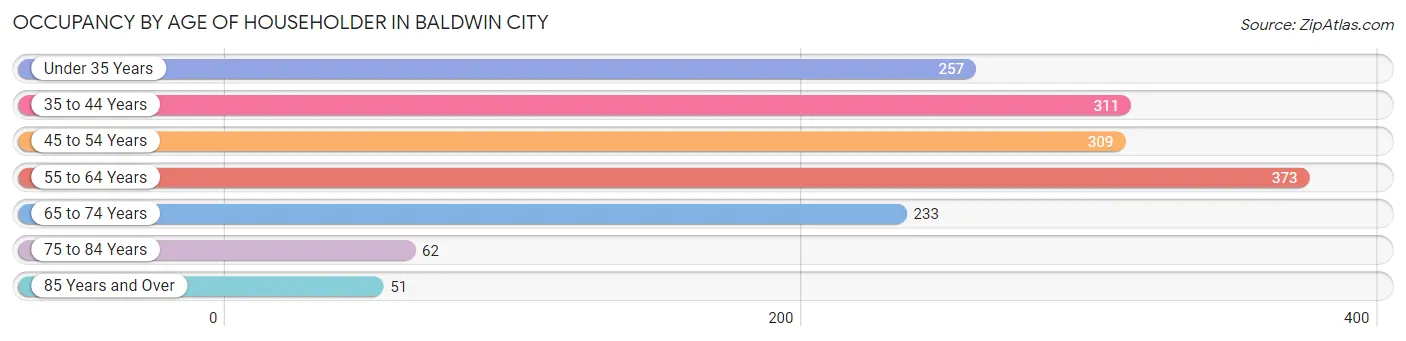
| Age Bracket | # Households | % Households |
| Under 35 Years | 257 | 16.1% |
| 35 to 44 Years | 311 | 19.5% |
| 45 to 54 Years | 309 | 19.4% |
| 55 to 64 Years | 373 | 23.4% |
| 65 to 74 Years | 233 | 14.6% |
| 75 to 84 Years | 62 | 3.9% |
| 85 Years and Over | 51 | 3.2% |
| Total | 1,596 | 100.0% |
Housing Finances in Baldwin City
Median Income by Occupancy in Baldwin City
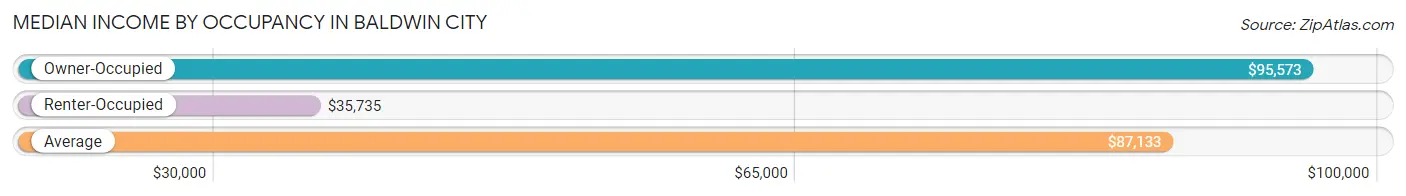
| Occupancy Type | # Households | Median Income |
| Owner-Occupied | 1,102 (69.1%) | $95,573 |
| Renter-Occupied | 494 (30.9%) | $35,735 |
| Average | 1,596 (100.0%) | $87,133 |
Occupancy by Householder Income Bracket in Baldwin City
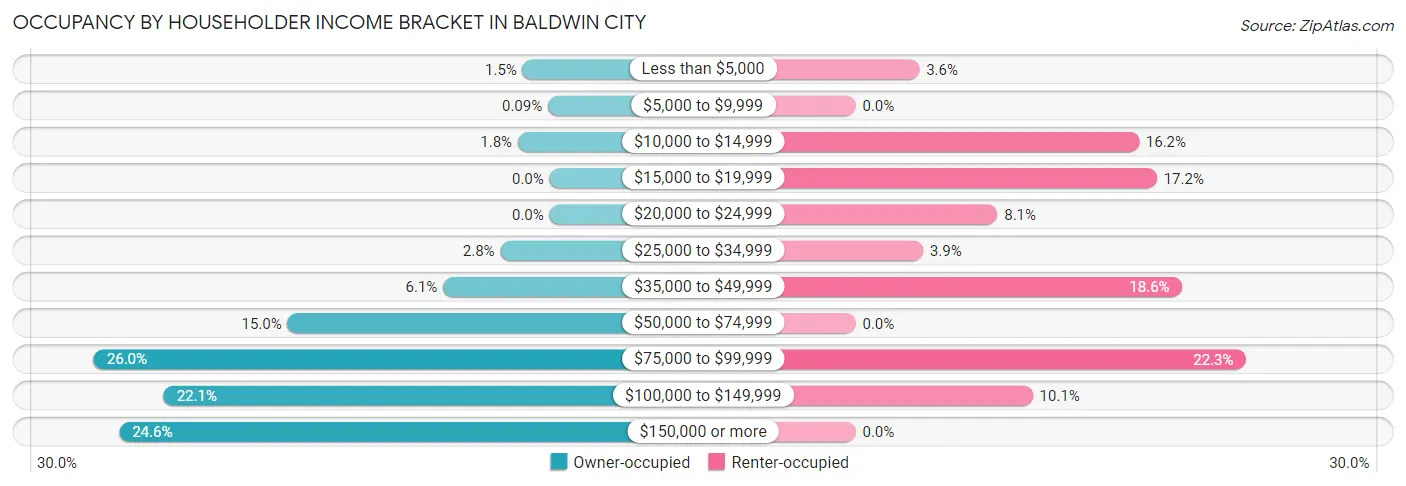
| Income Bracket | Owner-occupied | Renter-occupied |
| Less than $5,000 | 17 (1.5%) | 18 (3.6%) |
| $5,000 to $9,999 | 1 (0.1%) | 0 (0.0%) |
| $10,000 to $14,999 | 20 (1.8%) | 80 (16.2%) |
| $15,000 to $19,999 | 0 (0.0%) | 85 (17.2%) |
| $20,000 to $24,999 | 0 (0.0%) | 40 (8.1%) |
| $25,000 to $34,999 | 31 (2.8%) | 19 (3.8%) |
| $35,000 to $49,999 | 67 (6.1%) | 92 (18.6%) |
| $50,000 to $74,999 | 165 (15.0%) | 0 (0.0%) |
| $75,000 to $99,999 | 287 (26.0%) | 110 (22.3%) |
| $100,000 to $149,999 | 243 (22.1%) | 50 (10.1%) |
| $150,000 or more | 271 (24.6%) | 0 (0.0%) |
| Total | 1,102 (100.0%) | 494 (100.0%) |
Monthly Housing Cost Tiers in Baldwin City
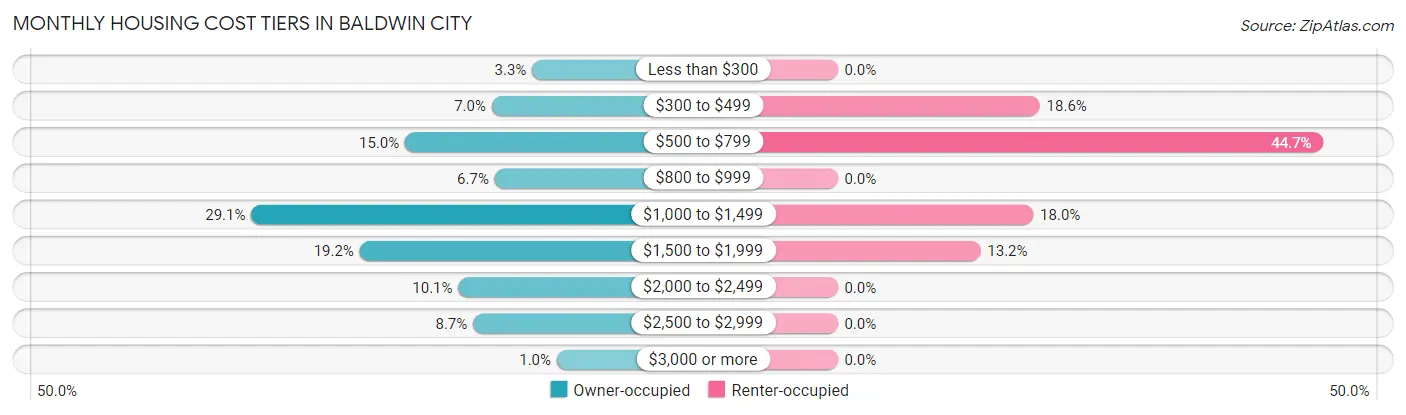
| Monthly Cost | Owner-occupied | Renter-occupied |
| Less than $300 | 36 (3.3%) | 0 (0.0%) |
| $300 to $499 | 77 (7.0%) | 92 (18.6%) |
| $500 to $799 | 165 (15.0%) | 221 (44.7%) |
| $800 to $999 | 74 (6.7%) | 0 (0.0%) |
| $1,000 to $1,499 | 321 (29.1%) | 89 (18.0%) |
| $1,500 to $1,999 | 211 (19.2%) | 65 (13.2%) |
| $2,000 to $2,499 | 111 (10.1%) | 0 (0.0%) |
| $2,500 to $2,999 | 96 (8.7%) | 0 (0.0%) |
| $3,000 or more | 11 (1.0%) | 0 (0.0%) |
| Total | 1,102 (100.0%) | 494 (100.0%) |
Physical Housing Characteristics in Baldwin City
Housing Structures in Baldwin City
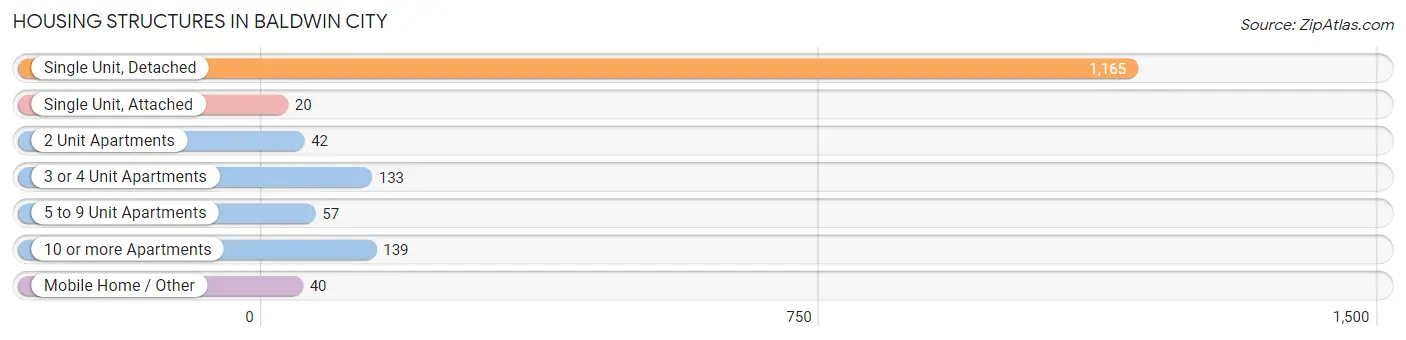
| Structure Type | # Housing Units | % Housing Units |
| Single Unit, Detached | 1,165 | 73.0% |
| Single Unit, Attached | 20 | 1.3% |
| 2 Unit Apartments | 42 | 2.6% |
| 3 or 4 Unit Apartments | 133 | 8.3% |
| 5 to 9 Unit Apartments | 57 | 3.6% |
| 10 or more Apartments | 139 | 8.7% |
| Mobile Home / Other | 40 | 2.5% |
| Total | 1,596 | 100.0% |
Housing Structures by Occupancy in Baldwin City
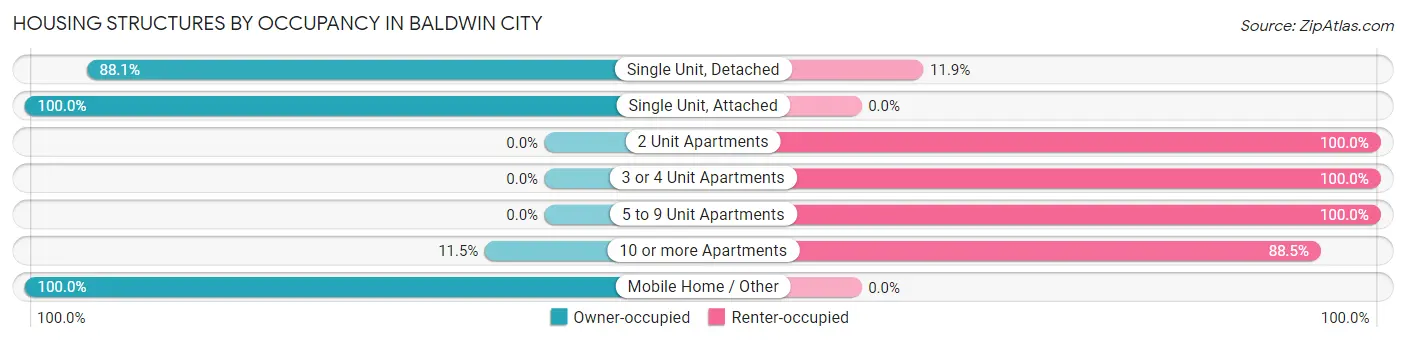
| Structure Type | Owner-occupied | Renter-occupied |
| Single Unit, Detached | 1,026 (88.1%) | 139 (11.9%) |
| Single Unit, Attached | 20 (100.0%) | 0 (0.0%) |
| 2 Unit Apartments | 0 (0.0%) | 42 (100.0%) |
| 3 or 4 Unit Apartments | 0 (0.0%) | 133 (100.0%) |
| 5 to 9 Unit Apartments | 0 (0.0%) | 57 (100.0%) |
| 10 or more Apartments | 16 (11.5%) | 123 (88.5%) |
| Mobile Home / Other | 40 (100.0%) | 0 (0.0%) |
| Total | 1,102 (69.1%) | 494 (30.9%) |
Housing Structures by Number of Rooms in Baldwin City
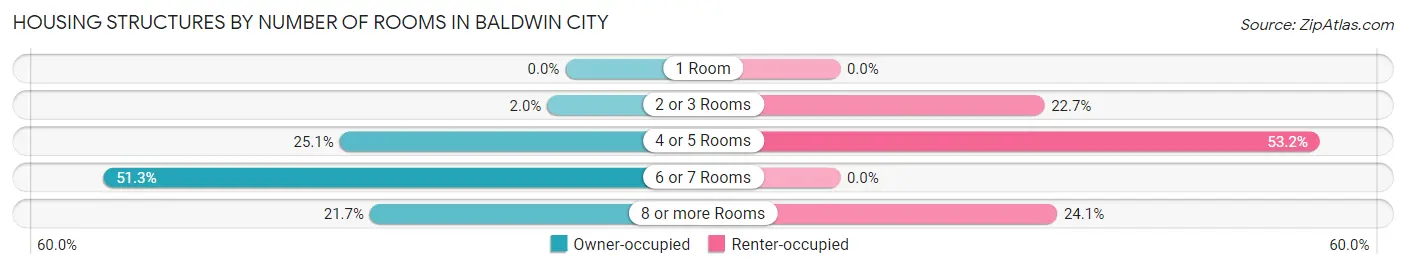
| Number of Rooms | Owner-occupied | Renter-occupied |
| 1 Room | 0 (0.0%) | 0 (0.0%) |
| 2 or 3 Rooms | 22 (2.0%) | 112 (22.7%) |
| 4 or 5 Rooms | 276 (25.1%) | 263 (53.2%) |
| 6 or 7 Rooms | 565 (51.3%) | 0 (0.0%) |
| 8 or more Rooms | 239 (21.7%) | 119 (24.1%) |
| Total | 1,102 (100.0%) | 494 (100.0%) |
Housing Structure by Heating Type in Baldwin City
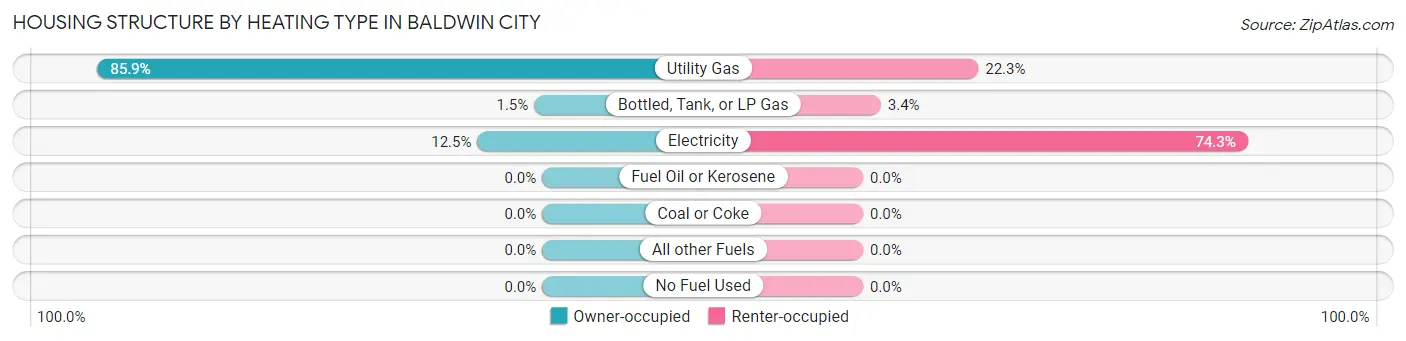
| Heating Type | Owner-occupied | Renter-occupied |
| Utility Gas | 947 (85.9%) | 110 (22.3%) |
| Bottled, Tank, or LP Gas | 17 (1.5%) | 17 (3.4%) |
| Electricity | 138 (12.5%) | 367 (74.3%) |
| Fuel Oil or Kerosene | 0 (0.0%) | 0 (0.0%) |
| Coal or Coke | 0 (0.0%) | 0 (0.0%) |
| All other Fuels | 0 (0.0%) | 0 (0.0%) |
| No Fuel Used | 0 (0.0%) | 0 (0.0%) |
| Total | 1,102 (100.0%) | 494 (100.0%) |
Household Vehicle Usage in Baldwin City
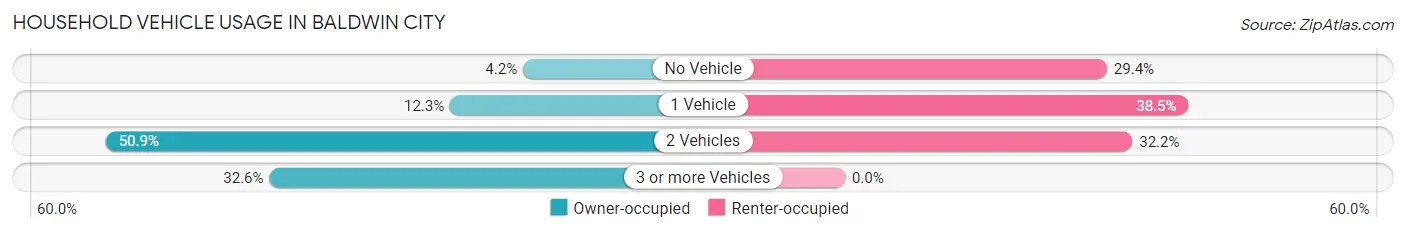
| Vehicles per Household | Owner-occupied | Renter-occupied |
| No Vehicle | 46 (4.2%) | 145 (29.3%) |
| 1 Vehicle | 136 (12.3%) | 190 (38.5%) |
| 2 Vehicles | 561 (50.9%) | 159 (32.2%) |
| 3 or more Vehicles | 359 (32.6%) | 0 (0.0%) |
| Total | 1,102 (100.0%) | 494 (100.0%) |
Real Estate & Mortgages in Baldwin City
Real Estate and Mortgage Overview in Baldwin City
| Characteristic | Without Mortgage | With Mortgage |
| Housing Units | 292 | 810 |
| Median Property Value | $237,500 | $215,300 |
| Median Household Income | $96,458 | $187 |
| Monthly Housing Costs | $624 | $11 |
| Real Estate Taxes | $3,103 | $0 |
Property Value by Mortgage Status in Baldwin City
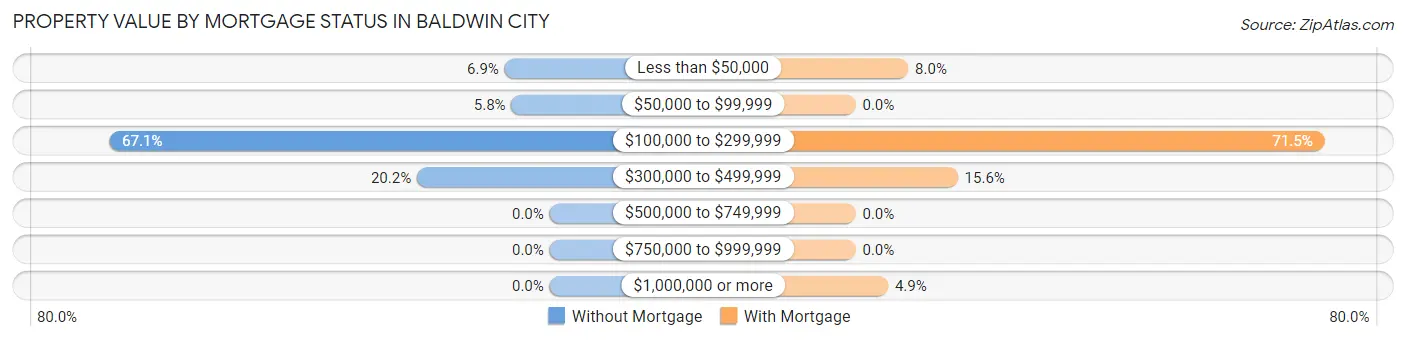
| Property Value | Without Mortgage | With Mortgage |
| Less than $50,000 | 20 (6.9%) | 65 (8.0%) |
| $50,000 to $99,999 | 17 (5.8%) | 0 (0.0%) |
| $100,000 to $299,999 | 196 (67.1%) | 579 (71.5%) |
| $300,000 to $499,999 | 59 (20.2%) | 126 (15.6%) |
| $500,000 to $749,999 | 0 (0.0%) | 0 (0.0%) |
| $750,000 to $999,999 | 0 (0.0%) | 0 (0.0%) |
| $1,000,000 or more | 0 (0.0%) | 40 (4.9%) |
| Total | 292 (100.0%) | 810 (100.0%) |
Household Income by Mortgage Status in Baldwin City
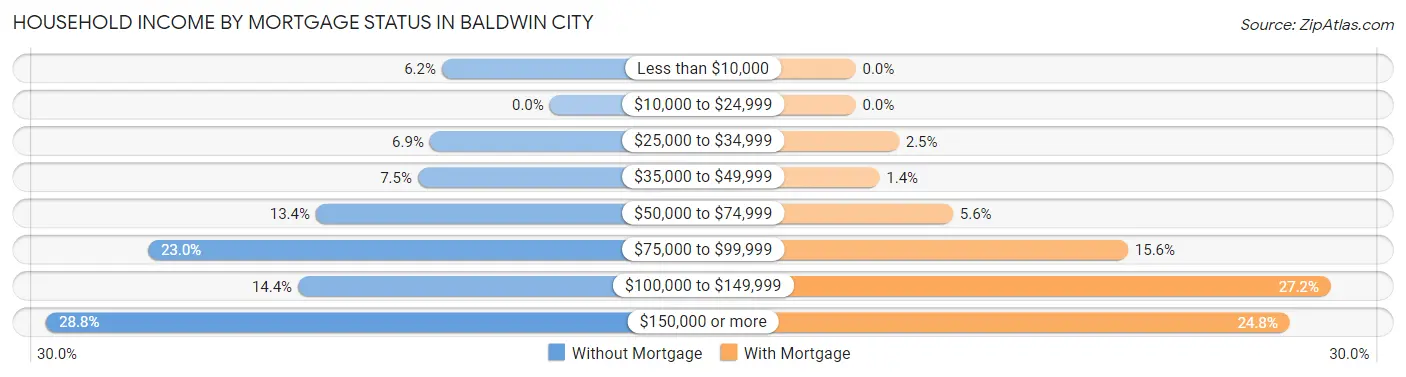
| Household Income | Without Mortgage | With Mortgage |
| Less than $10,000 | 18 (6.2%) | 0 (0.0%) |
| $10,000 to $24,999 | 0 (0.0%) | 0 (0.0%) |
| $25,000 to $34,999 | 20 (6.9%) | 20 (2.5%) |
| $35,000 to $49,999 | 22 (7.5%) | 11 (1.4%) |
| $50,000 to $74,999 | 39 (13.4%) | 45 (5.6%) |
| $75,000 to $99,999 | 67 (23.0%) | 126 (15.6%) |
| $100,000 to $149,999 | 42 (14.4%) | 220 (27.2%) |
| $150,000 or more | 84 (28.8%) | 201 (24.8%) |
| Total | 292 (100.0%) | 810 (100.0%) |
Property Value to Household Income Ratio in Baldwin City
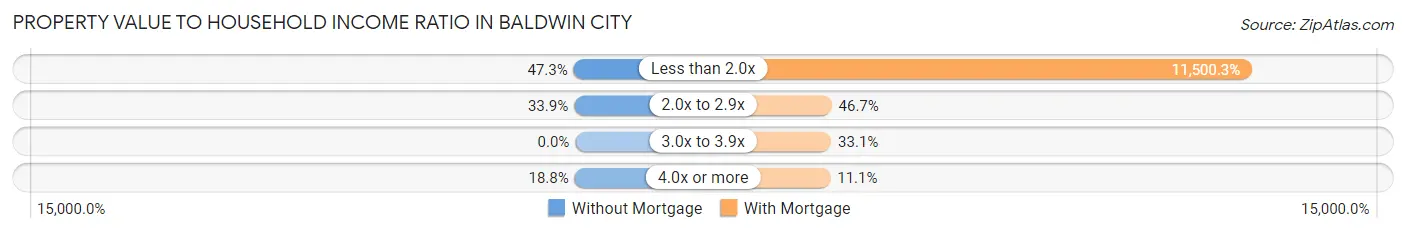
| Value-to-Income Ratio | Without Mortgage | With Mortgage |
| Less than 2.0x | 138 (47.3%) | 93,152 (11,500.2%) |
| 2.0x to 2.9x | 99 (33.9%) | 378 (46.7%) |
| 3.0x to 3.9x | 0 (0.0%) | 268 (33.1%) |
| 4.0x or more | 55 (18.8%) | 90 (11.1%) |
| Total | 292 (100.0%) | 810 (100.0%) |
Real Estate Taxes by Mortgage Status in Baldwin City
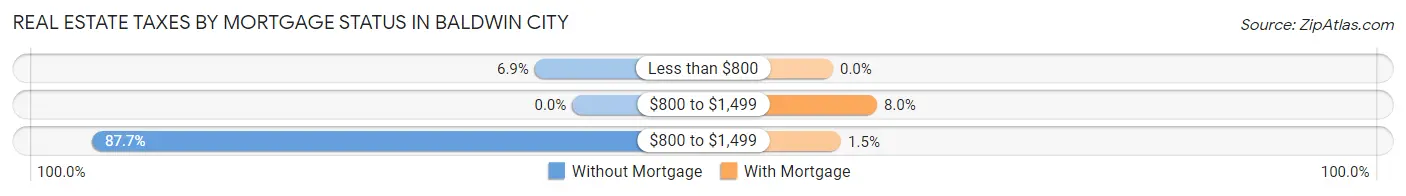
| Property Taxes | Without Mortgage | With Mortgage |
| Less than $800 | 20 (6.9%) | 0 (0.0%) |
| $800 to $1,499 | 0 (0.0%) | 65 (8.0%) |
| $800 to $1,499 | 256 (87.7%) | 12 (1.5%) |
| Total | 292 (100.0%) | 810 (100.0%) |
Health & Disability in Baldwin City
Health Insurance Coverage by Age in Baldwin City
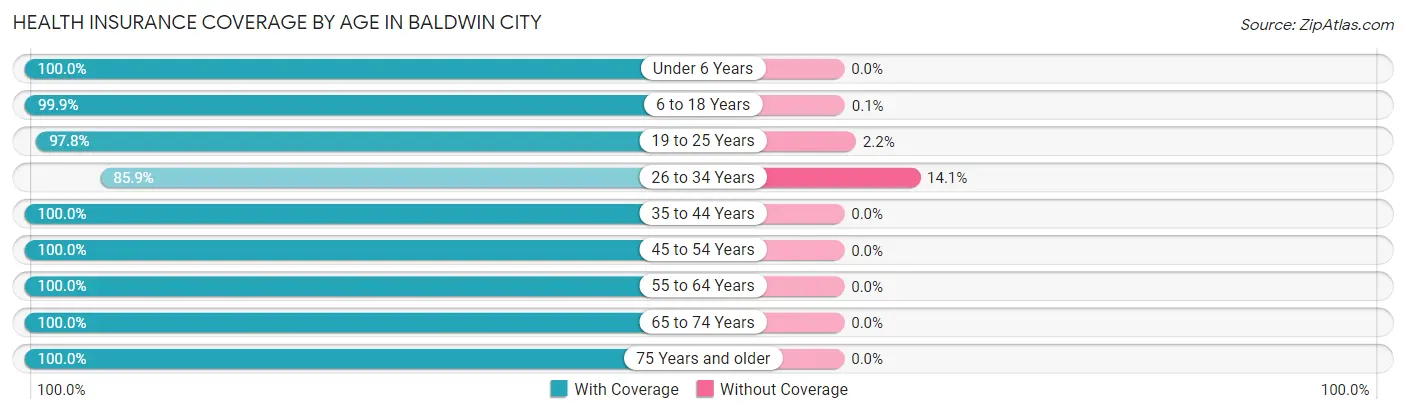
| Age Bracket | With Coverage | Without Coverage |
| Under 6 Years | 259 (100.0%) | 0 (0.0%) |
| 6 to 18 Years | 979 (99.9%) | 1 (0.1%) |
| 19 to 25 Years | 811 (97.8%) | 18 (2.2%) |
| 26 to 34 Years | 328 (85.9%) | 54 (14.1%) |
| 35 to 44 Years | 597 (100.0%) | 0 (0.0%) |
| 45 to 54 Years | 357 (100.0%) | 0 (0.0%) |
| 55 to 64 Years | 794 (100.0%) | 0 (0.0%) |
| 65 to 74 Years | 293 (100.0%) | 0 (0.0%) |
| 75 Years and older | 247 (100.0%) | 0 (0.0%) |
| Total | 4,665 (98.5%) | 73 (1.5%) |
Health Insurance Coverage by Citizenship Status in Baldwin City
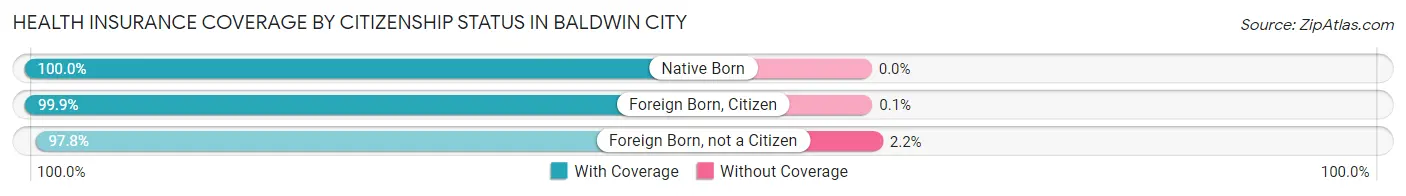
| Citizenship Status | With Coverage | Without Coverage |
| Native Born | 259 (100.0%) | 0 (0.0%) |
| Foreign Born, Citizen | 979 (99.9%) | 1 (0.1%) |
| Foreign Born, not a Citizen | 811 (97.8%) | 18 (2.2%) |
Health Insurance Coverage by Household Income in Baldwin City
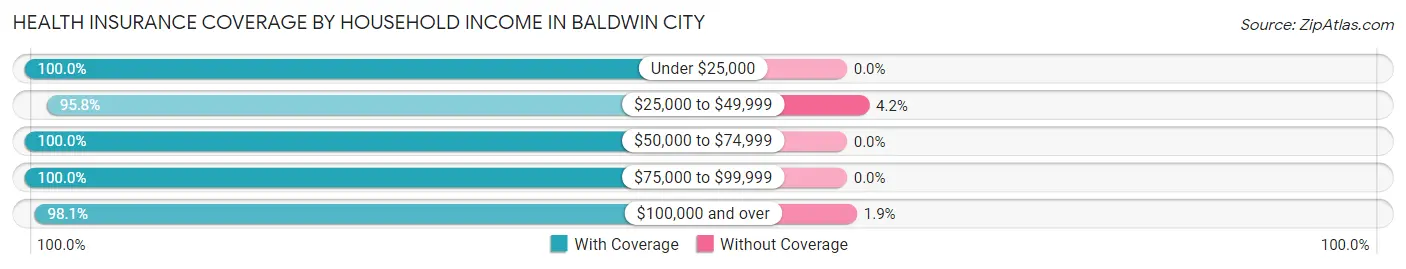
| Household Income | With Coverage | Without Coverage |
| Under $25,000 | 397 (100.0%) | 0 (0.0%) |
| $25,000 to $49,999 | 481 (95.8%) | 21 (4.2%) |
| $50,000 to $74,999 | 287 (100.0%) | 0 (0.0%) |
| $75,000 to $99,999 | 1,079 (100.0%) | 0 (0.0%) |
| $100,000 and over | 1,712 (98.1%) | 33 (1.9%) |
Public vs Private Health Insurance Coverage by Age in Baldwin City
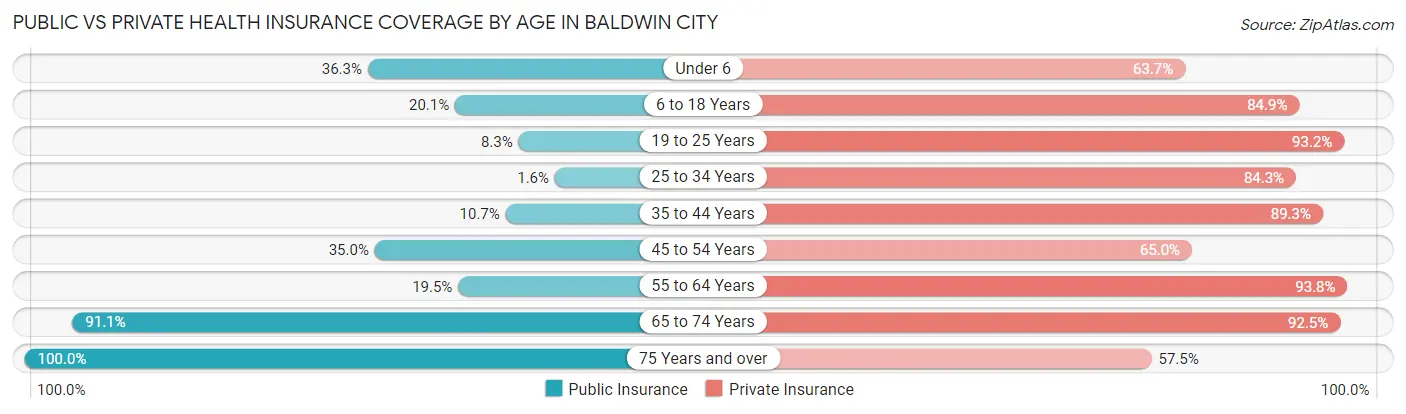
| Age Bracket | Public Insurance | Private Insurance |
| Under 6 | 94 (36.3%) | 165 (63.7%) |
| 6 to 18 Years | 197 (20.1%) | 832 (84.9%) |
| 19 to 25 Years | 69 (8.3%) | 773 (93.2%) |
| 25 to 34 Years | 6 (1.6%) | 322 (84.3%) |
| 35 to 44 Years | 64 (10.7%) | 533 (89.3%) |
| 45 to 54 Years | 125 (35.0%) | 232 (65.0%) |
| 55 to 64 Years | 155 (19.5%) | 745 (93.8%) |
| 65 to 74 Years | 267 (91.1%) | 271 (92.5%) |
| 75 Years and over | 247 (100.0%) | 142 (57.5%) |
| Total | 1,224 (25.8%) | 4,015 (84.7%) |
Disability Status by Sex by Age in Baldwin City
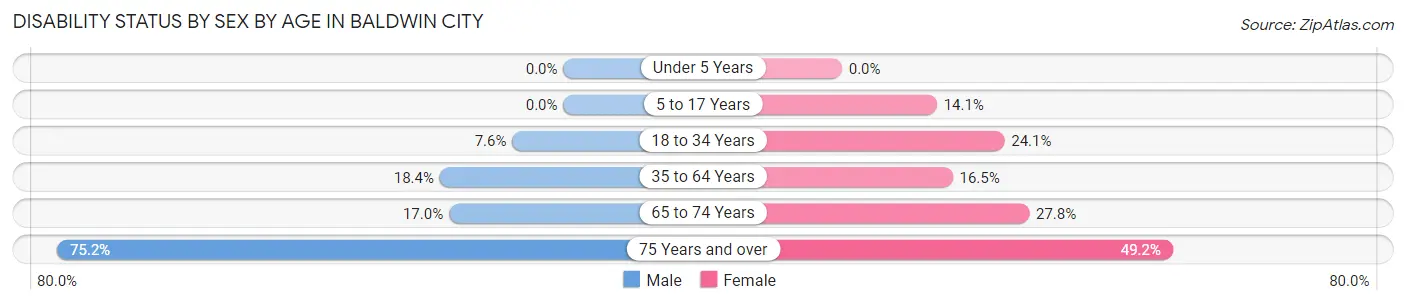
| Age Bracket | Male | Female |
| Under 5 Years | 0 (0.0%) | 0 (0.0%) |
| 5 to 17 Years | 0 (0.0%) | 42 (14.1%) |
| 18 to 34 Years | 51 (7.6%) | 187 (24.1%) |
| 35 to 64 Years | 140 (18.3%) | 162 (16.5%) |
| 65 to 74 Years | 18 (17.0%) | 52 (27.8%) |
| 75 Years and over | 97 (75.2%) | 58 (49.1%) |
Disability Class by Sex by Age in Baldwin City
Disability Class: Hearing Difficulty
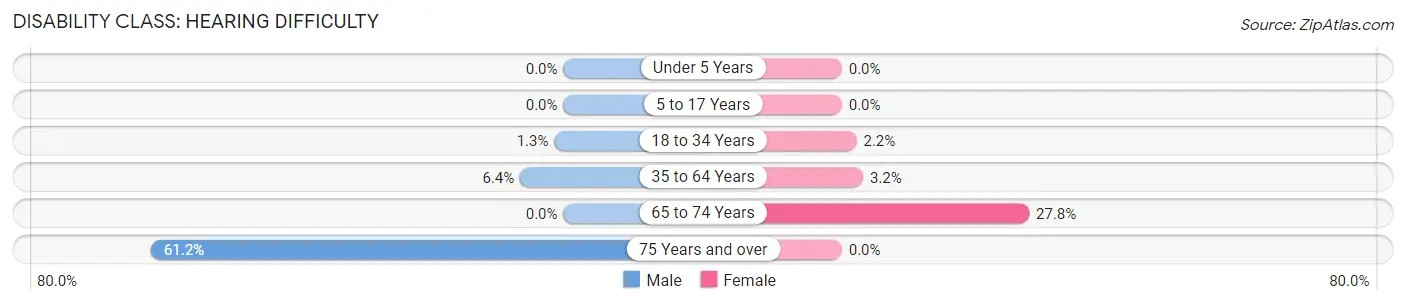
| Age Bracket | Male | Female |
| Under 5 Years | 0 (0.0%) | 0 (0.0%) |
| 5 to 17 Years | 0 (0.0%) | 0 (0.0%) |
| 18 to 34 Years | 9 (1.3%) | 17 (2.2%) |
| 35 to 64 Years | 49 (6.4%) | 31 (3.2%) |
| 65 to 74 Years | 0 (0.0%) | 52 (27.8%) |
| 75 Years and over | 79 (61.2%) | 0 (0.0%) |
Disability Class: Vision Difficulty
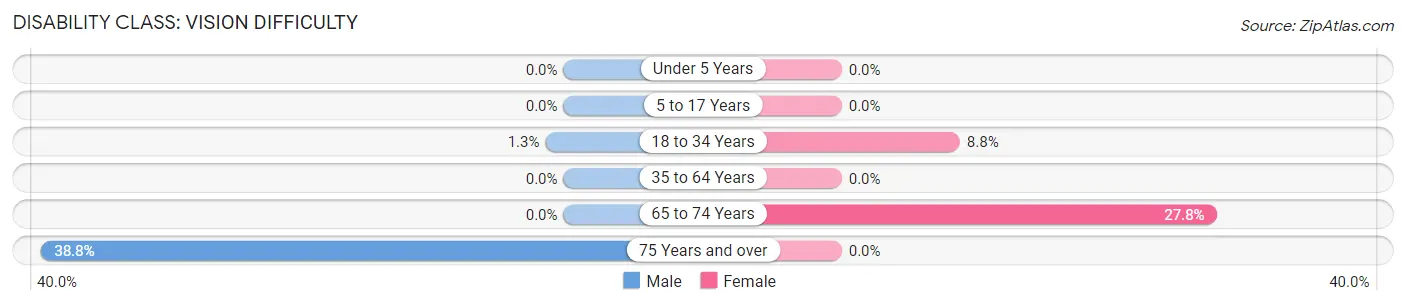
| Age Bracket | Male | Female |
| Under 5 Years | 0 (0.0%) | 0 (0.0%) |
| 5 to 17 Years | 0 (0.0%) | 0 (0.0%) |
| 18 to 34 Years | 9 (1.3%) | 68 (8.8%) |
| 35 to 64 Years | 0 (0.0%) | 0 (0.0%) |
| 65 to 74 Years | 0 (0.0%) | 52 (27.8%) |
| 75 Years and over | 50 (38.8%) | 0 (0.0%) |
Disability Class: Cognitive Difficulty
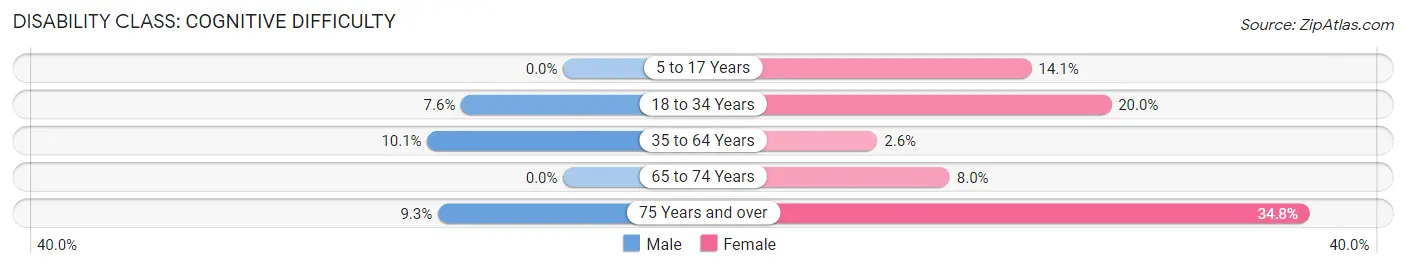
| Age Bracket | Male | Female |
| 5 to 17 Years | 0 (0.0%) | 42 (14.1%) |
| 18 to 34 Years | 51 (7.6%) | 155 (20.0%) |
| 35 to 64 Years | 77 (10.1%) | 26 (2.6%) |
| 65 to 74 Years | 0 (0.0%) | 15 (8.0%) |
| 75 Years and over | 12 (9.3%) | 41 (34.7%) |
Disability Class: Ambulatory Difficulty
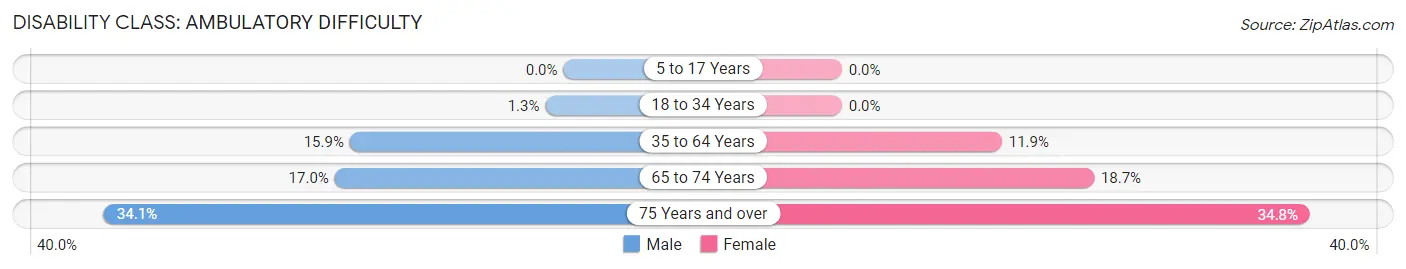
| Age Bracket | Male | Female |
| 5 to 17 Years | 0 (0.0%) | 0 (0.0%) |
| 18 to 34 Years | 9 (1.3%) | 0 (0.0%) |
| 35 to 64 Years | 121 (15.9%) | 117 (11.9%) |
| 65 to 74 Years | 18 (17.0%) | 35 (18.7%) |
| 75 Years and over | 44 (34.1%) | 41 (34.7%) |
Disability Class: Self-Care Difficulty
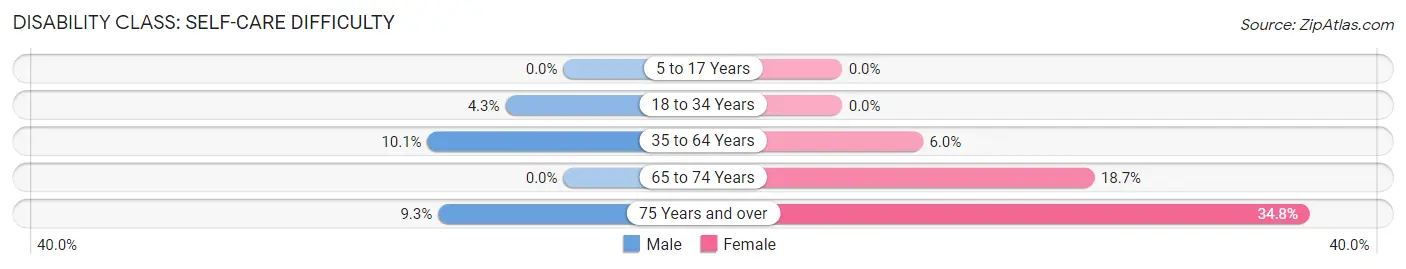
| Age Bracket | Male | Female |
| 5 to 17 Years | 0 (0.0%) | 0 (0.0%) |
| 18 to 34 Years | 29 (4.3%) | 0 (0.0%) |
| 35 to 64 Years | 77 (10.1%) | 59 (6.0%) |
| 65 to 74 Years | 0 (0.0%) | 35 (18.7%) |
| 75 Years and over | 12 (9.3%) | 41 (34.7%) |
Technology Access in Baldwin City
Computing Device Access in Baldwin City
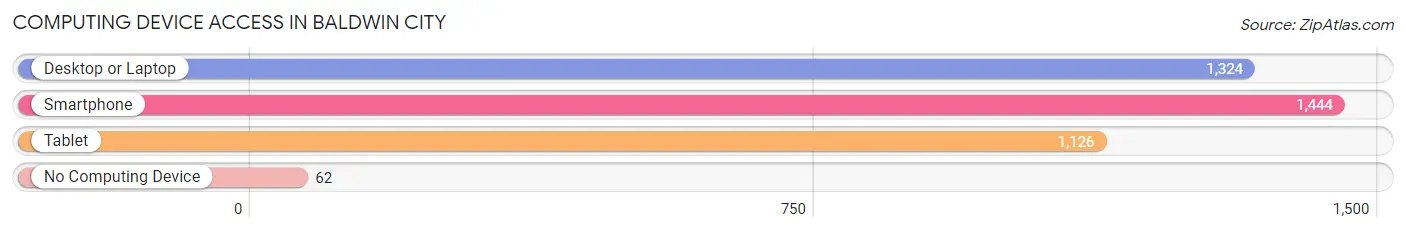
| Device Type | # Households | % Households |
| Desktop or Laptop | 1,324 | 83.0% |
| Smartphone | 1,444 | 90.5% |
| Tablet | 1,126 | 70.6% |
| No Computing Device | 62 | 3.9% |
| Total | 1,596 | 100.0% |
Internet Access in Baldwin City
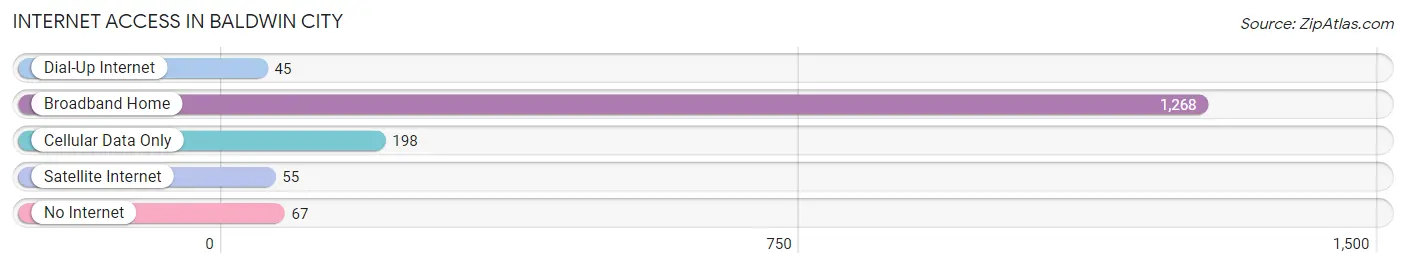
| Internet Type | # Households | % Households |
| Dial-Up Internet | 45 | 2.8% |
| Broadband Home | 1,268 | 79.4% |
| Cellular Data Only | 198 | 12.4% |
| Satellite Internet | 55 | 3.5% |
| No Internet | 67 | 4.2% |
| Total | 1,596 | 100.0% |
Baldwin City Summary
Baldwin City, Kansas is a small town located in Douglas County, Kansas. It is situated approximately 25 miles south of Lawrence and 25 miles west of Kansas City. The population of Baldwin City was estimated to be 4,093 in 2019.
History
Baldwin City was founded in 1858 by a group of settlers from Ohio. The town was named after John Baldwin, a prominent local businessman. The town was originally a stop on the Santa Fe Trail, and it was also a major stop on the Oregon Trail. In 1864, the town was incorporated and the first post office was established.
In the late 19th century, Baldwin City was a major center for the production of wheat and other grains. The town was also home to several flour mills, which provided employment for many of the town's residents.
In the early 20th century, Baldwin City was a major center for the production of coal. The town was also home to several coal mines, which provided employment for many of the town's residents.
Geography
Baldwin City is located in Douglas County, Kansas. The town is situated on the banks of the Wakarusa River, which flows through the town. The town is located in the eastern part of the county, and is approximately 25 miles south of Lawrence and 25 miles west of Kansas City.
The town is located in the Central Lowlands region of Kansas, and is characterized by rolling hills and flat plains. The climate in Baldwin City is characterized by hot, humid summers and cold, dry winters.
Economy
Baldwin City's economy is largely based on agriculture and tourism. The town is home to several farms, which produce a variety of crops, including wheat, corn, soybeans, and hay. The town is also home to several wineries, which produce a variety of wines.
The town is also home to several small businesses, including restaurants, retail stores, and service providers. The town is also home to several manufacturing companies, which produce a variety of products, including furniture, clothing, and electronics.
Demographics
As of 2019, the population of Baldwin City was estimated to be 4,093. The town has a median age of 37.7 years, and the median household income is $50,945. The town is predominantly white, with a population that is 94.3% white, 1.3% African American, 1.2% Hispanic, and 0.7% Asian.
Conclusion
Baldwin City, Kansas is a small town located in Douglas County, Kansas. The town was founded in 1858 and has a population of 4,093. The town's economy is largely based on agriculture and tourism, and the town is home to several small businesses. The town is predominantly white, with a population that is 94.3% white, 1.3% African American, 1.2% Hispanic, and 0.7% Asian.
Common Questions
What is Per Capita Income in Baldwin City?
Per Capita income in Baldwin City is $32,115.
What is the Median Family Income in Baldwin City?
Median Family Income in Baldwin City is $98,865.
What is the Median Household income in Baldwin City?
Median Household Income in Baldwin City is $87,133.
What is Income or Wage Gap in Baldwin City?
Income or Wage Gap in Baldwin City is 50.4%.
Women in Baldwin City earn 49.6 cents for every dollar earned by a man.
What is Family Income Deficit in Baldwin City?
Family Income Deficit in Baldwin City is $8,077.
Families that are below poverty line in Baldwin City earn $8,077 less on average than the poverty threshold level.
What is Inequality or Gini Index in Baldwin City?
Inequality or Gini Index in Baldwin City is 0.37.
What is the Total Population of Baldwin City?
Total Population of Baldwin City is 4,845.
What is the Total Male Population of Baldwin City?
Total Male Population of Baldwin City is 2,322.
What is the Total Female Population of Baldwin City?
Total Female Population of Baldwin City is 2,523.
What is the Ratio of Males per 100 Females in Baldwin City?
There are 92.03 Males per 100 Females in Baldwin City.
What is the Ratio of Females per 100 Males in Baldwin City?
There are 108.66 Females per 100 Males in Baldwin City.
What is the Median Population Age in Baldwin City?
Median Population Age in Baldwin City is 31.8 Years.
What is the Average Family Size in Baldwin City
Average Family Size in Baldwin City is 3.0 People.
What is the Average Household Size in Baldwin City
Average Household Size in Baldwin City is 2.5 People.
How Large is the Labor Force in Baldwin City?
There are 2,337 People in the Labor Forcein in Baldwin City.
What is the Percentage of People in the Labor Force in Baldwin City?
58.8% of People are in the Labor Force in Baldwin City.
What is the Unemployment Rate in Baldwin City?
Unemployment Rate in Baldwin City is 4.9%.