Ozawkie, KS Map & Demographics
Ozawkie Map
Ozawkie Overview
$39,229
PER CAPITA INCOME
$105,583
AVG FAMILY INCOME
$96,250
AVG HOUSEHOLD INCOME
38.7%
WAGE / INCOME GAP [ % ]
61.3¢/ $1
WAGE / INCOME GAP [ $ ]
0.34
INEQUALITY / GINI INDEX
666
TOTAL POPULATION
344
MALE POPULATION
322
FEMALE POPULATION
106.83
MALES / 100 FEMALES
93.60
FEMALES / 100 MALES
37.6
MEDIAN AGE
3.2
AVG FAMILY SIZE
2.8
AVG HOUSEHOLD SIZE
315
LABOR FORCE [ PEOPLE ]
63.5%
PERCENT IN LABOR FORCE
1.0%
UNEMPLOYMENT RATE
Ozawkie Zip Codes
Ozawkie Area Codes
Income in Ozawkie
Income Overview in Ozawkie
Per Capita Income in Ozawkie is $39,229, while median incomes of families and households are $105,583 and $96,250 respectively.
| Characteristic | Number | Measure |
| Per Capita Income | 666 | $39,229 |
| Median Family Income | 183 | $105,583 |
| Mean Family Income | 183 | $116,837 |
| Median Household Income | 240 | $96,250 |
| Mean Household Income | 240 | $105,990 |
| Income Deficit | 183 | $0 |
| Wage / Income Gap (%) | 666 | 38.74% |
| Wage / Income Gap ($) | 666 | 61.26¢ per $1 |
| Gini / Inequality Index | 666 | 0.34 |
Earnings by Sex in Ozawkie
Average Earnings in Ozawkie are $55,000, $66,250 for men and $40,588 for women, a difference of 38.7%.
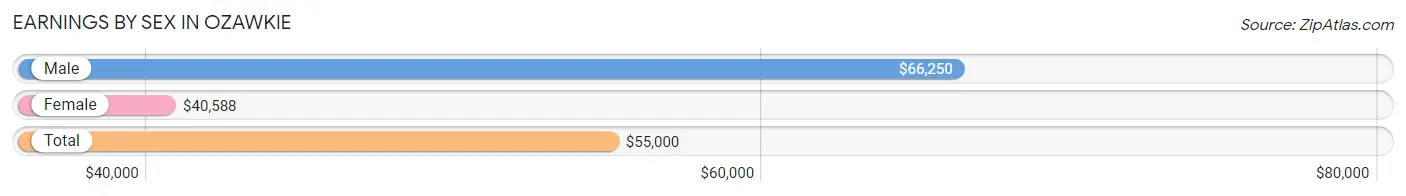
| Sex | Number | Average Earnings |
| Male | 176 (50.3%) | $66,250 |
| Female | 174 (49.7%) | $40,588 |
| Total | 350 (100.0%) | $55,000 |
Earnings by Sex by Income Bracket in Ozawkie
The most common earnings brackets in Ozawkie are $100,000+ for men (44 | 25.0%) and $55,000 to $64,999 for women (28 | 16.1%).
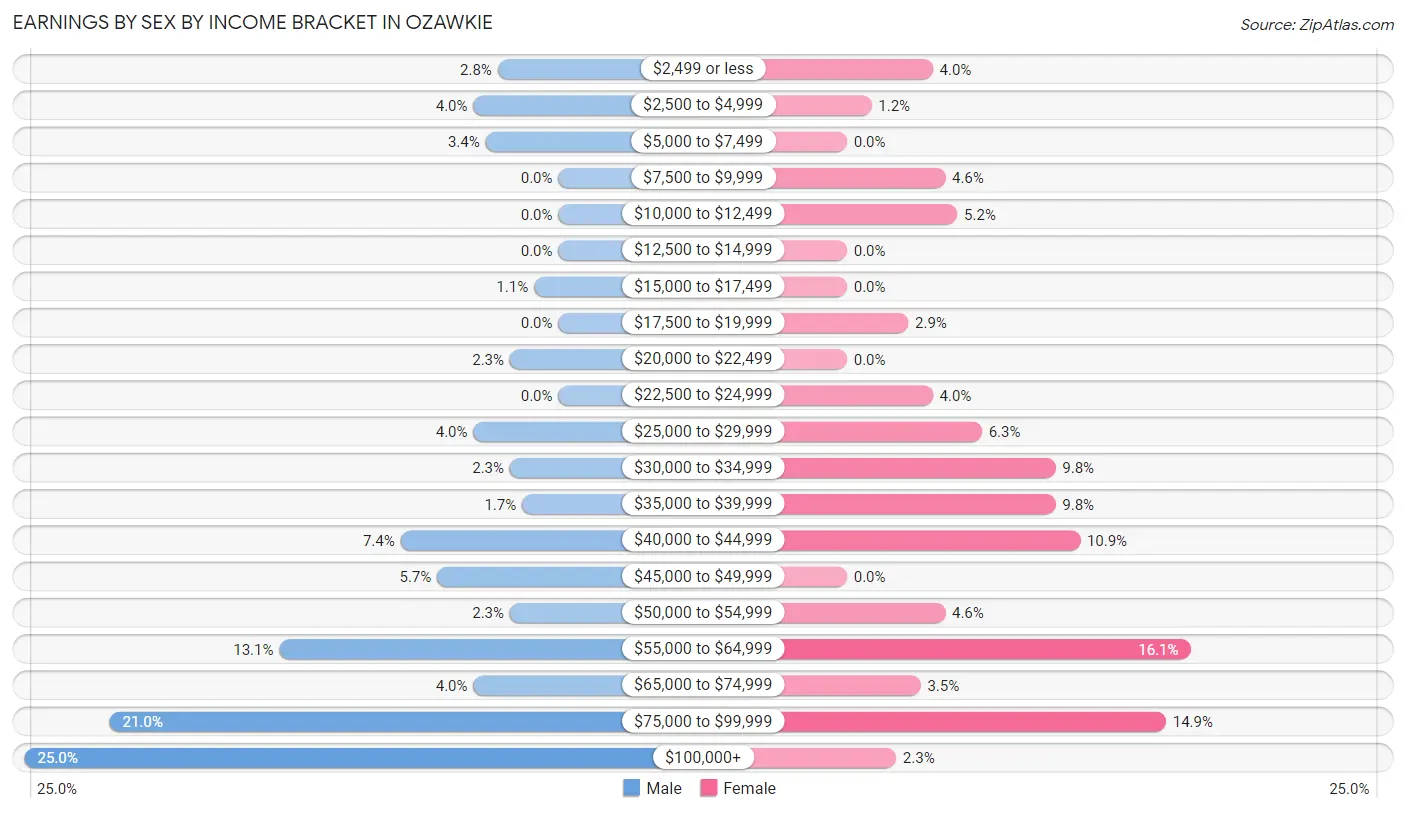
| Income | Male | Female |
| $2,499 or less | 5 (2.8%) | 7 (4.0%) |
| $2,500 to $4,999 | 7 (4.0%) | 2 (1.1%) |
| $5,000 to $7,499 | 6 (3.4%) | 0 (0.0%) |
| $7,500 to $9,999 | 0 (0.0%) | 8 (4.6%) |
| $10,000 to $12,499 | 0 (0.0%) | 9 (5.2%) |
| $12,500 to $14,999 | 0 (0.0%) | 0 (0.0%) |
| $15,000 to $17,499 | 2 (1.1%) | 0 (0.0%) |
| $17,500 to $19,999 | 0 (0.0%) | 5 (2.9%) |
| $20,000 to $22,499 | 4 (2.3%) | 0 (0.0%) |
| $22,500 to $24,999 | 0 (0.0%) | 7 (4.0%) |
| $25,000 to $29,999 | 7 (4.0%) | 11 (6.3%) |
| $30,000 to $34,999 | 4 (2.3%) | 17 (9.8%) |
| $35,000 to $39,999 | 3 (1.7%) | 17 (9.8%) |
| $40,000 to $44,999 | 13 (7.4%) | 19 (10.9%) |
| $45,000 to $49,999 | 10 (5.7%) | 0 (0.0%) |
| $50,000 to $54,999 | 4 (2.3%) | 8 (4.6%) |
| $55,000 to $64,999 | 23 (13.1%) | 28 (16.1%) |
| $65,000 to $74,999 | 7 (4.0%) | 6 (3.5%) |
| $75,000 to $99,999 | 37 (21.0%) | 26 (14.9%) |
| $100,000+ | 44 (25.0%) | 4 (2.3%) |
| Total | 176 (100.0%) | 174 (100.0%) |
Earnings by Sex by Educational Attainment in Ozawkie
Average earnings in Ozawkie are $79,063 for men and $41,471 for women, a difference of 47.5%. Men with an educational attainment of graduate degree enjoy the highest average annual earnings of $118,333, while those with bachelor's degree education earn the least with $62,212. Women with an educational attainment of graduate degree earn the most with the average annual earnings of $82,813, while those with college or associate's degree education have the smallest earnings of $33,125.
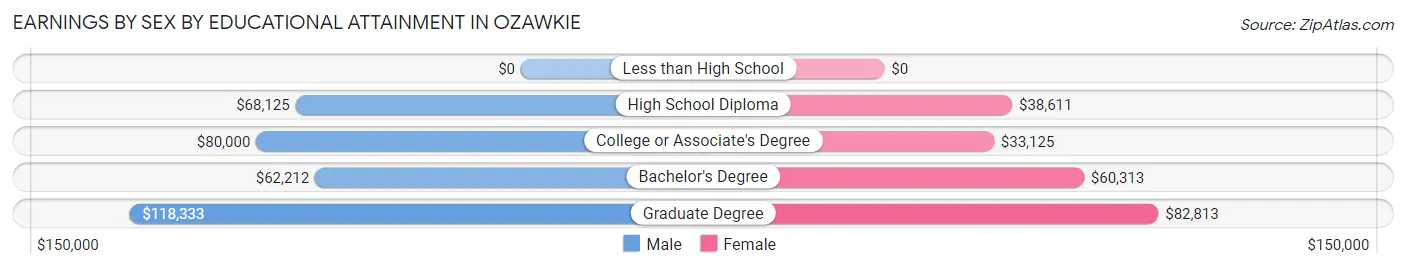
| Educational Attainment | Male Income | Female Income |
| Less than High School | - | - |
| High School Diploma | $68,125 | $38,611 |
| College or Associate's Degree | $80,000 | $33,125 |
| Bachelor's Degree | $62,212 | $60,313 |
| Graduate Degree | $118,333 | $82,813 |
| Total | $79,063 | $41,471 |
Family Income in Ozawkie
Family Income Brackets in Ozawkie
According to the Ozawkie family income data, there are 59 families falling into the $100,000 to $149,999 income range, which is the most common income bracket and makes up 32.2% of all families.
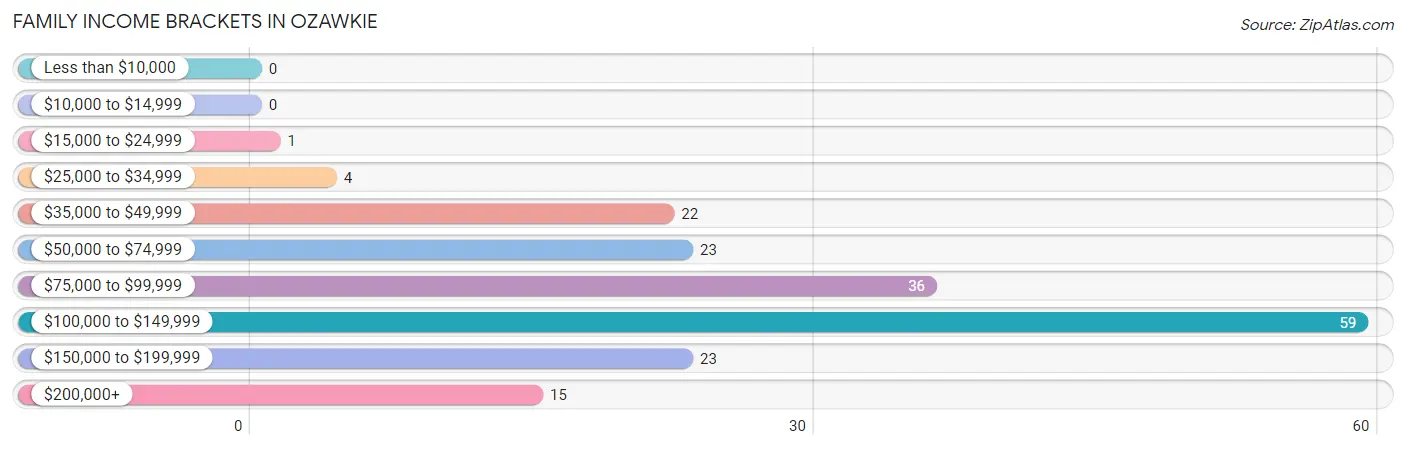
| Income Bracket | # Families | % Families |
| Less than $10,000 | 0 | 0.0% |
| $10,000 to $14,999 | 0 | 0.0% |
| $15,000 to $24,999 | 1 | 0.5% |
| $25,000 to $34,999 | 4 | 2.2% |
| $35,000 to $49,999 | 22 | 12.0% |
| $50,000 to $74,999 | 23 | 12.6% |
| $75,000 to $99,999 | 36 | 19.7% |
| $100,000 to $149,999 | 59 | 32.2% |
| $150,000 to $199,999 | 23 | 12.6% |
| $200,000+ | 15 | 8.2% |
Family Income by Famaliy Size in Ozawkie
4-person families (29 | 15.9%) account for the highest median family income in Ozawkie with $158,958 per family, while 2-person families (106 | 57.9%) have the highest median income of $45,625 per family member.
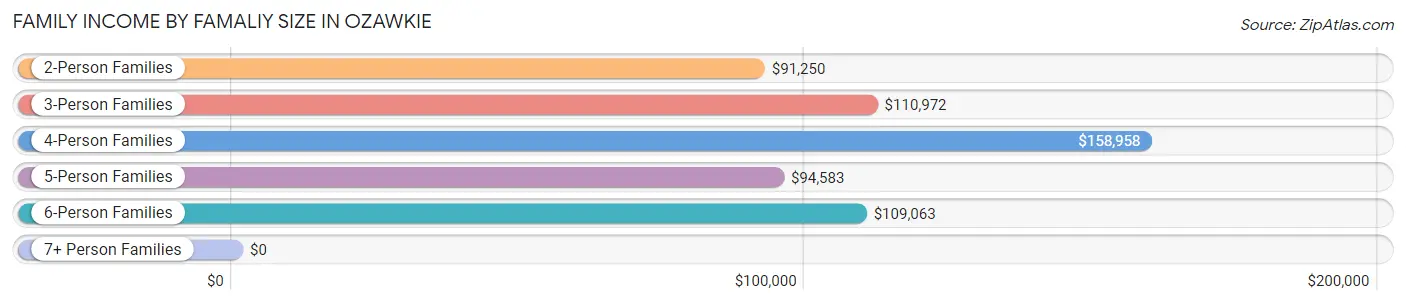
| Income Bracket | # Families | Median Income |
| 2-Person Families | 106 (57.9%) | $91,250 |
| 3-Person Families | 17 (9.3%) | $110,972 |
| 4-Person Families | 29 (15.9%) | $158,958 |
| 5-Person Families | 11 (6.0%) | $94,583 |
| 6-Person Families | 15 (8.2%) | $109,063 |
| 7+ Person Families | 5 (2.7%) | $0 |
| Total | 183 (100.0%) | $105,583 |
Family Income by Number of Earners in Ozawkie
The median family income in Ozawkie is $105,583, with families comprising 3+ earners (11) having the highest median family income of $177,708, while families with no earners (34) have the lowest median family income of $48,611, accounting for 6.0% and 18.6% of families, respectively.
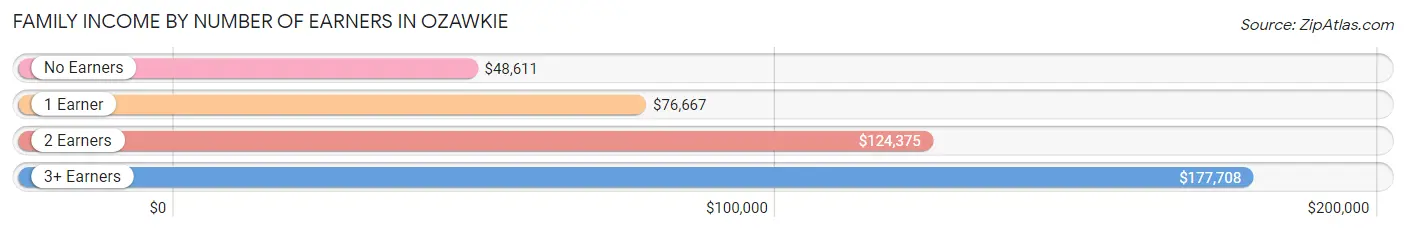
| Number of Earners | # Families | Median Income |
| No Earners | 34 (18.6%) | $48,611 |
| 1 Earner | 44 (24.0%) | $76,667 |
| 2 Earners | 94 (51.4%) | $124,375 |
| 3+ Earners | 11 (6.0%) | $177,708 |
| Total | 183 (100.0%) | $105,583 |
Household Income in Ozawkie
Household Income Brackets in Ozawkie
With 78 households falling in the category, the $100,000 to $149,999 income range is the most frequent in Ozawkie, accounting for 32.5% of all households.
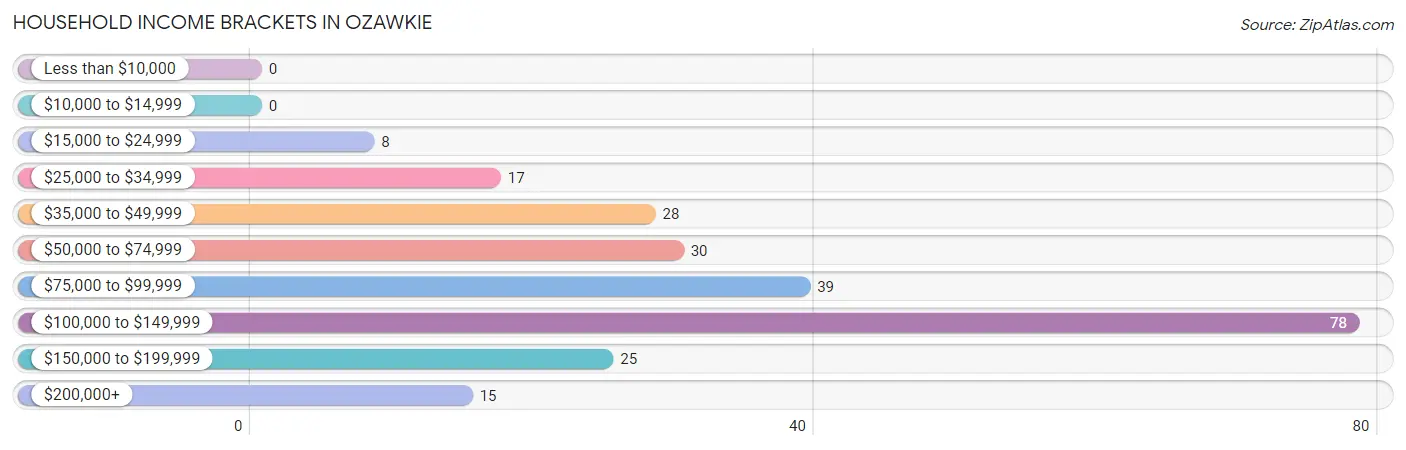
| Income Bracket | # Households | % Households |
| Less than $10,000 | 0 | 0.0% |
| $10,000 to $14,999 | 0 | 0.0% |
| $15,000 to $24,999 | 8 | 3.3% |
| $25,000 to $34,999 | 17 | 7.1% |
| $35,000 to $49,999 | 28 | 11.7% |
| $50,000 to $74,999 | 30 | 12.5% |
| $75,000 to $99,999 | 39 | 16.3% |
| $100,000 to $149,999 | 78 | 32.5% |
| $150,000 to $199,999 | 25 | 10.4% |
| $200,000+ | 15 | 6.3% |
Household Income by Householder Age in Ozawkie
The median household income in Ozawkie is $96,250, with the highest median household income of $115,000 found in the 25 to 44 years age bracket for the primary householder. A total of 84 households (35.0%) fall into this category. Meanwhile, the 15 to 24 years age bracket for the primary householder has the lowest median household income of $0, with 5 households (2.1%) in this group.
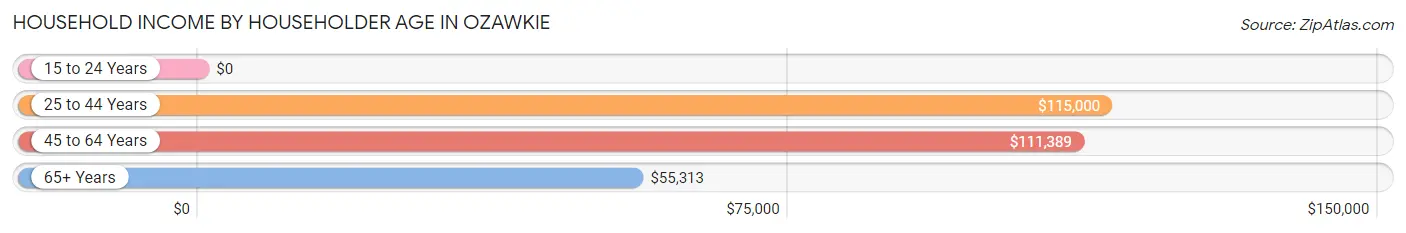
| Income Bracket | # Households | Median Income |
| 15 to 24 Years | 5 (2.1%) | $0 |
| 25 to 44 Years | 84 (35.0%) | $115,000 |
| 45 to 64 Years | 90 (37.5%) | $111,389 |
| 65+ Years | 61 (25.4%) | $55,313 |
| Total | 240 (100.0%) | $96,250 |
Poverty in Ozawkie
Income Below Poverty by Sex and Age in Ozawkie
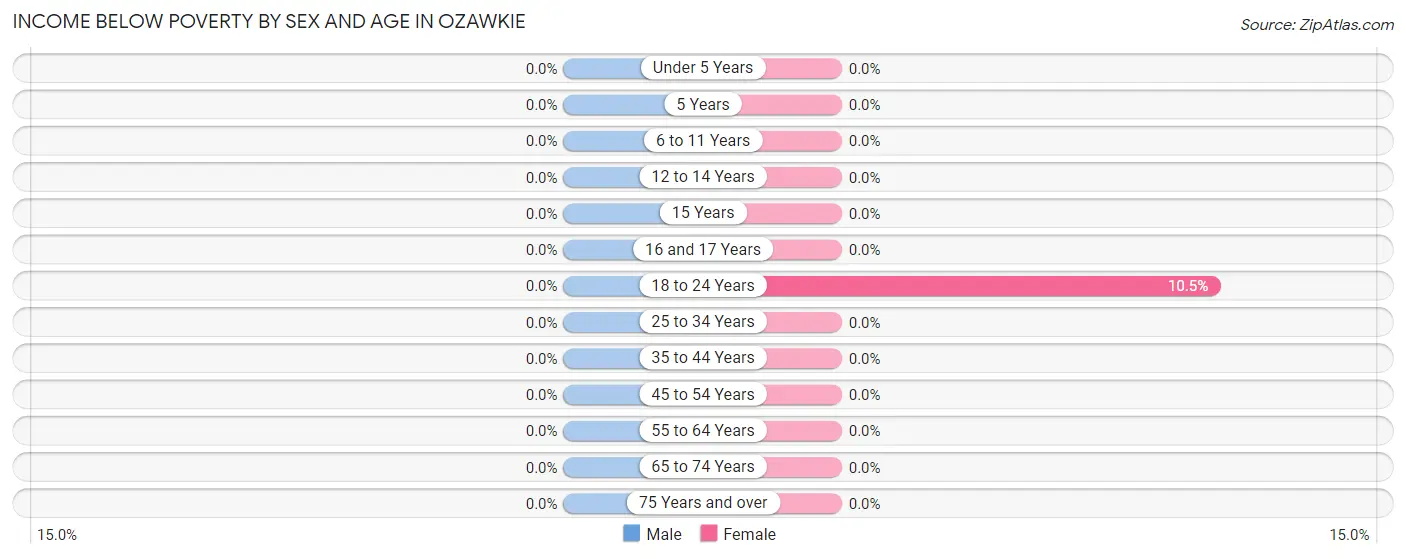
| Age Bracket | Male | Female |
| Under 5 Years | 0 (0.0%) | 0 (0.0%) |
| 5 Years | 0 (0.0%) | 0 (0.0%) |
| 6 to 11 Years | 0 (0.0%) | 0 (0.0%) |
| 12 to 14 Years | 0 (0.0%) | 0 (0.0%) |
| 15 Years | 0 (0.0%) | 0 (0.0%) |
| 16 and 17 Years | 0 (0.0%) | 0 (0.0%) |
| 18 to 24 Years | 0 (0.0%) | 2 (10.5%) |
| 25 to 34 Years | 0 (0.0%) | 0 (0.0%) |
| 35 to 44 Years | 0 (0.0%) | 0 (0.0%) |
| 45 to 54 Years | 0 (0.0%) | 0 (0.0%) |
| 55 to 64 Years | 0 (0.0%) | 0 (0.0%) |
| 65 to 74 Years | 0 (0.0%) | 0 (0.0%) |
| 75 Years and over | 0 (0.0%) | 0 (0.0%) |
| Total | 0 (0.0%) | 2 (0.6%) |
Income Above Poverty by Sex and Age in Ozawkie
According to the poverty statistics in Ozawkie, males aged under 5 years and females aged under 5 years are the age groups that are most secure financially, with 100.0% of males and 100.0% of females in these age groups living above the poverty line.
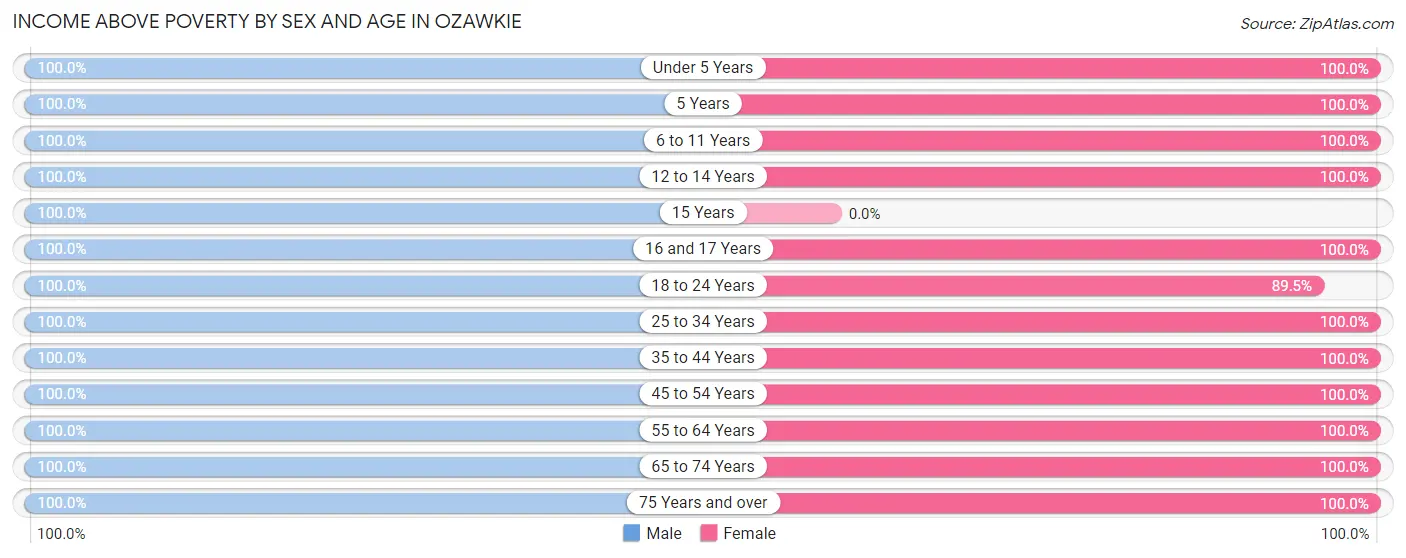
| Age Bracket | Male | Female |
| Under 5 Years | 45 (100.0%) | 32 (100.0%) |
| 5 Years | 4 (100.0%) | 7 (100.0%) |
| 6 to 11 Years | 36 (100.0%) | 13 (100.0%) |
| 12 to 14 Years | 13 (100.0%) | 14 (100.0%) |
| 15 Years | 4 (100.0%) | 0 (0.0%) |
| 16 and 17 Years | 18 (100.0%) | 12 (100.0%) |
| 18 to 24 Years | 12 (100.0%) | 17 (89.5%) |
| 25 to 34 Years | 52 (100.0%) | 35 (100.0%) |
| 35 to 44 Years | 35 (100.0%) | 50 (100.0%) |
| 45 to 54 Years | 33 (100.0%) | 33 (100.0%) |
| 55 to 64 Years | 36 (100.0%) | 51 (100.0%) |
| 65 to 74 Years | 33 (100.0%) | 40 (100.0%) |
| 75 Years and over | 21 (100.0%) | 16 (100.0%) |
| Total | 342 (100.0%) | 320 (99.4%) |
Income Below Poverty Among Married-Couple Families in Ozawkie
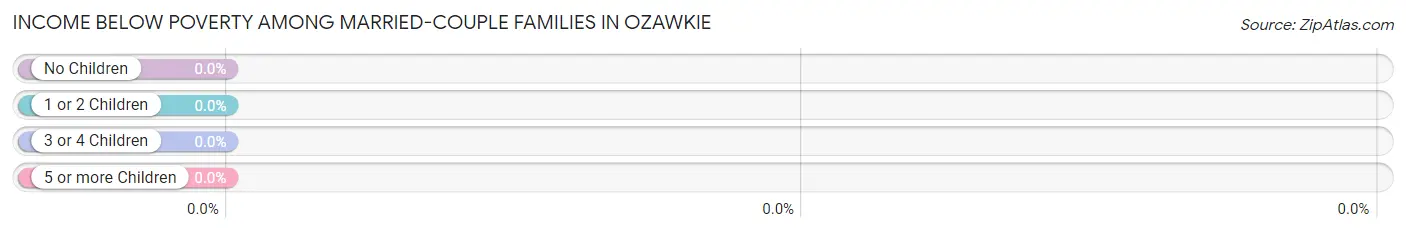
| Children | Above Poverty | Below Poverty |
| No Children | 97 (100.0%) | 0 (0.0%) |
| 1 or 2 Children | 29 (100.0%) | 0 (0.0%) |
| 3 or 4 Children | 26 (100.0%) | 0 (0.0%) |
| 5 or more Children | 5 (100.0%) | 0 (0.0%) |
| Total | 157 (100.0%) | 0 (0.0%) |
Income Below Poverty Among Single-Parent Households in Ozawkie
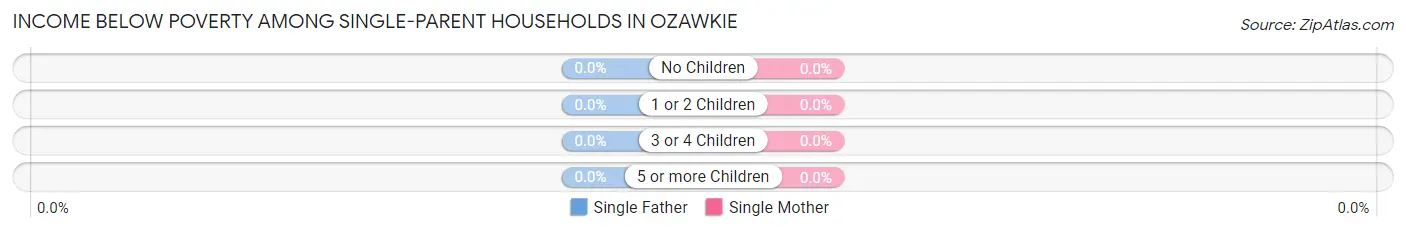
| Children | Single Father | Single Mother |
| No Children | 0 (0.0%) | 0 (0.0%) |
| 1 or 2 Children | 0 (0.0%) | 0 (0.0%) |
| 3 or 4 Children | 0 (0.0%) | 0 (0.0%) |
| 5 or more Children | 0 (0.0%) | 0 (0.0%) |
| Total | 0 (0.0%) | 0 (0.0%) |
Income Below Poverty Among Married-Couple vs Single-Parent Households in Ozawkie
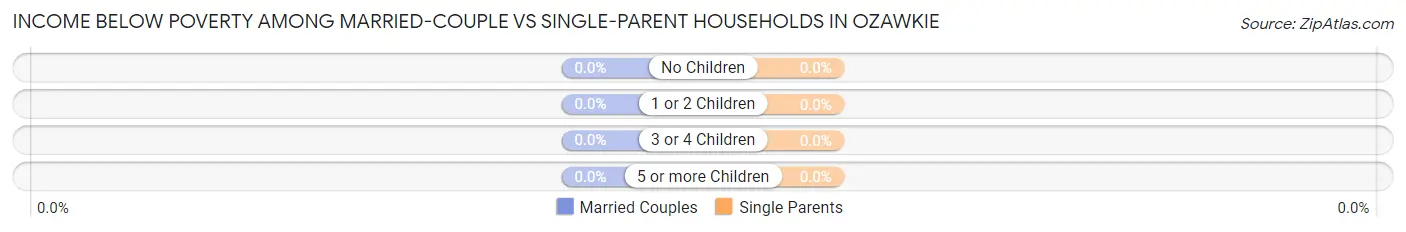
| Children | Married-Couple Families | Single-Parent Households |
| No Children | 0 (0.0%) | 0 (0.0%) |
| 1 or 2 Children | 0 (0.0%) | 0 (0.0%) |
| 3 or 4 Children | 0 (0.0%) | 0 (0.0%) |
| 5 or more Children | 0 (0.0%) | 0 (0.0%) |
| Total | 0 (0.0%) | 0 (0.0%) |
Race in Ozawkie
The most populous races in Ozawkie are White / Caucasian (623 | 93.5%), Hispanic or Latino (28 | 4.2%), and Black / African American (27 | 4.1%).
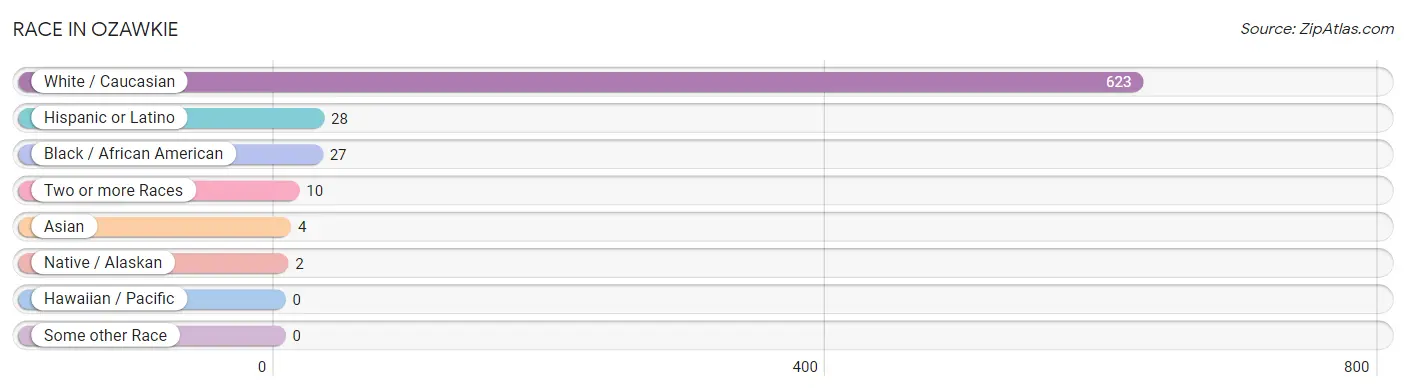
| Race | # Population | % Population |
| Asian | 4 | 0.6% |
| Black / African American | 27 | 4.1% |
| Hawaiian / Pacific | 0 | 0.0% |
| Hispanic or Latino | 28 | 4.2% |
| Native / Alaskan | 2 | 0.3% |
| White / Caucasian | 623 | 93.5% |
| Two or more Races | 10 | 1.5% |
| Some other Race | 0 | 0.0% |
| Total | 666 | 100.0% |
Ancestry in Ozawkie
The most populous ancestries reported in Ozawkie are German (240 | 36.0%), Irish (91 | 13.7%), English (75 | 11.3%), Scottish (45 | 6.8%), and Mexican (28 | 4.2%), together accounting for 71.9% of all Ozawkie residents.
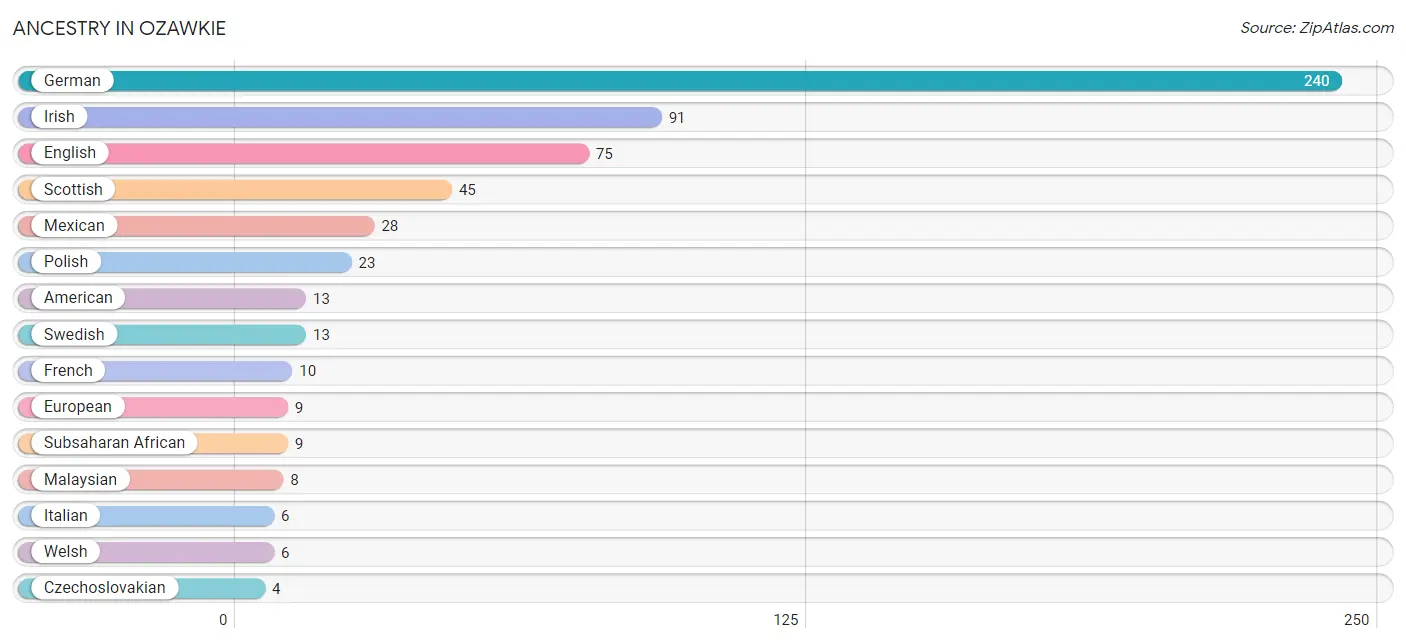
| Ancestry | # Population | % Population |
| American | 13 | 1.9% |
| Blackfeet | 2 | 0.3% |
| British | 2 | 0.3% |
| Cherokee | 1 | 0.2% |
| Chickasaw | 2 | 0.3% |
| Czech | 2 | 0.3% |
| Czechoslovakian | 4 | 0.6% |
| Danish | 3 | 0.4% |
| Dutch | 2 | 0.3% |
| English | 75 | 11.3% |
| European | 9 | 1.3% |
| Finnish | 4 | 0.6% |
| French | 10 | 1.5% |
| French Canadian | 2 | 0.3% |
| German | 240 | 36.0% |
| Haitian | 3 | 0.4% |
| Irish | 91 | 13.7% |
| Italian | 6 | 0.9% |
| Malaysian | 8 | 1.2% |
| Mexican | 28 | 4.2% |
| Norwegian | 3 | 0.4% |
| Pakistani | 1 | 0.2% |
| Polish | 23 | 3.5% |
| Russian | 2 | 0.3% |
| Scandinavian | 2 | 0.3% |
| Scotch-Irish | 2 | 0.3% |
| Scottish | 45 | 6.8% |
| Subsaharan African | 9 | 1.3% |
| Swedish | 13 | 1.9% |
| Welsh | 6 | 0.9% | View All 30 Rows |
Immigrants in Ozawkie
The most numerous immigrant groups reported in Ozawkie came from Africa (4 | 0.6%), Asia (4 | 0.6%), South Eastern Asia (4 | 0.6%), Thailand (4 | 0.6%), and Western Africa (4 | 0.6%), together accounting for 3.0% of all Ozawkie residents.
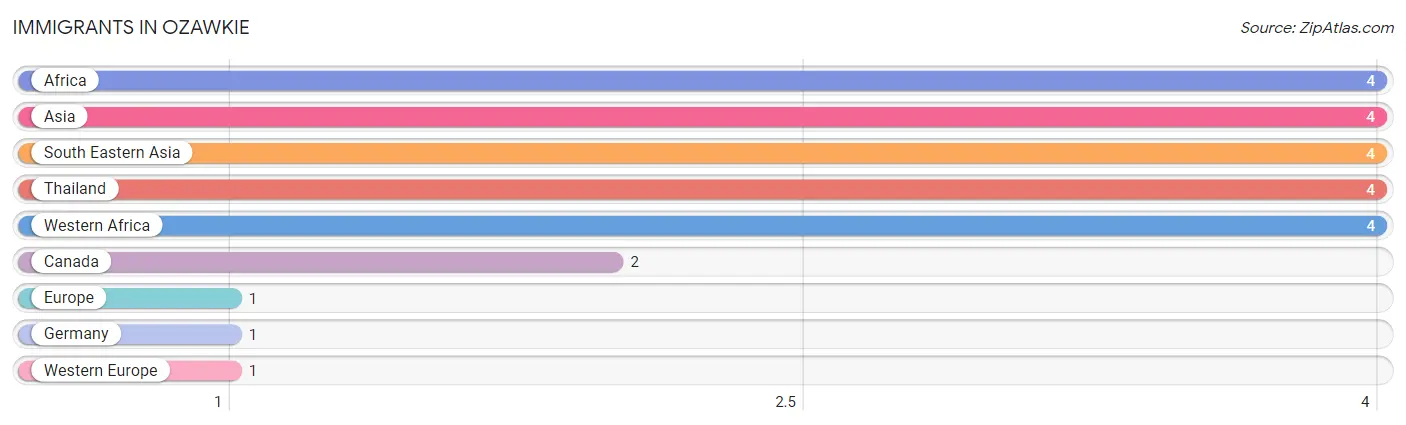
| Immigration Origin | # Population | % Population |
| Africa | 4 | 0.6% |
| Asia | 4 | 0.6% |
| Canada | 2 | 0.3% |
| Europe | 1 | 0.2% |
| Germany | 1 | 0.2% |
| South Eastern Asia | 4 | 0.6% |
| Thailand | 4 | 0.6% |
| Western Africa | 4 | 0.6% |
| Western Europe | 1 | 0.2% | View All 9 Rows |
Sex and Age in Ozawkie
Sex and Age in Ozawkie
The most populous age groups in Ozawkie are Under 5 Years (47 | 13.7%) for men and 55 to 59 Years (35 | 10.9%) for women.
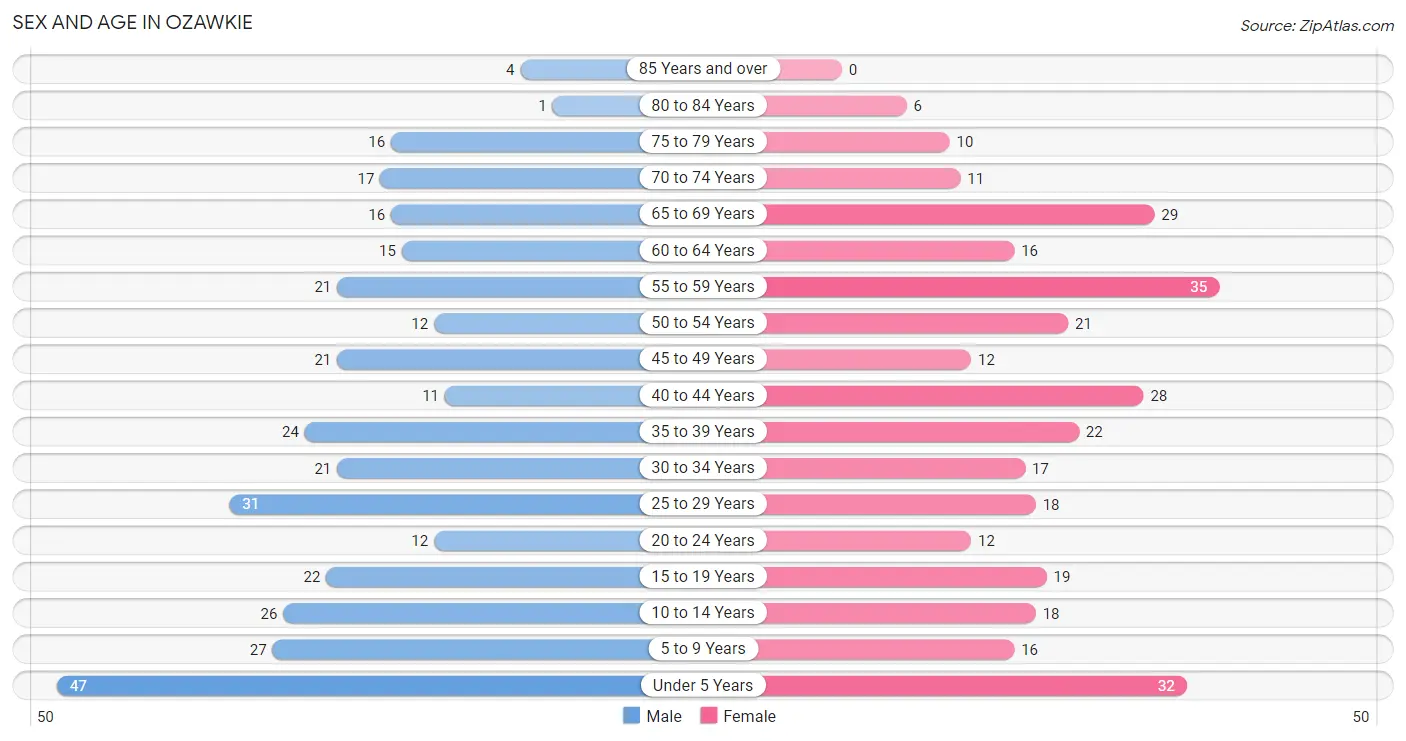
| Age Bracket | Male | Female |
| Under 5 Years | 47 (13.7%) | 32 (9.9%) |
| 5 to 9 Years | 27 (7.9%) | 16 (5.0%) |
| 10 to 14 Years | 26 (7.6%) | 18 (5.6%) |
| 15 to 19 Years | 22 (6.4%) | 19 (5.9%) |
| 20 to 24 Years | 12 (3.5%) | 12 (3.7%) |
| 25 to 29 Years | 31 (9.0%) | 18 (5.6%) |
| 30 to 34 Years | 21 (6.1%) | 17 (5.3%) |
| 35 to 39 Years | 24 (7.0%) | 22 (6.8%) |
| 40 to 44 Years | 11 (3.2%) | 28 (8.7%) |
| 45 to 49 Years | 21 (6.1%) | 12 (3.7%) |
| 50 to 54 Years | 12 (3.5%) | 21 (6.5%) |
| 55 to 59 Years | 21 (6.1%) | 35 (10.9%) |
| 60 to 64 Years | 15 (4.4%) | 16 (5.0%) |
| 65 to 69 Years | 16 (4.6%) | 29 (9.0%) |
| 70 to 74 Years | 17 (4.9%) | 11 (3.4%) |
| 75 to 79 Years | 16 (4.6%) | 10 (3.1%) |
| 80 to 84 Years | 1 (0.3%) | 6 (1.9%) |
| 85 Years and over | 4 (1.2%) | 0 (0.0%) |
| Total | 344 (100.0%) | 322 (100.0%) |
Families and Households in Ozawkie
Median Family Size in Ozawkie
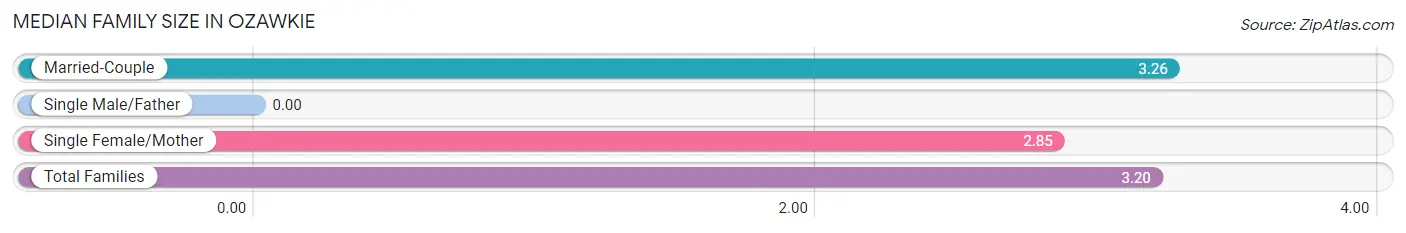
| Family Type | # Families | Family Size |
| Married-Couple | 157 (85.8%) | 3.26 |
| Single Male/Father | 0 (0.0%) | - |
| Single Female/Mother | 26 (14.2%) | 2.85 |
| Total Families | 183 (100.0%) | 3.20 |
Median Household Size in Ozawkie
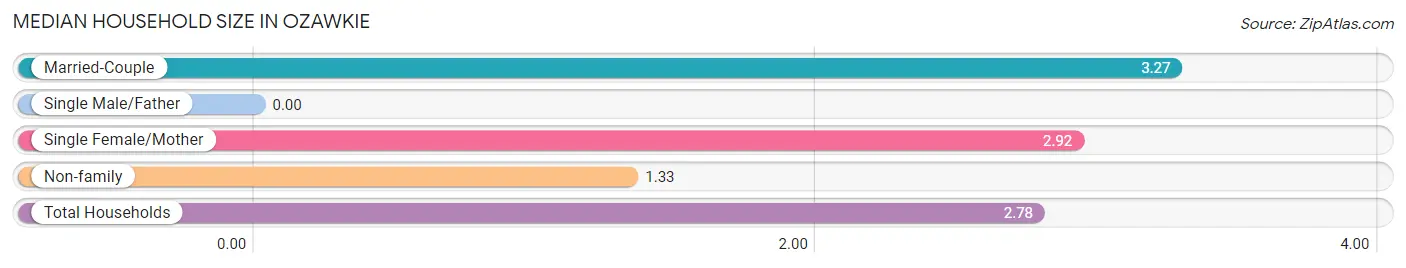
| Household Type | # Households | Household Size |
| Married-Couple | 157 (65.4%) | 3.27 |
| Single Male/Father | 0 (0.0%) | - |
| Single Female/Mother | 26 (10.8%) | 2.92 |
| Non-family | 57 (23.7%) | 1.33 |
| Total Households | 240 (100.0%) | 2.78 |
Household Size by Marriage Status in Ozawkie
Out of a total of 240 households in Ozawkie, 183 (76.2%) are family households, while 57 (23.7%) are nonfamily households. The most numerous type of family households are 2-person households, comprising 101, and the most common type of nonfamily households are 1-person households, comprising 37.
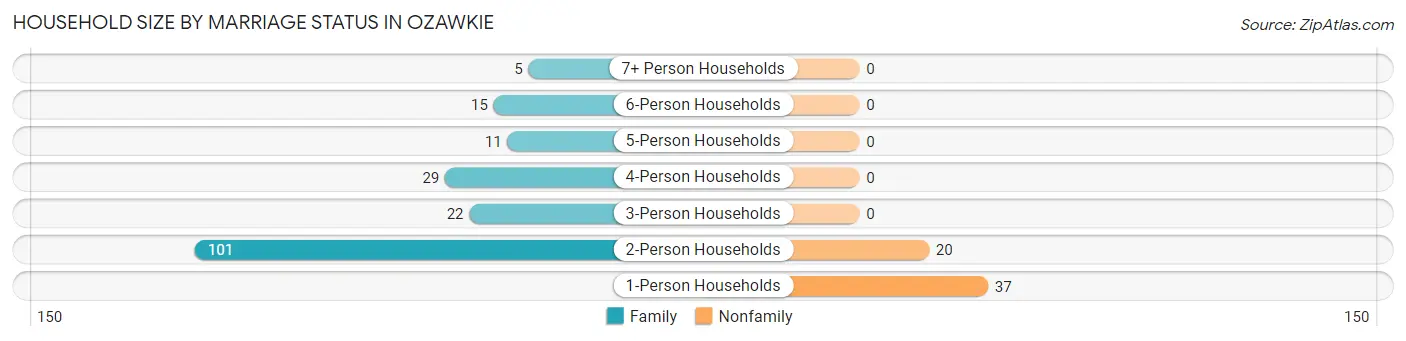
| Household Size | Family Households | Nonfamily Households |
| 1-Person Households | - | 37 (15.4%) |
| 2-Person Households | 101 (42.1%) | 20 (8.3%) |
| 3-Person Households | 22 (9.2%) | 0 (0.0%) |
| 4-Person Households | 29 (12.1%) | 0 (0.0%) |
| 5-Person Households | 11 (4.6%) | 0 (0.0%) |
| 6-Person Households | 15 (6.2%) | 0 (0.0%) |
| 7+ Person Households | 5 (2.1%) | 0 (0.0%) |
| Total | 183 (76.2%) | 57 (23.7%) |
Female Fertility in Ozawkie
Fertility by Age in Ozawkie
Average fertility rate in Ozawkie is 99.0 births per 1,000 women. Women in the age bracket of 20 to 34 years have the highest fertility rate with 191.0 births per 1,000 women. Women in the age bracket of 20 to 34 years acount for 69.2% of all women with births.
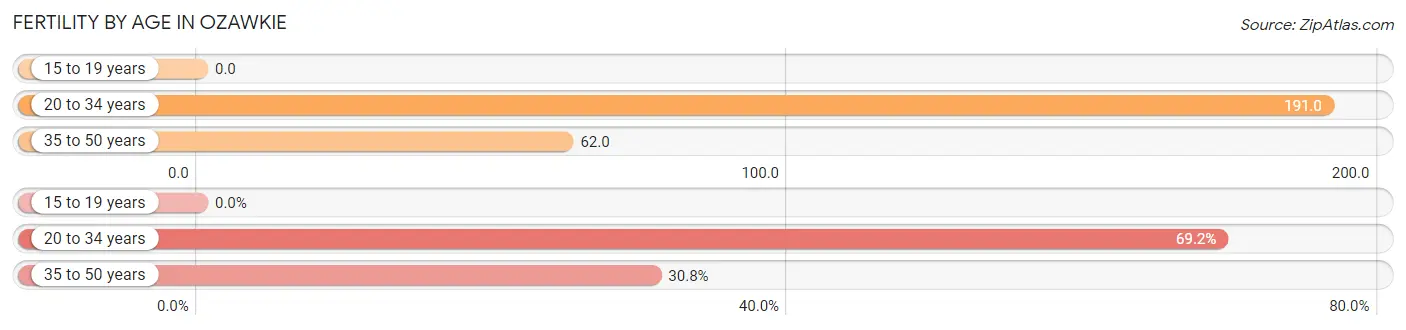
| Age Bracket | Women with Births | Births / 1,000 Women |
| 15 to 19 years | 0 (0.0%) | 0.0 |
| 20 to 34 years | 9 (69.2%) | 191.0 |
| 35 to 50 years | 4 (30.8%) | 62.0 |
| Total | 13 (100.0%) | 99.0 |
Fertility by Age by Marriage Status in Ozawkie
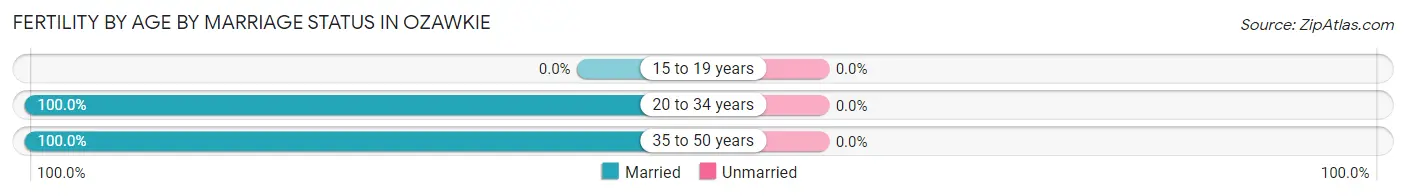
| Age Bracket | Married | Unmarried |
| 15 to 19 years | 0 (0.0%) | 0 (0.0%) |
| 20 to 34 years | 9 (100.0%) | 0 (0.0%) |
| 35 to 50 years | 4 (100.0%) | 0 (0.0%) |
| Total | 13 (100.0%) | 0 (0.0%) |
Fertility by Education in Ozawkie
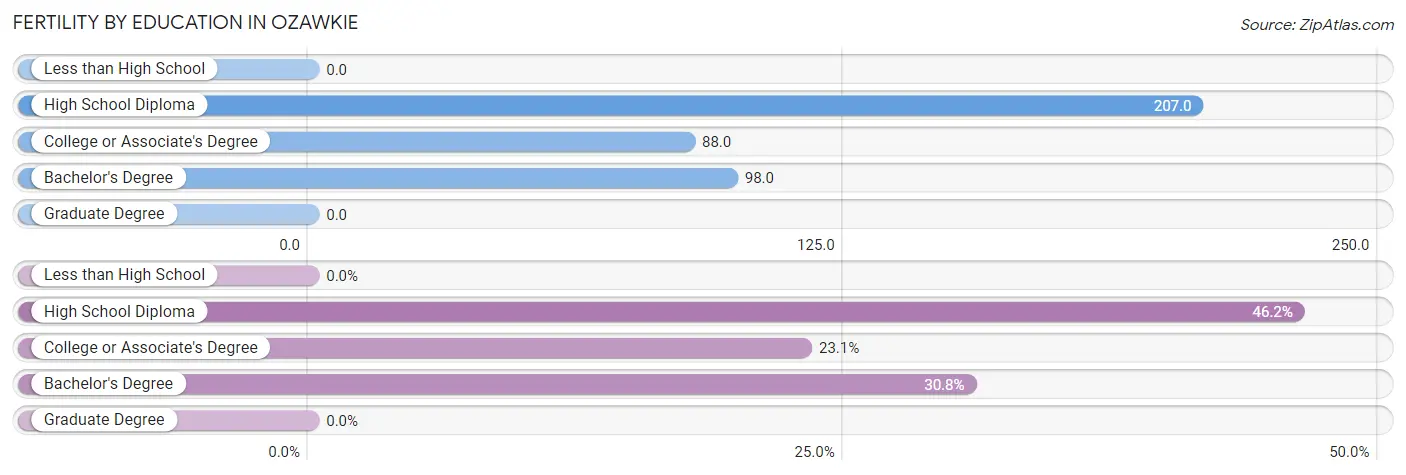
| Educational Attainment | Women with Births | Births / 1,000 Women |
| Less than High School | 0 (0.0%) | 0.0 |
| High School Diploma | 6 (46.2%) | 207.0 |
| College or Associate's Degree | 3 (23.1%) | 88.0 |
| Bachelor's Degree | 4 (30.8%) | 98.0 |
| Graduate Degree | 0 (0.0%) | 0.0 |
| Total | 13 (100.0%) | 99.0 |
Fertility by Education by Marriage Status in Ozawkie
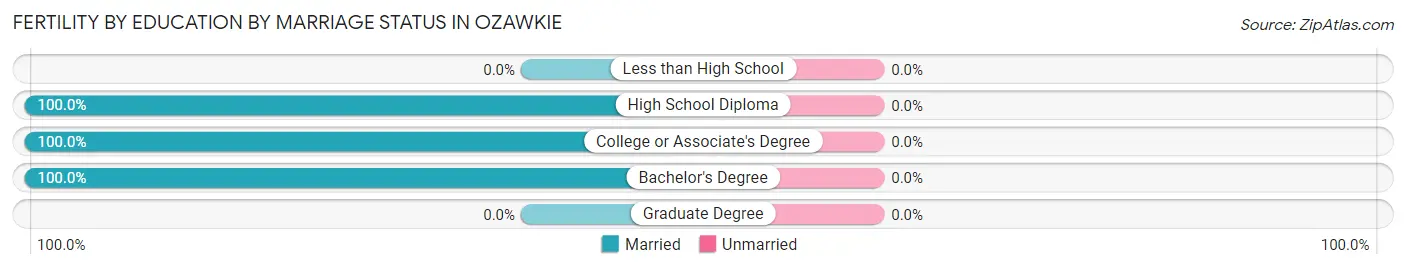
| Educational Attainment | Married | Unmarried |
| Less than High School | 0 (0.0%) | 0 (0.0%) |
| High School Diploma | 6 (100.0%) | 0 (0.0%) |
| College or Associate's Degree | 3 (100.0%) | 0 (0.0%) |
| Bachelor's Degree | 4 (100.0%) | 0 (0.0%) |
| Graduate Degree | 0 (0.0%) | 0 (0.0%) |
| Total | 13 (100.0%) | 0 (0.0%) |
Employment Characteristics in Ozawkie
Employment by Class of Employer in Ozawkie
Among the 310 employed individuals in Ozawkie, private company employees (205 | 66.1%), local government employees (44 | 14.2%), and not-for-profit organizations (25 | 8.1%) make up the most common classes of employment.
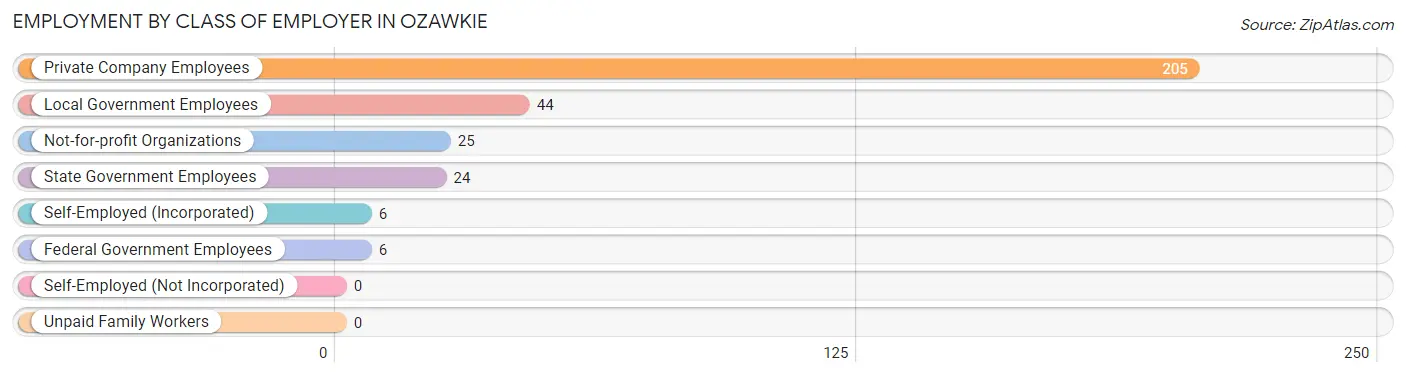
| Employer Class | # Employees | % Employees |
| Private Company Employees | 205 | 66.1% |
| Self-Employed (Incorporated) | 6 | 1.9% |
| Self-Employed (Not Incorporated) | 0 | 0.0% |
| Not-for-profit Organizations | 25 | 8.1% |
| Local Government Employees | 44 | 14.2% |
| State Government Employees | 24 | 7.7% |
| Federal Government Employees | 6 | 1.9% |
| Unpaid Family Workers | 0 | 0.0% |
| Total | 310 | 100.0% |
Employment Status by Age in Ozawkie
According to the labor force statistics for Ozawkie, out of the total population over 16 years of age (496), 63.5% or 315 individuals are in the labor force, with 1.0% or 3 of them unemployed. The age group with the highest labor force participation rate is 55 to 59 years, with 96.4% or 54 individuals in the labor force. Within the labor force, the 45 to 54 years age range has the highest percentage of unemployed individuals, with 4.8% or 3 of them being unemployed.
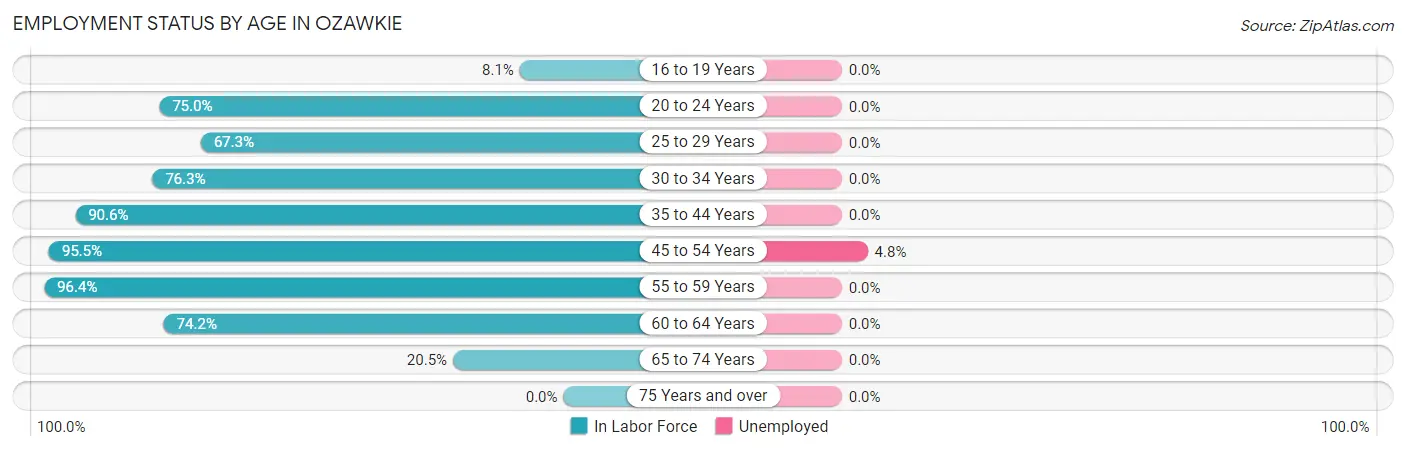
| Age Bracket | In Labor Force | Unemployed |
| 16 to 19 Years | 3 (8.1%) | 0 (0.0%) |
| 20 to 24 Years | 18 (75.0%) | 0 (0.0%) |
| 25 to 29 Years | 33 (67.3%) | 0 (0.0%) |
| 30 to 34 Years | 29 (76.3%) | 0 (0.0%) |
| 35 to 44 Years | 77 (90.6%) | 0 (0.0%) |
| 45 to 54 Years | 63 (95.5%) | 3 (4.8%) |
| 55 to 59 Years | 54 (96.4%) | 0 (0.0%) |
| 60 to 64 Years | 23 (74.2%) | 0 (0.0%) |
| 65 to 74 Years | 15 (20.5%) | 0 (0.0%) |
| 75 Years and over | 0 (0.0%) | 0 (0.0%) |
| Total | 315 (63.5%) | 3 (1.0%) |
Employment Status by Educational Attainment in Ozawkie
According to labor force statistics for Ozawkie, 85.8% of individuals (279) out of the total population between 25 and 64 years of age (325) are in the labor force, with 1.1% or 3 of them being unemployed. The group with the highest labor force participation rate are those with the educational attainment of less than high school, with 100.0% or 1 individuals in the labor force. Within the labor force, individuals with college / associate degree education have the highest percentage of unemployment, with 2.6% or 3 of them being unemployed.
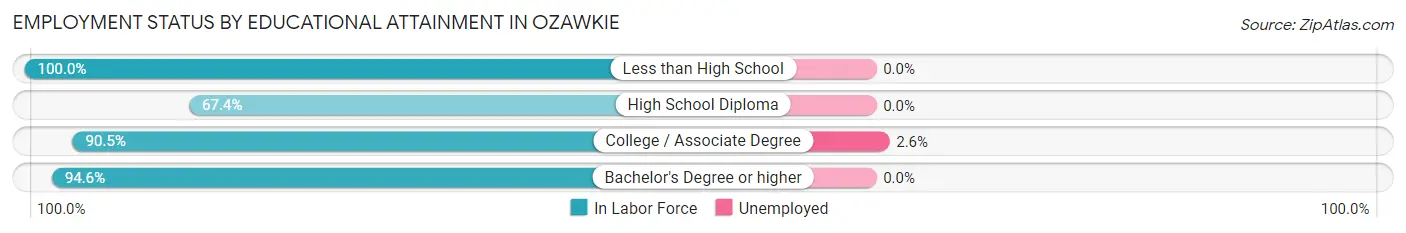
| Educational Attainment | In Labor Force | Unemployed |
| Less than High School | 1 (100.0%) | 0 (0.0%) |
| High School Diploma | 58 (67.4%) | 0 (0.0%) |
| College / Associate Degree | 114 (90.5%) | 3 (2.6%) |
| Bachelor's Degree or higher | 106 (94.6%) | 0 (0.0%) |
| Total | 279 (85.8%) | 4 (1.1%) |
Employment Occupations by Sex in Ozawkie
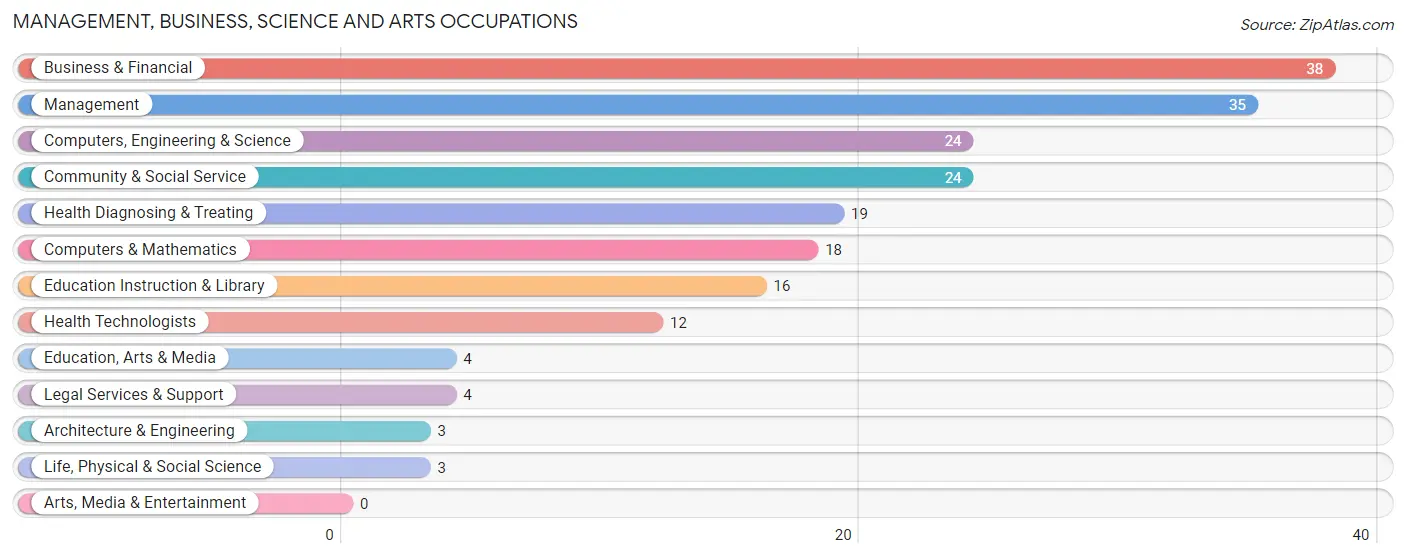
Management, Business, Science and Arts Occupations
The most common Management, Business, Science and Arts occupations in Ozawkie are Business & Financial (38 | 12.2%), Management (35 | 11.2%), Computers, Engineering & Science (24 | 7.7%), Community & Social Service (24 | 7.7%), and Health Diagnosing & Treating (19 | 6.1%).
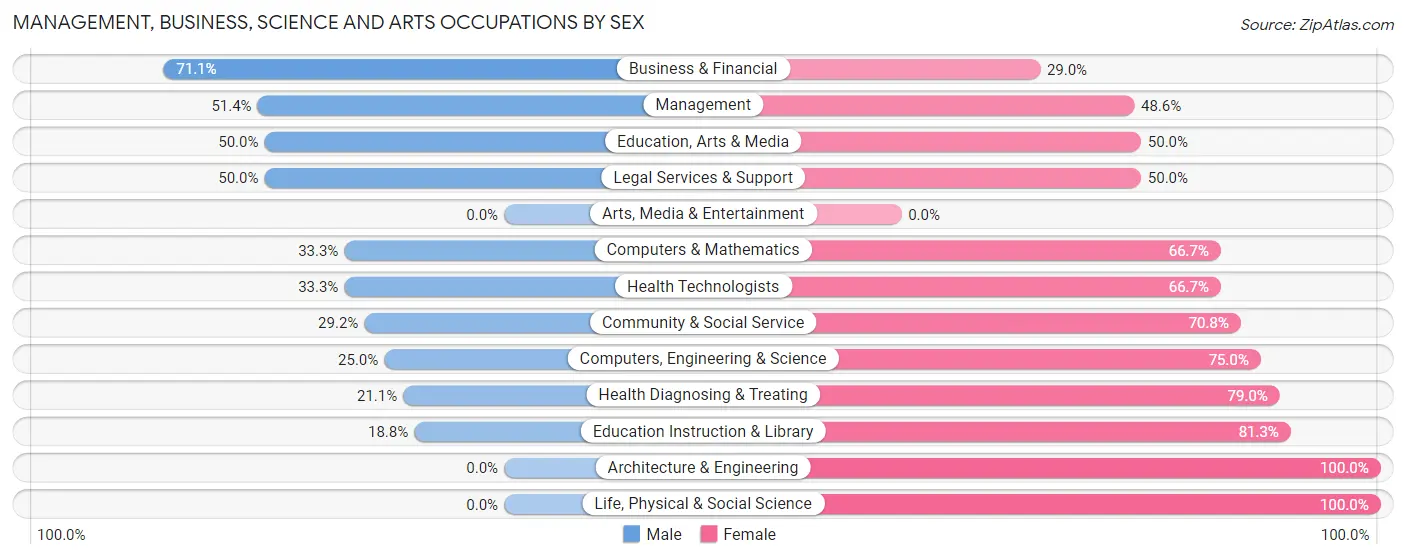
Management, Business, Science and Arts Occupations by Sex
Within the Management, Business, Science and Arts occupations in Ozawkie, the most male-oriented occupations are Business & Financial (71.1%), Management (51.4%), and Education, Arts & Media (50.0%), while the most female-oriented occupations are Architecture & Engineering (100.0%), Life, Physical & Social Science (100.0%), and Education Instruction & Library (81.2%).
| Occupation | Male | Female |
| Management | 18 (51.4%) | 17 (48.6%) |
| Business & Financial | 27 (71.1%) | 11 (28.9%) |
| Computers, Engineering & Science | 6 (25.0%) | 18 (75.0%) |
| Computers & Mathematics | 6 (33.3%) | 12 (66.7%) |
| Architecture & Engineering | 0 (0.0%) | 3 (100.0%) |
| Life, Physical & Social Science | 0 (0.0%) | 3 (100.0%) |
| Community & Social Service | 7 (29.2%) | 17 (70.8%) |
| Education, Arts & Media | 2 (50.0%) | 2 (50.0%) |
| Legal Services & Support | 2 (50.0%) | 2 (50.0%) |
| Education Instruction & Library | 3 (18.8%) | 13 (81.2%) |
| Arts, Media & Entertainment | 0 (0.0%) | 0 (0.0%) |
| Health Diagnosing & Treating | 4 (21.0%) | 15 (78.9%) |
| Health Technologists | 4 (33.3%) | 8 (66.7%) |
| Total (Category) | 62 (44.3%) | 78 (55.7%) |
| Total (Overall) | 156 (50.0%) | 156 (50.0%) |
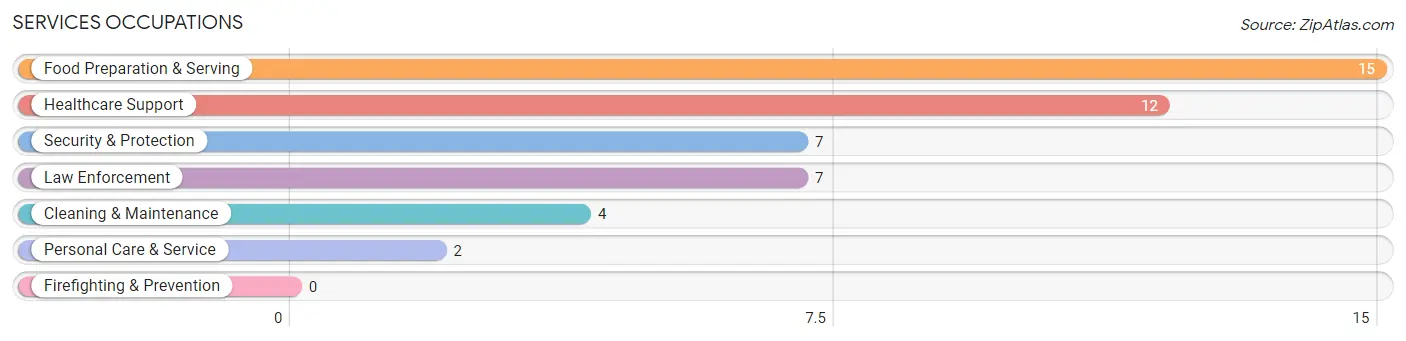
Services Occupations
The most common Services occupations in Ozawkie are Food Preparation & Serving (15 | 4.8%), Healthcare Support (12 | 3.8%), Security & Protection (7 | 2.2%), Law Enforcement (7 | 2.2%), and Cleaning & Maintenance (4 | 1.3%).
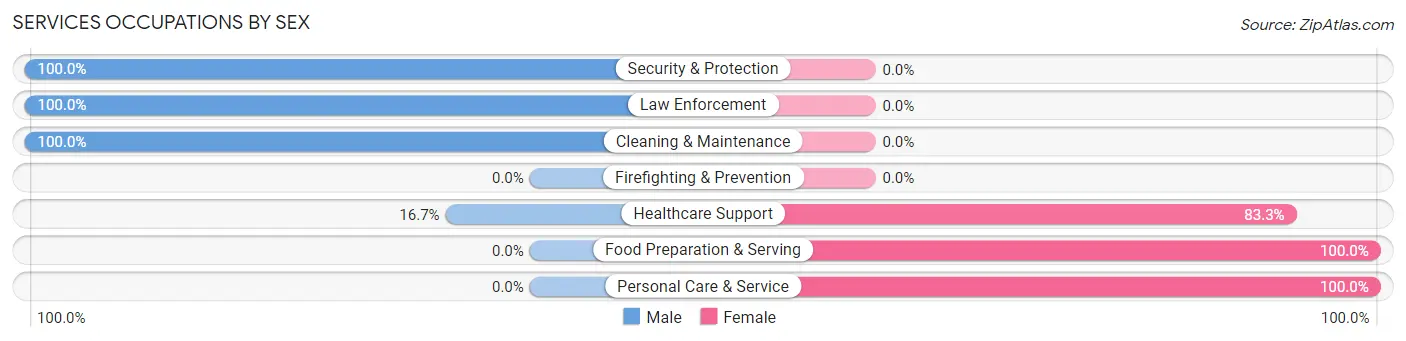
Services Occupations by Sex
Within the Services occupations in Ozawkie, the most male-oriented occupations are Security & Protection (100.0%), Law Enforcement (100.0%), and Cleaning & Maintenance (100.0%), while the most female-oriented occupations are Food Preparation & Serving (100.0%), Personal Care & Service (100.0%), and Healthcare Support (83.3%).
| Occupation | Male | Female |
| Healthcare Support | 2 (16.7%) | 10 (83.3%) |
| Security & Protection | 7 (100.0%) | 0 (0.0%) |
| Firefighting & Prevention | 0 (0.0%) | 0 (0.0%) |
| Law Enforcement | 7 (100.0%) | 0 (0.0%) |
| Food Preparation & Serving | 0 (0.0%) | 15 (100.0%) |
| Cleaning & Maintenance | 4 (100.0%) | 0 (0.0%) |
| Personal Care & Service | 0 (0.0%) | 2 (100.0%) |
| Total (Category) | 13 (32.5%) | 27 (67.5%) |
| Total (Overall) | 156 (50.0%) | 156 (50.0%) |
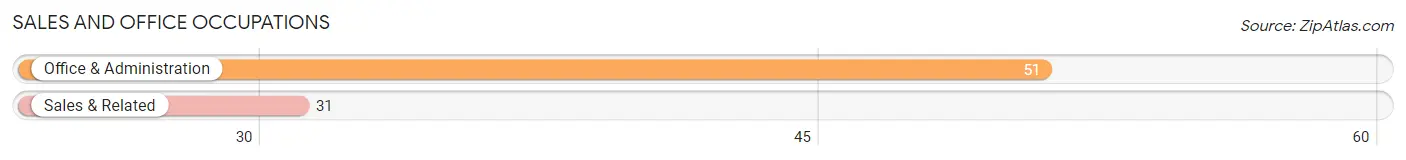
Sales and Office Occupations
The most common Sales and Office occupations in Ozawkie are Office & Administration (51 | 16.4%), and Sales & Related (31 | 9.9%).
Sales and Office Occupations by Sex
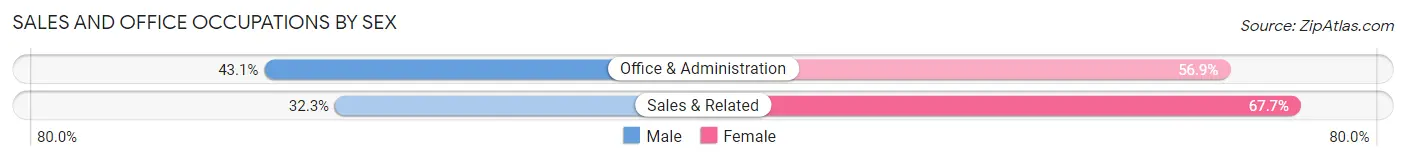
| Occupation | Male | Female |
| Sales & Related | 10 (32.3%) | 21 (67.7%) |
| Office & Administration | 22 (43.1%) | 29 (56.9%) |
| Total (Category) | 32 (39.0%) | 50 (61.0%) |
| Total (Overall) | 156 (50.0%) | 156 (50.0%) |
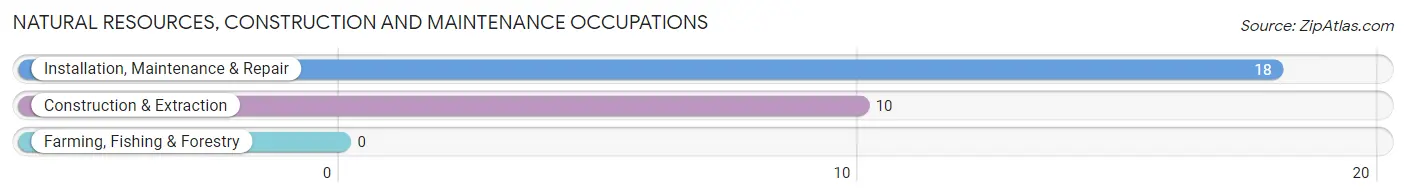
Natural Resources, Construction and Maintenance Occupations
The most common Natural Resources, Construction and Maintenance occupations in Ozawkie are Installation, Maintenance & Repair (18 | 5.8%), and Construction & Extraction (10 | 3.2%).
Natural Resources, Construction and Maintenance Occupations by Sex
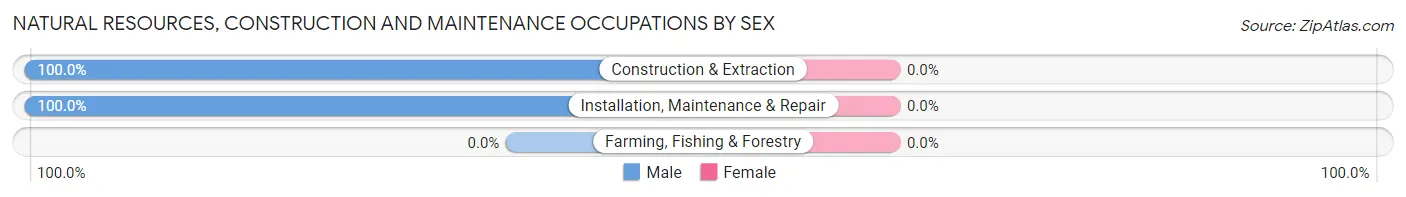
| Occupation | Male | Female |
| Farming, Fishing & Forestry | 0 (0.0%) | 0 (0.0%) |
| Construction & Extraction | 10 (100.0%) | 0 (0.0%) |
| Installation, Maintenance & Repair | 18 (100.0%) | 0 (0.0%) |
| Total (Category) | 28 (100.0%) | 0 (0.0%) |
| Total (Overall) | 156 (50.0%) | 156 (50.0%) |
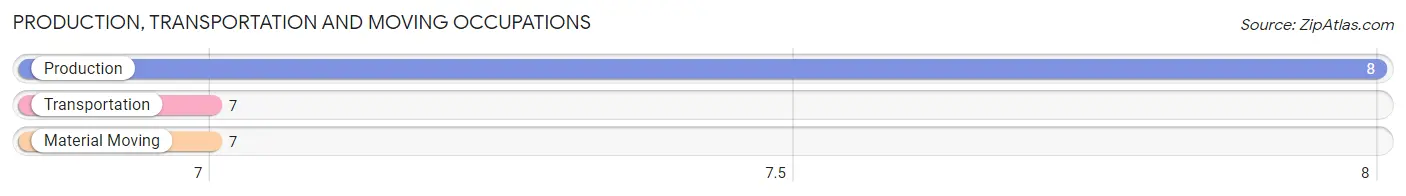
Production, Transportation and Moving Occupations
The most common Production, Transportation and Moving occupations in Ozawkie are Production (8 | 2.6%), Transportation (7 | 2.2%), and Material Moving (7 | 2.2%).
Production, Transportation and Moving Occupations by Sex
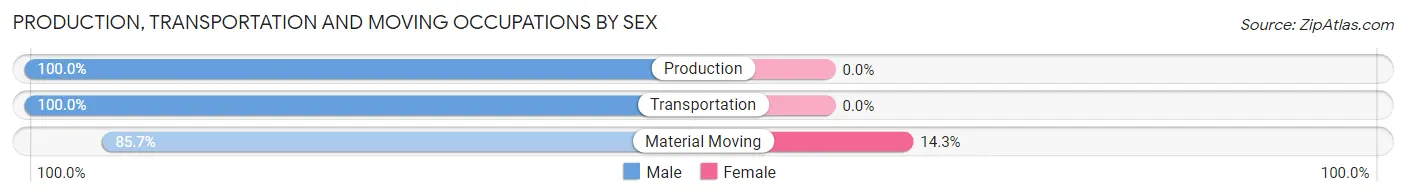
| Occupation | Male | Female |
| Production | 8 (100.0%) | 0 (0.0%) |
| Transportation | 7 (100.0%) | 0 (0.0%) |
| Material Moving | 6 (85.7%) | 1 (14.3%) |
| Total (Category) | 21 (95.5%) | 1 (4.5%) |
| Total (Overall) | 156 (50.0%) | 156 (50.0%) |
Employment Industries by Sex in Ozawkie
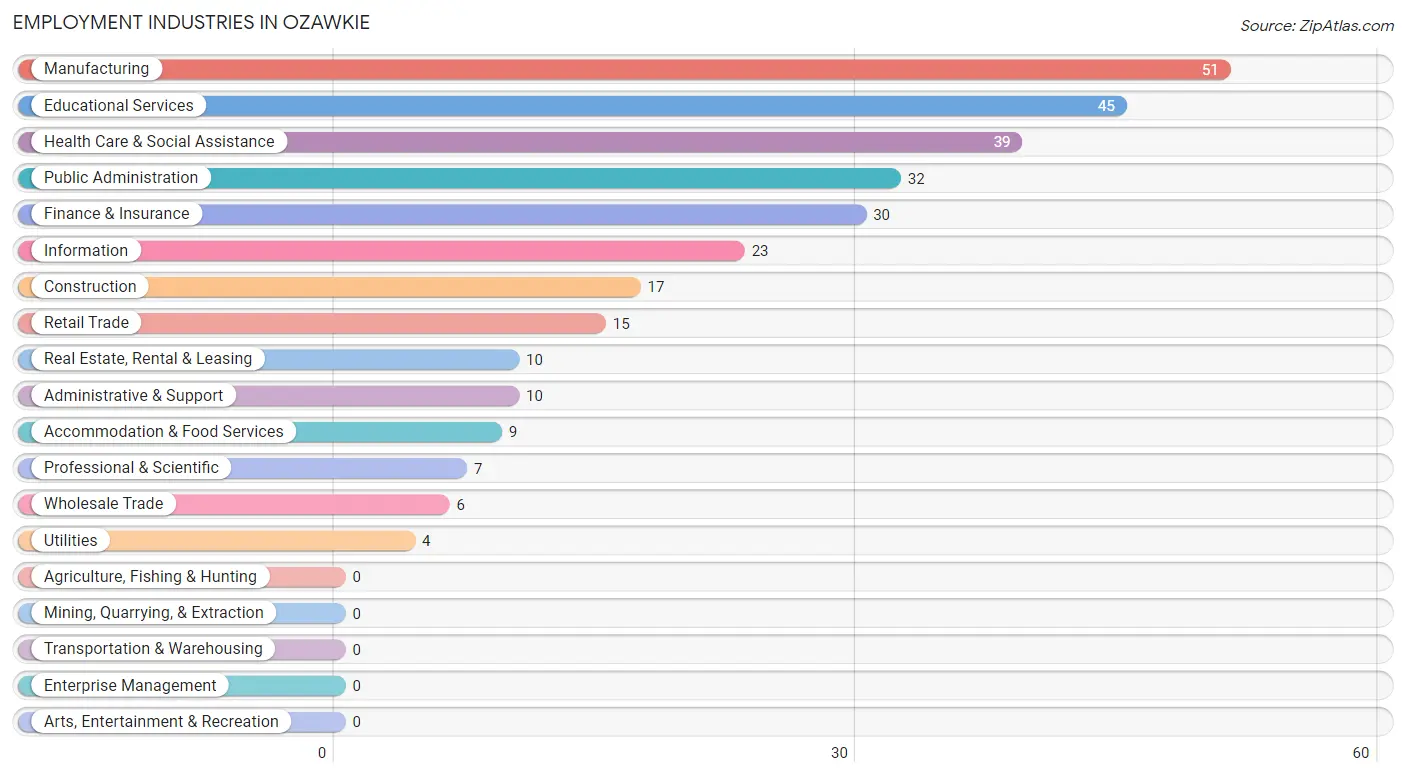
Employment Industries in Ozawkie
The major employment industries in Ozawkie include Manufacturing (51 | 16.4%), Educational Services (45 | 14.4%), Health Care & Social Assistance (39 | 12.5%), Public Administration (32 | 10.3%), and Finance & Insurance (30 | 9.6%).
Employment Industries by Sex in Ozawkie
The Ozawkie industries that see more men than women are Wholesale Trade (100.0%), Utilities (100.0%), and Administrative & Support (100.0%), whereas the industries that tend to have a higher number of women are Professional & Scientific (100.0%), Accommodation & Food Services (100.0%), and Retail Trade (80.0%).
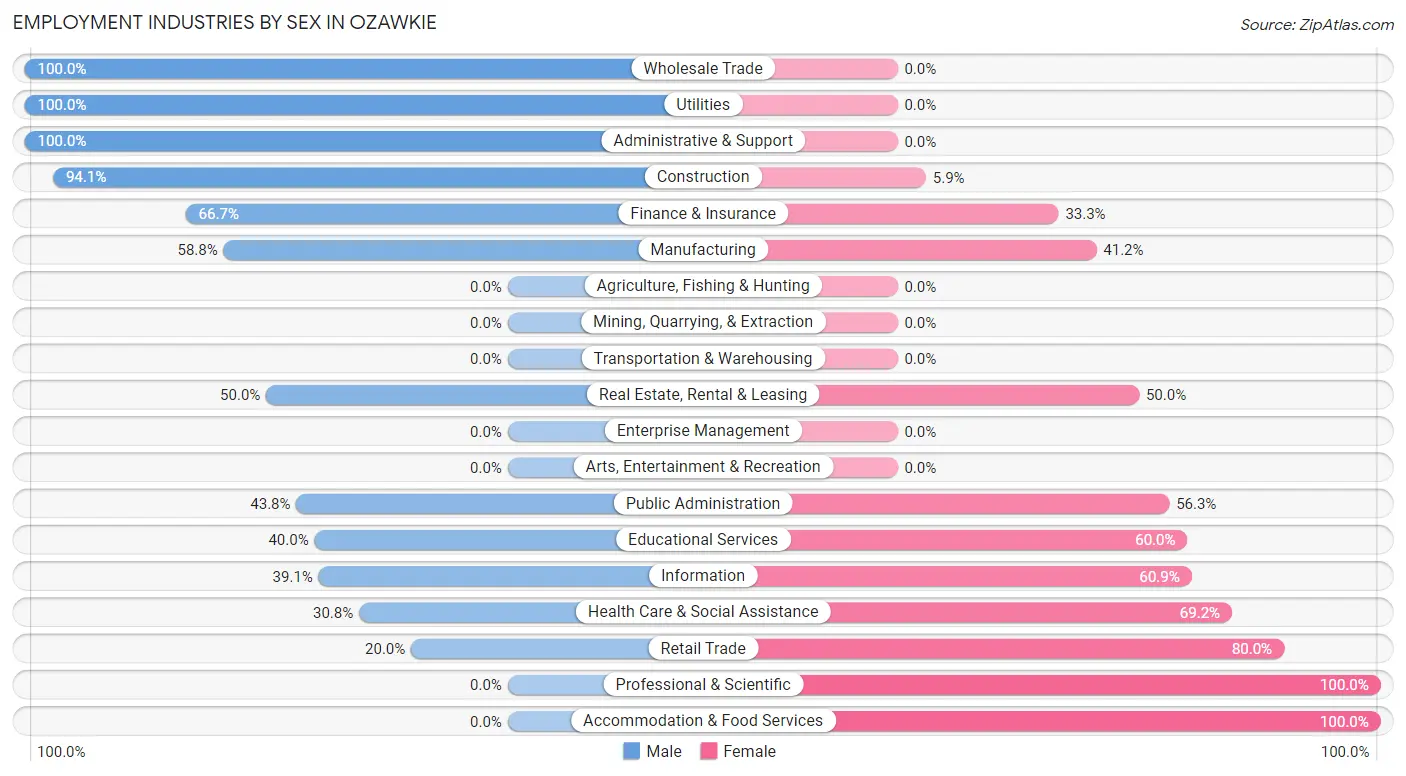
| Industry | Male | Female |
| Agriculture, Fishing & Hunting | 0 (0.0%) | 0 (0.0%) |
| Mining, Quarrying, & Extraction | 0 (0.0%) | 0 (0.0%) |
| Construction | 16 (94.1%) | 1 (5.9%) |
| Manufacturing | 30 (58.8%) | 21 (41.2%) |
| Wholesale Trade | 6 (100.0%) | 0 (0.0%) |
| Retail Trade | 3 (20.0%) | 12 (80.0%) |
| Transportation & Warehousing | 0 (0.0%) | 0 (0.0%) |
| Utilities | 4 (100.0%) | 0 (0.0%) |
| Information | 9 (39.1%) | 14 (60.9%) |
| Finance & Insurance | 20 (66.7%) | 10 (33.3%) |
| Real Estate, Rental & Leasing | 5 (50.0%) | 5 (50.0%) |
| Professional & Scientific | 0 (0.0%) | 7 (100.0%) |
| Enterprise Management | 0 (0.0%) | 0 (0.0%) |
| Administrative & Support | 10 (100.0%) | 0 (0.0%) |
| Educational Services | 18 (40.0%) | 27 (60.0%) |
| Health Care & Social Assistance | 12 (30.8%) | 27 (69.2%) |
| Arts, Entertainment & Recreation | 0 (0.0%) | 0 (0.0%) |
| Accommodation & Food Services | 0 (0.0%) | 9 (100.0%) |
| Public Administration | 14 (43.8%) | 18 (56.2%) |
| Total | 156 (50.0%) | 156 (50.0%) |
Education in Ozawkie
School Enrollment in Ozawkie
The most common levels of schooling among the 117 students in Ozawkie are elementary school (30 | 25.6%), middle school (30 | 25.6%), and high school (30 | 25.6%).
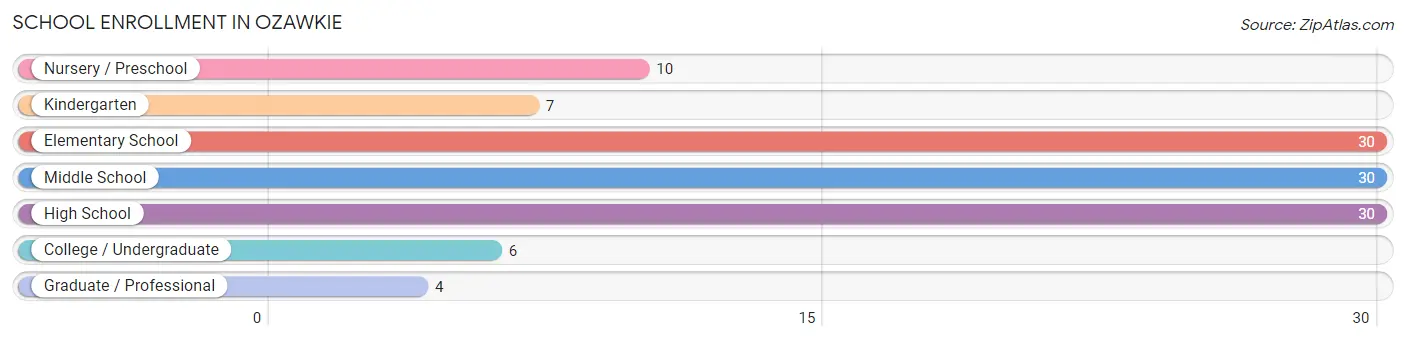
| School Level | # Students | % Students |
| Nursery / Preschool | 10 | 8.6% |
| Kindergarten | 7 | 6.0% |
| Elementary School | 30 | 25.6% |
| Middle School | 30 | 25.6% |
| High School | 30 | 25.6% |
| College / Undergraduate | 6 | 5.1% |
| Graduate / Professional | 4 | 3.4% |
| Total | 117 | 100.0% |
School Enrollment by Age by Funding Source in Ozawkie
Out of a total of 117 students who are enrolled in schools in Ozawkie, 2 (1.7%) attend a private institution, while the remaining 115 (98.3%) are enrolled in public schools. The age group of 10 to 14 year olds has the highest likelihood of being enrolled in private schools, with 2 (4.9% in the age bracket) enrolled. Conversely, the age group of 3 to 4 year olds has the lowest likelihood of being enrolled in a private school, with 6 (100.0% in the age bracket) attending a public institution.
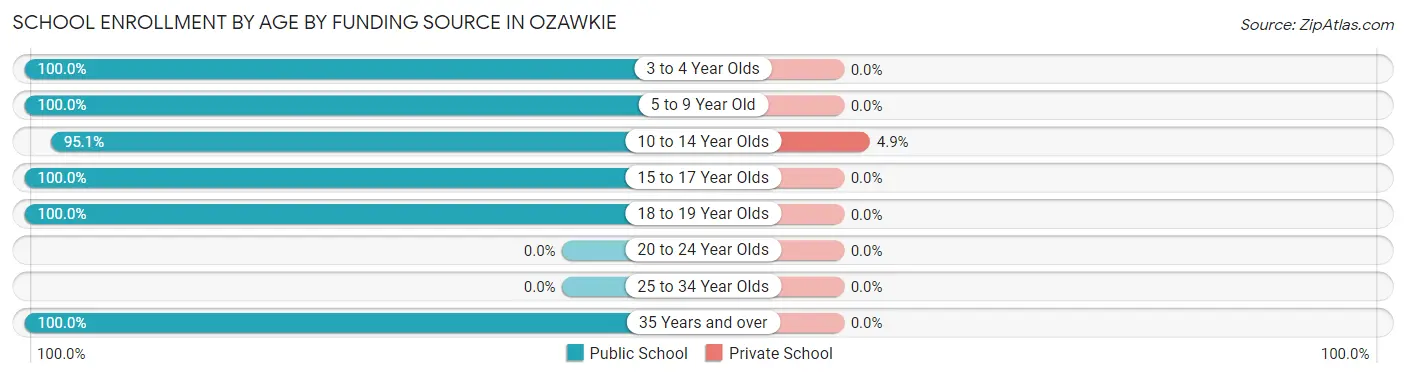
| Age Bracket | Public School | Private School |
| 3 to 4 Year Olds | 6 (100.0%) | 0 (0.0%) |
| 5 to 9 Year Old | 34 (100.0%) | 0 (0.0%) |
| 10 to 14 Year Olds | 39 (95.1%) | 2 (4.9%) |
| 15 to 17 Year Olds | 24 (100.0%) | 0 (0.0%) |
| 18 to 19 Year Olds | 2 (100.0%) | 0 (0.0%) |
| 20 to 24 Year Olds | 0 (0.0%) | 0 (0.0%) |
| 25 to 34 Year Olds | 0 (0.0%) | 0 (0.0%) |
| 35 Years and over | 10 (100.0%) | 0 (0.0%) |
| Total | 115 (98.3%) | 2 (1.7%) |
Educational Attainment by Field of Study in Ozawkie
Business (51 | 32.7%), education (24 | 15.4%), bio, nature & agricultural (19 | 12.2%), science & technology (17 | 10.9%), and visual & performing arts (12 | 7.7%) are the most common fields of study among 156 individuals in Ozawkie who have obtained a bachelor's degree or higher.
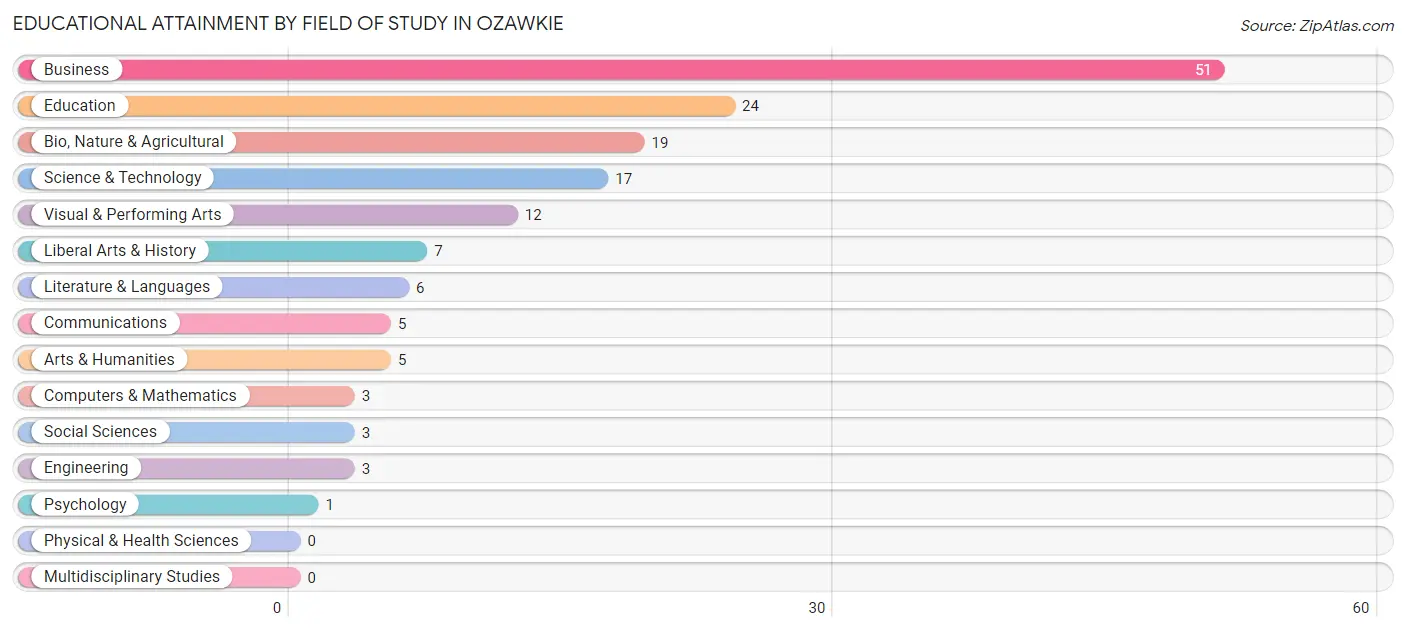
| Field of Study | # Graduates | % Graduates |
| Computers & Mathematics | 3 | 1.9% |
| Bio, Nature & Agricultural | 19 | 12.2% |
| Physical & Health Sciences | 0 | 0.0% |
| Psychology | 1 | 0.6% |
| Social Sciences | 3 | 1.9% |
| Engineering | 3 | 1.9% |
| Multidisciplinary Studies | 0 | 0.0% |
| Science & Technology | 17 | 10.9% |
| Business | 51 | 32.7% |
| Education | 24 | 15.4% |
| Literature & Languages | 6 | 3.8% |
| Liberal Arts & History | 7 | 4.5% |
| Visual & Performing Arts | 12 | 7.7% |
| Communications | 5 | 3.2% |
| Arts & Humanities | 5 | 3.2% |
| Total | 156 | 100.0% |
Transportation & Commute in Ozawkie
Vehicle Availability by Sex in Ozawkie
The most prevalent vehicle ownership categories in Ozawkie are males with 2 vehicles (61, accounting for 39.6%) and females with 2 vehicles (69, making up 39.1%).
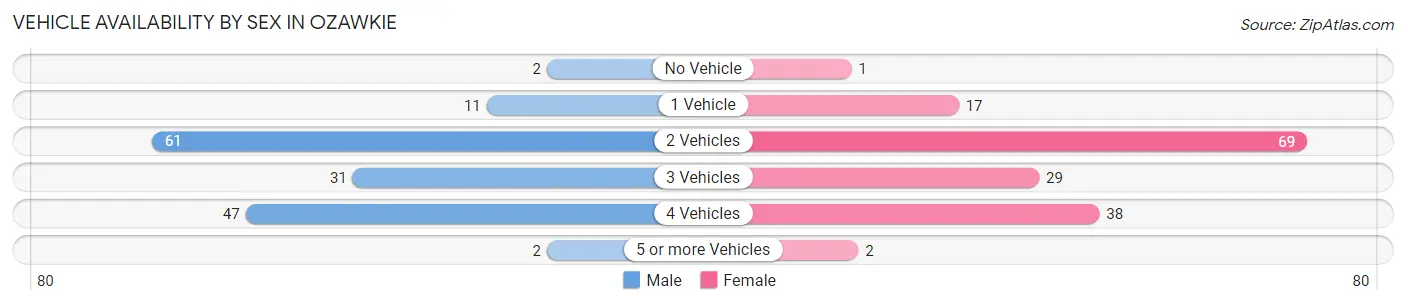
| Vehicles Available | Male | Female |
| No Vehicle | 2 (1.3%) | 1 (0.6%) |
| 1 Vehicle | 11 (7.1%) | 17 (10.9%) |
| 2 Vehicles | 61 (39.6%) | 69 (44.2%) |
| 3 Vehicles | 31 (20.1%) | 29 (18.6%) |
| 4 Vehicles | 47 (30.5%) | 38 (24.4%) |
| 5 or more Vehicles | 2 (1.3%) | 2 (1.3%) |
| Total | 154 (100.0%) | 156 (100.0%) |
Commute Time in Ozawkie
The most frequently occuring commute durations in Ozawkie are 30 to 34 minutes (57 commuters, 22.0%), 10 to 14 minutes (44 commuters, 17.0%), and 60 to 89 minutes (42 commuters, 16.2%).
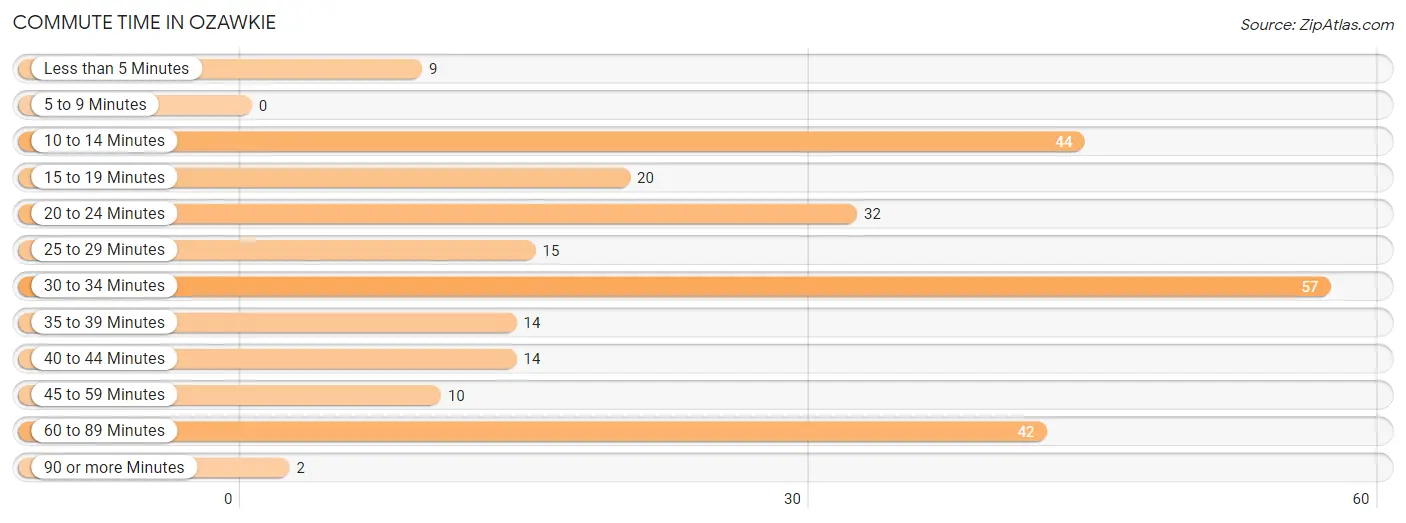
| Commute Time | # Commuters | % Commuters |
| Less than 5 Minutes | 9 | 3.5% |
| 5 to 9 Minutes | 0 | 0.0% |
| 10 to 14 Minutes | 44 | 17.0% |
| 15 to 19 Minutes | 20 | 7.7% |
| 20 to 24 Minutes | 32 | 12.4% |
| 25 to 29 Minutes | 15 | 5.8% |
| 30 to 34 Minutes | 57 | 22.0% |
| 35 to 39 Minutes | 14 | 5.4% |
| 40 to 44 Minutes | 14 | 5.4% |
| 45 to 59 Minutes | 10 | 3.9% |
| 60 to 89 Minutes | 42 | 16.2% |
| 90 or more Minutes | 2 | 0.8% |
Commute Time by Sex in Ozawkie
The most common commute times in Ozawkie are 10 to 14 minutes (24 commuters, 18.8%) for males and 30 to 34 minutes (36 commuters, 27.5%) for females.
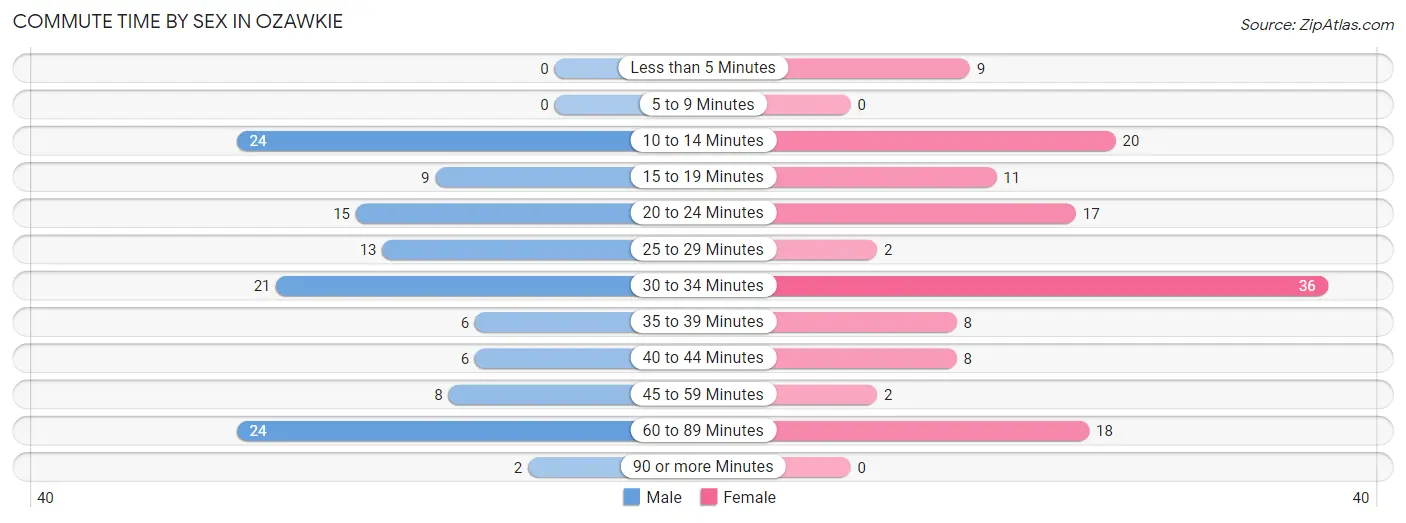
| Commute Time | Male | Female |
| Less than 5 Minutes | 0 (0.0%) | 9 (6.9%) |
| 5 to 9 Minutes | 0 (0.0%) | 0 (0.0%) |
| 10 to 14 Minutes | 24 (18.8%) | 20 (15.3%) |
| 15 to 19 Minutes | 9 (7.0%) | 11 (8.4%) |
| 20 to 24 Minutes | 15 (11.7%) | 17 (13.0%) |
| 25 to 29 Minutes | 13 (10.2%) | 2 (1.5%) |
| 30 to 34 Minutes | 21 (16.4%) | 36 (27.5%) |
| 35 to 39 Minutes | 6 (4.7%) | 8 (6.1%) |
| 40 to 44 Minutes | 6 (4.7%) | 8 (6.1%) |
| 45 to 59 Minutes | 8 (6.2%) | 2 (1.5%) |
| 60 to 89 Minutes | 24 (18.8%) | 18 (13.7%) |
| 90 or more Minutes | 2 (1.6%) | 0 (0.0%) |
Time of Departure to Work by Sex in Ozawkie
The most frequent times of departure to work in Ozawkie are 6:00 AM to 6:29 AM (34, 26.6%) for males and 7:00 AM to 7:29 AM (43, 32.8%) for females.
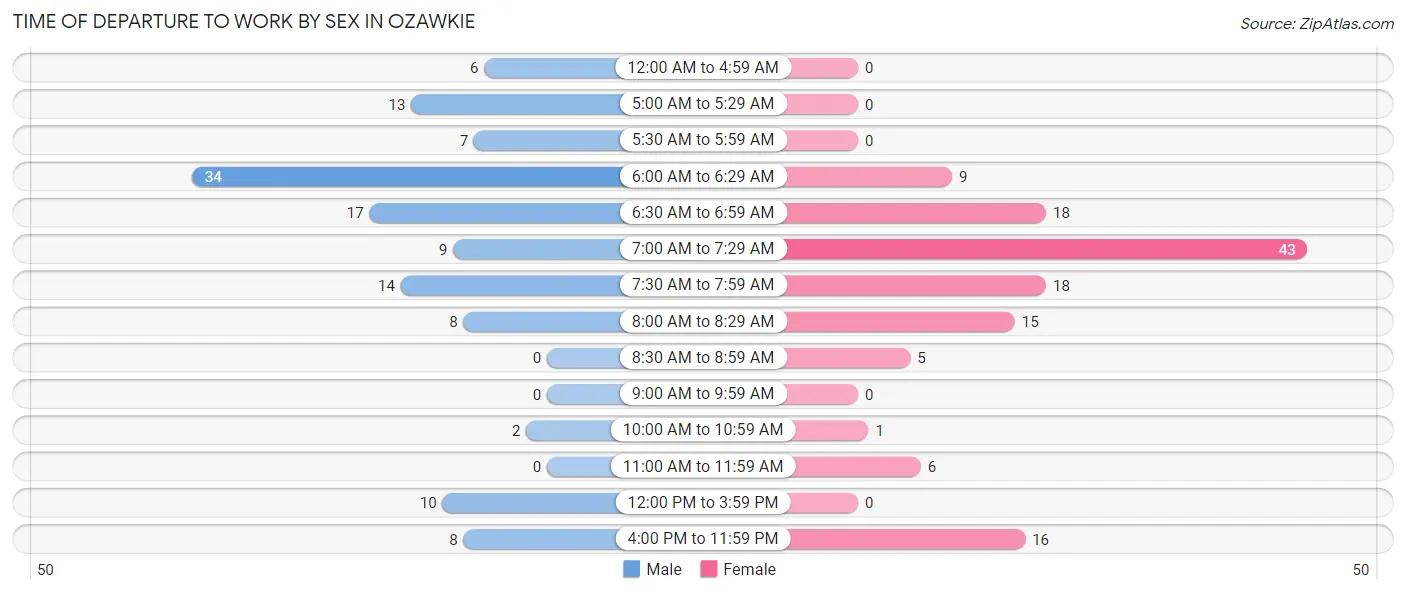
| Time of Departure | Male | Female |
| 12:00 AM to 4:59 AM | 6 (4.7%) | 0 (0.0%) |
| 5:00 AM to 5:29 AM | 13 (10.2%) | 0 (0.0%) |
| 5:30 AM to 5:59 AM | 7 (5.5%) | 0 (0.0%) |
| 6:00 AM to 6:29 AM | 34 (26.6%) | 9 (6.9%) |
| 6:30 AM to 6:59 AM | 17 (13.3%) | 18 (13.7%) |
| 7:00 AM to 7:29 AM | 9 (7.0%) | 43 (32.8%) |
| 7:30 AM to 7:59 AM | 14 (10.9%) | 18 (13.7%) |
| 8:00 AM to 8:29 AM | 8 (6.2%) | 15 (11.5%) |
| 8:30 AM to 8:59 AM | 0 (0.0%) | 5 (3.8%) |
| 9:00 AM to 9:59 AM | 0 (0.0%) | 0 (0.0%) |
| 10:00 AM to 10:59 AM | 2 (1.6%) | 1 (0.8%) |
| 11:00 AM to 11:59 AM | 0 (0.0%) | 6 (4.6%) |
| 12:00 PM to 3:59 PM | 10 (7.8%) | 0 (0.0%) |
| 4:00 PM to 11:59 PM | 8 (6.2%) | 16 (12.2%) |
| Total | 128 (100.0%) | 131 (100.0%) |
Housing Occupancy in Ozawkie
Occupancy by Ownership in Ozawkie
Of the total 240 dwellings in Ozawkie, owner-occupied units account for 222 (92.5%), while renter-occupied units make up 18 (7.5%).
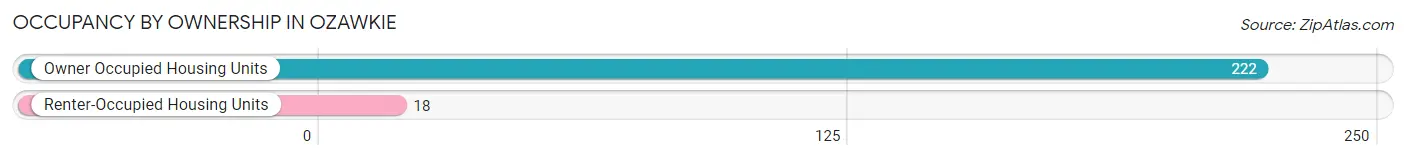
| Occupancy | # Housing Units | % Housing Units |
| Owner Occupied Housing Units | 222 | 92.5% |
| Renter-Occupied Housing Units | 18 | 7.5% |
| Total Occupied Housing Units | 240 | 100.0% |
Occupancy by Household Size in Ozawkie
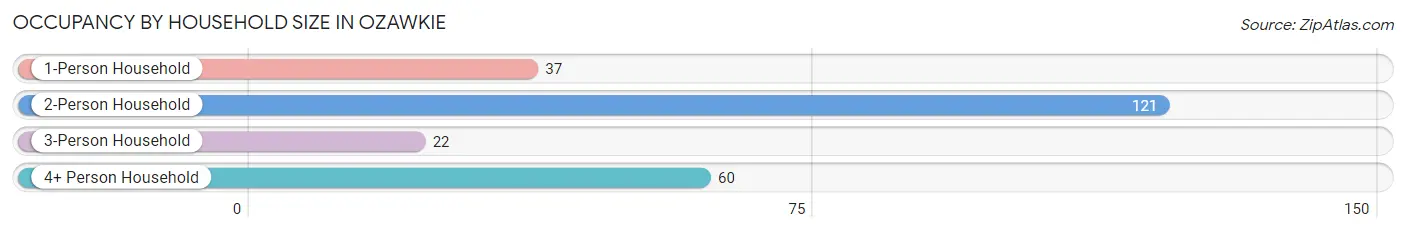
| Household Size | # Housing Units | % Housing Units |
| 1-Person Household | 37 | 15.4% |
| 2-Person Household | 121 | 50.4% |
| 3-Person Household | 22 | 9.2% |
| 4+ Person Household | 60 | 25.0% |
| Total Housing Units | 240 | 100.0% |
Occupancy by Ownership by Household Size in Ozawkie
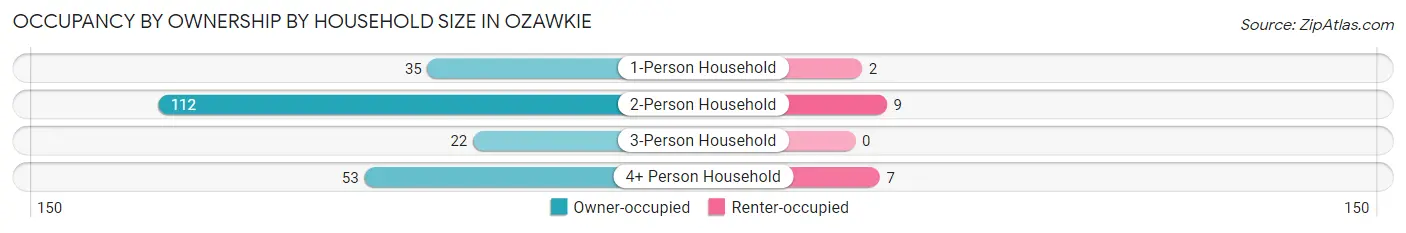
| Household Size | Owner-occupied | Renter-occupied |
| 1-Person Household | 35 (94.6%) | 2 (5.4%) |
| 2-Person Household | 112 (92.6%) | 9 (7.4%) |
| 3-Person Household | 22 (100.0%) | 0 (0.0%) |
| 4+ Person Household | 53 (88.3%) | 7 (11.7%) |
| Total Housing Units | 222 (92.5%) | 18 (7.5%) |
Occupancy by Educational Attainment in Ozawkie
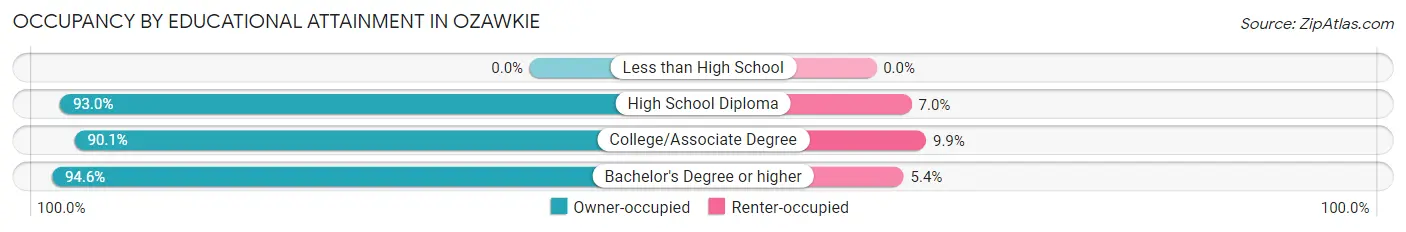
| Household Size | Owner-occupied | Renter-occupied |
| Less than High School | 0 (0.0%) | 0 (0.0%) |
| High School Diploma | 53 (93.0%) | 4 (7.0%) |
| College/Associate Degree | 82 (90.1%) | 9 (9.9%) |
| Bachelor's Degree or higher | 87 (94.6%) | 5 (5.4%) |
Occupancy by Age of Householder in Ozawkie
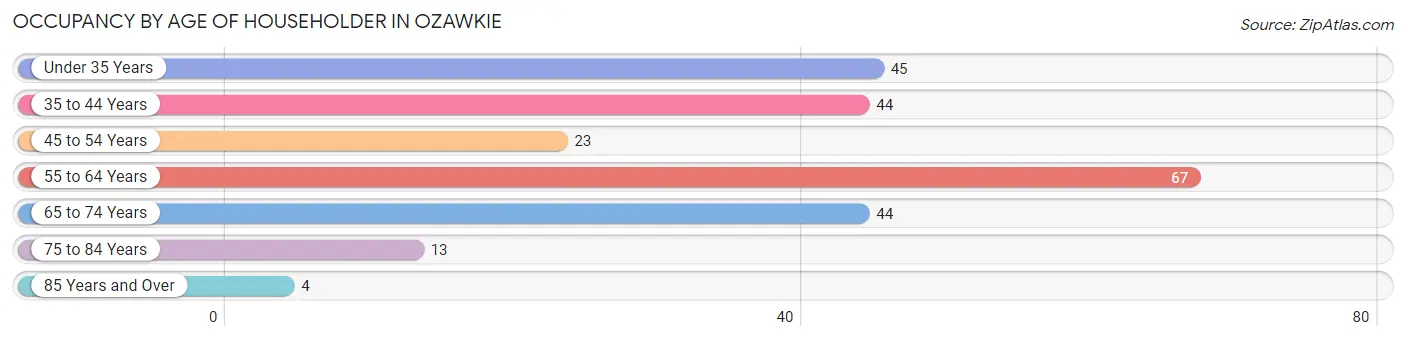
| Age Bracket | # Households | % Households |
| Under 35 Years | 45 | 18.8% |
| 35 to 44 Years | 44 | 18.3% |
| 45 to 54 Years | 23 | 9.6% |
| 55 to 64 Years | 67 | 27.9% |
| 65 to 74 Years | 44 | 18.3% |
| 75 to 84 Years | 13 | 5.4% |
| 85 Years and Over | 4 | 1.7% |
| Total | 240 | 100.0% |
Housing Finances in Ozawkie
Median Income by Occupancy in Ozawkie
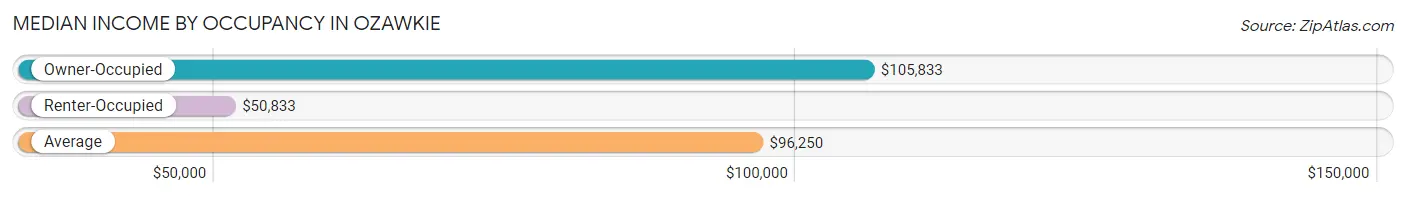
| Occupancy Type | # Households | Median Income |
| Owner-Occupied | 222 (92.5%) | $105,833 |
| Renter-Occupied | 18 (7.5%) | $50,833 |
| Average | 240 (100.0%) | $96,250 |
Occupancy by Householder Income Bracket in Ozawkie
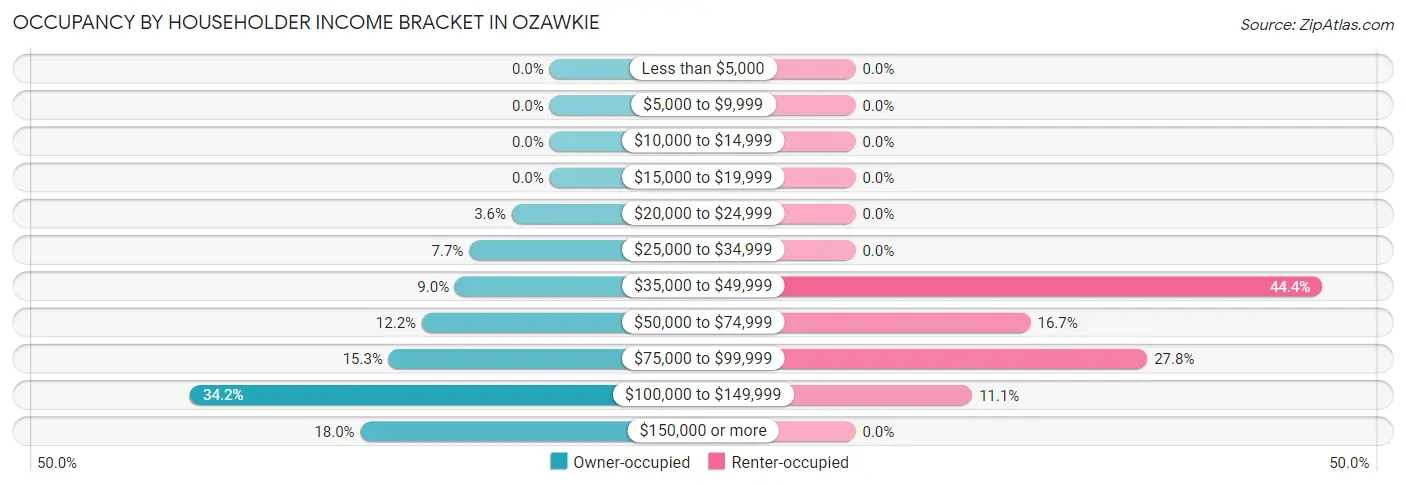
| Income Bracket | Owner-occupied | Renter-occupied |
| Less than $5,000 | 0 (0.0%) | 0 (0.0%) |
| $5,000 to $9,999 | 0 (0.0%) | 0 (0.0%) |
| $10,000 to $14,999 | 0 (0.0%) | 0 (0.0%) |
| $15,000 to $19,999 | 0 (0.0%) | 0 (0.0%) |
| $20,000 to $24,999 | 8 (3.6%) | 0 (0.0%) |
| $25,000 to $34,999 | 17 (7.7%) | 0 (0.0%) |
| $35,000 to $49,999 | 20 (9.0%) | 8 (44.4%) |
| $50,000 to $74,999 | 27 (12.2%) | 3 (16.7%) |
| $75,000 to $99,999 | 34 (15.3%) | 5 (27.8%) |
| $100,000 to $149,999 | 76 (34.2%) | 2 (11.1%) |
| $150,000 or more | 40 (18.0%) | 0 (0.0%) |
| Total | 222 (100.0%) | 18 (100.0%) |
Monthly Housing Cost Tiers in Ozawkie
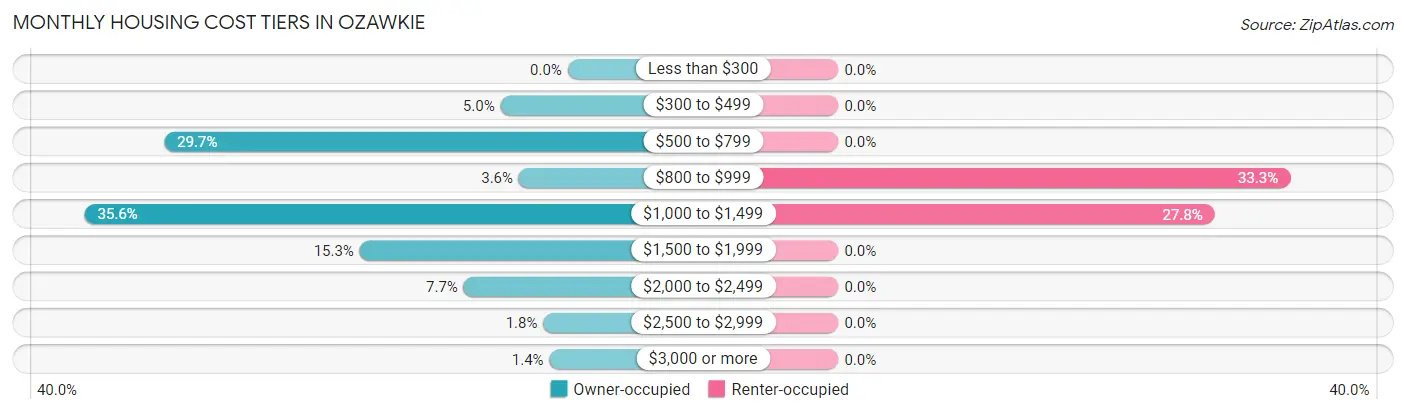
| Monthly Cost | Owner-occupied | Renter-occupied |
| Less than $300 | 0 (0.0%) | 0 (0.0%) |
| $300 to $499 | 11 (5.0%) | 0 (0.0%) |
| $500 to $799 | 66 (29.7%) | 0 (0.0%) |
| $800 to $999 | 8 (3.6%) | 6 (33.3%) |
| $1,000 to $1,499 | 79 (35.6%) | 5 (27.8%) |
| $1,500 to $1,999 | 34 (15.3%) | 0 (0.0%) |
| $2,000 to $2,499 | 17 (7.7%) | 0 (0.0%) |
| $2,500 to $2,999 | 4 (1.8%) | 0 (0.0%) |
| $3,000 or more | 3 (1.3%) | 0 (0.0%) |
| Total | 222 (100.0%) | 18 (100.0%) |
Physical Housing Characteristics in Ozawkie
Housing Structures in Ozawkie
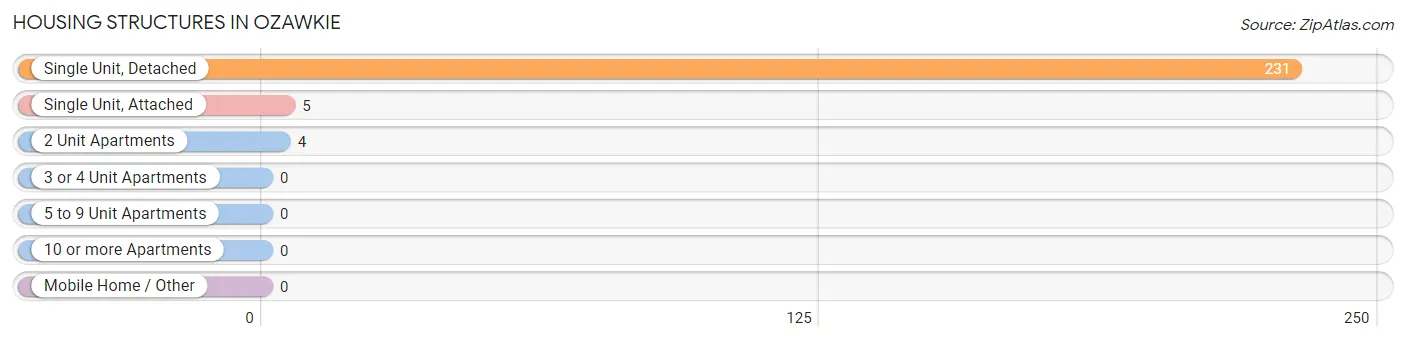
| Structure Type | # Housing Units | % Housing Units |
| Single Unit, Detached | 231 | 96.3% |
| Single Unit, Attached | 5 | 2.1% |
| 2 Unit Apartments | 4 | 1.7% |
| 3 or 4 Unit Apartments | 0 | 0.0% |
| 5 to 9 Unit Apartments | 0 | 0.0% |
| 10 or more Apartments | 0 | 0.0% |
| Mobile Home / Other | 0 | 0.0% |
| Total | 240 | 100.0% |
Housing Structures by Occupancy in Ozawkie
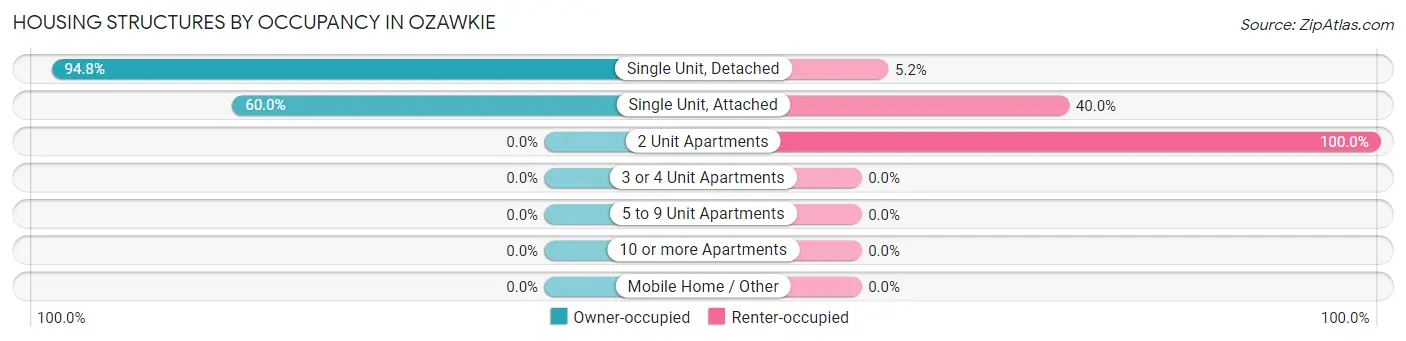
| Structure Type | Owner-occupied | Renter-occupied |
| Single Unit, Detached | 219 (94.8%) | 12 (5.2%) |
| Single Unit, Attached | 3 (60.0%) | 2 (40.0%) |
| 2 Unit Apartments | 0 (0.0%) | 4 (100.0%) |
| 3 or 4 Unit Apartments | 0 (0.0%) | 0 (0.0%) |
| 5 to 9 Unit Apartments | 0 (0.0%) | 0 (0.0%) |
| 10 or more Apartments | 0 (0.0%) | 0 (0.0%) |
| Mobile Home / Other | 0 (0.0%) | 0 (0.0%) |
| Total | 222 (92.5%) | 18 (7.5%) |
Housing Structures by Number of Rooms in Ozawkie
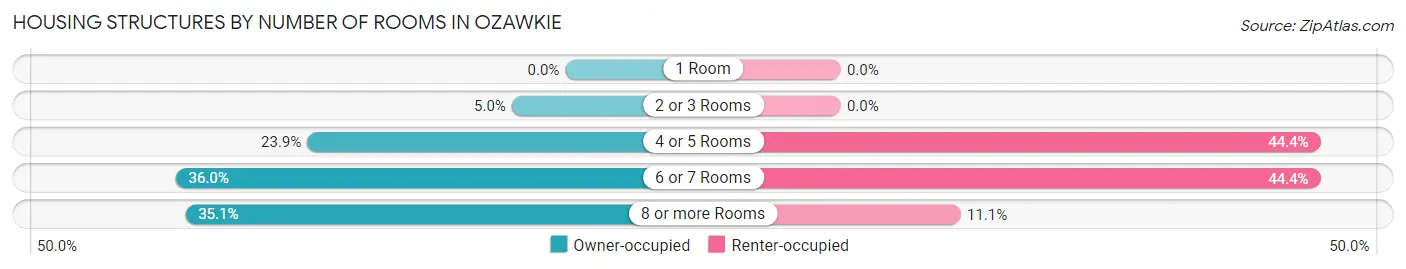
| Number of Rooms | Owner-occupied | Renter-occupied |
| 1 Room | 0 (0.0%) | 0 (0.0%) |
| 2 or 3 Rooms | 11 (5.0%) | 0 (0.0%) |
| 4 or 5 Rooms | 53 (23.9%) | 8 (44.4%) |
| 6 or 7 Rooms | 80 (36.0%) | 8 (44.4%) |
| 8 or more Rooms | 78 (35.1%) | 2 (11.1%) |
| Total | 222 (100.0%) | 18 (100.0%) |
Housing Structure by Heating Type in Ozawkie
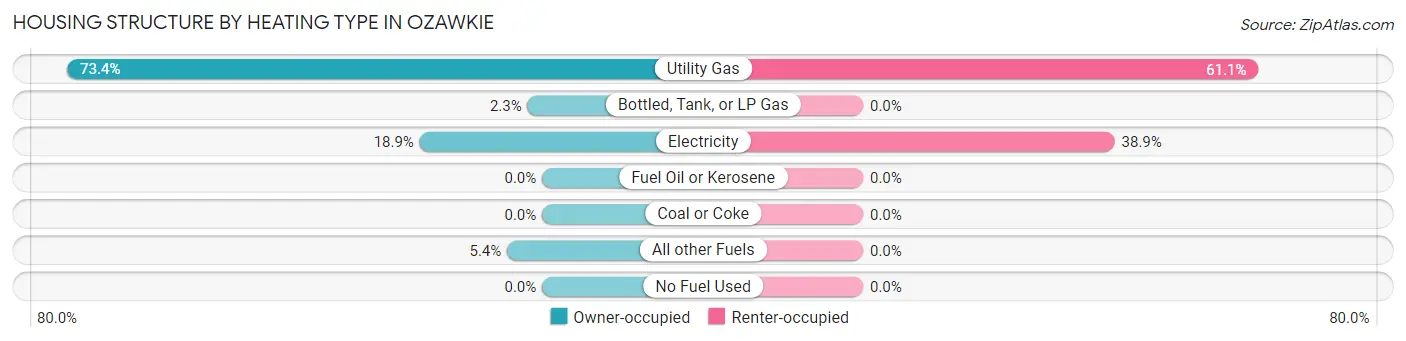
| Heating Type | Owner-occupied | Renter-occupied |
| Utility Gas | 163 (73.4%) | 11 (61.1%) |
| Bottled, Tank, or LP Gas | 5 (2.2%) | 0 (0.0%) |
| Electricity | 42 (18.9%) | 7 (38.9%) |
| Fuel Oil or Kerosene | 0 (0.0%) | 0 (0.0%) |
| Coal or Coke | 0 (0.0%) | 0 (0.0%) |
| All other Fuels | 12 (5.4%) | 0 (0.0%) |
| No Fuel Used | 0 (0.0%) | 0 (0.0%) |
| Total | 222 (100.0%) | 18 (100.0%) |
Household Vehicle Usage in Ozawkie
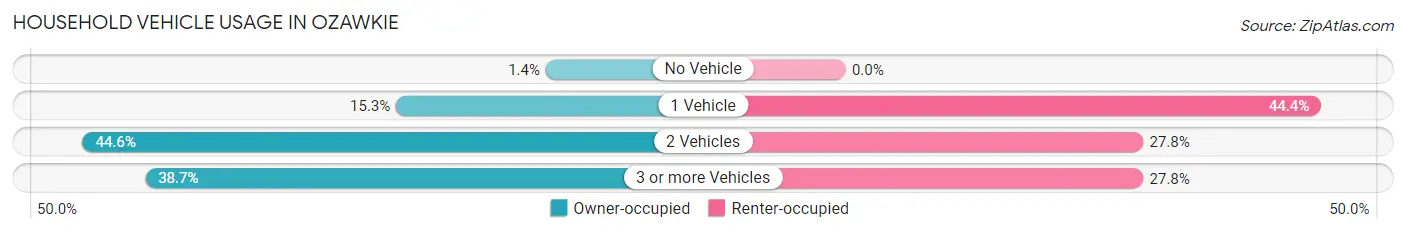
| Vehicles per Household | Owner-occupied | Renter-occupied |
| No Vehicle | 3 (1.3%) | 0 (0.0%) |
| 1 Vehicle | 34 (15.3%) | 8 (44.4%) |
| 2 Vehicles | 99 (44.6%) | 5 (27.8%) |
| 3 or more Vehicles | 86 (38.7%) | 5 (27.8%) |
| Total | 222 (100.0%) | 18 (100.0%) |
Real Estate & Mortgages in Ozawkie
Real Estate and Mortgage Overview in Ozawkie
| Characteristic | Without Mortgage | With Mortgage |
| Housing Units | 85 | 137 |
| Median Property Value | $168,800 | $180,800 |
| Median Household Income | $76,250 | $30 |
| Monthly Housing Costs | $629 | $3 |
| Real Estate Taxes | $2,678 | $4 |
Property Value by Mortgage Status in Ozawkie
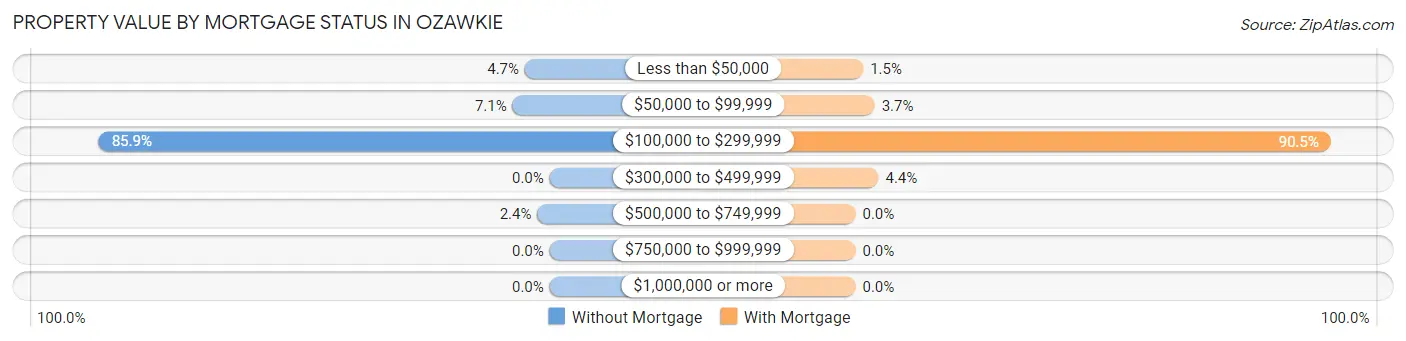
| Property Value | Without Mortgage | With Mortgage |
| Less than $50,000 | 4 (4.7%) | 2 (1.5%) |
| $50,000 to $99,999 | 6 (7.1%) | 5 (3.6%) |
| $100,000 to $299,999 | 73 (85.9%) | 124 (90.5%) |
| $300,000 to $499,999 | 0 (0.0%) | 6 (4.4%) |
| $500,000 to $749,999 | 2 (2.4%) | 0 (0.0%) |
| $750,000 to $999,999 | 0 (0.0%) | 0 (0.0%) |
| $1,000,000 or more | 0 (0.0%) | 0 (0.0%) |
| Total | 85 (100.0%) | 137 (100.0%) |
Household Income by Mortgage Status in Ozawkie
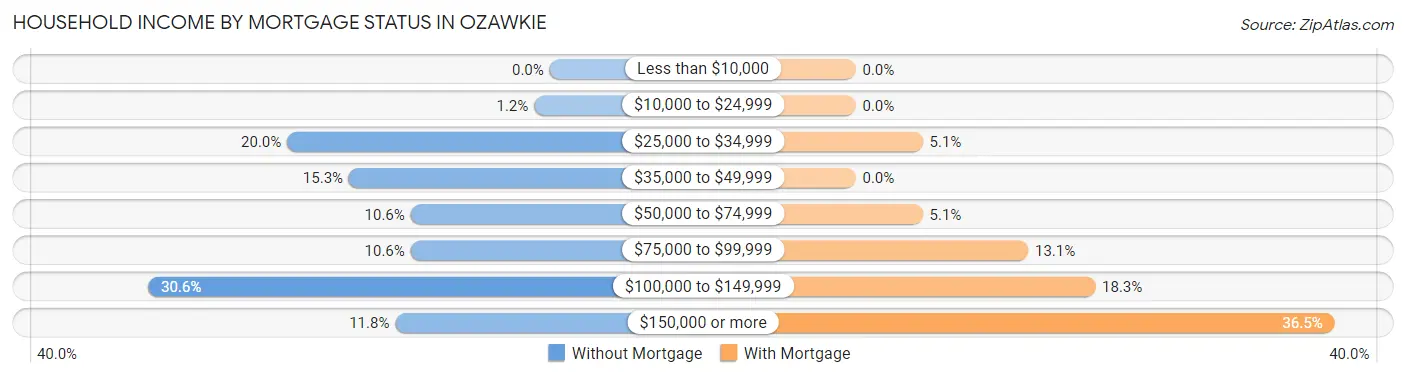
| Household Income | Without Mortgage | With Mortgage |
| Less than $10,000 | 0 (0.0%) | 0 (0.0%) |
| $10,000 to $24,999 | 1 (1.2%) | 0 (0.0%) |
| $25,000 to $34,999 | 17 (20.0%) | 7 (5.1%) |
| $35,000 to $49,999 | 13 (15.3%) | 0 (0.0%) |
| $50,000 to $74,999 | 9 (10.6%) | 7 (5.1%) |
| $75,000 to $99,999 | 9 (10.6%) | 18 (13.1%) |
| $100,000 to $149,999 | 26 (30.6%) | 25 (18.2%) |
| $150,000 or more | 10 (11.8%) | 50 (36.5%) |
| Total | 85 (100.0%) | 137 (100.0%) |
Property Value to Household Income Ratio in Ozawkie
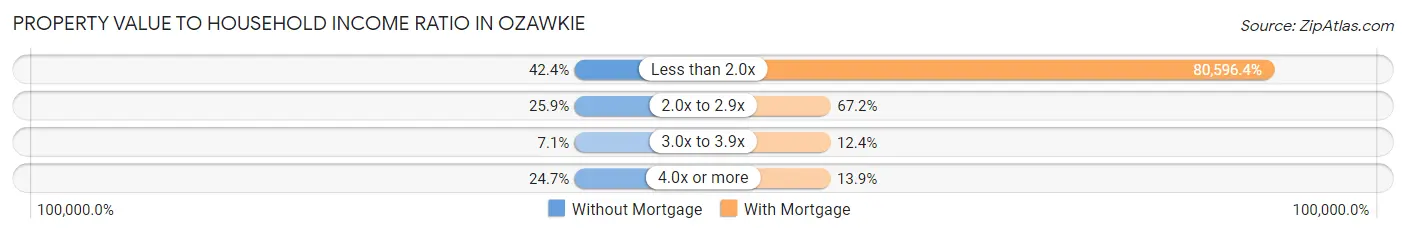
| Value-to-Income Ratio | Without Mortgage | With Mortgage |
| Less than 2.0x | 36 (42.3%) | 110,417 (80,596.3%) |
| 2.0x to 2.9x | 22 (25.9%) | 92 (67.1%) |
| 3.0x to 3.9x | 6 (7.1%) | 17 (12.4%) |
| 4.0x or more | 21 (24.7%) | 19 (13.9%) |
| Total | 85 (100.0%) | 137 (100.0%) |
Real Estate Taxes by Mortgage Status in Ozawkie
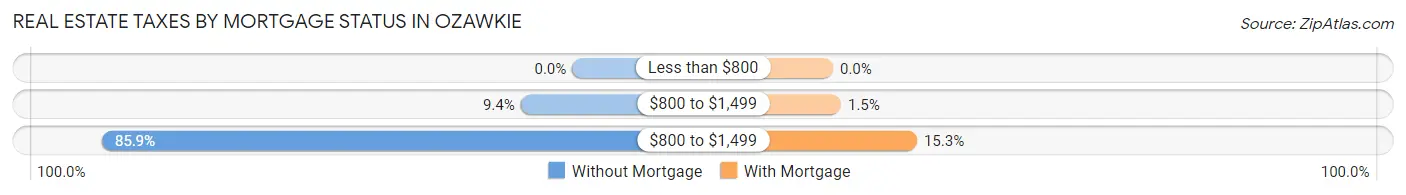
| Property Taxes | Without Mortgage | With Mortgage |
| Less than $800 | 0 (0.0%) | 0 (0.0%) |
| $800 to $1,499 | 8 (9.4%) | 2 (1.5%) |
| $800 to $1,499 | 73 (85.9%) | 21 (15.3%) |
| Total | 85 (100.0%) | 137 (100.0%) |
Health & Disability in Ozawkie
Health Insurance Coverage by Age in Ozawkie
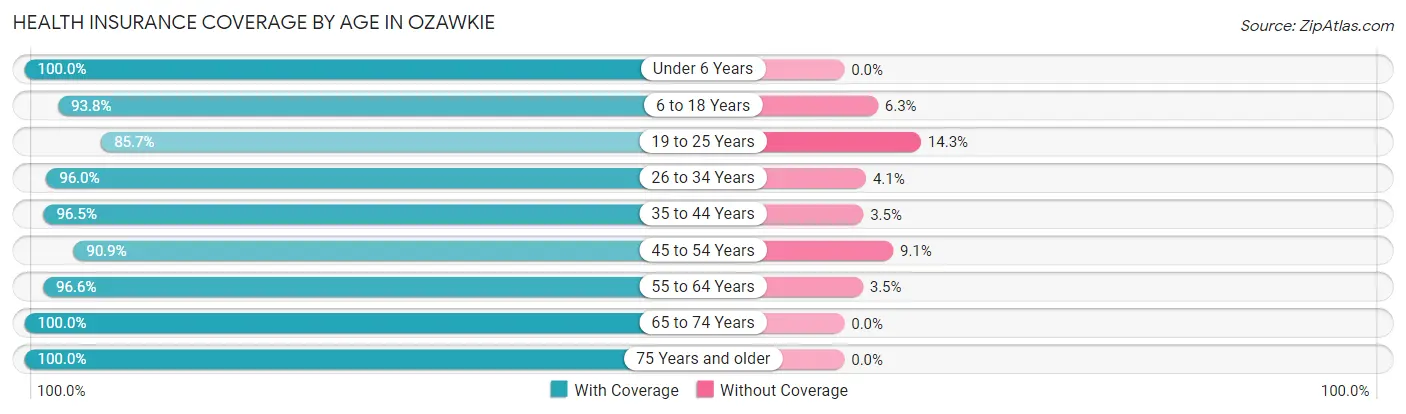
| Age Bracket | With Coverage | Without Coverage |
| Under 6 Years | 90 (100.0%) | 0 (0.0%) |
| 6 to 18 Years | 105 (93.8%) | 7 (6.2%) |
| 19 to 25 Years | 36 (85.7%) | 6 (14.3%) |
| 26 to 34 Years | 71 (96.0%) | 3 (4.1%) |
| 35 to 44 Years | 82 (96.5%) | 3 (3.5%) |
| 45 to 54 Years | 60 (90.9%) | 6 (9.1%) |
| 55 to 64 Years | 84 (96.6%) | 3 (3.5%) |
| 65 to 74 Years | 73 (100.0%) | 0 (0.0%) |
| 75 Years and older | 37 (100.0%) | 0 (0.0%) |
| Total | 638 (95.8%) | 28 (4.2%) |
Health Insurance Coverage by Citizenship Status in Ozawkie
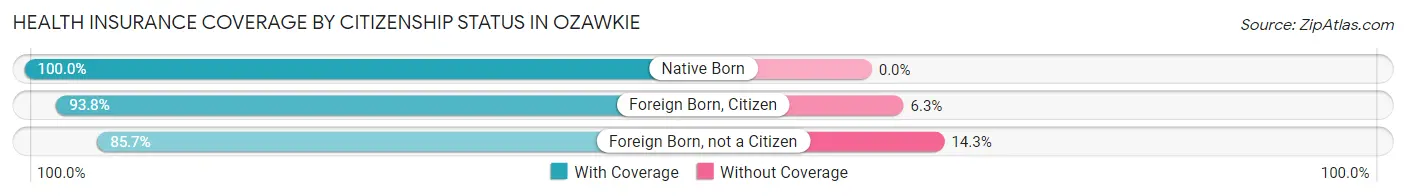
| Citizenship Status | With Coverage | Without Coverage |
| Native Born | 90 (100.0%) | 0 (0.0%) |
| Foreign Born, Citizen | 105 (93.8%) | 7 (6.2%) |
| Foreign Born, not a Citizen | 36 (85.7%) | 6 (14.3%) |
Health Insurance Coverage by Household Income in Ozawkie
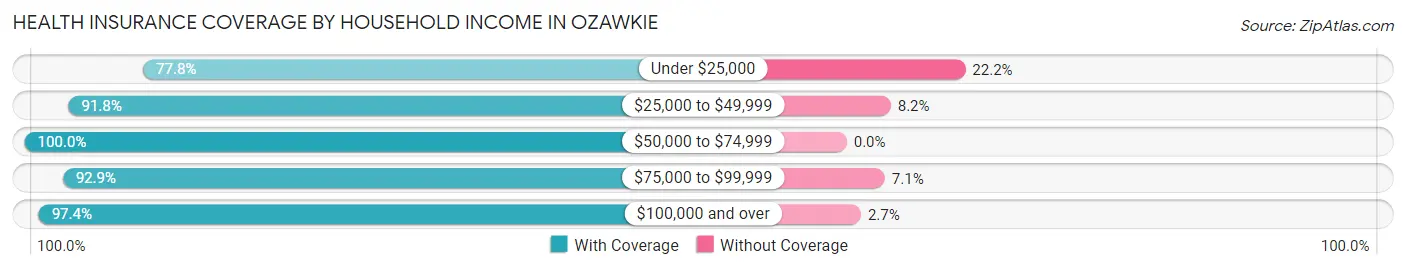
| Household Income | With Coverage | Without Coverage |
| Under $25,000 | 7 (77.8%) | 2 (22.2%) |
| $25,000 to $49,999 | 78 (91.8%) | 7 (8.2%) |
| $50,000 to $74,999 | 69 (100.0%) | 0 (0.0%) |
| $75,000 to $99,999 | 117 (92.9%) | 9 (7.1%) |
| $100,000 and over | 367 (97.4%) | 10 (2.6%) |
Public vs Private Health Insurance Coverage by Age in Ozawkie
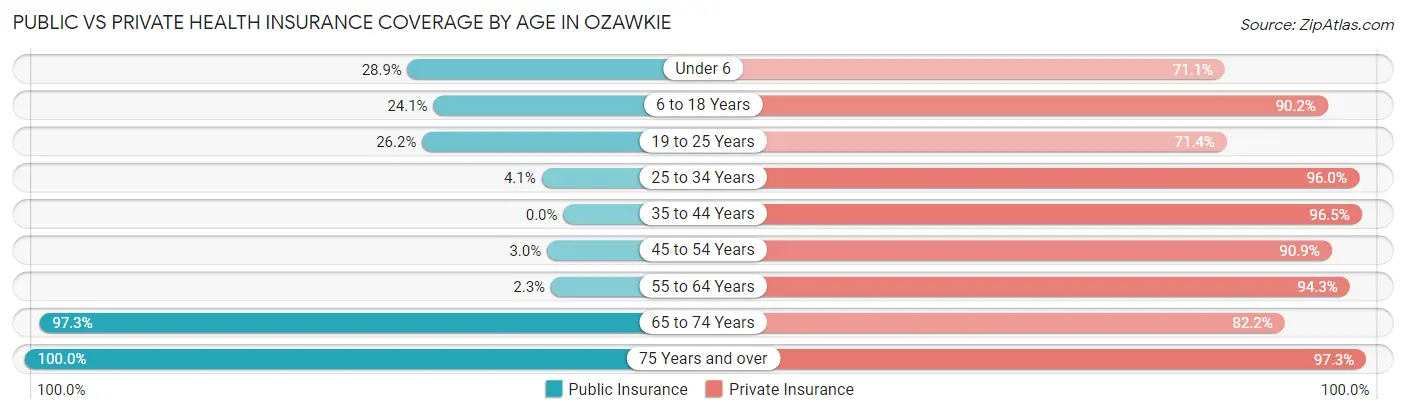
| Age Bracket | Public Insurance | Private Insurance |
| Under 6 | 26 (28.9%) | 64 (71.1%) |
| 6 to 18 Years | 27 (24.1%) | 101 (90.2%) |
| 19 to 25 Years | 11 (26.2%) | 30 (71.4%) |
| 25 to 34 Years | 3 (4.1%) | 71 (96.0%) |
| 35 to 44 Years | 0 (0.0%) | 82 (96.5%) |
| 45 to 54 Years | 2 (3.0%) | 60 (90.9%) |
| 55 to 64 Years | 2 (2.3%) | 82 (94.3%) |
| 65 to 74 Years | 71 (97.3%) | 60 (82.2%) |
| 75 Years and over | 37 (100.0%) | 36 (97.3%) |
| Total | 179 (26.9%) | 586 (88.0%) |
Disability Status by Sex by Age in Ozawkie
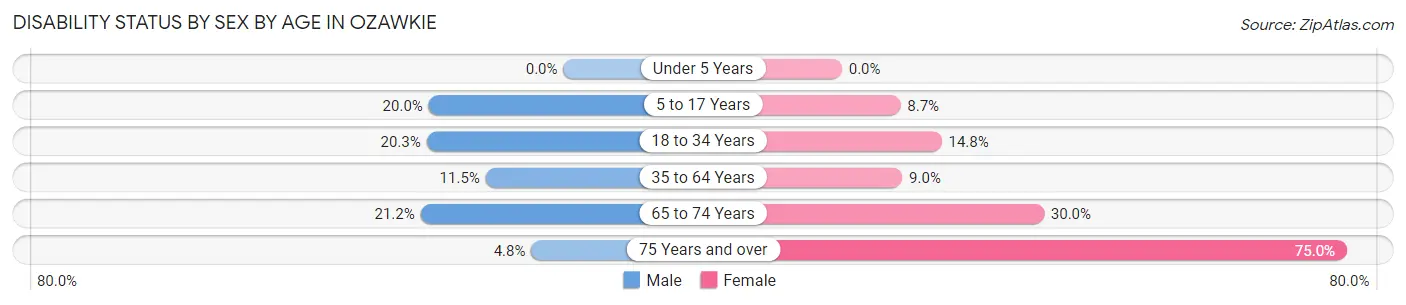
| Age Bracket | Male | Female |
| Under 5 Years | 0 (0.0%) | 0 (0.0%) |
| 5 to 17 Years | 15 (20.0%) | 4 (8.7%) |
| 18 to 34 Years | 13 (20.3%) | 8 (14.8%) |
| 35 to 64 Years | 12 (11.5%) | 12 (9.0%) |
| 65 to 74 Years | 7 (21.2%) | 12 (30.0%) |
| 75 Years and over | 1 (4.8%) | 12 (75.0%) |
Disability Class by Sex by Age in Ozawkie
Disability Class: Hearing Difficulty
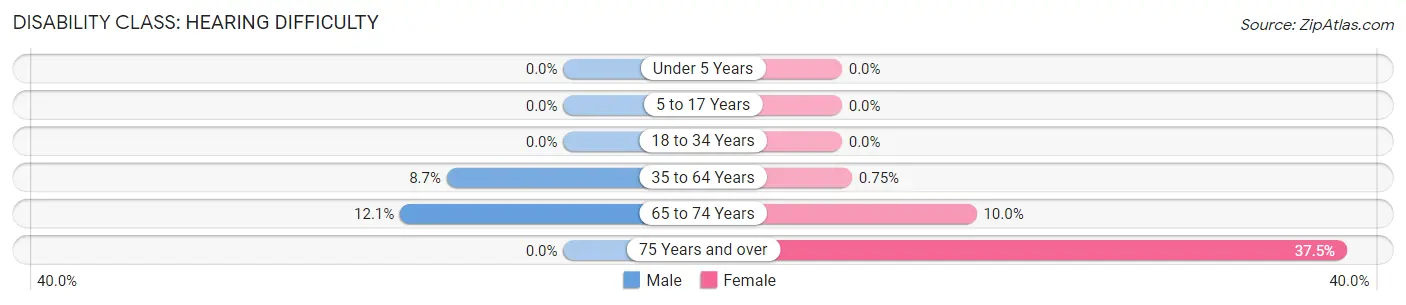
| Age Bracket | Male | Female |
| Under 5 Years | 0 (0.0%) | 0 (0.0%) |
| 5 to 17 Years | 0 (0.0%) | 0 (0.0%) |
| 18 to 34 Years | 0 (0.0%) | 0 (0.0%) |
| 35 to 64 Years | 9 (8.6%) | 1 (0.7%) |
| 65 to 74 Years | 4 (12.1%) | 4 (10.0%) |
| 75 Years and over | 0 (0.0%) | 6 (37.5%) |
Disability Class: Vision Difficulty
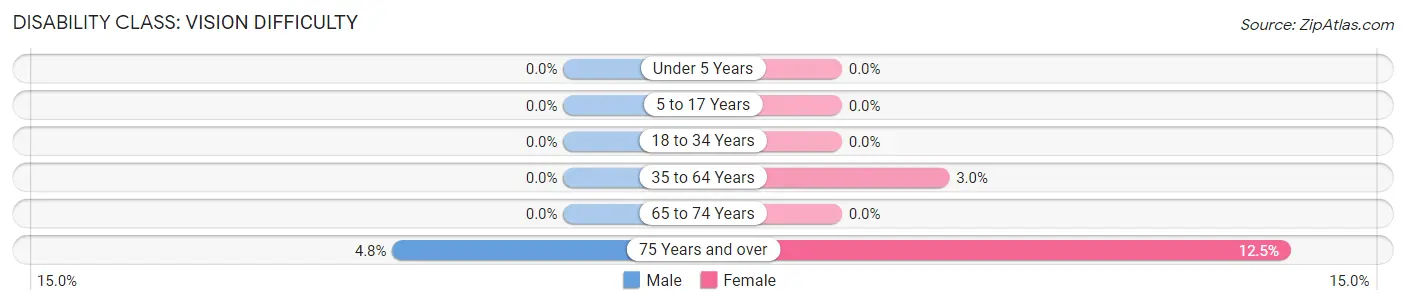
| Age Bracket | Male | Female |
| Under 5 Years | 0 (0.0%) | 0 (0.0%) |
| 5 to 17 Years | 0 (0.0%) | 0 (0.0%) |
| 18 to 34 Years | 0 (0.0%) | 0 (0.0%) |
| 35 to 64 Years | 0 (0.0%) | 4 (3.0%) |
| 65 to 74 Years | 0 (0.0%) | 0 (0.0%) |
| 75 Years and over | 1 (4.8%) | 2 (12.5%) |
Disability Class: Cognitive Difficulty
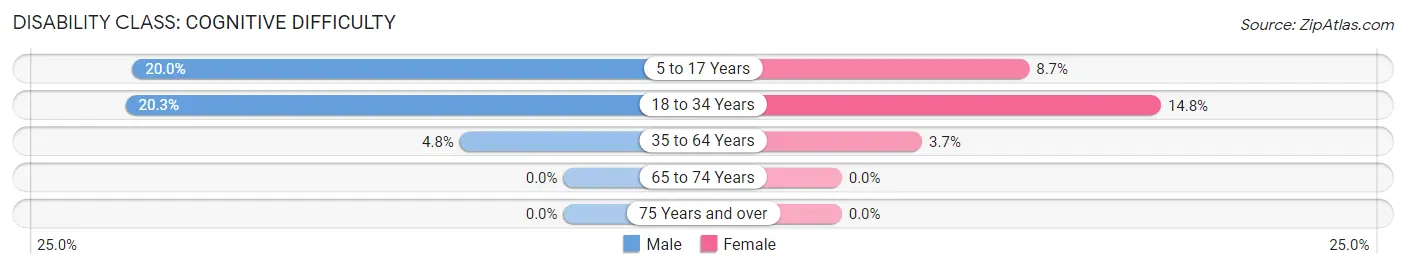
| Age Bracket | Male | Female |
| 5 to 17 Years | 15 (20.0%) | 4 (8.7%) |
| 18 to 34 Years | 13 (20.3%) | 8 (14.8%) |
| 35 to 64 Years | 5 (4.8%) | 5 (3.7%) |
| 65 to 74 Years | 0 (0.0%) | 0 (0.0%) |
| 75 Years and over | 0 (0.0%) | 0 (0.0%) |
Disability Class: Ambulatory Difficulty
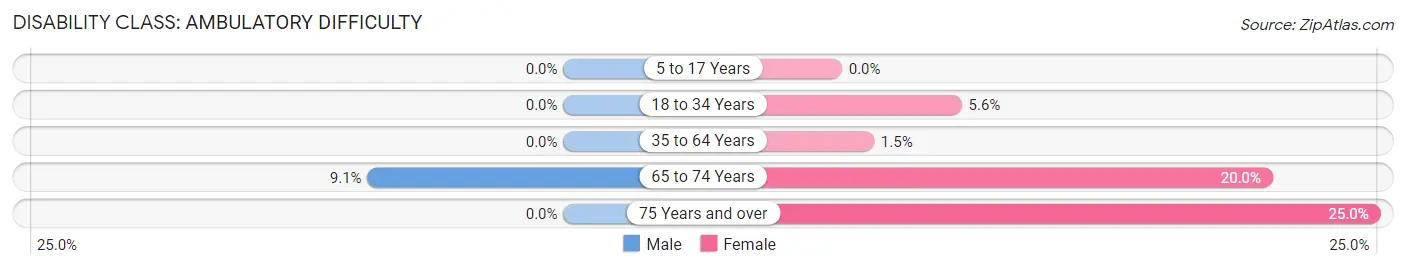
| Age Bracket | Male | Female |
| 5 to 17 Years | 0 (0.0%) | 0 (0.0%) |
| 18 to 34 Years | 0 (0.0%) | 3 (5.6%) |
| 35 to 64 Years | 0 (0.0%) | 2 (1.5%) |
| 65 to 74 Years | 3 (9.1%) | 8 (20.0%) |
| 75 Years and over | 0 (0.0%) | 4 (25.0%) |
Disability Class: Self-Care Difficulty
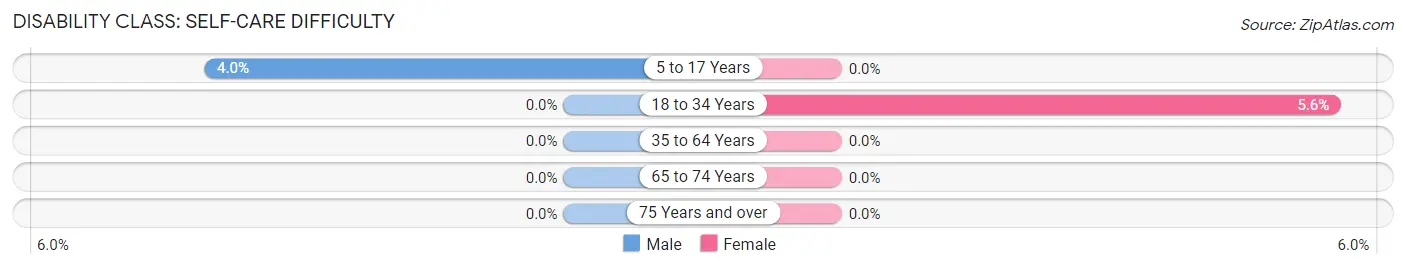
| Age Bracket | Male | Female |
| 5 to 17 Years | 3 (4.0%) | 0 (0.0%) |
| 18 to 34 Years | 0 (0.0%) | 3 (5.6%) |
| 35 to 64 Years | 0 (0.0%) | 0 (0.0%) |
| 65 to 74 Years | 0 (0.0%) | 0 (0.0%) |
| 75 Years and over | 0 (0.0%) | 0 (0.0%) |
Technology Access in Ozawkie
Computing Device Access in Ozawkie
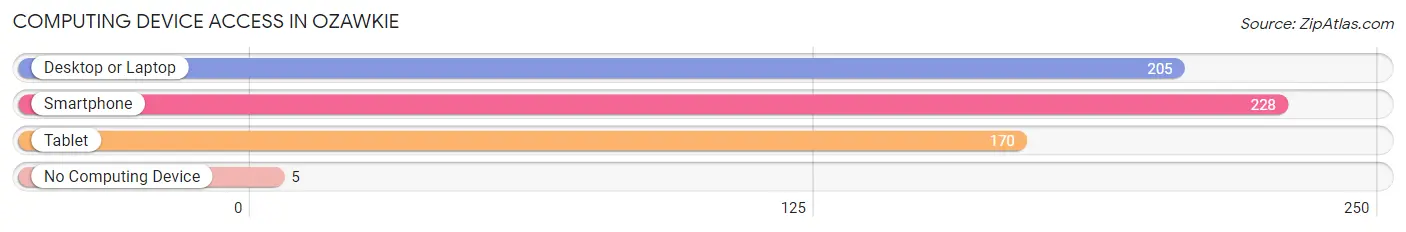
| Device Type | # Households | % Households |
| Desktop or Laptop | 205 | 85.4% |
| Smartphone | 228 | 95.0% |
| Tablet | 170 | 70.8% |
| No Computing Device | 5 | 2.1% |
| Total | 240 | 100.0% |
Internet Access in Ozawkie
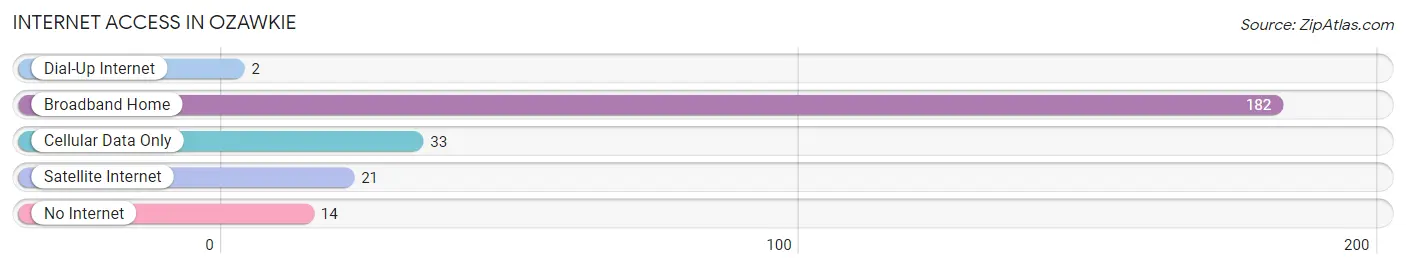
| Internet Type | # Households | % Households |
| Dial-Up Internet | 2 | 0.8% |
| Broadband Home | 182 | 75.8% |
| Cellular Data Only | 33 | 13.8% |
| Satellite Internet | 21 | 8.7% |
| No Internet | 14 | 5.8% |
| Total | 240 | 100.0% |
Ozawkie Summary
Ozawkie, Kansas is a small town located in Jefferson County, Kansas. It is situated on the banks of the Kansas River, approximately 20 miles west of Topeka. The population of Ozawkie was estimated to be 1,093 in 2019.
History
Ozawkie was founded in 1854 by a group of settlers from Ohio. The town was named after the Osage Indians who lived in the area. The settlers built a log cabin and a sawmill, and the town quickly grew. By 1856, Ozawkie had a post office, a school, and a church.
In the late 1800s, Ozawkie was a thriving community with a population of over 1,000. The town had several stores, a hotel, a bank, and a newspaper. The town was also home to a number of industries, including a flour mill, a brickyard, and a furniture factory.
In the early 1900s, Ozawkie began to decline. The population dropped to just over 500 by the 1930s. The decline was due to the Great Depression and the Dust Bowl. The town was also affected by the construction of the Tuttle Creek Dam, which flooded much of the surrounding area.
Geography
Ozawkie is located in the northeastern part of Jefferson County, Kansas. It is situated on the banks of the Kansas River, approximately 20 miles west of Topeka. The town is surrounded by rolling hills and farmland. The climate is humid continental, with hot summers and cold winters.
Economy
Ozawkie’s economy is largely based on agriculture. The town is home to several farms, which produce corn, soybeans, wheat, and other crops. The town also has a number of small businesses, including a grocery store, a hardware store, and a restaurant.
Demographics
As of 2019, the population of Ozawkie was estimated to be 1,093. The town is predominantly white, with a small Hispanic population. The median household income is $45,000, and the median home value is $90,000.
Ozawkie is a small town with a rich history and a bright future. The town is home to a diverse population and a thriving economy. With its close proximity to Topeka and its rural charm, Ozawkie is an ideal place to live and work.
Common Questions
What is Per Capita Income in Ozawkie?
Per Capita income in Ozawkie is $39,229.
What is the Median Family Income in Ozawkie?
Median Family Income in Ozawkie is $105,583.
What is the Median Household income in Ozawkie?
Median Household Income in Ozawkie is $96,250.
What is Income or Wage Gap in Ozawkie?
Income or Wage Gap in Ozawkie is 38.7%.
Women in Ozawkie earn 61.3 cents for every dollar earned by a man.
What is Inequality or Gini Index in Ozawkie?
Inequality or Gini Index in Ozawkie is 0.34.
What is the Total Population of Ozawkie?
Total Population of Ozawkie is 666.
What is the Total Male Population of Ozawkie?
Total Male Population of Ozawkie is 344.
What is the Total Female Population of Ozawkie?
Total Female Population of Ozawkie is 322.
What is the Ratio of Males per 100 Females in Ozawkie?
There are 106.83 Males per 100 Females in Ozawkie.
What is the Ratio of Females per 100 Males in Ozawkie?
There are 93.60 Females per 100 Males in Ozawkie.
What is the Median Population Age in Ozawkie?
Median Population Age in Ozawkie is 37.6 Years.
What is the Average Family Size in Ozawkie
Average Family Size in Ozawkie is 3.2 People.
What is the Average Household Size in Ozawkie
Average Household Size in Ozawkie is 2.8 People.
How Large is the Labor Force in Ozawkie?
There are 315 People in the Labor Forcein in Ozawkie.
What is the Percentage of People in the Labor Force in Ozawkie?
63.5% of People are in the Labor Force in Ozawkie.
What is the Unemployment Rate in Ozawkie?
Unemployment Rate in Ozawkie is 1.0%.