Cities with the Highest Percentage of Population Employed in Computer & Mathematics in Puerto Rico
RELATED REPORTS & OPTIONS
Computer & Mathematics
Puerto Rico
Compare Cities
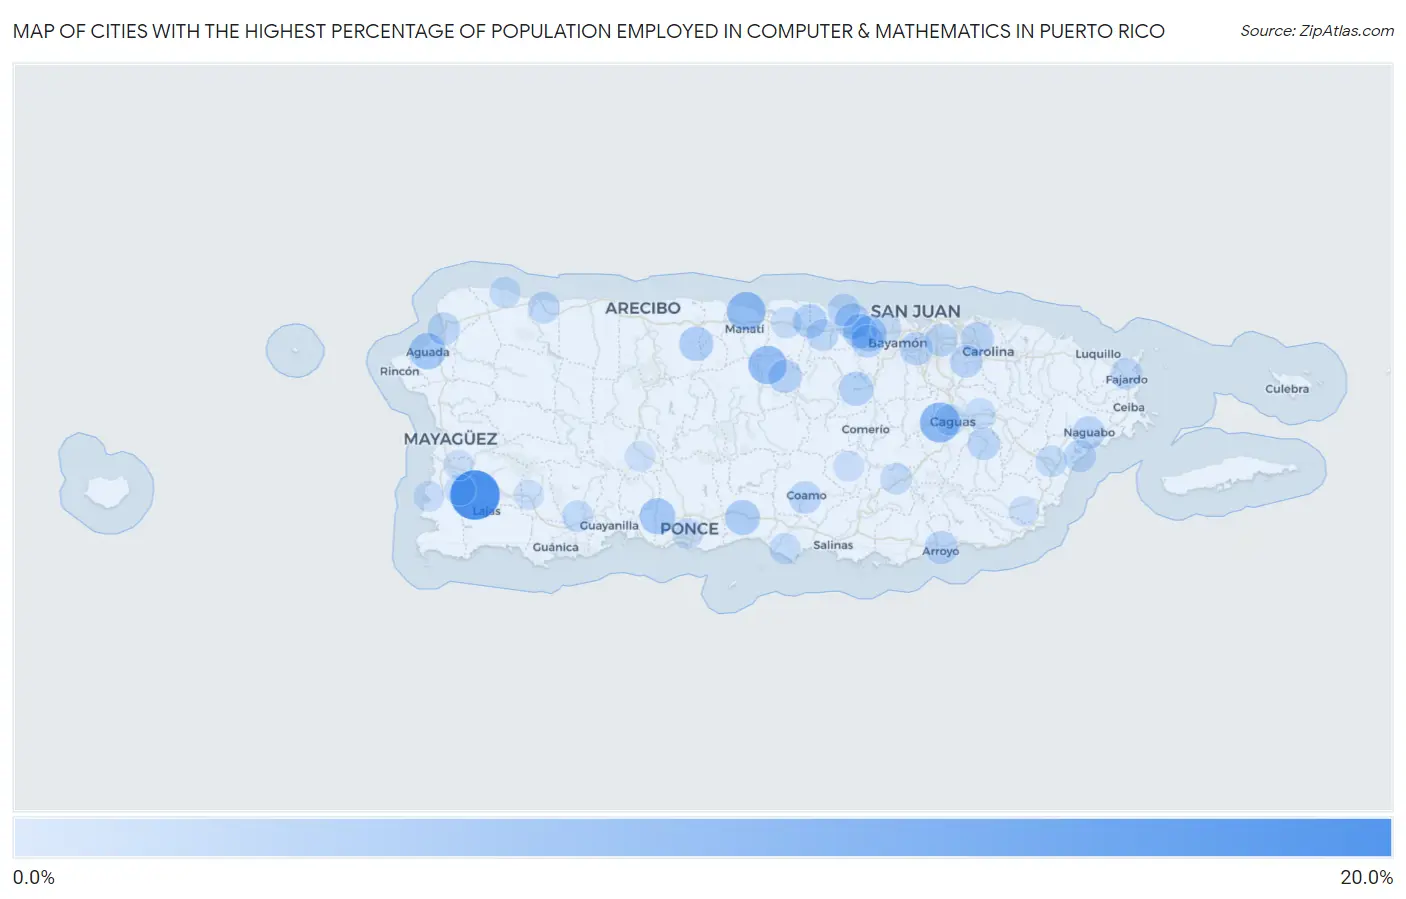
Map of Cities with the Highest Percentage of Population Employed in Computer & Mathematics in Puerto Rico
0.0%
20.0%
Cities with the Highest Percentage of Population Employed in Computer & Mathematics in Puerto Rico
| City | % Employed | vs State | vs National | |
| 1. | Sabana Eneas | 15.8% | 1.2%(+14.6)#1 | 3.5%(+12.3)#278 |
| 2. | Pueblito Del Rio | 10.1% | 1.2%(+8.87)#2 | 3.5%(+6.58)#717 |
| 3. | Honduras | 9.3% | 1.2%(+8.05)#3 | 3.5%(+5.76)#876 |
| 4. | Las Gaviotas | 7.9% | 1.2%(+6.69)#4 | 3.5%(+4.40)#1,250 |
| 5. | Los Prados | 7.9% | 1.2%(+6.63)#5 | 3.5%(+4.35)#1,276 |
| 6. | Marueno | 7.8% | 1.2%(+6.60)#6 | 3.5%(+4.32)#1,282 |
| 7. | Tierras Nuevas Poniente | 6.7% | 1.2%(+5.45)#7 | 3.5%(+3.17)#1,760 |
| 8. | Barahona | 6.5% | 1.2%(+5.29)#8 | 3.5%(+3.00)#1,855 |
| 9. | San Sebastian | 5.9% | 1.2%(+4.70)#9 | 3.5%(+2.42)#2,215 |
| 10. | Imbery | 5.8% | 1.2%(+4.58)#10 | 3.5%(+2.30)#2,303 |
| 11. | Rincon | 5.4% | 1.2%(+4.16)#11 | 3.5%(+1.88)#2,674 |
| 12. | Aguada | 4.9% | 1.2%(+3.69)#12 | 3.5%(+1.40)#3,170 |
| 13. | Quebrada Del Agua | 4.6% | 1.2%(+3.39)#13 | 3.5%(+1.11)#3,535 |
| 14. | Toa Baja | 4.2% | 1.2%(+2.97)#14 | 3.5%(+0.692)#4,103 |
| 15. | Candelaria Arenas | 4.1% | 1.2%(+2.85)#15 | 3.5%(+0.563)#4,330 |
| 16. | Piedra Aguza | 3.9% | 1.2%(+2.63)#16 | 3.5%(+0.347)#4,691 |
| 17. | Campanilla | 3.4% | 1.2%(+2.18)#17 | 3.5%(-0.099)#5,590 |
| 18. | La Alianza | 3.4% | 1.2%(+2.14)#18 | 3.5%(-0.141)#5,677 |
| 19. | Naranjito | 3.2% | 1.2%(+1.97)#19 | 3.5%(-0.310)#6,078 |
| 20. | Rafael Gonzalez | 3.2% | 1.2%(+1.96)#20 | 3.5%(-0.319)#6,101 |
| 21. | Ceiba | 3.0% | 1.2%(+1.76)#21 | 3.5%(-0.525)#6,596 |
| 22. | Morovis | 2.7% | 1.2%(+1.45)#22 | 3.5%(-0.829)#7,389 |
| 23. | Guaynabo | 2.4% | 1.2%(+1.20)#23 | 3.5%(-1.08)#8,113 |
| 24. | Canovanas | 2.4% | 1.2%(+1.16)#24 | 3.5%(-1.12)#8,236 |
| 25. | Arroyo | 2.4% | 1.2%(+1.14)#25 | 3.5%(-1.15)#8,347 |
| 26. | Carolina | 2.3% | 1.2%(+1.03)#26 | 3.5%(-1.25)#8,687 |
| 27. | Loiza | 2.3% | 1.2%(+1.03)#27 | 3.5%(-1.25)#8,691 |
| 28. | Yeguada | 2.3% | 1.2%(+1.01)#28 | 3.5%(-1.27)#8,770 |
| 29. | Trujillo Alto | 2.2% | 1.2%(+0.943)#29 | 3.5%(-1.34)#8,990 |
| 30. | San Juan | 2.1% | 1.2%(+0.891)#30 | 3.5%(-1.39)#9,183 |
| 31. | San Antonio Comunidad Dorado Municipio | 2.1% | 1.2%(+0.870)#31 | 3.5%(-1.41)#9,252 |
| 32. | Dorado | 2.1% | 1.2%(+0.854)#32 | 3.5%(-1.43)#9,309 |
| 33. | Mansión Del Mar | 2.1% | 1.2%(+0.843)#33 | 3.5%(-1.44)#9,356 |
| 34. | Hacienda San Jose | 2.0% | 1.2%(+0.797)#34 | 3.5%(-1.48)#9,503 |
| 35. | Candelaria | 2.0% | 1.2%(+0.789)#35 | 3.5%(-1.49)#9,522 |
| 36. | Coamo | 1.9% | 1.2%(+0.705)#36 | 3.5%(-1.58)#9,849 |
| 37. | Naguabo | 1.9% | 1.2%(+0.688)#37 | 3.5%(-1.59)#9,914 |
| 38. | Aguadilla | 1.9% | 1.2%(+0.672)#38 | 3.5%(-1.61)#9,984 |
| 39. | San Lorenzo | 1.9% | 1.2%(+0.667)#39 | 3.5%(-1.61)#10,004 |
| 40. | Punta Santiago | 1.6% | 1.2%(+0.394)#40 | 3.5%(-1.89)#11,105 |
| 41. | Rio Grande | 1.6% | 1.2%(+0.388)#41 | 3.5%(-1.89)#11,128 |
| 42. | Quebradillas | 1.6% | 1.2%(+0.318)#42 | 3.5%(-1.96)#11,445 |
| 43. | Vega Alta | 1.5% | 1.2%(+0.266)#43 | 3.5%(-2.02)#11,645 |
| 44. | Fajardo | 1.5% | 1.2%(+0.209)#44 | 3.5%(-2.07)#11,898 |
| 45. | Bayamón | 1.4% | 1.2%(+0.195)#45 | 3.5%(-2.09)#11,943 |
| 46. | Cayey | 1.3% | 1.2%(+0.014)#46 | 3.5%(-2.27)#12,754 |
| 47. | Mayaguez | 1.2% | 1.2%(-0.002)#47 | 3.5%(-2.28)#12,836 |
| 48. | Humacao | 1.2% | 1.2%(-0.023)#48 | 3.5%(-2.30)#12,906 |
| 49. | Yauco | 1.2% | 1.2%(-0.032)#49 | 3.5%(-2.31)#12,947 |
| 50. | Caguas | 1.1% | 1.2%(-0.124)#50 | 3.5%(-2.41)#13,385 |
| 51. | Isabela | 1.1% | 1.2%(-0.171)#51 | 3.5%(-2.45)#13,600 |
| 52. | Santa Isabel | 1.0% | 1.2%(-0.225)#52 | 3.5%(-2.51)#13,833 |
| 53. | Catano | 0.94% | 1.2%(-0.305)#53 | 3.5%(-2.59)#14,174 |
| 54. | Gurabo | 0.91% | 1.2%(-0.335)#54 | 3.5%(-2.62)#14,321 |
| 55. | Vega Baja | 0.90% | 1.2%(-0.343)#55 | 3.5%(-2.63)#14,375 |
| 56. | Caño Martin Peña | 0.83% | 1.2%(-0.409)#56 | 3.5%(-2.69)#14,688 |
| 57. | Monte Grande | 0.82% | 1.2%(-0.420)#57 | 3.5%(-2.70)#14,744 |
| 58. | Ponce | 0.78% | 1.2%(-0.459)#58 | 3.5%(-2.74)#14,921 |
| 59. | Anasco | 0.74% | 1.2%(-0.505)#59 | 3.5%(-2.79)#15,144 |
| 60. | Sabana Seca | 0.70% | 1.2%(-0.541)#60 | 3.5%(-2.82)#15,306 |
| 61. | Penuelas | 0.69% | 1.2%(-0.551)#61 | 3.5%(-2.83)#15,347 |
| 62. | Puerto Real | 0.60% | 1.2%(-0.641)#62 | 3.5%(-2.92)#15,813 |
| 63. | Aibonito | 0.52% | 1.2%(-0.719)#63 | 3.5%(-3.00)#16,133 |
| 64. | San German | 0.41% | 1.2%(-0.835)#64 | 3.5%(-3.12)#16,592 |
| 65. | Adjuntas | 0.37% | 1.2%(-0.873)#65 | 3.5%(-3.16)#16,709 |
| 66. | Yabucoa | 0.30% | 1.2%(-0.944)#66 | 3.5%(-3.23)#16,915 |
| 67. | Manati | 0.29% | 1.2%(-0.952)#67 | 3.5%(-3.23)#16,939 |
| 68. | Hormigueros | 0.28% | 1.2%(-0.960)#68 | 3.5%(-3.24)#16,958 |
| 69. | Pajaros | 0.27% | 1.2%(-0.977)#69 | 3.5%(-3.26)#17,006 |
| 70. | Sabana Grande | 0.26% | 1.2%(-0.987)#70 | 3.5%(-3.27)#17,032 |
Common Questions
What are the Top 10 Cities with the Highest Percentage of Population Employed in Computer & Mathematics in Puerto Rico?
Top 10 Cities with the Highest Percentage of Population Employed in Computer & Mathematics in Puerto Rico are:
#1
15.8%
#2
7.9%
#3
6.7%
#4
6.5%
#5
4.9%
#6
4.6%
#7
4.2%
#8
4.1%
#9
3.9%
#10
3.4%
What city has the Highest Percentage of Population Employed in Computer & Mathematics in Puerto Rico?
Sabana Eneas has the Highest Percentage of Population Employed in Computer & Mathematics in Puerto Rico with 15.8%.
What is the Percentage of Population Employed in Computer & Mathematics in the State of Puerto Rico?
Percentage of Population Employed in Computer & Mathematics in Puerto Rico is 1.2%.
What is the Percentage of Population Employed in Computer & Mathematics in the United States?
Percentage of Population Employed in Computer & Mathematics in the United States is 3.5%.