Romanian vs Hawaiian Self-Care Disability

COMPARE

Romanian
Race
Ancestry
AfghanAfricanAlaska NativeAlaskan AthabascanAlbanianAleutAlsatianAmericanApacheArabArapahoArgentineanArmenianAssyrian/Chaldean/SyriacAustralianAustrianBahamianBangladeshiBarbadianBasqueBelgianBelizeanBermudanBhutaneseBlackfeetBolivianBrazilianBritishBritish West IndianBulgarianBurmeseCajunCambodianCanadianCape VerdeanCarpatho RusynCelticCentral AmericanCentral American IndianCherokeeCheyenneChickasawChileanChineseChippewaChoctawColombianColvilleComancheCosta RicanCreeCreekCroatianCrowCubanCypriotCzechCzechoslovakianDanishDelawareDominicanDutchDutch West IndianEastern EuropeanEcuadorianEgyptianEnglishEstonianEthiopianEuropeanFijianFilipinoFinnishFrenchFrench American IndianFrench CanadianGermanGerman RussianGhanaianGreekGuamanian/ChamorroGuatemalanGuyaneseHaitianHmongHonduranHopiHoumaHungarianIcelanderIndian (Asian)IndonesianInupiatIranianIraqiIrishIroquoisIsraeliItalianJamaicanJapaneseJordanianKenyanKiowaKoreanLaotianLatvianLebaneseLiberianLithuanianLumbeeLuxembourgerMacedonianMalaysianMalteseMarshalleseMenomineeMexicanMexican American IndianMongolianMoroccanNative HawaiianNavajoNepaleseNew ZealanderNicaraguanNigerianNorthern EuropeanNorwegianOkinawanOsageOttawaPaiutePakistaniPalestinianPanamanianParaguayanPennsylvania GermanPeruvianPimaPolishPortuguesePotawatomiPuebloPuerto RicanPuget Sound SalishRomanianRussianSalvadoranSamoanScandinavianScotch-IrishScottishSeminoleSenegaleseSerbianShoshoneSierra LeoneanSiouxSlavicSlovakSloveneSomaliSouth AfricanSouth AmericanSouth American IndianSoviet UnionSpaniardSpanishSpanish AmericanSpanish American IndianSri LankanSubsaharan AfricanSudaneseSwedishSwissSyrianTaiwaneseThaiTlingit-HaidaTohono O'OdhamTonganTrinidadian and TobagonianTsimshianTurkishU.S. Virgin IslanderUgandanUkrainianUruguayanUteVenezuelanVietnameseWelshWest IndianYakamaYaquiYugoslavianYumanYup'ikZimbabwean
Immigration
NonimmigrantsImmigrantsAfghanistanAfricaAlbaniaArgentinaArmeniaAsiaAustraliaAustriaBahamasBangladeshBarbadosBelarusBelgiumBelizeBoliviaBosnia and HerzegovinaBrazilBulgariaBurma/MyanmarCabo VerdeCambodiaCameroonCanadaCaribbeanCentral AmericaChileChinaColombiaCongoCosta RicaCroatiaCubaCzechoslovakiaDenmarkDominicaDominican RepublicEastern AfricaEastern AsiaEastern EuropeEcuadorEgyptEl SalvadorEnglandEritreaEthiopiaEuropeFijiFranceGermanyGhanaGreeceGrenadaGuatemalaGuyanaHaitiHondurasHong KongHungaryIndiaIndonesiaIranIraqIrelandIsraelItalyJamaicaJapanJordanKazakhstanKenyaKoreaKuwaitLaosLatin AmericaLatviaLebanonLiberiaLithuaniaMalaysiaMexicoMicronesiaMiddle AfricaMoldovaMoroccoNepalNetherlandsNicaraguaNigeriaNorth AmericaNorth MacedoniaNorthern AfricaNorthern EuropeNorwayOceaniaPakistanPanamaPeruPhilippinesPolandPortugalRomaniaRussiaSaudi ArabiaScotlandSenegalSerbiaSierra LeoneSingaporeSomaliaSouth AfricaSouth AmericaSouth Central AsiaSouth Eastern AsiaSouthern EuropeSpainSri LankaSt. Vincent and the GrenadinesSudanSwedenSwitzerlandSyriaTaiwanThailandTrinidad and TobagoTurkeyUgandaUkraineUruguayUzbekistanVenezuelaVietnamWest IndiesWestern AfricaWestern AsiaWestern EuropeYemenZaireZimbabweAzores
Hawaiian
Race
Ancestry
AfghanAfricanAlaska NativeAlaskan AthabascanAlbanianAleutAlsatianAmericanApacheArabArapahoArgentineanArmenianAssyrian/Chaldean/SyriacAustralianAustrianBahamianBangladeshiBarbadianBasqueBelgianBelizeanBermudanBhutaneseBlackfeetBolivianBrazilianBritishBritish West IndianBulgarianBurmeseCajunCambodianCanadianCape VerdeanCarpatho RusynCelticCentral AmericanCentral American IndianCherokeeCheyenneChickasawChileanChineseChippewaChoctawColombianColvilleComancheCosta RicanCreeCreekCroatianCrowCubanCypriotCzechCzechoslovakianDanishDelawareDominicanDutchDutch West IndianEastern EuropeanEcuadorianEgyptianEnglishEstonianEthiopianEuropeanFijianFilipinoFinnishFrenchFrench American IndianFrench CanadianGermanGerman RussianGhanaianGreekGuamanian/ChamorroGuatemalanGuyaneseHaitianHmongHonduranHopiHoumaHungarianIcelanderIndian (Asian)IndonesianInupiatIranianIraqiIrishIroquoisIsraeliItalianJamaicanJapaneseJordanianKenyanKiowaKoreanLaotianLatvianLebaneseLiberianLithuanianLumbeeLuxembourgerMacedonianMalaysianMalteseMarshalleseMenomineeMexicanMexican American IndianMongolianMoroccanNative HawaiianNavajoNepaleseNew ZealanderNicaraguanNigerianNorthern EuropeanNorwegianOkinawanOsageOttawaPaiutePakistaniPalestinianPanamanianParaguayanPennsylvania GermanPeruvianPimaPolishPortuguesePotawatomiPuebloPuerto RicanPuget Sound SalishRussianSalvadoranSamoanScandinavianScotch-IrishScottishSeminoleSenegaleseSerbianShoshoneSierra LeoneanSiouxSlavicSlovakSloveneSomaliSouth AfricanSouth AmericanSouth American IndianSoviet UnionSpaniardSpanishSpanish AmericanSpanish American IndianSri LankanSubsaharan AfricanSudaneseSwedishSwissSyrianTaiwaneseThaiTlingit-HaidaTohono O'OdhamTonganTrinidadian and TobagonianTsimshianTurkishU.S. Virgin IslanderUgandanUkrainianUruguayanUteVenezuelanVietnameseWelshWest IndianYakamaYaquiYugoslavianYumanYup'ikZimbabwean
Immigration
NonimmigrantsImmigrantsAfghanistanAfricaAlbaniaArgentinaArmeniaAsiaAustraliaAustriaBahamasBangladeshBarbadosBelarusBelgiumBelizeBoliviaBosnia and HerzegovinaBrazilBulgariaBurma/MyanmarCabo VerdeCambodiaCameroonCanadaCaribbeanCentral AmericaChileChinaColombiaCongoCosta RicaCroatiaCubaCzechoslovakiaDenmarkDominicaDominican RepublicEastern AfricaEastern AsiaEastern EuropeEcuadorEgyptEl SalvadorEnglandEritreaEthiopiaEuropeFijiFranceGermanyGhanaGreeceGrenadaGuatemalaGuyanaHaitiHondurasHong KongHungaryIndiaIndonesiaIranIraqIrelandIsraelItalyJamaicaJapanJordanKazakhstanKenyaKoreaKuwaitLaosLatin AmericaLatviaLebanonLiberiaLithuaniaMalaysiaMexicoMicronesiaMiddle AfricaMoldovaMoroccoNepalNetherlandsNicaraguaNigeriaNorth AmericaNorth MacedoniaNorthern AfricaNorthern EuropeNorwayOceaniaPakistanPanamaPeruPhilippinesPolandPortugalRomaniaRussiaSaudi ArabiaScotlandSenegalSerbiaSierra LeoneSingaporeSomaliaSouth AfricaSouth AmericaSouth Central AsiaSouth Eastern AsiaSouthern EuropeSpainSri LankaSt. Vincent and the GrenadinesSudanSwedenSwitzerlandSyriaTaiwanThailandTrinidad and TobagoTurkeyUgandaUkraineUruguayUzbekistanVenezuelaVietnamWest IndiesWestern AfricaWestern AsiaWestern EuropeYemenZaireZimbabweAzores
Self-Care Disability
Income
Poverty
Unemployment
Labor Participation
Family Structure
Vehicle Availability
Education Level
Disability

Self-Care Disability Comparison

Romanians

Hawaiians

Good
Tragic
2.4%
SELF-CARE DISABILITY
75.8/ 100
METRIC RATING
148th/ 347
METRIC RANK
2.6%
SELF-CARE DISABILITY
0.8/ 100
METRIC RATING
243rd/ 347
METRIC RANK

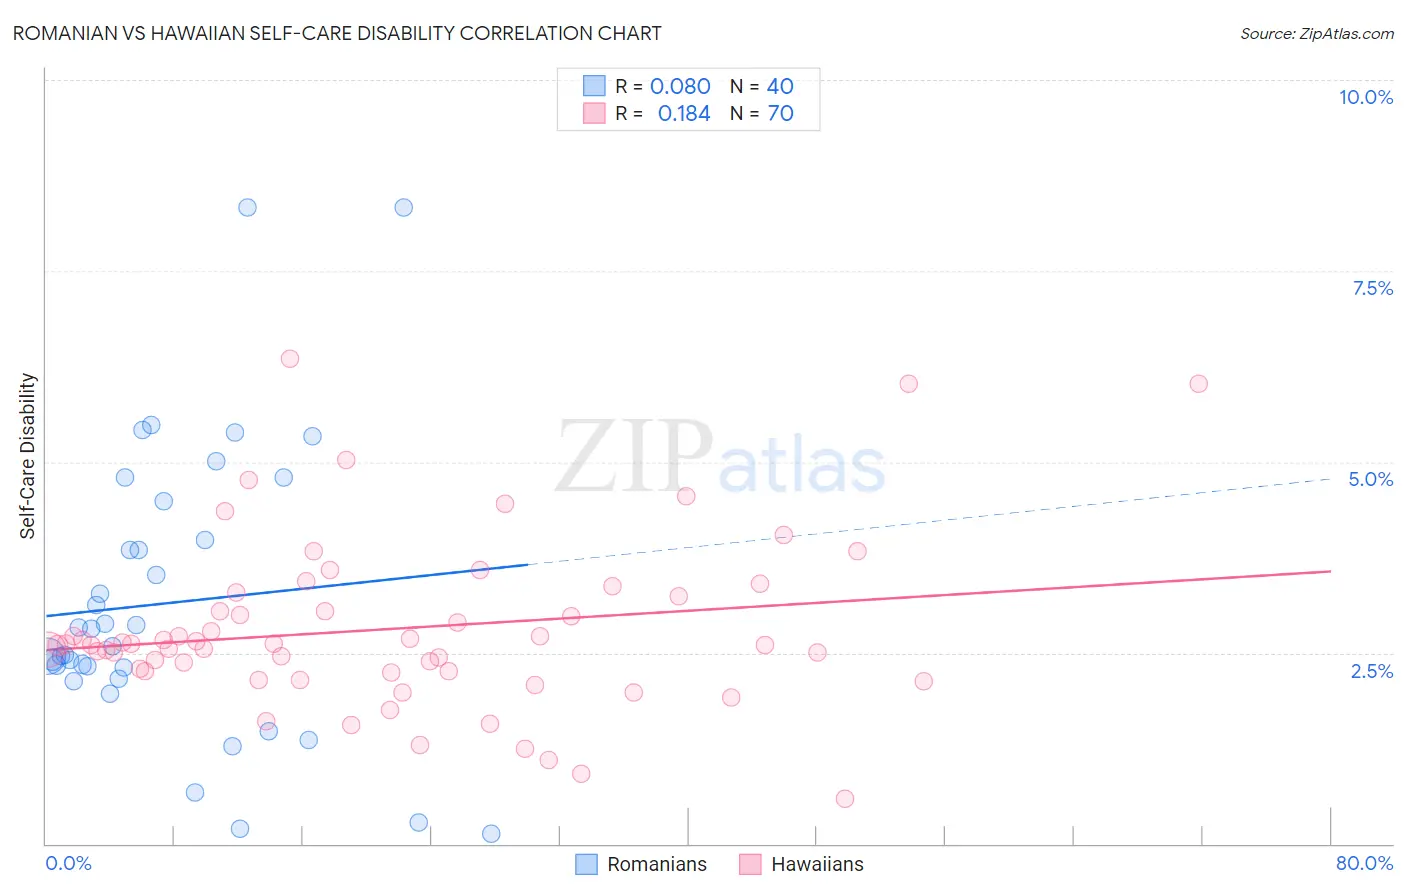
Romanian vs Hawaiian Self-Care Disability Correlation Chart

The statistical analysis conducted on geographies consisting of 377,466,974 people shows a slight positive correlation between the proportion of Romanians and percentage of population with self-care disability in the United States with a correlation coefficient (R) of 0.080 and weighted average of 2.4%. Similarly, the statistical analysis conducted on geographies consisting of 327,105,730 people shows a poor positive correlation between the proportion of Hawaiians and percentage of population with self-care disability in the United States with a correlation coefficient (R) of 0.184 and weighted average of 2.6%, a difference of 7.2%.
Romanian vs Hawaiian Self-Care Disability

Self-Care Disability Correlation Summary

MeasurementRomanianHawaiian
Minimum0.12%0.59%
Maximum8.3%6.3%
Range8.2%5.8%
Mean3.2%2.8%
Median2.7%2.6%
Interquartile 25% (IQ1)2.2%2.3%
Interquartile 75% (IQ3)4.2%3.2%
Interquartile Range (IQR)2.0%0.97%
Standard Deviation (Sample)1.9%1.1%
Standard Deviation (Population)1.9%1.1%

Similar Demographics by Self-Care Disability

Demographics Similar to Romanians by Self-Care Disability

In terms of self-care disability, the demographic groups most similar to Romanians are Arab (2.4%, a difference of 0.010%), Immigrants from Costa Rica (2.4%, a difference of 0.050%), Dutch (2.4%, a difference of 0.11%), Basque (2.4%, a difference of 0.12%), and Tlingit-Haida (2.4%, a difference of 0.15%).
DemographicsRating | RankSelf-Care Disability
Alaska Natives
84.5
/100
|
#141
Excellent
2.4%
Immigrants | Peru
83.2
/100
|
#142
Excellent
2.4%
Afghans
82.3
/100
|
#143
Excellent
2.4%
Costa Ricans
80.8
/100
|
#144
Excellent
2.4%
Germans
80.1
/100
|
#145
Excellent
2.4%
Israelis
80.0
/100
|
#146
Good
2.4%
Dutch
77.5
/100
|
#147
Good
2.4%
Romanians
75.8
/100
|
#148
Good
2.4%
Arabs
75.7
/100
|
#149
Good
2.4%
Immigrants | Costa Rica
75.1
/100
|
#150
Good
2.4%
Basques
74.0
/100
|
#151
Good
2.4%
Tlingit-Haida
73.5
/100
|
#152
Good
2.4%
Immigrants | England
73.5
/100
|
#153
Good
2.4%
Italians
72.2
/100
|
#154
Good
2.4%
Pakistanis
71.4
/100
|
#155
Good
2.4%

Demographics Similar to Hawaiians by Self-Care Disability

In terms of self-care disability, the demographic groups most similar to Hawaiians are Yuman (2.6%, a difference of 0.040%), Spanish (2.6%, a difference of 0.070%), Immigrants from Western Asia (2.6%, a difference of 0.23%), Cheyenne (2.6%, a difference of 0.25%), and Immigrants from Syria (2.6%, a difference of 0.31%).
DemographicsRating | RankSelf-Care Disability
Bermudans
1.9
/100
|
#236
Tragic
2.6%
Immigrants | Senegal
1.6
/100
|
#237
Tragic
2.6%
Senegalese
1.3
/100
|
#238
Tragic
2.6%
Immigrants | Panama
1.2
/100
|
#239
Tragic
2.6%
Marshallese
1.2
/100
|
#240
Tragic
2.6%
Immigrants | Syria
1.0
/100
|
#241
Tragic
2.6%
Spanish
0.8
/100
|
#242
Tragic
2.6%
Hawaiians
0.8
/100
|
#243
Tragic
2.6%
Yuman
0.8
/100
|
#244
Tragic
2.6%
Immigrants | Western Asia
0.6
/100
|
#245
Tragic
2.6%
Cheyenne
0.6
/100
|
#246
Tragic
2.6%
Immigrants | Albania
0.6
/100
|
#247
Tragic
2.6%
Nicaraguans
0.6
/100
|
#248
Tragic
2.6%
Mexican American Indians
0.5
/100
|
#249
Tragic
2.6%
Portuguese
0.4
/100
|
#250
Tragic
2.6%