Austrian Female Disability
COMPARE
Austrian
Select to Compare
Female Disability
Austrian Female Disability
12.3%
DISABILITY | FEMALES
33.3/ 100
METRIC RATING
186th/ 347
METRIC RANK
Austrian Female Disability Correlation Chart
The statistical analysis conducted on geographies consisting of 452,021,932 people shows a moderate positive correlation between the proportion of Austrians and percentage of females with a disability in the United States with a correlation coefficient (R) of 0.468 and weighted average of 12.3%. On average, for every 1% (one percent) increase in Austrians within a typical geography, there is an increase of 1.1% in percentage of females with a disability.
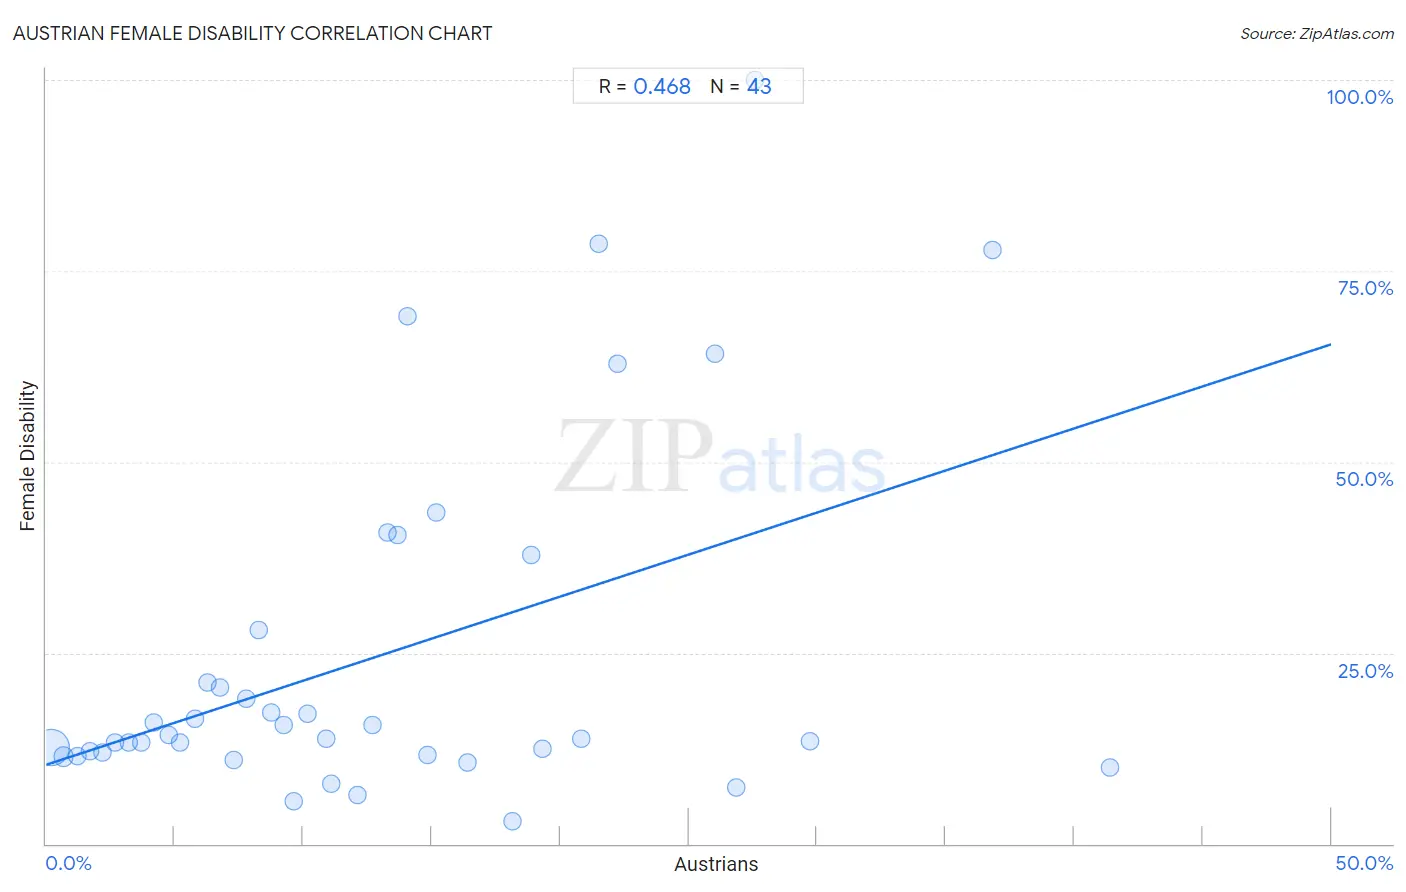
It is essential to understand that the correlation between the percentage of Austrians and percentage of females with a disability does not imply a direct cause-and-effect relationship. It remains uncertain whether the presence of Austrians influences an upward or downward trend in the level of percentage of females with a disability within an area, or if Austrians simply ended up residing in those areas with higher or lower levels of percentage of females with a disability due to other factors.
Demographics Similar to Austrians by Female Disability
In terms of female disability, the demographic groups most similar to Austrians are Serbian (12.3%, a difference of 0.010%), Immigrants from Uzbekistan (12.3%, a difference of 0.020%), Immigrants from North America (12.3%, a difference of 0.020%), Immigrants from Albania (12.3%, a difference of 0.080%), and Immigrants from Honduras (12.3%, a difference of 0.090%).
| Demographics | Rating | Rank | Female Disability |
| Immigrants from Fiji | 38.2 /100 | #179 | Fair 12.3% |
| Albanians | 37.9 /100 | #180 | Fair 12.3% |
| Immigrants from Canada | 37.2 /100 | #181 | Fair 12.3% |
| Norwegians | 36.9 /100 | #182 | Fair 12.3% |
| Cubans | 36.5 /100 | #183 | Fair 12.3% |
| Iraqis | 36.0 /100 | #184 | Fair 12.3% |
| Immigrants from Uzbekistan | 33.9 /100 | #185 | Fair 12.3% |
| Austrians | 33.3 /100 | #186 | Fair 12.3% |
| Serbians | 33.1 /100 | #187 | Fair 12.3% |
| Immigrants from North America | 32.8 /100 | #188 | Fair 12.3% |
| Immigrants from Albania | 31.6 /100 | #189 | Fair 12.3% |
| Immigrants from Honduras | 31.3 /100 | #190 | Fair 12.3% |
| Armenians | 29.7 /100 | #191 | Fair 12.3% |
| Immigrants from Western Africa | 29.2 /100 | #192 | Fair 12.3% |
| Northern Europeans | 27.5 /100 | #193 | Fair 12.3% |
Austrian Female Disability Correlation Summary
| Measurement | Austrian Data | Female Disability Data |
| Minimum | 0.17% | 2.9% |
| Maximum | 41.4% | 100.0% |
| Range | 41.2% | 97.1% |
| Mean | 12.9% | 24.5% |
| Median | 10.9% | 13.7% |
| Interquartile 25% (IQ1) | 5.2% | 11.6% |
| Interquartile 75% (IQ3) | 18.9% | 28.0% |
| Interquartile Range (IQR) | 13.6% | 16.3% |
| Standard Deviation (Sample) | 9.8% | 23.1% |
| Standard Deviation (Population) | 9.7% | 22.8% |
Correlation Details
| Austrian Percentile | Sample Size | Female Disability |
[ 0.0% - 0.5% ] 0.17% | 406,542,164 | 12.6% |
[ 0.5% - 1.0% ] 0.67% | 36,555,289 | 11.4% |
[ 1.0% - 1.5% ] 1.20% | 6,159,193 | 11.5% |
[ 1.5% - 2.0% ] 1.70% | 1,579,127 | 12.1% |
[ 2.0% - 2.5% ] 2.20% | 467,453 | 11.9% |
[ 2.5% - 3.0% ] 2.70% | 271,075 | 13.3% |
[ 3.0% - 3.5% ] 3.20% | 140,044 | 13.3% |
[ 3.5% - 4.0% ] 3.71% | 105,604 | 13.2% |
[ 4.0% - 4.5% ] 4.18% | 73,877 | 15.8% |
[ 4.5% - 5.0% ] 4.79% | 28,376 | 14.3% |
[ 5.0% - 5.5% ] 5.22% | 18,135 | 13.3% |
[ 5.5% - 6.0% ] 5.77% | 11,371 | 16.3% |
[ 6.0% - 6.5% ] 6.26% | 13,184 | 21.0% |
[ 6.5% - 7.0% ] 6.75% | 7,291 | 20.4% |
[ 7.0% - 7.5% ] 7.29% | 9,799 | 10.9% |
[ 7.5% - 8.0% ] 7.79% | 7,707 | 18.9% |
[ 8.0% - 8.5% ] 8.29% | 1,062 | 28.0% |
[ 8.5% - 9.0% ] 8.77% | 3,148 | 17.2% |
[ 9.0% - 9.5% ] 9.25% | 1,438 | 15.6% |
[ 9.5% - 10.0% ] 9.62% | 4,087 | 5.5% |
[ 10.0% - 10.5% ] 10.18% | 3,449 | 17.0% |
[ 10.5% - 11.0% ] 10.89% | 3,765 | 13.7% |
[ 11.0% - 11.5% ] 11.08% | 704 | 7.8% |
[ 12.0% - 12.5% ] 12.09% | 521 | 6.5% |
[ 12.5% - 13.0% ] 12.68% | 5,993 | 15.6% |
[ 13.0% - 13.5% ] 13.26% | 377 | 40.7% |
[ 13.5% - 14.0% ] 13.68% | 117 | 40.4% |
[ 14.0% - 14.5% ] 14.06% | 313 | 69.1% |
[ 14.5% - 15.0% ] 14.86% | 1,198 | 11.6% |
[ 15.0% - 15.5% ] 15.15% | 99 | 43.3% |
[ 16.0% - 16.5% ] 16.38% | 2,802 | 10.7% |
[ 18.0% - 18.5% ] 18.14% | 397 | 2.9% |
[ 18.5% - 19.0% ] 18.87% | 318 | 37.7% |
[ 19.0% - 19.5% ] 19.31% | 378 | 12.5% |
[ 20.5% - 21.0% ] 20.81% | 620 | 13.7% |
[ 21.0% - 21.5% ] 21.50% | 107 | 78.6% |
[ 22.0% - 22.5% ] 22.22% | 72 | 62.9% |
[ 26.0% - 26.5% ] 26.04% | 192 | 64.2% |
[ 26.5% - 27.0% ] 26.84% | 652 | 7.4% |
[ 27.5% - 28.0% ] 27.59% | 29 | 100.0% |
[ 29.5% - 30.0% ] 29.70% | 101 | 13.4% |
[ 36.5% - 37.0% ] 36.84% | 19 | 77.8% |
[ 41.0% - 41.5% ] 41.40% | 285 | 9.9% |