Ugandan Female Disability

COMPARE

Ugandan
Race
Ancestry
AfghanAfricanAlaska NativeAlaskan AthabascanAlbanianAleutAlsatianAmericanApacheArabArapahoArgentineanArmenianAssyrian/Chaldean/SyriacAustralianAustrianBahamianBangladeshiBarbadianBasqueBelgianBelizeanBermudanBhutaneseBlackfeetBolivianBrazilianBritishBritish West IndianBulgarianBurmeseCajunCambodianCanadianCape VerdeanCarpatho RusynCelticCentral AmericanCentral American IndianCherokeeCheyenneChickasawChileanChineseChippewaChoctawColombianColvilleComancheCosta RicanCreeCreekCroatianCrowCubanCypriotCzechCzechoslovakianDanishDelawareDominicanDutchDutch West IndianEastern EuropeanEcuadorianEgyptianEnglishEstonianEthiopianEuropeanFijianFilipinoFinnishFrenchFrench American IndianFrench CanadianGermanGerman RussianGhanaianGreekGuamanian/ChamorroGuatemalanGuyaneseHaitianHmongHonduranHopiHoumaHungarianIcelanderIndian (Asian)IndonesianInupiatIranianIraqiIrishIroquoisIsraeliItalianJamaicanJapaneseJordanianKenyanKiowaKoreanLaotianLatvianLebaneseLiberianLithuanianLumbeeLuxembourgerMacedonianMalaysianMalteseMarshalleseMenomineeMexicanMexican American IndianMongolianMoroccanNative HawaiianNavajoNepaleseNew ZealanderNicaraguanNigerianNorthern EuropeanNorwegianOkinawanOsageOttawaPaiutePakistaniPalestinianPanamanianParaguayanPennsylvania GermanPeruvianPimaPolishPortuguesePotawatomiPuebloPuerto RicanPuget Sound SalishRomanianRussianSalvadoranSamoanScandinavianScotch-IrishScottishSeminoleSenegaleseSerbianShoshoneSierra LeoneanSiouxSlavicSlovakSloveneSomaliSouth AfricanSouth AmericanSouth American IndianSoviet UnionSpaniardSpanishSpanish AmericanSpanish American IndianSri LankanSubsaharan AfricanSudaneseSwedishSwissSyrianTaiwaneseThaiTlingit-HaidaTohono O'OdhamTonganTrinidadian and TobagonianTsimshianTurkishU.S. Virgin IslanderUgandanUkrainianUruguayanUteVenezuelanVietnameseWelshWest IndianYakamaYaquiYugoslavianYumanYup'ikZimbabwean
Immigration
NonimmigrantsImmigrantsAfghanistanAfricaAlbaniaArgentinaArmeniaAsiaAustraliaAustriaBahamasBangladeshBarbadosBelarusBelgiumBelizeBoliviaBosnia and HerzegovinaBrazilBulgariaBurma/MyanmarCabo VerdeCambodiaCameroonCanadaCaribbeanCentral AmericaChileChinaColombiaCongoCosta RicaCroatiaCubaCzechoslovakiaDenmarkDominicaDominican RepublicEastern AfricaEastern AsiaEastern EuropeEcuadorEgyptEl SalvadorEnglandEritreaEthiopiaEuropeFijiFranceGermanyGhanaGreeceGrenadaGuatemalaGuyanaHaitiHondurasHong KongHungaryIndiaIndonesiaIranIraqIrelandIsraelItalyJamaicaJapanJordanKazakhstanKenyaKoreaKuwaitLaosLatin AmericaLatviaLebanonLiberiaLithuaniaMalaysiaMexicoMicronesiaMiddle AfricaMoldovaMoroccoNepalNetherlandsNicaraguaNigeriaNorth AmericaNorth MacedoniaNorthern AfricaNorthern EuropeNorwayOceaniaPakistanPanamaPeruPhilippinesPolandPortugalRomaniaRussiaSaudi ArabiaScotlandSenegalSerbiaSierra LeoneSingaporeSomaliaSouth AfricaSouth AmericaSouth Central AsiaSouth Eastern AsiaSouthern EuropeSpainSri LankaSt. Vincent and the GrenadinesSudanSwedenSwitzerlandSyriaTaiwanThailandTrinidad and TobagoTurkeyUgandaUkraineUruguayUzbekistanVenezuelaVietnamWest IndiesWestern AfricaWestern AsiaWestern EuropeYemenZaireZimbabweAzores
Select to Compare
Race
Ancestry
AfghanAfricanAlaska NativeAlaskan AthabascanAlbanianAleutAlsatianAmericanApacheArabArapahoArgentineanArmenianAssyrian/Chaldean/SyriacAustralianAustrianBahamianBangladeshiBarbadianBasqueBelgianBelizeanBermudanBhutaneseBlackfeetBolivianBrazilianBritishBritish West IndianBulgarianBurmeseCajunCambodianCanadianCape VerdeanCarpatho RusynCelticCentral AmericanCentral American IndianCherokeeCheyenneChickasawChileanChineseChippewaChoctawColombianColvilleComancheCosta RicanCreeCreekCroatianCrowCubanCypriotCzechCzechoslovakianDanishDelawareDominicanDutchDutch West IndianEastern EuropeanEcuadorianEgyptianEnglishEstonianEthiopianEuropeanFijianFilipinoFinnishFrenchFrench American IndianFrench CanadianGermanGerman RussianGhanaianGreekGuamanian/ChamorroGuatemalanGuyaneseHaitianHmongHonduranHopiHoumaHungarianIcelanderIndian (Asian)IndonesianInupiatIranianIraqiIrishIroquoisIsraeliItalianJamaicanJapaneseJordanianKenyanKiowaKoreanLaotianLatvianLebaneseLiberianLithuanianLumbeeLuxembourgerMacedonianMalaysianMalteseMarshalleseMenomineeMexicanMexican American IndianMongolianMoroccanNative HawaiianNavajoNepaleseNew ZealanderNicaraguanNigerianNorthern EuropeanNorwegianOkinawanOsageOttawaPaiutePakistaniPalestinianPanamanianParaguayanPennsylvania GermanPeruvianPimaPolishPortuguesePotawatomiPuebloPuerto RicanPuget Sound SalishRomanianRussianSalvadoranSamoanScandinavianScotch-IrishScottishSeminoleSenegaleseSerbianShoshoneSierra LeoneanSiouxSlavicSlovakSloveneSomaliSouth AfricanSouth AmericanSouth American IndianSoviet UnionSpaniardSpanishSpanish AmericanSpanish American IndianSri LankanSubsaharan AfricanSudaneseSwedishSwissSyrianTaiwaneseThaiTlingit-HaidaTohono O'OdhamTonganTrinidadian and TobagonianTsimshianTurkishU.S. Virgin IslanderUkrainianUruguayanUteVenezuelanVietnameseWelshWest IndianYakamaYaquiYugoslavianYumanYup'ikZimbabwean
Immigration
NonimmigrantsImmigrantsAfghanistanAfricaAlbaniaArgentinaArmeniaAsiaAustraliaAustriaBahamasBangladeshBarbadosBelarusBelgiumBelizeBoliviaBosnia and HerzegovinaBrazilBulgariaBurma/MyanmarCabo VerdeCambodiaCameroonCanadaCaribbeanCentral AmericaChileChinaColombiaCongoCosta RicaCroatiaCubaCzechoslovakiaDenmarkDominicaDominican RepublicEastern AfricaEastern AsiaEastern EuropeEcuadorEgyptEl SalvadorEnglandEritreaEthiopiaEuropeFijiFranceGermanyGhanaGreeceGrenadaGuatemalaGuyanaHaitiHondurasHong KongHungaryIndiaIndonesiaIranIraqIrelandIsraelItalyJamaicaJapanJordanKazakhstanKenyaKoreaKuwaitLaosLatin AmericaLatviaLebanonLiberiaLithuaniaMalaysiaMexicoMicronesiaMiddle AfricaMoldovaMoroccoNepalNetherlandsNicaraguaNigeriaNorth AmericaNorth MacedoniaNorthern AfricaNorthern EuropeNorwayOceaniaPakistanPanamaPeruPhilippinesPolandPortugalRomaniaRussiaSaudi ArabiaScotlandSenegalSerbiaSierra LeoneSingaporeSomaliaSouth AfricaSouth AmericaSouth Central AsiaSouth Eastern AsiaSouthern EuropeSpainSri LankaSt. Vincent and the GrenadinesSudanSwedenSwitzerlandSyriaTaiwanThailandTrinidad and TobagoTurkeyUgandaUkraineUruguayUzbekistanVenezuelaVietnamWest IndiesWestern AfricaWestern AsiaWestern EuropeYemenZaireZimbabweAzores
Female Disability
Income
Poverty
Unemployment
Labor Participation
Family Structure
Vehicle Availability
Education Level
Disability

Ugandan Female Disability
Exceptional

11.9%
DISABILITY | FEMALES
94.0/ 100
METRIC RATING
136th/ 347
METRIC RANK

Ugandan Female Disability Correlation Chart

The statistical analysis conducted on geographies consisting of 94,017,186 people shows a slight positive correlation between the proportion of Ugandans and percentage of females with a disability in the United States with a correlation coefficient (R) of 0.067 and weighted average of 11.9%. On average, for every 1% (one percent) increase in Ugandans within a typical geography, there is an increase of 0.079% in percentage of females with a disability.
Ugandan Female Disability
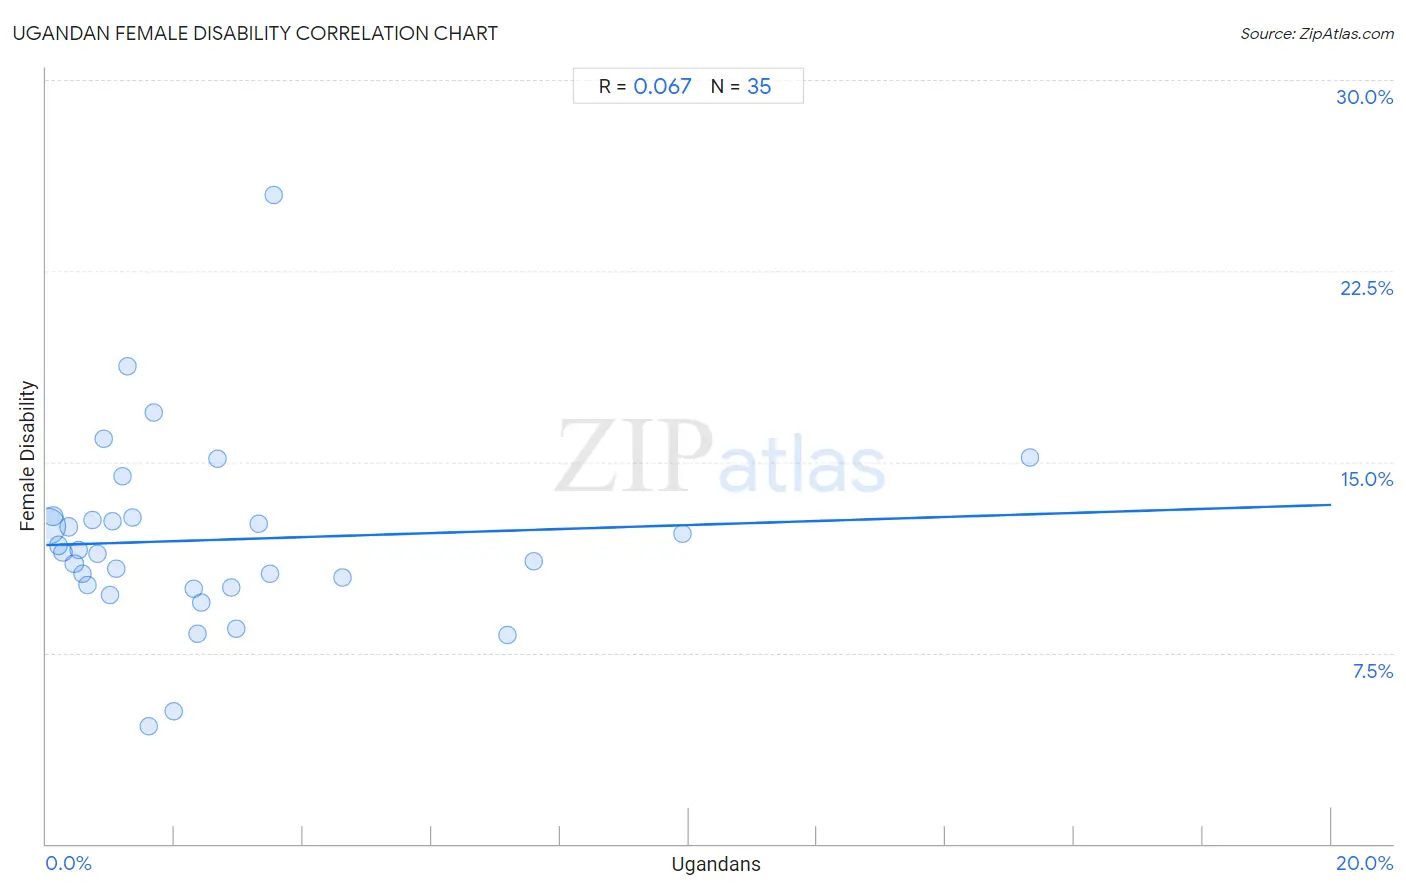
It is essential to understand that the correlation between the percentage of Ugandans and percentage of females with a disability does not imply a direct cause-and-effect relationship. It remains uncertain whether the presence of Ugandans influences an upward or downward trend in the level of percentage of females with a disability within an area, or if Ugandans simply ended up residing in those areas with higher or lower levels of percentage of females with a disability due to other factors.

Demographics Similar to Ugandans by Female Disability

In terms of female disability, the demographic groups most similar to Ugandans are Central American (11.9%, a difference of 0.030%), Immigrants from Norway (11.9%, a difference of 0.040%), Kenyan (11.9%, a difference of 0.090%), Immigrants from Nicaragua (11.9%, a difference of 0.090%), and Immigrants from Syria (11.9%, a difference of 0.10%).
DemographicsRating | RankFemale Disability
Macedonians
95.5
/100
|
#129
Exceptional
11.8%
Nicaraguans
95.2
/100
|
#130
Exceptional
11.9%
Arabs
95.1
/100
|
#131
Exceptional
11.9%
Immigrants from Syria
94.6
/100
|
#132
Exceptional
11.9%
Kenyans
94.5
/100
|
#133
Exceptional
11.9%
Immigrants from Nicaragua
94.5
/100
|
#134
Exceptional
11.9%
Central Americans
94.2
/100
|
#135
Exceptional
11.9%
Ugandans
94.0
/100
|
#136
Exceptional
11.9%
Immigrants from Norway
93.8
/100
|
#137
Exceptional
11.9%
Ecuadorians
93.4
/100
|
#138
Exceptional
11.9%
Immigrants from Hungary
92.8
/100
|
#139
Exceptional
11.9%
Romanians
91.6
/100
|
#140
Exceptional
11.9%
Immigrants from Ecuador
91.5
/100
|
#141
Exceptional
11.9%
Immigrants from Africa
90.0
/100
|
#142
Excellent
11.9%
Immigrants from Sudan
89.6
/100
|
#143
Excellent
11.9%

Ugandan Female Disability Correlation Summary

MeasurementUgandan DataFemale Disability Data
Minimum0.016%4.6%
Maximum15.3%25.5%
Range15.3%20.8%
Mean2.5%11.9%
Median1.3%11.5%
Interquartile 25% (IQ1)0.64%10.1%
Interquartile 75% (IQ3)3.0%12.8%
Interquartile Range (IQR)2.3%2.8%
Standard Deviation (Sample)3.2%3.7%
Standard Deviation (Population)3.1%3.7%

Correlation Details

Ugandan PercentileSample SizeFemale Disability
[
0.0%
-
0.5%
]
0.016%
81,499,76612.5%
[
0.0%
-
0.5%
]
0.10%
6,235,64512.9%
[
0.0%
-
0.5%
]
0.19%
2,313,26111.7%
[
0.0%
-
0.5%
]
0.26%
1,403,38811.5%
[
0.0%
-
0.5%
]
0.35%
576,21112.4%
[
0.0%
-
0.5%
]
0.44%
564,43111.0%
[
0.0%
-
0.5%
]
0.50%
258,14611.6%
[
0.5%
-
1.0%
]
0.57%
194,87010.6%
[
0.5%
-
1.0%
]
0.64%
253,51910.2%
[
0.5%
-
1.0%
]
0.72%
114,41712.7%
[
0.5%
-
1.0%
]
0.80%
123,60011.4%
[
0.5%
-
1.0%
]
0.90%
39,94115.9%
[
0.5%
-
1.0%
]
0.98%
27,5199.8%
[
1.0%
-
1.5%
]
1.03%
18,17012.7%
[
1.0%
-
1.5%
]
1.10%
163,76710.8%
[
1.0%
-
1.5%
]
1.19%
44,20814.4%
[
1.0%
-
1.5%
]
1.26%
13,51618.8%
[
1.0%
-
1.5%
]
1.34%
49,07412.8%
[
1.5%
-
2.0%
]
1.60%
5,6824.6%
[
1.5%
-
2.0%
]
1.68%
23816.9%
[
1.5%
-
2.0%
]
1.99%
6045.2%
[
2.0%
-
2.5%
]
2.29%
1,04910.0%
[
2.0%
-
2.5%
]
2.36%
14,2028.2%
[
2.0%
-
2.5%
]
2.42%
9,0199.5%
[
2.5%
-
3.0%
]
2.67%
1,01015.1%
[
2.5%
-
3.0%
]
2.87%
16,14510.1%
[
2.5%
-
3.0%
]
2.96%
34,5368.4%
[
3.0%
-
3.5%
]
3.30%
6,42612.6%
[
3.0%
-
3.5%
]
3.47%
2,27410.6%
[
3.5%
-
4.0%
]
3.55%
50725.5%
[
4.5%
-
5.0%
]
4.61%
26,68410.5%
[
7.0%
-
7.5%
]
7.17%
2,9008.2%
[
7.5%
-
8.0%
]
7.59%
31611.1%
[
9.5%
-
10.0%
]
9.90%
1,30312.2%
[
15.0%
-
15.5%
]
15.32%
84215.2%