Austrian GED/Equivalency

COMPARE

Austrian
Race
Ancestry
AfghanAfricanAlaska NativeAlaskan AthabascanAlbanianAleutAlsatianAmericanApacheArabArapahoArgentineanArmenianAssyrian/Chaldean/SyriacAustralianAustrianBahamianBangladeshiBarbadianBasqueBelgianBelizeanBermudanBhutaneseBlackfeetBolivianBrazilianBritishBritish West IndianBulgarianBurmeseCajunCambodianCanadianCape VerdeanCarpatho RusynCelticCentral AmericanCentral American IndianCherokeeCheyenneChickasawChileanChineseChippewaChoctawColombianColvilleComancheCosta RicanCreeCreekCroatianCrowCubanCypriotCzechCzechoslovakianDanishDelawareDominicanDutchDutch West IndianEastern EuropeanEcuadorianEgyptianEnglishEstonianEthiopianEuropeanFijianFilipinoFinnishFrenchFrench American IndianFrench CanadianGermanGerman RussianGhanaianGreekGuamanian/ChamorroGuatemalanGuyaneseHaitianHmongHonduranHopiHoumaHungarianIcelanderIndian (Asian)IndonesianInupiatIranianIraqiIrishIroquoisIsraeliItalianJamaicanJapaneseJordanianKenyanKiowaKoreanLaotianLatvianLebaneseLiberianLithuanianLumbeeLuxembourgerMacedonianMalaysianMalteseMarshalleseMenomineeMexicanMexican American IndianMongolianMoroccanNative HawaiianNavajoNepaleseNew ZealanderNicaraguanNigerianNorthern EuropeanNorwegianOkinawanOsageOttawaPaiutePakistaniPalestinianPanamanianParaguayanPennsylvania GermanPeruvianPimaPolishPortuguesePotawatomiPuebloPuerto RicanPuget Sound SalishRomanianRussianSalvadoranSamoanScandinavianScotch-IrishScottishSeminoleSenegaleseSerbianShoshoneSierra LeoneanSiouxSlavicSlovakSloveneSomaliSouth AfricanSouth AmericanSouth American IndianSoviet UnionSpaniardSpanishSpanish AmericanSpanish American IndianSri LankanSubsaharan AfricanSudaneseSwedishSwissSyrianTaiwaneseThaiTlingit-HaidaTohono O'OdhamTonganTrinidadian and TobagonianTsimshianTurkishU.S. Virgin IslanderUgandanUkrainianUruguayanUteVenezuelanVietnameseWelshWest IndianYakamaYaquiYugoslavianYumanYup'ikZimbabwean
Immigration
NonimmigrantsImmigrantsAfghanistanAfricaAlbaniaArgentinaArmeniaAsiaAustraliaAustriaBahamasBangladeshBarbadosBelarusBelgiumBelizeBoliviaBosnia and HerzegovinaBrazilBulgariaBurma/MyanmarCabo VerdeCambodiaCameroonCanadaCaribbeanCentral AmericaChileChinaColombiaCongoCosta RicaCroatiaCubaCzechoslovakiaDenmarkDominicaDominican RepublicEastern AfricaEastern AsiaEastern EuropeEcuadorEgyptEl SalvadorEnglandEritreaEthiopiaEuropeFijiFranceGermanyGhanaGreeceGrenadaGuatemalaGuyanaHaitiHondurasHong KongHungaryIndiaIndonesiaIranIraqIrelandIsraelItalyJamaicaJapanJordanKazakhstanKenyaKoreaKuwaitLaosLatin AmericaLatviaLebanonLiberiaLithuaniaMalaysiaMexicoMicronesiaMiddle AfricaMoldovaMoroccoNepalNetherlandsNicaraguaNigeriaNorth AmericaNorth MacedoniaNorthern AfricaNorthern EuropeNorwayOceaniaPakistanPanamaPeruPhilippinesPolandPortugalRomaniaRussiaSaudi ArabiaScotlandSenegalSerbiaSierra LeoneSingaporeSomaliaSouth AfricaSouth AmericaSouth Central AsiaSouth Eastern AsiaSouthern EuropeSpainSri LankaSt. Vincent and the GrenadinesSudanSwedenSwitzerlandSyriaTaiwanThailandTrinidad and TobagoTurkeyUgandaUkraineUruguayUzbekistanVenezuelaVietnamWest IndiesWestern AfricaWestern AsiaWestern EuropeYemenZaireZimbabweAzores
Select to Compare
Race
Ancestry
AfghanAfricanAlaska NativeAlaskan AthabascanAlbanianAleutAlsatianAmericanApacheArabArapahoArgentineanArmenianAssyrian/Chaldean/SyriacAustralianBahamianBangladeshiBarbadianBasqueBelgianBelizeanBermudanBhutaneseBlackfeetBolivianBrazilianBritishBritish West IndianBulgarianBurmeseCajunCambodianCanadianCape VerdeanCarpatho RusynCelticCentral AmericanCentral American IndianCherokeeCheyenneChickasawChileanChineseChippewaChoctawColombianColvilleComancheCosta RicanCreeCreekCroatianCrowCubanCypriotCzechCzechoslovakianDanishDelawareDominicanDutchDutch West IndianEastern EuropeanEcuadorianEgyptianEnglishEstonianEthiopianEuropeanFijianFilipinoFinnishFrenchFrench American IndianFrench CanadianGermanGerman RussianGhanaianGreekGuamanian/ChamorroGuatemalanGuyaneseHaitianHmongHonduranHopiHoumaHungarianIcelanderIndian (Asian)IndonesianInupiatIranianIraqiIrishIroquoisIsraeliItalianJamaicanJapaneseJordanianKenyanKiowaKoreanLaotianLatvianLebaneseLiberianLithuanianLumbeeLuxembourgerMacedonianMalaysianMalteseMarshalleseMenomineeMexicanMexican American IndianMongolianMoroccanNative HawaiianNavajoNepaleseNew ZealanderNicaraguanNigerianNorthern EuropeanNorwegianOkinawanOsageOttawaPaiutePakistaniPalestinianPanamanianParaguayanPennsylvania GermanPeruvianPimaPolishPortuguesePotawatomiPuebloPuerto RicanPuget Sound SalishRomanianRussianSalvadoranSamoanScandinavianScotch-IrishScottishSeminoleSenegaleseSerbianShoshoneSierra LeoneanSiouxSlavicSlovakSloveneSomaliSouth AfricanSouth AmericanSouth American IndianSoviet UnionSpaniardSpanishSpanish AmericanSpanish American IndianSri LankanSubsaharan AfricanSudaneseSwedishSwissSyrianTaiwaneseThaiTlingit-HaidaTohono O'OdhamTonganTrinidadian and TobagonianTsimshianTurkishU.S. Virgin IslanderUgandanUkrainianUruguayanUteVenezuelanVietnameseWelshWest IndianYakamaYaquiYugoslavianYumanYup'ikZimbabwean
Immigration
NonimmigrantsImmigrantsAfghanistanAfricaAlbaniaArgentinaArmeniaAsiaAustraliaAustriaBahamasBangladeshBarbadosBelarusBelgiumBelizeBoliviaBosnia and HerzegovinaBrazilBulgariaBurma/MyanmarCabo VerdeCambodiaCameroonCanadaCaribbeanCentral AmericaChileChinaColombiaCongoCosta RicaCroatiaCubaCzechoslovakiaDenmarkDominicaDominican RepublicEastern AfricaEastern AsiaEastern EuropeEcuadorEgyptEl SalvadorEnglandEritreaEthiopiaEuropeFijiFranceGermanyGhanaGreeceGrenadaGuatemalaGuyanaHaitiHondurasHong KongHungaryIndiaIndonesiaIranIraqIrelandIsraelItalyJamaicaJapanJordanKazakhstanKenyaKoreaKuwaitLaosLatin AmericaLatviaLebanonLiberiaLithuaniaMalaysiaMexicoMicronesiaMiddle AfricaMoldovaMoroccoNepalNetherlandsNicaraguaNigeriaNorth AmericaNorth MacedoniaNorthern AfricaNorthern EuropeNorwayOceaniaPakistanPanamaPeruPhilippinesPolandPortugalRomaniaRussiaSaudi ArabiaScotlandSenegalSerbiaSierra LeoneSingaporeSomaliaSouth AfricaSouth AmericaSouth Central AsiaSouth Eastern AsiaSouthern EuropeSpainSri LankaSt. Vincent and the GrenadinesSudanSwedenSwitzerlandSyriaTaiwanThailandTrinidad and TobagoTurkeyUgandaUkraineUruguayUzbekistanVenezuelaVietnamWest IndiesWestern AfricaWestern AsiaWestern EuropeYemenZaireZimbabweAzores
GED/Equivalency
Income
Poverty
Unemployment
Labor Participation
Family Structure
Vehicle Availability
Education Level
Disability

Austrian GED/Equivalency
Exceptional

87.7%
GED/EQUIVALENCY
98.8/ 100
METRIC RATING
71st/ 347
METRIC RANK

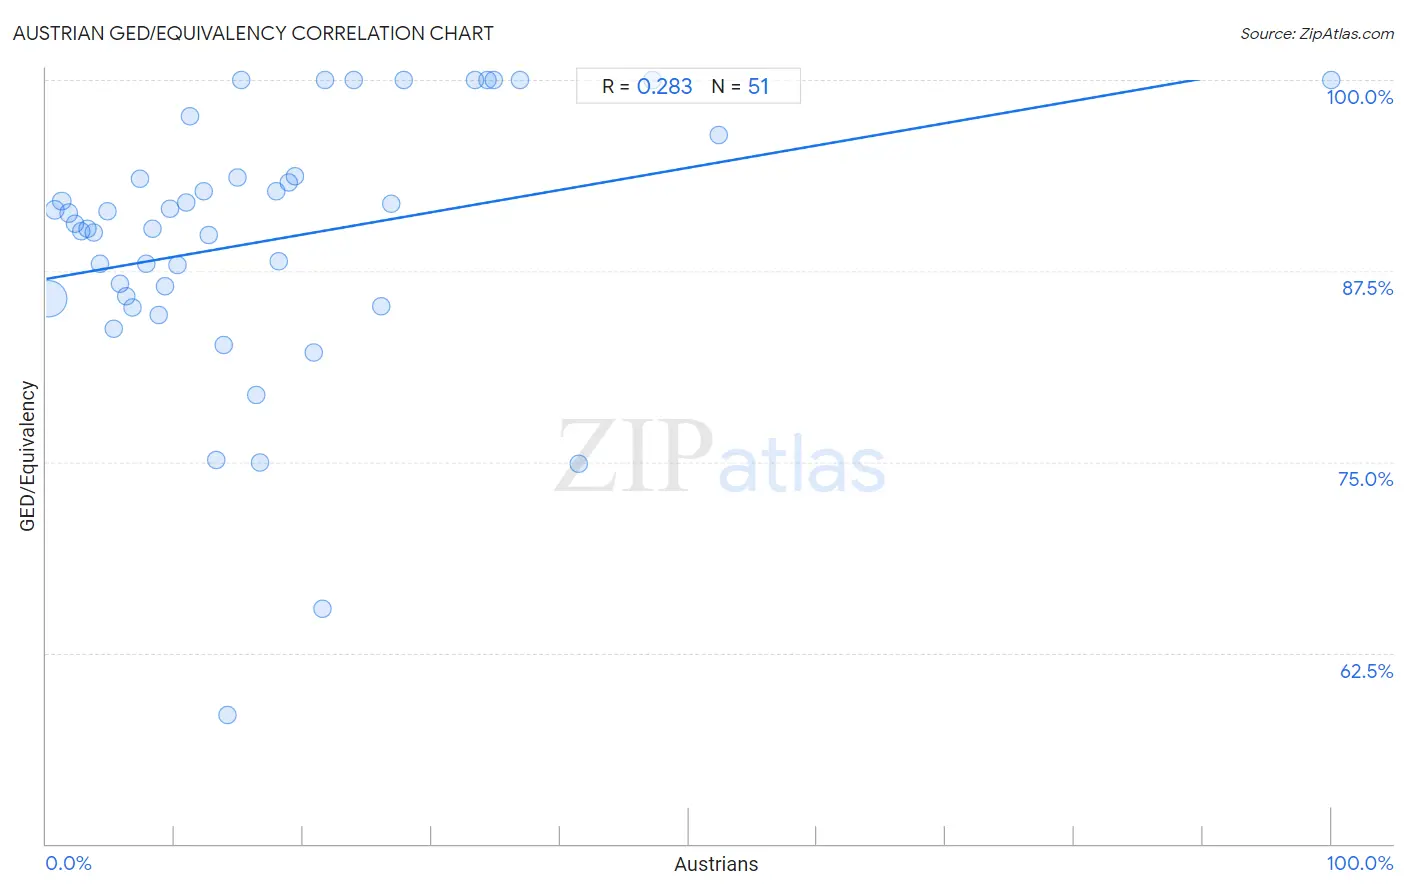
Austrian GED/Equivalency Correlation Chart

The statistical analysis conducted on geographies consisting of 452,082,927 people shows a weak positive correlation between the proportion of Austrians and percentage of population with at least ged/equivalency education in the United States with a correlation coefficient (R) of 0.283 and weighted average of 87.7%. On average, for every 1% (one percent) increase in Austrians within a typical geography, there is an increase of 0.15% in percentage of population with at least ged/equivalency education.
Austrian GED/Equivalency
It is essential to understand that the correlation between the percentage of Austrians and percentage of population with at least ged/equivalency education does not imply a direct cause-and-effect relationship. It remains uncertain whether the presence of Austrians influences an upward or downward trend in the level of percentage of population with at least ged/equivalency education within an area, or if Austrians simply ended up residing in those areas with higher or lower levels of percentage of population with at least ged/equivalency education due to other factors.

Demographics Similar to Austrians by GED/Equivalency

In terms of ged/equivalency, the demographic groups most similar to Austrians are Ukrainian (87.7%, a difference of 0.0%), Immigrants from Moldova (87.7%, a difference of 0.0%), Belgian (87.7%, a difference of 0.010%), Immigrants from Kuwait (87.7%, a difference of 0.030%), and Immigrants from Saudi Arabia (87.8%, a difference of 0.050%).
DemographicsRating | RankGED/Equivalency
Immigrants from Canada
99.2
/100
|
#64
Exceptional
87.9%
Immigrants from North America
99.1
/100
|
#65
Exceptional
87.8%
Immigrants from Bulgaria
99.1
/100
|
#66
Exceptional
87.8%
British
99.1
/100
|
#67
Exceptional
87.8%
Immigrants from France
99.1
/100
|
#68
Exceptional
87.8%
Immigrants from Saudi Arabia
99.0
/100
|
#69
Exceptional
87.8%
Ukrainians
98.8
/100
|
#70
Exceptional
87.7%
Austrians
98.8
/100
|
#71
Exceptional
87.7%
Immigrants from Moldova
98.8
/100
|
#72
Exceptional
87.7%
Belgians
98.8
/100
|
#73
Exceptional
87.7%
Immigrants from Kuwait
98.8
/100
|
#74
Exceptional
87.7%
Scottish
98.7
/100
|
#75
Exceptional
87.7%
Immigrants from Serbia
98.7
/100
|
#76
Exceptional
87.7%
Slavs
98.7
/100
|
#77
Exceptional
87.7%
Irish
98.6
/100
|
#78
Exceptional
87.6%

Austrian GED/Equivalency Correlation Summary

MeasurementAustrian DataGED/Equivalency Data
Minimum0.17%58.5%
Maximum100.0%100.0%
Range99.8%41.5%
Mean17.3%89.5%
Median13.3%90.6%
Interquartile 25% (IQ1)6.3%85.7%
Interquartile 75% (IQ3)21.7%93.7%
Interquartile Range (IQR)15.4%8.0%
Standard Deviation (Sample)17.1%8.8%
Standard Deviation (Population)16.9%8.7%

Correlation Details

Austrian PercentileSample SizeGED/Equivalency
[
0.0%
-
0.5%
]
0.17%
406,562,31385.7%
[
0.5%
-
1.0%
]
0.67%
36,566,07591.5%
[
1.0%
-
1.5%
]
1.20%
6,162,89192.1%
[
1.5%
-
2.0%
]
1.70%
1,580,48091.3%
[
2.0%
-
2.5%
]
2.20%
472,71090.6%
[
2.5%
-
3.0%
]
2.70%
276,38290.1%
[
3.0%
-
3.5%
]
3.20%
143,69790.3%
[
3.5%
-
4.0%
]
3.71%
107,71990.0%
[
4.0%
-
4.5%
]
4.18%
73,99788.0%
[
4.5%
-
5.0%
]
4.79%
28,77991.4%
[
5.0%
-
5.5%
]
5.23%
19,05883.7%
[
5.5%
-
6.0%
]
5.77%
12,23586.6%
[
6.0%
-
6.5%
]
6.26%
13,87585.8%
[
6.5%
-
7.0%
]
6.74%
7,98185.1%
[
7.0%
-
7.5%
]
7.28%
10,68193.5%
[
7.5%
-
8.0%
]
7.78%
7,97888.0%
[
8.0%
-
8.5%
]
8.27%
1,29490.2%
[
8.5%
-
9.0%
]
8.78%
3,41884.6%
[
9.0%
-
9.5%
]
9.26%
1,49186.5%
[
9.5%
-
10.0%
]
9.63%
4,32291.6%
[
10.0%
-
10.5%
]
10.20%
3,89187.9%
[
10.5%
-
11.0%
]
10.89%
3,76592.0%
[
11.0%
-
11.5%
]
11.19%
1,17197.7%
[
12.0%
-
12.5%
]
12.22%
1,05692.7%
[
12.5%
-
13.0%
]
12.68%
5,99389.9%
[
13.0%
-
13.5%
]
13.28%
58075.1%
[
13.5%
-
14.0%
]
13.78%
19682.6%
[
14.0%
-
14.5%
]
14.06%
31358.5%
[
14.5%
-
15.0%
]
14.84%
1,29493.7%
[
15.0%
-
15.5%
]
15.15%
99100.0%
[
16.0%
-
16.5%
]
16.38%
2,80279.4%
[
16.5%
-
17.0%
]
16.67%
1275.0%
[
17.5%
-
18.0%
]
17.88%
17992.7%
[
18.0%
-
18.5%
]
18.14%
39788.1%
[
18.5%
-
19.0%
]
18.83%
37793.3%
[
19.0%
-
19.5%
]
19.33%
50793.7%
[
20.5%
-
21.0%
]
20.81%
62082.2%
[
21.0%
-
21.5%
]
21.50%
10765.4%
[
21.5%
-
22.0%
]
21.69%
83100.0%
[
23.5%
-
24.0%
]
23.95%
526100.0%
[
26.0%
-
26.5%
]
26.04%
19285.2%
[
26.5%
-
27.0%
]
26.84%
65291.9%
[
27.5%
-
28.0%
]
27.78%
126100.0%
[
33.0%
-
33.5%
]
33.33%
108100.0%
[
34.0%
-
34.5%
]
34.38%
32100.0%
[
34.5%
-
35.0%
]
34.78%
23100.0%
[
36.5%
-
37.0%
]
36.84%
19100.0%
[
41.0%
-
41.5%
]
41.40%
28574.9%
[
47.0%
-
47.5%
]
47.22%
36100.0%
[
52.0%
-
52.5%
]
52.33%
8696.4%
[
99.5%
-
100.0%
]
100.00%
24100.0%