Greek Female Disability

COMPARE

Greek
Race
Ancestry
AfghanAfricanAlaska NativeAlaskan AthabascanAlbanianAleutAlsatianAmericanApacheArabArapahoArgentineanArmenianAssyrian/Chaldean/SyriacAustralianAustrianBahamianBangladeshiBarbadianBasqueBelgianBelizeanBermudanBhutaneseBlackfeetBolivianBrazilianBritishBritish West IndianBulgarianBurmeseCajunCambodianCanadianCape VerdeanCarpatho RusynCelticCentral AmericanCentral American IndianCherokeeCheyenneChickasawChileanChineseChippewaChoctawColombianColvilleComancheCosta RicanCreeCreekCroatianCrowCubanCypriotCzechCzechoslovakianDanishDelawareDominicanDutchDutch West IndianEastern EuropeanEcuadorianEgyptianEnglishEstonianEthiopianEuropeanFijianFilipinoFinnishFrenchFrench American IndianFrench CanadianGermanGerman RussianGhanaianGreekGuamanian/ChamorroGuatemalanGuyaneseHaitianHmongHonduranHopiHoumaHungarianIcelanderIndian (Asian)IndonesianInupiatIranianIraqiIrishIroquoisIsraeliItalianJamaicanJapaneseJordanianKenyanKiowaKoreanLaotianLatvianLebaneseLiberianLithuanianLumbeeLuxembourgerMacedonianMalaysianMalteseMarshalleseMenomineeMexicanMexican American IndianMongolianMoroccanNative HawaiianNavajoNepaleseNew ZealanderNicaraguanNigerianNorthern EuropeanNorwegianOkinawanOsageOttawaPaiutePakistaniPalestinianPanamanianParaguayanPennsylvania GermanPeruvianPimaPolishPortuguesePotawatomiPuebloPuerto RicanPuget Sound SalishRomanianRussianSalvadoranSamoanScandinavianScotch-IrishScottishSeminoleSenegaleseSerbianShoshoneSierra LeoneanSiouxSlavicSlovakSloveneSomaliSouth AfricanSouth AmericanSouth American IndianSoviet UnionSpaniardSpanishSpanish AmericanSpanish American IndianSri LankanSubsaharan AfricanSudaneseSwedishSwissSyrianTaiwaneseThaiTlingit-HaidaTohono O'OdhamTonganTrinidadian and TobagonianTsimshianTurkishU.S. Virgin IslanderUgandanUkrainianUruguayanUteVenezuelanVietnameseWelshWest IndianYakamaYaquiYugoslavianYumanYup'ikZimbabwean
Immigration
NonimmigrantsImmigrantsAfghanistanAfricaAlbaniaArgentinaArmeniaAsiaAustraliaAustriaBahamasBangladeshBarbadosBelarusBelgiumBelizeBoliviaBosnia and HerzegovinaBrazilBulgariaBurma/MyanmarCabo VerdeCambodiaCameroonCanadaCaribbeanCentral AmericaChileChinaColombiaCongoCosta RicaCroatiaCubaCzechoslovakiaDenmarkDominicaDominican RepublicEastern AfricaEastern AsiaEastern EuropeEcuadorEgyptEl SalvadorEnglandEritreaEthiopiaEuropeFijiFranceGermanyGhanaGreeceGrenadaGuatemalaGuyanaHaitiHondurasHong KongHungaryIndiaIndonesiaIranIraqIrelandIsraelItalyJamaicaJapanJordanKazakhstanKenyaKoreaKuwaitLaosLatin AmericaLatviaLebanonLiberiaLithuaniaMalaysiaMexicoMicronesiaMiddle AfricaMoldovaMoroccoNepalNetherlandsNicaraguaNigeriaNorth AmericaNorth MacedoniaNorthern AfricaNorthern EuropeNorwayOceaniaPakistanPanamaPeruPhilippinesPolandPortugalRomaniaRussiaSaudi ArabiaScotlandSenegalSerbiaSierra LeoneSingaporeSomaliaSouth AfricaSouth AmericaSouth Central AsiaSouth Eastern AsiaSouthern EuropeSpainSri LankaSt. Vincent and the GrenadinesSudanSwedenSwitzerlandSyriaTaiwanThailandTrinidad and TobagoTurkeyUgandaUkraineUruguayUzbekistanVenezuelaVietnamWest IndiesWestern AfricaWestern AsiaWestern EuropeYemenZaireZimbabweAzores
Select to Compare
Race
Ancestry
AfghanAfricanAlaska NativeAlaskan AthabascanAlbanianAleutAlsatianAmericanApacheArabArapahoArgentineanArmenianAssyrian/Chaldean/SyriacAustralianAustrianBahamianBangladeshiBarbadianBasqueBelgianBelizeanBermudanBhutaneseBlackfeetBolivianBrazilianBritishBritish West IndianBulgarianBurmeseCajunCambodianCanadianCape VerdeanCarpatho RusynCelticCentral AmericanCentral American IndianCherokeeCheyenneChickasawChileanChineseChippewaChoctawColombianColvilleComancheCosta RicanCreeCreekCroatianCrowCubanCypriotCzechCzechoslovakianDanishDelawareDominicanDutchDutch West IndianEastern EuropeanEcuadorianEgyptianEnglishEstonianEthiopianEuropeanFijianFilipinoFinnishFrenchFrench American IndianFrench CanadianGermanGerman RussianGhanaianGuamanian/ChamorroGuatemalanGuyaneseHaitianHmongHonduranHopiHoumaHungarianIcelanderIndian (Asian)IndonesianInupiatIranianIraqiIrishIroquoisIsraeliItalianJamaicanJapaneseJordanianKenyanKiowaKoreanLaotianLatvianLebaneseLiberianLithuanianLumbeeLuxembourgerMacedonianMalaysianMalteseMarshalleseMenomineeMexicanMexican American IndianMongolianMoroccanNative HawaiianNavajoNepaleseNew ZealanderNicaraguanNigerianNorthern EuropeanNorwegianOkinawanOsageOttawaPaiutePakistaniPalestinianPanamanianParaguayanPennsylvania GermanPeruvianPimaPolishPortuguesePotawatomiPuebloPuerto RicanPuget Sound SalishRomanianRussianSalvadoranSamoanScandinavianScotch-IrishScottishSeminoleSenegaleseSerbianShoshoneSierra LeoneanSiouxSlavicSlovakSloveneSomaliSouth AfricanSouth AmericanSouth American IndianSoviet UnionSpaniardSpanishSpanish AmericanSpanish American IndianSri LankanSubsaharan AfricanSudaneseSwedishSwissSyrianTaiwaneseThaiTlingit-HaidaTohono O'OdhamTonganTrinidadian and TobagonianTsimshianTurkishU.S. Virgin IslanderUgandanUkrainianUruguayanUteVenezuelanVietnameseWelshWest IndianYakamaYaquiYugoslavianYumanYup'ikZimbabwean
Immigration
NonimmigrantsImmigrantsAfghanistanAfricaAlbaniaArgentinaArmeniaAsiaAustraliaAustriaBahamasBangladeshBarbadosBelarusBelgiumBelizeBoliviaBosnia and HerzegovinaBrazilBulgariaBurma/MyanmarCabo VerdeCambodiaCameroonCanadaCaribbeanCentral AmericaChileChinaColombiaCongoCosta RicaCroatiaCubaCzechoslovakiaDenmarkDominicaDominican RepublicEastern AfricaEastern AsiaEastern EuropeEcuadorEgyptEl SalvadorEnglandEritreaEthiopiaEuropeFijiFranceGermanyGhanaGreeceGrenadaGuatemalaGuyanaHaitiHondurasHong KongHungaryIndiaIndonesiaIranIraqIrelandIsraelItalyJamaicaJapanJordanKazakhstanKenyaKoreaKuwaitLaosLatin AmericaLatviaLebanonLiberiaLithuaniaMalaysiaMexicoMicronesiaMiddle AfricaMoldovaMoroccoNepalNetherlandsNicaraguaNigeriaNorth AmericaNorth MacedoniaNorthern AfricaNorthern EuropeNorwayOceaniaPakistanPanamaPeruPhilippinesPolandPortugalRomaniaRussiaSaudi ArabiaScotlandSenegalSerbiaSierra LeoneSingaporeSomaliaSouth AfricaSouth AmericaSouth Central AsiaSouth Eastern AsiaSouthern EuropeSpainSri LankaSt. Vincent and the GrenadinesSudanSwedenSwitzerlandSyriaTaiwanThailandTrinidad and TobagoTurkeyUgandaUkraineUruguayUzbekistanVenezuelaVietnamWest IndiesWestern AfricaWestern AsiaWestern EuropeYemenZaireZimbabweAzores
Female Disability
Income
Poverty
Unemployment
Labor Participation
Family Structure
Vehicle Availability
Education Level
Disability

Greek Female Disability
Excellent

12.0%
DISABILITY | FEMALES
82.0/ 100
METRIC RATING
149th/ 347
METRIC RANK

Greek Female Disability Correlation Chart

The statistical analysis conducted on geographies consisting of 482,678,475 people shows a substantial positive correlation between the proportion of Greeks and percentage of females with a disability in the United States with a correlation coefficient (R) of 0.512 and weighted average of 12.0%. On average, for every 1% (one percent) increase in Greeks within a typical geography, there is an increase of 0.85% in percentage of females with a disability.
Greek Female Disability
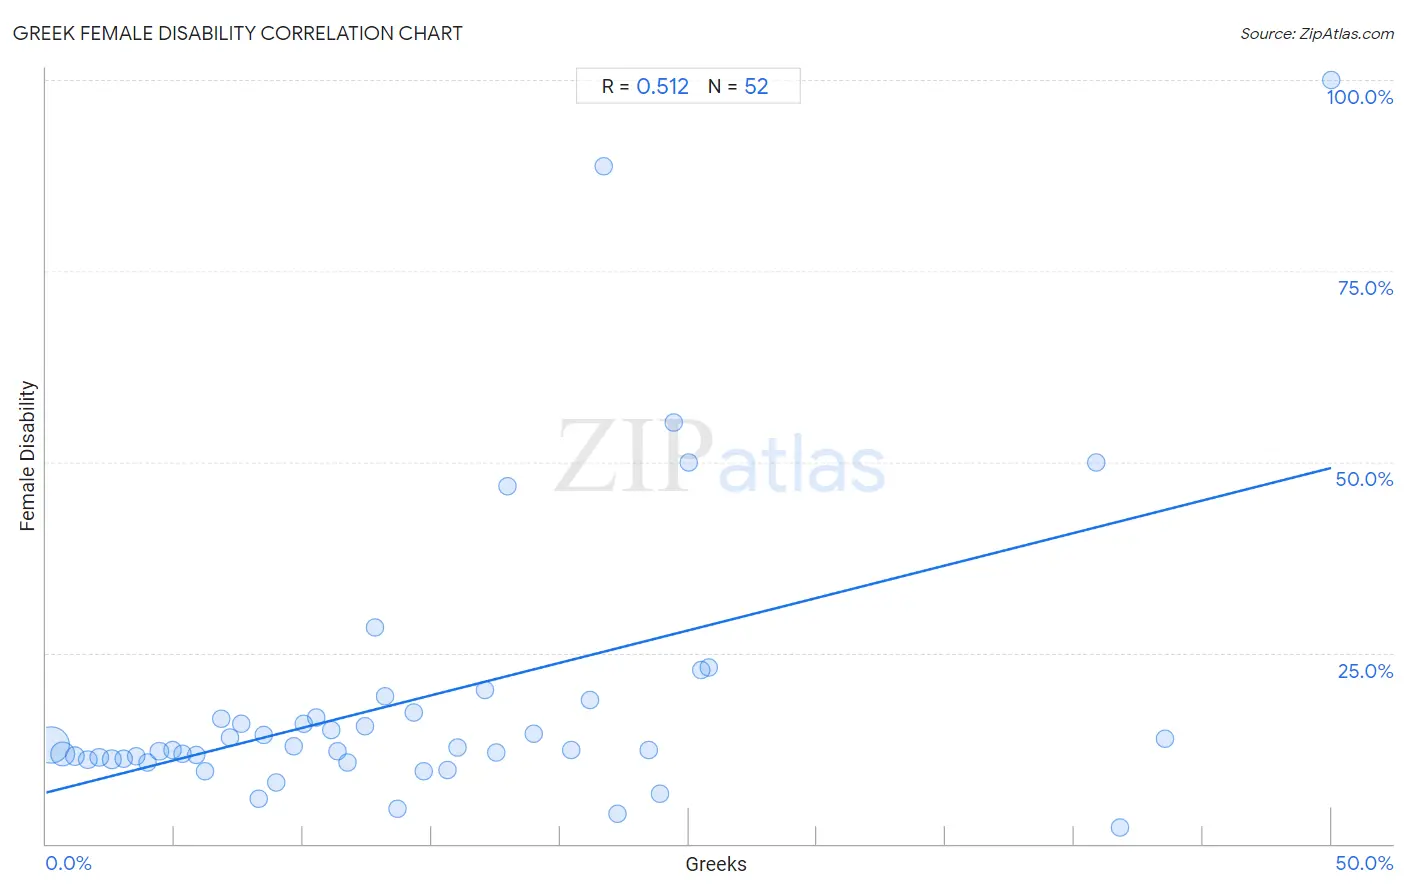
It is essential to understand that the correlation between the percentage of Greeks and percentage of females with a disability does not imply a direct cause-and-effect relationship. It remains uncertain whether the presence of Greeks influences an upward or downward trend in the level of percentage of females with a disability within an area, or if Greeks simply ended up residing in those areas with higher or lower levels of percentage of females with a disability due to other factors.

Demographics Similar to Greeks by Female Disability

In terms of female disability, the demographic groups most similar to Greeks are Immigrants from Moldova (12.0%, a difference of 0.030%), Immigrants from Kenya (12.0%, a difference of 0.070%), Icelander (12.0%, a difference of 0.080%), Nigerian (12.0%, a difference of 0.14%), and Immigrants from Scotland (12.0%, a difference of 0.16%).
DemographicsRating | RankFemale Disability
Immigrants from Africa
90.0
/100
|
#142
Excellent
11.9%
Immigrants from Sudan
89.6
/100
|
#143
Excellent
11.9%
Immigrants from Austria
87.9
/100
|
#144
Excellent
12.0%
Estonians
87.8
/100
|
#145
Excellent
12.0%
Pakistanis
84.6
/100
|
#146
Excellent
12.0%
Nigerians
84.0
/100
|
#147
Excellent
12.0%
Immigrants from Kenya
83.1
/100
|
#148
Excellent
12.0%
Greeks
82.0
/100
|
#149
Excellent
12.0%
Immigrants from Moldova
81.4
/100
|
#150
Excellent
12.0%
Icelanders
80.7
/100
|
#151
Excellent
12.0%
Immigrants from Scotland
79.3
/100
|
#152
Good
12.0%
Sudanese
79.1
/100
|
#153
Good
12.0%
Syrians
76.9
/100
|
#154
Good
12.1%
Ghanaians
76.6
/100
|
#155
Good
12.1%
Moroccans
72.9
/100
|
#156
Good
12.1%

Greek Female Disability Correlation Summary

MeasurementGreek DataFemale Disability Data
Minimum0.21%2.2%
Maximum50.0%100.0%
Range49.8%97.8%
Mean14.4%19.0%
Median12.1%12.5%
Interquartile 25% (IQ1)6.0%11.1%
Interquartile 75% (IQ3)20.8%16.9%
Interquartile Range (IQR)14.8%5.8%
Standard Deviation (Sample)11.4%18.9%
Standard Deviation (Population)11.3%18.7%

Correlation Details

Greek PercentileSample SizeFemale Disability
[
0.0%
-
0.5%
]
0.21%
330,055,70613.0%
[
0.5%
-
1.0%
]
0.65%
103,166,57911.8%
[
1.0%
-
1.5%
]
1.11%
27,150,70611.4%
[
1.5%
-
2.0%
]
1.61%
11,028,50211.0%
[
2.0%
-
2.5%
]
2.06%
4,393,41111.3%
[
2.5%
-
3.0%
]
2.55%
2,863,44511.1%
[
2.5%
-
3.0%
]
3.00%
1,534,05011.1%
[
3.0%
-
3.5%
]
3.50%
788,65911.5%
[
3.5%
-
4.0%
]
3.95%
350,04410.6%
[
4.0%
-
4.5%
]
4.40%
503,16312.1%
[
4.5%
-
5.0%
]
4.91%
154,57712.2%
[
5.0%
-
5.5%
]
5.29%
165,27311.8%
[
5.5%
-
6.0%
]
5.82%
131,26611.6%
[
6.0%
-
6.5%
]
6.20%
103,2379.5%
[
6.5%
-
7.0%
]
6.80%
60,64216.4%
[
7.0%
-
7.5%
]
7.17%
86,85013.9%
[
7.5%
-
8.0%
]
7.60%
31,37515.7%
[
8.0%
-
8.5%
]
8.26%
3,5595.9%
[
8.0%
-
8.5%
]
8.49%
2,28614.2%
[
8.5%
-
9.0%
]
8.96%
1,6868.0%
[
9.5%
-
10.0%
]
9.64%
7,58612.7%
[
10.0%
-
10.5%
]
10.01%
7,41015.7%
[
10.5%
-
11.0%
]
10.50%
1,01916.6%
[
11.0%
-
11.5%
]
11.10%
13,14715.0%
[
11.0%
-
11.5%
]
11.31%
50,44612.2%
[
11.5%
-
12.0%
]
11.72%
2,61210.6%
[
12.0%
-
12.5%
]
12.42%
1,64215.3%
[
12.5%
-
13.0%
]
12.79%
1,26728.3%
[
13.0%
-
13.5%
]
13.17%
46319.3%
[
13.5%
-
14.0%
]
13.68%
6654.6%
[
14.0%
-
14.5%
]
14.29%
52517.2%
[
14.5%
-
15.0%
]
14.71%
3,7739.6%
[
15.5%
-
16.0%
]
15.61%
4,3749.6%
[
16.0%
-
16.5%
]
16.01%
1,44312.6%
[
17.0%
-
17.5%
]
17.07%
94320.2%
[
17.5%
-
18.0%
]
17.53%
75311.9%
[
17.5%
-
18.0%
]
17.95%
23446.8%
[
18.5%
-
19.0%
]
18.95%
43814.5%
[
20.0%
-
20.5%
]
20.43%
42112.3%
[
21.0%
-
21.5%
]
21.15%
2,15118.8%
[
21.5%
-
22.0%
]
21.68%
14388.7%
[
22.0%
-
22.5%
]
22.22%
724.0%
[
23.0%
-
23.5%
]
23.43%
70012.3%
[
23.5%
-
24.0%
]
23.86%
886.5%
[
24.0%
-
24.5%
]
24.42%
8655.1%
[
25.0%
-
25.5%
]
25.00%
850.0%
[
25.5%
-
26.0%
]
25.51%
39622.8%
[
25.5%
-
26.0%
]
25.77%
39223.0%
[
40.5%
-
41.0%
]
40.85%
7150.0%
[
41.5%
-
42.0%
]
41.77%
792.2%
[
43.5%
-
44.0%
]
43.52%
10813.8%
[
50.0%
-
50.5%
]
50.00%
4100.0%