Latvian Female Disability
COMPARE
Latvian
Select to Compare
Female Disability
Latvian Female Disability
11.7%
DISABILITY | FEMALES
98.2/ 100
METRIC RATING
107th/ 347
METRIC RANK
Latvian Female Disability Correlation Chart
The statistical analysis conducted on geographies consisting of 220,713,826 people shows a substantial positive correlation between the proportion of Latvians and percentage of females with a disability in the United States with a correlation coefficient (R) of 0.533 and weighted average of 11.7%. On average, for every 1% (one percent) increase in Latvians within a typical geography, there is an increase of 1.5% in percentage of females with a disability.
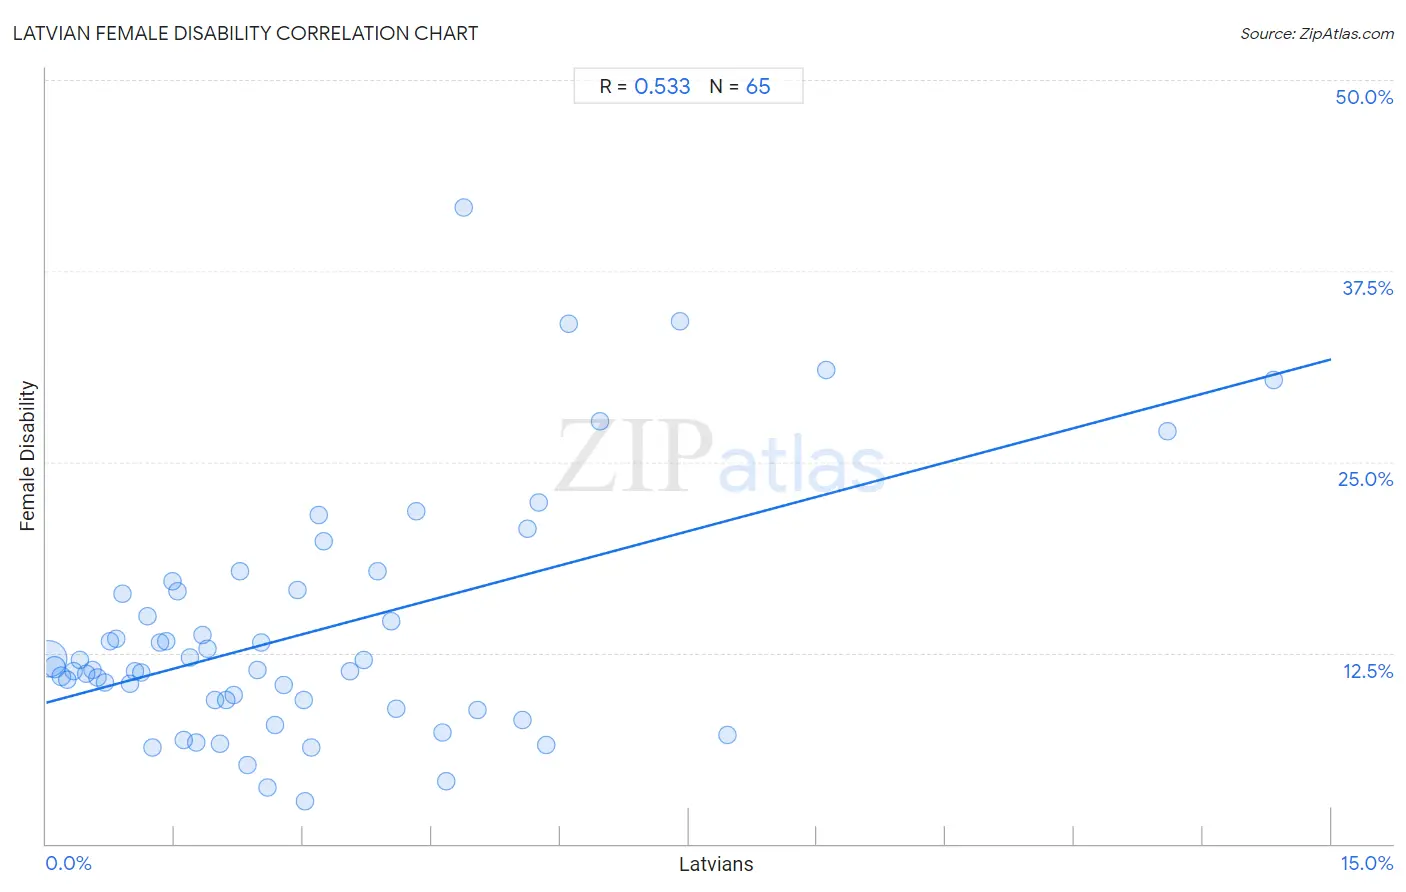
It is essential to understand that the correlation between the percentage of Latvians and percentage of females with a disability does not imply a direct cause-and-effect relationship. It remains uncertain whether the presence of Latvians influences an upward or downward trend in the level of percentage of females with a disability within an area, or if Latvians simply ended up residing in those areas with higher or lower levels of percentage of females with a disability due to other factors.
Demographics Similar to Latvians by Female Disability
In terms of female disability, the demographic groups most similar to Latvians are Immigrants from Greece (11.7%, a difference of 0.020%), New Zealander (11.7%, a difference of 0.020%), Australian (11.7%, a difference of 0.050%), Immigrants (11.7%, a difference of 0.050%), and Soviet Union (11.7%, a difference of 0.050%).
| Demographics | Rating | Rank | Female Disability |
| Immigrants from Uruguay | 98.5 /100 | #100 | Exceptional 11.7% |
| Immigrants from Costa Rica | 98.4 /100 | #101 | Exceptional 11.7% |
| Immigrants from South Eastern Asia | 98.4 /100 | #102 | Exceptional 11.7% |
| Immigrants from Eastern Africa | 98.3 /100 | #103 | Exceptional 11.7% |
| Immigrants from Western Asia | 98.3 /100 | #104 | Exceptional 11.7% |
| Australians | 98.3 /100 | #105 | Exceptional 11.7% |
| Immigrants from Greece | 98.2 /100 | #106 | Exceptional 11.7% |
| Latvians | 98.2 /100 | #107 | Exceptional 11.7% |
| New Zealanders | 98.1 /100 | #108 | Exceptional 11.7% |
| Immigrants | 98.1 /100 | #109 | Exceptional 11.7% |
| Soviet Union | 98.1 /100 | #110 | Exceptional 11.7% |
| Costa Ricans | 98.1 /100 | #111 | Exceptional 11.7% |
| Immigrants from Bangladesh | 97.8 /100 | #112 | Exceptional 11.8% |
| Immigrants from Belarus | 97.8 /100 | #113 | Exceptional 11.8% |
| South Africans | 97.7 /100 | #114 | Exceptional 11.8% |
Latvian Female Disability Correlation Summary
| Measurement | Latvian Data | Female Disability Data |
| Minimum | 0.030% | 2.8% |
| Maximum | 14.3% | 41.7% |
| Range | 14.3% | 38.8% |
| Mean | 3.1% | 13.9% |
| Median | 2.3% | 11.4% |
| Interquartile 25% (IQ1) | 1.1% | 9.1% |
| Interquartile 75% (IQ3) | 4.2% | 16.6% |
| Interquartile Range (IQR) | 3.1% | 7.5% |
| Standard Deviation (Sample) | 2.8% | 7.9% |
| Standard Deviation (Population) | 2.8% | 7.8% |
Correlation Details
| Latvian Percentile | Sample Size | Female Disability |
[ 0.0% - 0.5% ] 0.030% | 161,515,841 | 12.1% |
[ 0.0% - 0.5% ] 0.100% | 37,607,269 | 11.6% |
[ 0.0% - 0.5% ] 0.17% | 10,125,212 | 11.0% |
[ 0.0% - 0.5% ] 0.25% | 4,607,499 | 10.7% |
[ 0.0% - 0.5% ] 0.32% | 2,638,204 | 11.3% |
[ 0.0% - 0.5% ] 0.39% | 1,360,177 | 12.1% |
[ 0.0% - 0.5% ] 0.47% | 604,235 | 11.2% |
[ 0.5% - 1.0% ] 0.53% | 614,493 | 11.3% |
[ 0.5% - 1.0% ] 0.60% | 467,655 | 10.9% |
[ 0.5% - 1.0% ] 0.68% | 284,731 | 10.6% |
[ 0.5% - 1.0% ] 0.75% | 192,873 | 13.2% |
[ 0.5% - 1.0% ] 0.81% | 87,279 | 13.4% |
[ 0.5% - 1.0% ] 0.89% | 122,132 | 16.4% |
[ 0.5% - 1.0% ] 0.97% | 76,776 | 10.5% |
[ 1.0% - 1.5% ] 1.03% | 107,968 | 11.3% |
[ 1.0% - 1.5% ] 1.11% | 10,507 | 11.2% |
[ 1.0% - 1.5% ] 1.18% | 31,071 | 14.9% |
[ 1.0% - 1.5% ] 1.24% | 6,472 | 6.3% |
[ 1.0% - 1.5% ] 1.33% | 21,033 | 13.2% |
[ 1.0% - 1.5% ] 1.40% | 20,393 | 13.2% |
[ 1.0% - 1.5% ] 1.48% | 11,493 | 17.2% |
[ 1.5% - 2.0% ] 1.53% | 47,136 | 16.6% |
[ 1.5% - 2.0% ] 1.61% | 10,210 | 6.8% |
[ 1.5% - 2.0% ] 1.68% | 12,516 | 12.2% |
[ 1.5% - 2.0% ] 1.75% | 4,502 | 6.6% |
[ 1.5% - 2.0% ] 1.82% | 11,282 | 13.7% |
[ 1.5% - 2.0% ] 1.88% | 9,435 | 12.8% |
[ 1.5% - 2.0% ] 1.98% | 13,973 | 9.4% |
[ 2.0% - 2.5% ] 2.03% | 4,276 | 6.5% |
[ 2.0% - 2.5% ] 2.10% | 1,807 | 9.4% |
[ 2.0% - 2.5% ] 2.19% | 20,529 | 9.8% |
[ 2.0% - 2.5% ] 2.25% | 3,992 | 17.8% |
[ 2.0% - 2.5% ] 2.35% | 8,050 | 5.2% |
[ 2.0% - 2.5% ] 2.46% | 1,745 | 11.4% |
[ 2.5% - 3.0% ] 2.51% | 1,392 | 13.2% |
[ 2.5% - 3.0% ] 2.58% | 155 | 3.7% |
[ 2.5% - 3.0% ] 2.67% | 13,497 | 7.8% |
[ 2.5% - 3.0% ] 2.77% | 3,575 | 10.4% |
[ 2.5% - 3.0% ] 2.94% | 2,010 | 16.6% |
[ 3.0% - 3.5% ] 3.01% | 133 | 9.4% |
[ 3.0% - 3.5% ] 3.03% | 8,425 | 2.8% |
[ 3.0% - 3.5% ] 3.09% | 162 | 6.3% |
[ 3.0% - 3.5% ] 3.17% | 441 | 21.5% |
[ 3.0% - 3.5% ] 3.23% | 402 | 19.8% |
[ 3.5% - 4.0% ] 3.55% | 732 | 11.3% |
[ 3.5% - 4.0% ] 3.70% | 811 | 12.0% |
[ 3.5% - 4.0% ] 3.87% | 1,472 | 17.8% |
[ 4.0% - 4.5% ] 4.03% | 2,036 | 14.6% |
[ 4.0% - 4.5% ] 4.09% | 220 | 8.8% |
[ 4.0% - 4.5% ] 4.32% | 1,343 | 21.8% |
[ 4.5% - 5.0% ] 4.62% | 2,143 | 7.3% |
[ 4.5% - 5.0% ] 4.67% | 300 | 4.1% |
[ 4.5% - 5.0% ] 4.88% | 41 | 41.7% |
[ 5.0% - 5.5% ] 5.03% | 159 | 8.8% |
[ 5.5% - 6.0% ] 5.56% | 126 | 8.1% |
[ 5.5% - 6.0% ] 5.62% | 4,611 | 20.6% |
[ 5.5% - 6.0% ] 5.75% | 226 | 22.3% |
[ 5.5% - 6.0% ] 5.83% | 223 | 6.5% |
[ 6.0% - 6.5% ] 6.10% | 771 | 34.0% |
[ 6.0% - 6.5% ] 6.46% | 449 | 27.6% |
[ 7.0% - 7.5% ] 7.39% | 2,313 | 34.2% |
[ 7.5% - 8.0% ] 7.95% | 390 | 7.1% |
[ 9.0% - 9.5% ] 9.11% | 428 | 31.0% |
[ 13.0% - 13.5% ] 13.10% | 84 | 27.0% |
[ 14.0% - 14.5% ] 14.32% | 1,990 | 30.3% |