Austrian Wage/Income Gap

COMPARE

Austrian
Race
Ancestry
AfghanAfricanAlaska NativeAlaskan AthabascanAlbanianAleutAlsatianAmericanApacheArabArapahoArgentineanArmenianAssyrian/Chaldean/SyriacAustralianAustrianBahamianBangladeshiBarbadianBasqueBelgianBelizeanBermudanBhutaneseBlackfeetBolivianBrazilianBritishBritish West IndianBulgarianBurmeseCajunCambodianCanadianCape VerdeanCarpatho RusynCelticCentral AmericanCentral American IndianCherokeeCheyenneChickasawChileanChineseChippewaChoctawColombianColvilleComancheCosta RicanCreeCreekCroatianCrowCubanCypriotCzechCzechoslovakianDanishDelawareDominicanDutchDutch West IndianEastern EuropeanEcuadorianEgyptianEnglishEstonianEthiopianEuropeanFijianFilipinoFinnishFrenchFrench American IndianFrench CanadianGermanGerman RussianGhanaianGreekGuamanian/ChamorroGuatemalanGuyaneseHaitianHmongHonduranHopiHoumaHungarianIcelanderIndian (Asian)IndonesianInupiatIranianIraqiIrishIroquoisIsraeliItalianJamaicanJapaneseJordanianKenyanKiowaKoreanLaotianLatvianLebaneseLiberianLithuanianLumbeeLuxembourgerMacedonianMalaysianMalteseMarshalleseMenomineeMexicanMexican American IndianMongolianMoroccanNative HawaiianNavajoNepaleseNew ZealanderNicaraguanNigerianNorthern EuropeanNorwegianOkinawanOsageOttawaPaiutePakistaniPalestinianPanamanianParaguayanPennsylvania GermanPeruvianPimaPolishPortuguesePotawatomiPuebloPuerto RicanPuget Sound SalishRomanianRussianSalvadoranSamoanScandinavianScotch-IrishScottishSeminoleSenegaleseSerbianShoshoneSierra LeoneanSiouxSlavicSlovakSloveneSomaliSouth AfricanSouth AmericanSouth American IndianSoviet UnionSpaniardSpanishSpanish AmericanSpanish American IndianSri LankanSubsaharan AfricanSudaneseSwedishSwissSyrianTaiwaneseThaiTlingit-HaidaTohono O'OdhamTonganTrinidadian and TobagonianTsimshianTurkishU.S. Virgin IslanderUgandanUkrainianUruguayanUteVenezuelanVietnameseWelshWest IndianYakamaYaquiYugoslavianYumanYup'ikZimbabwean
Immigration
NonimmigrantsImmigrantsAfghanistanAfricaAlbaniaArgentinaArmeniaAsiaAustraliaAustriaBahamasBangladeshBarbadosBelarusBelgiumBelizeBoliviaBosnia and HerzegovinaBrazilBulgariaBurma/MyanmarCabo VerdeCambodiaCameroonCanadaCaribbeanCentral AmericaChileChinaColombiaCongoCosta RicaCroatiaCubaCzechoslovakiaDenmarkDominicaDominican RepublicEastern AfricaEastern AsiaEastern EuropeEcuadorEgyptEl SalvadorEnglandEritreaEthiopiaEuropeFijiFranceGermanyGhanaGreeceGrenadaGuatemalaGuyanaHaitiHondurasHong KongHungaryIndiaIndonesiaIranIraqIrelandIsraelItalyJamaicaJapanJordanKazakhstanKenyaKoreaKuwaitLaosLatin AmericaLatviaLebanonLiberiaLithuaniaMalaysiaMexicoMicronesiaMiddle AfricaMoldovaMoroccoNepalNetherlandsNicaraguaNigeriaNorth AmericaNorth MacedoniaNorthern AfricaNorthern EuropeNorwayOceaniaPakistanPanamaPeruPhilippinesPolandPortugalRomaniaRussiaSaudi ArabiaScotlandSenegalSerbiaSierra LeoneSingaporeSomaliaSouth AfricaSouth AmericaSouth Central AsiaSouth Eastern AsiaSouthern EuropeSpainSri LankaSt. Vincent and the GrenadinesSudanSwedenSwitzerlandSyriaTaiwanThailandTrinidad and TobagoTurkeyUgandaUkraineUruguayUzbekistanVenezuelaVietnamWest IndiesWestern AfricaWestern AsiaWestern EuropeYemenZaireZimbabweAzores
Select to Compare
Race
Ancestry
AfghanAfricanAlaska NativeAlaskan AthabascanAlbanianAleutAlsatianAmericanApacheArabArapahoArgentineanArmenianAssyrian/Chaldean/SyriacAustralianBahamianBangladeshiBarbadianBasqueBelgianBelizeanBermudanBhutaneseBlackfeetBolivianBrazilianBritishBritish West IndianBulgarianBurmeseCajunCambodianCanadianCape VerdeanCarpatho RusynCelticCentral AmericanCentral American IndianCherokeeCheyenneChickasawChileanChineseChippewaChoctawColombianColvilleComancheCosta RicanCreeCreekCroatianCrowCubanCypriotCzechCzechoslovakianDanishDelawareDominicanDutchDutch West IndianEastern EuropeanEcuadorianEgyptianEnglishEstonianEthiopianEuropeanFijianFilipinoFinnishFrenchFrench American IndianFrench CanadianGermanGerman RussianGhanaianGreekGuamanian/ChamorroGuatemalanGuyaneseHaitianHmongHonduranHopiHoumaHungarianIcelanderIndian (Asian)IndonesianInupiatIranianIraqiIrishIroquoisIsraeliItalianJamaicanJapaneseJordanianKenyanKiowaKoreanLaotianLatvianLebaneseLiberianLithuanianLumbeeLuxembourgerMacedonianMalaysianMalteseMarshalleseMenomineeMexicanMexican American IndianMongolianMoroccanNative HawaiianNavajoNepaleseNew ZealanderNicaraguanNigerianNorthern EuropeanNorwegianOkinawanOsageOttawaPaiutePakistaniPalestinianPanamanianParaguayanPennsylvania GermanPeruvianPimaPolishPortuguesePotawatomiPuebloPuerto RicanPuget Sound SalishRomanianRussianSalvadoranSamoanScandinavianScotch-IrishScottishSeminoleSenegaleseSerbianShoshoneSierra LeoneanSiouxSlavicSlovakSloveneSomaliSouth AfricanSouth AmericanSouth American IndianSoviet UnionSpaniardSpanishSpanish AmericanSpanish American IndianSri LankanSubsaharan AfricanSudaneseSwedishSwissSyrianTaiwaneseThaiTlingit-HaidaTohono O'OdhamTonganTrinidadian and TobagonianTsimshianTurkishU.S. Virgin IslanderUgandanUkrainianUruguayanUteVenezuelanVietnameseWelshWest IndianYakamaYaquiYugoslavianYumanYup'ikZimbabwean
Immigration
NonimmigrantsImmigrantsAfghanistanAfricaAlbaniaArgentinaArmeniaAsiaAustraliaAustriaBahamasBangladeshBarbadosBelarusBelgiumBelizeBoliviaBosnia and HerzegovinaBrazilBulgariaBurma/MyanmarCabo VerdeCambodiaCameroonCanadaCaribbeanCentral AmericaChileChinaColombiaCongoCosta RicaCroatiaCubaCzechoslovakiaDenmarkDominicaDominican RepublicEastern AfricaEastern AsiaEastern EuropeEcuadorEgyptEl SalvadorEnglandEritreaEthiopiaEuropeFijiFranceGermanyGhanaGreeceGrenadaGuatemalaGuyanaHaitiHondurasHong KongHungaryIndiaIndonesiaIranIraqIrelandIsraelItalyJamaicaJapanJordanKazakhstanKenyaKoreaKuwaitLaosLatin AmericaLatviaLebanonLiberiaLithuaniaMalaysiaMexicoMicronesiaMiddle AfricaMoldovaMoroccoNepalNetherlandsNicaraguaNigeriaNorth AmericaNorth MacedoniaNorthern AfricaNorthern EuropeNorwayOceaniaPakistanPanamaPeruPhilippinesPolandPortugalRomaniaRussiaSaudi ArabiaScotlandSenegalSerbiaSierra LeoneSingaporeSomaliaSouth AfricaSouth AmericaSouth Central AsiaSouth Eastern AsiaSouthern EuropeSpainSri LankaSt. Vincent and the GrenadinesSudanSwedenSwitzerlandSyriaTaiwanThailandTrinidad and TobagoTurkeyUgandaUkraineUruguayUzbekistanVenezuelaVietnamWest IndiesWestern AfricaWestern AsiaWestern EuropeYemenZaireZimbabweAzores
Wage/Income Gap
Income
Poverty
Unemployment
Labor Participation
Family Structure
Vehicle Availability
Education Level
Disability

Austrian Wage/Income Gap
Tragic

28.4%
WAGE/INCOME GAP
0.2/ 100
METRIC RATING
298th/ 347
METRIC RANK

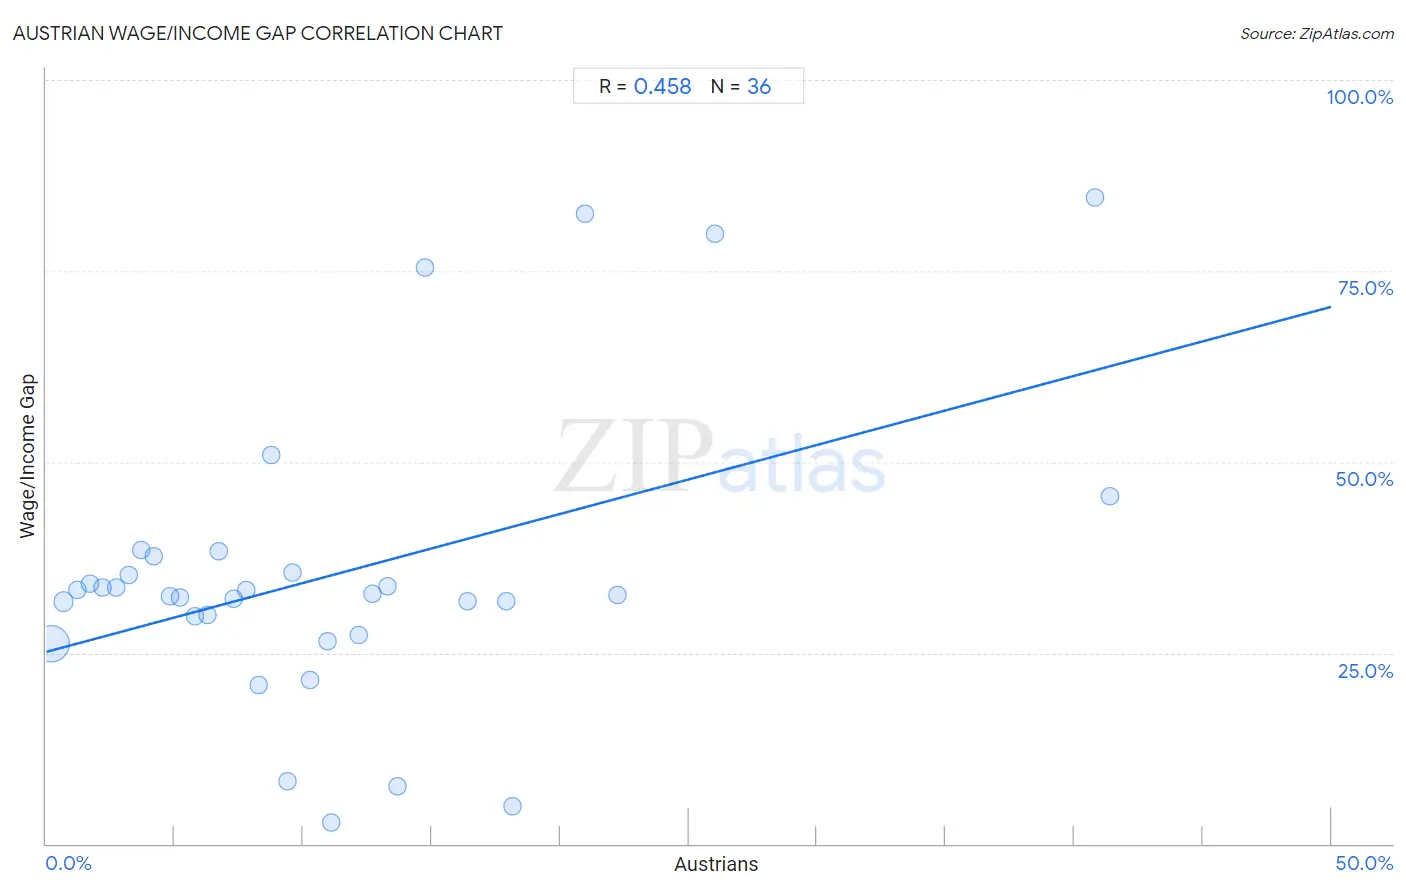
Austrian Wage/Income Gap Correlation Chart

The statistical analysis conducted on geographies consisting of 451,520,484 people shows a moderate positive correlation between the proportion of Austrians and wage/income gap percentage in the United States with a correlation coefficient (R) of 0.458 and weighted average of 28.4%. On average, for every 1% (one percent) increase in Austrians within a typical geography, there is an increase of 0.90% in wage/income gap percentage.
Austrian Wage/Income Gap
It is essential to understand that the correlation between the percentage of Austrians and wage/income gap percentage does not imply a direct cause-and-effect relationship. It remains uncertain whether the presence of Austrians influences an upward or downward trend in the level of wage/income gap percentage within an area, or if Austrians simply ended up residing in those areas with higher or lower levels of wage/income gap percentage due to other factors.

Demographics Similar to Austrians by Wage/Income Gap

In terms of wage/income gap, the demographic groups most similar to Austrians are Immigrants from North America (28.4%, a difference of 0.0%), Immigrants from North Macedonia (28.4%, a difference of 0.050%), Immigrants from Northern Europe (28.5%, a difference of 0.16%), Immigrants from Canada (28.5%, a difference of 0.21%), and Scotch-Irish (28.5%, a difference of 0.24%).
DemographicsRating | RankWage/Income Gap
Czechoslovakians
0.3
/100
|
#291
Tragic
28.2%
Immigrants from Australia
0.3
/100
|
#292
Tragic
28.2%
Immigrants from Israel
0.3
/100
|
#293
Tragic
28.2%
Greeks
0.3
/100
|
#294
Tragic
28.2%
Slovenes
0.3
/100
|
#295
Tragic
28.3%
Northern Europeans
0.3
/100
|
#296
Tragic
28.3%
Immigrants from North America
0.2
/100
|
#297
Tragic
28.4%
Austrians
0.2
/100
|
#298
Tragic
28.4%
Immigrants from North Macedonia
0.2
/100
|
#299
Tragic
28.4%
Immigrants from Northern Europe
0.2
/100
|
#300
Tragic
28.5%
Immigrants from Canada
0.2
/100
|
#301
Tragic
28.5%
Scotch-Irish
0.2
/100
|
#302
Tragic
28.5%
Irish
0.2
/100
|
#303
Tragic
28.5%
Immigrants from Netherlands
0.2
/100
|
#304
Tragic
28.5%
Immigrants from South Africa
0.1
/100
|
#305
Tragic
28.5%

Austrian Wage/Income Gap Correlation Summary

MeasurementAustrian DataWage/Income Gap Data
Minimum0.17%2.8%
Maximum41.4%84.6%
Range41.2%81.9%
Mean11.2%35.2%
Median9.1%32.6%
Interquartile 25% (IQ1)4.5%28.6%
Interquartile 75% (IQ3)14.2%36.7%
Interquartile Range (IQR)9.7%8.1%
Standard Deviation (Sample)9.7%19.2%
Standard Deviation (Population)9.6%18.9%

Correlation Details

Austrian PercentileSample SizeWage/Income Gap
[
0.0%
-
0.5%
]
0.17%
406,376,93326.2%
[
0.5%
-
1.0%
]
0.67%
36,438,57431.7%
[
1.0%
-
1.5%
]
1.20%
6,076,14733.2%
[
1.5%
-
2.0%
]
1.70%
1,544,25734.0%
[
2.0%
-
2.5%
]
2.20%
431,59733.6%
[
2.5%
-
3.0%
]
2.70%
254,25333.5%
[
3.0%
-
3.5%
]
3.19%
126,51835.1%
[
3.5%
-
4.0%
]
3.70%
95,83338.4%
[
4.0%
-
4.5%
]
4.17%
66,93937.7%
[
4.5%
-
5.0%
]
4.80%
24,51632.4%
[
5.0%
-
5.5%
]
5.20%
15,69732.2%
[
5.5%
-
6.0%
]
5.78%
10,35129.8%
[
6.0%
-
6.5%
]
6.26%
12,67229.9%
[
6.5%
-
7.0%
]
6.73%
5,61738.4%
[
7.0%
-
7.5%
]
7.29%
9,15032.0%
[
7.5%
-
8.0%
]
7.80%
7,26133.3%
[
8.0%
-
8.5%
]
8.29%
1,06220.9%
[
8.5%
-
9.0%
]
8.78%
2,39350.9%
[
9.0%
-
9.5%
]
9.38%
6828.2%
[
9.5%
-
10.0%
]
9.58%
3,66235.6%
[
10.0%
-
10.5%
]
10.27%
93521.4%
[
10.5%
-
11.0%
]
10.93%
3,22126.6%
[
11.0%
-
11.5%
]
11.09%
5952.8%
[
12.0%
-
12.5%
]
12.17%
76427.4%
[
12.5%
-
13.0%
]
12.68%
5,99332.8%
[
13.0%
-
13.5%
]
13.30%
20333.7%
[
13.5%
-
14.0%
]
13.68%
1177.6%
[
14.5%
-
15.0%
]
14.72%
23175.5%
[
16.0%
-
16.5%
]
16.38%
2,80231.7%
[
17.5%
-
18.0%
]
17.88%
17931.8%
[
18.0%
-
18.5%
]
18.14%
3974.8%
[
20.5%
-
21.0%
]
20.97%
32982.5%
[
22.0%
-
22.5%
]
22.22%
7232.5%
[
26.0%
-
26.5%
]
26.04%
19279.8%
[
40.5%
-
41.0%
]
40.80%
12584.6%
[
41.0%
-
41.5%
]
41.40%
21545.4%