Indian (Asian) Female Disability
COMPARE
Indian (Asian)
Select to Compare
Female Disability
Indian (Asian) Female Disability
10.8%
DISABILITY | FEMALES
100.0/ 100
METRIC RATING
17th/ 347
METRIC RANK
Indian (Asian) Female Disability Correlation Chart
The statistical analysis conducted on geographies consisting of 495,223,198 people shows a slight negative correlation between the proportion of Indians (Asian) and percentage of females with a disability in the United States with a correlation coefficient (R) of -0.061 and weighted average of 10.8%. On average, for every 1% (one percent) increase in Indians (Asian) within a typical geography, there is a decrease of 0.0081% in percentage of females with a disability.
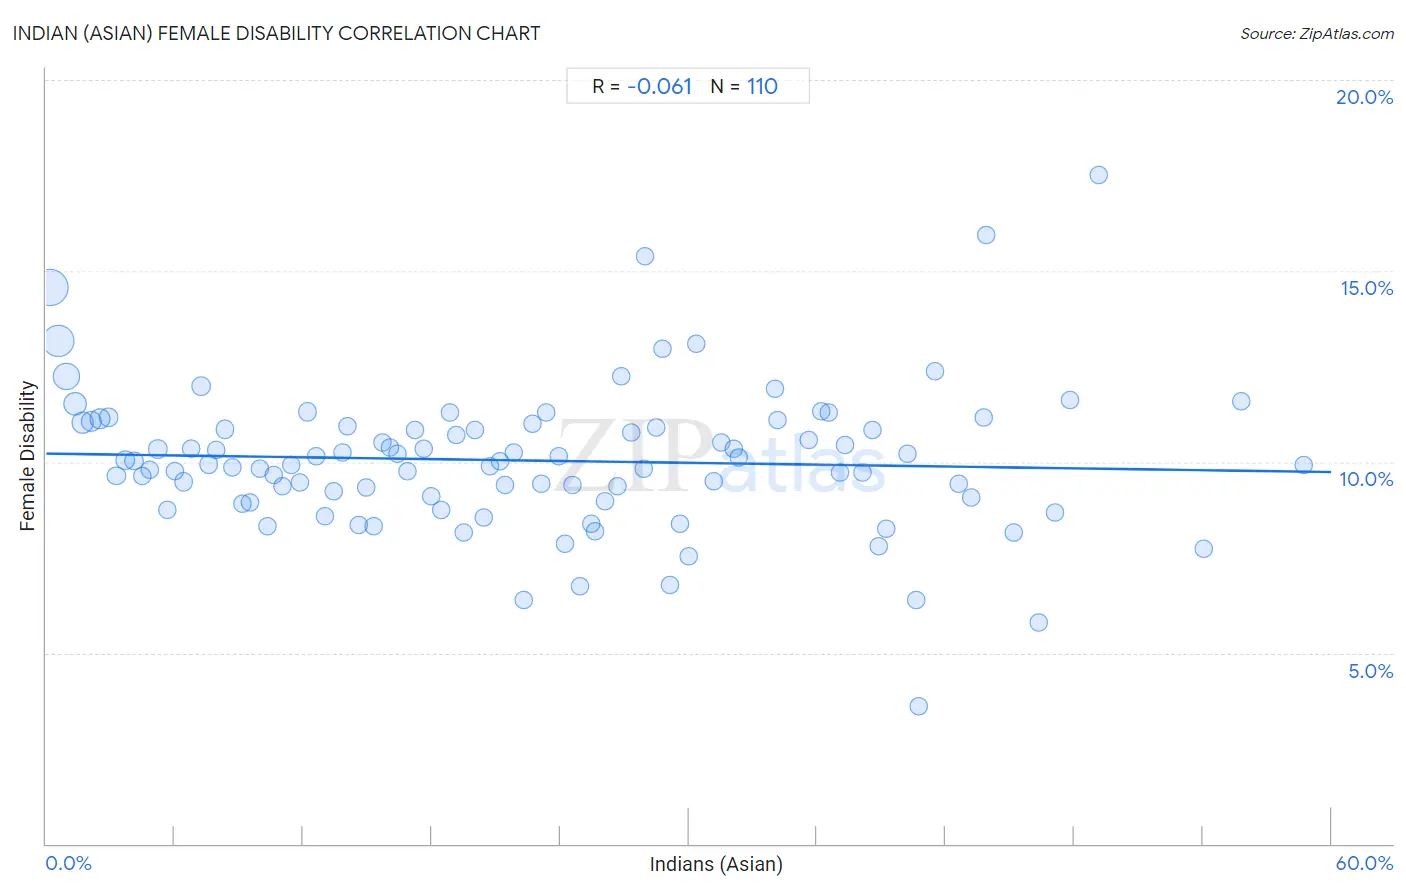
It is essential to understand that the correlation between the percentage of Indians (Asian) and percentage of females with a disability does not imply a direct cause-and-effect relationship. It remains uncertain whether the presence of Indians (Asian) influences an upward or downward trend in the level of percentage of females with a disability within an area, or if Indians (Asian) simply ended up residing in those areas with higher or lower levels of percentage of females with a disability due to other factors.
Demographics Similar to Indians (Asian) by Female Disability
In terms of female disability, the demographic groups most similar to Indians (Asian) are Okinawan (10.8%, a difference of 0.32%), Immigrants from Iran (10.8%, a difference of 0.38%), Burmese (10.7%, a difference of 0.39%), Immigrants from Venezuela (10.9%, a difference of 0.60%), and Immigrants from Pakistan (10.9%, a difference of 0.77%).
| Demographics | Rating | Rank | Female Disability |
| Immigrants from Hong Kong | 100.0 /100 | #10 | Exceptional 10.6% |
| Immigrants from Korea | 100.0 /100 | #11 | Exceptional 10.6% |
| Immigrants from Israel | 100.0 /100 | #12 | Exceptional 10.7% |
| Immigrants from Eastern Asia | 100.0 /100 | #13 | Exceptional 10.7% |
| Immigrants from China | 100.0 /100 | #14 | Exceptional 10.7% |
| Burmese | 100.0 /100 | #15 | Exceptional 10.7% |
| Okinawans | 100.0 /100 | #16 | Exceptional 10.8% |
| Indians (Asian) | 100.0 /100 | #17 | Exceptional 10.8% |
| Immigrants from Iran | 100.0 /100 | #18 | Exceptional 10.8% |
| Immigrants from Venezuela | 100.0 /100 | #19 | Exceptional 10.9% |
| Immigrants from Pakistan | 100.0 /100 | #20 | Exceptional 10.9% |
| Asians | 100.0 /100 | #21 | Exceptional 10.9% |
| Immigrants from Sri Lanka | 100.0 /100 | #22 | Exceptional 10.9% |
| Venezuelans | 100.0 /100 | #23 | Exceptional 11.0% |
| Immigrants from Argentina | 100.0 /100 | #24 | Exceptional 11.0% |
Indian (Asian) Female Disability Correlation Summary
| Measurement | Indian (Asian) Data | Female Disability Data |
| Minimum | 0.19% | 3.6% |
| Maximum | 58.7% | 17.5% |
| Range | 58.5% | 13.9% |
| Mean | 22.6% | 10.0% |
| Median | 21.3% | 10.0% |
| Interquartile 25% (IQ1) | 10.6% | 9.1% |
| Interquartile 75% (IQ3) | 32.3% | 10.9% |
| Interquartile Range (IQR) | 21.7% | 1.8% |
| Standard Deviation (Sample) | 14.3% | 1.9% |
| Standard Deviation (Population) | 14.3% | 1.9% |
Correlation Details
| Indian (Asian) Percentile | Sample Size | Female Disability |
[ 0.0% - 0.5% ] 0.19% | 140,518,450 | 14.6% |
[ 0.5% - 1.0% ] 0.57% | 108,218,653 | 13.2% |
[ 0.5% - 1.0% ] 0.95% | 62,748,585 | 12.2% |
[ 1.0% - 1.5% ] 1.34% | 36,253,722 | 11.5% |
[ 1.5% - 2.0% ] 1.72% | 25,922,051 | 11.0% |
[ 2.0% - 2.5% ] 2.11% | 17,540,359 | 11.1% |
[ 2.5% - 3.0% ] 2.51% | 18,114,169 | 11.1% |
[ 2.5% - 3.0% ] 2.91% | 11,455,047 | 11.2% |
[ 3.0% - 3.5% ] 3.29% | 6,947,430 | 9.6% |
[ 3.5% - 4.0% ] 3.67% | 6,001,761 | 10.0% |
[ 4.0% - 4.5% ] 4.08% | 5,830,733 | 10.0% |
[ 4.0% - 4.5% ] 4.48% | 3,416,987 | 9.6% |
[ 4.5% - 5.0% ] 4.83% | 3,318,062 | 9.8% |
[ 5.0% - 5.5% ] 5.22% | 4,125,122 | 10.3% |
[ 5.5% - 6.0% ] 5.64% | 2,350,649 | 8.7% |
[ 5.5% - 6.0% ] 6.00% | 2,249,897 | 9.8% |
[ 6.0% - 6.5% ] 6.42% | 1,658,887 | 9.5% |
[ 6.5% - 7.0% ] 6.77% | 1,860,533 | 10.4% |
[ 7.0% - 7.5% ] 7.25% | 10,879,803 | 12.0% |
[ 7.5% - 8.0% ] 7.61% | 1,075,125 | 9.9% |
[ 7.5% - 8.0% ] 7.95% | 1,303,433 | 10.3% |
[ 8.0% - 8.5% ] 8.35% | 1,289,385 | 10.9% |
[ 8.5% - 9.0% ] 8.71% | 1,913,926 | 9.9% |
[ 9.0% - 9.5% ] 9.15% | 716,832 | 8.9% |
[ 9.5% - 10.0% ] 9.51% | 777,845 | 8.9% |
[ 9.5% - 10.0% ] 9.98% | 1,480,558 | 9.8% |
[ 10.0% - 10.5% ] 10.30% | 438,147 | 8.3% |
[ 10.5% - 11.0% ] 10.62% | 419,481 | 9.6% |
[ 11.0% - 11.5% ] 11.04% | 694,909 | 9.4% |
[ 11.0% - 11.5% ] 11.44% | 568,984 | 9.9% |
[ 11.5% - 12.0% ] 11.84% | 715,151 | 9.5% |
[ 12.0% - 12.5% ] 12.19% | 767,993 | 11.3% |
[ 12.5% - 13.0% ] 12.63% | 680,954 | 10.1% |
[ 13.0% - 13.5% ] 13.00% | 446,053 | 8.6% |
[ 13.0% - 13.5% ] 13.42% | 232,485 | 9.2% |
[ 13.5% - 14.0% ] 13.81% | 339,330 | 10.2% |
[ 14.0% - 14.5% ] 14.09% | 552,650 | 10.9% |
[ 14.5% - 15.0% ] 14.59% | 202,223 | 8.3% |
[ 14.5% - 15.0% ] 14.93% | 470,981 | 9.3% |
[ 15.0% - 15.5% ] 15.27% | 749,333 | 8.3% |
[ 15.5% - 16.0% ] 15.71% | 465,405 | 10.5% |
[ 16.0% - 16.5% ] 16.08% | 276,336 | 10.4% |
[ 16.0% - 16.5% ] 16.40% | 515,007 | 10.2% |
[ 16.5% - 17.0% ] 16.89% | 420,482 | 9.7% |
[ 17.0% - 17.5% ] 17.21% | 102,809 | 10.8% |
[ 17.5% - 18.0% ] 17.63% | 334,774 | 10.3% |
[ 17.5% - 18.0% ] 17.97% | 641,507 | 9.1% |
[ 18.0% - 18.5% ] 18.43% | 527,602 | 8.7% |
[ 18.5% - 19.0% ] 18.87% | 338,579 | 11.3% |
[ 19.0% - 19.5% ] 19.11% | 119,017 | 10.7% |
[ 19.0% - 19.5% ] 19.48% | 319,065 | 8.1% |
[ 20.0% - 20.5% ] 20.02% | 795,534 | 10.8% |
[ 20.0% - 20.5% ] 20.43% | 107,024 | 8.6% |
[ 20.5% - 21.0% ] 20.74% | 236,857 | 9.9% |
[ 21.0% - 21.5% ] 21.21% | 68,874 | 10.0% |
[ 21.0% - 21.5% ] 21.41% | 203,886 | 9.4% |
[ 21.5% - 22.0% ] 21.85% | 64,946 | 10.2% |
[ 22.0% - 22.5% ] 22.30% | 76,137 | 6.4% |
[ 22.5% - 23.0% ] 22.71% | 133,398 | 11.0% |
[ 23.0% - 23.5% ] 23.09% | 144,601 | 9.4% |
[ 23.0% - 23.5% ] 23.36% | 862,624 | 11.3% |
[ 23.5% - 24.0% ] 23.95% | 60,815 | 10.2% |
[ 24.0% - 24.5% ] 24.23% | 181,482 | 7.8% |
[ 24.5% - 25.0% ] 24.58% | 45,466 | 9.4% |
[ 24.5% - 25.0% ] 24.93% | 8,755 | 6.7% |
[ 25.0% - 25.5% ] 25.46% | 58,529 | 8.4% |
[ 25.5% - 26.0% ] 25.62% | 91,833 | 8.2% |
[ 26.0% - 26.5% ] 26.11% | 23,343 | 9.0% |
[ 26.5% - 27.0% ] 26.68% | 52,159 | 9.4% |
[ 26.5% - 27.0% ] 26.85% | 88,531 | 12.2% |
[ 27.0% - 27.5% ] 27.32% | 29,394 | 10.8% |
[ 27.5% - 28.0% ] 27.87% | 125,567 | 9.8% |
[ 27.5% - 28.0% ] 27.93% | 52,707 | 15.4% |
[ 28.0% - 28.5% ] 28.48% | 108,626 | 10.9% |
[ 28.5% - 29.0% ] 28.77% | 46,424 | 13.0% |
[ 29.0% - 29.5% ] 29.13% | 128,689 | 6.8% |
[ 29.5% - 30.0% ] 29.57% | 90,121 | 8.4% |
[ 29.5% - 30.0% ] 29.99% | 90,534 | 7.5% |
[ 30.0% - 30.5% ] 30.34% | 118,437 | 13.1% |
[ 31.0% - 31.5% ] 31.18% | 19,928 | 9.5% |
[ 31.5% - 32.0% ] 31.53% | 48,930 | 10.5% |
[ 32.0% - 32.5% ] 32.10% | 38,554 | 10.3% |
[ 32.0% - 32.5% ] 32.32% | 98,730 | 10.1% |
[ 34.0% - 34.5% ] 34.02% | 135,971 | 11.9% |
[ 34.0% - 34.5% ] 34.14% | 43,304 | 11.1% |
[ 35.5% - 36.0% ] 35.63% | 80,880 | 10.6% |
[ 36.0% - 36.5% ] 36.18% | 65,922 | 11.3% |
[ 36.5% - 37.0% ] 36.54% | 31,986 | 11.3% |
[ 37.0% - 37.5% ] 37.05% | 62,692 | 9.7% |
[ 37.0% - 37.5% ] 37.29% | 140,699 | 10.4% |
[ 38.0% - 38.5% ] 38.11% | 129,504 | 9.7% |
[ 38.5% - 39.0% ] 38.57% | 115,076 | 10.8% |
[ 38.5% - 39.0% ] 38.86% | 85,525 | 7.8% |
[ 39.0% - 39.5% ] 39.20% | 7,786 | 8.3% |
[ 40.0% - 40.5% ] 40.24% | 22,654 | 10.2% |
[ 40.5% - 41.0% ] 40.62% | 28,212 | 6.4% |
[ 40.5% - 41.0% ] 40.74% | 2,825 | 3.6% |
[ 41.5% - 42.0% ] 41.51% | 33,937 | 12.4% |
[ 42.5% - 43.0% ] 42.62% | 60,364 | 9.4% |
[ 43.0% - 43.5% ] 43.21% | 83,114 | 9.1% |
[ 43.5% - 44.0% ] 43.76% | 91,781 | 11.2% |
[ 43.5% - 44.0% ] 43.92% | 25,460 | 15.9% |
[ 45.0% - 45.5% ] 45.16% | 37,340 | 8.1% |
[ 46.0% - 46.5% ] 46.32% | 557 | 5.8% |
[ 47.0% - 47.5% ] 47.13% | 89,536 | 8.7% |
[ 47.5% - 48.0% ] 47.81% | 96,393 | 11.6% |
[ 49.0% - 49.5% ] 49.15% | 12,070 | 17.5% |
[ 54.0% - 54.5% ] 54.04% | 25,001 | 7.7% |
[ 55.5% - 56.0% ] 55.81% | 26,418 | 11.6% |
[ 58.5% - 59.0% ] 58.72% | 79,495 | 9.9% |